Embed Size (px)
Citation preview
Archives ofDisease in Childhood 1992; 67: 1050-1055
CURRENT TOPIC
Cerebral palsy-an increasing contributor to severe
mental retardation?
Amanda Nicholson, Eva Alberman
Severe mental retardation (SMR), here approxi-mating to an intelligence quotient (IQ) of lessthan 50, has a prevalence among school entrantsof about 3-5 per thousand.' The wide range ofclinical conditions within the severely retardedpopulation fall into five major groups: Down'ssyndrome, cerebral palsy, X linked mentalretardation, single gene defects, and malforma-tion syndromes. The aim of this paper is topredict the future contribution of the aetiologi-cally heterogeneous group of cerebral palsy tothe severely retarded population.The prevalence of cerebral palsy is about
2/1000 in most childhood populations studied,2and up to 35% of those affected (0-7/1000), arealso severely mentally retarded3 4 (G Hagberg,personal communication). This group thereforecomprises about one fifth of the overall preva-lence of severe mental retardation. Forcomparison, Down's syndrome contributes onethird and X linked mental retardation, singlegene defects, and malformation syndromes eachcontribute one tenth to the overall prevalence.Background information needed to predict
future trends in this group includes a know-ledge of the causes of cerebral palsy, and of anytrends in their prevalence; and of the effect ofchanges in the early mortality rates of affectedor high risk infants. Although in most cases thecause remains unknown, associated factors arerecognised and will be used for prediction.As only few reports of cerebral palsy distin-
guish between the characteristics of those withSMR and those without, the literature on trendsin cerebral palsy in general will be reviewed,pointing out any factors known to be particularlyrelated to SMR.
Wolfson Institute ofPreventive Medicine,Medical Coliege ofSt Bartholomew'sHospitalAmanda NicholsonEva AlbermanCorrespondence to:Dr Amanda Nicholson,Department of Epidemiologyand Public Health,University College London,66-72 Gower Street,London WC1E 6EA.
Associated factorsOne feature which distinguishes the epidemio-logy of cerebral palsy from that of any of theother causes of SMR is the close associationbetween cerebral palsy and low birth weight,whether in preterm or other births. This re-
lationship acts as an important confoundingfactor and must be taken into account in anyanalyses of possible causation, or when predict-ing trends. It is accepted that many of theadverse obstetric factors known to be associatedwith cerebral palsy may act primarily by causingpreterm delivery, and thus are only indirectlyrelated with the sequelae consequent uponimmaturity. Similarly, brain 'damage' may bethe cause and not the consequence of asphyxiaat birth.
In the following account the likely time ofaction of different types of insult will bedescribed, but it must be borne in mind thatmany of these causes may act differently atdifferent ages.
KNOWN PRENATAL CAUSESEnvironmental factors that are known to causeprenatal brain injury include congenital infec-tions; exposure to toxins including drugs andalcohol; and a suboptimal uterine environmentof unknown cause which has been described as'fetal deprivation of supply', secondary to anumber of known and unknown causes.
InfectionsIn the UK cytomegalovirus is the most commoncause of congenital infection, leading to impair-ment in about 0-3/1000 births.5 Approximatelyhalf of the affected children have cerebral palsyor psychomotor delay, but not all will haveSMR. Isolated mental retardation is un-common.6 7 The congenital rubella syndromecurrently has a birth prevalence of about 0-03/1000, and reported sequelae include cerebralpalsy, but again isolated mental retardation isuncommon. Congenital toxoplasmosis' is a causeof severe retardation in the absence of cerebralpalsy but birth prevalence is estimated to be lessthan 0-01/1000. The impact of HIV has yet tobe assessed. Evidence is growing that a sub-stantial proportion of symptomatic infectedchildren have neurological syndromes whichmay involve mental retardation, '2 but' atpresent the number of children in the UKknown to be HIV positive is very small.
In summary, congenital infections togetherprobably cause no more than an estimated 0-03cases of SMR/1000 live births, most of whichwill be associated with cerebral palsy. There isunlikely to be any substantial change in theprevalence of these risks, since it is onlycongenital rubella, already a rare cause, which islikely to decline further over the next decade.There is a possibility that congenital HIVinfections may lead to a small increase.
AlcoholAlthough many prescription drugs may causefetal damage, alcohol is the only commonly usedfetal toxin that has been linked to mentalretardation, although severe retardation isprobably not common. The mean IQ for the
1050
on Novem
ber 28, 2021 by guest. Protected by copyright.
http://adc.bmj.com
/A
rch Dis C
hild: first published as 10.1136/adc.67.8.1050 on 1 August 1992. D
ownloaded from
Cerebral pals-an increasing contributor to severe mental retardation?
fetal alcohol syndrome has been stated to be63. 13 Estimates of the prevalence of fetal alcoholsyndrome, and more specifically mental retar-dation associated with maternal alcohol intake,are scanty and inconsistent. It seems that in theUK the number of cases of severe retardationdue to alcohol consumption is likely to be verysmall, although good population based data isscanty. 14
Fetal deprivation ofsupply (FDS)This is a term introduced in Scandinavia toinclude cases of presumed prenatal fetal depri-vation inferred from either maternal complica-tions or fetal growth retardation. Often it is notknown whether the growth retardation is due tofetal or maternal causes. Estimates from Swedenand Canada indicate that 0-3/1000 cases of SMRare linked to FDS,'5 16 but it is difficult to tellfrom the literature how many are associatedwith cerebral palsy.
Perinatal brain damagePerinatal brain damage will include the effectson potentially normal babies of complicationsaround the time of birth, including asphyxiaand trauma.
For babies of normal birth weight perinatalfactors are thought unlikely to be important as acause of isolated SMR,'6 but it had been hopedthat improved obstetric care would lead to a fallin prevalence of cerebral palsy in babies ofnormal birth weight in parallel with the falloccurring in perinatal mortality. Recent worksuggests, however, that birth asphyxia is a rarecause of cerebral palsy,'7 18 accounting for lessthan 10% of the total.
In the very low birthweight infant whosechance of survival is increasing, the complica-tions of immaturity may be extremely importantin those potentially normal at birth, resulting inperiventricular ischaemia and neurologicalsequelae. However, we do not known in whatproportion preterm birth is a consequence ofprenatal damage, which itself causes neurologi-cal sequelae. Infantile hydrocephalus after cere-bral haemorrhage, and its sequelae, is anotherimportant cause of SMR and/or cerebral palsy,for which the best recent prevalence data isfrom Sweden with a rate of 0-63/1000 in thebirth years 1979-82.1922 The ventriculomegalytrial group in England reported that all affectedchildren with developmental delay also hadneuromotor impairments.23
Although perinatal damage is traditionallyassociated with cerebral palsy, some survivorsof low birth weight are severely retarded but donot have cerebral palsy. These may have as-sociated sensory deficits such as deafness orblindness or may have isolated SMR. Albermanet al, studying births of less than 1814 g born inthe 1970s, found that the total prevalence ofsevere mental retardation was 17/1000 with14-5/1000 being associated with cerebral palsy.24Recent smaller studies report no cases of SMRwithout cerebral palsy,25 26 although in others itis difficult to extract this information.27A 'best guess' for the contribution of perinatal
factors to SMR is about 0-3/1000 births, and
this proportion is one that may be rising becauseof the improved survival of high risk infants.
Postnatal brain injuryCauses of postnatal brain injury reflect thehazards of the older child's environment. Infec-tions of the nervous system are predominant buttrauma, particularly road traffic accidents andnon-accidental injury, are also important.Survivors of central nervous system malignan-cies also contribute but are a small group, mostalso having motor deficits. There are manyproblems associated with definitions of postnatalcerebral palsy, reported prevalence of postnatalSMR varying from 0-1 to 0-5/1000,' 15 28 butthis group is one where improved standards ofliving and better medical care should lead to areduction. Nevertheless preterm births are atincreased risk and their increasing survival mustbe taken into account when assessing likelytrends.Our 'best guess' for the overall prevalence per
thousand children of SMR with cerebral palsy is0-03 due to congenital infection, 0-3 due to fetaldeprivation, 0-3 due to perinatal factors, andthe remainder, perhaps 0-2, associated withpostnatal factors, with a small proportion due tothe fetal alcohol syndrome or other exposure tofetal toxins.
Trends in the prevalence of cerebral palsyPRENATALLY AND PERINATALLY CAUSEDCEREBRAL PALSYCerebral palsy registers in Mersey RegionalHealth Authority in England, in south westernSweden, and in Western Australia provide thebulk of the recent trend data,2932 with addi-tional information from registers in the regionalhealth authorities in the north east and south eastof England.The reported overall prevalence per 1000 live
births, excluding postnatal cases, remainedfairly stable from 1958 to 1977,2 and then beganto rise. Table 1 gives recent data from Sweden,Western Australia and Mersey, and there havebeen similar reports from elsewhere.33-35The table gives the trends in different birth-
weight groups and shows that there has been afairly constant level over time in babies ofnormal birth weight in the studies included,although Jarvis et al found an increase inreported live birth prevalence from 1-03 to 1I53/1000 among babies weighing 2500 to 4000 gbetween birth years 1968-71 and 1972-5.36 Inall three registers, apart from the most recentMersey data, there has been a fall in prevalencerates in the group weighing between 1500 and2499 g at birth.However, the most striking finding in the
table is the considerable rise in prevalence inneonatal survivors found in all three registersfor babies of <1500 g birth weight. The mostrecent data from Mersey suggest that theincrease in prevalence in the very smallestbabies is maintained, although there have beensome recent reports suggesting that the disabilityrate in these is stable, or falling.37 38 Neverthe-less, the Mersey and Swedish recent prevalencerates of cerebral palsy in babies of under 1500 gof around 90/1000 are confirmed by numerous
1051
on Novem
ber 28, 2021 by guest. Protected by copyright.
http://adc.bmj.com
/A
rch Dis C
hild: first published as 10.1136/adc.67.8.1050 on 1 August 1992. D
ownloaded from
Nicholson, Alberman
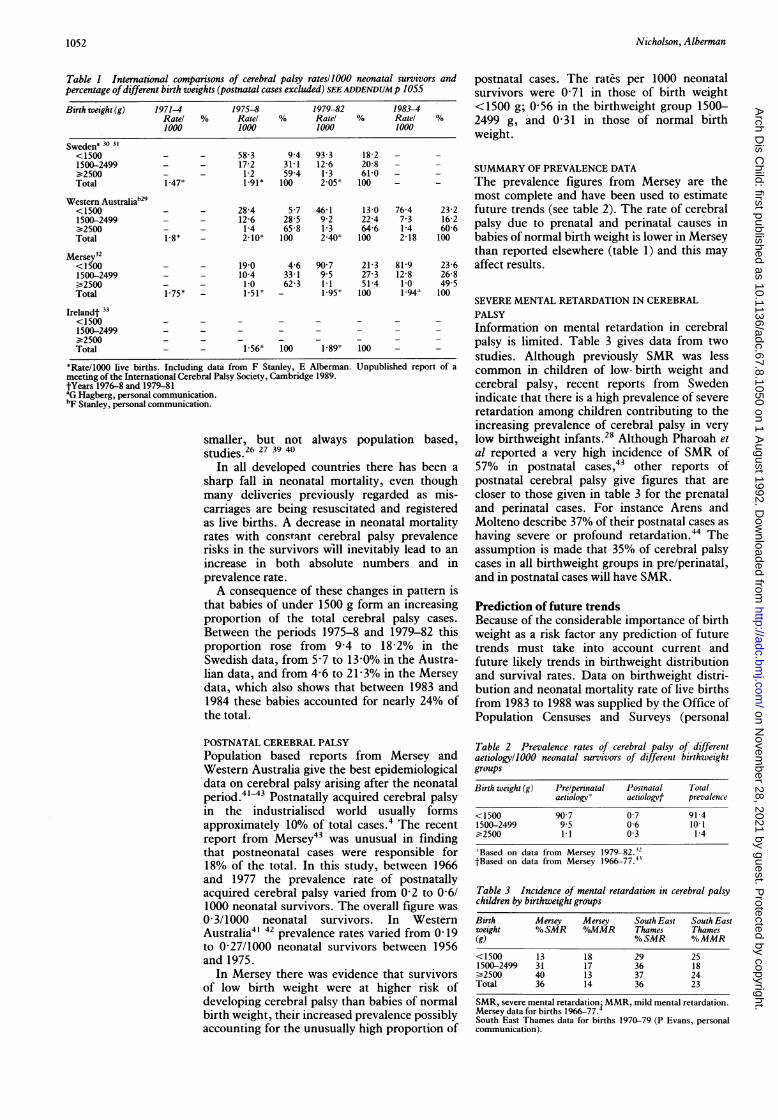
Table I International comparisons of cerebral palsy ratesllOOO neonatal survivors andpercentage ofdifferent birth weights (postnatal cases excluded) SEE ADDENDUM p 1055
Birth weight (g) 1971-4 1975-8 1979-82 1983-4Rate! % Rate! % Rate! % Ratel %1000 1000 1000 1000
Swedena 30 31
<1500 - - 58 3 9-4 93-3 18-2 - -
1500-2499 - - 17-2 31-1 12-6 20-8 - -
¢2500 - - 1-2 59-4 1-3 61-0 - -
Total 1-47* 1-91* 100 2-05' 100 -
Western AustraliabZ9<1500 - - 28-4 5-7 46-1 13-0 76-4 23-21500-2499 - 12-6 28-5 9-2 22-4 7-3 16-2¢2500 - - 1-4 65-8 1-3 64-6 1-4 60-6Total 1-8* - 2-10* 100 2-40' 100 2-18 100
Mersey32<1500 - - 19-0 4-6 90 7 21-3 81-9 23-61500-2499 - - 10-4 33-1 95 27-3 12-8 26-8¢2500 - - 1-0 62-3 1-1 51-4 1-0 49 5Total 1-75* - 1 51 - 1.95* 100 1-94* 100
Irelandt 33<1500 - - - -
1500-2499 - - - - - - -¢2500 - -
Total - - 1-56* 100 1-89* 100
*Rate/1000 live births. Including data from F Stanley, E Alberman. Unpublished report of ameeting of the International Cerebral Palsy Society, Cambridge 1989.tYears 1976-8 and 1979-81'G Hagberg, personal communication.bF Stanley, personal communication.
smaller, but not always population based,studies.26 27 39 40
In all developed countries there has been asharp fall in neonatal mortality, even thoughmany deliveries previously regarded as mis-carriages are being resuscitated and registeredas live births. A decrease in neonatal mortalityrates with constqnt cerebral palsy prevalencerisks in the survivors will inevitably lead to anincrease in both absolute numbers and inprevalence rate.A consequence of these changes in pattern is
that babies of under 1500 g form an increasingproportion of the total cerebral palsy cases.Between the periods 1975-8 and 1979-82 thisproportion rose from 9-4 to 18-2% in theSwedish data, from 5-7 to 13-0% in the Austra-lian data, and from 4-6 to 21-3% in the Merseydata, which also shows that between 1983 and1984 these babies accounted for nearly 24% ofthe total.
POSTNATAL CEREBRAL PALSYPopulation based reports from Mersey andWestern Australia give the best epidemiologicaldata on cerebral palsy arising after the neonatalperiod.4143 Postnatally acquired cerebral palsyin the industrialised world usually formsapproximately 10% of total cases.4 The recentreport from Mersey43 was unusual in findingthat postneonatal cases were responsible for18% of the total. In this study, between 1966and 1977 the prevalence rate of postnatallyacquired cerebral palsy varied from 0-2 to 0-6/1000 neonatal survivors. The overall figure was0-3/1000 neonatal survivors. In WesternAustralia4' 42 prevalence rates varied from 0-19to 0-27/1000 neonatal survivors between 1956and 1975.
In Mersey there was evidence that survivorsof low birth weight were at higher risk ofdeveloping cerebral palsy than babies of normalbirth weight, their increased prevalence possiblyaccounting for the unusually high proportion of
postnatal cases. The rates per 1000 neonatalsurvivors were 0-71 in those of birth weight<1500 g; 0-56 in the birthweight group 1500-2499 g, and 0-31 in those of normal birthweight.
SUMMARY OF PREVALENCE DATAThe prevalence figures from Mersey are themost complete and have been used to estimatefuture trends (see table 2). The rate of cerebralpalsy due to prenatal and perinatal causes inbabies of normal birth weight is lower in Merseythan reported elsewhere (table 1) and this mayaffect results.
SEVERE MENTAL RETARDATION IN CEREBRALPALSYInformation on mental retardation in cerebralpalsy is limited. Table 3 gives data from twostudies. Although previously SMR was lesscommon in children of low- birth weight andcerebral palsy, recent reports from Swedenindicate that there is a high prevalence of severeretardation among children contributing to theincreasing prevalence of cerebral palsy in verylow birthweight infants.28 Although Pharoah etal reported a very high incidence of SMR of57% in postnatal cases,43 other reports ofpostnatal cerebral palsy give figures that arecloser to those given in table 3 for the prenataland perinatal cases. For instance Arens andMolteno describe 37% of their postnatal cases ashaving severe or profound retardation.44 Theassumption is made that 35% of cerebral palsycases in all birthweight groups in pre/perinatal,and in postnatal cases will have SMR.
Prediction of future trendsBecause of the considerable importance of birthweight as a risk factor any prediction of futuretrends must take into account current andfuture likely trends in birthweight distributionand survival rates. Data on birthweight distri-bution and neonatal mortality rate of live birthsfrom 1983 to 1988 was supplied by the Office ofPopulation Censuses and Surveys (personal
Table 2 Prevalence rates of cerebral palsy of differentaetiology/O000 neonatal survivors of different birthweightgroups
Birth weight (g) Prelperinatal Postnatal Totalaetiologyv aetiologvf prevalence
<1500 90-7 0-7 91-41500-2499 9-5 0-6 10-1>2500 1-1 0-3 1-4
Based on data from Mersey 1979-82. 12tBased on data from Mersey 1966-77.4'
Table 3 Incidence of mental retardation in cerebral palsychildren by birthweight groups
Birth Mersey Mersey South East South Eastweight % SMR %/oMMR Thames Thames(g) %SMR %MMR
<1500 13 18 29 251500-2499 31 17 36 18>2500 40 13 37 24Total 36 14 36 23
SMR, severe mental retardation1 MMR, mild mental retardation.Mersey data for births 1966-77.iSouth East Thames data for births 1970-79 (P Evans, personalcommunication).
1052
on Novem
ber 28, 2021 by guest. Protected by copyright.
http://adc.bmj.com
/A
rch Dis C
hild: first published as 10.1136/adc.67.8.1050 on 1 August 1992. D
ownloaded from
Cerebral palsy-an increasing contributor to severe mental retardation?
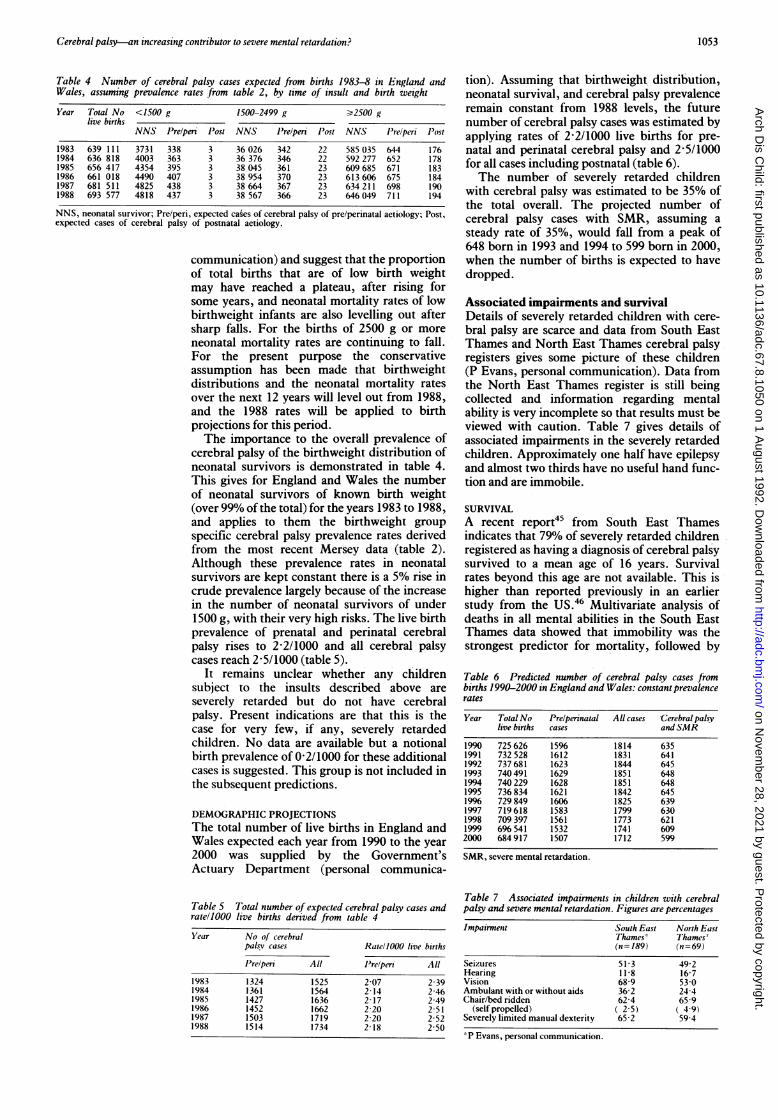
Table 4 Number of cerebral palsy cases expected from births 1983-8 in England andWales, assuming prevalence rates from table 2, by time of insult and birth weight
Year Total No <1500 g 1500-2499 g >2500 glive births
NNS Prelpern Post NNS Prelperi Post NNS IPrelperi I'ost
1983 639 111 3731 338 3 36026 342 22 585035 644 1761984 636 818 4003 363 3 36 376 346 22 592 277 652 1781985 656 417 4354 395 3 38 045 361 23 609685 671 1831986 661 018 4490 407 3 38 954 370 23 613606 675 1841987 681 511 4825 438 3 38664 367 23 634211 698 1901988 693 577 4818 437 3 38567 366 23 646049 711 194
NNS, neonatal survivor; Pre/peri, expected cages of cerebral palsy of pre/perinatal aetiology; Post,expected cases of cerebral palsy of postnatal aetiology.
communication) and suggest that the proportionof total births that are of low birth weightmay have reached a plateau, after rising forsome years, and neonatal mortality rates of lowbirthweight infants are also levelling out aftersharp falls. For the births of 2500 g or moreneonatal mortality rates are continuing to fall.For the present purpose the conservativeassumption has been made that birthweightdistributions and the neonatal mortality ratesover the next 12 years will level out from 1988,and the 1988 rates will be applied to birthprojections for this period.The importance to the overall prevalence of
cerebral palsy of the birthweight distribution ofneonatal survivors is demonstrated in table 4.This gives for England and Wales the numberof neonatal survivors of known birth weight(over 99% of the total) for the years 1983 to 1988,and applies to them the birthweight groupspecific cerebral palsy prevalence rates derivedfrom the most recent Mersey data (table 2).Although these prevalence rates in neonatalsurvivors are kept constant there is a 5% rise incrude prevalence largely because of the increasein the number of neonatal survivors of under1500 g, with their very high risks. The live birthprevalence of prenatal and perinatal cerebralpalsy rises to 2-2/1000 and all cerebral palsycases reach 2 5/1000 (table 5).
It remains unclear whether any childrensubject to the insults described above areseverely retarded but do not have cerebralpalsy. Present indications are that this is thecase for very few, if any, severely retardedchildren. No data are available but a notionalbirth prevalence of 0 2/1000 for these additionalcases is suggested. This group is not included inthe subsequent predictions.
DEMOGRAPHIC PROJECTIONSThe total number of live births in England andWales expected each year from 1990 to the year2000 was supplied by the Government'sActuary Department (personal communica-
Table 5 Total number of expected cerebral palsy cases andratellOOO live births derived from table 4
Year No of cerebralpals' cases Rate1000 live births
Prelperi All 1'relpen All1983 1324 1525 2 07 2-391984 1361 1564 2-14 2-461985 1427 1636 2 17 2491986 1452 1662 2 20 2 511987 1503 1719 2-20 2-521988 1514 1734 2 18 2 50
tion). Assuming that birthweight distribution,neonatal survival, and cerebral palsy prevalenceremain constant from 1988 levels, the futurenumber of cerebral palsy cases was estimated byapplying rates of 2-2/1000 live births for pre-natal and perinatal cerebral palsy and 2-5/1000for all cases including postnatal (table 6).The number of severely retarded children
with cerebral palsy was estimated to be 35% ofthe total overall. The projected number ofcerebral palsy cases with SMR, assuming asteady rate of 35%, would fall from a peak of648 born in 1993 and 1994 to 599 born in 2000,when the number of births is expected to havedropped.
Associated impairments and survivalDetails of severely retarded children with cere-bral palsy are scarce and data from South EastThames and North East Thames cerebral palsyregisters gives some picture of these children(P Evans, personal communication). Data fromthe North East Thames register is still beingcollected and information regarding mentalability is very incomplete so that results must beviewed with caution. Table 7 gives details ofassociated impairments in the severely retardedchildren. Approximately one half have epilepsyand almost two thirds have no useful hand func-tion and are immobile.
SURVIVALA recent report45 from South East Thamesindicates that 79% of severely retarded childrenregistered as having a diagnosis of cerebral palsysurvived to a mean age of 16 years. Survivalrates beyond this age are not available. This ishigher than reported previously in an earlierstudy from the US.46 Multivariate analysis ofdeaths in all mental abilities in the South EastThames data showed that immobility was thestrongest predictor for mortality, followed by
Table 6 Predicted number of cerebral palsy cases frombirths 1990-2000 in England and Wales: constant prevalencerates
Year 7otalNo Prelperinatal All cases Cerebral palsylive births cases and SMR
1990 725 626 15% 1814 6351991 732 528 1612 1831 6411992 737 681 1623 1844 6451993 740 491 1629 1851 6481994 740229 1628 1851 6481995 736 834 1621 1842 64519% 729 849 1606 1825 6391997 719 618 1583 1799 6301998 709397 1561 1773 6211999 696 541 1532 1741 6092000 684 917 1507 1712 599
SMR, severe mental retardation.
Table 7 Associated impairments in children with cerebralpalsy and severe mental retardation. Figures are percentages
Impairment South East North EastThames' Thames'(n= 189) (n=69)
Seizures 51 3 49-2Hearing 11-8 16 7Vision 68 9 53 0Ambulant with or without aids 36-2 24-4Chair/bed ridden 62 4 65-9
(self propelled) ( 25) ( 49)Severely limited manual dexterity 65 2 59-4
*P Evans, personal communication.
1053
on Novem
ber 28, 2021 by guest. Protected by copyright.
http://adc.bmj.com
/A
rch Dis C
hild: first published as 10.1136/adc.67.8.1050 on 1 August 1992. D
ownloaded from
Nicholson, Alberman
severe retardation: 31% ofthe immobile, severelyretarded group had died compared with 3% ofthe mobile but severely retarded group.
DiscussionPREDICTIONSThe most recent data upon which these predic-tions have been based come from births up to1984. When calculating future prevalence it hasbeen assumed that prevalence rates will stay atthe these levels. It is important to consider anypossible changes that may challenge thisassumption.
BIRTHS UNDER 1500 G: PREVALENCE ANDSURVIVALThe predictions made have taken into accounttrends in the prevalence of the high risk birth-weight groups up to 1988 only. It is possible thatfollowing the alteration in the abortion law,lowering the upper limit at which legal termina-tion is permitted to 24 weeks, the legal distinc-tion between stillbirth and miscarriage will alsobe changed to 24 weeks. This may have aneffect in further increasing the resuscitation ofbirths less than 1500 g.A focus of recent literature on this question
has been how much of the increase in prevalenceof cerebral palsy in these babies is due toincreased survival of prenatally impaired child-ren, and how much to postnatal damage duringtheir neonatal course.3' 32 The latter situationleaves more scope for improvement with betterneonatal care. At present we have little under-standing of the prenatal causes leading topreterm birth with permanent neurologicalsequelae, and no means of preventing them; yetrecent work with serial ultrasound has indicatedthat in one third of children with disabilities,ischaemic brain lesions were noted within twohours of birth, confirming the hypotheses thatsome of this damage had taken place before orduring birth.47 Advances in medical imagingwill continue to improve our knowledge of thetiming of the insult in this group.
Regardless of timing, many studies haveshown that periventricular leucomalacia andventricular enlargement are predictors of futurehandicap.25 26 48 49 Early recognition of severelydamaged infants may lead to a reconsiderationof their neonatal management, with a reductionin effort to maintain their survival. This maylead to a fall in both neonatal survival andcerebral palsy prevalence in those survivors.
BIRTHS WEIGHING BETWEEN 1500 AND 2499 GThis is a group about which little is known inregard to timing of insult, although theirsurvival has improved considerably. It is likely,although not certain, that in many such affectedbirths there has been a prenatal insult, but theyprobably include a group which resembles thevery low birthweight group in their stormyneonatal course. It is difficult to predict whetherthere are likely to be changes in risk exposureaffecting the prevalence of SMR, other thanpurely demographic, which have been takeninto account. The assumption has been thatthere will be no such changes over the nextdecade.
BIRTHS GREATER THAN 2499 GSince imaging is less often carried out in largerbabies, and many will develop cerebral palsyafter an apparently normal obstetric and neo-natal course, the literature on the timing of theinsult is usually based on inference only. It isnow recognised that birth asphyxia plays only asmall part, and probably 90% are due toprenatal causes, most of which are not prevent-able in our present state of knowledge. Fetaldeprivation of supply is so poorly understoodthat substantial reduction seems unlikely. HIVinfection may prove increasingly important butfurther reduction in the number of cases ofrubella or of infants damaged by cytomegalo-virus is unlikely. Increasing public awarenessmay reduce the problems of alcohol but this isunlikely to have a major impact on totalprevalence of SMR.The assumption -has been made that over the
next decade the risk in these babies is likely tostay constant, and that changes are likely to beaccounted for by demographic changes only.
POSTNATAL CEREBRAL PALSY AND SMRWork published on postnatally acquired cere-bral palsy is largely based on data from the1950s to 1970s. The population studies on SMRgiving prevalence of postnatal SMR are of thesame era. Changes in medical care and childsafety may make these results unreliable as abasis for future prediction. Infection is the lead-ing cause of postnatal cerebral palsy in allstudies, particularly meningitis and encephali-tis. Gastroenteritis and subsequent dehydrationwas responsible for up to 15% of cases. Traumais the second most common cause accountingfor a quarter of cases. Road traffic accidentsalone cause almost 10% and non-accidentalinjury between 3% and 9% of postnatal cerebralpalsy. Improvement in parental education sothat children's illnesses are recognised andtreated sooner may mean that infectious causesare diminished. It seems feasible to assume thatthe widespread use of safety seats in cars willhave reduced the contribution of road trafficaccidents to the total. On balance it seems mostlikely that postnatal causes will be less commonthan they were, and any fall in this group wouldimply a reduction in our projected prevalence of2-5/1000.
SummaryIt is estimated that the prevalence of non-genetic SMR associated with cerebral palsy hasrisen from 0-7 to about 0-9 per 1000 live birthsin the last decade. This is due to the predictedrise in total cerebral palsy prevalence to 2-5/1000 live births. This predicted prevalence ofcerebral palsy is similar to that given for WesternAustralia in 1979-82, allowing for postnatalcauses, but is higher than prevalence datafrom England and Sweden for that period. Theestimated rise is due largely to improvedsurvival and increased proportion of low birth-weight babies since 1983 and also reflects theuse of prevalence rates based on Mersey data.Improvements in prenatal diagnosis, and a
parental choice of selective termination may
1054
on Novem
ber 28, 2021 by guest. Protected by copyright.
http://adc.bmj.com
/A
rch Dis C
hild: first published as 10.1136/adc.67.8.1050 on 1 August 1992. D
ownloaded from
Cerebralpals-an increasing contributor to severe mental retardation? 1055
lead to reductions in other causes of SMR, suchas Down's syndrome and neural tube defects, soit seems that children both physically andmentally handicapped due to brain damage willcontribute a greater proportion of the SMRpopulation. The careload of these children isgreater than that associated with many othercauses of SMR and most survive into adult life.The implications for planning future serviceswill need to be recognised.
Unpublished data and advice from Dr G Hagberg, Dr F Stanley,Ms Linda Watson, and Dr P Evans is gratefully acknowledged.The Office of Population Censuses and Surveys and theGovernment Actuary's Department kindly provided unpublisheddemographic data. The study has been supported by theDepartment of Health.
AddendumThe recent publication of F J Stanley and L Watson(Trends in perinatal mortality and cerebral palsy inWestern Australia, 1967 to 1985, BMJ 1992;304:1658-63) has shown that there are minor errors in table 1.For Western Australia total prevalence of cerebral palsyper 1000 live births (postnatal causes excluded) for theyears 1975-8 and 1979-82 should read 1-92 and 1-88(not 2-10 and 2 40). Individual birthweight prevalencesare correct. Thus our predicted prevalence for all cerebralpalsy of 2 5/1000 live births is higher than any previousreports.
1 McLaren J, Brysen SE. Review of recent epidemiologicalstudies of mental retardation: prevalence, associated dis-orders and aetiology. AmJ Ment Retard 1987;92:243-54.
2 Paneth N, Kiely J. The frequency of cerebral palsy: a reviewof population studies in industrialised nations since 1950.In: Stanley F, Alberman E, eds. The epidemiology of thecerebral palsies. Clinics in developmental medicine. No 87:London: Spastics International Medical Publications, 1984:960-6.
3 Paneth N, Stark RI. Cerebral palsy and mental retardation inrelation to indicators of perinatal asphyxia. Am J ObstetGynecol 1983;147:960-6.
4 Pharoah POD, Cooke T, Rosenbloom L, Cooke RWI.Effects of birth weight, gestational age and maternal obstet-ric history on birth prevalence of cerebral palsy. Arch DisChild 1987;62:1035-40.
5 Rudd PT, Peckham C. Infection of the fetus and newborn:prevention, treatment and related handicap. Clin ObstetGynecol 1988;2:55-72.
6 Preece PM, Pearl KN, Peckham CS. Congenital cytomegalo-virus infection. Arch Dis Child 1984;59:1120-6.
7 Saigal S, Lunyk 0, Laryke RPB, Chernesky MA. Theoutcome of children with congenital cytomegalovirus infec-tion. AmJ Dis Child 1982;136:896-901.
8 Hall SM. Congenital toxoplasmosis in England, Wales andNorthern Ireland: some epidemiological problems. BMJ1983;287:453-5.
9 Belman AL, Diamond G, Dickson D, et al. Pediatricacquired immunodeficiency syndrome: neurological syn-dromes. AmJ Dis Child 1988;142:29-35.
10 Hopkins KM. Emerging patterns of services and case findingfor children with HIV infection. Ment Retard 1989;27:219-22.
11 European Collaborative Study. Neurologic signs in youngchildren with human immunodeficiency virus infection.Pediatr Infect DisJ 1990;9:402-6.
12 Diamond GW, Gurdin P, Wiznia AA, et al. Effects of con-genital HIV status on the neurodevelopmental status ofbabies in foster care. Dev Med Child Neurol 1990;32:999-1005.
13 Nanson JL. Behaviour in children with fetal alcohol syn-drome. In: Fraser WI, ed. Key issues in mental retardationresearch. London: Routledge, 1990:109-20.
14 Roman E. Hazards in pregnancy with specific reference toalcohol. In: Hosking G, Murphy G, eds. Prevention ofmental handicap: a uwrld view. Royal Society of Medicineinternational congress and symposium series. No 112.London: RSM, 1987.
15 McQueen PC, Spence MW, Winsor EJT, et al; Causal originsof major mental handicap in the Canadian MaritimeProvinces. Dev Med Child Neurol 1986;28:697-707.
16 Susser M, Hauser WA, Keily JL, et al. Quantitative estimatesof prenatal and perinatal risk factors for perinatal mortality,cerebral palsy, mental retardation and epilepsy. In:Freeman JM, ed. l'renatal and perinatal factors associatedwith brain disorder. (NIH publication No 85-1149.)Bethesda: US Department of Health and Human Services,Public Health Service, NIH, 1985.
17 Grant A, Jay MT, O'Brien N, et al. Cerebral palsy amongchildren born during the Dublin randomised trial of intra-partum monitoring. Lancet 1989;ii: 1233-6.
18 Nelson KB, Ellenberg JH. Antecedents of cerebral palsy:multivariate analysis of risk. N EnglJ Med 1986;315:81-6.
19 Fernell E, Hagberg B, Hagberg G, von Wendt L. Epidemio-logy of infantile hydrocephalus. I. Birth prevalence andgeneral data. Acta PaediatrScand 1986;75:975-8 1.
20 Fernell E, Hagberg B, Hagberg G, von Wendt L. Epidemio-logy of infantile hydrocephalus. II. Origin in infants born atterm. Acta Plaediatr Scand 1987;76:411-7.
21 Fernell E, Hagberg B, Hagberg G, von Wendt L. Epidemio-logy of infantile hydrocephalus. III. Origin in preterminfants. Acta Paediatr Scand 1987;76:418-23.
22 Fernell E, Hagberg B, Hagberg G, et al. Epidemiology ofinfantile hydrocephalus in Sweden: a clinical follow-upstudy in children born at term. Neuropediatrics 1988;19:135-42.
23 Ventriculomegaly trial group. Randomised trial of earlytapping in neonatal posthaeiiiorrhagic ventricular dilata-tion. Arch Dis Child 1990;65:3-10.
24 Alberman E, Benson J, McDonald A. Cerebral palsy andsevere educational subnormality in low birthweightchildren: a comparison of births in 1951-53 and 1970-73.Lancet 1982;i:606-8.
25 Fawer CL, Diebold P, Calame A. Periventricular leucomala-cia and neurodevelopmental outcome in preterm infants.Arch Dis Child 1987;62:30-6.
26 Graham M, Levene MI, Trounce JQ, Rutter N. Prediction ofcerebral palsy in very low birthweight infants: prospectiveultrasound study. Lancet 1987;ii:593-6.
27 Tudehope DI, Masel J, Mohay H, et al. Neonatal cranialultrasonography as predictor of 2 year outcome of very lowbirthweight infants. Australian Paediatric Journal 1989;25:66-71.
28 Martindale A, McGrath E, Hosking GP, Buckley RA. Trendsin the prevalence of severe mental handicap in Sheffieldsince 1960. Community Med 1988;10:331-40.
29 Stanley FJ, Watson L. The cerebral palsies in WesternAustralia: trends 1968 to 1981. Am J Obstet Gynecol 1988;158:89-93.
30 Hagberg B, Hagberg G, Olow I. The changing panorama ofcerebral palsy in Sweden. IV. Epidemiological trends1959-1978. Acta l'aediatr Scand 1984;73:433-40.
31 Hagberg B, Hagberg G, Olow I, von Wendt L. The changingpanorama of cerebral palsy in Sweden. V. The birth yearperiod 1979-1982. Acta Paediatr Scand 1989;78:283-90.
32 Pharaoh POD, Cooke T, Cooke RWI, Rosenbloom L.Birthweight specific trends in cerebral palsy. Arch Dis Child1990;65:602-6.
33 Dowding VM, Barry C. Cerebral palsy: changing patterns ofbirthweight and gestational age (1976/81). Irish Med J1988;81:25-9.
34 Riikonen R, Raumavirta S, Sinivnen E, Seppala T. Changingpattern of cerebral palsy in the Southwest region ofFinland. Acta l'aediatr Scand 1989;78:581-7.
35 Takeshita K, Ando Y, Ohtani K, Takashima S. Cerebralpalsy in Tottori, Japan. Neuroepidemiology 1989;8:184-92.
36 Jarvis SN, Holloway JS, Hey EN. Increase in cerebral palsyin normal birthweight babies. Arch Dis Child 1985;60:1113-21.
37 Saigal S, Rosenbaum P, Hattersley B, Milner R. Decreaseddisability rate among 3 year old survivors weighing 501 g-1000 g at birth and born to residents of a geographicallydefined region from 1981 to 1984 compared with 1977 to1980. J Pediatr 1989;114:839-46.
38 Grogaard JB, Lindstrom DP, Parker RA, et al. Increasedsurvival rate in very low birthweight infants (1500 g orless): no association with increased incidence of handicaps.J I'ediatr 1990;117:139-46.
39 Kitchen W, Ford G, Orgill A, et al. Outcome in infants ofbirthweight 500 to 999g: a continuing regional study of 5year old survivors. J Iediatr 1987;111:761-6.
40 Kitchen WH, Ford GW, Rickards AL, et al. Five yearoutcome of infants of birthweight 500 to 1500 grams:relationship with neonatal ultrasound data. Am J Perinatol1990;7:60-5.
41 Blair E, Stanley FJ. An epidemiological study of cerebralpalsy in Western Australia, 1956-1975. III. Postnatalaetiology. Dev Med Child Neurol 1982;24:575-85.
42 Stanley F, Blair E. Postnatal risk factors in the cerebralpalsies. In: Stanley F, Alberman E, eds. The epidemiology ofthe cerebral palsies. Clinics in developmental medicine. No 87.London: Spastics International Medical Publications, 1984:135-49.
43 Pharoah POD, Cooke T, Rosenbloom L. Acquired cerebralpalsy. Arch Dis Child 1989;64:1013-6.
44 Arens LJ, Molteno CD. A comparative study of postnatally-acquired cerebral palsy in Cape Town. Dev Med ChildNeurol 1989;31:246-54.
45 Evans PM, Evans SJW, Alberman E. Cerebral palsy-whywe must plan for survival. Arch Dis Child 1990;65:1329-33.
46 Kudriavcev T, Schoenburg BS, Kurland LT, Groover RV.Cerebral palsy-survival rates, associated handicaps anddistribution by clincial subtype. (Rochester MN,1950-1976). Neurology 1985;35:900-3.
47 Sinha SK, D'Souza SW, Rivlin E, Chiswick ML. Ischaemicbrain lesions diagnosed at birth in preterm infants: clinicalevents and developmental outcome. Arch Dis Child 1990;65:1017-20.
48 Cooke RWI. Early and late cranial ultrasonographic appear-ances and outcome in very low birthweight infants. ArchDis Child 1987;62:931-7.
49 Saliba ED, Bertrand P, Gold F, et azl. Area of lateral ventriclesmeasured on cranial ultrasonography in preterm infants:association with outcome. Arch Dis Child 1990;65:1033-57.
on Novem
ber 28, 2021 by guest. Protected by copyright.
http://adc.bmj.com
/A
rch Dis C
hild: first published as 10.1136/adc.67.8.1050 on 1 August 1992. D
ownloaded from