Embed Size (px)
Citation preview
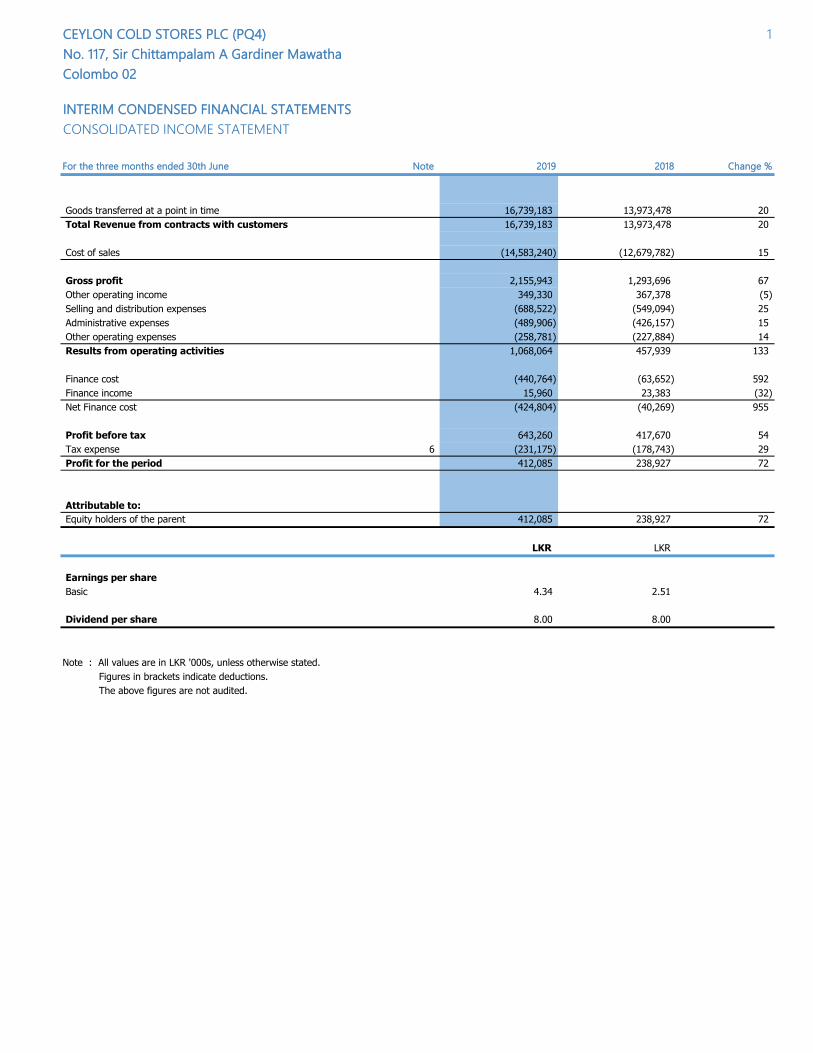
CEYLON COLD STORES PLC (PQ4) 1
No. 117, Sir Chittampalam A Gardiner Mawatha
Colombo 02
INTERIM CONDENSED FINANCIAL STATEMENTS
CONSOLIDATED INCOME STATEMENT
For the three months ended 30th June Note 2019 2018 Change %
Goods transferred at a point in time 16,739,183 13,973,478 20
Total Revenue from contracts with customers 16,739,183 13,973,478 20
Cost of sales (14,583,240) (12,679,782) 15
Gross profit 2,155,943 1,293,696 67
Other operating income 349,330 367,378 (5)
Selling and distribution expenses (688,522) (549,094) 25
Administrative expenses (489,906) (426,157) 15
Other operating expenses (258,781) (227,884) 14
Results from operating activities 1,068,064 457,939 133
Finance cost (440,764) (63,652) 592
Finance income 15,960 23,383 (32)
Net Finance cost (424,804) (40,269) 955
Profit before tax 643,260 417,670 54
Tax expense 6 (231,175) (178,743) 29
Profit for the period 412,085 238,927 72
Attributable to:
Equity holders of the parent 412,085 238,927 72
LKR LKR
Earnings per share
Basic 4.34 2.51
Dividend per share 8.00 8.00
Note : All values are in LKR '000s, unless otherwise stated.
Figures in brackets indicate deductions.
The above figures are not audited.
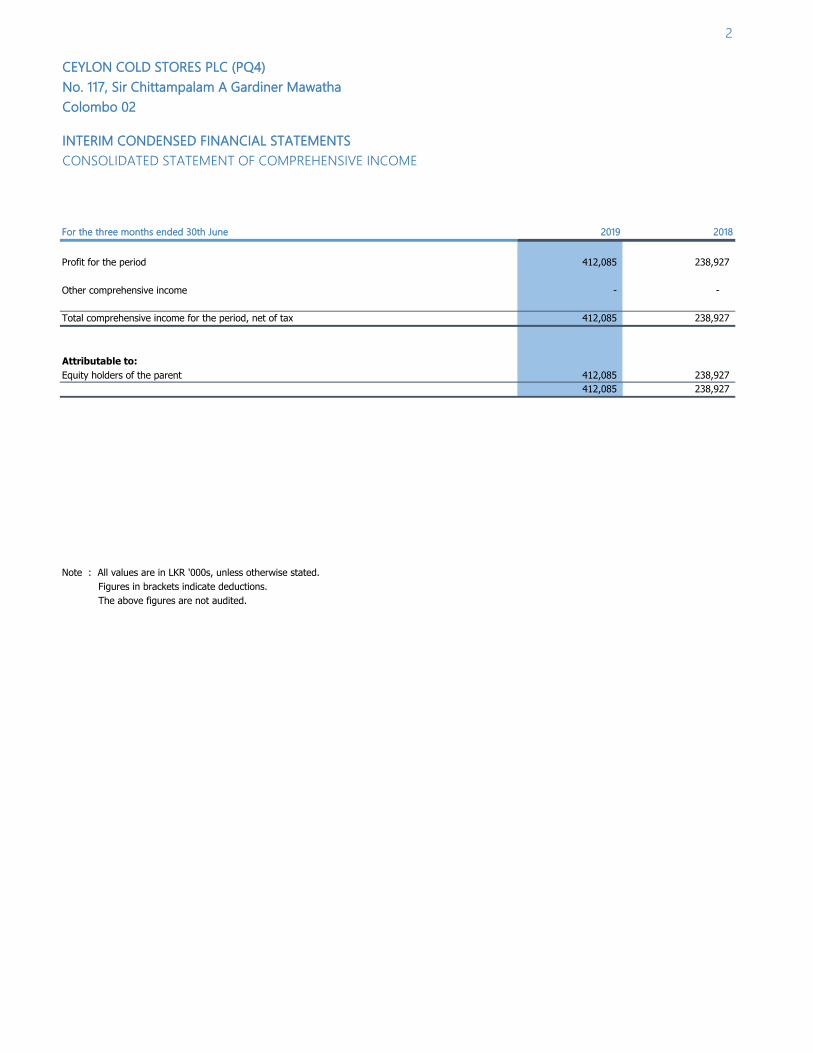
2
CEYLON COLD STORES PLC (PQ4)
No. 117, Sir Chittampalam A Gardiner Mawatha
Colombo 02
INTERIM CONDENSED FINANCIAL STATEMENTS
CONSOLIDATED STATEMENT OF COMPREHENSIVE INCOME
For the three months ended 30th June 2019 2018
Profit for the period 412,085 238,927
Other comprehensive income - -
Total comprehensive income for the period, net of tax 412,085 238,927
Attributable to:
Equity holders of the parent 412,085 238,927
412,085 238,927
The above figures are not audited.
Note : All values are in LKR '000s, unless otherwise stated.
Figures in brackets indicate deductions.
CEYLON COLD STORES PLC (PQ4) 3
No. 117, Sir Chittampalam A Gardiner Mawatha
Colombo 02
INTERIM CONDENSED FINANCIAL STATEMENTS
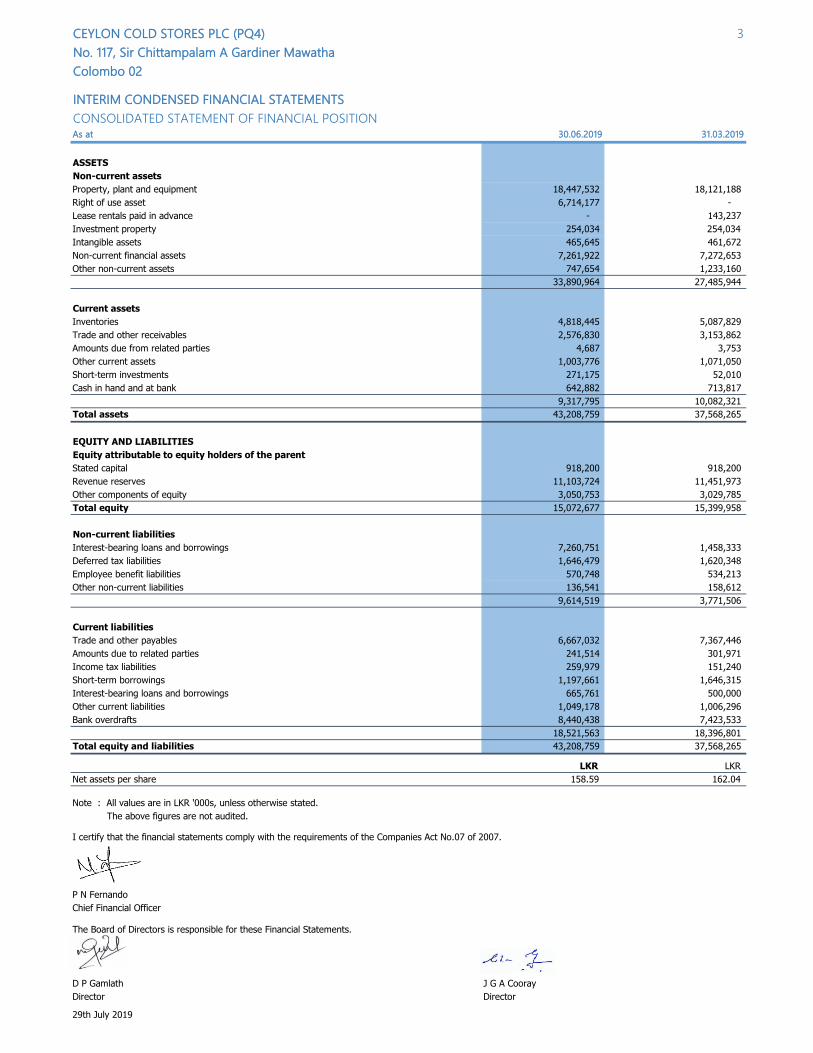
CONSOLIDATED STATEMENT OF FINANCIAL POSITIONAs at 30.06.2019 31.03.2019
ASSETS
Non-current assets
Property, plant and equipment 18,447,532 18,121,188
Right of use asset 6,714,177 -
Lease rentals paid in advance - 143,237
Investment property 254,034 254,034
Intangible assets 465,645 461,672
Non-current financial assets 7,261,922 7,272,653
Other non-current assets 747,654 1,233,160
33,890,964 27,485,944
Current assets
Inventories 4,818,445 5,087,829
Trade and other receivables 2,576,830 3,153,862
Amounts due from related parties 4,687 3,753
Other current assets 1,003,776 1,071,050
Short-term investments 271,175 52,010
Cash in hand and at bank 642,882 713,817
9,317,795 10,082,321
Total assets 43,208,759 37,568,265
EQUITY AND LIABILITIES
Equity attributable to equity holders of the parent
Stated capital 918,200 918,200
Revenue reserves 11,103,724 11,451,973
Other components of equity 3,050,753 3,029,785
Total equity 15,072,677 15,399,958
Non-current liabilities
Interest-bearing loans and borrowings 7,260,751 1,458,333
Deferred tax liabilities 1,646,479 1,620,348
Employee benefit liabilities 570,748 534,213
Other non-current liabilities 136,541 158,612
9,614,519 3,771,506
Current liabilities
Trade and other payables 6,667,032 7,367,446
Amounts due to related parties 241,514 301,971
Income tax liabilities 259,979 151,240
Short-term borrowings 1,197,661 1,646,315
Interest-bearing loans and borrowings 665,761 500,000
Other current liabilities 1,049,178 1,006,296
Bank overdrafts 8,440,438 7,423,533
18,521,563 18,396,801
Total equity and liabilities 43,208,759 37,568,265
LKR LKR
Net assets per share 158.59 162.04
Note : All values are in LKR '000s, unless otherwise stated.
The above figures are not audited.
I certify that the financial statements comply with the requirements of the Companies Act No.07 of 2007.
P N Fernando
Chief Financial Officer
The Board of Directors is responsible for these Financial Statements.
D P Gamlath J G A Cooray
Director Director
29th July 2019
CEYLON COLD STORES PLC (PQ4) 4
No. 117, Sir Chittampalam A Gardiner Mawatha
Colombo 02
INTERIM CONDENSED FINANCIAL STATEMENTS
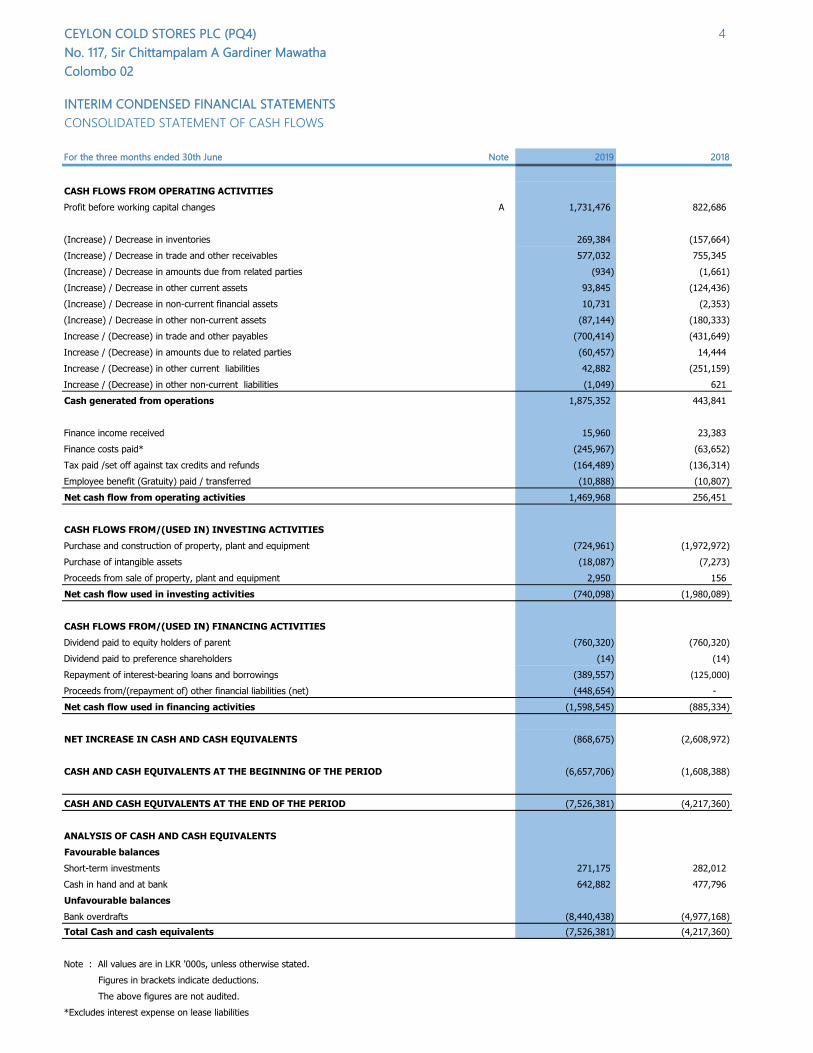
CONSOLIDATED STATEMENT OF CASH FLOWS
For the three months ended 30th June Note 2019 2018
CASH FLOWS FROM OPERATING ACTIVITIES
Profit before working capital changes A 1,731,476 822,686
(Increase) / Decrease in inventories 269,384 (157,664)
(Increase) / Decrease in trade and other receivables 577,032 755,345
(Increase) / Decrease in amounts due from related parties (934) (1,661)
(Increase) / Decrease in other current assets 93,845 (124,436)
(Increase) / Decrease in non-current financial assets 10,731 (2,353)
(Increase) / Decrease in other non-current assets (87,144) (180,333)
Increase / (Decrease) in trade and other payables (700,414) (431,649)
Increase / (Decrease) in amounts due to related parties (60,457) 14,444
Increase / (Decrease) in other current liabilities 42,882 (251,159)
Increase / (Decrease) in other non-current liabilities (1,049) 621
Cash generated from operations 1,875,352 443,841
Finance income received 15,960 23,383
Finance costs paid* (245,967) (63,652)
Tax paid /set off against tax credits and refunds (164,489) (136,314)
Employee benefit (Gratuity) paid / transferred (10,888) (10,807)
Net cash flow from operating activities 1,469,968 256,451
CASH FLOWS FROM/(USED IN) INVESTING ACTIVITIES
Purchase and construction of property, plant and equipment (724,961) (1,972,972)
Purchase of intangible assets (18,087) (7,273)
Proceeds from sale of property, plant and equipment 2,950 156
Net cash flow used in investing activities (740,098) (1,980,089)
CASH FLOWS FROM/(USED IN) FINANCING ACTIVITIES
Dividend paid to equity holders of parent (760,320) (760,320)
Dividend paid to preference shareholders (14) (14)
Repayment of interest-bearing loans and borrowings (389,557) (125,000)
Proceeds from/(repayment of) other financial liabilities (net) (448,654) -
Net cash flow used in financing activities (1,598,545) (885,334)
NET INCREASE IN CASH AND CASH EQUIVALENTS (868,675) (2,608,972)
CASH AND CASH EQUIVALENTS AT THE BEGINNING OF THE PERIOD (6,657,706) (1,608,388)
CASH AND CASH EQUIVALENTS AT THE END OF THE PERIOD (7,526,381) (4,217,360)
ANALYSIS OF CASH AND CASH EQUIVALENTS
Favourable balances
Short-term investments 271,175 282,012
Cash in hand and at bank 642,882 477,796
Unfavourable balances
Bank overdrafts (8,440,438) (4,977,168)
Total Cash and cash equivalents (7,526,381) (4,217,360)
Note : All values are in LKR '000s, unless otherwise stated.
Figures in brackets indicate deductions.
The above figures are not audited.
*Excludes interest expense on lease liabilities
CEYLON COLD STORES PLC (PQ4) 5
No. 117, Sir Chittampalam A Gardiner Mawatha
Colombo 02
INTERIM CONDENSED FINANCIAL STATEMENTS
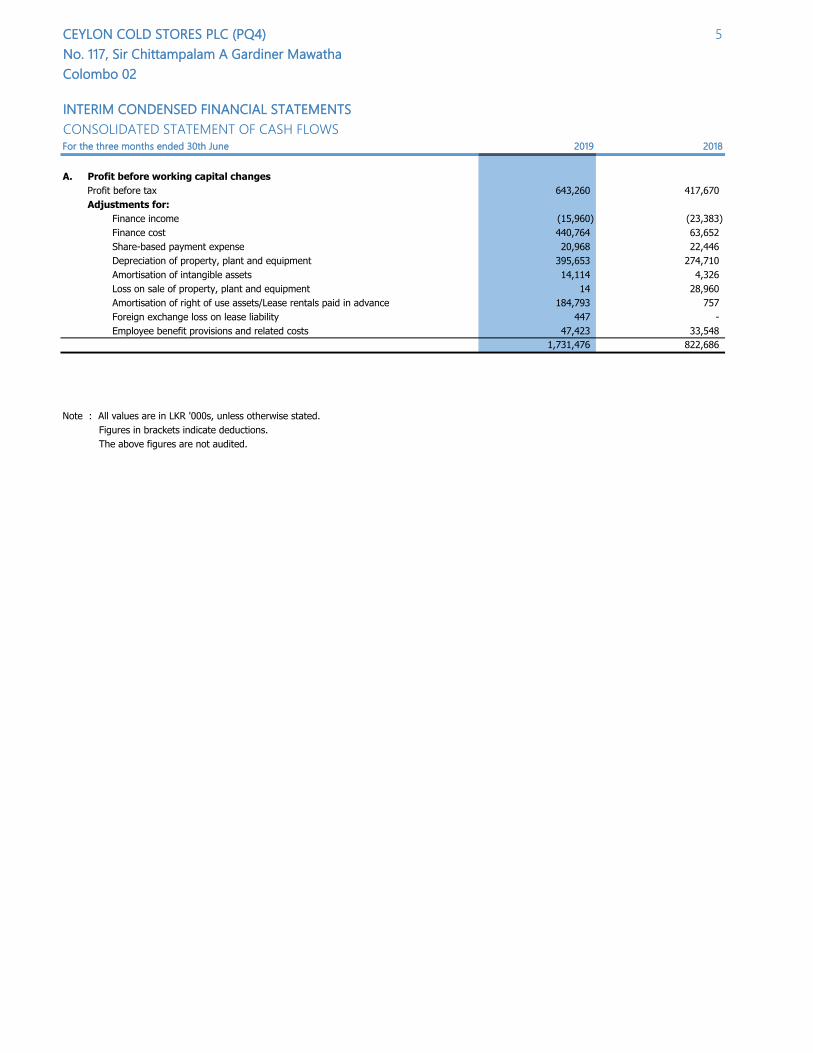
CONSOLIDATED STATEMENT OF CASH FLOWSFor the three months ended 30th June 2019 2018
A. Profit before working capital changes
Profit before tax 643,260 417,670
Adjustments for:
Finance income (15,960) (23,383)
Finance cost 440,764 63,652
Share-based payment expense 20,968 22,446
Depreciation of property, plant and equipment 395,653 274,710
Amortisation of intangible assets 14,114 4,326
Loss on sale of property, plant and equipment 14 28,960
Amortisation of right of use assets/Lease rentals paid in advance 184,793 757
Foreign exchange loss on lease liability 447 -
Employee benefit provisions and related costs 47,423 33,548
1,731,476 822,686
Note : All values are in LKR '000s, unless otherwise stated.
Figures in brackets indicate deductions.
The above figures are not audited.
CEYLON COLD STORES PLC (PQ4) 6
No. 117, Sir Chittampalam A Gardiner Mawatha
Colombo 02
INTERIM CONDENSED FINANCIAL STATEMENTS
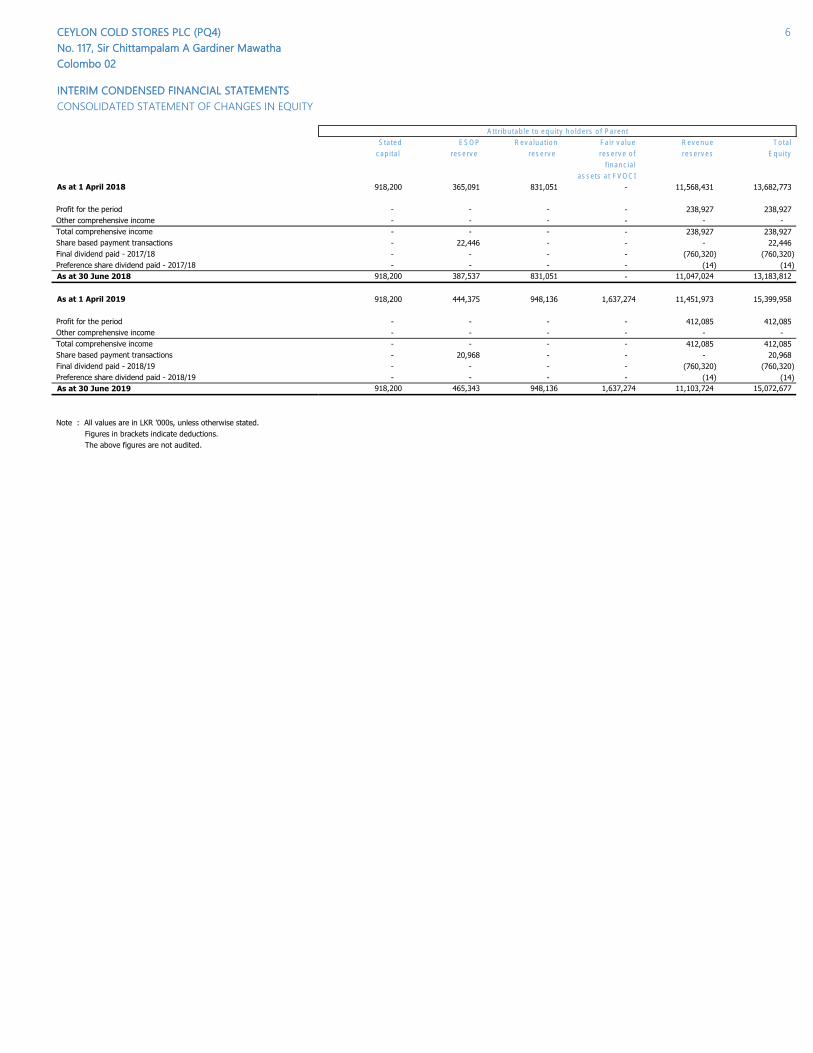
CONSOLIDATED STATEMENT OF CHANGES IN EQUITY
Stated ESOP Revaluation Fair value Revenue Total
capital reserve reserve reserve of reserves Equity
financial
assets at FVOCI
As at 1 April 2018 918,200 365,091 831,051 - 11,568,431 13,682,773
Profit for the period - - - - 238,927 238,927
Other comprehensive income - - - - - -
Total comprehensive income - - - - 238,927 238,927
Share based payment transactions - 22,446 - - - 22,446
Final dividend paid - 2017/18 - - - - (760,320) (760,320)
Preference share dividend paid - 2017/18 - - - - (14) (14)
As at 30 June 2018 918,200 387,537 831,051 - 11,047,024 13,183,812
As at 1 April 2019 918,200 444,375 948,136 1,637,274 11,451,973 15,399,958
Profit for the period - - - - 412,085 412,085
Other comprehensive income - - - - - -
Total comprehensive income - - - - 412,085 412,085
Share based payment transactions - 20,968 - - - 20,968
Final dividend paid - 2018/19 - - - - (760,320) (760,320)
Preference share dividend paid - 2018/19 - - - - (14) (14)
As at 30 June 2019 918,200 465,343 948,136 1,637,274 11,103,724 15,072,677
Note : All values are in LKR '000s, unless otherwise stated.
Figures in brackets indicate deductions.
The above figures are not audited.
Attributable to equity holders of Parent
7
CEYLON COLD STORES PLC (PQ4)
No. 117, Sir Chittampalam A Gardiner Mawatha
Colombo 02
INTERIM CONDENSED FINANCIAL STATEMENTS
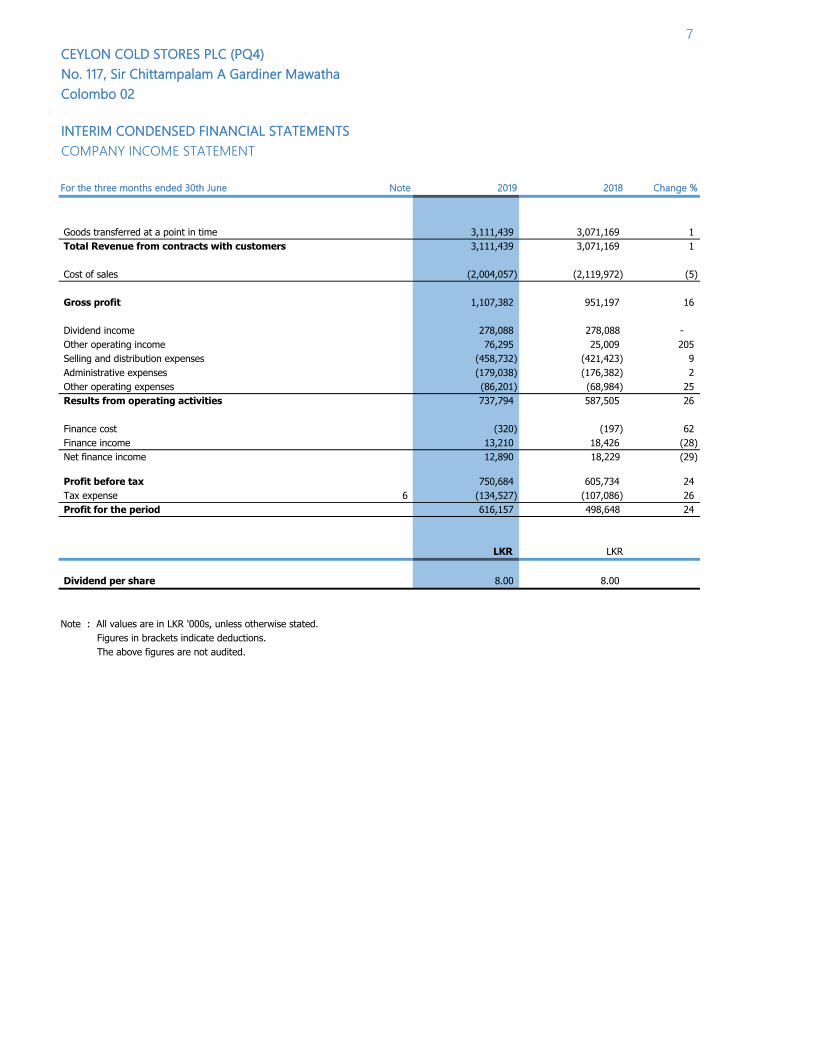
COMPANY INCOME STATEMENT
For the three months ended 30th June Note 2019 2018 Change %
Goods transferred at a point in time 3,111,439 3,071,169 1
Total Revenue from contracts with customers 3,111,439 3,071,169 1
Cost of sales (2,004,057) (2,119,972) (5)
Gross profit 1,107,382 951,197 16
Dividend income 278,088 278,088 -
Other operating income 76,295 25,009 205
Selling and distribution expenses (458,732) (421,423) 9
Administrative expenses (179,038) (176,382) 2
Other operating expenses (86,201) (68,984) 25
Results from operating activities 737,794 587,505 26
Finance cost (320) (197) 62
Finance income 13,210 18,426 (28)
Net finance income 12,890 18,229 (29)
Profit before tax 750,684 605,734 24
Tax expense 6 (134,527) (107,086) 26
Profit for the period 616,157 498,648 24
LKR LKR
Dividend per share 8.00 8.00
Note : All values are in LKR '000s, unless otherwise stated.
Figures in brackets indicate deductions.
The above figures are not audited.
CEYLON COLD STORES PLC (PQ4) 8
No. 117, Sir Chittampalam A Gardiner Mawatha
Colombo 02
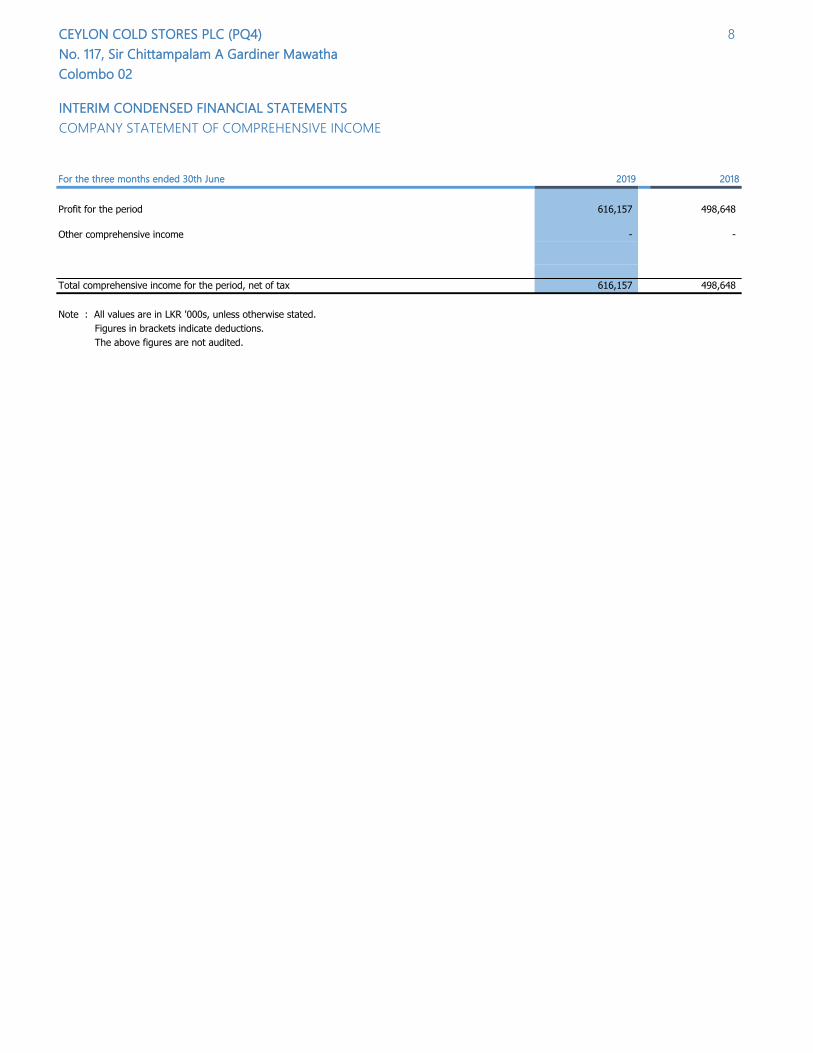
INTERIM CONDENSED FINANCIAL STATEMENTS
COMPANY STATEMENT OF COMPREHENSIVE INCOME
For the three months ended 30th June 2019 2018
Profit for the period 616,157 498,648
Other comprehensive income - -
Total comprehensive income for the period, net of tax 616,157 498,648
Note : All values are in LKR '000s, unless otherwise stated.
Figures in brackets indicate deductions.
The above figures are not audited.
CEYLON COLD STORES PLC (PQ4) 9
No. 117, Sir Chittampalam A Gardiner Mawatha
Colombo 02
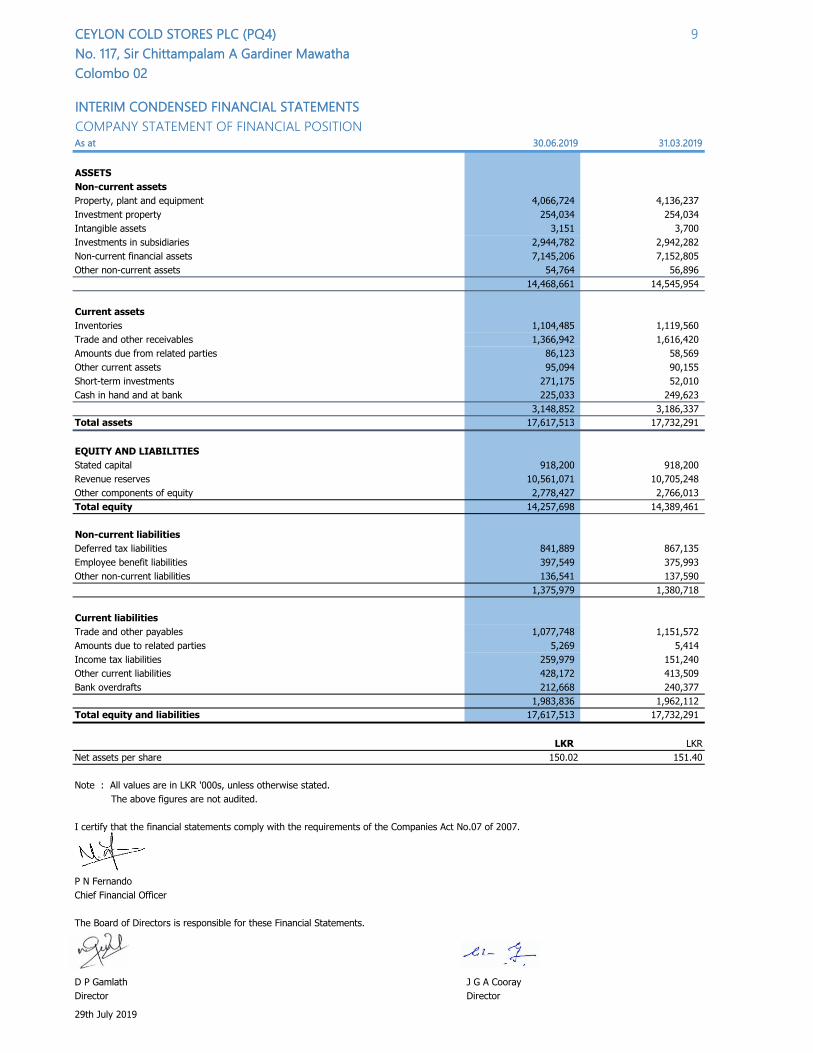
INTERIM CONDENSED FINANCIAL STATEMENTS
COMPANY STATEMENT OF FINANCIAL POSITIONAs at 30.06.2019 31.03.2019
ASSETS
Non-current assets
Property, plant and equipment 4,066,724 4,136,237
Investment property 254,034 254,034
Intangible assets 3,151 3,700
Investments in subsidiaries 2,944,782 2,942,282
Non-current financial assets 7,145,206 7,152,805
Other non-current assets 54,764 56,896
14,468,661 14,545,954
Current assets
Inventories 1,104,485 1,119,560
Trade and other receivables 1,366,942 1,616,420
Amounts due from related parties 86,123 58,569
Other current assets 95,094 90,155
Short-term investments 271,175 52,010
Cash in hand and at bank 225,033 249,623
3,148,852 3,186,337
Total assets 17,617,513 17,732,291
EQUITY AND LIABILITIES
Stated capital 918,200 918,200
Revenue reserves 10,561,071 10,705,248
Other components of equity 2,778,427 2,766,013
Total equity 14,257,698 14,389,461
Non-current liabilities
Deferred tax liabilities 841,889 867,135
Employee benefit liabilities 397,549 375,993
Other non-current liabilities 136,541 137,590
1,375,979 1,380,718
Current liabilities
Trade and other payables 1,077,748 1,151,572
Amounts due to related parties 5,269 5,414
Income tax liabilities 259,979 151,240
Other current liabilities 428,172 413,509
Bank overdrafts 212,668 240,377
1,983,836 1,962,112
Total equity and liabilities 17,617,513 17,732,291
LKR LKR
Net assets per share 150.02 151.40
Note : All values are in LKR '000s, unless otherwise stated.
The above figures are not audited.
I certify that the financial statements comply with the requirements of the Companies Act No.07 of 2007.
P N Fernando
Chief Financial Officer
The Board of Directors is responsible for these Financial Statements.
D P Gamlath J G A Cooray
Director Director
29th July 2019
CEYLON COLD STORES PLC (PQ4) 10
No. 117, Sir Chittampalam A Gardiner Mawatha
Colombo 02
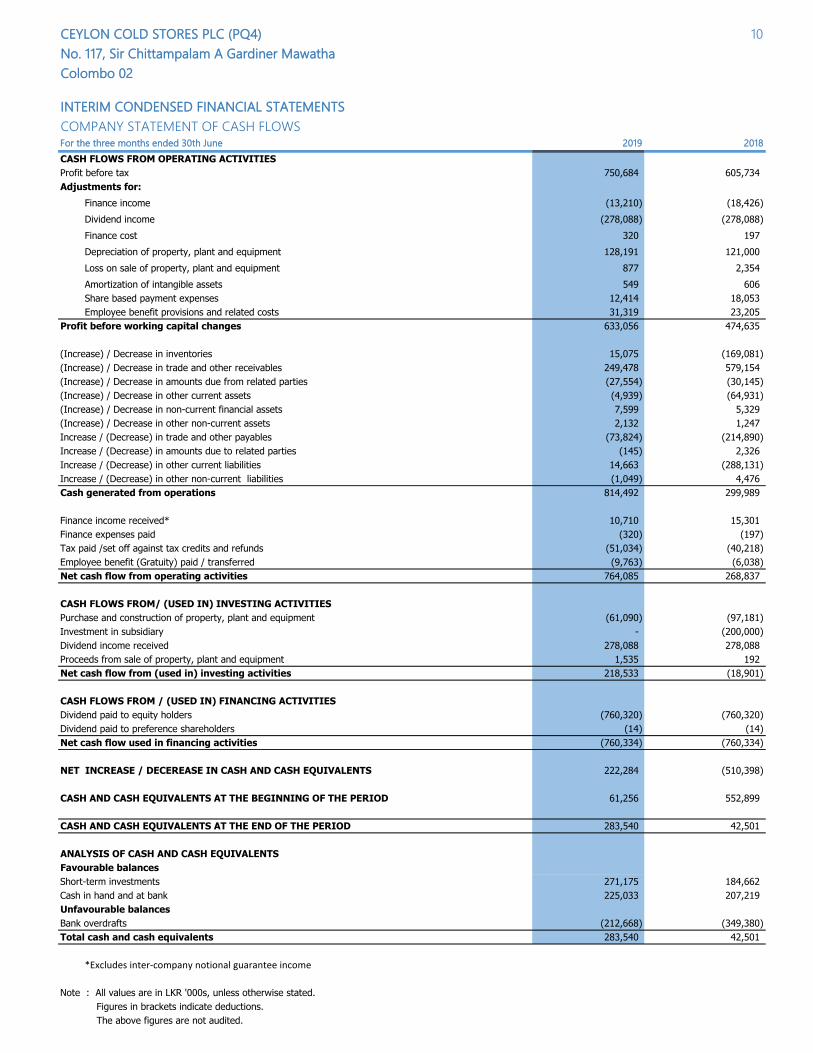
INTERIM CONDENSED FINANCIAL STATEMENTS
COMPANY STATEMENT OF CASH FLOWSFor the three months ended 30th June 2019 2018
CASH FLOWS FROM OPERATING ACTIVITIES
Profit before tax 750,684 605,734
Adjustments for:
Finance income (13,210) (18,426)
Dividend income (278,088) (278,088)
Finance cost 320 197
Depreciation of property, plant and equipment 128,191 121,000
Loss on sale of property, plant and equipment 877 2,354
Amortization of intangible assets 549 606
Share based payment expenses 12,414 18,053
Employee benefit provisions and related costs 31,319 23,205
Profit before working capital changes 633,056 474,635
(Increase) / Decrease in inventories 15,075 (169,081)
(Increase) / Decrease in trade and other receivables 249,478 579,154
(Increase) / Decrease in amounts due from related parties (27,554) (30,145)
(Increase) / Decrease in other current assets (4,939) (64,931)
(Increase) / Decrease in non-current financial assets 7,599 5,329
(Increase) / Decrease in other non-current assets 2,132 1,247
Increase / (Decrease) in trade and other payables (73,824) (214,890)
Increase / (Decrease) in amounts due to related parties (145) 2,326
Increase / (Decrease) in other current liabilities 14,663 (288,131)
Increase / (Decrease) in other non-current liabilities (1,049) 4,476
Cash generated from operations 814,492 299,989
Finance income received* 10,710 15,301
Finance expenses paid (320) (197)
Tax paid /set off against tax credits and refunds (51,034) (40,218)
Employee benefit (Gratuity) paid / transferred (9,763) (6,038)
Net cash flow from operating activities 764,085 268,837
CASH FLOWS FROM/ (USED IN) INVESTING ACTIVITIES
Purchase and construction of property, plant and equipment (61,090) (97,181)
Investment in subsidiary - (200,000)
Dividend income received 278,088 278,088
Proceeds from sale of property, plant and equipment 1,535 192
Net cash flow from (used in) investing activities 218,533 (18,901)
CASH FLOWS FROM / (USED IN) FINANCING ACTIVITIES
Dividend paid to equity holders (760,320) (760,320)
Dividend paid to preference shareholders (14) (14)
Net cash flow used in financing activities (760,334) (760,334)
NET INCREASE / DECEREASE IN CASH AND CASH EQUIVALENTS 222,284 (510,398)
CASH AND CASH EQUIVALENTS AT THE BEGINNING OF THE PERIOD 61,256 552,899
CASH AND CASH EQUIVALENTS AT THE END OF THE PERIOD 283,540 42,501
ANALYSIS OF CASH AND CASH EQUIVALENTS
Favourable balances
Short-term investments 271,175 184,662
Cash in hand and at bank 225,033 207,219
Unfavourable balances
Bank overdrafts (212,668) (349,380)
Total cash and cash equivalents 283,540 42,501
*Excludes inter-company notional guarantee income
Note : All values are in LKR '000s, unless otherwise stated.
Figures in brackets indicate deductions.
The above figures are not audited.
CEYLON COLD STORES PLC (PQ4) 11
No. 117, Sir Chittampalam A Gardiner Mawatha
Colombo 02
INTERIM CONDENSED FINANCIAL STATEMENTS
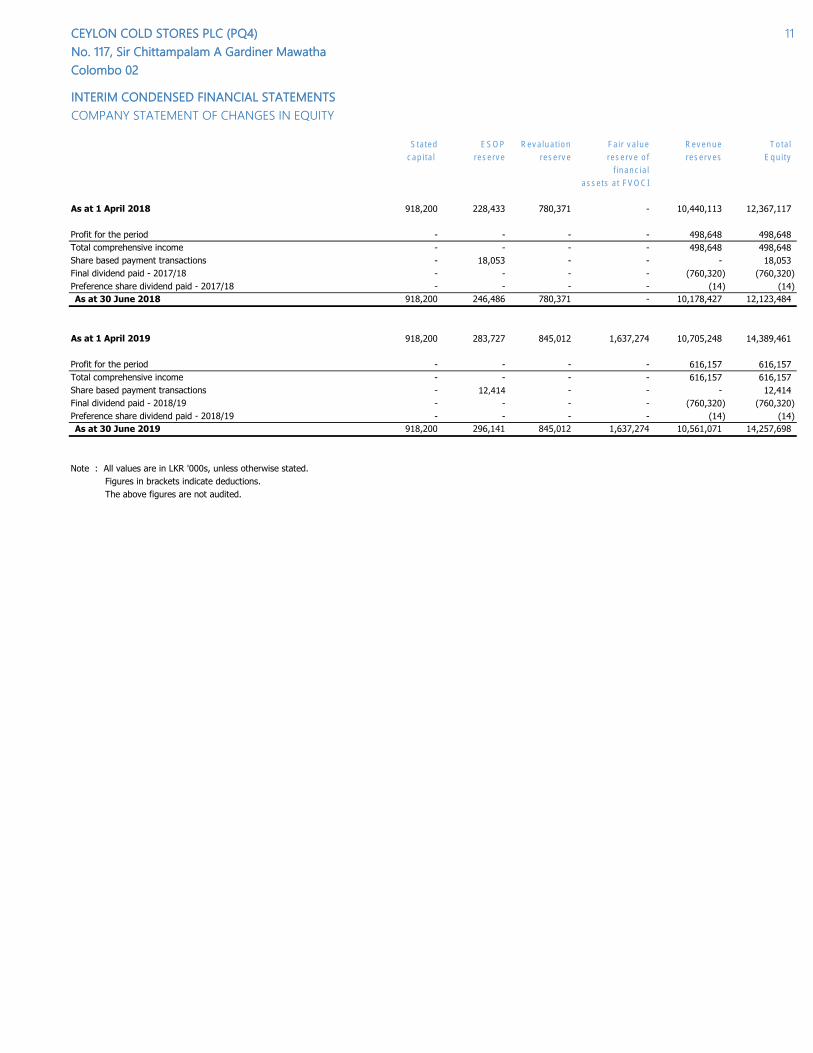
COMPANY STATEMENT OF CHANGES IN EQUITY
Stated ESOP Revaluation Fair value Revenue Total
capital reserve reserve reserve of reserves Equity
financial
assets at FVOCI
As at 1 April 2018 918,200 228,433 780,371 - 10,440,113 12,367,117
Profit for the period - - - - 498,648 498,648
Total comprehensive income - - - - 498,648 498,648
Share based payment transactions - 18,053 - - - 18,053
Final dividend paid - 2017/18 - - - - (760,320) (760,320)
Preference share dividend paid - 2017/18 - - - - (14) (14)
As at 30 June 2018 918,200 246,486 780,371 - 10,178,427 12,123,484
As at 1 April 2019 918,200 283,727 845,012 1,637,274 10,705,248 14,389,461
Profit for the period - - - - 616,157 616,157
Total comprehensive income - - - - 616,157 616,157
Share based payment transactions - 12,414 - - - 12,414
Final dividend paid - 2018/19 - - - - (760,320) (760,320)
Preference share dividend paid - 2018/19 - - - - (14) (14)
As at 30 June 2019 918,200 296,141 845,012 1,637,274 10,561,071 14,257,698
Note : All values are in LKR '000s, unless otherwise stated.
Figures in brackets indicate deductions.
The above figures are not audited.
12
CEYLON COLD STORES PLC (PQ4)
No. 117, Sir Chittampalam A Gardiner Mawatha
Colombo 02
INTERIM CONDENSED FINANCIAL STATEMENTS
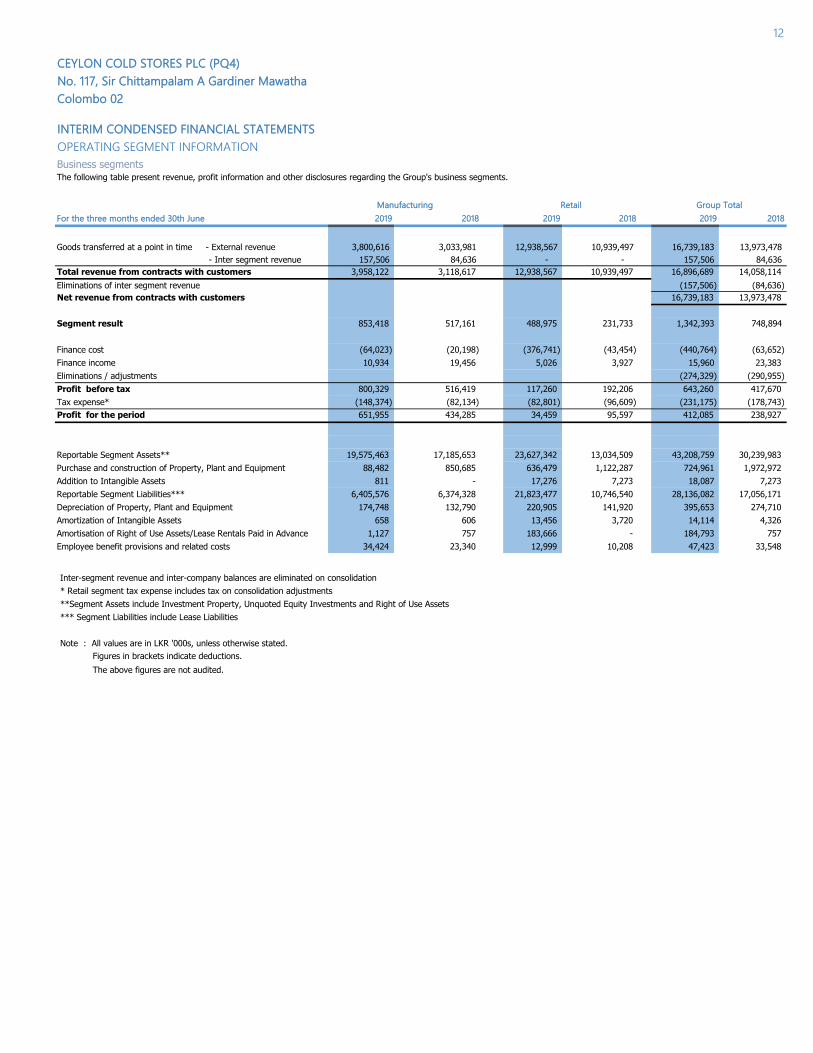
OPERATING SEGMENT INFORMATION
Business segmentsThe following table present revenue, profit information and other disclosures regarding the Group's business segments.
For the three months ended 30th June 2019 2018 2019 2018 2019 2018
Goods transferred at a point in time - External revenue 3,800,616 3,033,981 12,938,567 10,939,497 16,739,183 13,973,478
- Inter segment revenue 157,506 84,636 - - 157,506 84,636
Total revenue from contracts with customers 3,958,122 3,118,617 12,938,567 10,939,497 16,896,689 14,058,114
Eliminations of inter segment revenue (157,506) (84,636)
Net revenue from contracts with customers 16,739,183 13,973,478
Segment result 853,418 517,161 488,975 231,733 1,342,393 748,894
Finance cost (64,023) (20,198) (376,741) (43,454) (440,764) (63,652)
Finance income 10,934 19,456 5,026 3,927 15,960 23,383
Eliminations / adjustments (274,329) (290,955)
Profit before tax 800,329 516,419 117,260 192,206 643,260 417,670
Tax expense* (148,374) (82,134) (82,801) (96,609) (231,175) (178,743)
Profit for the period 651,955 434,285 34,459 95,597 412,085 238,927
Reportable Segment Assets** 19,575,463 17,185,653 23,627,342 13,034,509 43,208,759 30,239,983
Purchase and construction of Property, Plant and Equipment 88,482 850,685 636,479 1,122,287 724,961 1,972,972
Addition to Intangible Assets 811 - 17,276 7,273 18,087 7,273
Reportable Segment Liabilities*** 6,405,576 6,374,328 21,823,477 10,746,540 28,136,082 17,056,171
Depreciation of Property, Plant and Equipment 174,748 132,790 220,905 141,920 395,653 274,710
Amortization of Intangible Assets 658 606 13,456 3,720 14,114 4,326
Amortisation of Right of Use Assets/Lease Rentals Paid in Advance 1,127 757 183,666 - 184,793 757
Employee benefit provisions and related costs 34,424 23,340 12,999 10,208 47,423 33,548
Inter-segment revenue and inter-company balances are eliminated on consolidation
* Retail segment tax expense includes tax on consolidation adjustments
**Segment Assets include Investment Property, Unquoted Equity Investments and Right of Use Assets
*** Segment Liabilities include Lease Liabilities
Note : All values are in LKR '000s, unless otherwise stated.
Figures in brackets indicate deductions.
The above figures are not audited.
Manufacturing Retail Group Total
CEYLON COLD STORES PLC (PQ4) 13
No. 117, Sir Chittampalam A Gardiner Mawatha
Colombo 02
INTERIM CONDENSED FINANCIAL STATEMENTS
NOTES TO INTERIM CONDENSED FINANCIAL STATEMENTS
1 CORPORATE INFORMATION
2 INTERIM CONDENSED FINANCIAL STATEMENTS
3 APPROVAL OF FINANCIAL STATEMENTS
4 BASIS OF PREPARATION AND CHANGES TO THE GROUP'S ACCOUNTING POLICIES
4.1 Basis of Preparation
4.2 Fair value measurement and related fair value disclosures
4.3 New standards, interpretations and amendments adopted by the Group
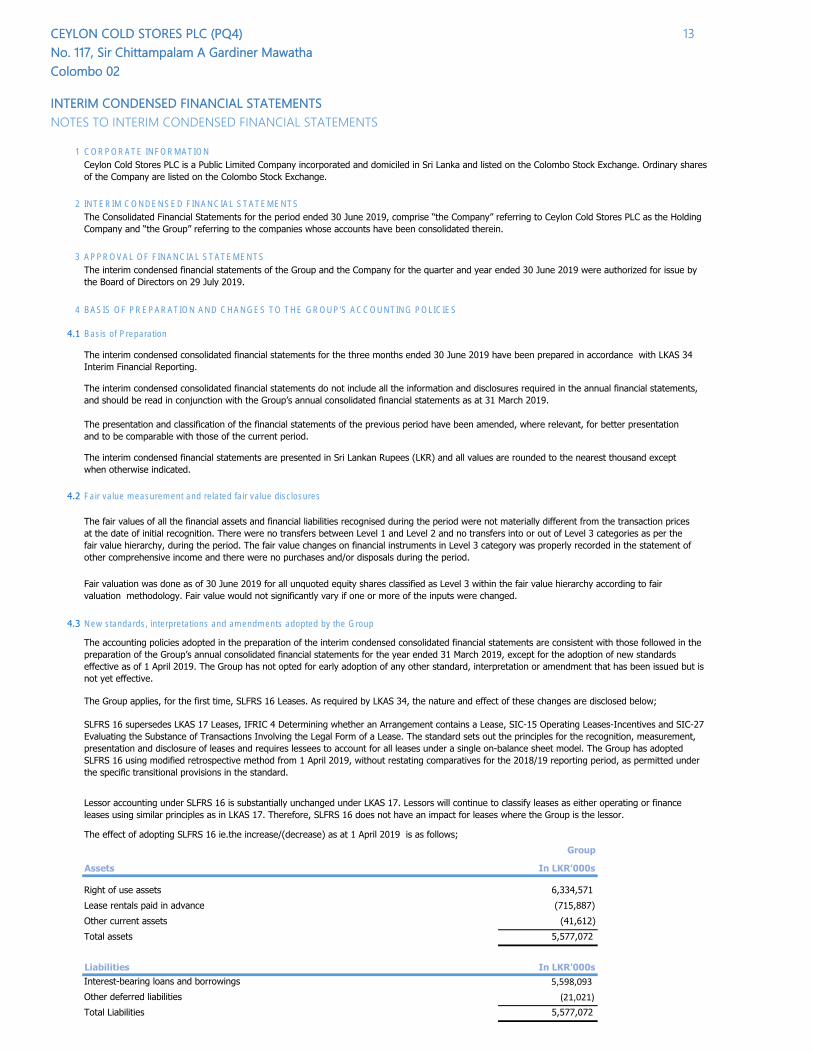
The effect of adopting SLFRS 16 ie.the increase/(decrease) as at 1 April 2019 is as follows;
Group
Assets In LKR'000s
Right of use assets 6,334,571
Lease rentals paid in advance (715,887)
Other current assets (41,612)
Total assets 5,577,072
Liabilities In LKR'000s
Interest-bearing loans and borrowings 5,598,093
Other deferred liabilities (21,021)
Total Liabilities 5,577,072
The interim condensed consolidated financial statements do not include all the information and disclosures required in the annual financial statements,
and should be read in conjunction with the Group’s annual consolidated financial statements as at 31 March 2019.
The fair values of all the financial assets and financial liabilities recognised during the period were not materially different from the transaction prices
at the date of initial recognition. There were no transfers between Level 1 and Level 2 and no transfers into or out of Level 3 categories as per the
fair value hierarchy, during the period. The fair value changes on financial instruments in Level 3 category was properly recorded in the statement of
other comprehensive income and there were no purchases and/or disposals during the period.
Fair valuation was done as of 30 June 2019 for all unquoted equity shares classified as Level 3 within the fair value hierarchy according to fair
valuation methodology. Fair value would not significantly vary if one or more of the inputs were changed.
The presentation and classification of the financial statements of the previous period have been amended, where relevant, for better presentation
and to be comparable with those of the current period.
The interim condensed financial statements are presented in Sri Lankan Rupees (LKR) and all values are rounded to the nearest thousand except
when otherwise indicated.
The accounting policies adopted in the preparation of the interim condensed consolidated financial statements are consistent with those followed in the
preparation of the Group’s annual consolidated financial statements for the year ended 31 March 2019, except for the adoption of new standards
effective as of 1 April 2019. The Group has not opted for early adoption of any other standard, interpretation or amendment that has been issued but is
not yet effective.
SLFRS 16 supersedes LKAS 17 Leases, IFRIC 4 Determining whether an Arrangement contains a Lease, SIC-15 Operating Leases-Incentives and SIC-27
Evaluating the Substance of Transactions Involving the Legal Form of a Lease. The standard sets out the principles for the recognition, measurement,
presentation and disclosure of leases and requires lessees to account for all leases under a single on-balance sheet model. The Group has adopted
SLFRS 16 using modified retrospective method from 1 April 2019, without restating comparatives for the 2018/19 reporting period, as permitted under
the specific transitional provisions in the standard.
The Group applies, for the first time, SLFRS 16 Leases. As required by LKAS 34, the nature and effect of these changes are disclosed below;
Lessor accounting under SLFRS 16 is substantially unchanged under LKAS 17. Lessors will continue to classify leases as either operating or finance
leases using similar principles as in LKAS 17. Therefore, SLFRS 16 does not have an impact for leases where the Group is the lessor.
Ceylon Cold Stores PLC is a Public Limited Company incorporated and domiciled in Sri Lanka and listed on the Colombo Stock Exchange. Ordinary shares
of the Company are listed on the Colombo Stock Exchange.
The Consolidated Financial Statements for the period ended 30 June 2019, comprise “the Company” referring to Ceylon Cold Stores PLC as the Holding
Company and “the Group” referring to the companies whose accounts have been consolidated therein.
The interim condensed financial statements of the Group and the Company for the quarter and year ended 30 June 2019 were authorized for issue by
the Board of Directors on 29 July 2019.
The interim condensed consolidated financial statements for the three months ended 30 June 2019 have been prepared in accordance with LKAS 34
Interim Financial Reporting.
CEYLON COLD STORES PLC (PQ4)
No. 117, Sir Chittampalam A Gardiner Mawatha
Colombo 02
INTERIM CONDENSED FINANCIAL STATEMENTS
NOTES TO INTERIM CONDENSED FINANCIAL STATEMENTS
a) Nature of the effect of adoption of SLFRS 16
Leases previously classified as finance leases
Leases previously accounted for as operating leases
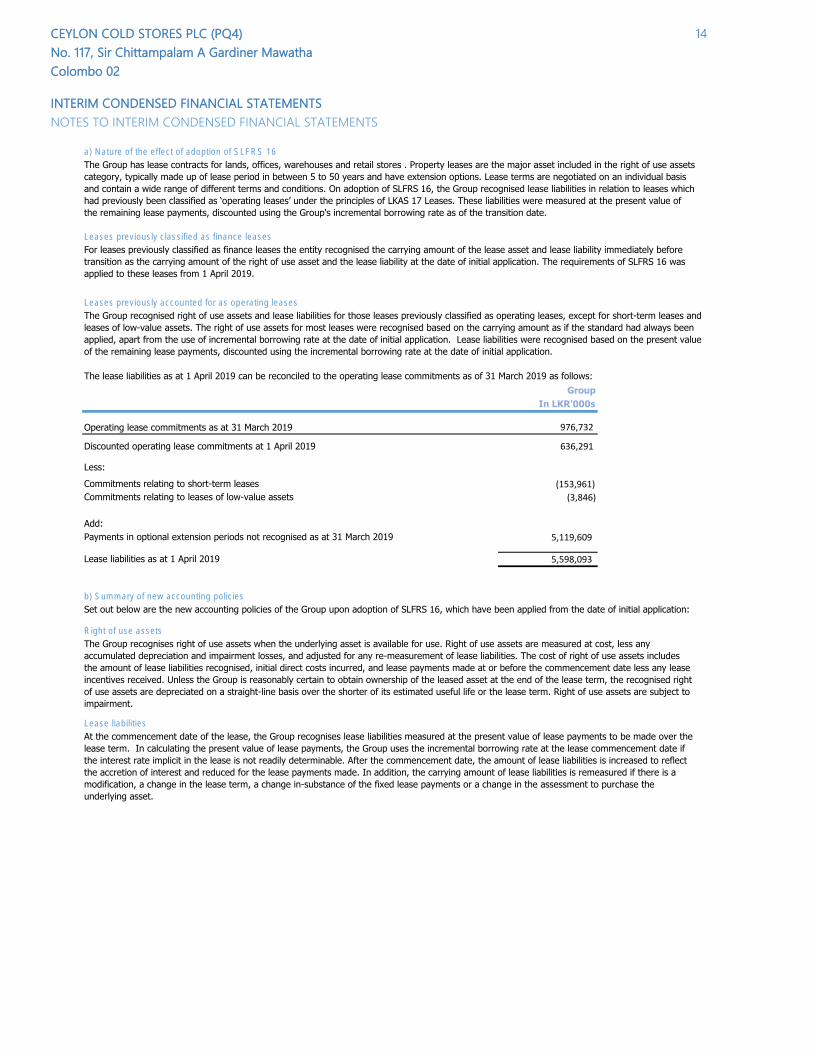
The lease liabilities as at 1 April 2019 can be reconciled to the operating lease commitments as of 31 March 2019 as follows:
Group
In LKR'000s
Operating lease commitments as at 31 March 2019 976,732
Discounted operating lease commitments at 1 April 2019 636,291
Less:
Commitments relating to short-term leases (153,961)
Commitments relating to leases of low-value assets (3,846)
Add:
Payments in optional extension periods not recognised as at 31 March 2019 5,119,609
Lease liabilities as at 1 April 2019 5,598,093
b) Summary of new accounting policies
Right of use assets
Lease liabilities
The Group recognises right of use assets when the underlying asset is available for use. Right of use assets are measured at cost, less any
accumulated depreciation and impairment losses, and adjusted for any re-measurement of lease liabilities. The cost of right of use assets includes
the amount of lease liabilities recognised, initial direct costs incurred, and lease payments made at or before the commencement date less any lease
incentives received. Unless the Group is reasonably certain to obtain ownership of the leased asset at the end of the lease term, the recognised right
of use assets are depreciated on a straight-line basis over the shorter of its estimated useful life or the lease term. Right of use assets are subject to
impairment.
At the commencement date of the lease, the Group recognises lease liabilities measured at the present value of lease payments to be made over the
lease term. In calculating the present value of lease payments, the Group uses the incremental borrowing rate at the lease commencement date if
the interest rate implicit in the lease is not readily determinable. After the commencement date, the amount of lease liabilities is increased to reflect
the accretion of interest and reduced for the lease payments made. In addition, the carrying amount of lease liabilities is remeasured if there is a
modification, a change in the lease term, a change in-substance of the fixed lease payments or a change in the assessment to purchase the
underlying asset.
14
The Group has lease contracts for lands, offices, warehouses and retail stores . Property leases are the major asset included in the right of use assets
category, typically made up of lease period in between 5 to 50 years and have extension options. Lease terms are negotiated on an individual basis
and contain a wide range of different terms and conditions. On adoption of SLFRS 16, the Group recognised lease liabilities in relation to leases which
had previously been classified as ‘operating leases’ under the principles of LKAS 17 Leases. These liabilities were measured at the present value of
the remaining lease payments, discounted using the Group's incremental borrowing rate as of the transition date.
For leases previously classified as finance leases the entity recognised the carrying amount of the lease asset and lease liability immediately before
transition as the carrying amount of the right of use asset and the lease liability at the date of initial application. The requirements of SLFRS 16 was
applied to these leases from 1 April 2019.
The Group recognised right of use assets and lease liabilities for those leases previously classified as operating leases, except for short-term leases and
leases of low-value assets. The right of use assets for most leases were recognised based on the carrying amount as if the standard had always been
applied, apart from the use of incremental borrowing rate at the date of initial application. Lease liabilities were recognised based on the present value
of the remaining lease payments, discounted using the incremental borrowing rate at the date of initial application.
Set out below are the new accounting policies of the Group upon adoption of SLFRS 16, which have been applied from the date of initial application:
CEYLON COLD STORES PLC (PQ4)
No. 117, Sir Chittampalam A Gardiner Mawatha
Colombo 02
INTERIM CONDENSED FINANCIAL STATEMENTS
NOTES TO INTERIM CONDENSED FINANCIAL STATEMENTS
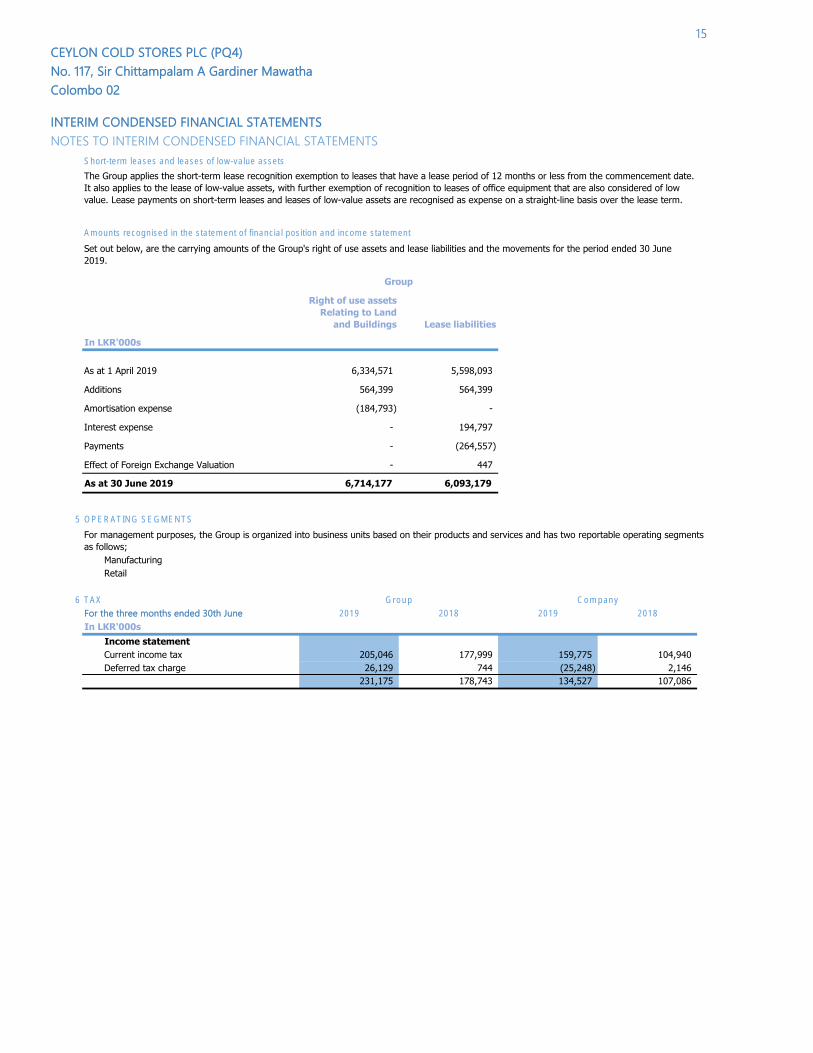
Short-term leases and leases of low-value assets
Amounts recognised in the statement of financial position and income statement
Right of use assets
Relating to Land
and Buildings Lease liabilities
In LKR'000s
As at 1 April 2019 6,334,571 5,598,093
Additions 564,399 564,399
Amortisation expense (184,793) -
Interest expense - 194,797
Payments - (264,557)
Effect of Foreign Exchange Valuation - 447
As at 30 June 2019 6,714,177 6,093,179
5 OPERATING SEGMENTS
Manufacturing
Retail
6 TAX
For the three months ended 30th June 2019 2018 2019 2018
In LKR'000s
Income statement
Current income tax 205,046 177,999 159,775 104,940
Deferred tax charge 26,129 744 (25,248) 2,146
231,175 178,743 134,527 107,086
For management purposes, the Group is organized into business units based on their products and services and has two reportable operating segments
as follows;
Group Company
The Group applies the short-term lease recognition exemption to leases that have a lease period of 12 months or less from the commencement date.
It also applies to the lease of low-value assets, with further exemption of recognition to leases of office equipment that are also considered of low
value. Lease payments on short-term leases and leases of low-value assets are recognised as expense on a straight-line basis over the lease term.
Set out below, are the carrying amounts of the Group's right of use assets and lease liabilities and the movements for the period ended 30 June
2019.
15
Group
CEYLON COLD STORES PLC (PQ4) 16
No. 117, Sir Chittampalam A Gardiner Mawatha
Colombo 02
INTERIM CONDENSED FINANCIAL STATEMENTS
NOTES TO INTERIM CONDENSED FINANCIAL STATEMENTS
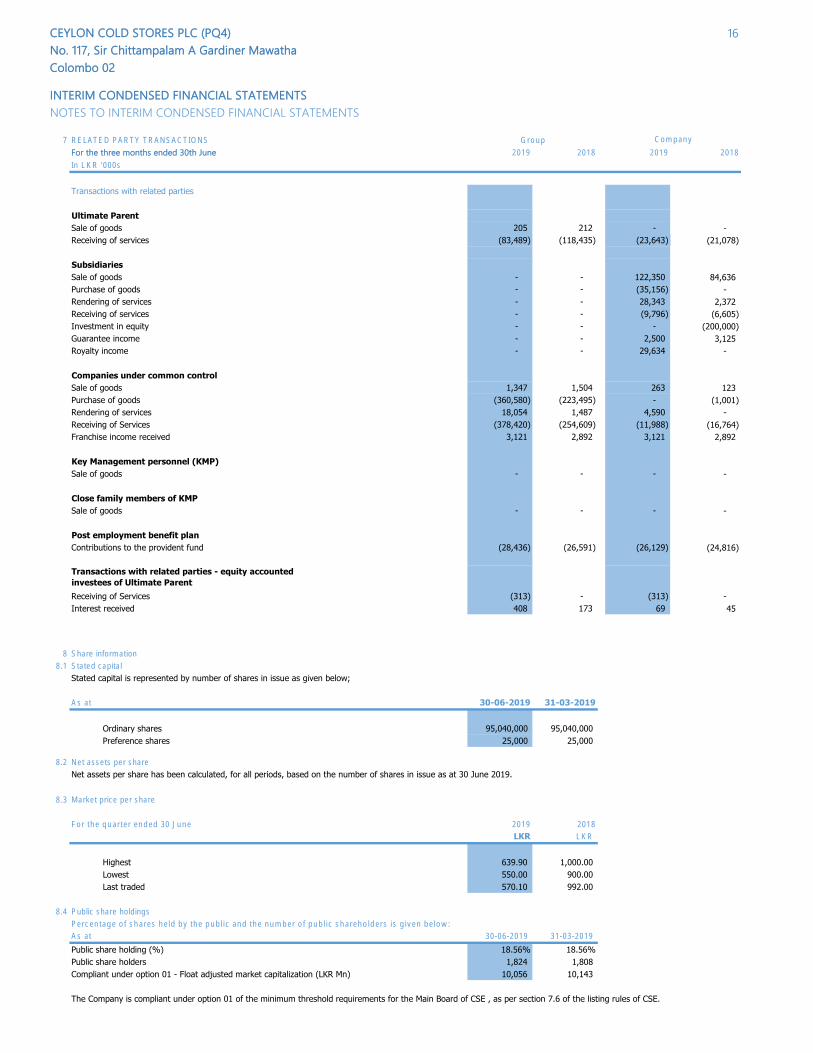
7 RELATED PARTY TRANSACTIONS
For the three months ended 30th June 2019 2018 2019 2018
In LKR '000s
Transactions with related parties
Ultimate Parent
Sale of goods 205 212 - -
Receiving of services (83,489) (118,435) (23,643) (21,078)
Subsidiaries
Sale of goods - - 122,350 84,636
Purchase of goods - - (35,156) -
Rendering of services - - 28,343 2,372
Receiving of services - - (9,796) (6,605)
Investment in equity - - - (200,000)
Guarantee income - - 2,500 3,125
Royalty income - - 29,634 -
Companies under common control
Sale of goods 1,347 1,504 263 123
Purchase of goods (360,580) (223,495) - (1,001)
Rendering of services 18,054 1,487 4,590 -
Receiving of Services (378,420) (254,609) (11,988) (16,764)
Franchise income received 3,121 2,892 3,121 2,892
Key Management personnel (KMP)
Sale of goods - - - -
Close family members of KMP
Sale of goods - - - -
Post employment benefit plan
Contributions to the provident fund (28,436) (26,591) (26,129) (24,816)
Receiving of Services (313) - (313) -
Interest received 408 173 69 45
8 Share information
8.1 Stated capital
Stated capital is represented by number of shares in issue as given below;
As at 30-06-2019 31-03-2019
Ordinary shares 95,040,000 95,040,000
Preference shares 25,000 25,000
8.2 Net assets per share
Net assets per share has been calculated, for all periods, based on the number of shares in issue as at 30 June 2019.
8.3 Market price per share
For the quarter ended 30 June 2019 2018
LKR LKR
Highest 639.90 1,000.00
Lowest 550.00 900.00
Last traded 570.10 992.00
8.4 Public share holdings
Percentage of shares held by the public and the number of public shareholders is given below:
As at 30-06-2019 31-03-2019
Public share holding (%) 18.56% 18.56%
Public share holders 1,824 1,808
Compliant under option 01 - Float adjusted market capitalization (LKR Mn) 10,056 10,143
The Company is compliant under option 01 of the minimum threshold requirements for the Main Board of CSE , as per section 7.6 of the listing rules of CSE.
Group Company
Transactions with related parties - equity accounted
investees of Ultimate Parent
CEYLON COLD STORES PLC (PQ4) 17
No. 117, Sir Chittampalam A Gardiner Mawatha
Colombo 02
INTERIM CONDENSED FINANCIAL STATEMENTS
NOTES TO INTERIM CONDENSED FINANCIAL STATEMENTS
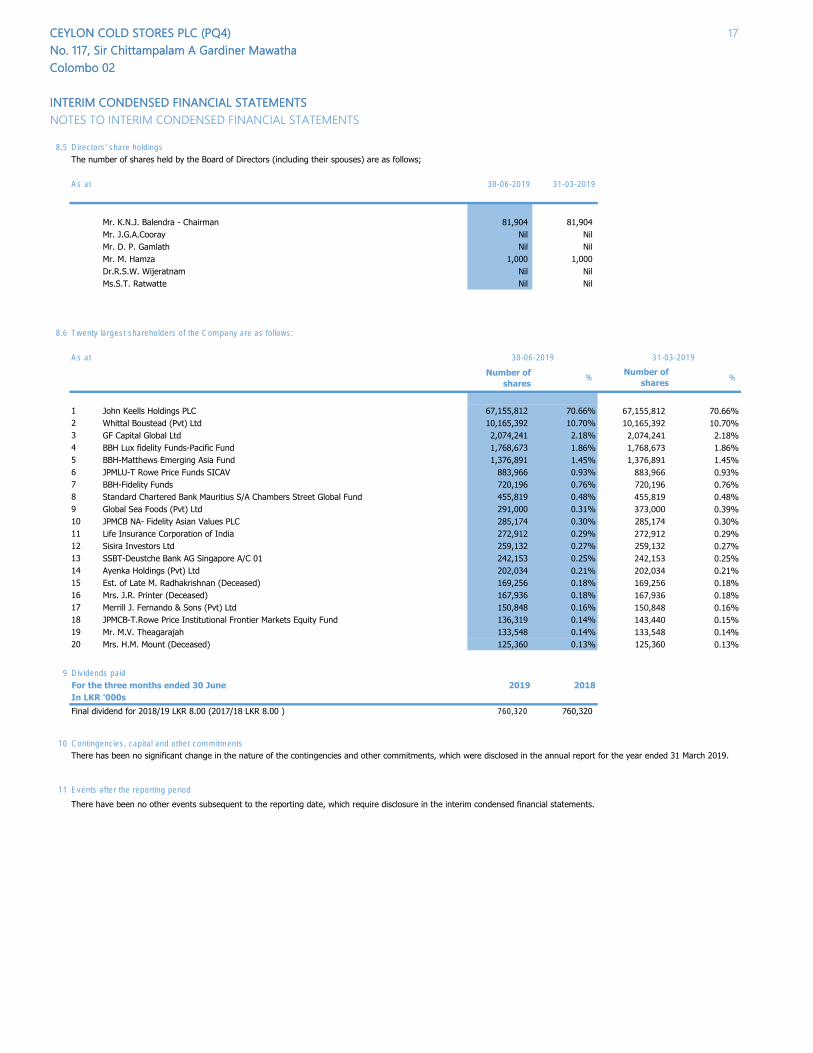
8.5 Directors' share holdings
The number of shares held by the Board of Directors (including their spouses) are as follows;
As at 30-06-2019 31-03-2019
Mr. K.N.J. Balendra - Chairman 81,904 81,904
Mr. J.G.A.Cooray Nil Nil
Mr. D. P. Gamlath Nil Nil
Mr. M. Hamza 1,000 1,000
Dr.R.S.W. Wijeratnam Nil Nil
Ms.S.T. Ratwatte Nil Nil
8.6 Twenty largest shareholders of the Company are as follows:
As at
Number of
shares %
Number of
shares %
1 John Keells Holdings PLC 67,155,812 70.66% 67,155,812 70.66%
2 Whittal Boustead (Pvt) Ltd 10,165,392 10.70% 10,165,392 10.70%
3 GF Capital Global Ltd 2,074,241 2.18% 2,074,241 2.18%
4 BBH Lux fidelity Funds-Pacific Fund 1,768,673 1.86% 1,768,673 1.86%
5 BBH-Matthews Emerging Asia Fund 1,376,891 1.45% 1,376,891 1.45%
6 JPMLU-T Rowe Price Funds SICAV 883,966 0.93% 883,966 0.93%
7 BBH-Fidelity Funds 720,196 0.76% 720,196 0.76%
8 Standard Chartered Bank Mauritius S/A Chambers Street Global Fund 455,819 0.48% 455,819 0.48%
9 Global Sea Foods (Pvt) Ltd 291,000 0.31% 373,000 0.39%
10 JPMCB NA- Fidelity Asian Values PLC 285,174 0.30% 285,174 0.30%
11 Life Insurance Corporation of India 272,912 0.29% 272,912 0.29%
12 Sisira Investors Ltd 259,132 0.27% 259,132 0.27%
13 SSBT-Deustche Bank AG Singapore A/C 01 242,153 0.25% 242,153 0.25%
14 Ayenka Holdings (Pvt) Ltd 202,034 0.21% 202,034 0.21%
15 Est. of Late M. Radhakrishnan (Deceased) 169,256 0.18% 169,256 0.18%
16 Mrs. J.R. Printer (Deceased) 167,936 0.18% 167,936 0.18%
17 Merrill J. Fernando & Sons (Pvt) Ltd 150,848 0.16% 150,848 0.16%
18 JPMCB-T.Rowe Price Institutional Frontier Markets Equity Fund 136,319 0.14% 143,440 0.15%
19 Mr. M.V. Theagarajah 133,548 0.14% 133,548 0.14%
20 Mrs. H.M. Mount (Deceased) 125,360 0.13% 125,360 0.13%
9 Dividends paid
For the three months ended 30 June 2019 2018
In LKR '000s
Final dividend for 2018/19 LKR 8.00 (2017/18 LKR 8.00 ) 760,320 760,320
10 Contingencies, capital and other commitments
11 Events after the reporting period
There have been no other events subsequent to the reporting date, which require disclosure in the interim condensed financial statements.
There has been no significant change in the nature of the contingencies and other commitments, which were disclosed in the annual report for the year ended 31 March 2019.
30-06-2019 31-03-2019