Embed Size (px)
Citation preview

CF Industries Holdings, Inc.CF Industries Holdings, Inc.
2006 Goldman Sachs 2006 Goldman Sachs Agriculture Biotech ForumAgriculture Biotech Forum
CF Industries Holdings, Inc.CF Industries Holdings, Inc.NYSE: CFNYSE: CF February 14,February 14, 20062006

2
Safe Harbor Statement
Certain statements contained in this presentation may constitute “forward-looking statements” within the meaning of federal securities laws. All statements in this presentation, other than those relating to our historical information or current condition, are forward-looking statements. These forward-looking statements are subject to a number of risks and uncertainties, many of which are beyond our control, which could cause our actual results to differ materially from such statements. These risks and uncertainties include the relatively expensive and volatile cost of North American natural gas; the cyclical nature of our business; the nature of our products as global commodities; intense global competition in the consolidating markets in which we operate; conditions in the U.S. agricultural industry; weather conditions; our inability to accurately predict seasonal demand for our products; the concentration of our sales to pre-IPO owners and other large customers; the impact of changing market conditions on our forward pricing program; the significant risks and hazards involved in fertilizer manufacturing; unanticipated consequences related to future expansion of our business; our inability to expand our business, including consequences due to the significant resources that could be required; potential liabilities and expenditures related to environmental and health and safety laws and regulations; our inability to obtain or maintain required permits and governmental approvals; acts of terrorism; difficulties in securing the raw materials we use; changes in global fertilizer supply and demand and the other risks and uncertainties included from time to time in our filings with the Securities and Exchange Commission. We undertake no obligation to update or revise any forward-looking statements.

3
CF Industries will report Q4 and ’05 results on February 23; Conference Call on February 24
‘We’re taking some extra time our first time around!’
We have not released our year-end results yet, so today’s presentation will take a longer-term, strategic look at CF Industries
Today’s Presentation

4
Leading manufacturer and distributor of nitrogen and phosphate fertilizer
Founded as a cooperative in 1946; new bottom line oriented business model in 2003
Market shares for fertilizer year 2004 were 22 percent nitrogen and 14 percent phosphate; Corn Belt 29 percent for nitrogen and 20 percent for phosphate
IPO in August 2005; 2005 high and low: $18.00 and $11.19
Reported strong sales and operating earnings through Q3 2005
Who We Are . . .

5
Fertilizer is a global worldwide commodity, and commodity prices don’t necessarily reflect cost of raw materials
Three major nutrients – N, P and K – essential for improved crop yield, growth and durability
No substitutes – and N, P and K not substitutable for each other
Key variable in nitrogen profitability is relationship between natural gas costs and fertilizer costs
U.S. net nitrogen and potash importer; net phosphate exporter
Growth has been consistent at approximately 2.7% annually
The Fertilizer Market

6
The assets, the financial strength, and the flexibility to adapt to changing market conditions and create long-term shareholder value
We donWe don’’t underestimate the neart underestimate the near--term challengesterm challenges…… but we but we believe CF Industries is well positioned believe CF Industries is well positioned –– strategically strategically –– to to adapt to and ultimately capitalize on changes in the globaadapt to and ultimately capitalize on changes in the global l fertilizer marketplace!fertilizer marketplace!
CF Industries’ Strategic Focus in a Volatile Industry...

7
Assets and Flexibility in Nitrogen Fertilizer
Two of three largest North American nitrogen fertilizer complexes– Donaldsonville, Louisiana– Medicine Hat, Alberta
Nitrogen

8
North America’s largest: four ammonia plants, four urea plants and two UAN plants
Operational, product and transport flexibility
TODAY: Flexibility, modularity and “make versus buy”capability to cope with high natural gas prices
FUTURE: Modern, productive facility with economies of scale for era of ‘normalized’ natural gas prices and/or alternative feedstock
CF Industries’ Donaldsonville Complex

9
Joint venture is third largest nitrogen complex in North America: two ammonia plants and one urea plant
Access to lower-cost AECO natural gas, as well as to markets in northern-tier U.S. and western Canada
Average natural gas cost advantage $27 per ton of ammonia
TODAY: Competitive presence in a strong, growing marketFUTURE: Cost structure and location should remain
competitive advantages
CF Industries’ Medicine Hat Complex
10
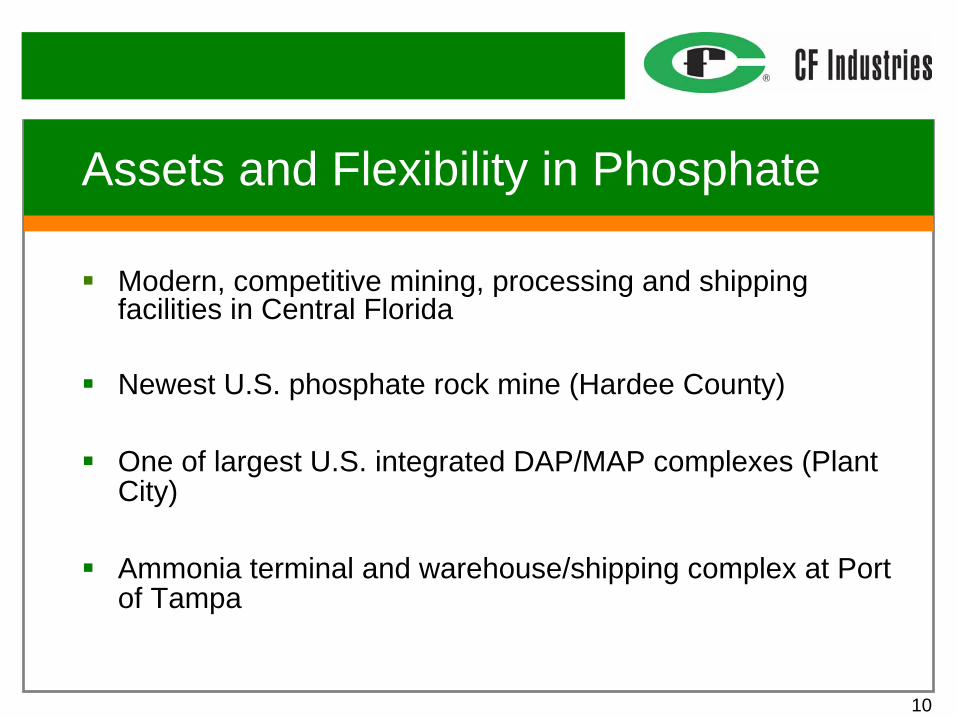
Modern, competitive mining, processing and shipping facilities in Central Florida
Newest U.S. phosphate rock mine (Hardee County)
One of largest U.S. integrated DAP/MAP complexes (Plant City)
Ammonia terminal and warehouse/shipping complex at Port of Tampa
Assets and Flexibility in Phosphate

11
CF Industries’ Central Florida Phosphate Operations
Strong (26 years) rock reserve position
Produce DAP and MAP: fastest growing phosphate fertilizer products
Access to domestic and export markets
TODAY: Diversification from nitrogen market and access to export markets
FUTURE: Benefit from value of finite amount of Florida rock reserves; continued access to world markets

12
Assets and Flexibility in Distribution
49 nitrogen and phosphate distribution facilities, strategicallylocated primarily in midwestern grain-producing states
Most can access multiple modes of incoming transportation, including pipeline, barge, rail and truck
Access – thanks to Donaldsonville “make versus buy”capability – to domestic and imported product

13
Assets and Flexibility in Distribution
With 20 ammonia terminals, one of only three producers that can effectively provide ammonia (approximately one fourth of nitrogen fertilizer market) to Corn Belt
Locations are key advantage in regional markets
Good mix of new and old customers
TODAY:TODAY: Strong complement to manufacturing operations with access to fertilizer-intensive markets
FUTURE:FUTURE: A strategic asset providing unique market access

14
Assets and Flexibility to Compete
World-scale assets in nitrogen fertilizer, phosphate fertilizer and product distribution
Significant flexibility / capability to anticipate changing market conditions
Strong financial position
We have strategic options in a changing marketWe have strategic options in a changing market

15
Additional Strengths
Innovative program to manage margin riskItIt’’s much more than simply a forward pricing programs much more than simply a forward pricing program
Strong customer relationshipsMultiMulti--year contracts with previous owners, plus new year contracts with previous owners, plus new relationships with major agricultural suppliersrelationships with major agricultural suppliers
Leading market positionUnlike many Unlike many IPOsIPOs, we, we’’re established in the market!re established in the market!

16
The Natural Gas Issue
North America’s position as high-cost nitrogen fertilizer producer worsened post-Katrina
Large percentage of capacity (including much of CF Industries’ Donaldsonville complex) idled in Q4
Phosphate less sensitive to natural gas (approximately7 mmBTU versus 33 mmBTU for ammonia)
Significant downturn in North American natural gas prices since December 2005…

17
The Natural Gas Issue
Clearly a challenge today, although lower natural gas and current fertilizer prices permit resumed North American nitrogenproductionLong-term factors offer promise, including alternative feed stocks and increased exploration in U.S. LNG also an option, as increased availability could, as with oil, create world commodity market for natural gasLack of distribution capabilities – especially for ammonia and, to lesser extent, UAN – remains a challenge for offshore producers
In this environment, we view CF IndustriesIn this environment, we view CF Industries’’ assets and assets and flexibility as key strategic strengths, providing us the flexibility as key strategic strengths, providing us the opportunity to capitalize on a wide range of outcomes in opportunity to capitalize on a wide range of outcomes in world fertilizer marketsworld fertilizer markets

18
To capitalize on our assets and flexibilities …
Reduce dependence on North American natural gas– Proposed Trinidad joint venture– Alternative feedstock at Donaldsonville
Expand usage and duration of margin risk management programIdentify next generation of cost-reduction opportunitiesContinue to develop new, post-cooperative market opportunitiesRefine longer-term vision
CF Industries’ Strategic Priorities

19
CF Industries ‘Investable Idea’
A business model transformation that has effectively positioned CF Industries as a profit-driven company focused on building shareholder value
The assets, the financial strength, and the flexibility to adapt to changing market conditions and create long-term shareholder value
We donWe don’’t underestimate the neart underestimate the near--term challenges . . . but term challenges . . . but we believe CF Industries is well positioned we believe CF Industries is well positioned –– strategically strategically ––to adapt to and ultimately capitalize on changes in the to adapt to and ultimately capitalize on changes in the global fertilizer marketplace!global fertilizer marketplace!

20

21
Addendum

22
Third Quarter Performance
Net sales increased by 10 percent to $359.4 millionOperating earnings of $35.1 million more than offset by non-recurring IPO-related charges and other itemsNet loss of $91.4 millionAdjusted net earnings, totaled $13.8 million, or $0.25 per common share, on a pro forma basis, compared to $14.3 million, or $0.26 per share, on a pro forma basis, for 2004’s third quarter.At September 30, 2005: gross cash and short-term investments of $317.5 million, debt of $4.2 million, and current liability for customer advances of $183.4 million.
23
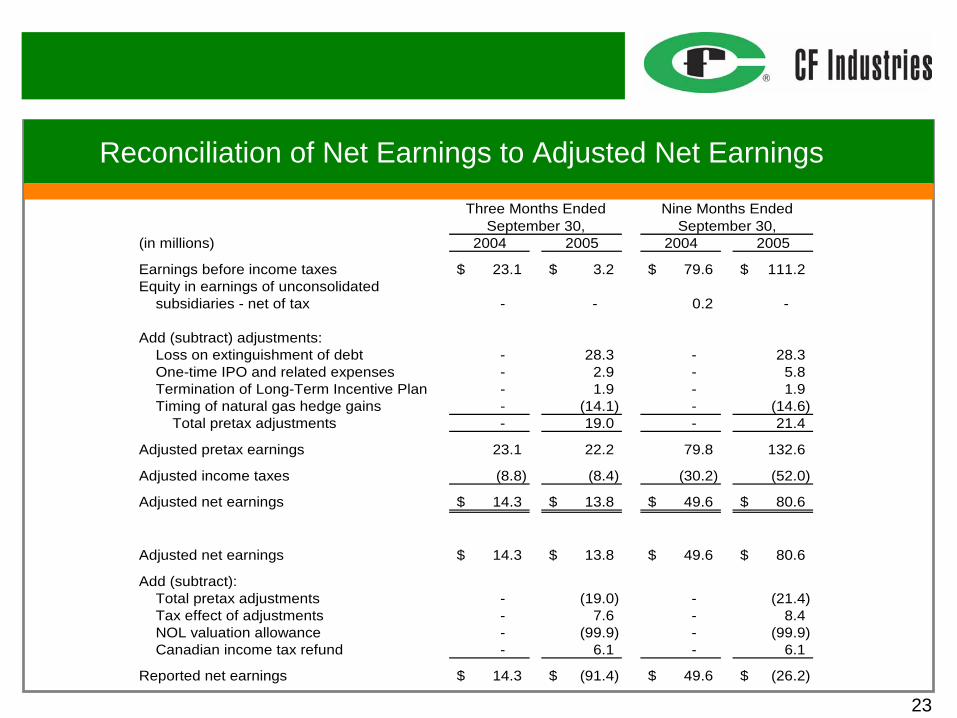
Reconciliation of Net Earnings to Adjusted Net Earnings
Three Months Ended September 30,
Nine Months Ended September 30,
(in millions) 2004 2005 2004 2005
Earnings before income taxes 23.1$ 3.2$ 79.6$ 111.2$ Equity in earnings of unconsolidated
subsidiaries - net of tax - - 0.2 -
Add (subtract) adjustments:Loss on extinguishment of debt - 28.3 - 28.3 One-time IPO and related expenses - 2.9 - 5.8 Termination of Long-Term Incentive Plan - 1.9 - 1.9 Timing of natural gas hedge gains - (14.1) - (14.6)
Total pretax adjustments - 19.0 - 21.4
Adjusted pretax earnings 23.1 22.2 79.8 132.6
Adjusted income taxes (8.8) (8.4) (30.2) (52.0)
Adjusted net earnings 14.3$ 13.8$ 49.6$ 80.6$
Adjusted net earnings 14.3$ 13.8$ 49.6$ 80.6$
Add (subtract):Total pretax adjustments - (19.0) - (21.4) Tax effect of adjustments - 7.6 - 8.4 NOL valuation allowance - (99.9) - (99.9) Canadian income tax refund - 6.1 - 6.1
Reported net earnings 14.3$ (91.4)$ 49.6$ (26.2)$

24
Reconciliation of Net Earnings to EBITDA and Adjusted EBITDA
Three Months Ended September 30,
Nine Months Ended September 30,
(in millions) 2004 2005 2004 2005
Net earnings (loss) 14.3$ (91.4)$ 49.6$ (26.2)$ Interest - net 4.0 (0.9) 13.8 1.9 Income tax provision 8.8 94.6 30.2 137.4 Depreciation, depletion and amortization 27.5 23.2 81.1 76.4 Less: Loan fee amortization (a) (0.3) (0.1) (0.8) (0.7)
EBITDA 54.3$ 25.4$ 173.9$ 188.8$
Add (subtract) adjustments:Loss on extinguishment of debt - 28.3 - 28.3 IPO and related expenses - 2.9 - 5.8 Termination of Long-Term Incentive Plan - 1.9 - 1.9 Timing of natural gas hedge gains - (14.1) - (14.6)
Total adjustments - 19.0 - 21.4
Adjusted EBITDA 54.3$ 44.4$ 173.9$ 210.2$
(a) To adjust for amount included in both interest and amortization.

25
Industry Overview
Three key nutrients:
– Nitrogen (N)
– Phosphate (P)
– Potash (K)
Global Fertilizer ConsumptionTotal Tons 2004: 162MM
Potash (K)
Phosphate (P)
Nitrogen (N)
17%
24%
59%

26
050
100150200250300
Corn Wheat Soybeans
…While World Meat Consumption Is Increasing…
MM Tonnes
Developed Developing
…Requiring More Corn to Feed More Livestock…
Pounds per Acre
World Population is Growing…
04080
120160
1970/1971 1980/1981 1990/1991 2000/2001 2009/2010E
MM Tons
CAGR 2.7%
Global Fertilizer Consumption (1)
NPK
NPK
Billions
Notes: (1) Excludes former Soviet Union countries
02468
10
2000 2015E 2030E0
100
200
300
400
2000 2015E 2030E
Long-Term Demand Drivers
1970/1971 1980/1981 1990/1991 2000/2001 2009/20010E

27
Competitive Strengths
World-Scale Manufacturing FacilitiesStrategically Located, Flexible Distribution SystemLong-Standing Customer RelationshipsLeading Market PositionsInnovative Risk ManagementStrong Financial PositionExperienced Management Team

28
Significant Scale Advantage
North American Nitrogen Fertilizer Facilities – By CapacityMM Tons
Donaldsonville
Medicine Hat
0.0
0.5
1.0
1.5
2.0
2.5

29
#1 nitrogen fertilizer complex in North America
Significant production flexibility
Access to low-cost transportation by barge, pipeline and rail
Deep-water dock
Annual GrossCapacity
AmmoniaUreaUAN
MMTons
2.31.72.7
2.31.72.7
World-Scale Manufacturing –Donaldsonville, LA
30
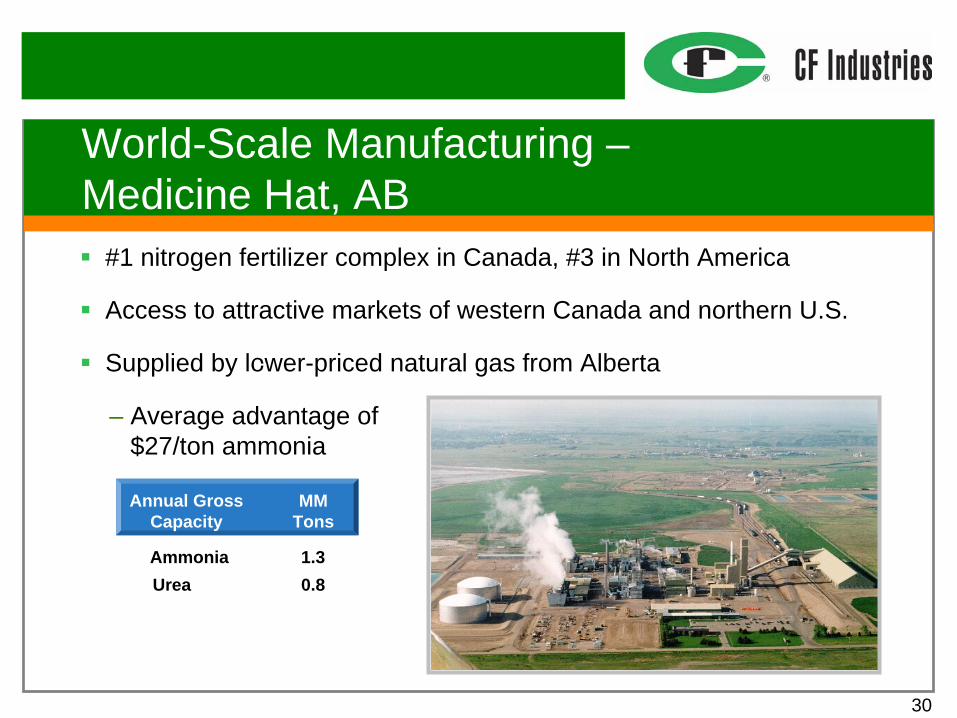
#1 nitrogen fertilizer complex in Canada, #3 in North America
Access to attractive markets of western Canada and northern U.S.
Supplied by lower-priced natural gas from Alberta-
– Average advantage of$27/ton ammonia
Annual GrossCapacity
AmmoniaUrea
MMTons
2.31.72.7
1.30.8
World-Scale Manufacturing –Medicine Hat, AB

31
Hardee Rock Mine – newest U.S. phosphate rock mine– 27 years of reserves Plant City Complex – one of the largest, integrated DAP/MAPcomplexes in U.S.
Port of Tampa – access to domestic and international markets
-
Annual GrossCapacity
Phosphate RockSulfuric Acid
MMTons
2.31.72.7
3.52.6
World-Scale Manufacturing –Central Florida
Phosphoric AcidPhosphoric Acid
1.02.0

32
Strategically Located, Flexible Distribution Network
Medicine Hat
Nitrogen Complex
Phosphate PlantPhosphate Rock Mine
Ammonia Terminal and UAN Terminal
Urea Warehouse
Ammonia Terminal
UAN Terminal
WI
IN
MN
IA
MO
NEOH
ND
IL
SD
Donaldsonville
Plant CityHardee
Low High
KS
MI

33
Forward Pricing Program
>50% of nitrogen fertilizer sold under FPP in 2004
ChallengeNatural gas and nitrogen fertilizer prices are highly volatile
SolutionCustomers purchase product forward
CF locks in margin by fixing natural gas costs
Substantial customer deposit
+ Margin certainty
+ Improved production scheduling
+ Reduced inventory risk
+ Enhanced liquidity
+ Integration with customers
Benefits

34
Leading Market Positions in North America
Market Share (2004)
(%)Nitrogen Phosphate
(%)
Key Driver: Strategically located network of terminals and warehouses
29%
22%
0
5
10
15
20
25
30
35
Total U.S. Ten Core States
20%
14%
0
5
10
15
20
25
Total U.S. Ten Core States

35
Experienced Management Team
Age PositionName
56 President, CEO and ChairmanSteve Wilson 15
51 SVP and CFOErnie Thomas 1
53 VP, Corporate PlanningSteve Chase 30
53 VP, Raw Materials ProcurementPhil Koch 2
54 VP, Supply and LogisticsFred Mugica 29
52 VP, SalesMonty Summa 8
54 VP, GM DonaldsonvilleLou Frey 30
Years In Industry
58 VP, GM Medicine HatRuss Holowachuk 36
54 VP, GM Phosphate OperationsHerschel Morris 30
51 SVP, OperationsDavid Pruett -