Embed Size (px)
Citation preview

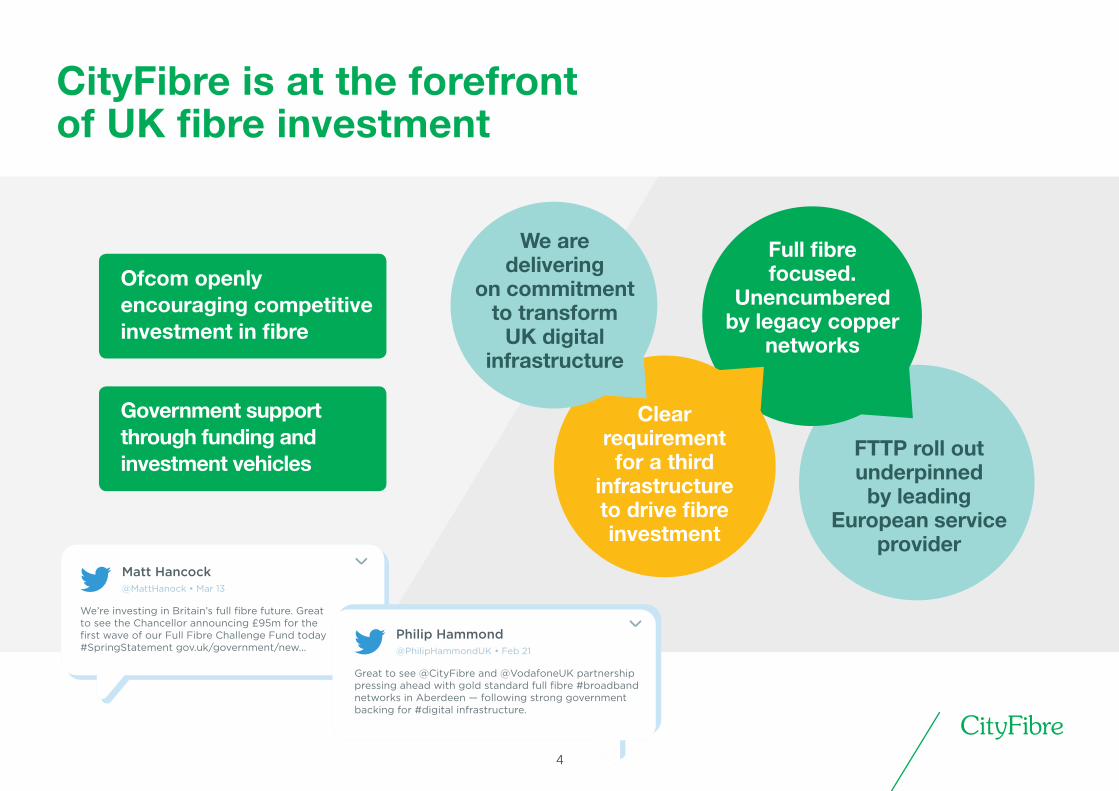
Matt Hancock@MattHanock • Mar 13
We’re investing in Britain’s full fibre future. Great to see the Chancellor announcing £95m for the first wave of our Full Fibre Challenge Fund today #SpringStatement gov.uk/government/new...
Philip Hammond@PhilipHammondUK • Feb 21
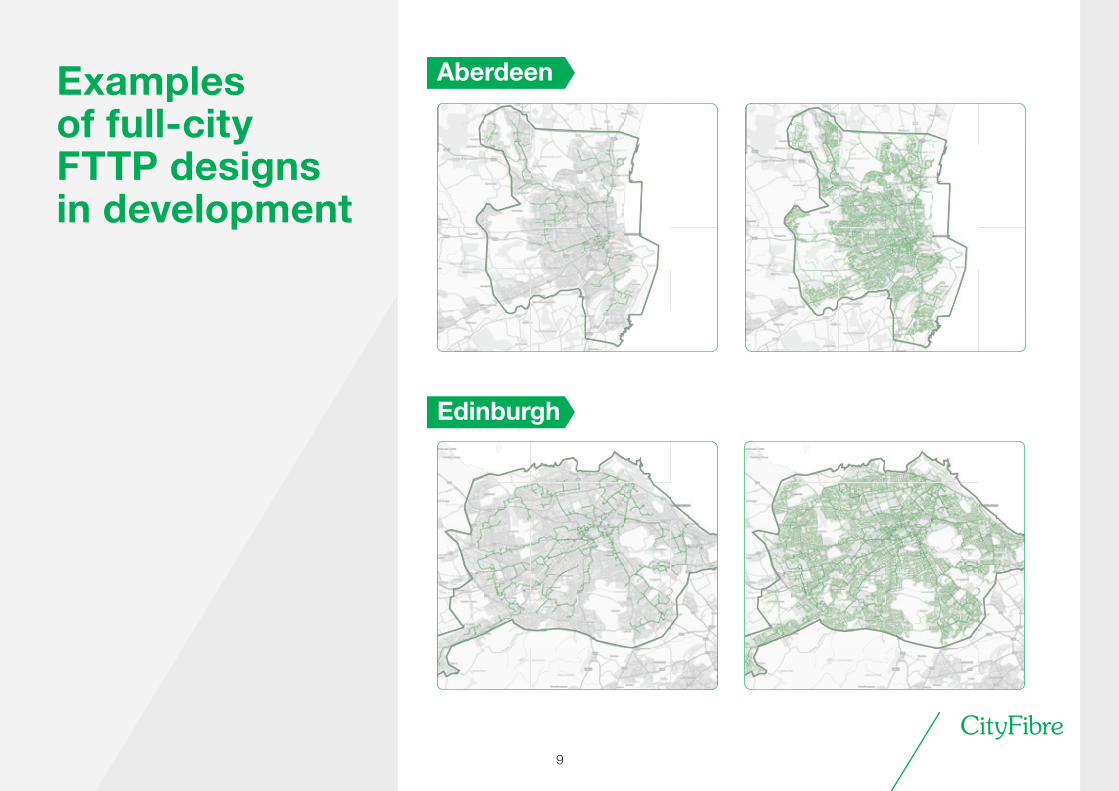
Great to see @CityFibre and @VodafoneUK partnership pressing ahead with gold standard full fibre #broadband networks in Aberdeen — following strong government backing for #digital infrastructure.
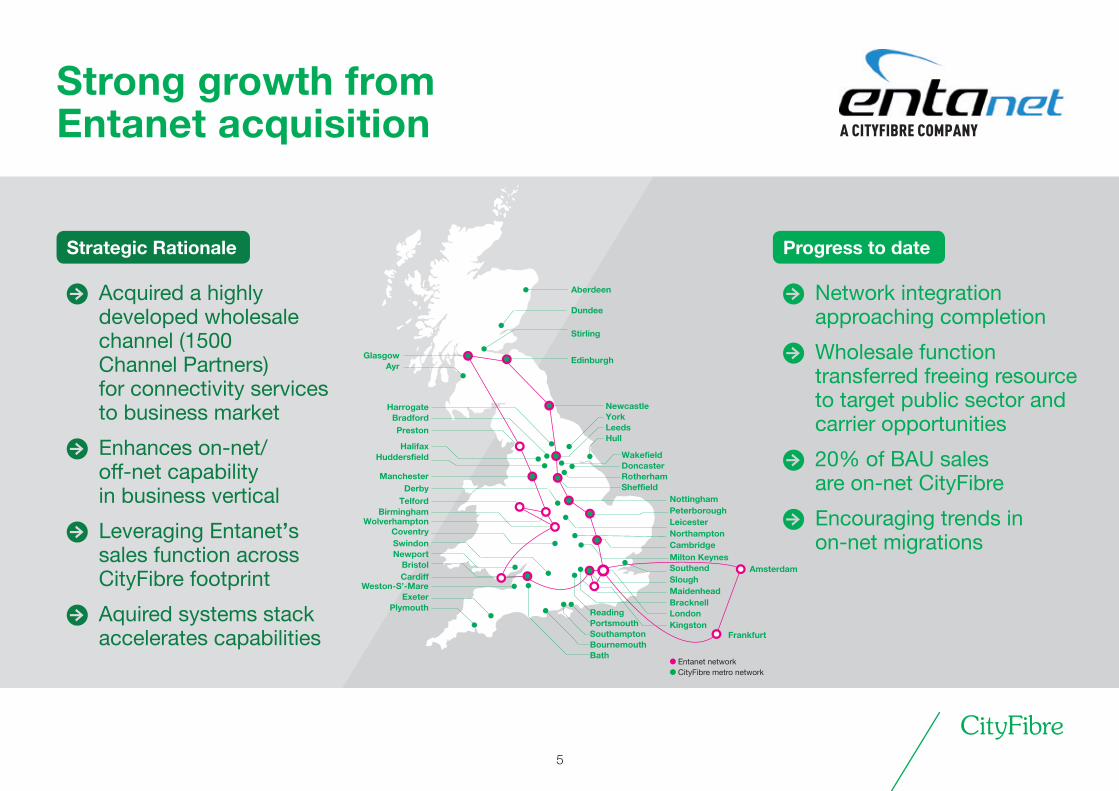
Amsterdam
Frankfurt
LondonKingston
Cardiff
CoventryWolverhampton
Birmingham
HalifaxHuddersfield
Manchester
Preston
HarrogateBradford
ReadingPortsmouthSouthamptonBournemouthBath
WakefieldDoncasterRotherhamSheffield
Dundee
GlasgowAyr
NottinghamPeterboroughLeicesterNorthamptonCambridge
SouthendSloughMaidenheadBracknell
Derby
SwindonNewport
Bristol
Weston-S’-MareExeter
Plymouth
NewcastleYorkLeedsHull
Edinburgh
Aberdeen
Stirling
Milton Keynes
Telford
Coventry
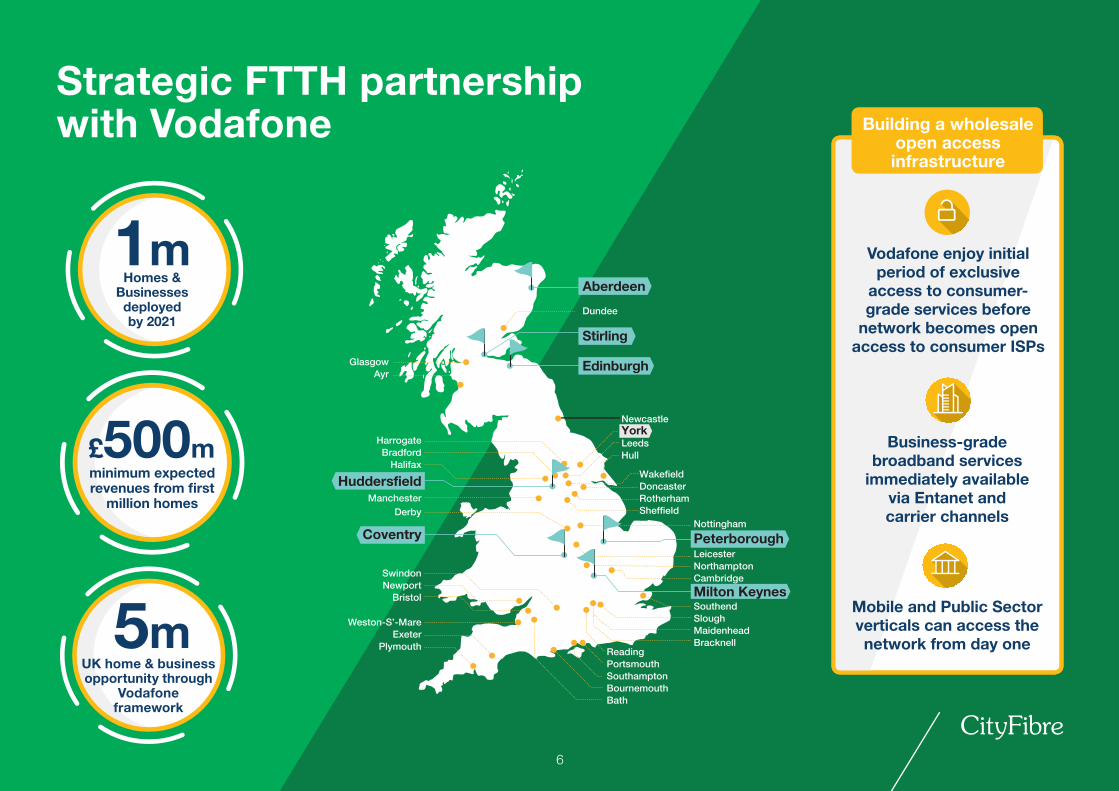
ReadingPortsmouthSouthamptonBournemouthBath
WakefieldDoncasterRotherhamSheffield
Dundee
GlasgowAyr
NottinghamPeterboroughLeicesterNorthamptonCambridge
SouthendSloughMaidenheadBracknell
Derby
HarrogateBradford
Halifax
Huddersfield
SwindonNewport
Bristol
Weston-S’-MareExeter
Plymouth
NewcastleYorkLeedsHull
Edinburgh
Aberdeen
Stirling
Milton Keynes
Manchester
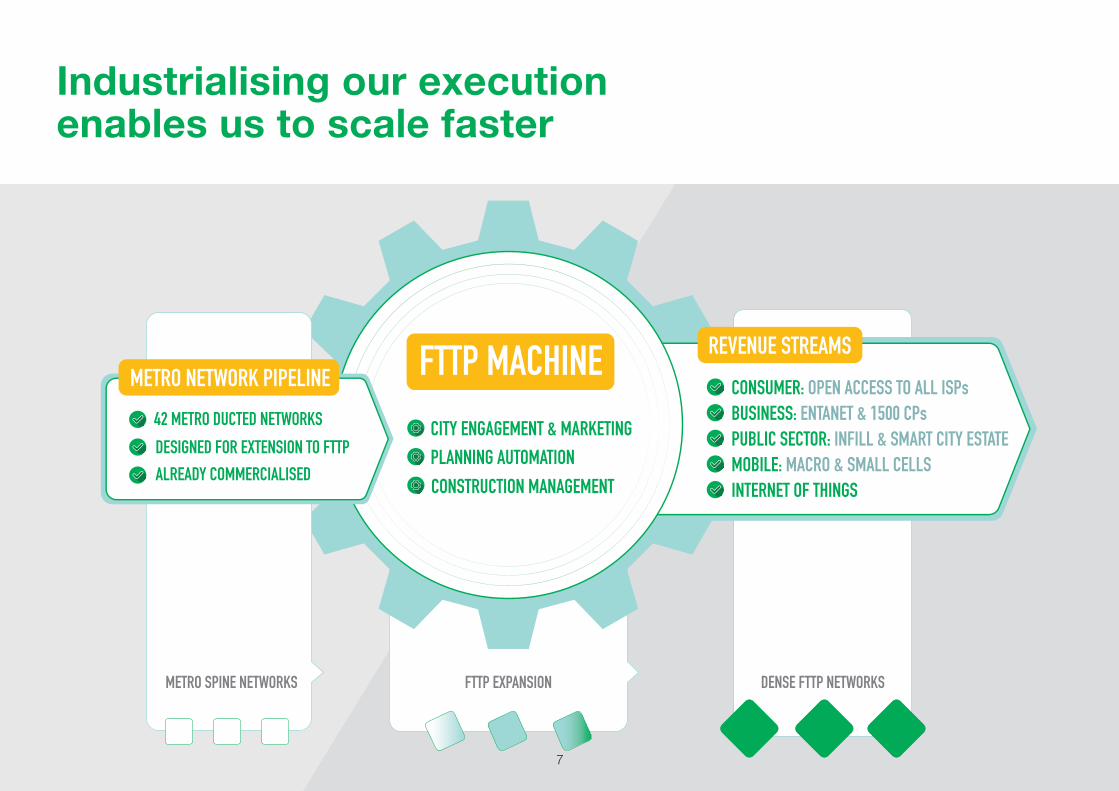
CONSUMER: OPEN ACCESS TO ALL ISPsBUSINESS: ENTANET & 1500 CPsPUBLIC SECTOR: INFILL & SMART CITY ESTATEMOBILE: MACRO & SMALL CELLSINTERNET OF THINGS
REVENUE STREAMS
DENSE FTTP NETWORKSMETRO SPINE NETWORKS
FTTP MACHINEMETRO NETWORK PIPELINE
42 METRO DUCTED NETWORKS
DESIGNED FOR EXTENSION TO FTTPALREADY COMMERCIALISED
CITY ENGAGEMENT & MARKETINGPLANNING AUTOMATIONCONSTRUCTION MANAGEMENT
FTTP EXPANSION

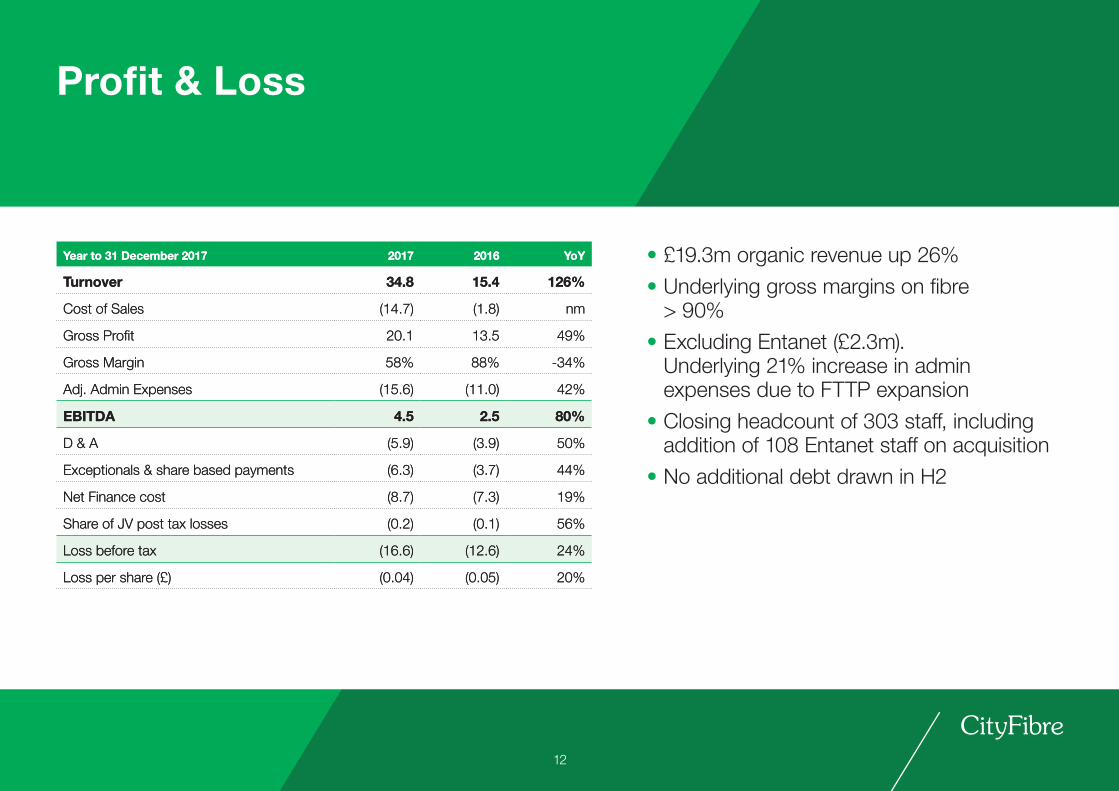
Year to 31 December 2017 2017 2016 YoY
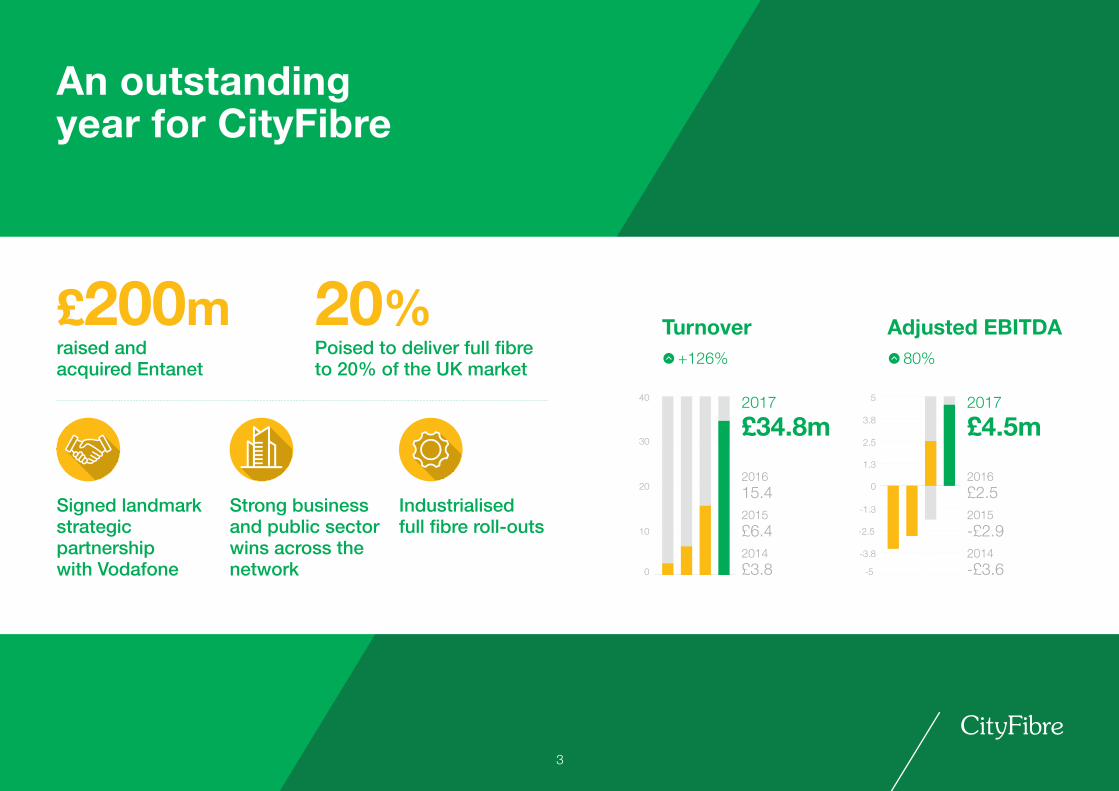
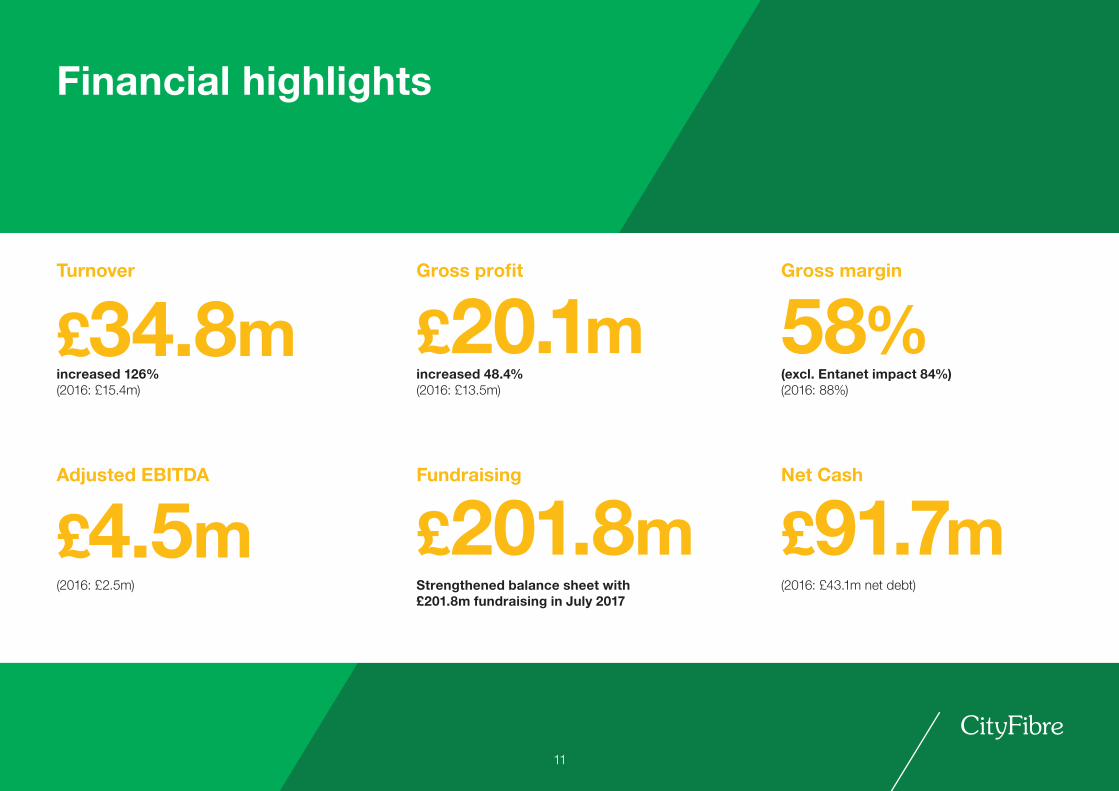
Turnover 34.8 15.4 126%
Cost of Sales (14.7) (1.8) nm
Gross Profit 20.1 13.5 49%
Gross Margin 58% 88% -34%
Adj. Admin Expenses (15.6) (11.0) 42%
EBITDA 4.5 2.5 80%
D & A (5.9) (3.9) 50%
Exceptionals & share based payments (6.3) (3.7) 44%
Net Finance cost (8.7) (7.3) 19%
Share of JV post tax losses (0.2) (0.1) 56%
Loss before tax (16.6) (12.6) 24%
Loss per share (£) (0.04) (0.05) 20%
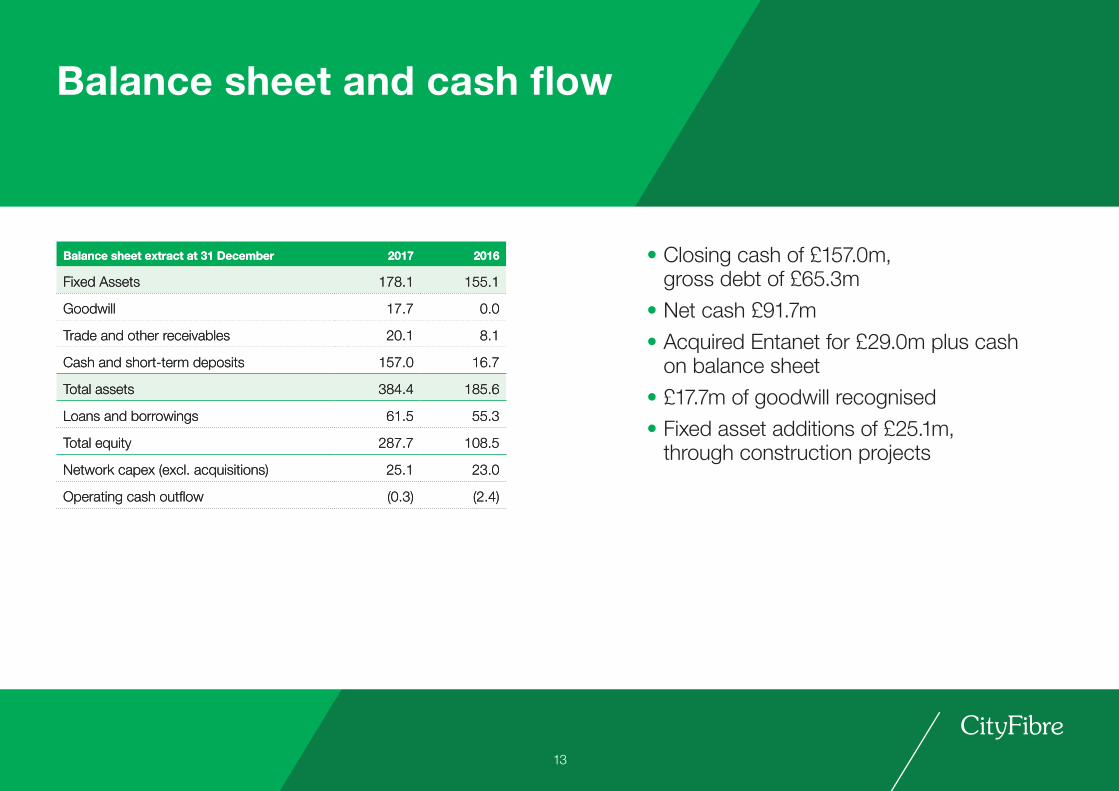
Balance sheet extract at 31 December 2017 2016
Fixed Assets 178.1 155.1
Goodwill 17.7 0.0
Trade and other receivables 20.1 8.1
Cash and short-term deposits 157.0 16.7
Total assets 384.4 185.6
Loans and borrowings 61.5 55.3
Total equity 287.7 108.5
Network capex (excl. acquisitions) 25.1 23.0
Operating cash outflow (0.3) (2.4)