Embed Size (px)
Citation preview

CFA Institute Member Survey:
XBRL
November 2009
Report prepared by: CFA Institute Market Research

2
Contents Executive Summary ....................................................................................................................................... 3
XBRL Related Questions ............................................................................................................................ 3
General Financial Analysis Questions ........................................................................................................ 4
About the Survey ....................................................................................................................................... 4
Purpose ......................................................................................................................................................... 5
Results ........................................................................................................................................................... 5
XBRL Related Questions ............................................................................................................................ 5
Awareness of XBRL ................................................................................................................................ 5
Current use/extraction of XBRL tagged data from source documents (of those aware of XBRL) ........ 7
Effect of using XBRL tagged interactive data (of those aware of XBRL) ................................................ 8
Protocol for creating XBRL data tags (of those aware of XBRL) ............................................................ 9
Necessary level of assurance (of those aware of XBRL) ...................................................................... 10
Importance of global convergence of XBRL taxonomies (of those aware of XBRL) ............................ 11
General Financial Analysis Questions ...................................................................................................... 12
How members obtain companies’ financial data/information for use in evaluation & analysis ........ 12
Importance of source documents to analysis and evaluation ............................................................ 13
Importance of data attributes in performing analysis and evaluation ............................................... 14
Methodology ............................................................................................................................................... 15
Questionnaire Development .................................................................................................................... 15
Sampling .................................................................................................................................................. 15
Distribution .............................................................................................................................................. 15
Analysis and Reporting ............................................................................................................................ 15
Response Rate and Demographics .......................................................................................................... 16

3
Executive Summary
XBRL Related Questions 55 percent of respondents are not aware of XBRL, down slightly from 59 percent in 2007; 35 percent are aware of XBRL but not up-to-date on its usage in financial reporting, and 11 percent are aware of it and of plans for its usage in financial reporting. Awareness is significantly lower among members in Asia Pacific and EMEA than it is among those in the Americas. In EMEA, 33 percent are aware of XBRL and in Asia Pacific, 37 percent are aware. Conversely, in the Americas, 52 percent are aware of XBRL. In aggregate, and within regions, awareness is significantly lower among new CFA charterholders (those who have had their charter less than two years) and non-charterholder members (37 percent and 39 percent are aware, respectively) than among more tenured charterholders (49 percent of those with the CFA for 2-10 years are aware and 66 percent of those with the CFA for more than 10 years are aware). With regard to occupations, academics have the highest awareness (72 percent), followed by research analysts (48 percent), portfolio managers (46 percent), financial advisors (45 percent), investment banking analysts (33 percent), and credit analysts (26 percent). Of those aware of XBRL, most do not use information through an XBRL instance document reader/viewer, and even fewer extract or import XBRL tagged data directly into financial analysis models. Using information through an XBRL instance document reader/viewer is slightly higher than it was in 2007; extracting/importing data is consistent with 2007 findings. As in 2007, respondents indicate the use of XBRL tagged interactive data will have the largest effect or improvement on uploading company data into financial analysis models and making comparisons between companies and/or industries. Those obtaining most or all of their information from 3rd party data providers indicate a higher effect/improvement on the following than do those manually extracting most or all of their data from source documents: analyzing companies’ performances, accessing companies' data regarding the level of disaggregation or granularity, and accessing companies' data regarding the level of timeliness. 67 percent think that companies should have limited ability to create new tags in order to reflect unique business activities or transactions not defined by the current XBRL taxonomy, and 25 percent think companies should not be able to create new tags. These results are consistent with the 2007 survey. Members in the Asia Pacific are more split in opinion to this question than members in the Americas and EMEA. In the Americas, an overwhelming 71 percent think companies should have limited ability to create new tags in order to reflect unique business activities or transactions not defined by the current XBRL taxonomy. 63 percent in EMEA support this protocol but only 41 percent in Asia Pacific support, significantly lower than the proportions in the Americas and EMEA. In Asia Pacific, 37 percent think companies should not be able to create new tags (compared to 22 percent and 29 percent in the Americas and EMEA, respectively) but 22 percent think they should be able to create new tags (compared to only 7 percent in the Americas and 8 percent in EMEA). 41 percent of those aware of XBRL think an integrated audit by an independent auditor is necessary to ensure the proper XBRL tags are assigned to the reported amount in accordance with GAAP defined tags (down from 50 percent in 2007), and 27 percent think a separate audit by an independent auditor is necessary (up from 19 percent in 2007).
4
70 percent think global convergence of XBRL taxonomies in performing their analysis of companies’ financial statements and disclosures and comparing companies’ performance is important (top two box). A higher proportion of members in EMEA think this is important (81 percent) than in the Americas (66 percent important). 79 percent of those in Asia Pacific indicate global convergence of XBRL taxonomies is important in performing their analysis.
General Financial Analysis Questions The majority of respondents obtain companies’ financial data/information used in their evaluation and analysis either mostly from 3rd party data providers with some limited amount of data extracted manually from source documents (34 percent) or mostly extracted manually from source documents with limited data obtained from 3rd party data providers (34 percent). 21 percent indicate they manually extract all the data/information from source documents, up slightly from 17 percent in 2007. In the Americas, 46 percent obtain most or all of the data/information used in their evaluation & analysis of companies’ performance & evaluation from 3rd party data providers, compared to only 32 percent in Asia Pacific and 34 percent in Europe, Middle East, and Africa (EMEA). Annual reports, interim reports, and quarterly earnings releases are rated as the most important source documents in members’ analysis and evaluations of companies’ financial conditions and performances, as they also were in 2007. Across all source documents, the proportion of members indicating they are important (top two box) is higher than it was in 2007. The importance of each of the following source documents is significantly higher among respondents who indicate most or all of their data/information used in analysis & evaluation is manually extracted from source documents than among those who get most or all of their information from 3rd party data providers: interim reports, annual reports, special events reports, shareholder reports/proxy statements, periodic supplements/fact books, and prospectus/registration statements for initial public offerings. An overwhelming majority of members indicate reliability, consistency, granularity, timeliness, and comparability are all important data attributes or characteristics to have in performing analysis and evaluation of a company’s financial condition and performance. Reliability is most important, with 93 percent rating it important (top two box) and comparability rates are lowest in importance, although a majority 84 percent still rate this attribute as important. Findings are similar to 2007.
About the Survey The purpose of this poll was to obtain CFA Institute member feedback on issues relating to eXtensible Business Reporting Language (XBRL) tagged data—ensuring a broad view of the “end user” of financial reports and other disclosures, gaining input on key areas involving the development and implementation of XBRL tagged data for financial reporting to the capital markets, and knowing what is important to members in accessing and analyzing companies’ financial data. 23,854 CFA Institute members were invited to participate in the web-based survey via e-mail, which was delivered on 27 October 2009. The survey closed on 6 November. The survey questionnaire consisted of nine questions, all of which were asked in the exact same manner as on the June 2007 XBRL member survey. 1,462 valid responses were received, for an overall response rate of 6.1 percent. The margin of error is ±2.5 percent at the 95 percent confidence level. Margin of error varies by question as the number responding to each question varies. No opinion responses have been excluded from the findings presented below.

5
Purpose The objectives of the XBRL survey of CFA Institute members on issues relating to XBRL tagged data are: to ensure a broad view of the “end user” of financial reports and other disclosures, to gain input on some key areas involving the development and implementation of XBRL tagged data for financial reporting to the capital markets, and to know what is important to members in accessing and analyzing companies’ financial data. In addition, the results from the survey will be benchmarked against the XBRL survey conducted in June 2007.
Results
XBRL Related Questions
Awareness of XBRL Many countries’ security regulators and standard setters are moving towards the utilization of eXtensible Business Reporting Language (XBRL) as an alternative method for companies to prepare their financial reports. 55 percent of respondents are not aware of XBRL, down slightly from 59 percent in 2007. 35 percent are aware of XBRL but not up-to-date on its usage in financial reporting, and 11 percent are aware of it and of plans for its usage in financial reporting.
6
Awareness is significantly lower among members in Asia Pacific and EMEA than it is among those in the Americas. In EMEA, 33 percent are aware of XBRL, and in Asia Pacific, 37 percent are aware. Conversely, in the Americas, 52 percent are aware of XBRL. Both in aggregate and within regions, awareness is significantly lower among new CFA charterholders (those who have had their charter less than two years) and non-charterholder members (37 percent and 39 percent are aware, respectively) than among more tenured charterholders (49 percent of those with the CFA for 2-10 years are aware and 66 percent of those with the CFA for more than 10 years are aware). With regard to occupations, academics have the highest awareness (72 percent aware), followed by research analysts (48 percent aware), portfolio managers (46 percent aware), financial advisors (45 percent aware), investment banking analysts (33 percent aware), and credit analysts (26 percent aware).

7
Current use/extraction of XBRL tagged data from source documents (of those aware of XBRL) Of those aware of XBRL, most do not use information through an XBRL instance document reader/viewer, and even fewer extract or import XBRL tagged data directly into financial analysis models. Using information through an XBRL instance document reader/viewer is slightly higher than it was in 2007, and extracting/importing data is consistent with 2007 findings.

8
Effect of using XBRL tagged interactive data (of those aware of XBRL) As in 2007, respondents indicate the use of XBRL tagged interactive data will have the largest effect or improvement on uploading company data into financial analysis models and making comparisons between companies and/or industries.
Those obtaining most or all of their information from 3rd party data providers indicate a higher effect/improvement of the following than do those manually extracting most or all of their data from source documents: analyzing companies’ performance (65 percent vs. 52 percent high effect/improvement), accessing companies' data regarding the level of disaggregation or granularity (62 percent vs. 46 percent high effect/improvement), and accessing companies' data regarding the level of timeliness (61 percent vs. 48 percent high effect/improvement).

9
Protocol for creating XBRL data tags (of those aware of XBRL) 67 percent think that companies should have limited ability to create new tags in order to reflect unique business activities or transactions not defined by the current XBRL taxonomy (tags are predefined according to current financial reporting standards). 25 percent think companies should not be able to create new tags (only current XBRL taxonomy or list of tags should be used and tags are predefined according to current financial reporting standards). These results are consistent with the 2007 survey.
Members in Asia Pacific are more split on opinion to this question than members in the Americas and EMEA. In the Americas, an overwhelming 71 percent think companies should have limited ability to create new tags in order to reflect unique business activities or transactions not defined by the current XBRL taxonomy. 63 percent in EMEA support this protocol but only 41 percent in Asia Pacific support, significantly lower than the proportions in the Americas and EMEA. In Asia Pacific, 37 percent think companies should not be able to create new tags (compared to 22 percent and 29 percent in the Americas and EMEA, respectively) and 22 percent think they should be able to create new tags (compared to only 7 percent in the Americas and 8 percent in EMEA).

10
Necessary level of assurance (of those aware of XBRL) 41 percent of those aware of XBRL think an integrated audit by an independent auditor is necessary to ensure the proper XBRL tags are assigned to the reported amount in accordance with GAAP defined tags (down from 50 percent in 2007), and 27 percent think a separate audit by an independent auditor is necessary (up from 19 percent in 2007).

11
Importance of global convergence of XBRL taxonomies (of those aware of XBRL) 70 percent think global convergence of XBRL taxonomies in performing their analysis of companies’ financial statements and disclosures and comparing companies’ performance is important (top two box). A higher proportion of members in EMEA think this is important (81 percent) than of members in the Americas (66 percent important). 79 percent of those in Asia Pacific indicate global convergence of XBRL taxonomies is important in performing their analysis.
12
General Financial Analysis Questions
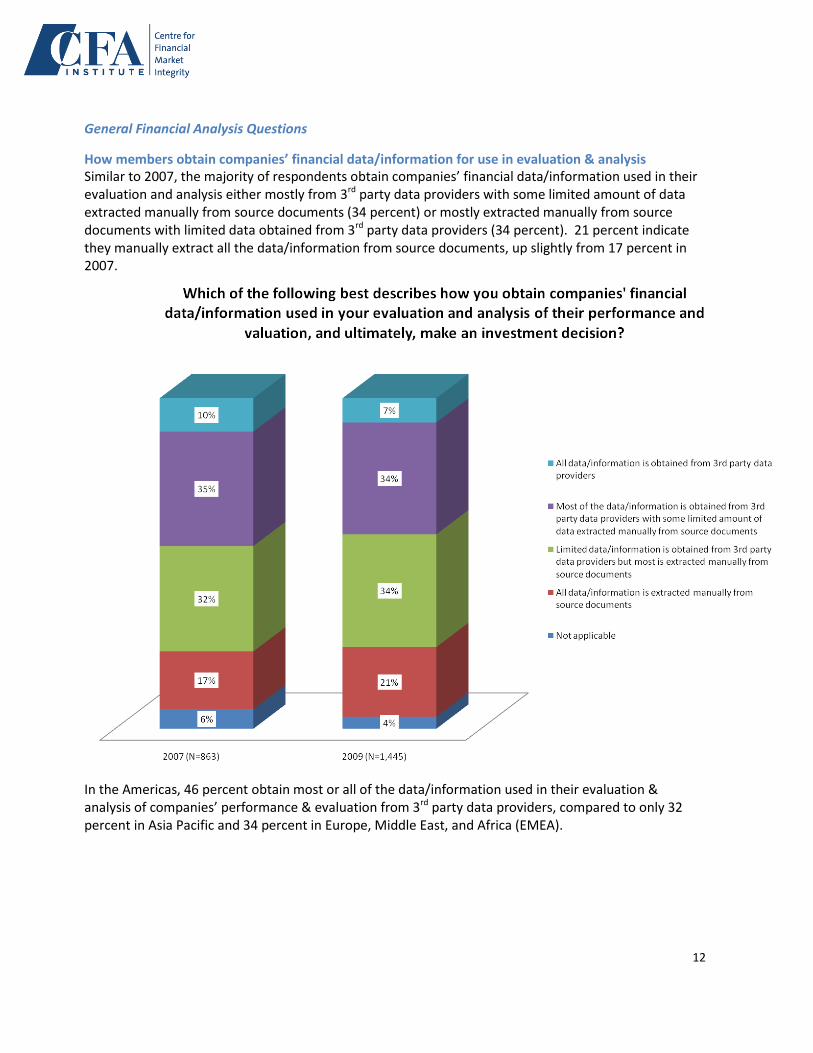
How members obtain companies’ financial data/information for use in evaluation & analysis Similar to 2007, the majority of respondents obtain companies’ financial data/information used in their evaluation and analysis either mostly from 3rd party data providers with some limited amount of data extracted manually from source documents (34 percent) or mostly extracted manually from source documents with limited data obtained from 3rd party data providers (34 percent). 21 percent indicate they manually extract all the data/information from source documents, up slightly from 17 percent in 2007.
In the Americas, 46 percent obtain most or all of the data/information used in their evaluation & analysis of companies’ performance & evaluation from 3rd party data providers, compared to only 32 percent in Asia Pacific and 34 percent in Europe, Middle East, and Africa (EMEA).
13
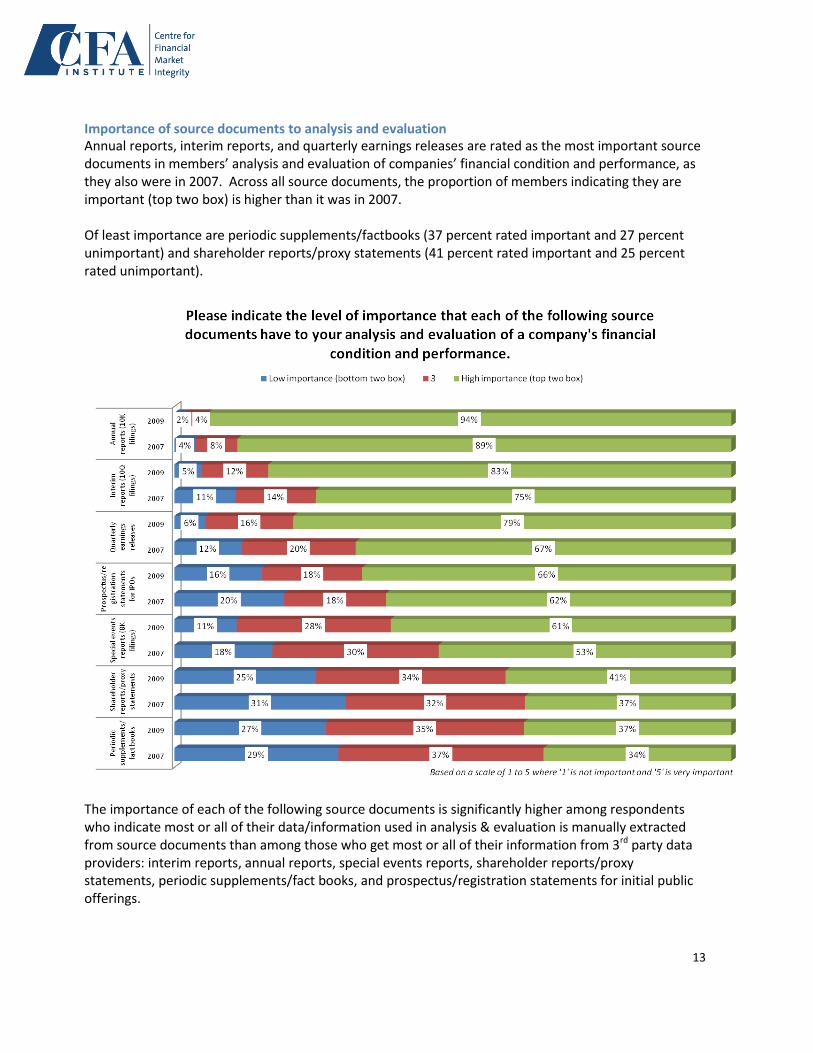
Importance of source documents to analysis and evaluation Annual reports, interim reports, and quarterly earnings releases are rated as the most important source documents in members’ analysis and evaluation of companies’ financial condition and performance, as they also were in 2007. Across all source documents, the proportion of members indicating they are important (top two box) is higher than it was in 2007. Of least importance are periodic supplements/factbooks (37 percent rated important and 27 percent unimportant) and shareholder reports/proxy statements (41 percent rated important and 25 percent rated unimportant).
The importance of each of the following source documents is significantly higher among respondents who indicate most or all of their data/information used in analysis & evaluation is manually extracted from source documents than among those who get most or all of their information from 3rd party data providers: interim reports, annual reports, special events reports, shareholder reports/proxy statements, periodic supplements/fact books, and prospectus/registration statements for initial public offerings.

14
Importance of data attributes in performing analysis and evaluation An overwhelming majority of members indicate reliability, consistency, granularity, timeliness, and comparability are all important data attributes or characteristics to have in performing analysis and evaluation of a company’s financial condition and performance. Reliability is most important, with 93 percent rating it important (top two box);comparability rates lowest in importance, although a majority 84 percent still rate this attribute as important.
Timeliness is rated to be more important by those in the Americas and Asia Pacific (87 percent and 88 percent, respectively) than by those in EMEA (79 percent rated as important). Granularity is more important to those extracting most or all of their data manually from source documents (88 percent important) than to those obtaining most or all of their data from 3rd party data providers (83 percent important).
15
Methodology
Questionnaire Development The questionnaire was developed from the June 2007 XBRL survey. All questions were kept exactly the same from the earlier survey, although some questions included on the 2007 survey were not asked on the 2009 survey.
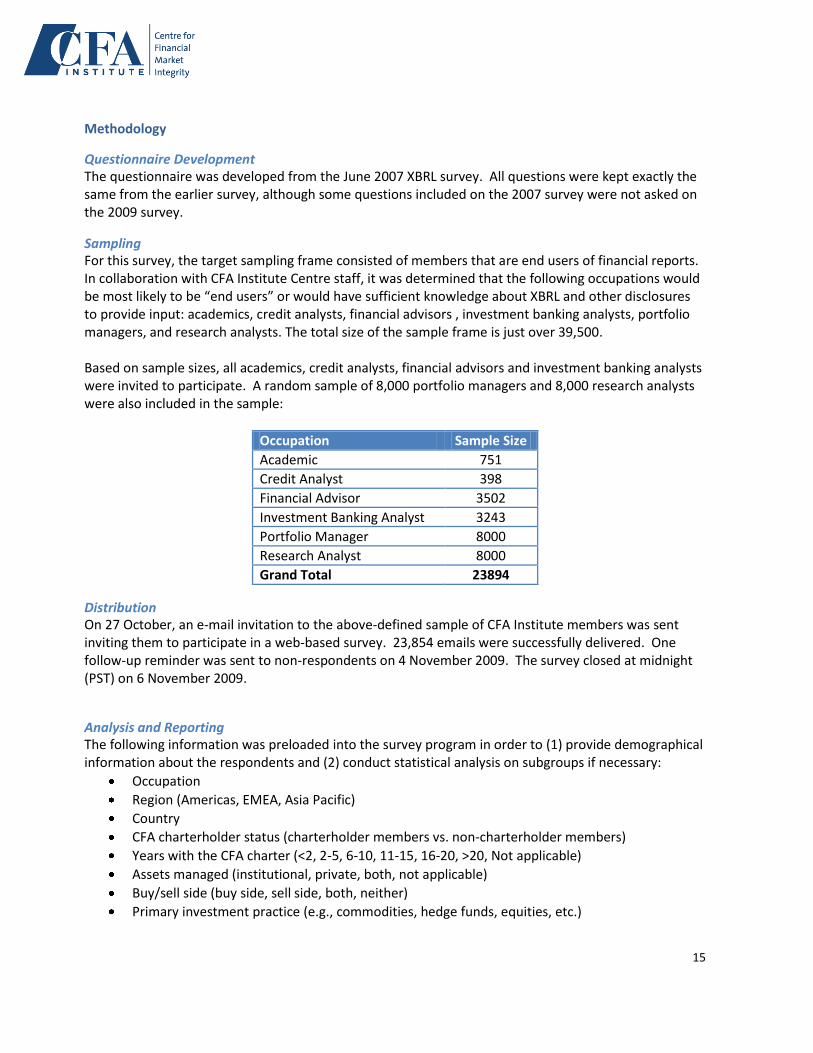
Sampling For this survey, the target sampling frame consisted of members that are end users of financial reports. In collaboration with CFA Institute Centre staff, it was determined that the following occupations would be most likely to be “end users” or would have sufficient knowledge about XBRL and other disclosures to provide input: academics, credit analysts, financial advisors , investment banking analysts, portfolio managers, and research analysts. The total size of the sample frame is just over 39,500. Based on sample sizes, all academics, credit analysts, financial advisors and investment banking analysts were invited to participate. A random sample of 8,000 portfolio managers and 8,000 research analysts were also included in the sample:
Occupation Sample Size
Academic 751
Credit Analyst 398
Financial Advisor 3502
Investment Banking Analyst 3243
Portfolio Manager 8000
Research Analyst 8000
Grand Total 23894
Distribution On 27 October, an e-mail invitation to the above-defined sample of CFA Institute members was sent inviting them to participate in a web-based survey. 23,854 emails were successfully delivered. One follow-up reminder was sent to non-respondents on 4 November 2009. The survey closed at midnight (PST) on 6 November 2009.
Analysis and Reporting The following information was preloaded into the survey program in order to (1) provide demographical information about the respondents and (2) conduct statistical analysis on subgroups if necessary:
Occupation
Region (Americas, EMEA, Asia Pacific)
Country
CFA charterholder status (charterholder members vs. non-charterholder members)
Years with the CFA charter (<2, 2-5, 6-10, 11-15, 16-20, >20, Not applicable)
Assets managed (institutional, private, both, not applicable)
Buy/sell side (buy side, sell side, both, neither)
Primary investment practice (e.g., commodities, hedge funds, equities, etc.)

16
Sample sizes for some demographical information are small; statistical analysis should only be run for those with sufficient response. For purposes of analysis, most of the ‘not applicable’ and ‘no opinion’ responses are excluded from the results (calculations).
Response Rate and Demographics 23,894 members were invited to participate in the survey, and 23,854 e-mail invitations were successfully delivered. 1,462 valid responses were received, for a response rate of 6.1%. The margin of
error (based on the sampling frame population) is 2.5 percent at the 95 percent confidence level. Margin of error will vary by question, as the number of respondents varies by question. For example, five questions were asked only of those that were aware of XBRL and most questions excluded the respondents that answered “no opinion.”
Occupation Invited Responded Response Rate
Academic 751 57 8%
Credit Analyst 398 39 10%
Financial Advisor 3502 188 5%
Investment Banking Analyst 3243 215 7%
Portfolio Manager 8000 367 5%
Research Analyst 8000 596 7%
Grand Total 23894 1462
Region Invited Responded Response Rate
Americas 16118 923 6%
Asia Pacific 3353 194 6%
EMEA 4400 345 8%
(blank) 23 0 0%
Grand Total 23894 1462
Country Invited Responded Response Rate
USA 13054 759 6%
Canada 2793 132 5%
United Kingdom 1676 89 5%
China 530 44 8%
Switzerland 456 35 8%
Germany 412 29 7%
India 151 22 15%
Singapore 538 22 4%

17
Australia 375 19 5%
Japan 250 19 8%
Hong Kong 891 18 2%
South Africa 309 14 5%
France 159 13 8%
Poland 57 12 21%
Brazil 112 11 10%
Ireland 74 11 15%
Italy 95 11 12%
Netherlands 141 11 8%
All other 1821 191 10%
Grand Total 23894 1462
CFA Charterholder Status Invited Responded Response Rate
CFA 21109 1209 6%
Non-CFA 2785 253 9%
Grand Total 23894 1462
Years with Charter Invited Responded Response Rate
<2 2985 348 12%
2-5 7040 333 5%
6-10 6710 309 5%
11-15 2184 97 4%
16-20 1205 58 5%
More than 20 Years 985 64 6%
Not applicable 2785 253 9%
Grand Total 23894 1462
Asset Base Invited Responded Response Rate
Institutional 7950 445 6%
Private 6059 367 6%
Both 2605 147 6%
N/A 7279 503 7%
(blank) 1 0 0%
Grand Total 23894 1462
Buy/Sell Side Invited Responded Response Rate
Buy Side 13727 832 6%

18
Sell Side 4451 264 6%
Buy Side / Sell Side 1658 122 7%
Neither 4057 244 6%
(blank) 1 0 0%
Grand Total 23894 1462
Primary Investment Practice Invited Responded Response Rate
Commodities 149 10 7%
Derivatives 429 32 7%
Equities 11659 777 7%
Fixed Income 4361 239 5%
Foreign Currency 135 7 5%
Hedge Funds 572 22 4%
Indexed 239 11 5%
Private Equity 1072 85 8%
Real Estate 472 33 7%
Structured Products 605 32 5%
Venture Capital 129 12 9%
Other 949 52 5%
Not Applicable 2870 137 5%
(blank) 253 13 5%
Grand Total 23894 1462