Embed Size (px)
Citation preview
CFA Institute Research Challenge
Hosted by:
CFA Society Sydney, Australia The University of Sydney
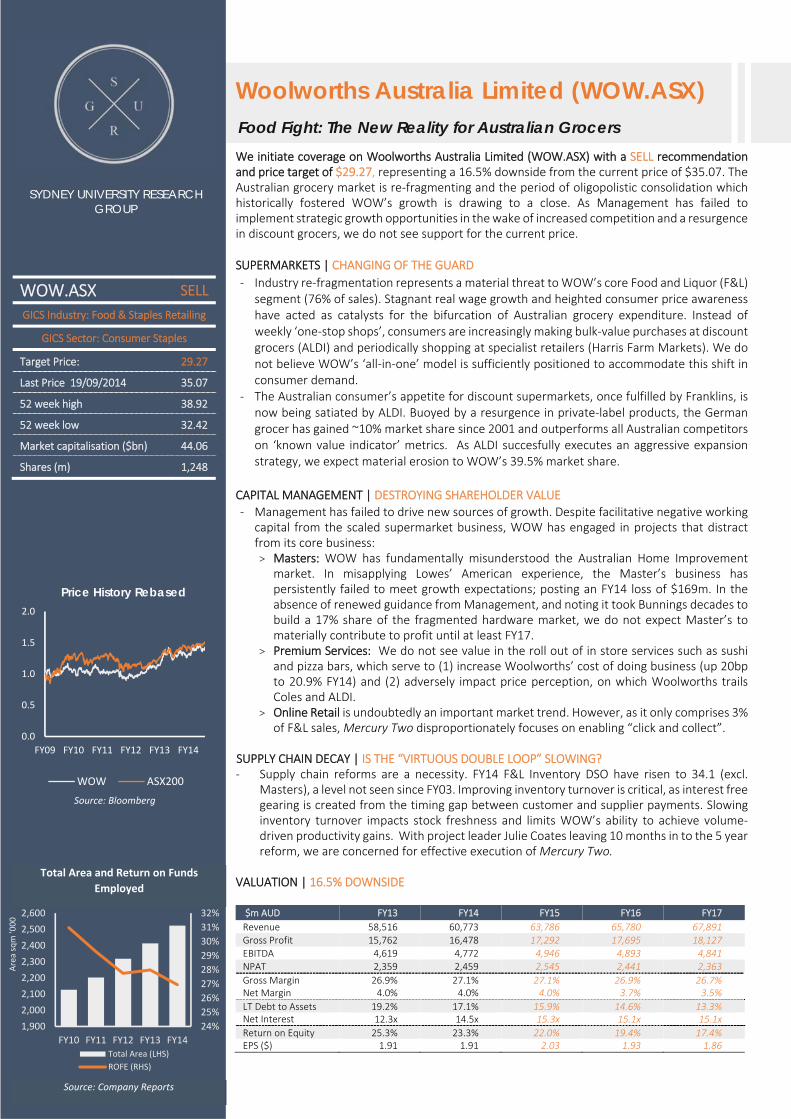
Woolworths Australia Limited (WOW.ASX) Food Fight: The New Reality for Australian Grocers We initiate coverage on Woolworths Australia Limited (WOW.ASX) with a SELL recommendation and price target of $29.27, representing a 16.5% downside from the current price of $35.07. The Australian grocery market is re‐fragmenting and the period of oligopolistic consolidation which historically fostered WOW’s growth is drawing to a close. As Management has failed to implement strategic growth opportunities in the wake of increased competition and a resurgence in discount grocers, we do not see support for the current price. SUPERMARKETS | CHANGING OF THE GUARD
‐ Industry re‐fragmentation represents a material threat to WOW’s core Food and Liquor (F&L) segment (76% of sales). Stagnant real wage growth and heighted consumer price awareness have acted as catalysts for the bifurcation of Australian grocery expenditure. Instead of weekly ‘one‐stop shops’, consumers are increasingly making bulk‐value purchases at discount grocers (ALDI) and periodically shopping at specialist retailers (Harris Farm Markets). We do not believe WOW’s ‘all‐in‐one’ model is sufficiently positioned to accommodate this shift in consumer demand.
‐ The Australian consumer’s appetite for discount supermarkets, once fulfilled by Franklins, is now being satiated by ALDI. Buoyed by a resurgence in private‐label products, the German grocer has gained ~10% market share since 2001 and outperforms all Australian competitors on ‘known value indicator’ metrics. As ALDI succesfully executes an aggressive expansion strategy, we expect material erosion to WOW’s 39.5% market share.
CAPITAL MANAGEMENT | DESTROYING SHAREHOLDER VALUE
‐ Management has failed to drive new sources of growth. Despite facilitative negative working capital from the scaled supermarket business, WOW has engaged in projects that distract from its core business: > Masters: WOW has fundamentally misunderstood the Australian Home Improvement
market. In misapplying Lowes’ American experience, the Master’s business has persistently failed to meet growth expectations; posting an FY14 loss of $169m. In the absence of renewed guidance from Management, and noting it took Bunnings decades to build a 17% share of the fragmented hardware market, we do not expect Master’s to materially contribute to profit until at least FY17.
> Premium Services: We do not see value in the roll out of in store services such as sushi and pizza bars, which serve to (1) increase Woolworths’ cost of doing business (up 20bp to 20.9% FY14) and (2) adversely impact price perception, on which Woolworths trails Coles and ALDI.
> Online Retail is undoubtedly an important market trend. However, as it only comprises 3% of F&L sales, Mercury Two disproportionately focuses on enabling “click and collect”.
SUPPLY CHAIN DECAY | IS THE “VIRTUOUS DOUBLE LOOP” SLOWING? ‐ Supply chain reforms are a necessity. FY14 F&L Inventory DSO have risen to 34.1 (excl.
Masters), a level not seen since FY03. Improving inventory turnover is critical, as interest free gearing is created from the timing gap between customer and supplier payments. Slowing inventory turnover impacts stock freshness and limits WOW’s ability to achieve volume‐driven productivity gains. With project leader Julie Coates leaving 10 months in to the 5 year reform, we are concerned for effective execution of Mercury Two.
VALUATION | 16.5% DOWNSIDE $m AUD FY13 FY14 FY15 FY16 FY17
Revenue 58,516 60,773 63,786 65,780 67,891 Gross Profit 15,762 16,478 17,292 17,695 18,127 EBITDA 4,619 4,772 4,946 4,893 4,841 NPAT 2,359 2,459 2,545 2,441 2,363
Gross Margin 26.9% 27.1% 27.1% 26.9% 26.7% Net Margin 4.0% 4.0% 4.0% 3.7% 3.5%
LT Debt to Assets 19.2% 17.1% 15.9% 14.6% 13.3% Net Interest 12.3x 14.5x 15.3x 15.1x 15.1x
Return on Equity 25.3% 23.3% 22.0% 19.4% 17.4% EPS ($) 1.91 1.91 2.03 1.93 1.86
WOW.ASX SELL
GICS Industry: Food & Staples Retailing
GICS Sector: Consumer Staples
Target Price: 29.27
Last Price 19/09/2014 35.07
52 week high 38.92
52 week low 32.42
Market capitalisation ($bn) 44.06
Shares (m) 1,248
SYDNEY UNIVERSITY RESEARCH GROUP
Total Area and Return on Funds
Employed
Source: Company Reports
0.0
0.5
1.0
1.5
2.0
FY09 FY10 FY11 FY12 FY13 FY14
Price History Rebased
WOW ASX200
Source: Bloomberg
24%
25%
26%
27%
28%
29%
30%
31%
32%
1,900
2,000
2,100
2,200
2,300
2,400
2,500
2,600
FY10 FY11 FY12 FY13 FY14
Area sqm '000
Total Area (LHS)
ROFE (RHS)
2
6.61%
7.09%
7.44%7.74%
7.92%7.73%
FY10 FY11 FY12 FY13 FY14 FY15E
Group EBITDA Margin
BUSINESS DESCRIPTION
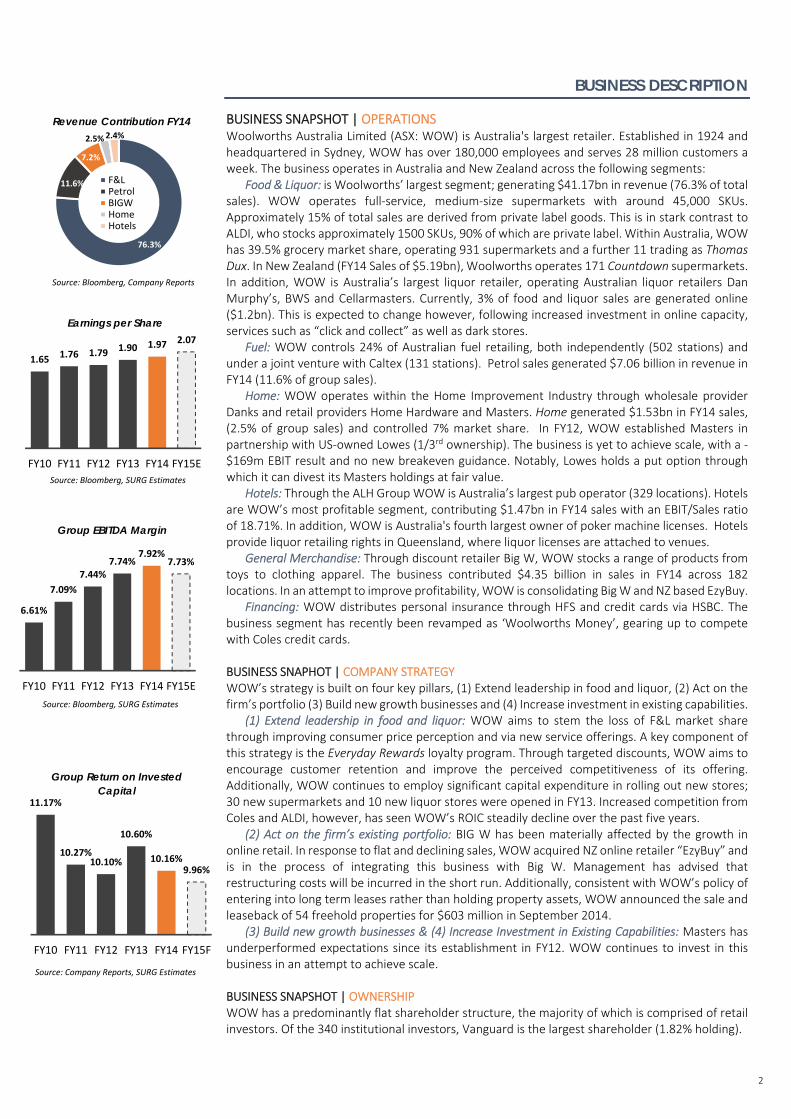
BUSINESS SNAPSHOT | OPERATIONS Woolworths Australia Limited (ASX: WOW) is Australia's largest retailer. Established in 1924 and headquartered in Sydney, WOW has over 180,000 employees and serves 28 million customers a week. The business operates in Australia and New Zealand across the following segments:
Food & Liquor: is Woolworths’ largest segment; generating $41.17bn in revenue (76.3% of total sales). WOW operates full‐service, medium‐size supermarkets with around 45,000 SKUs. Approximately 15% of total sales are derived from private label goods. This is in stark contrast to ALDI, who stocks approximately 1500 SKUs, 90% of which are private label. Within Australia, WOW has 39.5% grocery market share, operating 931 supermarkets and a further 11 trading as Thomas Dux. In New Zealand (FY14 Sales of $5.19bn), Woolworths operates 171 Countdown supermarkets. In addition, WOW is Australia’s largest liquor retailer, operating Australian liquor retailers Dan Murphy’s, BWS and Cellarmasters. Currently, 3% of food and liquor sales are generated online ($1.2bn). This is expected to change however, following increased investment in online capacity, services such as “click and collect” as well as dark stores.
Fuel: WOW controls 24% of Australian fuel retailing, both independently (502 stations) and under a joint venture with Caltex (131 stations). Petrol sales generated $7.06 billion in revenue in FY14 (11.6% of group sales).
Home: WOW operates within the Home Improvement Industry through wholesale provider Danks and retail providers Home Hardware and Masters. Home generated $1.53bn in FY14 sales, (2.5% of group sales) and controlled 7% market share. In FY12, WOW established Masters in partnership with US‐owned Lowes (1/3rd ownership). The business is yet to achieve scale, with a ‐$169m EBIT result and no new breakeven guidance. Notably, Lowes holds a put option through which it can divest its Masters holdings at fair value.
Hotels: Through the ALH Group WOW is Australia’s largest pub operator (329 locations). Hotels are WOW’s most profitable segment, contributing $1.47bn in FY14 sales with an EBIT/Sales ratio of 18.71%. In addition, WOW is Australia's fourth largest owner of poker machine licenses. Hotels provide liquor retailing rights in Queensland, where liquor licenses are attached to venues.
General Merchandise: Through discount retailer Big W, WOW stocks a range of products from toys to clothing apparel. The business contributed $4.35 billion in sales in FY14 across 182 locations. In an attempt to improve profitability, WOW is consolidating Big W and NZ based EzyBuy.
Financing: WOW distributes personal insurance through HFS and credit cards via HSBC. The business segment has recently been revamped as ‘Woolworths Money’, gearing up to compete with Coles credit cards. BUSINESS SNAPHOT | COMPANY STRATEGY WOW’s strategy is built on four key pillars, (1) Extend leadership in food and liquor, (2) Act on the firm’s portfolio (3) Build new growth businesses and (4) Increase investment in existing capabilities.
(1) Extend leadership in food and liquor: WOW aims to stem the loss of F&L market share through improving consumer price perception and via new service offerings. A key component of this strategy is the Everyday Rewards loyalty program. Through targeted discounts, WOW aims to encourage customer retention and improve the perceived competitiveness of its offering. Additionally, WOW continues to employ significant capital expenditure in rolling out new stores; 30 new supermarkets and 10 new liquor stores were opened in FY13. Increased competition from Coles and ALDI, however, has seen WOW’s ROIC steadily decline over the past five years.
(2) Act on the firm’s existing portfolio: BIG W has been materially affected by the growth in online retail. In response to flat and declining sales, WOW acquired NZ online retailer “EzyBuy” and is in the process of integrating this business with Big W. Management has advised that restructuring costs will be incurred in the short run. Additionally, consistent with WOW’s policy of entering into long term leases rather than holding property assets, WOW announced the sale and leaseback of 54 freehold properties for $603 million in September 2014.
(3) Build new growth businesses & (4) Increase Investment in Existing Capabilities: Masters has underperformed expectations since its establishment in FY12. WOW continues to invest in this business in an attempt to achieve scale. BUSINESS SNAPSHOT | OWNERSHIP WOW has a predominantly flat shareholder structure, the majority of which is comprised of retail investors. Of the 340 institutional investors, Vanguard is the largest shareholder (1.82% holding).
Revenue Contribution FY14
76.3%
11.6%
7.2%
2.5%2.4%
F&LPetrolBIGWHomeHotels
Source: Company Reports, SURG Estimates
Group Return on Invested Capital
1.65 1.76 1.79 1.90 1.97 2.07
FY10 FY11 FY12 FY13 FY14 FY15E
Earnings per Share
11.17%
10.27%10.10%
10.60%
10.16%9.96%
FY10 FY11 FY12 FY13 FY14 FY15F
Source: Bloomberg, SURG Estimates
Source: Bloomberg, SURG Estimates
Source: Bloomberg, Company Reports
3
BUSINESS DETAIL | CORPORATE GOVERNANCE & SOCIAL RESPONSIBILITY WOW has sound corporate governance and sufficiently fulfils Australia’s prudential regulatory requirements. To ensure that WOW meets high levels compliance standards, a number of committees have been established, including the Nomination, Audit, Risk Management and Compliance Committees. In addition, WOW attempts to maintain strong community partnerships, investing 1% of pre‐tax profits in community projects and initiatives. In recognition of the firm’s commitment to responsible reporting, WOW is the only Australian retailer listed on the Carbon Disclosure Project Leadership Index. However, we identify the ALH Group as Australia’s 4th largest operator of poker machines. While the firm was awarded the “Socially Responsible Operator of 2012”, we recognise that gambling may be an issue for individuals pursuing Socially Responsible investment strategies.
INDUSTRY OVERVIEW & COMPETITIVE POSITIONING
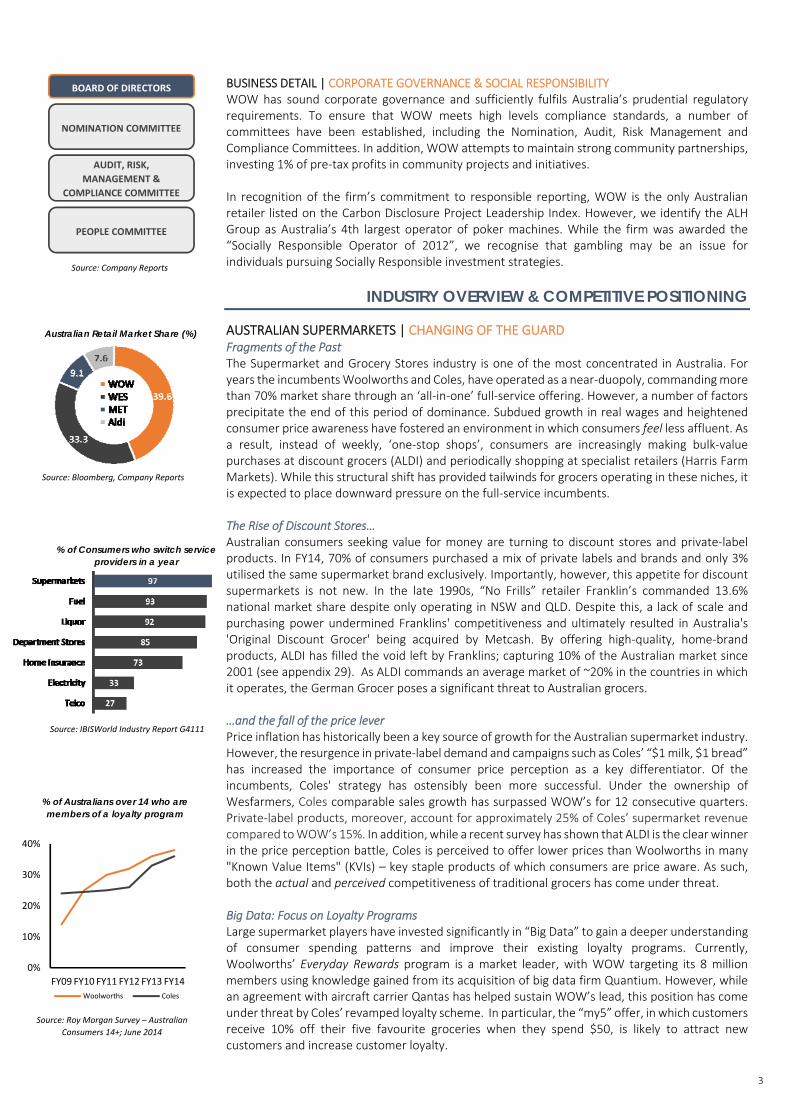
AUSTRALIAN SUPERMARKETS | CHANGING OF THE GUARD Fragments of the Past The Supermarket and Grocery Stores industry is one of the most concentrated in Australia. For years the incumbents Woolworths and Coles, have operated as a near‐duopoly, commanding more than 70% market share through an ‘all‐in‐one’ full‐service offering. However, a number of factors precipitate the end of this period of dominance. Subdued growth in real wages and heightened consumer price awareness have fostered an environment in which consumers feel less affluent. As a result, instead of weekly, ‘one‐stop shops’, consumers are increasingly making bulk‐value purchases at discount grocers (ALDI) and periodically shopping at specialist retailers (Harris Farm Markets). While this structural shift has provided tailwinds for grocers operating in these niches, it is expected to place downward pressure on the full‐service incumbents. The Rise of Discount Stores… Australian consumers seeking value for money are turning to discount stores and private‐label products. In FY14, 70% of consumers purchased a mix of private labels and brands and only 3% utilised the same supermarket brand exclusively. Importantly, however, this appetite for discount supermarkets is not new. In the late 1990s, “No Frills” retailer Franklin’s commanded 13.6% national market share despite only operating in NSW and QLD. Despite this, a lack of scale and purchasing power undermined Franklins' competitiveness and ultimately resulted in Australia's 'Original Discount Grocer' being acquired by Metcash. By offering high‐quality, home‐brand products, ALDI has filled the void left by Franklins; capturing 10% of the Australian market since 2001 (see appendix 29). As ALDI commands an average market of ~20% in the countries in which it operates, the German Grocer poses a significant threat to Australian grocers. …and the fall of the price lever Price inflation has historically been a key source of growth for the Australian supermarket industry. However, the resurgence in private‐label demand and campaigns such as Coles’ “$1 milk, $1 bread” has increased the importance of consumer price perception as a key differentiator. Of the incumbents, Coles' strategy has ostensibly been more successful. Under the ownership of Wesfarmers, Coles comparable sales growth has surpassed WOW’s for 12 consecutive quarters. Private‐label products, moreover, account for approximately 25% of Coles’ supermarket revenue compared to WOW’s 15%. In addition, while a recent survey has shown that ALDI is the clear winner in the price perception battle, Coles is perceived to offer lower prices than Woolworths in many "Known Value Items" (KVIs) – key staple products of which consumers are price aware. As such, both the actual and perceived competitiveness of traditional grocers has come under threat. Big Data: Focus on Loyalty Programs Large supermarket players have invested significantly in “Big Data” to gain a deeper understanding of consumer spending patterns and improve their existing loyalty programs. Currently, Woolworths’ Everyday Rewards program is a market leader, with WOW targeting its 8 million members using knowledge gained from its acquisition of big data firm Quantium. However, while an agreement with aircraft carrier Qantas has helped sustain WOW’s lead, this position has come under threat by Coles’ revamped loyalty scheme. In particular, the “my5” offer, in which customers receive 10% off their five favourite groceries when they spend $50, is likely to attract new customers and increase customer loyalty.
% of Australians over 14 who are members of a loyalty program
Australian Retail Market Share (%)
Source: Bloomberg, Company Reports
Source: Company Reports
% of Consumers who switch service providers in a year
Source: IBISWorld Industry Report G4111
BOARD OF DIRECTORS
NOMINATION COMMITTEE
AUDIT, RISK,
MANAGEMENT &
COMPLIANCE COMMITTEE
PEOPLE COMMITTEE
0%
10%
20%
30%
40%
FY09 FY10 FY11 FY12 FY13 FY14
Woolworths Coles
Source: Roy Morgan Survey – Australian
Consumers 14+; June 2014
4
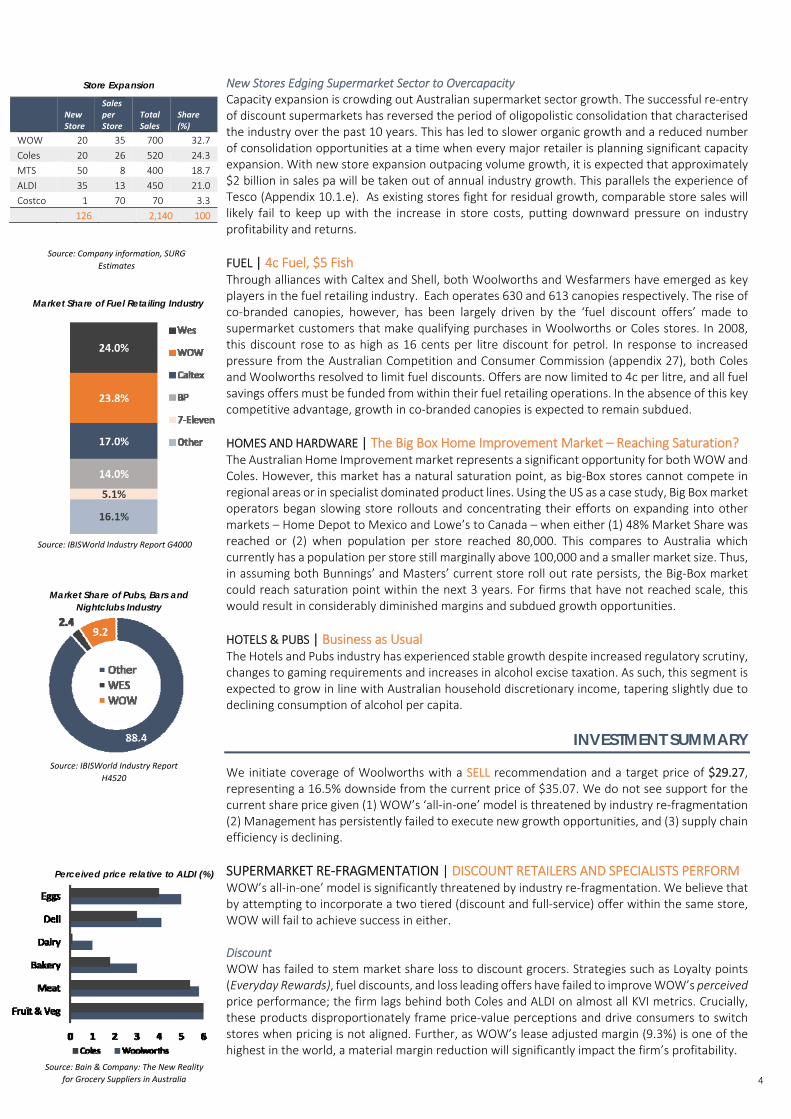
New Stores Edging Supermarket Sector to Overcapacity Capacity expansion is crowding out Australian supermarket sector growth. The successful re‐entry of discount supermarkets has reversed the period of oligopolistic consolidation that characterised the industry over the past 10 years. This has led to slower organic growth and a reduced number of consolidation opportunities at a time when every major retailer is planning significant capacity expansion. With new store expansion outpacing volume growth, it is expected that approximately $2 billion in sales pa will be taken out of annual industry growth. This parallels the experience of Tesco (Appendix 10.1.e). As existing stores fight for residual growth, comparable store sales will likely fail to keep up with the increase in store costs, putting downward pressure on industry profitability and returns.
FUEL | 4c Fuel, $5 Fish Through alliances with Caltex and Shell, both Woolworths and Wesfarmers have emerged as key players in the fuel retailing industry. Each operates 630 and 613 canopies respectively. The rise of co‐branded canopies, however, has been largely driven by the ‘fuel discount offers’ made to supermarket customers that make qualifying purchases in Woolworths or Coles stores. In 2008, this discount rose to as high as 16 cents per litre discount for petrol. In response to increased pressure from the Australian Competition and Consumer Commission (appendix 27), both Coles and Woolworths resolved to limit fuel discounts. Offers are now limited to 4c per litre, and all fuel savings offers must be funded from within their fuel retailing operations. In the absence of this key competitive advantage, growth in co‐branded canopies is expected to remain subdued.
HOMES AND HARDWARE | The Big Box Home Improvement Market – Reaching Saturation? The Australian Home Improvement market represents a significant opportunity for both WOW and Coles. However, this market has a natural saturation point, as big‐Box stores cannot compete in regional areas or in specialist dominated product lines. Using the US as a case study, Big Box market operators began slowing store rollouts and concentrating their efforts on expanding into other markets – Home Depot to Mexico and Lowe’s to Canada – when either (1) 48% Market Share was reached or (2) when population per store reached 80,000. This compares to Australia which currently has a population per store still marginally above 100,000 and a smaller market size. Thus, in assuming both Bunnings’ and Masters’ current store roll out rate persists, the Big‐Box market could reach saturation point within the next 3 years. For firms that have not reached scale, this would result in considerably diminished margins and subdued growth opportunities.
HOTELS & PUBS | Business as Usual The Hotels and Pubs industry has experienced stable growth despite increased regulatory scrutiny, changes to gaming requirements and increases in alcohol excise taxation. As such, this segment is expected to grow in line with Australian household discretionary income, tapering slightly due to declining consumption of alcohol per capita.
INVESTMENT SUMMARY
We initiate coverage of Woolworths with a SELL recommendation and a target price of $29.27, representing a 16.5% downside from the current price of $35.07. We do not see support for the current share price given (1) WOW’s ‘all‐in‐one’ model is threatened by industry re‐fragmentation (2) Management has persistently failed to execute new growth opportunities, and (3) supply chain efficiency is declining.
SUPERMARKET RE‐FRAGMENTATION | DISCOUNT RETAILERS AND SPECIALISTS PERFORM WOW’s all‐in‐one’ model is significantly threatened by industry re‐fragmentation. We believe that by attempting to incorporate a two tiered (discount and full‐service) offer within the same store, WOW will fail to achieve success in either. Discount WOW has failed to stem market share loss to discount grocers. Strategies such as Loyalty points (Everyday Rewards), fuel discounts, and loss leading offers have failed to improve WOW’s perceived price performance; the firm lags behind both Coles and ALDI on almost all KVI metrics. Crucially, these products disproportionately frame price‐value perceptions and drive consumers to switch stores when pricing is not aligned. Further, as WOW’s lease adjusted margin (9.3%) is one of the highest in the world, a material margin reduction will significantly impact the firm’s profitability.
Source: Company information, SURG
Estimates
New Store
Sales per Store
Total Sales
Share (%)
WOW 20 35 700 32.7
Coles 20 26 520 24.3
MTS 50 8 400 18.7
ALDI 35 13 450 21.0
Costco 1 70 70 3.3
126 2,140 100
Store Expansion
Market Share of Fuel Retailing Industry
Source: IBISWorld Industry Report G4000
Perceived price relative to ALDI (%)
Source: Bain & Company: The New Reality
for Grocery Suppliers in Australia
Market Share of Pubs, Bars and Nightclubs Industry
Source: IBISWorld Industry Report
H4520
5
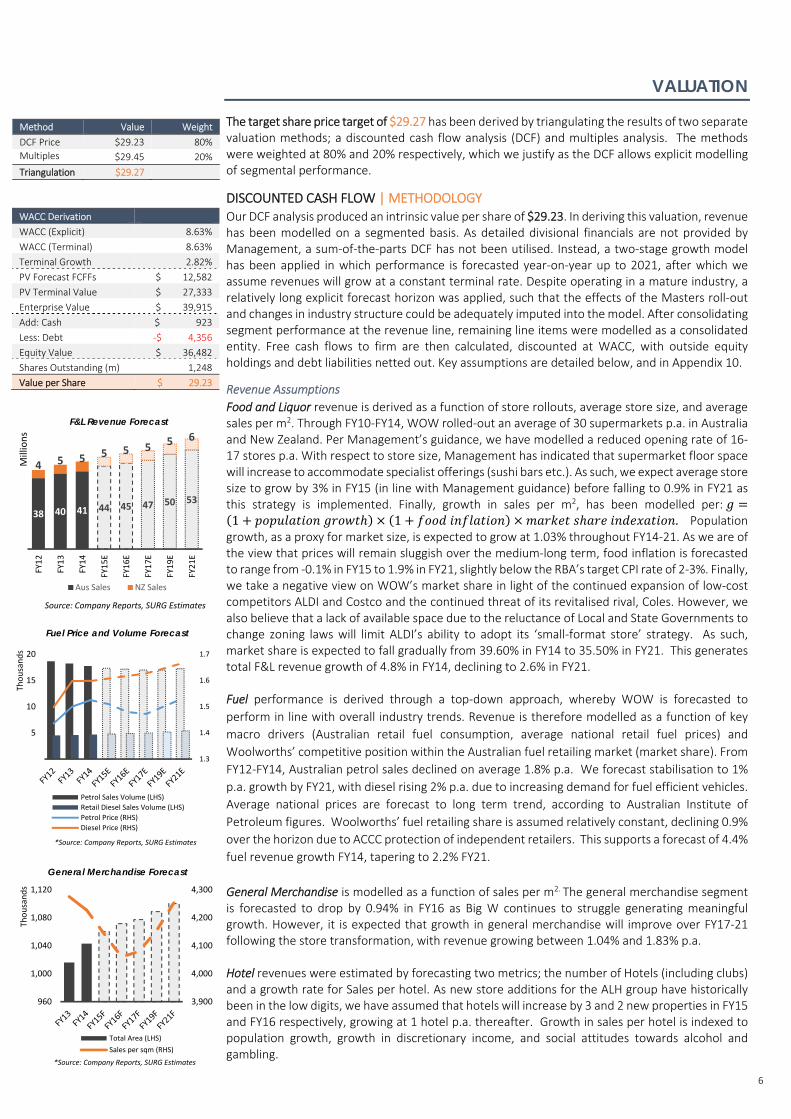
3,8604,240 4,470
4,7405,140
5,510
174 183 222 320654
993
FY09 FY10 FY11 FY12 FY13 FY14
Bunnings WOW
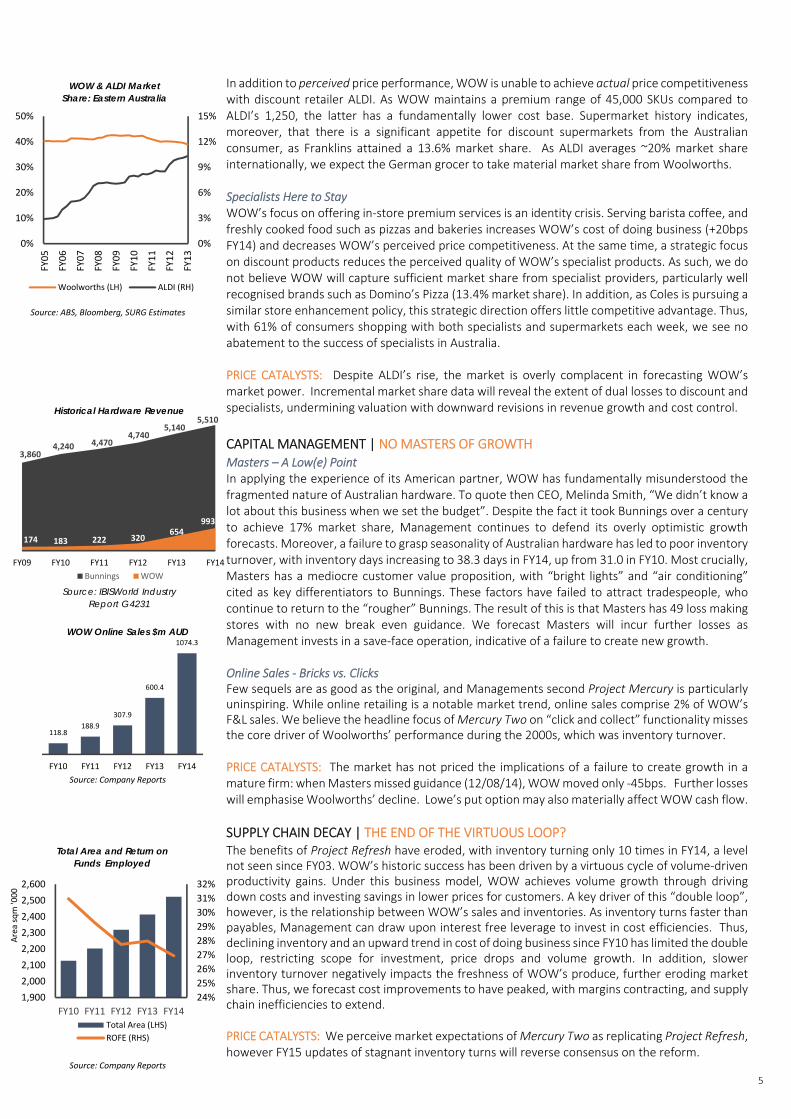
In addition to perceived price performance, WOW is unable to achieve actual price competitiveness with discount retailer ALDI. As WOW maintains a premium range of 45,000 SKUs compared to ALDI’s 1,250, the latter has a fundamentally lower cost base. Supermarket history indicates, moreover, that there is a significant appetite for discount supermarkets from the Australian consumer, as Franklins attained a 13.6% market share. As ALDI averages ~20% market share internationally, we expect the German grocer to take material market share from Woolworths. Specialists Here to Stay WOW’s focus on offering in‐store premium services is an identity crisis. Serving barista coffee, and freshly cooked food such as pizzas and bakeries increases WOW’s cost of doing business (+20bps FY14) and decreases WOW’s perceived price competitiveness. At the same time, a strategic focus on discount products reduces the perceived quality of WOW’s specialist products. As such, we do not believe WOW will capture sufficient market share from specialist providers, particularly well recognised brands such as Domino’s Pizza (13.4% market share). In addition, as Coles is pursuing a similar store enhancement policy, this strategic direction offers little competitive advantage. Thus, with 61% of consumers shopping with both specialists and supermarkets each week, we see no abatement to the success of specialists in Australia.
PRICE CATALYSTS: Despite ALDI’s rise, the market is overly complacent in forecasting WOW’s market power. Incremental market share data will reveal the extent of dual losses to discount and specialists, undermining valuation with downward revisions in revenue growth and cost control.
CAPITAL MANAGEMENT | NO MASTERS OF GROWTH Masters – A Low(e) Point In applying the experience of its American partner, WOW has fundamentally misunderstood the fragmented nature of Australian hardware. To quote then CEO, Melinda Smith, “We didn’t know a lot about this business when we set the budget”. Despite the fact it took Bunnings over a century to achieve 17% market share, Management continues to defend its overly optimistic growth forecasts. Moreover, a failure to grasp seasonality of Australian hardware has led to poor inventory turnover, with inventory days increasing to 38.3 days in FY14, up from 31.0 in FY10. Most crucially, Masters has a mediocre customer value proposition, with “bright lights” and “air conditioning” cited as key differentiators to Bunnings. These factors have failed to attract tradespeople, who continue to return to the “rougher” Bunnings. The result of this is that Masters has 49 loss making stores with no new break even guidance. We forecast Masters will incur further losses as Management invests in a save‐face operation, indicative of a failure to create new growth.
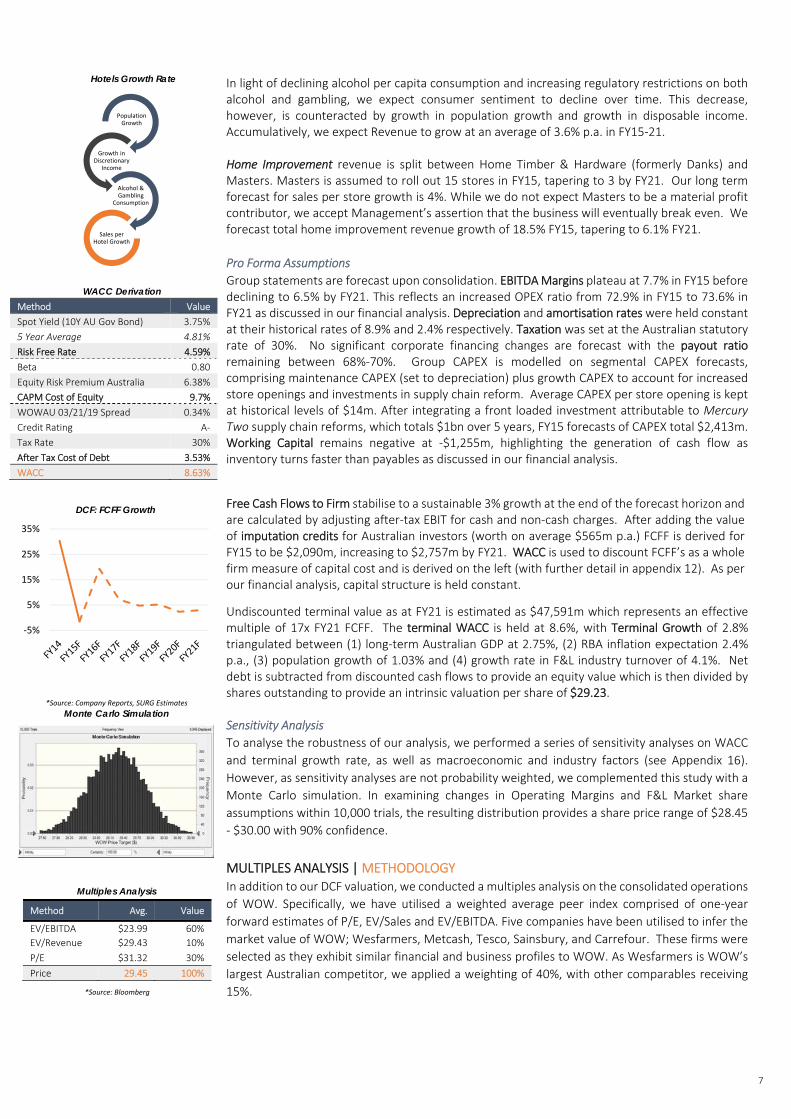
Online Sales ‐ Bricks vs. Clicks Few sequels are as good as the original, and Managements second Project Mercury is particularly uninspiring. While online retailing is a notable market trend, online sales comprise 2% of WOW’s F&L sales. We believe the headline focus of Mercury Two on “click and collect” functionality misses the core driver of Woolworths’ performance during the 2000s, which was inventory turnover.
PRICE CATALYSTS: The market has not priced the implications of a failure to create growth in a mature firm: when Masters missed guidance (12/08/14), WOW moved only ‐45bps. Further losses will emphasise Woolworths’ decline. Lowe’s put option may also materially affect WOW cash flow.
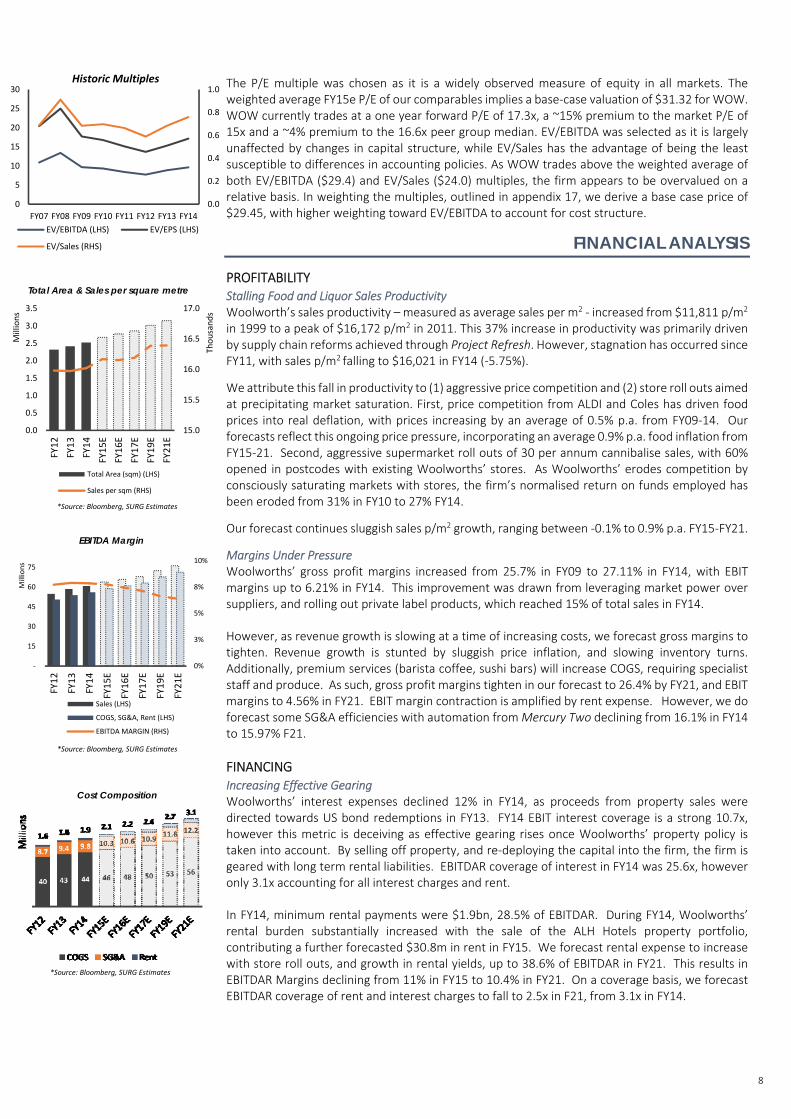
SUPPLY CHAIN DECAY | THE END OF THE VIRTUOUS LOOP? The benefits of Project Refresh have eroded, with inventory turning only 10 times in FY14, a level not seen since FY03. WOW’s historic success has been driven by a virtuous cycle of volume‐driven productivity gains. Under this business model, WOW achieves volume growth through driving down costs and investing savings in lower prices for customers. A key driver of this “double loop”, however, is the relationship between WOW’s sales and inventories. As inventory turns faster than payables, Management can draw upon interest free leverage to invest in cost efficiencies. Thus, declining inventory and an upward trend in cost of doing business since FY10 has limited the double loop, restricting scope for investment, price drops and volume growth. In addition, slower inventory turnover negatively impacts the freshness of WOW’s produce, further eroding market share. Thus, we forecast cost improvements to have peaked, with margins contracting, and supply chain inefficiencies to extend. PRICE CATALYSTS: We perceive market expectations of Mercury Two as replicating Project Refresh, however FY15 updates of stagnant inventory turns will reverse consensus on the reform.
WOW & ALDI Market Share: Eastern Australia
0%
3%
6%
9%
12%
15%
0%
10%
20%
30%
40%
50%
FY05
FY06
FY07
FY08
FY09
FY10
FY11
FY12
FY13
Woolworths (LH) ALDI (RH)
WOW Online Sales $m AUD
Total Area and Return on Funds Employed
Source: ABS, Bloomberg, SURG Estimates
118.8188.9
307.9
600.4
1074.3
FY10 FY11 FY12 FY13 FY14
24%
25%
26%
27%
28%
29%
30%
31%
32%
1,900
2,000
2,100
2,200
2,300
2,400
2,500
2,600
FY10 FY11 FY12 FY13 FY14
Area sqm '000
Total Area (LHS)
ROFE (RHS)
Source: Company Reports
Source: Company Reports
Source: IBISWorld Industry Report G4231
Historical Hardware Revenue
6
WACC Derivation
WACC (Explicit) 8.63%
WACC (Terminal) 8.63%
Terminal Growth 2.82%
PV Forecast FCFFs $ 12,582
PV Terminal Value $ 27,333
Enterprise Value $ 39,915
Add: Cash $ 923
Less: Debt ‐$ 4,356
Equity Value $ 36,482
Shares Outstanding (m) 1,248
Value per Share $ 29.23
Method Value Weight
DCF Price $29.23 80%
Multiples $29.45 20%
Triangulation $29.27
VALUATION
The target share price target of $29.27 has been derived by triangulating the results of two separate valuation methods; a discounted cash flow analysis (DCF) and multiples analysis. The methods were weighted at 80% and 20% respectively, which we justify as the DCF allows explicit modelling of segmental performance.
DISCOUNTED CASH FLOW | METHODOLOGY Our DCF analysis produced an intrinsic value per share of $29.23. In deriving this valuation, revenue has been modelled on a segmented basis. As detailed divisional financials are not provided by Management, a sum‐of‐the‐parts DCF has not been utilised. Instead, a two‐stage growth model has been applied in which performance is forecasted year‐on‐year up to 2021, after which we assume revenues will grow at a constant terminal rate. Despite operating in a mature industry, a relatively long explicit forecast horizon was applied, such that the effects of the Masters roll‐out and changes in industry structure could be adequately imputed into the model. After consolidating segment performance at the revenue line, remaining line items were modelled as a consolidated entity. Free cash flows to firm are then calculated, discounted at WACC, with outside equity holdings and debt liabilities netted out. Key assumptions are detailed below, and in Appendix 10.
Revenue Assumptions Food and Liquor revenue is derived as a function of store rollouts, average store size, and average sales per m2. Through FY10‐FY14, WOW rolled‐out an average of 30 supermarkets p.a. in Australia and New Zealand. Per Management’s guidance, we have modelled a reduced opening rate of 16‐17 stores p.a. With respect to store size, Management has indicated that supermarket floor space will increase to accommodate specialist offerings (sushi bars etc.). As such, we expect average store size to grow by 3% in FY15 (in line with Management guidance) before falling to 0.9% in FY21 as this strategy is implemented. Finally, growth in sales per m2, has been modelled per:1 1 . Population growth, as a proxy for market size, is expected to grow at 1.03% throughout FY14‐21. As we are of the view that prices will remain sluggish over the medium‐long term, food inflation is forecasted to range from ‐0.1% in FY15 to 1.9% in FY21, slightly below the RBA’s target CPI rate of 2‐3%. Finally, we take a negative view on WOW’s market share in light of the continued expansion of low‐cost competitors ALDI and Costco and the continued threat of its revitalised rival, Coles. However, we also believe that a lack of available space due to the reluctance of Local and State Governments to change zoning laws will limit ALDI’s ability to adopt its ‘small‐format store’ strategy. As such, market share is expected to fall gradually from 39.60% in FY14 to 35.50% in FY21. This generates total F&L revenue growth of 4.8% in FY14, declining to 2.6% in FY21. Fuel performance is derived through a top‐down approach, whereby WOW is forecasted to
perform in line with overall industry trends. Revenue is therefore modelled as a function of key
macro drivers (Australian retail fuel consumption, average national retail fuel prices) and
Woolworths’ competitive position within the Australian fuel retailing market (market share). From
FY12‐FY14, Australian petrol sales declined on average 1.8% p.a. We forecast stabilisation to 1%
p.a. growth by FY21, with diesel rising 2% p.a. due to increasing demand for fuel efficient vehicles.
Average national prices are forecast to long term trend, according to Australian Institute of
Petroleum figures. Woolworths’ fuel retailing share is assumed relatively constant, declining 0.9%
over the horizon due to ACCC protection of independent retailers. This supports a forecast of 4.4%
fuel revenue growth FY14, tapering to 2.2% FY21.
General Merchandise is modelled as a function of sales per m2. The general merchandise segment is forecasted to drop by 0.94% in FY16 as Big W continues to struggle generating meaningful growth. However, it is expected that growth in general merchandise will improve over FY17‐21 following the store transformation, with revenue growing between 1.04% and 1.83% p.a. Hotel revenues were estimated by forecasting two metrics; the number of Hotels (including clubs) and a growth rate for Sales per hotel. As new store additions for the ALH group have historically been in the low digits, we have assumed that hotels will increase by 3 and 2 new properties in FY15 and FY16 respectively, growing at 1 hotel p.a. thereafter. Growth in sales per hotel is indexed to population growth, growth in discretionary income, and social attitudes towards alcohol and gambling.
F&L Revenue Forecast
Source: Company Reports, SURG Estimates
*Source: Company Reports, SURG Estimates
38 40 41 44 45 47 50 53
4 5 5 5 5 5 5 6
10
20
30
40
50
60
FY12
FY13
FY14
FY15E
FY16E
FY17E
FY19E
FY21E
Millions
Aus Sales NZ Sales
Fuel Price and Volume Forecast
1.3
1.4
1.5
1.6
1.7
5
10
15
20
Thousands
Petrol Sales Volume (LHS)
Retail Diesel Sales Volume (LHS)
Petrol Price (RHS)
Diesel Price (RHS)
3,900
4,000
4,100
4,200
4,300
960
1,000
1,040
1,080
1,120
Thousands
Total Area (LHS)
Sales per sqm (RHS)
*Source: Company Reports, SURG Estimates
General Merchandise Forecast
7
Method Value
Spot Yield (10Y AU Gov Bond) 3.75%
5 Year Average 4.81%
Risk Free Rate 4.59%
Beta 0.80
Equity Risk Premium Australia 6.38%
CAPM Cost of Equity 9.7%
WOWAU 03/21/19 Spread 0.34%
Credit Rating A‐
Tax Rate 30%
After Tax Cost of Debt 3.53%
WACC 8.63%
Population Growth
Growth in Discretionary
Income
Alcohol & Gambling
Consumption
Sales per Hotel Growth
Method Avg. Value
EV/EBITDA $23.99 60%
EV/Revenue $29.43 10%
P/E $31.32 30%
Price 29.45 100%
In light of declining alcohol per capita consumption and increasing regulatory restrictions on both alcohol and gambling, we expect consumer sentiment to decline over time. This decrease, however, is counteracted by growth in population growth and growth in disposable income. Accumulatively, we expect Revenue to grow at an average of 3.6% p.a. in FY15‐21. Home Improvement revenue is split between Home Timber & Hardware (formerly Danks) and Masters. Masters is assumed to roll out 15 stores in FY15, tapering to 3 by FY21. Our long term forecast for sales per store growth is 4%. While we do not expect Masters to be a material profit contributor, we accept Management’s assertion that the business will eventually break even. We forecast total home improvement revenue growth of 18.5% FY15, tapering to 6.1% FY21.
Pro Forma Assumptions
Group statements are forecast upon consolidation. EBITDA Margins plateau at 7.7% in FY15 before declining to 6.5% by FY21. This reflects an increased OPEX ratio from 72.9% in FY15 to 73.6% in FY21 as discussed in our financial analysis. Depreciation and amortisation rates were held constant at their historical rates of 8.9% and 2.4% respectively. Taxation was set at the Australian statutory rate of 30%. No significant corporate financing changes are forecast with the payout ratio remaining between 68%‐70%. Group CAPEX is modelled on segmental CAPEX forecasts, comprising maintenance CAPEX (set to depreciation) plus growth CAPEX to account for increased store openings and investments in supply chain reform. Average CAPEX per store opening is kept at historical levels of $14m. After integrating a front loaded investment attributable to Mercury Two supply chain reforms, which totals $1bn over 5 years, FY15 forecasts of CAPEX total $2,413m. Working Capital remains negative at ‐$1,255m, highlighting the generation of cash flow as inventory turns faster than payables as discussed in our financial analysis.
Free Cash Flows to Firm stabilise to a sustainable 3% growth at the end of the forecast horizon and are calculated by adjusting after‐tax EBIT for cash and non‐cash charges. After adding the value of imputation credits for Australian investors (worth on average $565m p.a.) FCFF is derived for FY15 to be $2,090m, increasing to $2,757m by FY21. WACC is used to discount FCFF’s as a whole firm measure of capital cost and is derived on the left (with further detail in appendix 12). As per our financial analysis, capital structure is held constant.
Undiscounted terminal value as at FY21 is estimated as $47,591m which represents an effective multiple of 17x FY21 FCFF. The terminal WACC is held at 8.6%, with Terminal Growth of 2.8% triangulated between (1) long‐term Australian GDP at 2.75%, (2) RBA inflation expectation 2.4% p.a., (3) population growth of 1.03% and (4) growth rate in F&L industry turnover of 4.1%. Net debt is subtracted from discounted cash flows to provide an equity value which is then divided by shares outstanding to provide an intrinsic valuation per share of $29.23. Sensitivity Analysis
To analyse the robustness of our analysis, we performed a series of sensitivity analyses on WACC
and terminal growth rate, as well as macroeconomic and industry factors (see Appendix 16).
However, as sensitivity analyses are not probability weighted, we complemented this study with a
Monte Carlo simulation. In examining changes in Operating Margins and F&L Market share
assumptions within 10,000 trials, the resulting distribution provides a share price range of $28.45
‐ $30.00 with 90% confidence.
MULTIPLES ANALYSIS | METHODOLOGY In addition to our DCF valuation, we conducted a multiples analysis on the consolidated operations
of WOW. Specifically, we have utilised a weighted average peer index comprised of one‐year
forward estimates of P/E, EV/Sales and EV/EBITDA. Five companies have been utilised to infer the
market value of WOW; Wesfarmers, Metcash, Tesco, Sainsbury, and Carrefour. These firms were
selected as they exhibit similar financial and business profiles to WOW. As Wesfarmers is WOW’s
largest Australian competitor, we applied a weighting of 40%, with other comparables receiving
15%.
WACC Derivation
Hotels Growth Rate
‐5%
5%
15%
25%
35%
DCF: FCFF Growth
Monte Carlo Simulation *Source: Company Reports, SURG Estimates
*Source: Bloomberg
Multiples Analysis
8
The P/E multiple was chosen as it is a widely observed measure of equity in all markets. The weighted average FY15e P/E of our comparables implies a base‐case valuation of $31.32 for WOW. WOW currently trades at a one year forward P/E of 17.3x, a ~15% premium to the market P/E of 15x and a ~4% premium to the 16.6x peer group median. EV/EBITDA was selected as it is largely unaffected by changes in capital structure, while EV/Sales has the advantage of being the least susceptible to differences in accounting policies. As WOW trades above the weighted average of both EV/EBITDA ($29.4) and EV/Sales ($24.0) multiples, the firm appears to be overvalued on a relative basis. In weighting the multiples, outlined in appendix 17, we derive a base case price of $29.45, with higher weighting toward EV/EBITDA to account for cost structure.
FINANCIAL ANALYSIS
PROFITABILITY Stalling Food and Liquor Sales Productivity Woolworth’s sales productivity – measured as average sales per m2 ‐ increased from $11,811 p/m2 in 1999 to a peak of $16,172 p/m2 in 2011. This 37% increase in productivity was primarily driven by supply chain reforms achieved through Project Refresh. However, stagnation has occurred since FY11, with sales p/m2 falling to $16,021 in FY14 (‐5.75%).
We attribute this fall in productivity to (1) aggressive price competition and (2) store roll outs aimed at precipitating market saturation. First, price competition from ALDI and Coles has driven food prices into real deflation, with prices increasing by an average of 0.5% p.a. from FY09‐14. Our forecasts reflect this ongoing price pressure, incorporating an average 0.9% p.a. food inflation from FY15‐21. Second, aggressive supermarket roll outs of 30 per annum cannibalise sales, with 60% opened in postcodes with existing Woolworths’ stores. As Woolworths’ erodes competition by consciously saturating markets with stores, the firm’s normalised return on funds employed has been eroded from 31% in FY10 to 27% FY14.
Our forecast continues sluggish sales p/m2 growth, ranging between ‐0.1% to 0.9% p.a. FY15‐FY21.
Margins Under Pressure Woolworths’ gross profit margins increased from 25.7% in FY09 to 27.11% in FY14, with EBIT margins up to 6.21% in FY14. This improvement was drawn from leveraging market power over suppliers, and rolling out private label products, which reached 15% of total sales in FY14.
However, as revenue growth is slowing at a time of increasing costs, we forecast gross margins to tighten. Revenue growth is stunted by sluggish price inflation, and slowing inventory turns. Additionally, premium services (barista coffee, sushi bars) will increase COGS, requiring specialist staff and produce. As such, gross profit margins tighten in our forecast to 26.4% by FY21, and EBIT margins to 4.56% in FY21. EBIT margin contraction is amplified by rent expense. However, we do forecast some SG&A efficiencies with automation from Mercury Two declining from 16.1% in FY14 to 15.97% F21.
FINANCING Increasing Effective Gearing Woolworths’ interest expenses declined 12% in FY14, as proceeds from property sales were directed towards US bond redemptions in FY13. FY14 EBIT interest coverage is a strong 10.7x, however this metric is deceiving as effective gearing rises once Woolworths’ property policy is taken into account. By selling off property, and re‐deploying the capital into the firm, the firm is geared with long term rental liabilities. EBITDAR coverage of interest in FY14 was 25.6x, however only 3.1x accounting for all interest charges and rent.
In FY14, minimum rental payments were $1.9bn, 28.5% of EBITDAR. During FY14, Woolworths’ rental burden substantially increased with the sale of the ALH Hotels property portfolio, contributing a further forecasted $30.8m in rent in FY15. We forecast rental expense to increase with store roll outs, and growth in rental yields, up to 38.6% of EBITDAR in FY21. This results in EBITDAR Margins declining from 11% in FY15 to 10.4% in FY21. On a coverage basis, we forecast EBITDAR coverage of rent and interest charges to fall to 2.5x in F21, from 3.1x in FY14.
15.0
15.5
16.0
16.5
17.0
0.0
0.5
1.0
1.5
2.0
2.5
3.0
3.5
FY12
FY13
FY14
FY15E
FY16E
FY17E
FY19E
FY21E
Thousands
Millions
Total Area (sqm) (LHS)
Sales per sqm (RHS)
0%
3%
5%
8%
10%
‐
15
30
45
60
75
FY12
FY13
FY14
FY15E
FY16E
FY17E
FY19E
FY21E
Millions
Sales (LHS)
COGS, SG&A, Rent (LHS)
EBITDA MARGIN (RHS)
Cost Composition
Total Area & Sales per square metre
*Source: Bloomberg, SURG Estimates
*Source: Bloomberg, SURG Estimates
*Source: Bloomberg, SURG Estimates
EBITDA Margin
0.0
0.2
0.4
0.6
0.8
1.0
0
5
10
15
20
25
30
FY07 FY08 FY09 FY10 FY11 FY12 FY13 FY14
Historic Multiples
EV/EBITDA (LHS) EV/EPS (LHS)
EV/Sales (RHS)
9
0
1,000
2,000
3,000
4,000
5,000
6,000
7,000
8,000
9,000
Inventories A/C Payable
Reliable Capital on Tap From FY09‐FY14, group CAPEX averaged $2,174m per annum, with our forecasts following Management guidance of store roll outs and refurbishments to require $2,645m in FY15, tapering to $1,690m in FY21. This CAPEX has been supported by WOW’s reliable sources of capital – (1) dividend reinvestment, (2) negative working capital and (3) cheap corporate debt issuance. First, Woolworths’ dividend reinvestment plan has on average 15% take‐up, with reinvested dividends forecast to be worth $265m in FY15. We have assumed a constant payout of 69% NPAT, with continuing 15% reinvestment. Second, Woolworths generates negative working capital by selling substantial produce before paying suppliers. This provides flexible ongoing liquidity to deploy into CAPEX projects, discussed under ‘enhanced cash generation’. Third, Woolworths’ has maintained an A‐ (S&P) credit rating, enabling access to cheap credit. Woolworths’ Debt/ Equity ratio has historically remained stable, being ~7.8% in FY14. We use 7.8% as a target debt to equity ratio, without any indication of Management intentions to become more heavily reliant on debt funding. Further, in support of good capital Management, and in line with Australian practices, excess cash will likely be committed to a projected share buy back in FY19 of $1,729m.
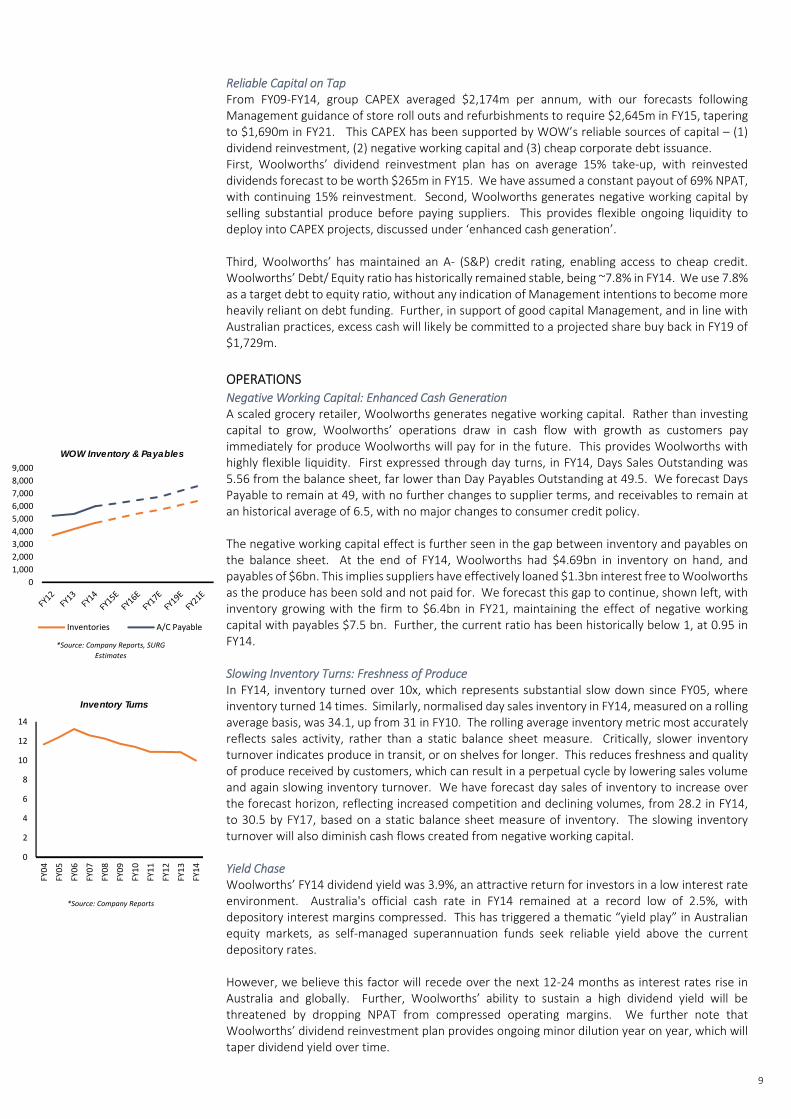
OPERATIONS Negative Working Capital: Enhanced Cash Generation A scaled grocery retailer, Woolworths generates negative working capital. Rather than investing capital to grow, Woolworths’ operations draw in cash flow with growth as customers pay immediately for produce Woolworths will pay for in the future. This provides Woolworths with highly flexible liquidity. First expressed through day turns, in FY14, Days Sales Outstanding was 5.56 from the balance sheet, far lower than Day Payables Outstanding at 49.5. We forecast Days Payable to remain at 49, with no further changes to supplier terms, and receivables to remain at an historical average of 6.5, with no major changes to consumer credit policy.
The negative working capital effect is further seen in the gap between inventory and payables on the balance sheet. At the end of FY14, Woolworths had $4.69bn in inventory on hand, and payables of $6bn. This implies suppliers have effectively loaned $1.3bn interest free to Woolworths as the produce has been sold and not paid for. We forecast this gap to continue, shown left, with inventory growing with the firm to $6.4bn in FY21, maintaining the effect of negative working capital with payables $7.5 bn. Further, the current ratio has been historically below 1, at 0.95 in FY14. Slowing Inventory Turns: Freshness of Produce In FY14, inventory turned over 10x, which represents substantial slow down since FY05, where inventory turned 14 times. Similarly, normalised day sales inventory in FY14, measured on a rolling average basis, was 34.1, up from 31 in FY10. The rolling average inventory metric most accurately reflects sales activity, rather than a static balance sheet measure. Critically, slower inventory turnover indicates produce in transit, or on shelves for longer. This reduces freshness and quality of produce received by customers, which can result in a perpetual cycle by lowering sales volume and again slowing inventory turnover. We have forecast day sales of inventory to increase over the forecast horizon, reflecting increased competition and declining volumes, from 28.2 in FY14, to 30.5 by FY17, based on a static balance sheet measure of inventory. The slowing inventory turnover will also diminish cash flows created from negative working capital. Yield Chase Woolworths’ FY14 dividend yield was 3.9%, an attractive return for investors in a low interest rate environment. Australia's official cash rate in FY14 remained at a record low of 2.5%, with depository interest margins compressed. This has triggered a thematic “yield play” in Australian equity markets, as self‐managed superannuation funds seek reliable yield above the current depository rates. However, we believe this factor will recede over the next 12‐24 months as interest rates rise in Australia and globally. Further, Woolworths’ ability to sustain a high dividend yield will be threatened by dropping NPAT from compressed operating margins. We further note that Woolworths’ dividend reinvestment plan provides ongoing minor dilution year on year, which will taper dividend yield over time.
*Source: Company Reports, SURG
Estimates
WOW Inventory & Payables
0
2
4
6
8
10
12
14
FY04
FY05
FY06
FY07
FY08
FY09
FY10
FY11
FY12
FY13
FY14
Inventory Turns
*Source: Company Reports
10
INVESTMENT RISKS
DOWNSIDE RISKS
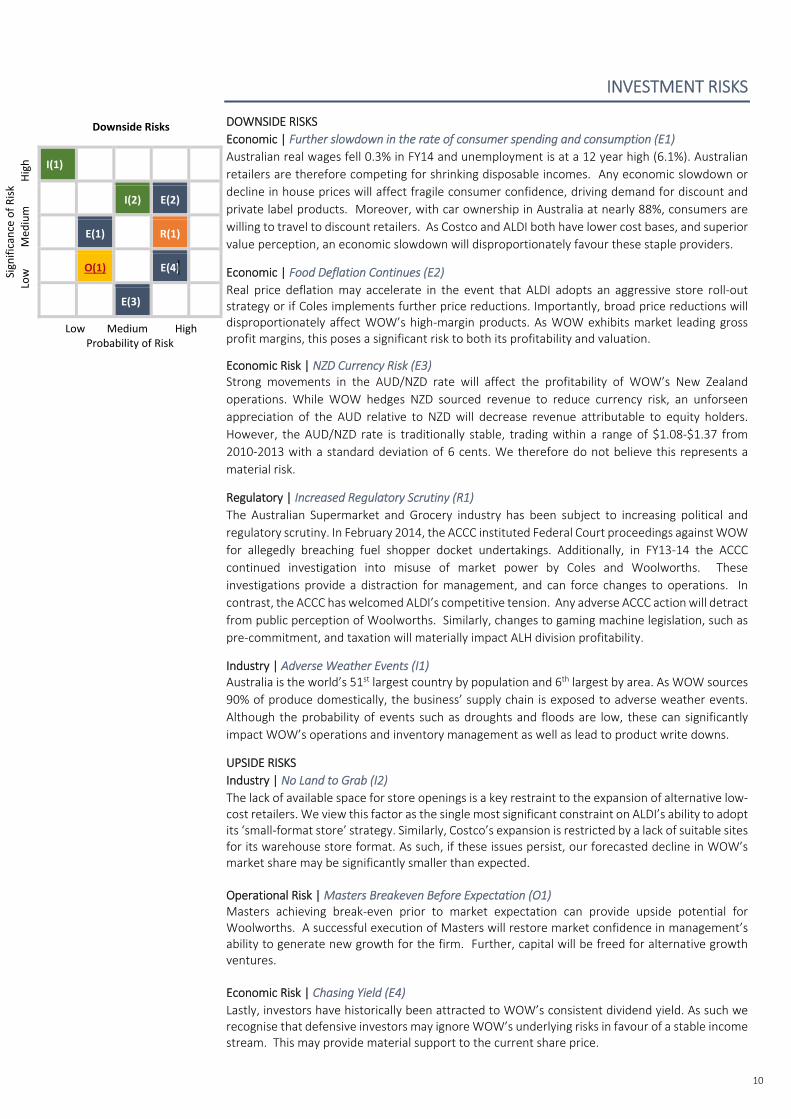
Economic | Further slowdown in the rate of consumer spending and consumption (E1)
Australian real wages fell 0.3% in FY14 and unemployment is at a 12 year high (6.1%). Australian
retailers are therefore competing for shrinking disposable incomes. Any economic slowdown or
decline in house prices will affect fragile consumer confidence, driving demand for discount and
private label products. Moreover, with car ownership in Australia at nearly 88%, consumers are
willing to travel to discount retailers. As Costco and ALDI both have lower cost bases, and superior
value perception, an economic slowdown will disproportionately favour these staple providers.
Economic | Food Deflation Continues (E2)
Real price deflation may accelerate in the event that ALDI adopts an aggressive store roll‐out strategy or if Coles implements further price reductions. Importantly, broad price reductions will disproportionately affect WOW’s high‐margin products. As WOW exhibits market leading gross profit margins, this poses a significant risk to both its profitability and valuation.
Economic Risk | NZD Currency Risk (E3) Strong movements in the AUD/NZD rate will affect the profitability of WOW’s New Zealand
operations. While WOW hedges NZD sourced revenue to reduce currency risk, an unforseen
appreciation of the AUD relative to NZD will decrease revenue attributable to equity holders.
However, the AUD/NZD rate is traditionally stable, trading within a range of $1.08‐$1.37 from
2010‐2013 with a standard deviation of 6 cents. We therefore do not believe this represents a
material risk.
Regulatory | Increased Regulatory Scrutiny (R1)
The Australian Supermarket and Grocery industry has been subject to increasing political and
regulatory scrutiny. In February 2014, the ACCC instituted Federal Court proceedings against WOW
for allegedly breaching fuel shopper docket undertakings. Additionally, in FY13‐14 the ACCC
continued investigation into misuse of market power by Coles and Woolworths. These
investigations provide a distraction for management, and can force changes to operations. In
contrast, the ACCC has welcomed ALDI’s competitive tension. Any adverse ACCC action will detract
from public perception of Woolworths. Similarly, changes to gaming machine legislation, such as
pre‐commitment, and taxation will materially impact ALH division profitability.
Industry | Adverse Weather Events (I1) Australia is the world’s 51st largest country by population and 6th largest by area. As WOW sources
90% of produce domestically, the business’ supply chain is exposed to adverse weather events.
Although the probability of events such as droughts and floods are low, these can significantly
impact WOW’s operations and inventory management as well as lead to product write downs.
UPSIDE RISKS
Industry | No Land to Grab (I2)
The lack of available space for store openings is a key restraint to the expansion of alternative low‐cost retailers. We view this factor as the single most significant constraint on ALDI’s ability to adopt its ‘small‐format store’ strategy. Similarly, Costco’s expansion is restricted by a lack of suitable sites for its warehouse store format. As such, if these issues persist, our forecasted decline in WOW’s market share may be significantly smaller than expected. Operational Risk | Masters Breakeven Before Expectation (O1) Masters achieving break‐even prior to market expectation can provide upside potential for Woolworths. A successful execution of Masters will restore market confidence in management’s ability to generate new growth for the firm. Further, capital will be freed for alternative growth ventures. Economic Risk | Chasing Yield (E4)
Lastly, investors have historically been attracted to WOW’s consistent dividend yield. As such we recognise that defensive investors may ignore WOW’s underlying risks in favour of a stable income stream. This may provide material support to the current share price.
Downside Risks
Significance of Risk
Low M
edium High
I(1) I)
R) I(2) E(2)
E1) E(1) R(1) (4)
O(1)
O(1) E(4)
I1) E(3)
Low Medium High Probability of Risk
11
APPENDIX 1: STATEMENT OF FINANCIAL POSITION
In AUD Millions FY13 FY14 FY15F FY16F FY17F FY18F FY19F FY20F FY21F
Cash and cash equivalents 849 923 702 756 930 1,438 942 967 1,680
Trade and other receivables 969 926 1,131 1,166 1,203 1,242 1,284 1,318 1,354
Inventories 4,205 4,693 5,068 5,407 5,673 5,855 6,056 6,213 6,382
Other financial assets 54 13 68 62 57 46 50 49 55
Assets held for Sale 149 621 168 ‐ ‐ ‐ ‐ ‐ ‐
Total Current Assets 6,226 7,175 7,136 7,391 7,863 8,581 8,332 8,547 9,471
Trade and other receivables 17 108 39 21 21 22 23 23 24
Other financial assets 360 305 332 318 325 322 324 323 323
Property, plant and equipment 9,246 9,601 11,167 12,204 12,941 13,609 14,134 14,602 15,010
Intangible assets 5,784 6,335 6,177 6,030 5,886 5,746 5,609 5,475 5,344
Deferred tax assets 618 682 677 649 629 615 606 605 616
Total Non‐Current assets 16,025 17,030 18,392 19,222 19,802 20,313 20,694 21,028 21,318
ASSETS 22,251 24,205 25,528 26,613 27,666 28,895 29,027 29,575 30,788
Accounts Payable 5,390 6,006 6,244 6,458 6,683 6,916 7,163 7,349 7,549
Borrowings 169 220 220 220 220 220 220 220 220
Current tax l iabil ities 193 159 233 223 216 212 208 208 212
Other financial l iabil ities 146 168 168 168 168 168 168 168 168
Provisions 967 1,005 1,045 1,086 1,129 1,173 1,220 1,268 1,318
Total Current Liabilities 6,866 7,558 7,909 8,155 8,416 8,689 8,979 9,213 9,466
Borrowings 4,283 4,136 4,048 3,874 3,684 3,684 4,312 3,684 3,684
Other financial l iabil ities 993 1,155 1,155 1,155 1,155 1,155 1,155 1,155 1,155
Provisions 550 567 586 605 624 645 665 687 709
Other 259 263 263 263 263 263 263 263 263
Total Non‐Current Liabilities 6,084 6,122 6,052 5,897 5,726 5,747 6,396 5,789 5,811
LIABILITIES 12,950 13,680 13,961 14,052 14,142 14,435 15,374 15,002 15,278
Issued capital 4,523 4,850 5,115 5,371 5,618 5,861 4,371 4,609 4,853
Shares held in trust (181) (219) (219) (219) (219) (219) (219) (219) (219)
Reserves 25 198 198 198 198 198 198 198 198
Retained earnings 4,661 5,423 6,199 6,938 7,653 8,347 9,030 9,712 10,406
Equity Attributable to Shareholders 9,028 10,253 11,294 12,288 13,251 14,187 13,380 14,301 15,238
Non‐controlling interests 272 273 273 273 273 273 273 273 273
Total Equity 9,301 10,525 11,567 12,561 13,523 14,460 13,653 14,573 15,511
12
APPENDIX 2: STATEMENT OF COMPREHENSIVE INCOME
APPENDIX 3: STATEMENT OF CASH FLOWS
In AUD Millions FY13 FY14 FY15F FY16F FY17F FY18F FY19F FY20F FY21F
Food and Liquor (Australia) 40,031 41,171 43,889 45,485 47,032 48,510 50,211 51,401 52,722
Food and Liquor (New Zealand) 4,600 5,186 4,711 4,892 5,059 5,244 5,407 5,544 5,685
Fuel 6,794 7,065 7,467 7,430 7,483 7,649 7,846 8,084 8,341
General Merchandise (Big W) 4,383 4,352 4,392 4,350 4,395 4,454 4,523 4,596 4,680
Hotels (ALH) 1,469 1,472 1,517 1,573 1,639 1,710 1,792 1,850 1,891
Home Improvement (Danks) 710 775 813 853 894 936 978 1,022 1,067
Home Improvement (Masters) 529 752 997 1,197 1,388 1,564 1,716 1,859 1,991
Sales 58,516 60,773 63,786 65,780 67,891 70,067 72,472 74,356 76,378
COGS (42,755) (44,295) (46,493) (48,085) (49,764) (51,499) (53,339) (54,726) (56,214)
Gross Profit 15,762 16,478 17,292 17,695 18,127 18,568 19,133 19,630 20,164
SG&A (9,379) (9,807) (10,269) (10,571) (10,897) (11,225) (11,596) (11,890) (12,198)
EBITDAR 6,383 6,670 7,023 7,124 7,230 7,343 7,537 7,740 7,966
Rent (1,764) (1,899) (2,076) (2,231) (2,389) (2,554) (2,722) (2,894) (3,074)
EBITDA 4,619 4,772 4,946 4,893 4,841 4,790 4,815 4,847 4,893
Depreciation (810) (816) (899) (1,012) (1,089) (1,150) (1,201) (1,244) (1,282)
Amortisation (155) (180) (158) (147) (144) (140) (137) (134) (131)
EBIT 3,653 3,776 3,889 3,734 3,609 3,500 3,477 3,469 3,480
Net Financing Cost (251) (219) (204) (201) (190) (157) (189) (187) (142)
Woolworths Notes interest (46) (41) (50) (46) (43) (40) (37) (33) (30)
Profit Before tax & significant items 3,356 3,515 3,636 3,487 3,376 3,303 3,252 3,248 3,308
Tax (997) (1,057) (1,091) (1,046) (1,013) (991) (975) (974) (992)
NPAT 2,359 2,459 2,545 2,441 2,363 2,312 2,276 2,274 2,316
Shares Outstanding at Period End (m) 1,237.4 1,248 1,256 1,263 1,270 1,277 1,234 1,241 1,248
Total Dividend/Share (Cents) 133.0 137 141 135 130 127 129 128 130
Total Dividend Paid (m) 1,645.7 1,710 1,769 1,702 1,648 1,618 1,593 1,592 1,621
Retained Earnings 713.4 749 776 739 715 694 683 682 695
Imputation credits (Fully Franked) 695.2 735 606 584 565 555 546 546 556
In AUD Millions FY13 FY14 FY15F FY16F FY17F FY18F FY19F FY20F FY21F
EBITDA 4,619 4,772 4,946 4,893 4,841 4,790 4,815 4,847 4,893
Financing Expense (298) (260) (254) (247) (233) (197) (225) (221) (172)
Tax Paid (997) (1,057) (1,091) (1,046) (1,013) (991) (975) (974) (992)
Change in Working Capital (601) 176 (355) (123) (81) 26 (3) (4) (12)
Net Cash Flows from Operating Activities 2,724 3,631 3,247 3,478 3,515 3,628 3,612 3,648 3,716
Total Capex (1,955) (1,899) (2,465) (2,049) (1,826) (1,818) (1,726) (1,712) (1,690)
Proceeds from Asset Sale ‐ ‐ 452 ‐ ‐ ‐ ‐ ‐ ‐
Net Cash Flows From Investing Activities (1,955) (1,899) (2,013) (2,049) (1,826) (1,818) (1,726) (1,712) (1,690)
Change in Existing Debt (295) (96) (495) (42) (42) (42) (42) (42) (42)
Financing Repayment/Addition 1,002 (180) 544 115 (72) 116 744 (516) 107
Distributions Paid (1,646) (1,710) (1,769) (1,702) (1,648) (1,618) (1,593) (1,592) (1,621)
Change in Equity 186 327 265 255 247 243 (1,490) 239 243
Net Cash Flows from Financing Activities (752) (1,659) (1,455) (1,374) (1,515) (1,302) (2,381) (1,911) (1,313)
Net increase in cash 16 73 (221) 55 174 508 (496) 24 713
Opening Cash 833 849 923 702 756 930 1,438 942 967
Net Change in Cash 16 73 (221) 55 174 508 (496) 24 713
Closing Cash 849 923 702 756 930 1,438 942 967 1,680
13
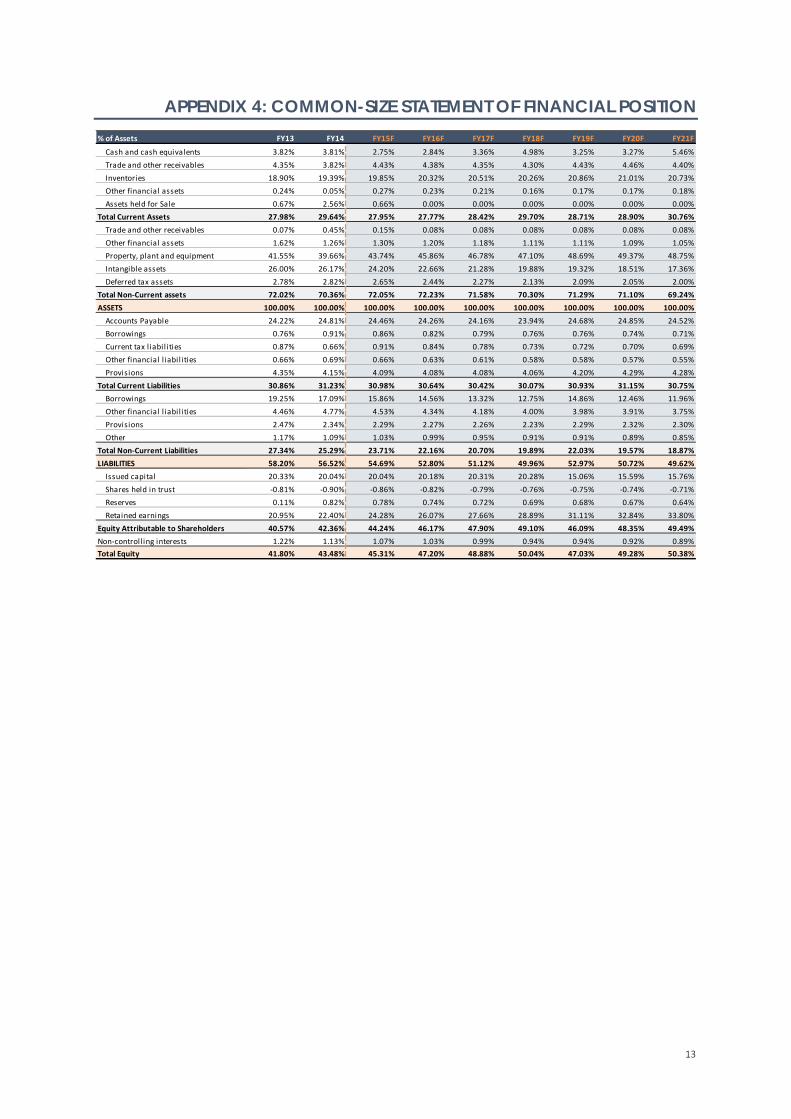
APPENDIX 4: COMMON-SIZE STATEMENT OF FINANCIAL POSITION
% of Assets FY13 FY14 FY15F FY16F FY17F FY18F FY19F FY20F FY21F
Cash and cash equivalents 3.82% 3.81% 2.75% 2.84% 3.36% 4.98% 3.25% 3.27% 5.46%
Trade and other receivables 4.35% 3.82% 4.43% 4.38% 4.35% 4.30% 4.43% 4.46% 4.40%
Inventories 18.90% 19.39% 19.85% 20.32% 20.51% 20.26% 20.86% 21.01% 20.73%
Other financial assets 0.24% 0.05% 0.27% 0.23% 0.21% 0.16% 0.17% 0.17% 0.18%
Assets held for Sale 0.67% 2.56% 0.66% 0.00% 0.00% 0.00% 0.00% 0.00% 0.00%
Total Current Assets 27.98% 29.64% 27.95% 27.77% 28.42% 29.70% 28.71% 28.90% 30.76%
Trade and other receivables 0.07% 0.45% 0.15% 0.08% 0.08% 0.08% 0.08% 0.08% 0.08%
Other financial assets 1.62% 1.26% 1.30% 1.20% 1.18% 1.11% 1.11% 1.09% 1.05%
Property, plant and equipment 41.55% 39.66% 43.74% 45.86% 46.78% 47.10% 48.69% 49.37% 48.75%
Intangible assets 26.00% 26.17% 24.20% 22.66% 21.28% 19.88% 19.32% 18.51% 17.36%
Deferred tax assets 2.78% 2.82% 2.65% 2.44% 2.27% 2.13% 2.09% 2.05% 2.00%
Total Non‐Current assets 72.02% 70.36% 72.05% 72.23% 71.58% 70.30% 71.29% 71.10% 69.24%
ASSETS 100.00% 100.00% 100.00% 100.00% 100.00% 100.00% 100.00% 100.00% 100.00%
Accounts Payable 24.22% 24.81% 24.46% 24.26% 24.16% 23.94% 24.68% 24.85% 24.52%
Borrowings 0.76% 0.91% 0.86% 0.82% 0.79% 0.76% 0.76% 0.74% 0.71%
Current tax l iabilities 0.87% 0.66% 0.91% 0.84% 0.78% 0.73% 0.72% 0.70% 0.69%
Other financial l iabilities 0.66% 0.69% 0.66% 0.63% 0.61% 0.58% 0.58% 0.57% 0.55%
Provisions 4.35% 4.15% 4.09% 4.08% 4.08% 4.06% 4.20% 4.29% 4.28%
Total Current Liabilities 30.86% 31.23% 30.98% 30.64% 30.42% 30.07% 30.93% 31.15% 30.75%
Borrowings 19.25% 17.09% 15.86% 14.56% 13.32% 12.75% 14.86% 12.46% 11.96%
Other financial l iabilities 4.46% 4.77% 4.53% 4.34% 4.18% 4.00% 3.98% 3.91% 3.75%
Provisions 2.47% 2.34% 2.29% 2.27% 2.26% 2.23% 2.29% 2.32% 2.30%
Other 1.17% 1.09% 1.03% 0.99% 0.95% 0.91% 0.91% 0.89% 0.85%
Total Non‐Current Liabilities 27.34% 25.29% 23.71% 22.16% 20.70% 19.89% 22.03% 19.57% 18.87%
LIABILITIES 58.20% 56.52% 54.69% 52.80% 51.12% 49.96% 52.97% 50.72% 49.62%
Issued capital 20.33% 20.04% 20.04% 20.18% 20.31% 20.28% 15.06% 15.59% 15.76%
Shares held in trust ‐0.81% ‐0.90% ‐0.86% ‐0.82% ‐0.79% ‐0.76% ‐0.75% ‐0.74% ‐0.71%
Reserves 0.11% 0.82% 0.78% 0.74% 0.72% 0.69% 0.68% 0.67% 0.64%
Retained earnings 20.95% 22.40% 24.28% 26.07% 27.66% 28.89% 31.11% 32.84% 33.80%
Equity Attributable to Shareholders 40.57% 42.36% 44.24% 46.17% 47.90% 49.10% 46.09% 48.35% 49.49%
Non‐controlling interests 1.22% 1.13% 1.07% 1.03% 0.99% 0.94% 0.94% 0.92% 0.89%
Total Equity 41.80% 43.48% 45.31% 47.20% 48.88% 50.04% 47.03% 49.28% 50.38%
14
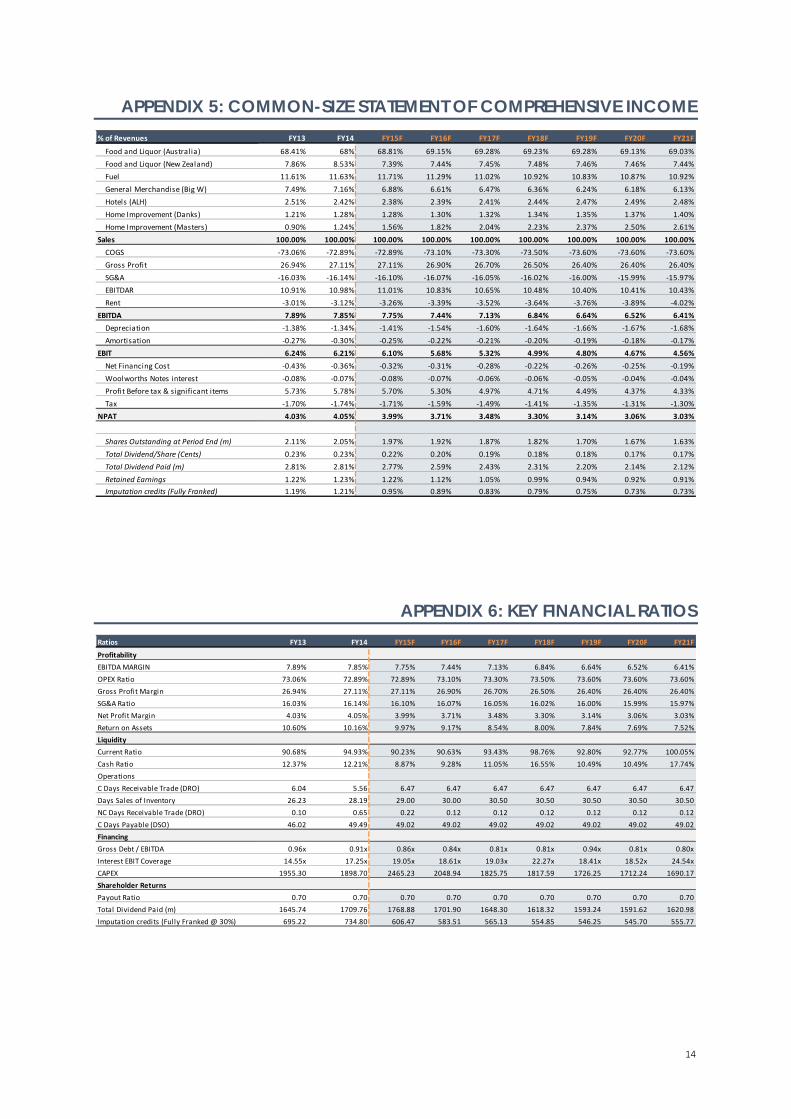
APPENDIX 5: COMMON-SIZE STATEMENT OF COMPREHENSIVE INCOME
APPENDIX 6: KEY FINANCIAL RATIOS
% of Revenues FY13 FY14 FY15F FY16F FY17F FY18F FY19F FY20F FY21F
Food and Liquor (Australia) 68.41% 68% 68.81% 69.15% 69.28% 69.23% 69.28% 69.13% 69.03%
Food and Liquor (New Zealand) 7.86% 8.53% 7.39% 7.44% 7.45% 7.48% 7.46% 7.46% 7.44%
Fuel 11.61% 11.63% 11.71% 11.29% 11.02% 10.92% 10.83% 10.87% 10.92%
General Merchandise (Big W) 7.49% 7.16% 6.88% 6.61% 6.47% 6.36% 6.24% 6.18% 6.13%
Hotels (ALH) 2.51% 2.42% 2.38% 2.39% 2.41% 2.44% 2.47% 2.49% 2.48%
Home Improvement (Danks) 1.21% 1.28% 1.28% 1.30% 1.32% 1.34% 1.35% 1.37% 1.40%
Home Improvement (Masters) 0.90% 1.24% 1.56% 1.82% 2.04% 2.23% 2.37% 2.50% 2.61%
Sales 100.00% 100.00% 100.00% 100.00% 100.00% 100.00% 100.00% 100.00% 100.00%
COGS ‐73.06% ‐72.89% ‐72.89% ‐73.10% ‐73.30% ‐73.50% ‐73.60% ‐73.60% ‐73.60%
Gross Profit 26.94% 27.11% 27.11% 26.90% 26.70% 26.50% 26.40% 26.40% 26.40%
SG&A ‐16.03% ‐16.14% ‐16.10% ‐16.07% ‐16.05% ‐16.02% ‐16.00% ‐15.99% ‐15.97%
EBITDAR 10.91% 10.98% 11.01% 10.83% 10.65% 10.48% 10.40% 10.41% 10.43%
Rent ‐3.01% ‐3.12% ‐3.26% ‐3.39% ‐3.52% ‐3.64% ‐3.76% ‐3.89% ‐4.02%
EBITDA 7.89% 7.85% 7.75% 7.44% 7.13% 6.84% 6.64% 6.52% 6.41%
Depreciation ‐1.38% ‐1.34% ‐1.41% ‐1.54% ‐1.60% ‐1.64% ‐1.66% ‐1.67% ‐1.68%
Amortisation ‐0.27% ‐0.30% ‐0.25% ‐0.22% ‐0.21% ‐0.20% ‐0.19% ‐0.18% ‐0.17%
EBIT 6.24% 6.21% 6.10% 5.68% 5.32% 4.99% 4.80% 4.67% 4.56%
Net Financing Cost ‐0.43% ‐0.36% ‐0.32% ‐0.31% ‐0.28% ‐0.22% ‐0.26% ‐0.25% ‐0.19%
Woolworths Notes interest ‐0.08% ‐0.07% ‐0.08% ‐0.07% ‐0.06% ‐0.06% ‐0.05% ‐0.04% ‐0.04%
Profit Before tax & significant items 5.73% 5.78% 5.70% 5.30% 4.97% 4.71% 4.49% 4.37% 4.33%
Tax ‐1.70% ‐1.74% ‐1.71% ‐1.59% ‐1.49% ‐1.41% ‐1.35% ‐1.31% ‐1.30%
NPAT 4.03% 4.05% 3.99% 3.71% 3.48% 3.30% 3.14% 3.06% 3.03%
Shares Outstanding at Period End (m) 2.11% 2.05% 1.97% 1.92% 1.87% 1.82% 1.70% 1.67% 1.63%
Total Dividend/Share (Cents) 0.23% 0.23% 0.22% 0.20% 0.19% 0.18% 0.18% 0.17% 0.17%
Total Dividend Paid (m) 2.81% 2.81% 2.77% 2.59% 2.43% 2.31% 2.20% 2.14% 2.12%
Retained Earnings 1.22% 1.23% 1.22% 1.12% 1.05% 0.99% 0.94% 0.92% 0.91%
Imputation credits (Fully Franked) 1.19% 1.21% 0.95% 0.89% 0.83% 0.79% 0.75% 0.73% 0.73%
Ratios FY13 FY14 FY15F FY16F FY17F FY18F FY19F FY20F FY21F
Profitability
EBITDA MARGIN 7.89% 7.85% 7.75% 7.44% 7.13% 6.84% 6.64% 6.52% 6.41%
OPEX Ratio 73.06% 72.89% 72.89% 73.10% 73.30% 73.50% 73.60% 73.60% 73.60%
Gross Profit Margin 26.94% 27.11% 27.11% 26.90% 26.70% 26.50% 26.40% 26.40% 26.40%
SG&A Ratio 16.03% 16.14% 16.10% 16.07% 16.05% 16.02% 16.00% 15.99% 15.97%
Net Profit Margin 4.03% 4.05% 3.99% 3.71% 3.48% 3.30% 3.14% 3.06% 3.03%
Return on Assets 10.60% 10.16% 9.97% 9.17% 8.54% 8.00% 7.84% 7.69% 7.52%
Liquidity
Current Ratio 90.68% 94.93% 90.23% 90.63% 93.43% 98.76% 92.80% 92.77% 100.05%
Cash Ratio 12.37% 12.21% 8.87% 9.28% 11.05% 16.55% 10.49% 10.49% 17.74%
Operations
C Days Receivable Trade (DRO) 6.04 5.56 6.47 6.47 6.47 6.47 6.47 6.47 6.47
Days Sales of Inventory 26.23 28.19 29.00 30.00 30.50 30.50 30.50 30.50 30.50
NC Days Receivable Trade (DRO) 0.10 0.65 0.22 0.12 0.12 0.12 0.12 0.12 0.12
C Days Payable (DSO) 46.02 49.49 49.02 49.02 49.02 49.02 49.02 49.02 49.02
Financing
Gross Debt / EBITDA 0.96x 0.91x 0.86x 0.84x 0.81x 0.81x 0.94x 0.81x 0.80x
Interest EBIT Coverage 14.55x 17.25x 19.05x 18.61x 19.03x 22.27x 18.41x 18.52x 24.54x
CAPEX 1955.30 1898.70 2465.23 2048.94 1825.75 1817.59 1726.25 1712.24 1690.17
Shareholder Returns
Payout Ratio 0.70 0.70 0.70 0.70 0.70 0.70 0.70 0.70 0.70
Total Dividend Paid (m) 1645.74 1709.76 1768.88 1701.90 1648.30 1618.32 1593.24 1591.62 1620.98
Imputation credits (Fully Franked @ 30%) 695.22 734.80 606.47 583.51 565.13 554.85 546.25 545.70 555.77
15
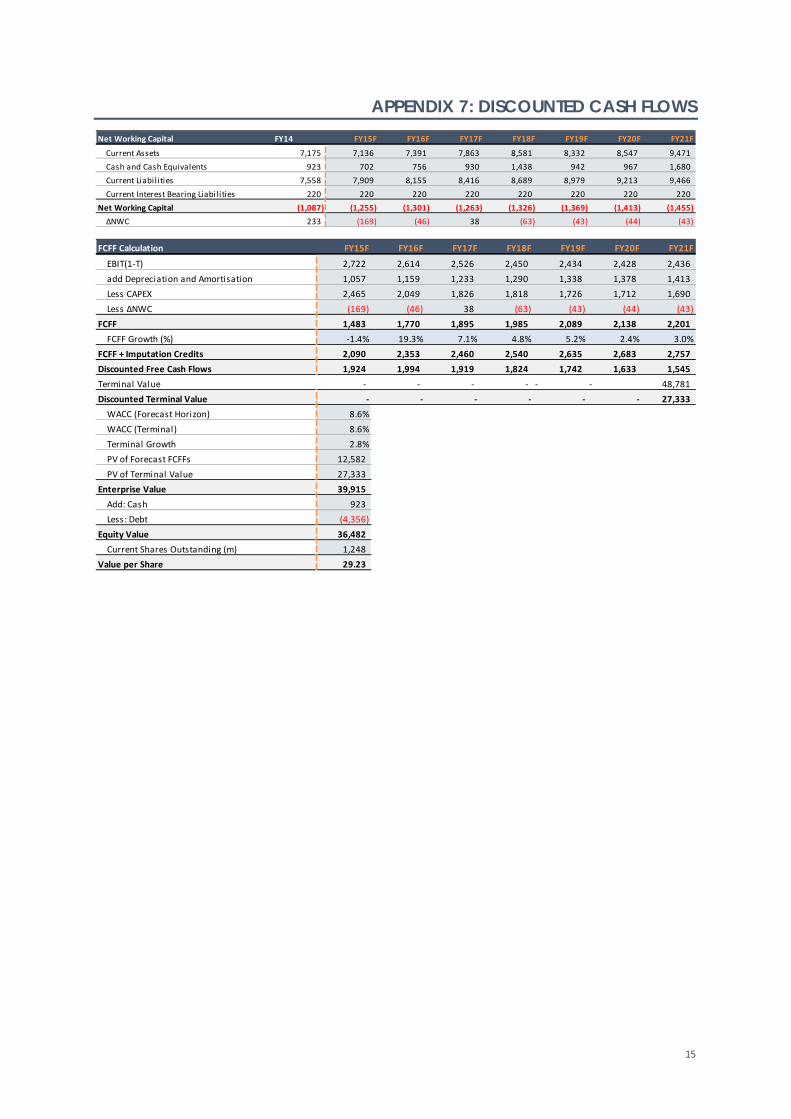
APPENDIX 7: DISCOUNTED CASH FLOWS
Net Working Capital FY14 FY15F FY16F FY17F FY18F FY19F FY20F FY21F
Current Assets 7,175 7,136 7,391 7,863 8,581 8,332 8,547 9,471
Cash and Cash Equivalents 923 702 756 930 1,438 942 967 1,680
Current Liabilities 7,558 7,909 8,155 8,416 8,689 8,979 9,213 9,466
Current Interest Bearing Liabilities 220 220 220 220 220 220 220 220
Net Working Capital (1,087) (1,255) (1,301) (1,263) (1,326) (1,369) (1,413) (1,455)
ΔNWC 233 (169) (46) 38 (63) (43) (44) (43)
FCFF Calculation FY15F FY16F FY17F FY18F FY19F FY20F FY21F
EBIT(1‐T) 2,722 2,614 2,526 2,450 2,434 2,428 2,436
add Depreciation and Amortisation 1,057 1,159 1,233 1,290 1,338 1,378 1,413
Less CAPEX 2,465 2,049 1,826 1,818 1,726 1,712 1,690
Less ΔNWC (169) (46) 38 (63) (43) (44) (43)
FCFF 1,483 1,770 1,895 1,985 2,089 2,138 2,201
FCFF Growth (%) ‐1.4% 19.3% 7.1% 4.8% 5.2% 2.4% 3.0%
FCFF + Imputation Credits 2,090 2,353 2,460 2,540 2,635 2,683 2,757
Discounted Free Cash Flows 1,924 1,994 1,919 1,824 1,742 1,633 1,545
Terminal Value ‐ ‐ ‐ ‐ ‐ ‐ 48,781
Discounted Terminal Value ‐ ‐ ‐ ‐ ‐ ‐ 27,333
WACC (Forecast Horizon) 8.6%
WACC (Terminal) 8.6%
Terminal Growth 2.8%
PV of Forecast FCFFs 12,582
PV of Terminal Value 27,333
Enterprise Value 39,915
Add: Cash 923
Less: Debt (4,356)
Equity Value 36,482
Current Shares Outstanding (m) 1,248
Value per Share 29.23
16
$25.02
$25.57
$25.46
$33.88
$34.70
$34.54
22.5 27.5 32.5
Relative Valuation
DCF Triangulation
Final Valuation
WOW Share Price ($A)
Valuation Triangulation
$29.27
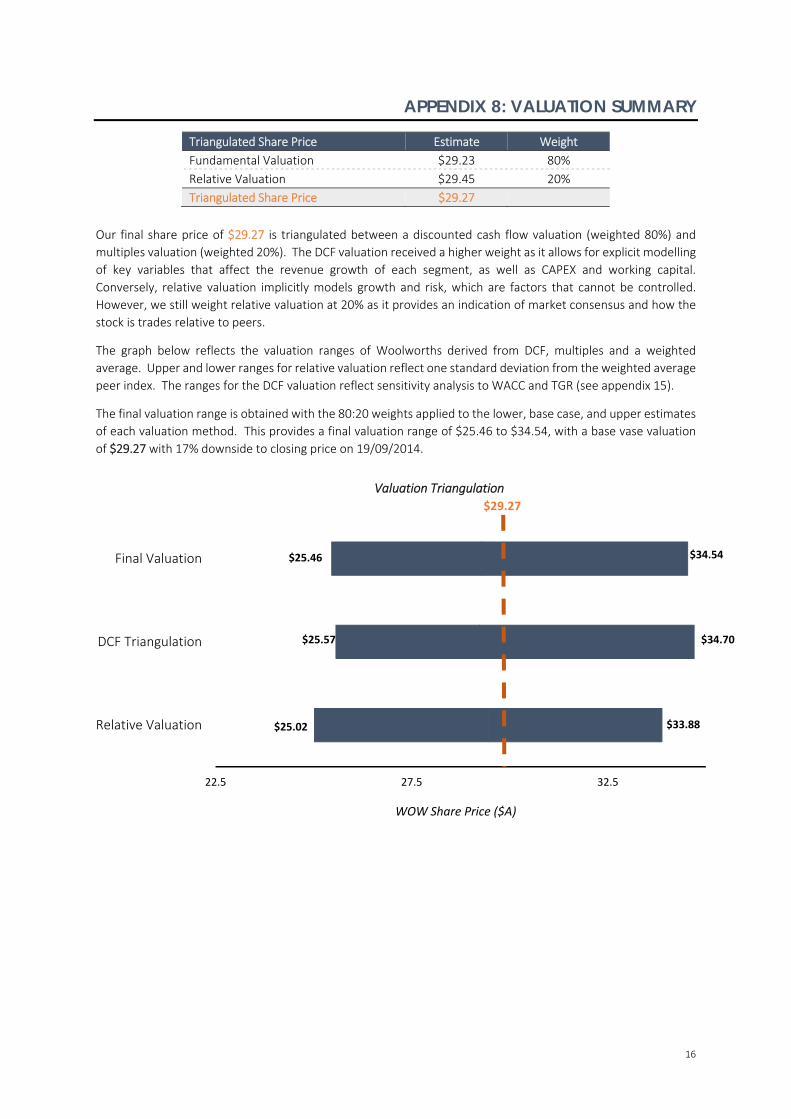
APPENDIX 8: VALUATION SUMMARY
Triangulated Share Price Estimate Weight
Fundamental Valuation $29.23 80%
Relative Valuation $29.45 20%
Triangulated Share Price $29.27
Our final share price of $29.27 is triangulated between a discounted cash flow valuation (weighted 80%) and
multiples valuation (weighted 20%). The DCF valuation received a higher weight as it allows for explicit modelling
of key variables that affect the revenue growth of each segment, as well as CAPEX and working capital.
Conversely, relative valuation implicitly models growth and risk, which are factors that cannot be controlled.
However, we still weight relative valuation at 20% as it provides an indication of market consensus and how the
stock is trades relative to peers.
The graph below reflects the valuation ranges of Woolworths derived from DCF, multiples and a weighted
average. Upper and lower ranges for relative valuation reflect one standard deviation from the weighted average
peer index. The ranges for the DCF valuation reflect sensitivity analysis to WACC and TGR (see appendix 15).
The final valuation range is obtained with the 80:20 weights applied to the lower, base case, and upper estimates
of each valuation method. This provides a final valuation range of $25.46 to $34.54, with a base vase valuation
of $29.27 with 17% downside to closing price on 19/09/2014.
17
APPENDIX 9: FINANCIAL ANALYSIS
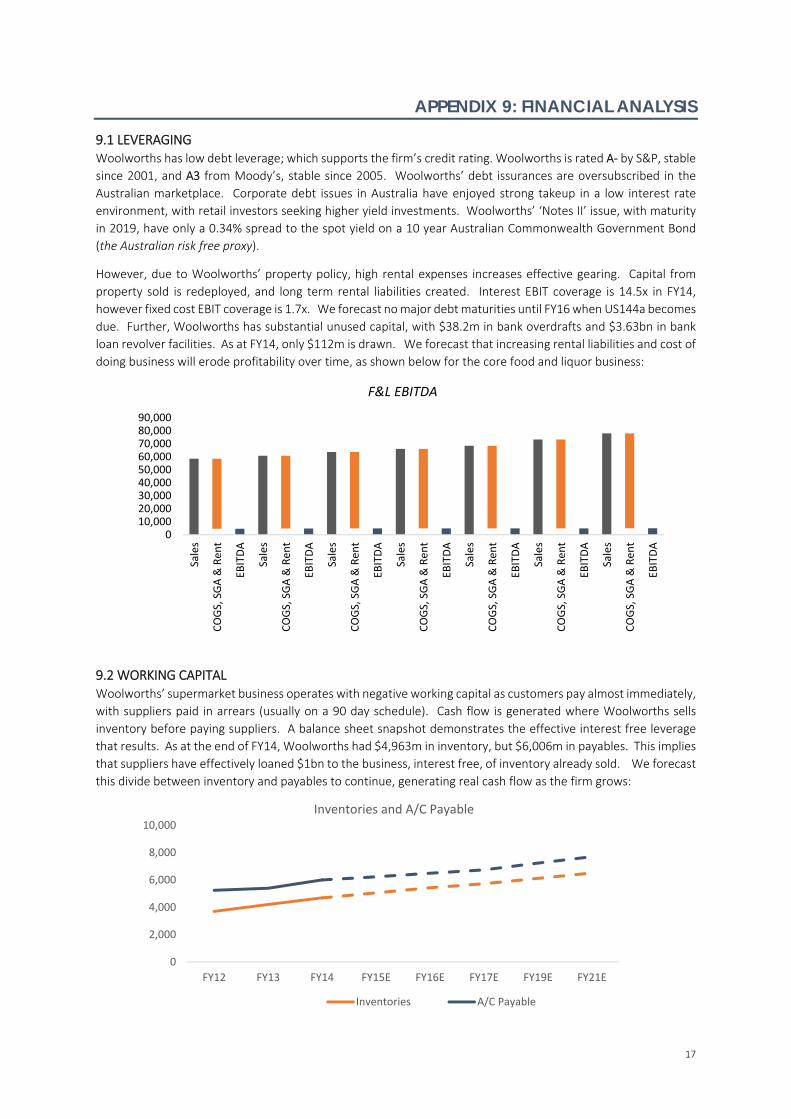
9.1 LEVERAGING Woolworths has low debt leverage; which supports the firm’s credit rating. Woolworths is rated A‐ by S&P, stable
since 2001, and A3 from Moody’s, stable since 2005. Woolworths’ debt issurances are oversubscribed in the
Australian marketplace. Corporate debt issues in Australia have enjoyed strong takeup in a low interest rate
environment, with retail investors seeking higher yield investments. Woolworths’ ‘Notes II’ issue, with maturity
in 2019, have only a 0.34% spread to the spot yield on a 10 year Australian Commonwealth Government Bond
(the Australian risk free proxy).
However, due to Woolworths’ property policy, high rental expenses increases effective gearing. Capital from
property sold is redeployed, and long term rental liabilities created. Interest EBIT coverage is 14.5x in FY14,
however fixed cost EBIT coverage is 1.7x. We forecast no major debt maturities until FY16 when US144a becomes
due. Further, Woolworths has substantial unused capital, with $38.2m in bank overdrafts and $3.63bn in bank
loan revolver facilities. As at FY14, only $112m is drawn. We forecast that increasing rental liabilities and cost of
doing business will erode profitability over time, as shown below for the core food and liquor business:
9.2 WORKING CAPITAL Woolworths’ supermarket business operates with negative working capital as customers pay almost immediately,
with suppliers paid in arrears (usually on a 90 day schedule). Cash flow is generated where Woolworths sells
inventory before paying suppliers. A balance sheet snapshot demonstrates the effective interest free leverage
that results. As at the end of FY14, Woolworths had $4,963m in inventory, but $6,006m in payables. This implies
that suppliers have effectively loaned $1bn to the business, interest free, of inventory already sold. We forecast
this divide between inventory and payables to continue, generating real cash flow as the firm grows:
0
2,000
4,000
6,000
8,000
10,000
FY12 FY13 FY14 FY15E FY16E FY17E FY19E FY21E
Inventories and A/C Payable
Inventories A/C Payable
010,00020,00030,00040,00050,00060,00070,00080,00090,000
Sales
COGS, SGA & Rent
EBITDA
Sales
COGS, SGA & Rent
EBITDA
Sales
COGS, SGA & Rent
EBITDA
Sales
COGS, SGA & Rent
EBITDA
Sales
COGS, SGA & Rent
EBITDA
Sales
COGS, SGA & Rent
EBITDA
Sales
COGS, SGA & Rent
EBITDA
F&L EBITDA
18
$10
$11
$12
$13
$14
$15
$16
$17
$18
10
510
1010
1510
2010
2510
3010
3510
07 08 09 10 11 12 13 14 15 16 17 18 19 20 21
Sales p/sqm $000
Area sqm '000
Area & Sales p/sqm
Total Area Sales per SQM
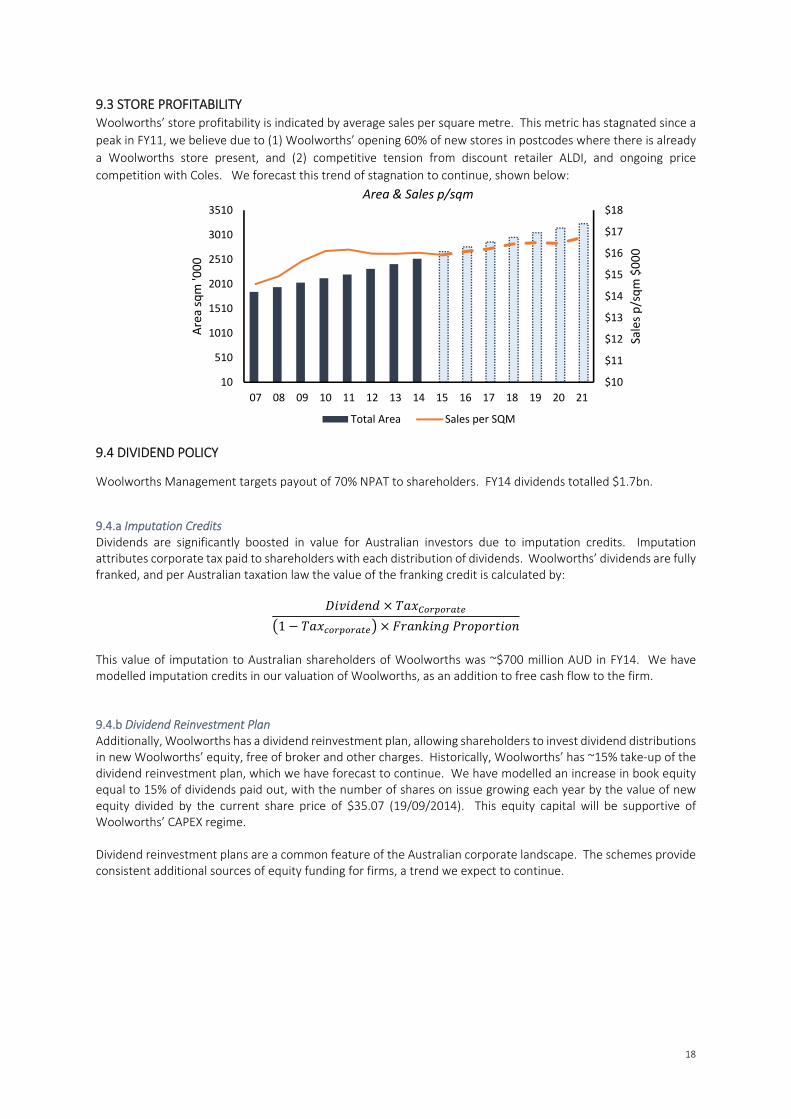
9.3 STORE PROFITABILITY Woolworths’ store profitability is indicated by average sales per square metre. This metric has stagnated since a
peak in FY11, we believe due to (1) Woolworths’ opening 60% of new stores in postcodes where there is already
a Woolworths store present, and (2) competitive tension from discount retailer ALDI, and ongoing price
competition with Coles. We forecast this trend of stagnation to continue, shown below:
9.4 DIVIDEND POLICY
Woolworths Management targets payout of 70% NPAT to shareholders. FY14 dividends totalled $1.7bn.
9.4.a Imputation Credits Dividends are significantly boosted in value for Australian investors due to imputation credits. Imputation attributes corporate tax paid to shareholders with each distribution of dividends. Woolworths’ dividends are fully franked, and per Australian taxation law the value of the franking credit is calculated by:
1
This value of imputation to Australian shareholders of Woolworths was ~$700 million AUD in FY14. We have modelled imputation credits in our valuation of Woolworths, as an addition to free cash flow to the firm. 9.4.b Dividend Reinvestment Plan Additionally, Woolworths has a dividend reinvestment plan, allowing shareholders to invest dividend distributions in new Woolworths’ equity, free of broker and other charges. Historically, Woolworths’ has ~15% take‐up of the dividend reinvestment plan, which we have forecast to continue. We have modelled an increase in book equity equal to 15% of dividends paid out, with the number of shares on issue growing each year by the value of new equity divided by the current share price of $35.07 (19/09/2014). This equity capital will be supportive of Woolworths’ CAPEX regime. Dividend reinvestment plans are a common feature of the Australian corporate landscape. The schemes provide consistent additional sources of equity funding for firms, a trend we expect to continue.
19
0%
1%
2%
3%
4%
5%
6%
7%
8%
9%
10%
‐
10,000
20,000
30,000
40,000
50,000
60,000
70,000
80,000
90,000
100,000
12 13 14 15F 16F 17F 19F 21F
EBITDA Margin
Sales COGS, SGA & Rent EBITDA Margin
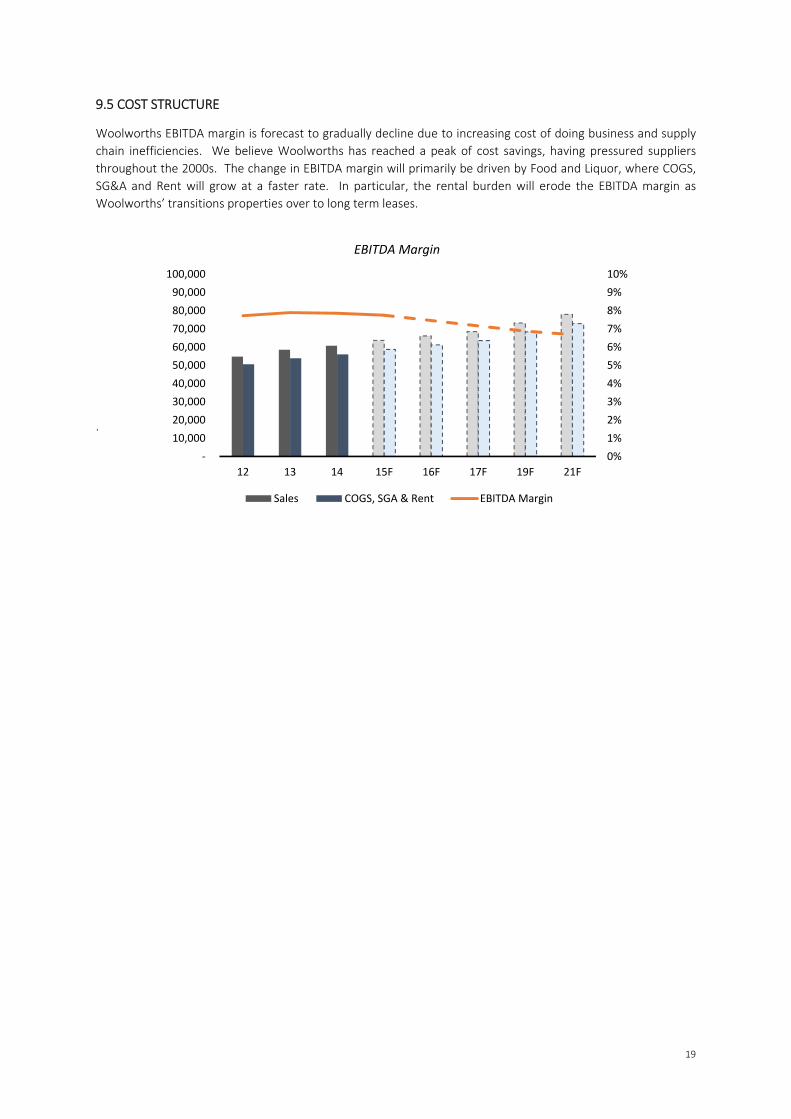
9.5 COST STRUCTURE
Woolworths EBITDA margin is forecast to gradually decline due to increasing cost of doing business and supply
chain inefficiencies. We believe Woolworths has reached a peak of cost savings, having pressured suppliers
throughout the 2000s. The change in EBITDA margin will primarily be driven by Food and Liquor, where COGS,
SG&A and Rent will grow at a faster rate. In particular, the rental burden will erode the EBITDA margin as
Woolworths’ transitions properties over to long term leases.
.
20
APPENDIX 10: DCF REVENUE ASSUMPTIONS
10.1 Food & Liquor
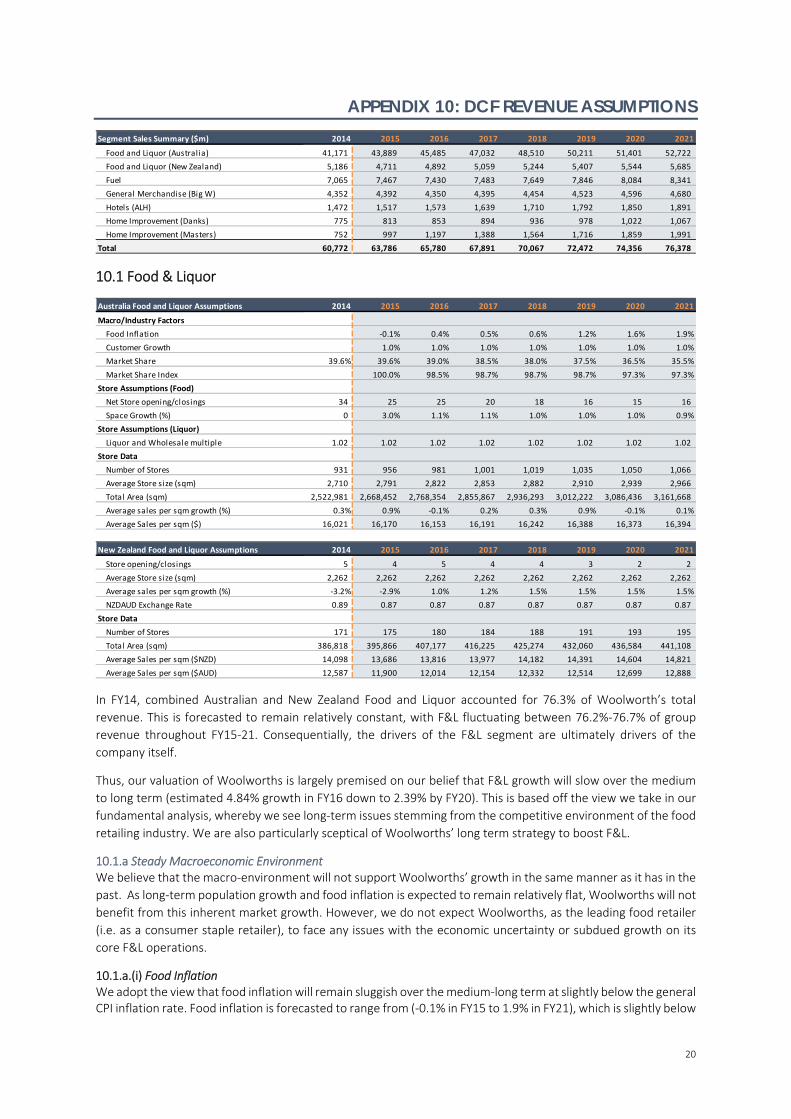
In FY14, combined Australian and New Zealand Food and Liquor accounted for 76.3% of Woolworth’s total
revenue. This is forecasted to remain relatively constant, with F&L fluctuating between 76.2%‐76.7% of group
revenue throughout FY15‐21. Consequentially, the drivers of the F&L segment are ultimately drivers of the
company itself.
Thus, our valuation of Woolworths is largely premised on our belief that F&L growth will slow over the medium
to long term (estimated 4.84% growth in FY16 down to 2.39% by FY20). This is based off the view we take in our
fundamental analysis, whereby we see long‐term issues stemming from the competitive environment of the food
retailing industry. We are also particularly sceptical of Woolworths’ long term strategy to boost F&L.
10.1.a Steady Macroeconomic Environment We believe that the macro‐environment will not support Woolworths’ growth in the same manner as it has in the
past. As long‐term population growth and food inflation is expected to remain relatively flat, Woolworths will not
benefit from this inherent market growth. However, we do not expect Woolworths, as the leading food retailer
(i.e. as a consumer staple retailer), to face any issues with the economic uncertainty or subdued growth on its
core F&L operations.
10.1.a.(i) Food Inflation We adopt the view that food inflation will remain sluggish over the medium‐long term at slightly below the general CPI inflation rate. Food inflation is forecasted to range from (‐0.1% in FY15 to 1.9% in FY21), which is slightly below
Segment Sales Summary ($m) 2014 2015 2016 2017 2018 2019 2020 2021
Food and Liquor (Australia) 41,171 43,889 45,485 47,032 48,510 50,211 51,401 52,722
Food and Liquor (New Zealand) 5,186 4,711 4,892 5,059 5,244 5,407 5,544 5,685
Fuel 7,065 7,467 7,430 7,483 7,649 7,846 8,084 8,341
General Merchandise (Big W) 4,352 4,392 4,350 4,395 4,454 4,523 4,596 4,680
Hotels (ALH) 1,472 1,517 1,573 1,639 1,710 1,792 1,850 1,891
Home Improvement (Danks) 775 813 853 894 936 978 1,022 1,067
Home Improvement (Masters) 752 997 1,197 1,388 1,564 1,716 1,859 1,991
Total 60,772 63,786 65,780 67,891 70,067 72,472 74,356 76,378
Australia Food and Liquor Assumptions 2014 2015 2016 2017 2018 2019 2020 2021
Macro/Industry Factors
Food Inflation ‐0.1% 0.4% 0.5% 0.6% 1.2% 1.6% 1.9%
Customer Growth 1.0% 1.0% 1.0% 1.0% 1.0% 1.0% 1.0%
Market Share 39.6% 39.6% 39.0% 38.5% 38.0% 37.5% 36.5% 35.5%
Market Share Index 100.0% 98.5% 98.7% 98.7% 98.7% 97.3% 97.3%
Store Assumptions (Food)
Net Store opening/closings 34 25 25 20 18 16 15 16
Space Growth (%) 0 3.0% 1.1% 1.1% 1.0% 1.0% 1.0% 0.9%
Store Assumptions (Liquor)
Liquor and Wholesale multiple 1.02 1.02 1.02 1.02 1.02 1.02 1.02 1.02
Store Data
Number of Stores 931 956 981 1,001 1,019 1,035 1,050 1,066
Average Store size (sqm) 2,710 2,791 2,822 2,853 2,882 2,910 2,939 2,966
Total Area (sqm) 2,522,981 2,668,452 2,768,354 2,855,867 2,936,293 3,012,222 3,086,436 3,161,668
Average sales per sqm growth (%) 0.3% 0.9% ‐0.1% 0.2% 0.3% 0.9% ‐0.1% 0.1%
Average Sales per sqm ($) 16,021 16,170 16,153 16,191 16,242 16,388 16,373 16,394
New Zealand Food and Liquor Assumptions 2014 2015 2016 2017 2018 2019 2020 2021
Store opening/closings 5 4 5 4 4 3 2 2
Average Store size (sqm) 2,262 2,262 2,262 2,262 2,262 2,262 2,262 2,262
Average sales per sqm growth (%) ‐3.2% ‐2.9% 1.0% 1.2% 1.5% 1.5% 1.5% 1.5%
NZDAUD Exchange Rate 0.89 0.87 0.87 0.87 0.87 0.87 0.87 0.87
Store Data
Number of Stores 171 175 180 184 188 191 193 195
Total Area (sqm) 386,818 395,866 407,177 416,225 425,274 432,060 436,584 441,108
Average Sales per sqm ($NZD) 14,098 13,686 13,816 13,977 14,182 14,391 14,604 14,821
Average Sales per sqm ($AUD) 12,587 11,900 12,014 12,154 12,332 12,514 12,699 12,888
21
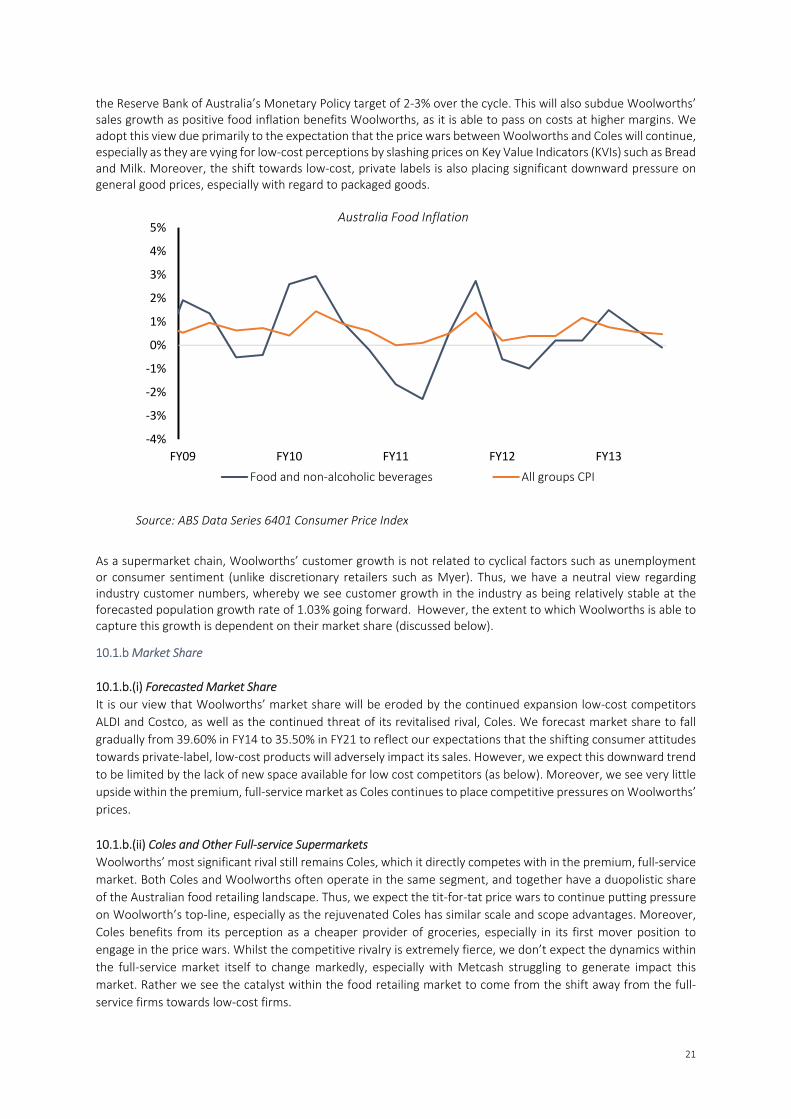
Source: ABS Data Series 6401 Consumer Price Index
the Reserve Bank of Australia’s Monetary Policy target of 2‐3% over the cycle. This will also subdue Woolworths’ sales growth as positive food inflation benefits Woolworths, as it is able to pass on costs at higher margins. We adopt this view due primarily to the expectation that the price wars between Woolworths and Coles will continue, especially as they are vying for low‐cost perceptions by slashing prices on Key Value Indicators (KVIs) such as Bread and Milk. Moreover, the shift towards low‐cost, private labels is also placing significant downward pressure on general good prices, especially with regard to packaged goods.
As a supermarket chain, Woolworths’ customer growth is not related to cyclical factors such as unemployment or consumer sentiment (unlike discretionary retailers such as Myer). Thus, we have a neutral view regarding industry customer numbers, whereby we see customer growth in the industry as being relatively stable at the forecasted population growth rate of 1.03% going forward. However, the extent to which Woolworths is able to capture this growth is dependent on their market share (discussed below).
10.1.b Market Share
10.1.b.(i) Forecasted Market Share
It is our view that Woolworths’ market share will be eroded by the continued expansion low‐cost competitors
ALDI and Costco, as well as the continued threat of its revitalised rival, Coles. We forecast market share to fall
gradually from 39.60% in FY14 to 35.50% in FY21 to reflect our expectations that the shifting consumer attitudes
towards private‐label, low‐cost products will adversely impact its sales. However, we expect this downward trend
to be limited by the lack of new space available for low cost competitors (as below). Moreover, we see very little
upside within the premium, full‐service market as Coles continues to place competitive pressures on Woolworths’
prices.
10.1.b.(ii) Coles and Other Full‐service Supermarkets
Woolworths’ most significant rival still remains Coles, which it directly competes with in the premium, full‐service
market. Both Coles and Woolworths often operate in the same segment, and together have a duopolistic share
of the Australian food retailing landscape. Thus, we expect the tit‐for‐tat price wars to continue putting pressure
on Woolworth’s top‐line, especially as the rejuvenated Coles has similar scale and scope advantages. Moreover,
Coles benefits from its perception as a cheaper provider of groceries, especially in its first mover position to
engage in the price wars. Whilst the competitive rivalry is extremely fierce, we don’t expect the dynamics within
the full‐service market itself to change markedly, especially with Metcash struggling to generate impact this
market. Rather we see the catalyst within the food retailing market to come from the shift away from the full‐
service firms towards low‐cost firms.
‐4%
‐3%
‐2%
‐1%
0%
1%
2%
3%
4%
5%
FY09 FY10 FY11 FY12 FY13
Australia Food Inflation
Food and non‐alcoholic beverages All groups CPI
22
10.1.b.(iii) Changing Industry Dynamics
Our view is that the greatest threat to Woolworths’ F&L growth is the continued acceptance by consumers of
low‐cost private label products. With private labels forecasted to rise to account for approximately 40‐50% of
total supermarket sales by 2020 (up from 25% in 2009), we don’t believe that Woolworths will be able to meet
these changes. Instead, we believe that this trend will adversely impact Woolworths, as it is unable to compete
with ALDI on price, due largely to the different distribution systems and store formats. As Woolworths’ model is
not focussed on having a single private‐label brand, we expect it to struggle in capturing the post‐GFC shift
towards cheaper groceries. Similarly, the expansion of American Retailer Costco will also eat into Woolworths’
revenue. We also see a slight shift in the upper‐end market towards restaurants and cafes, as consumers are
increasingly dining out as their net disposable incomes increases. Thus, we do not believe that Woolworths will
be able to adequately position themselves in the changing F&L space.
10.1.b.(iv) Land Issues
Whilst we take a negative view on Woolworths in light of these industry shifts, we also believe that a lack of
available space for store openings is a key restraint to the expansion of alternative low‐cost retailers. The lack of
suitable space, due primarily to the reluctance of Local and State Governments to change zoning laws, in allowing
urban centres to be used for commercial use, is limiting ALDI’s ability to adopt its ‘small‐format store’ strategy.
This is best highlighted by ALDI only being open 94 stores in Victoria despite identifying 160 possible opportunities. Similarly, the expansion of Costco is also restricted by the lack of suitable sites for its warehouse store format. As
such, we view this as the single most significant brake on ALDI and Costco’s expansion such that they drop in
market share will be significantly smaller than if it had full access to land.
10.1.c Contradicting Store Efficiency Vs Rollouts
10.1.c.(i) Average Sales p/sqm vs. Store Rollouts
Our main concern regarding Woolworths is with regards to its strategy in underpinning top‐line growth through
continued rollouts of new stores. Woolworths has indicated their intention to open 25 stores in FY14 before
maintaining a store‐opening rate of approximately 16‐17 stores per year. Whilst this does will inherently increase
revenue, as there is greater footprint space, we believe that these rollouts are limited in effectiveness as there
will be declining store efficiency.
This is because the market is relatively saturated, whereby Woolworths, as a market leader, already has a
presence in most catchment areas across Australia. Thus we forecast a drop in average sales p/sqm as sales per
square metre growth will drop from 0.93% in FY15, to 0.13% by FY21 as Woolworths increasingly cannibalises its
existing stores over the long term.
10.1.c.(ii) Store Sizes Woolworths has indicated its intention to grow its average store size in order to expand its product offerings, and
differentiate itself from traditional food retailing. As such, we forecast space to grow by 3% in FY15 (in‐line with
Management guidance) before falling to 0.9% in FY21, as this strategy is increasingly implemented. In addition
to our negative opinion of Woolworths’ store rollout program, we also believe that its strategy of increasing store
sizes/footprint will similarly lead to store inefficiencies. In particular, Woolworths is targeting a strategy of offering
a diversified service offering through Barista and ‘Food‐Court’ services at some of its flagship stores. We believe
that this is indicative of Woolworths moving away from its core operational focus of traditional food retailing.
10.1.c.(iii) Dark Stores Woolworths has recently announced the opening of its first ‘dark store’ in Mascot, Sydney, a 7000m2 warehouse
that is dedicated exclusively to catering for online sales. We expect these stores to generate cost savings and
efficiency improvements, as these stores are specially formatted to facilitate quick order execution and delivery.
Moreover, we expect there to be minor boosts to sales as customers are now able to arrange for more flexible
delivery times, as well as access to a greater range of products (as suburban stores often exhaust inventory at
peak times).
23
However, despite these improvements, we do not believe that these stores will materially drive growth over the
long term. First, we do not believe that these dark stores will materially increase the number of customers
shopping on Woolworths online. In particular, we see the sales generated by the dark store as purely redirecting
online sales from local suburban stores towards the dedicated dark store. Moreover, we do not believe that
consumers are more likely to purchase from Woolworths Online because of these dark stores. Purchasing
groceries online is a materially different proposition to regular retailing, with online food and liquor retailing only
accounting for 2% of total online sales. We see customer preferences with regard to online food retailing being
somewhat more conservative, relative to other types of online retailing such as clothing.
10.1.d New Zealand (Countdown)
We take the view that Woolworths’ Subsidiary, Progressive, will see a shrink in revenue in FY15, as the market
conditions remain extremely challenging. Despite the relative success of the ‘Price Lockdown’ marketing
campaign, we believe that the strategic positioning of Progressive’s main rival Foodstuffs (who own New World
and Pak’n Save), will erode into comparable store sales. In particular, we expect this trend to continue with
average sales p.sqm falling ‐2.92% in FY15 before improving gradually to 1.48% in FY21.This reflects our
understanding of the highly concentrated New Zealand market where Foodstuffs ownership of Pak’n Save
(discount grocer) and New World (full‐service grocer) places Countdown in the position where it will struggle to
differentiate itself within a particular market segment. Moreover, the potential entrance of ALDI into the New
Zealand is also a significant long term risk. Finally, we believe that the New Zealand dollar, which will come down
from its historical highs will further detract from the small growth that it was able to earn last year.
10.1.e In Depth Study: Tesco, United Kingdom We look to the United Kingdom for guidance on the progression of supermarkets in Australia, particularly the
changes to Tesco’s business. We believe that Tesco is an appropriate case study for Woolworths, being the
United Kingdom’s largest grocer, stocking a full‐range of SKUs in medium format stores. Tesco’s decline in
profitability precipitated by the entry of discount retailers is concerning for the Woolworths business, as
Australia normally follows international trends on delay.
10.1.e.(i) History
In the 1990s and 2000s, the ‘Big 4’ (Tesco, Sainsbury, Asda & Morrisons) all significantly expanded floor space
in the UK. Tesco quadrupled store count from 2000‐2014, gaining significant market share. Tesco became
the largest grocery retailer in the UK.
However Tesco’s market share has been in decline since 2007. The Global Financial Crisis prompted
consumers to shift to discount retailers, particularly due to bifurcation between high and low income
households. This was a boost for true premium service offerings such as Waitrose and Marks & Spencer, as
well as discounters ALDI and Lidl; but bad news for middle‐ground retailer Tesco.
10.1.e.(ii) Price Competition
Fundamentally, Tesco’s ability to compete with discount retailers was severely restricted by its exposure to
large format stores, and premium range of products. Fragmentation of shopping in the UK between smaller
retailers has decreased the effectiveness of large format stores. Similarly, Woolworths’ store format, and
premium range delivers inferior price perception to discount retailers. In the UK, Tesco has had negative like‐
for‐like growth, and has been forced to cut broad levels of prices, investing in a “fuel save” program, and
reducing online delivery fees (£1 per delivery).
10.1.e.(iii) FY14 Update As of 2014, Tesco is focussing on price investment and further cost cutting. FY14 results saw like‐for‐like sales down ~3% yoy. Management has attributed the decline to increased competition from the discounters. Throughout 2014, Tesco’s market share has continued to decline, falling from 30.7% to 28.96% in 3 years. Discount operator Lidl is opening 20 stores per annum in the UK, up from 12 in 2013, increasing discounter pressure on Tesco.
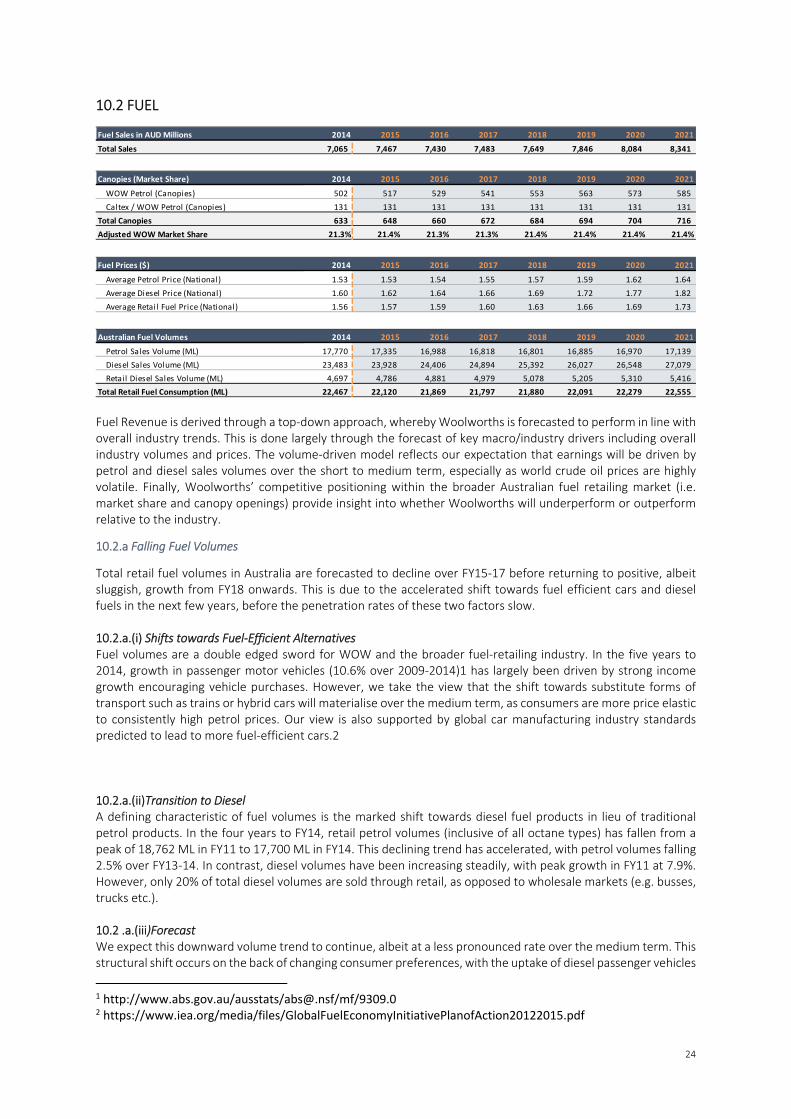
24
10.2 FUEL
Fuel Revenue is derived through a top‐down approach, whereby Woolworths is forecasted to perform in line with overall industry trends. This is done largely through the forecast of key macro/industry drivers including overall industry volumes and prices. The volume‐driven model reflects our expectation that earnings will be driven by petrol and diesel sales volumes over the short to medium term, especially as world crude oil prices are highly volatile. Finally, Woolworths’ competitive positioning within the broader Australian fuel retailing market (i.e. market share and canopy openings) provide insight into whether Woolworths will underperform or outperform relative to the industry.
10.2.a Falling Fuel Volumes
Total retail fuel volumes in Australia are forecasted to decline over FY15‐17 before returning to positive, albeit sluggish, growth from FY18 onwards. This is due to the accelerated shift towards fuel efficient cars and diesel fuels in the next few years, before the penetration rates of these two factors slow. 10.2.a.(i) Shifts towards Fuel‐Efficient Alternatives Fuel volumes are a double edged sword for WOW and the broader fuel‐retailing industry. In the five years to 2014, growth in passenger motor vehicles (10.6% over 2009‐2014)1 has largely been driven by strong income growth encouraging vehicle purchases. However, we take the view that the shift towards substitute forms of transport such as trains or hybrid cars will materialise over the medium term, as consumers are more price elastic to consistently high petrol prices. Our view is also supported by global car manufacturing industry standards predicted to lead to more fuel‐efficient cars.2 10.2.a.(ii)Transition to Diesel A defining characteristic of fuel volumes is the marked shift towards diesel fuel products in lieu of traditional petrol products. In the four years to FY14, retail petrol volumes (inclusive of all octane types) has fallen from a peak of 18,762 ML in FY11 to 17,700 ML in FY14. This declining trend has accelerated, with petrol volumes falling 2.5% over FY13‐14. In contrast, diesel volumes have been increasing steadily, with peak growth in FY11 at 7.9%. However, only 20% of total diesel volumes are sold through retail, as opposed to wholesale markets (e.g. busses, trucks etc.). 10.2 .a.(iii)Forecast We expect this downward volume trend to continue, albeit at a less pronounced rate over the medium term. This structural shift occurs on the back of changing consumer preferences, with the uptake of diesel passenger vehicles
1 http://www.abs.gov.au/ausstats/[email protected]/mf/9309.0 2 https://www.iea.org/media/files/GlobalFuelEconomyInitiativePlanofAction20122015.pdf
Fuel Sales in AUD Millions 2014 2015 2016 2017 2018 2019 2020 2021
Total Sales 7,065 7,467 7,430 7,483 7,649 7,846 8,084 8,341
Canopies (Market Share) 2014 2015 2016 2017 2018 2019 2020 2021
WOW Petrol (Canopies) 502 517 529 541 553 563 573 585
Caltex / WOW Petrol (Canopies) 131 131 131 131 131 131 131 131
Total Canopies 633 648 660 672 684 694 704 716
Adjusted WOW Market Share 21.3% 21.4% 21.3% 21.3% 21.4% 21.4% 21.4% 21.4%
Fuel Prices ($) 2014 2015 2016 2017 2018 2019 2020 2021
Average Petrol Price (National) 1.53 1.53 1.54 1.55 1.57 1.59 1.62 1.64
Average Diesel Price (National) 1.60 1.62 1.64 1.66 1.69 1.72 1.77 1.82
Average Retail Fuel Price (National) 1.56 1.57 1.59 1.60 1.63 1.66 1.69 1.73
Australian Fuel Volumes 2014 2015 2016 2017 2018 2019 2020 2021
Petrol Sales Volume (ML) 17,770 17,335 16,988 16,818 16,801 16,885 16,970 17,139
Diesel Sales Volume (ML) 23,483 23,928 24,406 24,894 25,392 26,027 26,548 27,079
Retail Diesel Sales Volume (ML) 4,697 4,786 4,881 4,979 5,078 5,205 5,310 5,416
Total Retail Fuel Consumption (ML) 22,467 22,120 21,869 21,797 21,880 22,091 22,279 22,555
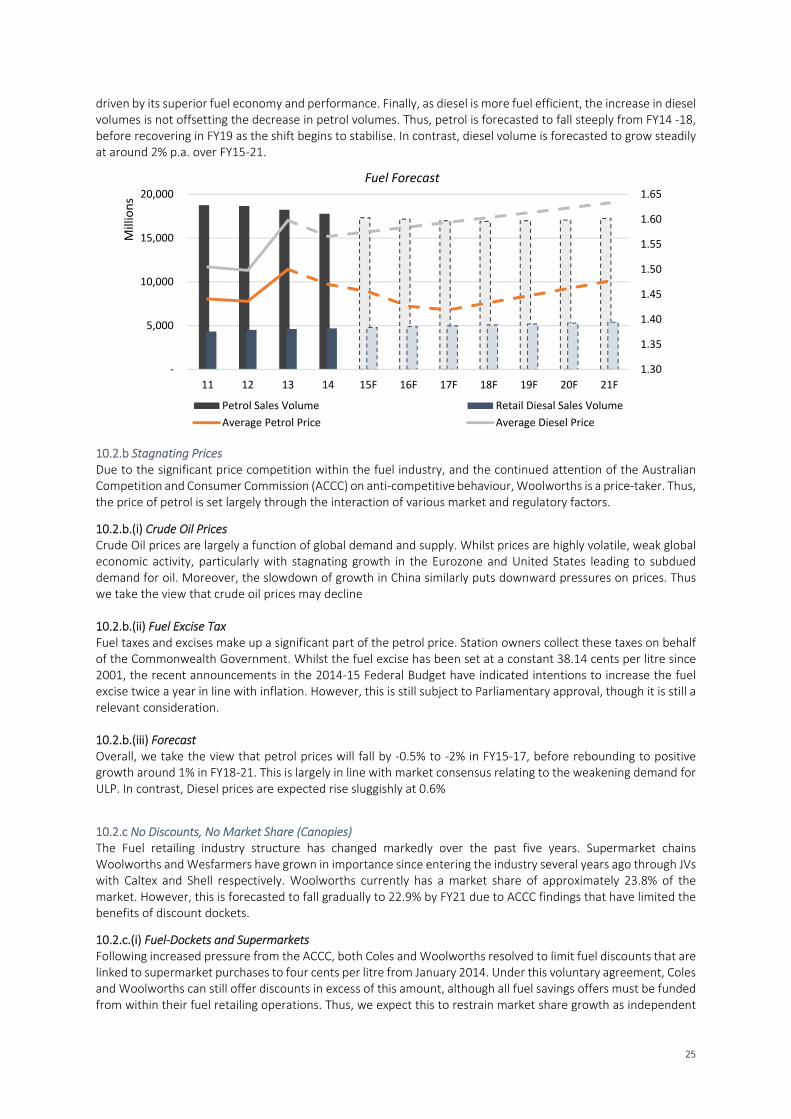
25
driven by its superior fuel economy and performance. Finally, as diesel is more fuel efficient, the increase in diesel volumes is not offsetting the decrease in petrol volumes. Thus, petrol is forecasted to fall steeply from FY14 ‐18, before recovering in FY19 as the shift begins to stabilise. In contrast, diesel volume is forecasted to grow steadily at around 2% p.a. over FY15‐21.
10.2.b Stagnating Prices Due to the significant price competition within the fuel industry, and the continued attention of the Australian Competition and Consumer Commission (ACCC) on anti‐competitive behaviour, Woolworths is a price‐taker. Thus, the price of petrol is set largely through the interaction of various market and regulatory factors.
10.2.b.(i) Crude Oil Prices Crude Oil prices are largely a function of global demand and supply. Whilst prices are highly volatile, weak global economic activity, particularly with stagnating growth in the Eurozone and United States leading to subdued demand for oil. Moreover, the slowdown of growth in China similarly puts downward pressures on prices. Thus we take the view that crude oil prices may decline 10.2.b.(ii) Fuel Excise Tax Fuel taxes and excises make up a significant part of the petrol price. Station owners collect these taxes on behalf of the Commonwealth Government. Whilst the fuel excise has been set at a constant 38.14 cents per litre since 2001, the recent announcements in the 2014‐15 Federal Budget have indicated intentions to increase the fuel excise twice a year in line with inflation. However, this is still subject to Parliamentary approval, though it is still a relevant consideration. 10.2.b.(iii) Forecast Overall, we take the view that petrol prices will fall by ‐0.5% to ‐2% in FY15‐17, before rebounding to positive growth around 1% in FY18‐21. This is largely in line with market consensus relating to the weakening demand for ULP. In contrast, Diesel prices are expected rise sluggishly at 0.6%
10.2.c No Discounts, No Market Share (Canopies) The Fuel retailing industry structure has changed markedly over the past five years. Supermarket chains Woolworths and Wesfarmers have grown in importance since entering the industry several years ago through JVs with Caltex and Shell respectively. Woolworths currently has a market share of approximately 23.8% of the market. However, this is forecasted to fall gradually to 22.9% by FY21 due to ACCC findings that have limited the benefits of discount dockets.
10.2.c.(i) Fuel‐Dockets and Supermarkets Following increased pressure from the ACCC, both Coles and Woolworths resolved to limit fuel discounts that are linked to supermarket purchases to four cents per litre from January 2014. Under this voluntary agreement, Coles and Woolworths can still offer discounts in excess of this amount, although all fuel savings offers must be funded from within their fuel retailing operations. Thus, we expect this to restrain market share growth as independent
1.30
1.35
1.40
1.45
1.50
1.55
1.60
1.65
‐
5,000
10,000
15,000
20,000
11 12 13 14 15F 16F 17F 18F 19F 20F 21F
Millions
Fuel Forecast
Petrol Sales Volume Retail Diesal Sales Volume
Average Petrol Price Average Diesel Price
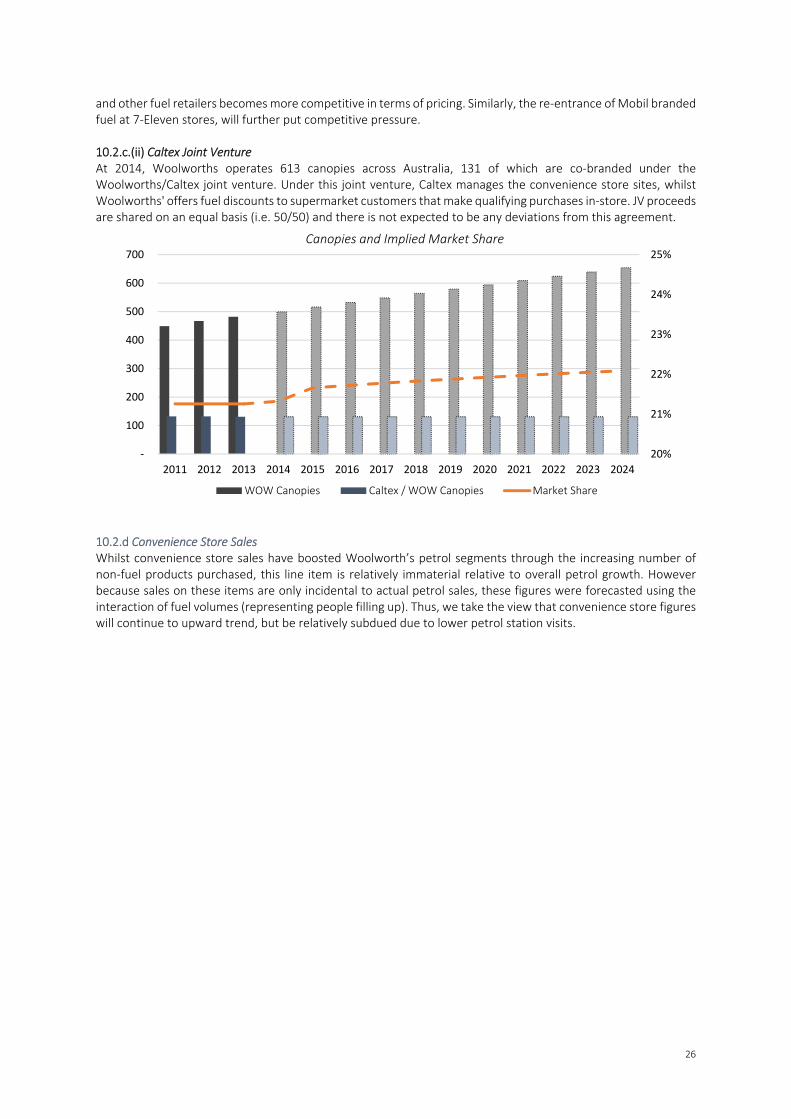
26
and other fuel retailers becomes more competitive in terms of pricing. Similarly, the re‐entrance of Mobil branded fuel at 7‐Eleven stores, will further put competitive pressure. 10.2.c.(ii) Caltex Joint Venture At 2014, Woolworths operates 613 canopies across Australia, 131 of which are co‐branded under the Woolworths/Caltex joint venture. Under this joint venture, Caltex manages the convenience store sites, whilst Woolworths' offers fuel discounts to supermarket customers that make qualifying purchases in‐store. JV proceeds are shared on an equal basis (i.e. 50/50) and there is not expected to be any deviations from this agreement.
10.2.d Convenience Store Sales Whilst convenience store sales have boosted Woolworth’s petrol segments through the increasing number of non‐fuel products purchased, this line item is relatively immaterial relative to overall petrol growth. However because sales on these items are only incidental to actual petrol sales, these figures were forecasted using the interaction of fuel volumes (representing people filling up). Thus, we take the view that convenience store figures will continue to upward trend, but be relatively subdued due to lower petrol station visits.
20%
21%
22%
23%
24%
25%
‐
100
200
300
400
500
600
700
2011 2012 2013 2014 2015 2016 2017 2018 2019 2020 2021 2022 2023 2024
Canopies and Implied Market Share
WOW Canopies Caltex / WOW Canopies Market Share
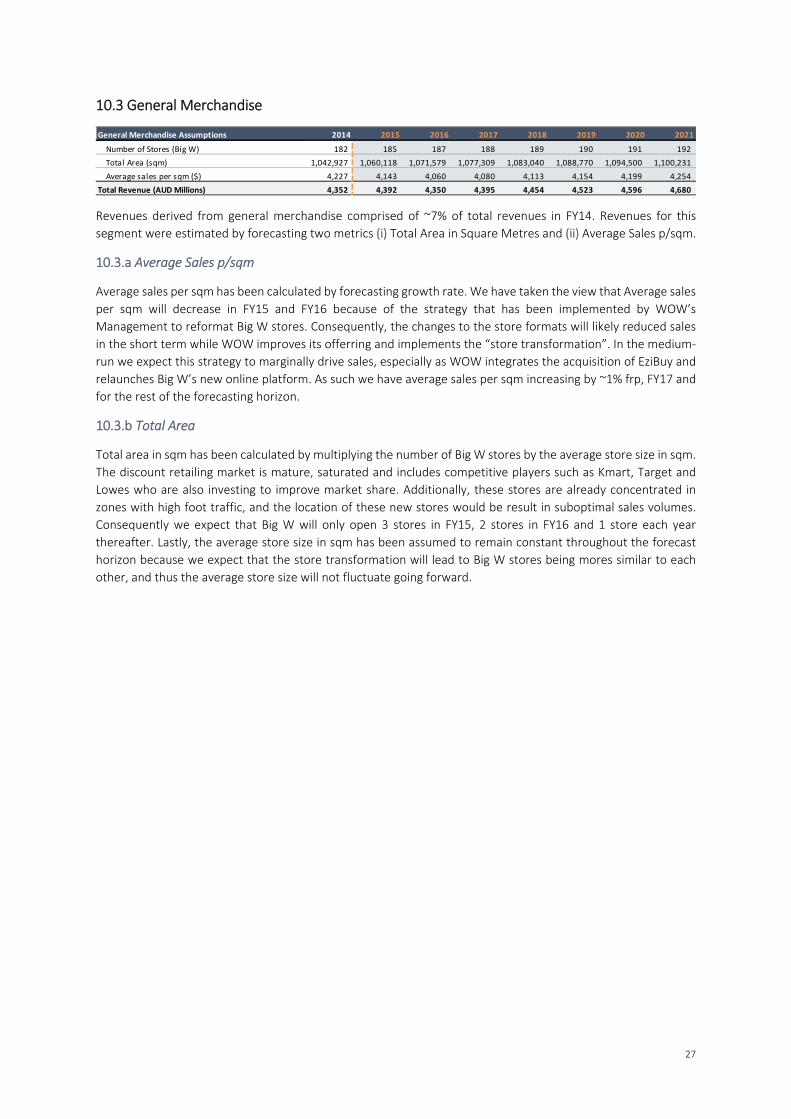
27
10.3 General Merchandise
Revenues derived from general merchandise comprised of ~7% of total revenues in FY14. Revenues for this
segment were estimated by forecasting two metrics (i) Total Area in Square Metres and (ii) Average Sales p/sqm.
10.3.a Average Sales p/sqm
Average sales per sqm has been calculated by forecasting growth rate. We have taken the view that Average sales
per sqm will decrease in FY15 and FY16 because of the strategy that has been implemented by WOW’s
Management to reformat Big W stores. Consequently, the changes to the store formats will likely reduced sales
in the short term while WOW improves its offerring and implements the “store transformation”. In the medium‐
run we expect this strategy to marginally drive sales, especially as WOW integrates the acquisition of EziBuy and
relaunches Big W’s new online platform. As such we have average sales per sqm increasing by ~1% frp, FY17 and
for the rest of the forecasting horizon.
10.3.b Total Area
Total area in sqm has been calculated by multiplying the number of Big W stores by the average store size in sqm.
The discount retailing market is mature, saturated and includes competitive players such as Kmart, Target and
Lowes who are also investing to improve market share. Additionally, these stores are already concentrated in
zones with high foot traffic, and the location of these new stores would be result in suboptimal sales volumes.
Consequently we expect that Big W will only open 3 stores in FY15, 2 stores in FY16 and 1 store each year
thereafter. Lastly, the average store size in sqm has been assumed to remain constant throughout the forecast
horizon because we expect that the store transformation will lead to Big W stores being mores similar to each
other, and thus the average store size will not fluctuate going forward.
General Merchandise Assumptions 2014 2015 2016 2017 2018 2019 2020 2021
Number of Stores (Big W) 182 185 187 188 189 190 191 192
Total Area (sqm) 1,042,927 1,060,118 1,071,579 1,077,309 1,083,040 1,088,770 1,094,500 1,100,231
Average sales per sqm ($) 4,227 4,143 4,060 4,080 4,113 4,154 4,199 4,254
Total Revenue (AUD Millions) 4,352 4,392 4,350 4,395 4,454 4,523 4,596 4,680
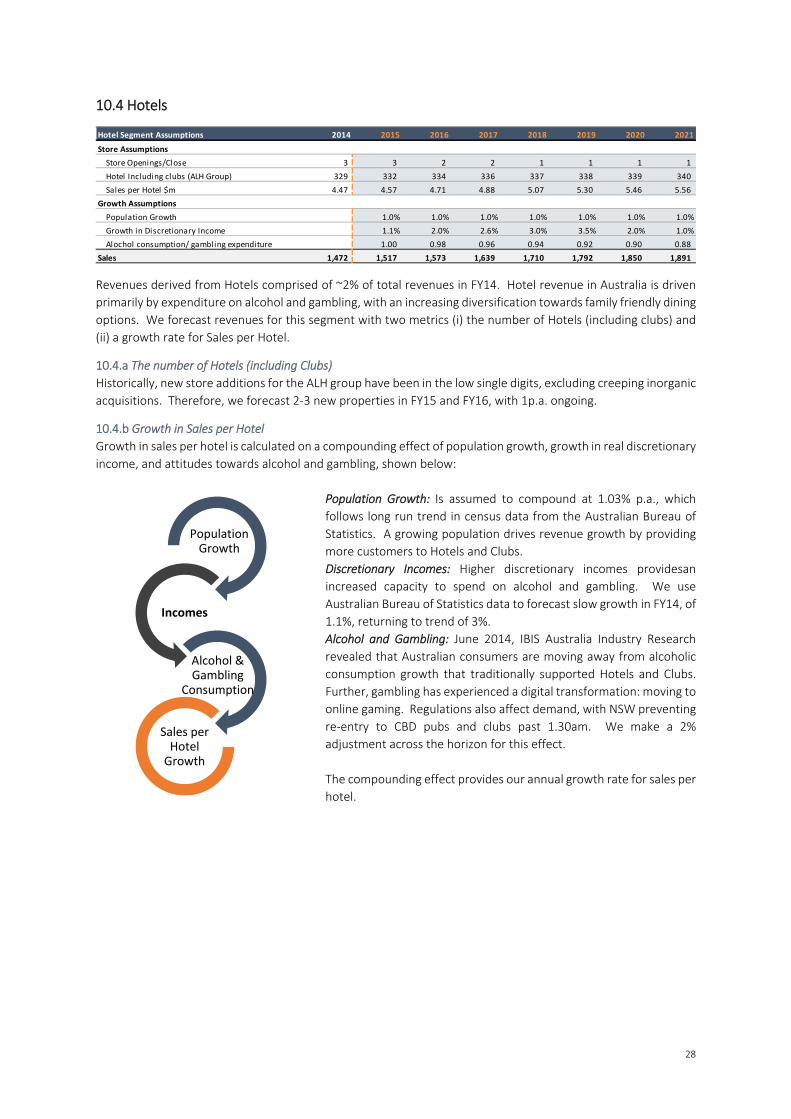
28
10.4 Hotels
Revenues derived from Hotels comprised of ~2% of total revenues in FY14. Hotel revenue in Australia is driven
primarily by expenditure on alcohol and gambling, with an increasing diversification towards family friendly dining
options. We forecast revenues for this segment with two metrics (i) the number of Hotels (including clubs) and
(ii) a growth rate for Sales per Hotel.
10.4.a The number of Hotels (including Clubs)
Historically, new store additions for the ALH group have been in the low single digits, excluding creeping inorganic
acquisitions. Therefore, we forecast 2‐3 new properties in FY15 and FY16, with 1p.a. ongoing.
10.4.b Growth in Sales per Hotel
Growth in sales per hotel is calculated on a compounding effect of population growth, growth in real discretionary
income, and attitudes towards alcohol and gambling, shown below:
Population Growth: Is assumed to compound at 1.03% p.a., which
follows long run trend in census data from the Australian Bureau of
Statistics. A growing population drives revenue growth by providing
more customers to Hotels and Clubs.
Discretionary Incomes: Higher discretionary incomes providesan
increased capacity to spend on alcohol and gambling. We use
Australian Bureau of Statistics data to forecast slow growth in FY14, of
1.1%, returning to trend of 3%.
Alcohol and Gambling: June 2014, IBIS Australia Industry Research
revealed that Australian consumers are moving away from alcoholic
consumption growth that traditionally supported Hotels and Clubs.
Further, gambling has experienced a digital transformation: moving to
online gaming. Regulations also affect demand, with NSW preventing
re‐entry to CBD pubs and clubs past 1.30am. We make a 2%
adjustment across the horizon for this effect.
The compounding effect provides our annual growth rate for sales per
hotel.
Hotel Segment Assumptions 2014 2015 2016 2017 2018 2019 2020 2021
Store Assumptions
Store Openings/Close 3 3 2 2 1 1 1 1
Hotel Including clubs (ALH Group) 329 332 334 336 337 338 339 340
Sales per Hotel $m 4.47 4.57 4.71 4.88 5.07 5.30 5.46 5.56
Growth Assumptions
Population Growth 1.0% 1.0% 1.0% 1.0% 1.0% 1.0% 1.0%
Growth in Discretionary Income 1.1% 2.0% 2.6% 3.0% 3.5% 2.0% 1.0%
Alochol consumption/ gambling expenditure 1.00 0.98 0.96 0.94 0.92 0.90 0.88
Sales 1,472 1,517 1,573 1,639 1,710 1,792 1,850 1,891
Population Growth
Incomes
Alcohol & Gambling
Consumption
Sales per Hotel Growth
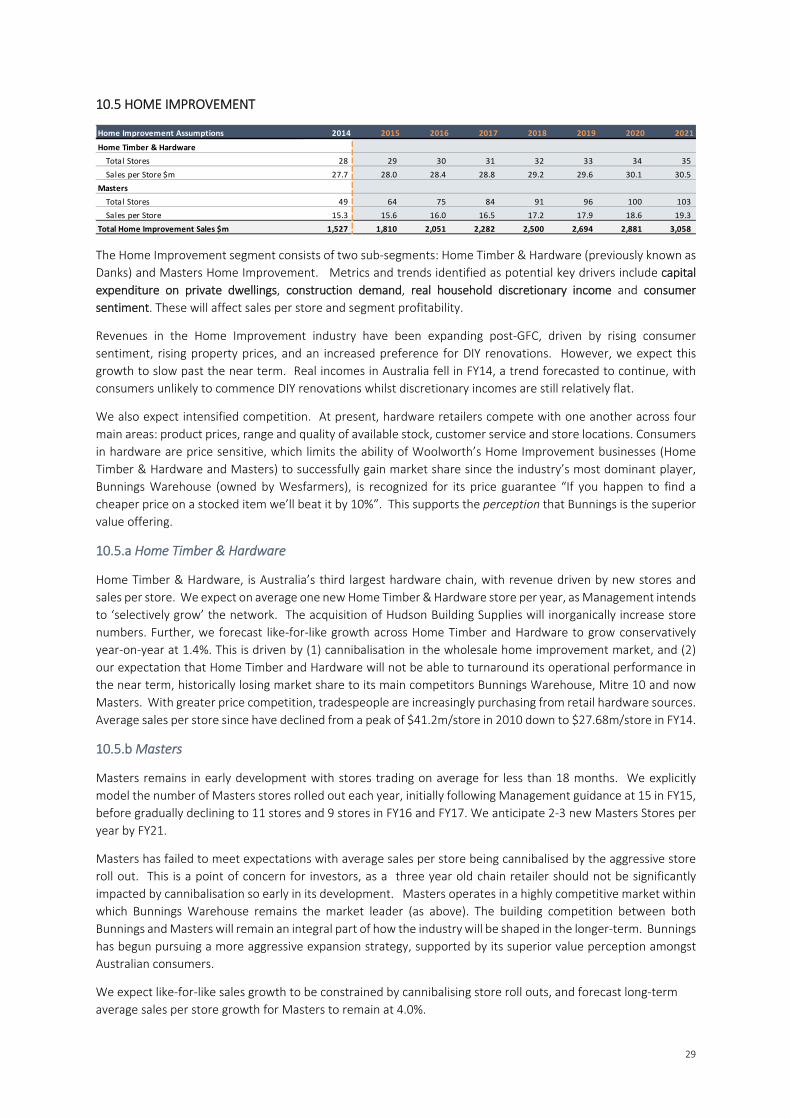
29
10.5 HOME IMPROVEMENT
The Home Improvement segment consists of two sub‐segments: Home Timber & Hardware (previously known as
Danks) and Masters Home Improvement. Metrics and trends identified as potential key drivers include capital
expenditure on private dwellings, construction demand, real household discretionary income and consumer
sentiment. These will affect sales per store and segment profitability.
Revenues in the Home Improvement industry have been expanding post‐GFC, driven by rising consumer
sentiment, rising property prices, and an increased preference for DIY renovations. However, we expect this
growth to slow past the near term. Real incomes in Australia fell in FY14, a trend forecasted to continue, with
consumers unlikely to commence DIY renovations whilst discretionary incomes are still relatively flat.
We also expect intensified competition. At present, hardware retailers compete with one another across four
main areas: product prices, range and quality of available stock, customer service and store locations. Consumers
in hardware are price sensitive, which limits the ability of Woolworth’s Home Improvement businesses (Home
Timber & Hardware and Masters) to successfully gain market share since the industry’s most dominant player,
Bunnings Warehouse (owned by Wesfarmers), is recognized for its price guarantee “If you happen to find a
cheaper price on a stocked item we’ll beat it by 10%”. This supports the perception that Bunnings is the superior
value offering.
10.5.a Home Timber & Hardware
Home Timber & Hardware, is Australia’s third largest hardware chain, with revenue driven by new stores and
sales per store. We expect on average one new Home Timber & Hardware store per year, as Management intends
to ‘selectively grow’ the network. The acquisition of Hudson Building Supplies will inorganically increase store
numbers. Further, we forecast like‐for‐like growth across Home Timber and Hardware to grow conservatively
year‐on‐year at 1.4%. This is driven by (1) cannibalisation in the wholesale home improvement market, and (2)
our expectation that Home Timber and Hardware will not be able to turnaround its operational performance in
the near term, historically losing market share to its main competitors Bunnings Warehouse, Mitre 10 and now
Masters. With greater price competition, tradespeople are increasingly purchasing from retail hardware sources.
Average sales per store since have declined from a peak of $41.2m/store in 2010 down to $27.68m/store in FY14.
10.5.b Masters
Masters remains in early development with stores trading on average for less than 18 months. We explicitly
model the number of Masters stores rolled out each year, initially following Management guidance at 15 in FY15,
before gradually declining to 11 stores and 9 stores in FY16 and FY17. We anticipate 2‐3 new Masters Stores per
year by FY21.
Masters has failed to meet expectations with average sales per store being cannibalised by the aggressive store
roll out. This is a point of concern for investors, as a three year old chain retailer should not be significantly
impacted by cannibalisation so early in its development. Masters operates in a highly competitive market within
which Bunnings Warehouse remains the market leader (as above). The building competition between both
Bunnings and Masters will remain an integral part of how the industry will be shaped in the longer‐term. Bunnings
has begun pursuing a more aggressive expansion strategy, supported by its superior value perception amongst
Australian consumers.
We expect like‐for‐like sales growth to be constrained by cannibalising store roll outs, and forecast long‐term
average sales per store growth for Masters to remain at 4.0%.
Home Improvement Assumptions 2014 2015 2016 2017 2018 2019 2020 2021
Home Timber & Hardware
Total Stores 28 29 30 31 32 33 34 35
Sales per Store $m 27.7 28.0 28.4 28.8 29.2 29.6 30.1 30.5
Masters
Total Stores 49 64 75 84 91 96 100 103
Sales per Store 15.3 15.6 16.0 16.5 17.2 17.9 18.6 19.3
Total Home Improvement Sales $m 1,527 1,810 2,051 2,282 2,500 2,694 2,881 3,058
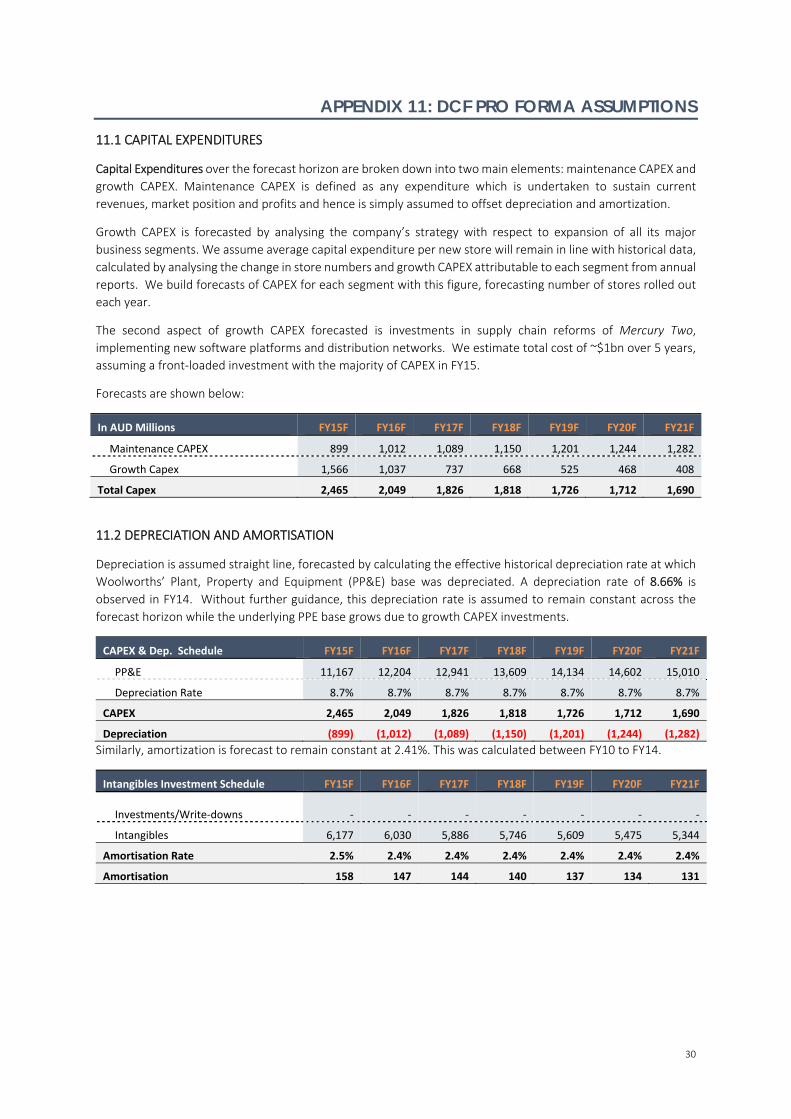
30
APPENDIX 11: DCF PRO FORMA ASSUMPTIONS
11.1 CAPITAL EXPENDITURES
Capital Expenditures over the forecast horizon are broken down into two main elements: maintenance CAPEX and
growth CAPEX. Maintenance CAPEX is defined as any expenditure which is undertaken to sustain current
revenues, market position and profits and hence is simply assumed to offset depreciation and amortization.
Growth CAPEX is forecasted by analysing the company’s strategy with respect to expansion of all its major
business segments. We assume average capital expenditure per new store will remain in line with historical data,
calculated by analysing the change in store numbers and growth CAPEX attributable to each segment from annual
reports. We build forecasts of CAPEX for each segment with this figure, forecasting number of stores rolled out
each year.
The second aspect of growth CAPEX forecasted is investments in supply chain reforms of Mercury Two,
implementing new software platforms and distribution networks. We estimate total cost of ~$1bn over 5 years,
assuming a front‐loaded investment with the majority of CAPEX in FY15.
Forecasts are shown below:
In AUD Millions FY15F FY16F FY17F FY18F FY19F FY20F FY21F
Maintenance CAPEX 899 1,012 1,089 1,150 1,201 1,244 1,282
Growth Capex 1,566 1,037 737 668 525 468 408
Total Capex 2,465 2,049 1,826 1,818 1,726 1,712 1,690
11.2 DEPRECIATION AND AMORTISATION
Depreciation is assumed straight line, forecasted by calculating the effective historical depreciation rate at which
Woolworths’ Plant, Property and Equipment (PP&E) base was depreciated. A depreciation rate of 8.66% is
observed in FY14. Without further guidance, this depreciation rate is assumed to remain constant across the
forecast horizon while the underlying PPE base grows due to growth CAPEX investments.
CAPEX & Dep. Schedule FY15F FY16F FY17F FY18F FY19F FY20F FY21F
PP&E 11,167 12,204 12,941 13,609 14,134 14,602 15,010
Depreciation Rate 8.7% 8.7% 8.7% 8.7% 8.7% 8.7% 8.7%
CAPEX 2,465 2,049 1,826 1,818 1,726 1,712 1,690
Depreciation (899) (1,012) (1,089) (1,150) (1,201) (1,244) (1,282)
Similarly, amortization is forecast to remain constant at 2.41%. This was calculated between FY10 to FY14.
Intangibles Investment Schedule FY15F FY16F FY17F FY18F FY19F FY20F FY21F
Investments/Write‐downs
‐
‐
‐
‐ ‐
‐
‐
Intangibles 6,177 6,030 5,886 5,746 5,609 5,475 5,344
Amortisation Rate 2.5% 2.4% 2.4% 2.4% 2.4% 2.4% 2.4%
Amortisation 158 147 144 140 137 134 131
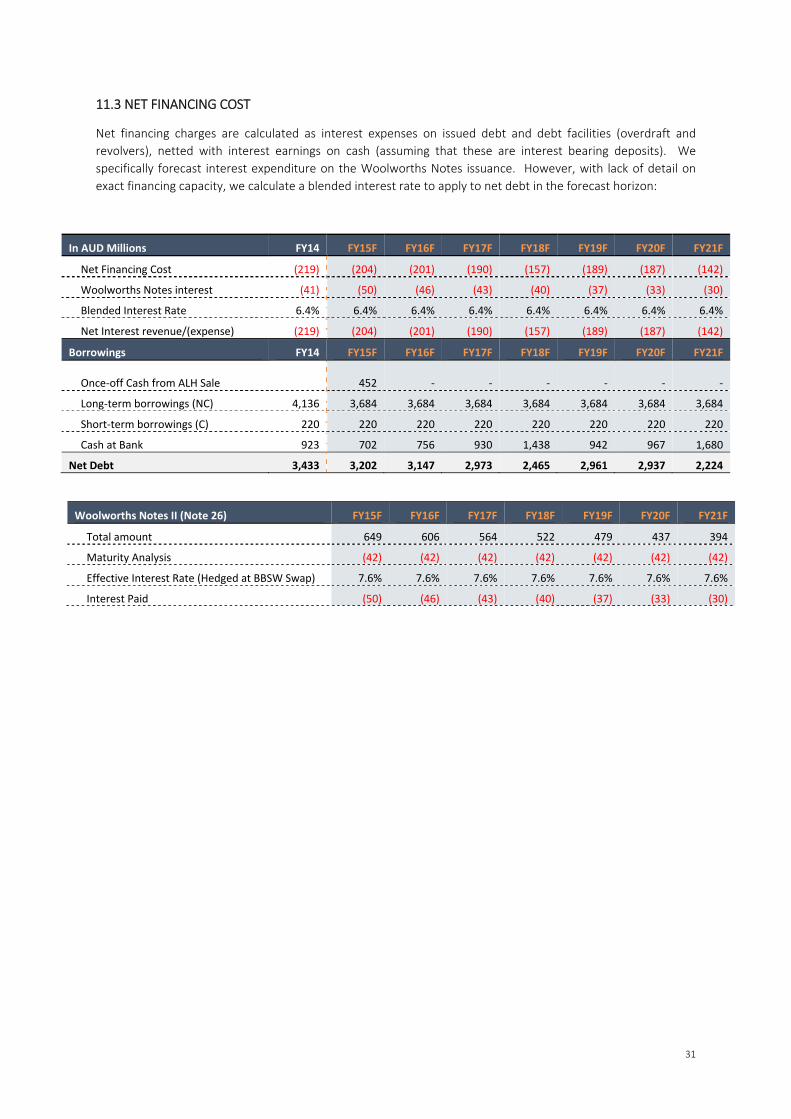
31
11.3 NET FINANCING COST
Net financing charges are calculated as interest expenses on issued debt and debt facilities (overdraft and
revolvers), netted with interest earnings on cash (assuming that these are interest bearing deposits). We
specifically forecast interest expenditure on the Woolworths Notes issuance. However, with lack of detail on
exact financing capacity, we calculate a blended interest rate to apply to net debt in the forecast horizon:
In AUD Millions FY14 FY15F FY16F FY17F FY18F FY19F FY20F FY21F
Net Financing Cost (219) (204) (201) (190) (157) (189) (187) (142)
Woolworths Notes interest (41) (50) (46) (43) (40) (37) (33) (30)
Blended Interest Rate 6.4% 6.4% 6.4% 6.4% 6.4% 6.4% 6.4% 6.4%
Net Interest revenue/(expense) (219) (204) (201) (190) (157) (189) (187) (142)
Borrowings FY14 FY15F FY16F FY17F FY18F FY19F FY20F FY21F
Once‐off Cash from ALH Sale 452
‐
‐
‐ ‐
‐
‐
Long‐term borrowings (NC) 4,136 3,684 3,684 3,684 3,684 3,684 3,684 3,684
Short‐term borrowings (C) 220 220 220 220 220 220 220 220
Cash at Bank 923 702 756 930 1,438 942 967 1,680
Net Debt 3,433 3,202 3,147 2,973 2,465 2,961 2,937 2,224
Woolworths Notes II (Note 26) FY15F FY16F FY17F FY18F FY19F FY20F FY21F
Total amount 649 606 564 522 479 437 394
Maturity Analysis (42) (42) (42) (42) (42) (42) (42)
Effective Interest Rate (Hedged at BBSW Swap) 7.6% 7.6% 7.6% 7.6% 7.6% 7.6% 7.6%
Interest Paid (50) (46) (43) (40) (37) (33) (30)
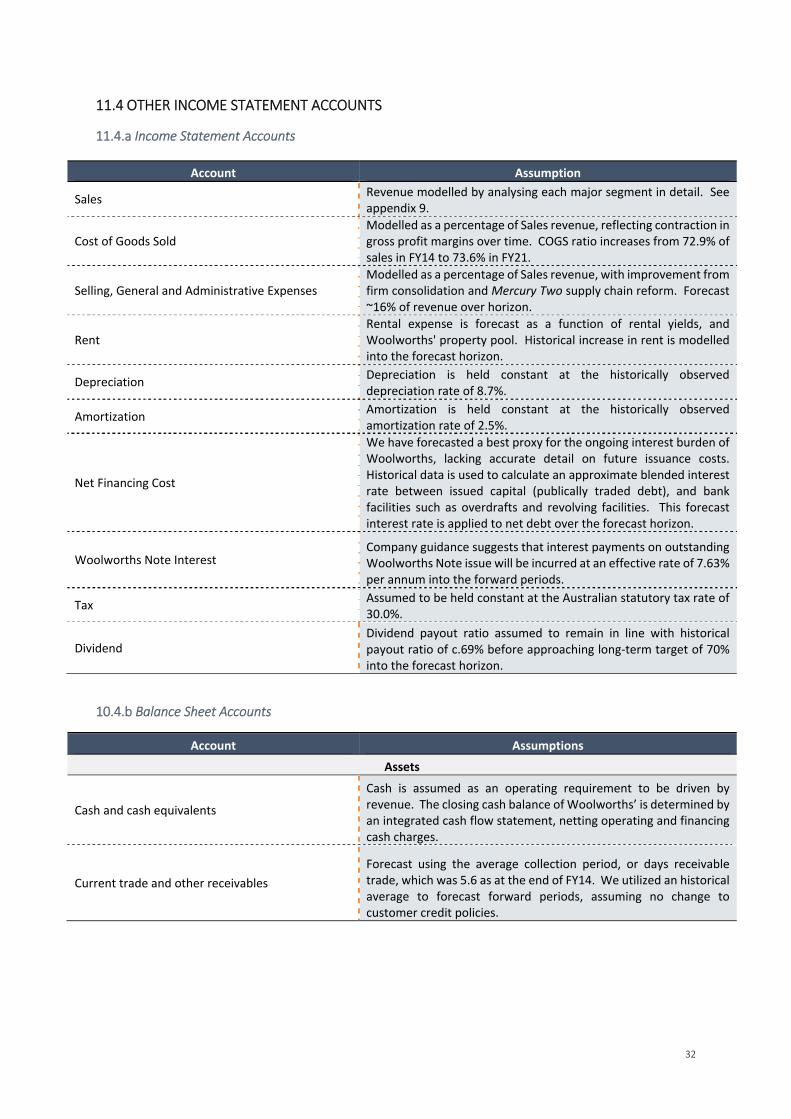
32
11.4 OTHER INCOME STATEMENT ACCOUNTS
11.4.a Income Statement Accounts
Account Assumption
Sales Revenue modelled by analysing each major segment in detail. See appendix 9.
Cost of Goods Sold Modelled as a percentage of Sales revenue, reflecting contraction in gross profit margins over time. COGS ratio increases from 72.9% of sales in FY14 to 73.6% in FY21.
Selling, General and Administrative Expenses Modelled as a percentage of Sales revenue, with improvement from firm consolidation and Mercury Two supply chain reform. Forecast ~16% of revenue over horizon.
Rent Rental expense is forecast as a function of rental yields, and Woolworths' property pool. Historical increase in rent is modelled into the forecast horizon.
Depreciation Depreciation is held constant at the historically observed depreciation rate of 8.7%.
Amortization Amortization is held constant at the historically observed amortization rate of 2.5%.
Net Financing Cost
We have forecasted a best proxy for the ongoing interest burden of Woolworths, lacking accurate detail on future issuance costs. Historical data is used to calculate an approximate blended interest rate between issued capital (publically traded debt), and bank facilities such as overdrafts and revolving facilities. This forecast interest rate is applied to net debt over the forecast horizon.
Woolworths Note Interest Company guidance suggests that interest payments on outstanding Woolworths Note issue will be incurred at an effective rate of 7.63% per annum into the forward periods.
Tax Assumed to be held constant at the Australian statutory tax rate of 30.0%.
Dividend Dividend payout ratio assumed to remain in line with historical payout ratio of c.69% before approaching long‐term target of 70% into the forecast horizon.
10.4.b Balance Sheet Accounts
Account Assumptions
Assets
Cash and cash equivalents
Cash is assumed as an operating requirement to be driven by revenue. The closing cash balance of Woolworths’ is determined by an integrated cash flow statement, netting operating and financing cash charges.
Current trade and other receivables
Forecast using the average collection period, or days receivable trade, which was 5.6 as at the end of FY14. We utilized an historical average to forecast forward periods, assuming no change to customer credit policies.
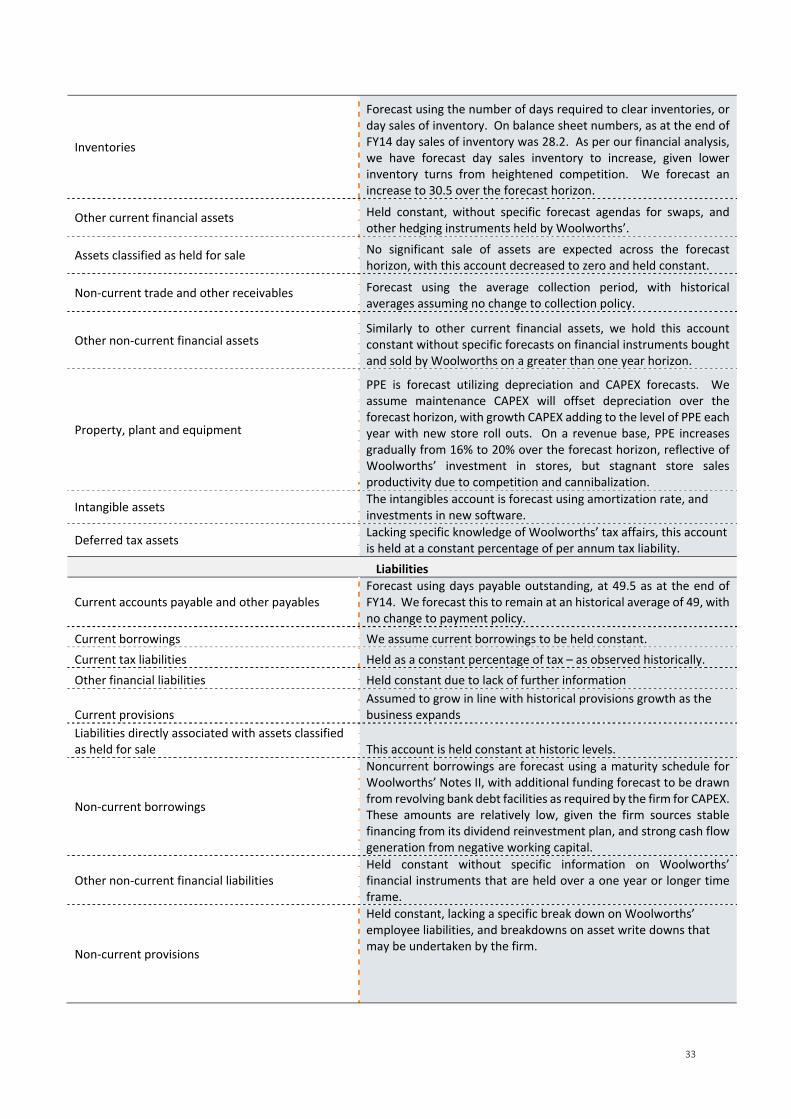
33
Inventories
Forecast using the number of days required to clear inventories, or day sales of inventory. On balance sheet numbers, as at the end of FY14 day sales of inventory was 28.2. As per our financial analysis, we have forecast day sales inventory to increase, given lower inventory turns from heightened competition. We forecast an increase to 30.5 over the forecast horizon.
Other current financial assets Held constant, without specific forecast agendas for swaps, and other hedging instruments held by Woolworths’.
Assets classified as held for sale No significant sale of assets are expected across the forecast horizon, with this account decreased to zero and held constant.
Non‐current trade and other receivables Forecast using the average collection period, with historical averages assuming no change to collection policy.
Other non‐current financial assets Similarly to other current financial assets, we hold this account constant without specific forecasts on financial instruments bought and sold by Woolworths on a greater than one year horizon.
Property, plant and equipment
PPE is forecast utilizing depreciation and CAPEX forecasts. We assume maintenance CAPEX will offset depreciation over the forecast horizon, with growth CAPEX adding to the level of PPE each year with new store roll outs. On a revenue base, PPE increases gradually from 16% to 20% over the forecast horizon, reflective of Woolworths’ investment in stores, but stagnant store sales productivity due to competition and cannibalization.
Intangible assets The intangibles account is forecast using amortization rate, and investments in new software.
Deferred tax assets Lacking specific knowledge of Woolworths’ tax affairs, this account is held at a constant percentage of per annum tax liability.
Liabilities
Current accounts payable and other payables Forecast using days payable outstanding, at 49.5 as at the end of FY14. We forecast this to remain at an historical average of 49, with no change to payment policy.
Current borrowings We assume current borrowings to be held constant.
Current tax liabilities Held as a constant percentage of tax – as observed historically.
Other financial liabilities Held constant due to lack of further information
Current provisions Assumed to grow in line with historical provisions growth as the business expands
Liabilities directly associated with assets classified as held for sale This account is held constant at historic levels.
Non‐current borrowings
Noncurrent borrowings are forecast using a maturity schedule for Woolworths’ Notes II, with additional funding forecast to be drawn from revolving bank debt facilities as required by the firm for CAPEX. These amounts are relatively low, given the firm sources stable financing from its dividend reinvestment plan, and strong cash flow generation from negative working capital.
Other non‐current financial liabilities Held constant without specific information on Woolworths’ financial instruments that are held over a one year or longer time frame.
Non‐current provisions
Held constant, lacking a specific break down on Woolworths’ employee liabilities, and breakdowns on asset write downs that may be undertaken by the firm.
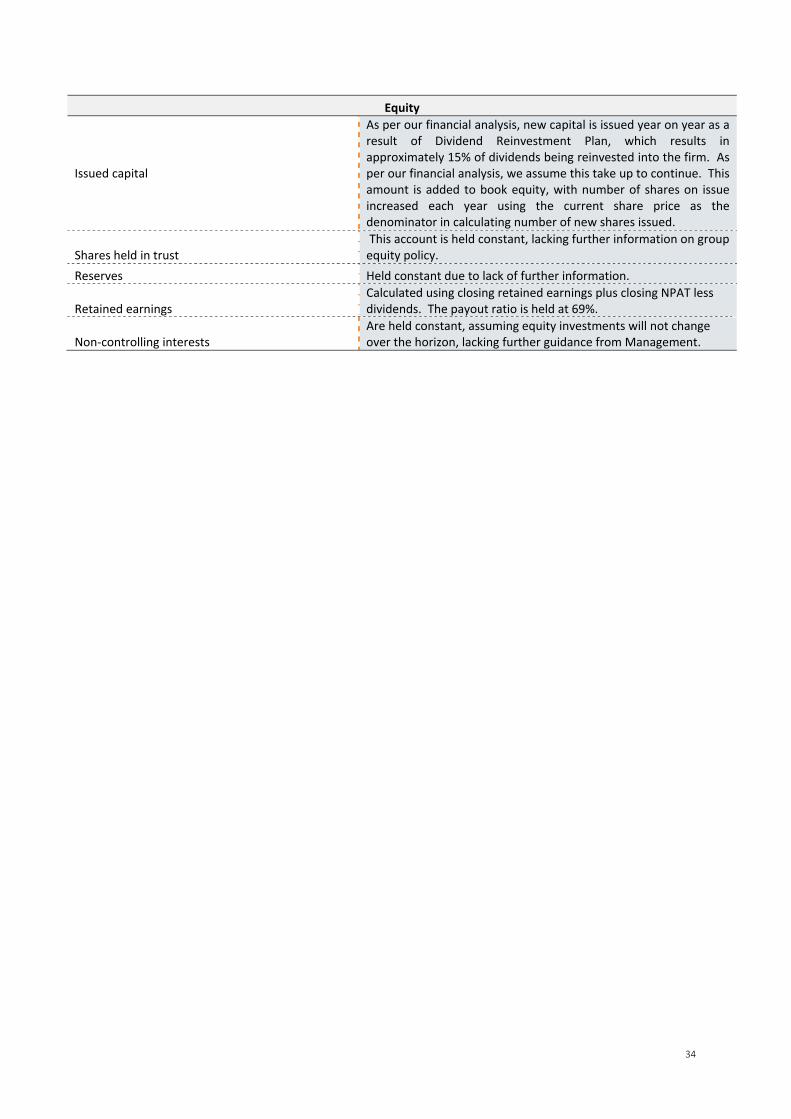
34
Equity
Issued capital
As per our financial analysis, new capital is issued year on year as a result of Dividend Reinvestment Plan, which results in approximately 15% of dividends being reinvested into the firm. As per our financial analysis, we assume this take up to continue. This amount is added to book equity, with number of shares on issue increased each year using the current share price as the denominator in calculating number of new shares issued.
Shares held in trust This account is held constant, lacking further information on group equity policy.
Reserves Held constant due to lack of further information.
Retained earnings Calculated using closing retained earnings plus closing NPAT less dividends. The payout ratio is held at 69%.
Non‐controlling interests Are held constant, assuming equity investments will not change over the horizon, lacking further guidance from Management.
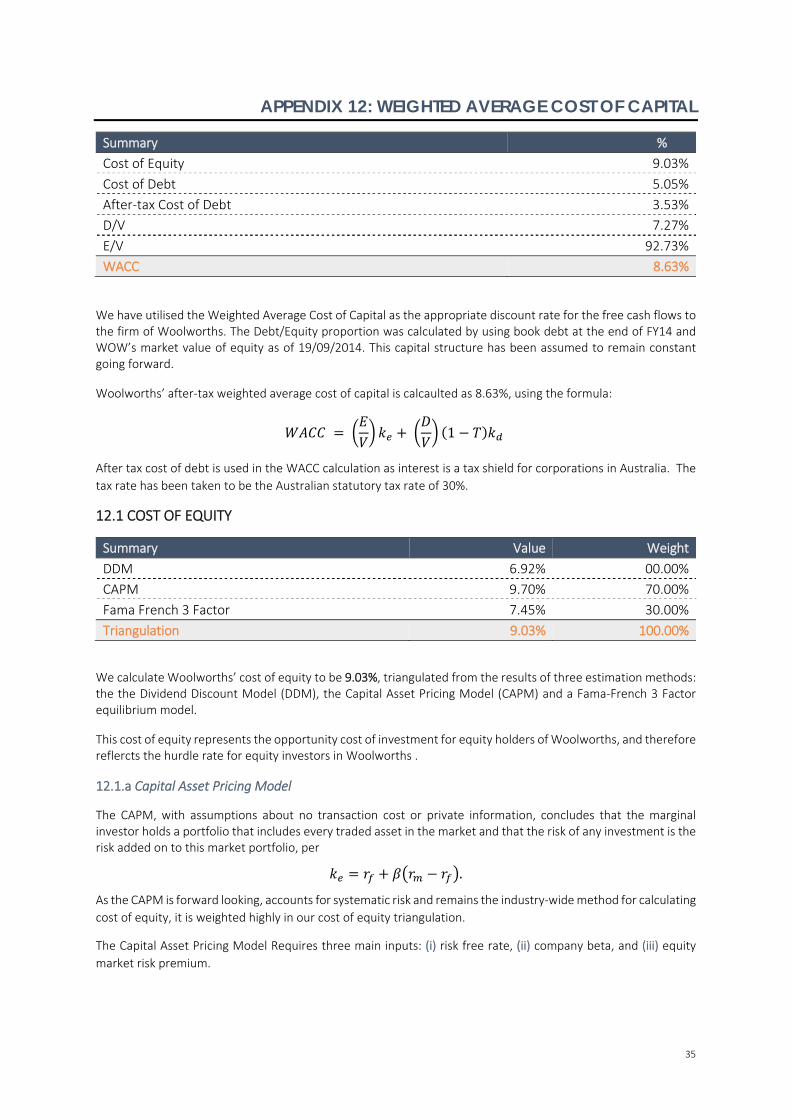
35
APPENDIX 12: WEIGHTED AVERAGE COST OF CAPITAL
Summary %
Cost of Equity 9.03%
Cost of Debt 5.05%
After‐tax Cost of Debt 3.53%
D/V 7.27%
E/V 92.73%
WACC 8.63%
We have utilised the Weighted Average Cost of Capital as the appropriate discount rate for the free cash flows to the firm of Woolworths. The Debt/Equity proportion was calculated by using book debt at the end of FY14 and WOW’s market value of equity as of 19/09/2014. This capital structure has been assumed to remain constant going forward.
Woolworths’ after‐tax weighted average cost of capital is calcaulted as 8.63%, using the formula:
1
After tax cost of debt is used in the WACC calculation as interest is a tax shield for corporations in Australia. The
tax rate has been taken to be the Australian statutory tax rate of 30%.
12.1 COST OF EQUITY
Summary Value Weight
DDM 6.92% 00.00%
CAPM 9.70% 70.00%
Fama French 3 Factor 7.45% 30.00%
Triangulation 9.03% 100.00%
We calculate Woolworths’ cost of equity to be 9.03%, triangulated from the results of three estimation methods: the the Dividend Discount Model (DDM), the Capital Asset Pricing Model (CAPM) and a Fama‐French 3 Factor equilibrium model.
This cost of equity represents the opportunity cost of investment for equity holders of Woolworths, and therefore reflercts the hurdle rate for equity investors in Woolworths .
12.1.a Capital Asset Pricing Model
The CAPM, with assumptions about no transaction cost or private information, concludes that the marginal investor holds a portfolio that includes every traded asset in the market and that the risk of any investment is the risk added on to this market portfolio, per
.
As the CAPM is forward looking, accounts for systematic risk and remains the industry‐wide method for calculating
cost of equity, it is weighted highly in our cost of equity triangulation.
The Capital Asset Pricing Model Requires three main inputs: (i) risk free rate, (ii) company beta, and (iii) equity
market risk premium.
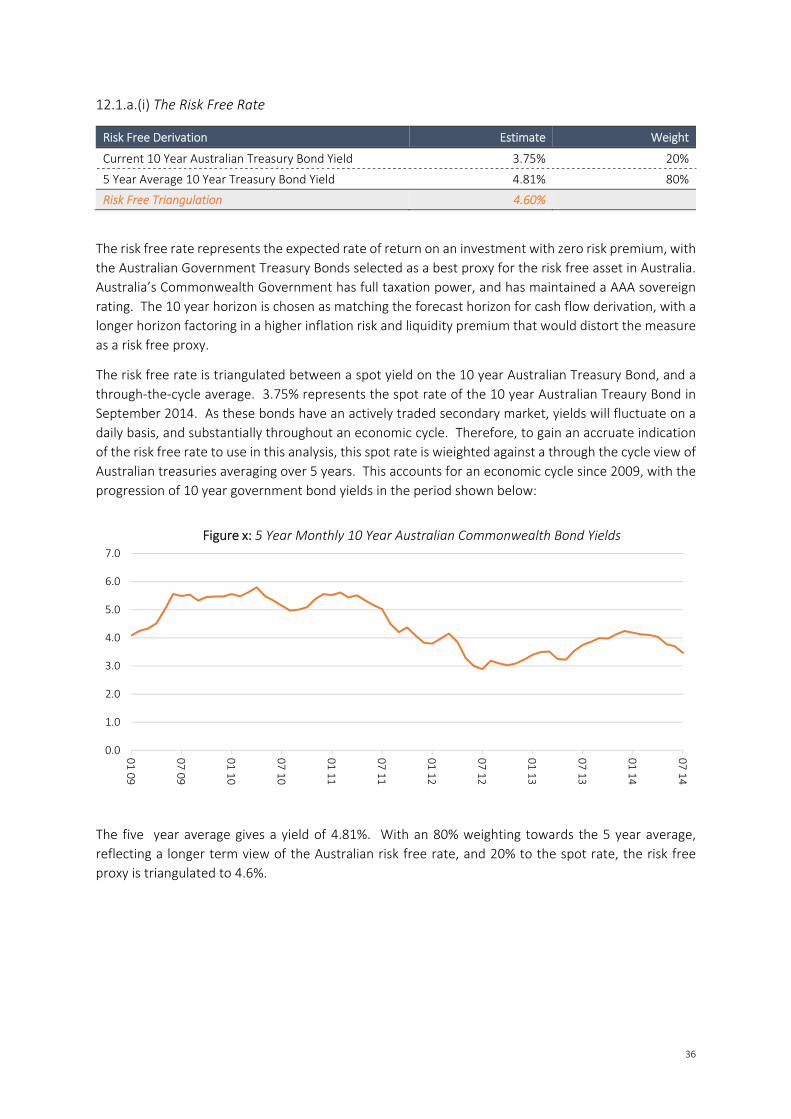
36
12.1.a.(i) The Risk Free Rate
Risk Free Derivation Estimate Weight
Current 10 Year Australian Treasury Bond Yield 3.75% 20%
5 Year Average 10 Year Treasury Bond Yield 4.81% 80%
Risk Free Triangulation 4.60%
The risk free rate represents the expected rate of return on an investment with zero risk premium, with
the Australian Government Treasury Bonds selected as a best proxy for the risk free asset in Australia.
Australia’s Commonwealth Government has full taxation power, and has maintained a AAA sovereign
rating. The 10 year horizon is chosen as matching the forecast horizon for cash flow derivation, with a
longer horizon factoring in a higher inflation risk and liquidity premium that would distort the measure
as a risk free proxy.
The risk free rate is triangulated between a spot yield on the 10 year Australian Treasury Bond, and a
through‐the‐cycle average. 3.75% represents the spot rate of the 10 year Australian Treaury Bond in
September 2014. As these bonds have an actively traded secondary market, yields will fluctuate on a
daily basis, and substantially throughout an economic cycle. Therefore, to gain an accruate indication
of the risk free rate to use in this analysis, this spot rate is wieighted against a through the cycle view of
Australian treasuries averaging over 5 years. This accounts for an economic cycle since 2009, with the
progression of 10 year government bond yields in the period shown below:
The five year average gives a yield of 4.81%. With an 80% weighting towards the 5 year average,
reflecting a longer term view of the Australian risk free rate, and 20% to the spot rate, the risk free
proxy is triangulated to 4.6%.
0.0
1.0
2.0
3.0
4.0
5.0
6.0
7.0
01 09
07 09
01 10
07 10
01 11
07 11
01 12
07 12
01 13
07 13
01 14
07 14
Figure x: 5 Year Monthly 10 Year Australian Commonwealth Bond Yields
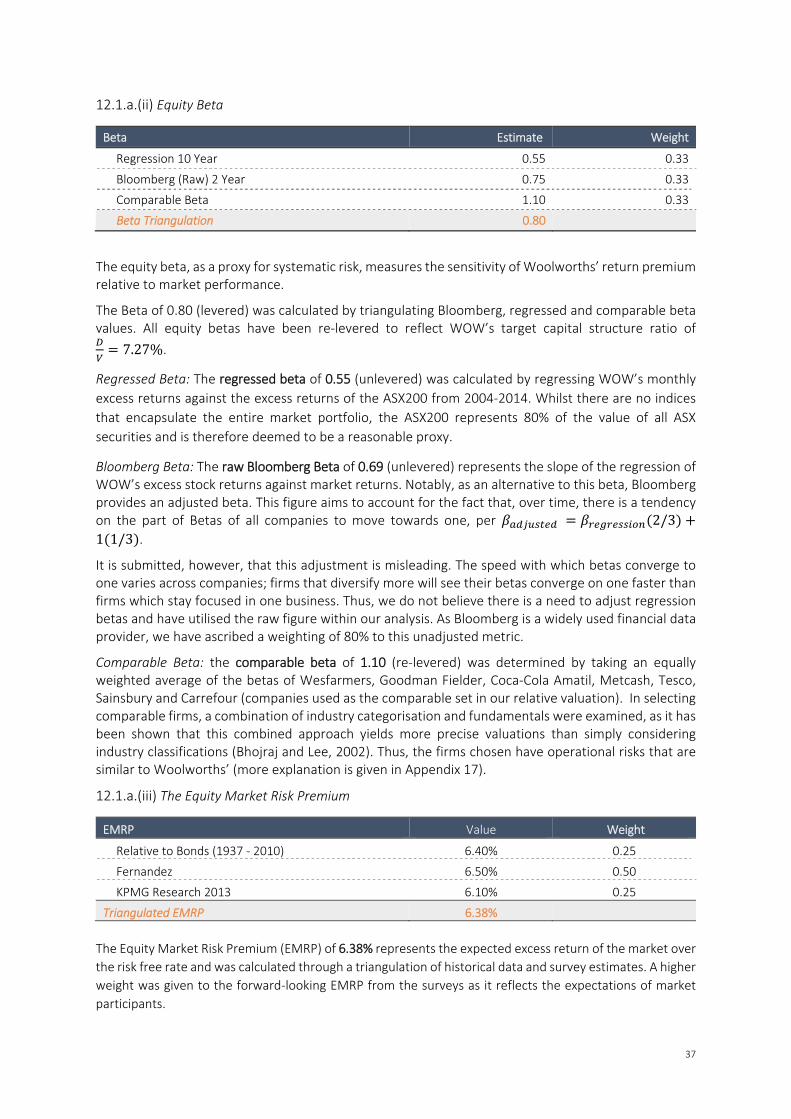
37
12.1.a.(ii) Equity Beta
Beta Estimate Weight
Regression 10 Year 0.55 0.33
Bloomberg (Raw) 2 Year 0.75 0.33
Comparable Beta 1.10 0.33
Beta Triangulation 0.80
The equity beta, as a proxy for systematic risk, measures the sensitivity of Woolworths’ return premium relative to market performance.
The Beta of 0.80 (levered) was calculated by triangulating Bloomberg, regressed and comparable beta values. All equity betas have been re‐levered to reflect WOW’s target capital structure ratio of
7.27%.
Regressed Beta: The regressed beta of 0.55 (unlevered) was calculated by regressing WOW’s monthly
excess returns against the excess returns of the ASX200 from 2004‐2014. Whilst there are no indices
that encapsulate the entire market portfolio, the ASX200 represents 80% of the value of all ASX
securities and is therefore deemed to be a reasonable proxy.
Bloomberg Beta: The raw Bloomberg Beta of 0.69 (unlevered) represents the slope of the regression of WOW’s excess stock returns against market returns. Notably, as an alternative to this beta, Bloomberg provides an adjusted beta. This figure aims to account for the fact that, over time, there is a tendency on the part of Betas of all companies to move towards one, per 2/3
1 1/3 .
It is submitted, however, that this adjustment is misleading. The speed with which betas converge to one varies across companies; firms that diversify more will see their betas converge on one faster than firms which stay focused in one business. Thus, we do not believe there is a need to adjust regression betas and have utilised the raw figure within our analysis. As Bloomberg is a widely used financial data provider, we have ascribed a weighting of 80% to this unadjusted metric.
Comparable Beta: the comparable beta of 1.10 (re‐levered) was determined by taking an equally weighted average of the betas of Wesfarmers, Goodman Fielder, Coca‐Cola Amatil, Metcash, Tesco, Sainsbury and Carrefour (companies used as the comparable set in our relative valuation). In selecting comparable firms, a combination of industry categorisation and fundamentals were examined, as it has been shown that this combined approach yields more precise valuations than simply considering industry classifications (Bhojraj and Lee, 2002). Thus, the firms chosen have operational risks that are similar to Woolworths’ (more explanation is given in Appendix 17).
12.1.a.(iii) The Equity Market Risk Premium
EMRP Value Weight
Relative to Bonds (1937 ‐ 2010) 6.40% 0.25
Fernandez 6.50% 0.50
KPMG Research 2013 6.10% 0.25
Triangulated EMRP 6.38%
The Equity Market Risk Premium (EMRP) of 6.38% represents the expected excess return of the market over
the risk free rate and was calculated through a triangulation of historical data and survey estimates. A higher
weight was given to the forward‐looking EMRP from the surveys as it reflects the expectations of market
participants.
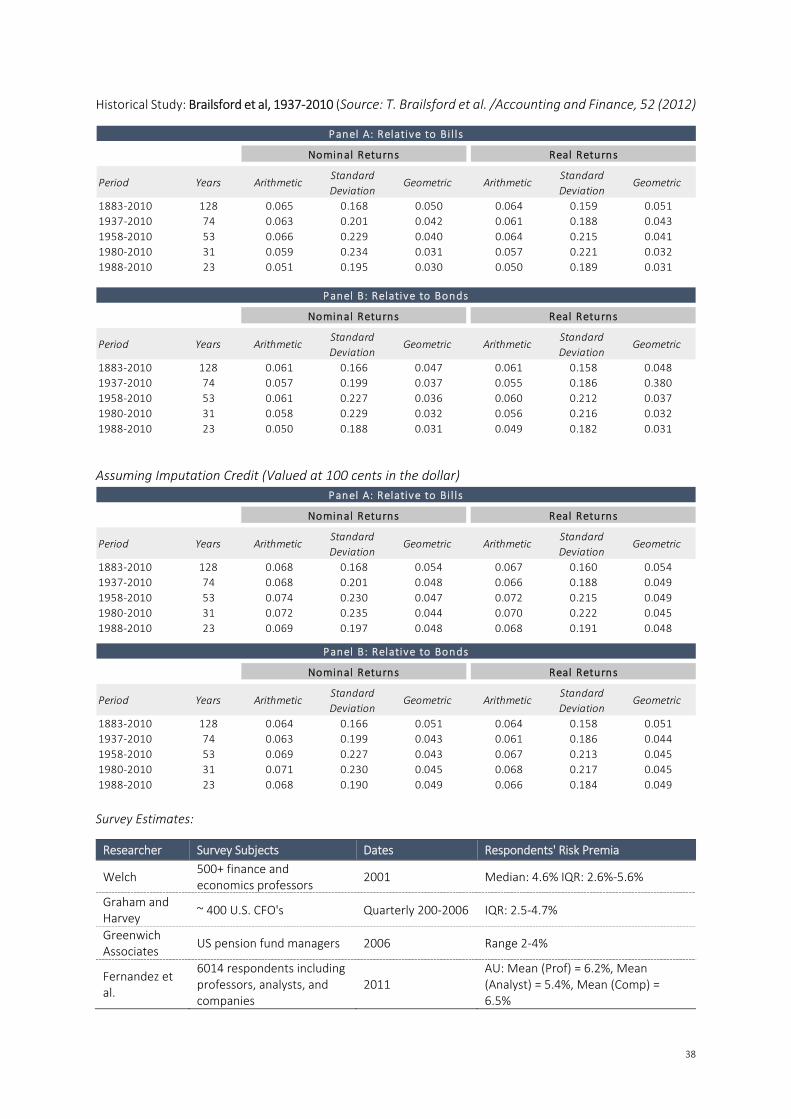
38
Historical Study: Brailsford et al, 1937‐2010 (Source: T. Brailsford et al. /Accounting and Finance, 52 (2012)
Assuming Imputation Credit (Valued at 100 cents in the dollar)
Survey Estimates:
Researcher Survey Subjects Dates Respondents' Risk Premia
Welch 500+ finance and economics professors
2001 Median: 4.6% IQR: 2.6%‐5.6%
Graham and Harvey
~ 400 U.S. CFO's Quarterly 200‐2006 IQR: 2.5‐4.7%
Greenwich Associates
US pension fund managers 2006 Range 2‐4%
Fernandez et al.
6014 respondents including professors, analysts, and companies
2011 AU: Mean (Prof) = 6.2%, Mean (Analyst) = 5.4%, Mean (Comp) = 6.5%
Panel A: Relative to Bil ls
Nominal Returns Real Returns
Period Years ArithmeticStandard
DeviationGeometric Arithmetic
Standard
DeviationGeometric
1883‐2010 128 0.065 0.168 0.050 0.064 0.159 0.051
1937‐2010 74 0.063 0.201 0.042 0.061 0.188 0.043
1958‐2010 53 0.066 0.229 0.040 0.064 0.215 0.041
1980‐2010 31 0.059 0.234 0.031 0.057 0.221 0.032
1988‐2010 23 0.051 0.195 0.030 0.050 0.189 0.031
Panel B: Relative to Bonds
Nominal Returns Real Returns
Period Years ArithmeticStandard
DeviationGeometric Arithmetic
Standard
DeviationGeometric
1883‐2010 128 0.061 0.166 0.047 0.061 0.158 0.048
1937‐2010 74 0.057 0.199 0.037 0.055 0.186 0.380
1958‐2010 53 0.061 0.227 0.036 0.060 0.212 0.037
1980‐2010 31 0.058 0.229 0.032 0.056 0.216 0.032
1988‐2010 23 0.050 0.188 0.031 0.049 0.182 0.031
Panel A: Relative to Bil ls
Nominal Returns Real Returns
Period Years ArithmeticStandard
DeviationGeometric Arithmetic
Standard
DeviationGeometric
1883‐2010 128 0.068 0.168 0.054 0.067 0.160 0.054
1937‐2010 74 0.068 0.201 0.048 0.066 0.188 0.049
1958‐2010 53 0.074 0.230 0.047 0.072 0.215 0.049
1980‐2010 31 0.072 0.235 0.044 0.070 0.222 0.045
1988‐2010 23 0.069 0.197 0.048 0.068 0.191 0.048
Panel B: Relative to Bonds
Nominal Returns Real Returns
Period Years ArithmeticStandard
DeviationGeometric Arithmetic
Standard
DeviationGeometric
1883‐2010 128 0.064 0.166 0.051 0.064 0.158 0.051
1937‐2010 74 0.063 0.199 0.043 0.061 0.186 0.044
1958‐2010 53 0.069 0.227 0.043 0.067 0.213 0.045
1980‐2010 31 0.071 0.230 0.045 0.068 0.217 0.045
1988‐2010 23 0.068 0.190 0.049 0.066 0.184 0.049
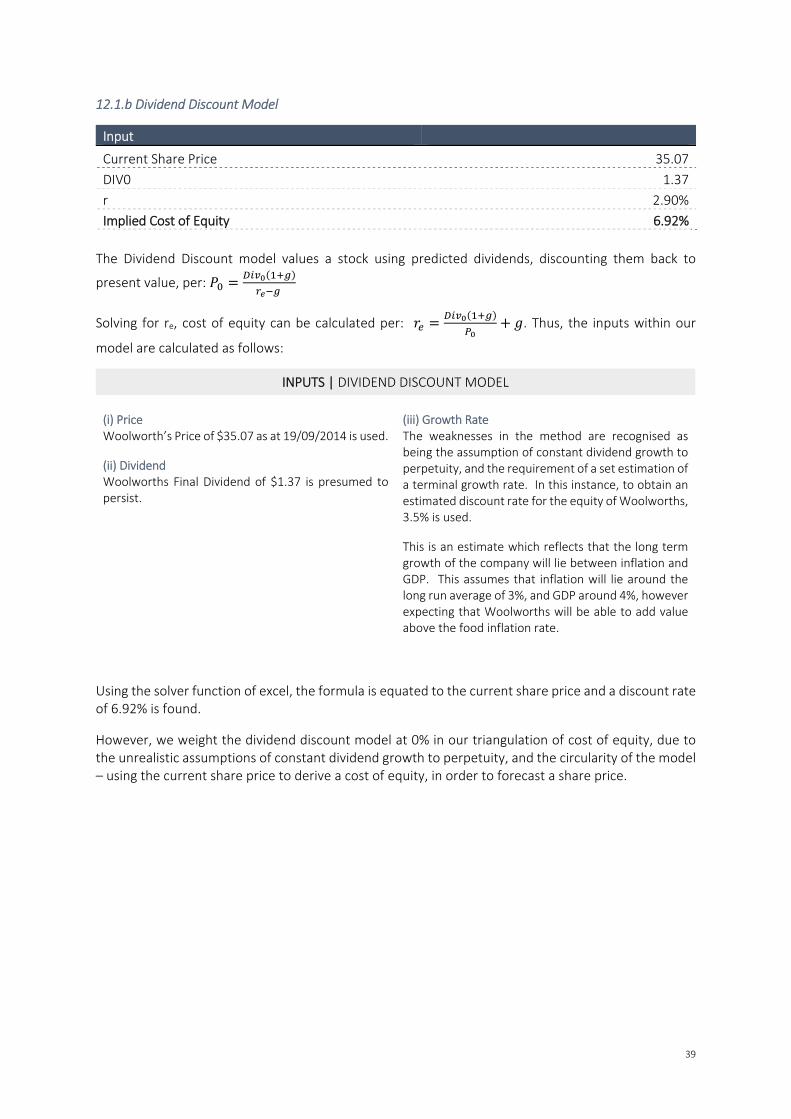
39
12.1.b Dividend Discount Model
Input
Current Share Price 35.07
DIV0 1.37
r 2.90%
Implied Cost of Equity 6.92%
The Dividend Discount model values a stock using predicted dividends, discounting them back to
present value, per:
Solving for re, cost of equity can be calculated per: . Thus, the inputs within our
model are calculated as follows:
INPUTS | DIVIDEND DISCOUNT MODEL
(i) Price Woolworth’s Price of $35.07 as at 19/09/2014 is used.
(ii) Dividend Woolworths Final Dividend of $1.37 is presumed to persist.
(iii) Growth Rate The weaknesses in the method are recognised as being the assumption of constant dividend growth to perpetuity, and the requirement of a set estimation of a terminal growth rate. In this instance, to obtain an estimated discount rate for the equity of Woolworths, 3.5% is used.
This is an estimate which reflects that the long term growth of the company will lie between inflation and GDP. This assumes that inflation will lie around the long run average of 3%, and GDP around 4%, however expecting that Woolworths will be able to add value above the food inflation rate.
Using the solver function of excel, the formula is equated to the current share price and a discount rate of 6.92% is found.
However, we weight the dividend discount model at 0% in our triangulation of cost of equity, due to the unrealistic assumptions of constant dividend growth to perpetuity, and the circularity of the model – using the current share price to derive a cost of equity, in order to forecast a share price.
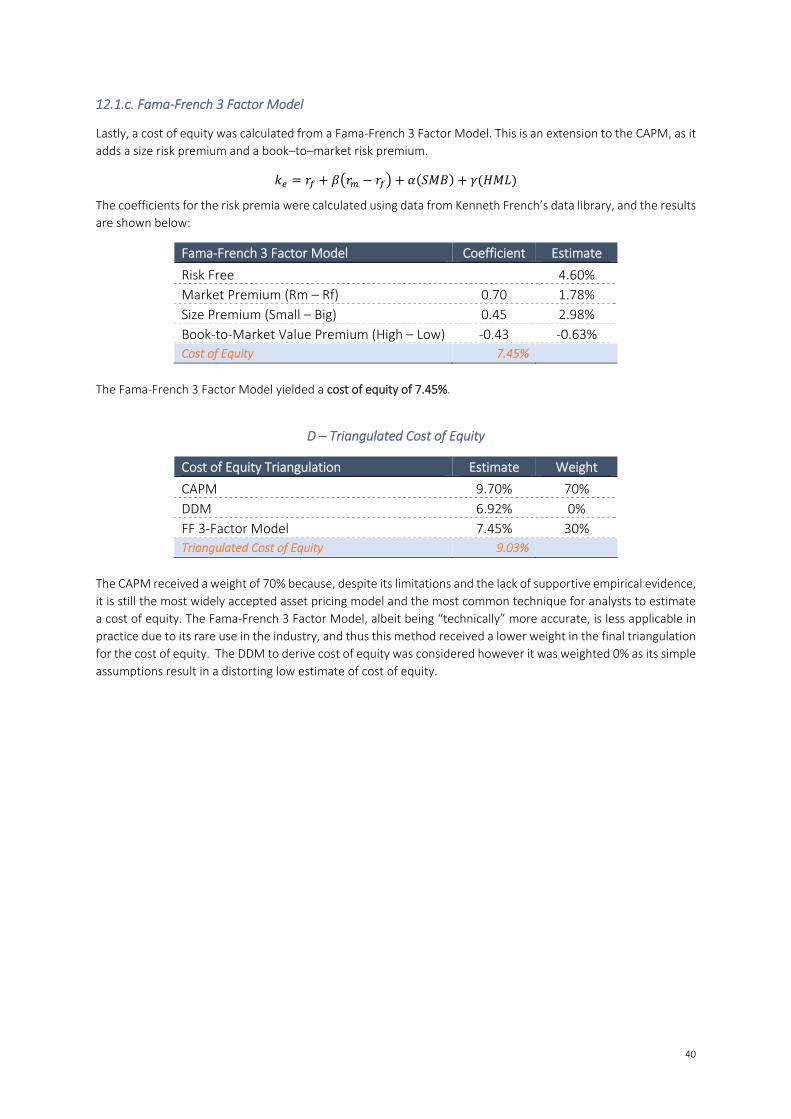
40
12.1.c. Fama‐French 3 Factor Model
Lastly, a cost of equity was calculated from a Fama‐French 3 Factor Model. This is an extension to the CAPM, as it
adds a size risk premium and a book–to–market risk premium.
The coefficients for the risk premia were calculated using data from Kenneth French’s data library, and the results
are shown below:
Fama‐French 3 Factor Model Coefficient Estimate
Risk Free 4.60%
Market Premium (Rm – Rf) 0.70 1.78%
Size Premium (Small – Big) 0.45 2.98%
Book‐to‐Market Value Premium (High – Low) ‐0.43 ‐0.63%
Cost of Equity 7.45%
The Fama‐French 3 Factor Model yielded a cost of equity of 7.45%.
D – Triangulated Cost of Equity
Cost of Equity Triangulation Estimate Weight
CAPM 9.70% 70%
DDM 6.92% 0%
FF 3‐Factor Model 7.45% 30%
Triangulated Cost of Equity 9.03%
The CAPM received a weight of 70% because, despite its limitations and the lack of supportive empirical evidence,
it is still the most widely accepted asset pricing model and the most common technique for analysts to estimate
a cost of equity. The Fama‐French 3 Factor Model, albeit being “technically” more accurate, is less applicable in
practice due to its rare use in the industry, and thus this method received a lower weight in the final triangulation
for the cost of equity. The DDM to derive cost of equity was considered however it was weighted 0% as its simple
assumptions result in a distorting low estimate of cost of equity.
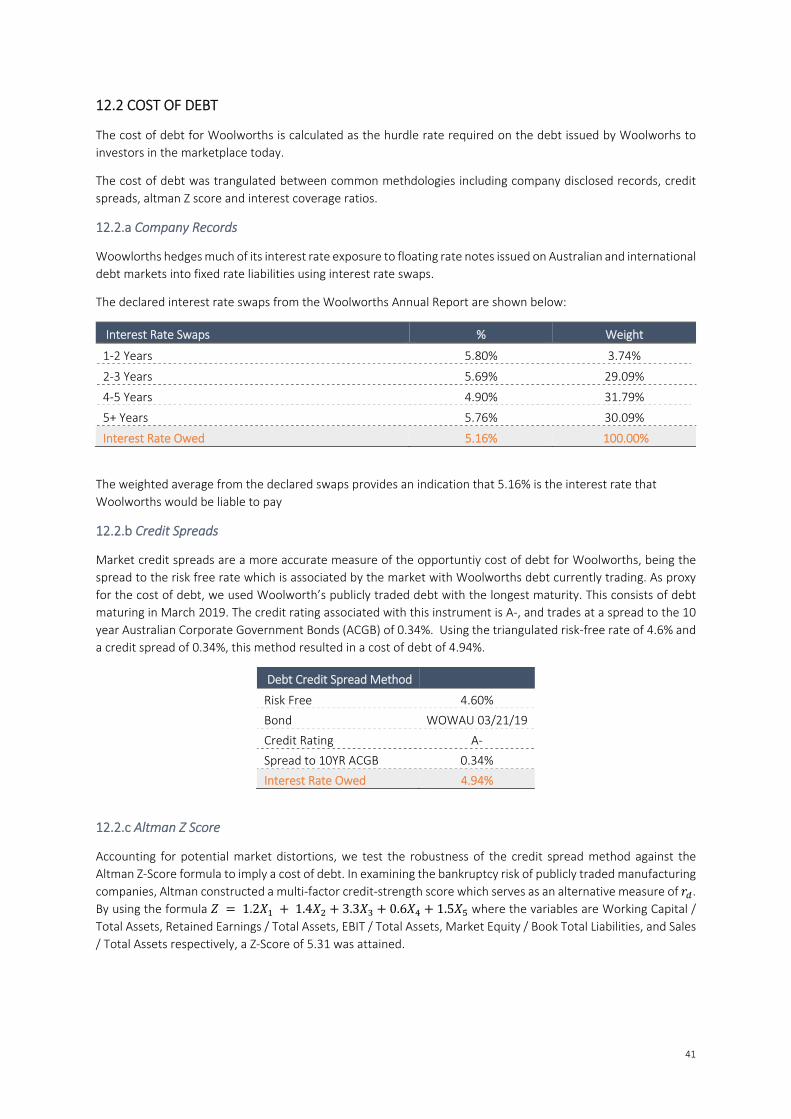
41
12.2 COST OF DEBT
The cost of debt for Woolworths is calculated as the hurdle rate required on the debt issued by Woolworhs to
investors in the marketplace today.
The cost of debt was trangulated between common methdologies including company disclosed records, credit
spreads, altman Z score and interest coverage ratios.
12.2.a Company Records
Woowlorths hedges much of its interest rate exposure to floating rate notes issued on Australian and international
debt markets into fixed rate liabilities using interest rate swaps.
The declared interest rate swaps from the Woolworths Annual Report are shown below:
Interest Rate Swaps % Weight
1‐2 Years 5.80% 3.74%
2‐3 Years 5.69% 29.09%
4‐5 Years 4.90% 31.79%
5+ Years 5.76% 30.09%
Interest Rate Owed 5.16% 100.00%
The weighted average from the declared swaps provides an indication that 5.16% is the interest rate that
Woolworths would be liable to pay
12.2.b Credit Spreads
Market credit spreads are a more accurate measure of the opportuntiy cost of debt for Woolworths, being the
spread to the risk free rate which is associated by the market with Woolworths debt currently trading. As proxy
for the cost of debt, we used Woolworth’s publicly traded debt with the longest maturity. This consists of debt
maturing in March 2019. The credit rating associated with this instrument is A‐, and trades at a spread to the 10
year Australian Corporate Government Bonds (ACGB) of 0.34%. Using the triangulated risk‐free rate of 4.6% and
a credit spread of 0.34%, this method resulted in a cost of debt of 4.94%.
Debt Credit Spread Method
Risk Free 4.60%
Bond WOWAU 03/21/19
Credit Rating A‐
Spread to 10YR ACGB 0.34%
Interest Rate Owed 4.94%
12.2.c Altman Z Score
Accounting for potential market distortions, we test the robustness of the credit spread method against the
Altman Z‐Score formula to imply a cost of debt. In examining the bankruptcy risk of publicly traded manufacturing
companies, Altman constructed a multi‐factor credit‐strength score which serves as an alternative measure of .
By using the formula 1.2 1.4 3.3 0.6 1.5 where the variables are Working Capital /
Total Assets, Retained Earnings / Total Assets, EBIT / Total Assets, Market Equity / Book Total Liabilities, and Sales
/ Total Assets respectively, a Z‐Score of 5.31 was attained.
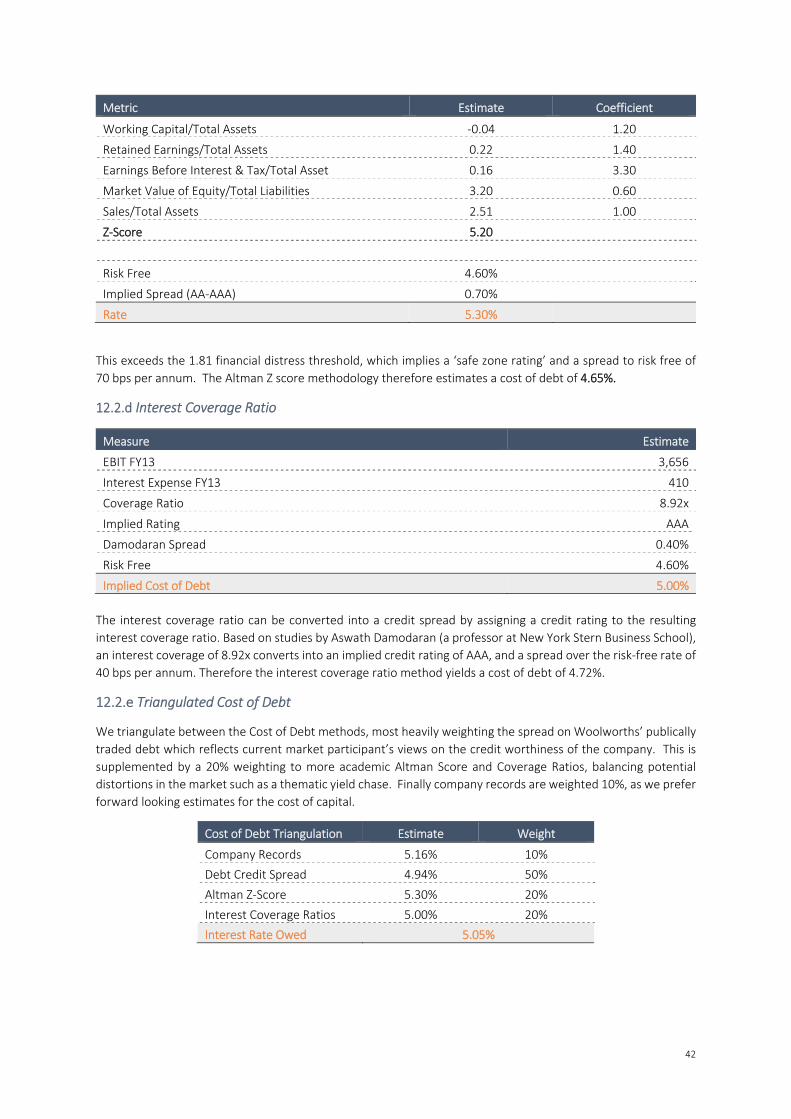
42
Metric Estimate Coefficient
Working Capital/Total Assets ‐0.04 1.20
Retained Earnings/Total Assets 0.22 1.40
Earnings Before Interest & Tax/Total Asset 0.16 3.30
Market Value of Equity/Total Liabilities 3.20 0.60
Sales/Total Assets 2.51 1.00
Z‐Score 5.20
Risk Free 4.60%
Implied Spread (AA‐AAA) 0.70%
Rate 5.30%
This exceeds the 1.81 financial distress threshold, which implies a ‘safe zone rating’ and a spread to risk free of
70 bps per annum. The Altman Z score methodology therefore estimates a cost of debt of 4.65%.
12.2.d Interest Coverage Ratio
Measure Estimate
EBIT FY13 3,656
Interest Expense FY13 410
Coverage Ratio 8.92x
Implied Rating AAA
Damodaran Spread 0.40%
Risk Free 4.60%
Implied Cost of Debt 5.00%
The interest coverage ratio can be converted into a credit spread by assigning a credit rating to the resulting
interest coverage ratio. Based on studies by Aswath Damodaran (a professor at New York Stern Business School),
an interest coverage of 8.92x converts into an implied credit rating of AAA, and a spread over the risk‐free rate of
40 bps per annum. Therefore the interest coverage ratio method yields a cost of debt of 4.72%.
12.2.e Triangulated Cost of Debt
We triangulate between the Cost of Debt methods, most heavily weighting the spread on Woolworths’ publically
traded debt which reflects current market participant’s views on the credit worthiness of the company. This is
supplemented by a 20% weighting to more academic Altman Score and Coverage Ratios, balancing potential
distortions in the market such as a thematic yield chase. Finally company records are weighted 10%, as we prefer
forward looking estimates for the cost of capital.
Cost of Debt Triangulation Estimate Weight
Company Records 5.16% 10%
Debt Credit Spread 4.94% 50%
Altman Z‐Score 5.30% 20%
Interest Coverage Ratios 5.00% 20%
Interest Rate Owed 5.05%
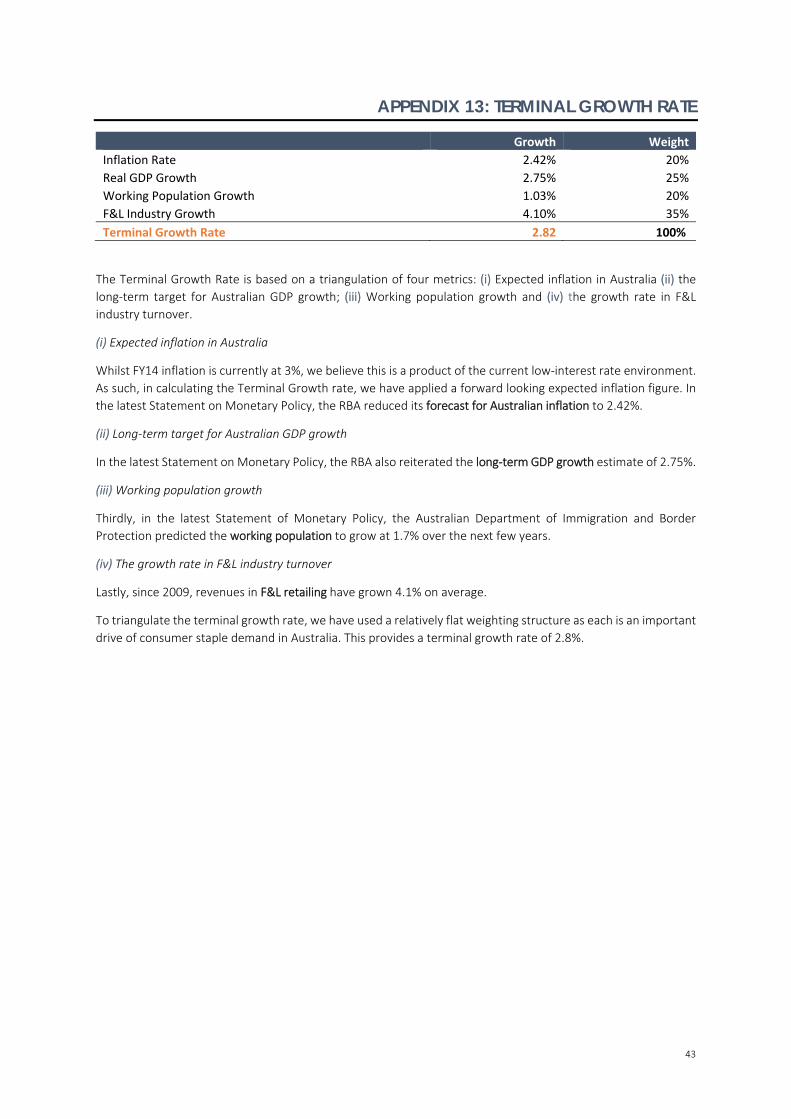
43
APPENDIX 13: TERMINAL GROWTH RATE
Growth Weight
Inflation Rate 2.42% 20%
Real GDP Growth 2.75% 25%
Working Population Growth 1.03% 20%
F&L Industry Growth 4.10% 35%
Terminal Growth Rate 2.82 100%
The Terminal Growth Rate is based on a triangulation of four metrics: (i) Expected inflation in Australia (ii) the
long‐term target for Australian GDP growth; (iii) Working population growth and (iv) the growth rate in F&L
industry turnover.
(i) Expected inflation in Australia
Whilst FY14 inflation is currently at 3%, we believe this is a product of the current low‐interest rate environment.
As such, in calculating the Terminal Growth rate, we have applied a forward looking expected inflation figure. In
the latest Statement on Monetary Policy, the RBA reduced its forecast for Australian inflation to 2.42%.
(ii) Long‐term target for Australian GDP growth
In the latest Statement on Monetary Policy, the RBA also reiterated the long‐term GDP growth estimate of 2.75%.
(iii) Working population growth
Thirdly, in the latest Statement of Monetary Policy, the Australian Department of Immigration and Border
Protection predicted the working population to grow at 1.7% over the next few years.
(iv) The growth rate in F&L industry turnover
Lastly, since 2009, revenues in F&L retailing have grown 4.1% on average.
To triangulate the terminal growth rate, we have used a relatively flat weighting structure as each is an important
drive of consumer staple demand in Australia. This provides a terminal growth rate of 2.8%.
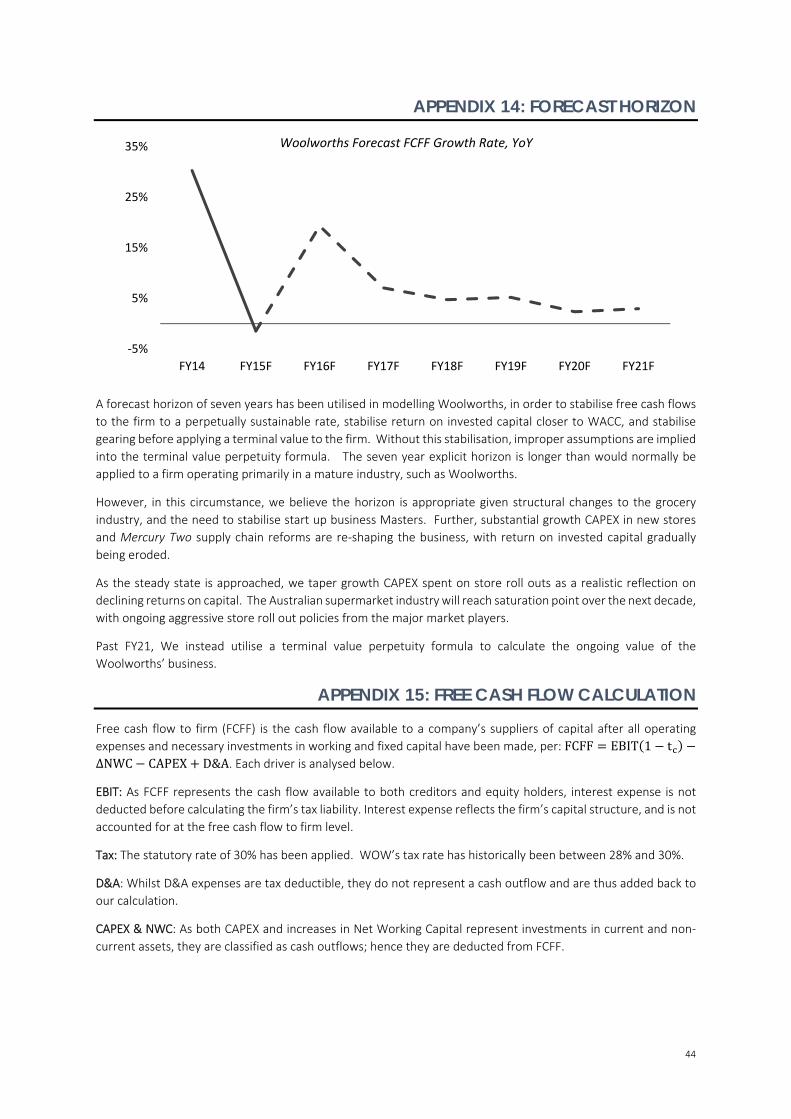
44
APPENDIX 14: FORECAST HORIZON
A forecast horizon of seven years has been utilised in modelling Woolworths, in order to stabilise free cash flows
to the firm to a perpetually sustainable rate, stabilise return on invested capital closer to WACC, and stabilise
gearing before applying a terminal value to the firm. Without this stabilisation, improper assumptions are implied
into the terminal value perpetuity formula. The seven year explicit horizon is longer than would normally be
applied to a firm operating primarily in a mature industry, such as Woolworths.
However, in this circumstance, we believe the horizon is appropriate given structural changes to the grocery
industry, and the need to stabilise start up business Masters. Further, substantial growth CAPEX in new stores
and Mercury Two supply chain reforms are re‐shaping the business, with return on invested capital gradually
being eroded.
As the steady state is approached, we taper growth CAPEX spent on store roll outs as a realistic reflection on
declining returns on capital. The Australian supermarket industry will reach saturation point over the next decade,
with ongoing aggressive store roll out policies from the major market players.
Past FY21, We instead utilise a terminal value perpetuity formula to calculate the ongoing value of the
Woolworths’ business.
APPENDIX 15: FREE CASH FLOW CALCULATION
Free cash flow to firm (FCFF) is the cash flow available to a company’s suppliers of capital after all operating
expenses and necessary investments in working and fixed capital have been made, per: FCFF EBIT 1 t
∆NWC CAPEX D&A. Each driver is analysed below.
EBIT: As FCFF represents the cash flow available to both creditors and equity holders, interest expense is not
deducted before calculating the firm’s tax liability. Interest expense reflects the firm’s capital structure, and is not
accounted for at the free cash flow to firm level.
Tax: The statutory rate of 30% has been applied. WOW’s tax rate has historically been between 28% and 30%.
D&A: Whilst D&A expenses are tax deductible, they do not represent a cash outflow and are thus added back to
our calculation.
CAPEX & NWC: As both CAPEX and increases in Net Working Capital represent investments in current and non‐
current assets, they are classified as cash outflows; hence they are deducted from FCFF.
‐5%
5%
15%
25%
35%
FY14 FY15F FY16F FY17F FY18F FY19F FY20F FY21F
Woolworths Forecast FCFF Growth Rate, YoY
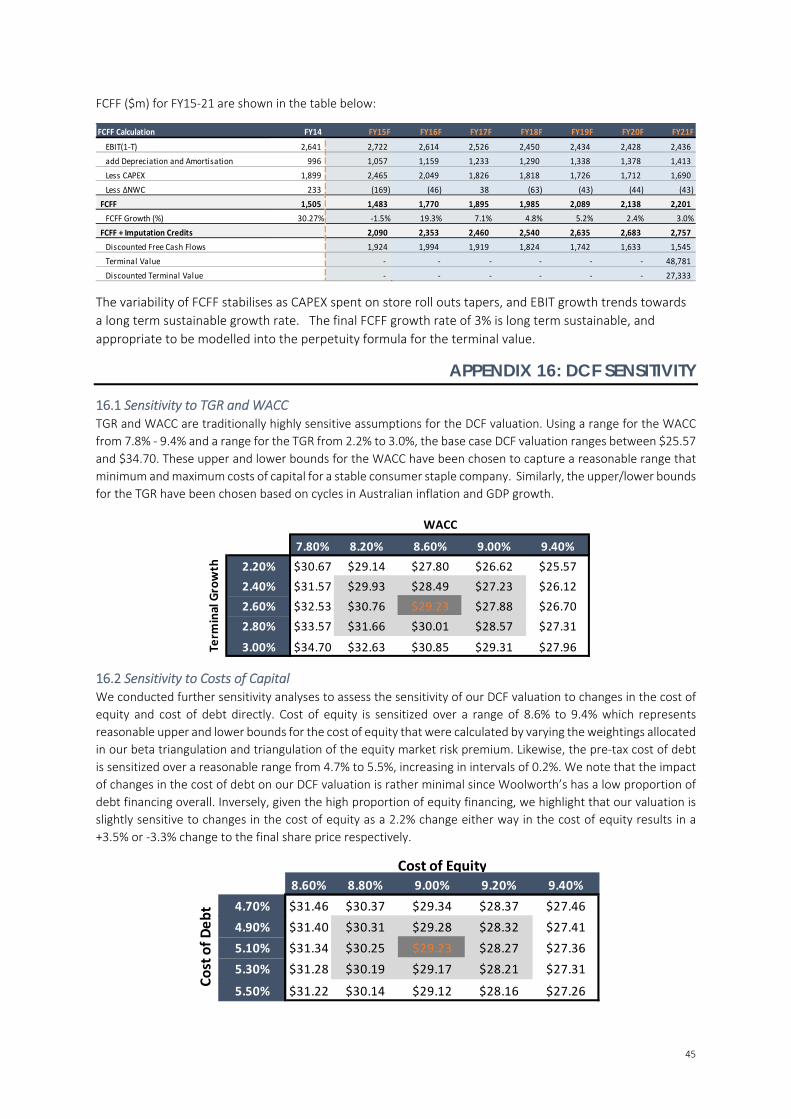
45
FCFF ($m) for FY15‐21 are shown in the table below:
The variability of FCFF stabilises as CAPEX spent on store roll outs tapers, and EBIT growth trends towards
a long term sustainable growth rate. The final FCFF growth rate of 3% is long term sustainable, and
appropriate to be modelled into the perpetuity formula for the terminal value. APPENDIX 16: DCF SENSITIVITY
16.1 Sensitivity to TGR and WACC TGR and WACC are traditionally highly sensitive assumptions for the DCF valuation. Using a range for the WACC
from 7.8% ‐ 9.4% and a range for the TGR from 2.2% to 3.0%, the base case DCF valuation ranges between $25.57
and $34.70. These upper and lower bounds for the WACC have been chosen to capture a reasonable range that
minimum and maximum costs of capital for a stable consumer staple company. Similarly, the upper/lower bounds
for the TGR have been chosen based on cycles in Australian inflation and GDP growth.
16.2 Sensitivity to Costs of Capital We conducted further sensitivity analyses to assess the sensitivity of our DCF valuation to changes in the cost of
equity and cost of debt directly. Cost of equity is sensitized over a range of 8.6% to 9.4% which represents
reasonable upper and lower bounds for the cost of equity that were calculated by varying the weightings allocated
in our beta triangulation and triangulation of the equity market risk premium. Likewise, the pre‐tax cost of debt
is sensitized over a reasonable range from 4.7% to 5.5%, increasing in intervals of 0.2%. We note that the impact
of changes in the cost of debt on our DCF valuation is rather minimal since Woolworth’s has a low proportion of
debt financing overall. Inversely, given the high proportion of equity financing, we highlight that our valuation is
slightly sensitive to changes in the cost of equity as a 2.2% change either way in the cost of equity results in a
+3.5% or ‐3.3% change to the final share price respectively.
FCFF Calculation FY14 FY15F FY16F FY17F FY18F FY19F FY20F FY21F
EBIT(1‐T) 2,641 2,722 2,614 2,526 2,450 2,434 2,428 2,436
add Depreciation and Amortisation 996 1,057 1,159 1,233 1,290 1,338 1,378 1,413
Less CAPEX 1,899 2,465 2,049 1,826 1,818 1,726 1,712 1,690
Less ΔNWC 233 (169) (46) 38 (63) (43) (44) (43)
FCFF 1,505 1,483 1,770 1,895 1,985 2,089 2,138 2,201
FCFF Growth (%) 30.27% ‐1.5% 19.3% 7.1% 4.8% 5.2% 2.4% 3.0%
FCFF + Imputation Credits 2,090 2,353 2,460 2,540 2,635 2,683 2,757
Discounted Free Cash Flows 1,924 1,994 1,919 1,824 1,742 1,633 1,545
Terminal Value ‐ ‐ ‐ ‐ ‐ ‐ 48,781
Discounted Terminal Value ‐ ‐ ‐ ‐ ‐ ‐ 27,333
7.80% 8.20% 8.60% 9.00% 9.40%
2.20% $30.67 $29.14 $27.80 $26.62 $25.57
2.40% $31.57 $29.93 $28.49 $27.23 $26.12
2.60% $32.53 $30.76 $29.23 $27.88 $26.70
2.80% $33.57 $31.66 $30.01 $28.57 $27.31
3.00% $34.70 $32.63 $30.85 $29.31 $27.96
WACC
Term
inal Growth
$29.23 8.60% 8.80% 9.00% 9.20% 9.40%
4.70% $31.46 $30.37 $29.34 $28.37 $27.46
4.90% $31.40 $30.31 $29.28 $28.32 $27.41
5.10% $31.34 $30.25 $29.23 $28.27 $27.36
5.30% $31.28 $30.19 $29.17 $28.21 $27.31
5.50% $31.22 $30.14 $29.12 $28.16 $27.26
Cost of Equity
Cost of Debt
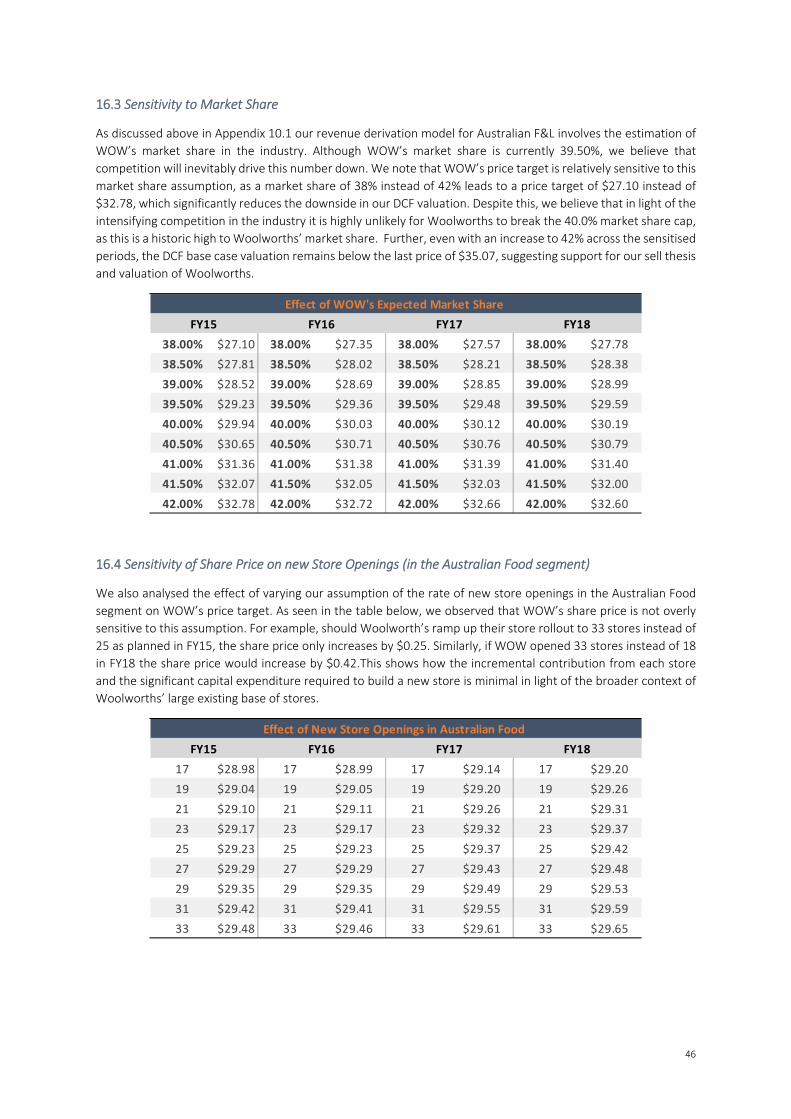
46
16.3 Sensitivity to Market Share
As discussed above in Appendix 10.1 our revenue derivation model for Australian F&L involves the estimation of
WOW’s market share in the industry. Although WOW’s market share is currently 39.50%, we believe that
competition will inevitably drive this number down. We note that WOW’s price target is relatively sensitive to this
market share assumption, as a market share of 38% instead of 42% leads to a price target of $27.10 instead of
$32.78, which significantly reduces the downside in our DCF valuation. Despite this, we believe that in light of the
intensifying competition in the industry it is highly unlikely for Woolworths to break the 40.0% market share cap,
as this is a historic high to Woolworths’ market share. Further, even with an increase to 42% across the sensitised
periods, the DCF base case valuation remains below the last price of $35.07, suggesting support for our sell thesis
and valuation of Woolworths.
16.4 Sensitivity of Share Price on new Store Openings (in the Australian Food segment)
We also analysed the effect of varying our assumption of the rate of new store openings in the Australian Food
segment on WOW’s price target. As seen in the table below, we observed that WOW’s share price is not overly
sensitive to this assumption. For example, should Woolworth’s ramp up their store rollout to 33 stores instead of
25 as planned in FY15, the share price only increases by $0.25. Similarly, if WOW opened 33 stores instead of 18
in FY18 the share price would increase by $0.42.This shows how the incremental contribution from each store
and the significant capital expenditure required to build a new store is minimal in light of the broader context of
Woolworths’ large existing base of stores.
Effect of WOW's Expected Market Share
FY15 FY16 FY17 FY18
38.00% $27.10 38.00% $27.35 38.00% $27.57 38.00% $27.78
38.50% $27.81 38.50% $28.02 38.50% $28.21 38.50% $28.38
39.00% $28.52 39.00% $28.69 39.00% $28.85 39.00% $28.99
39.50% $29.23 39.50% $29.36 39.50% $29.48 39.50% $29.59
40.00% $29.94 40.00% $30.03 40.00% $30.12 40.00% $30.19
40.50% $30.65 40.50% $30.71 40.50% $30.76 40.50% $30.79
41.00% $31.36 41.00% $31.38 41.00% $31.39 41.00% $31.40
41.50% $32.07 41.50% $32.05 41.50% $32.03 41.50% $32.00
42.00% $32.78 42.00% $32.72 42.00% $32.66 42.00% $32.60
Effect of New Store Openings in Australian Food
FY15 FY16 FY17 FY18
17 $28.98 17 $28.99 17 $29.14 17 $29.20
19 $29.04 19 $29.05 19 $29.20 19 $29.26
21 $29.10 21 $29.11 21 $29.26 21 $29.31
23 $29.17 23 $29.17 23 $29.32 23 $29.37
25 $29.23 25 $29.23 25 $29.37 25 $29.42
27 $29.29 27 $29.29 27 $29.43 27 $29.48
29 $29.35 29 $29.35 29 $29.49 29 $29.53
31 $29.42 31 $29.41 31 $29.55 31 $29.59
33 $29.48 33 $29.46 33 $29.61 33 $29.65
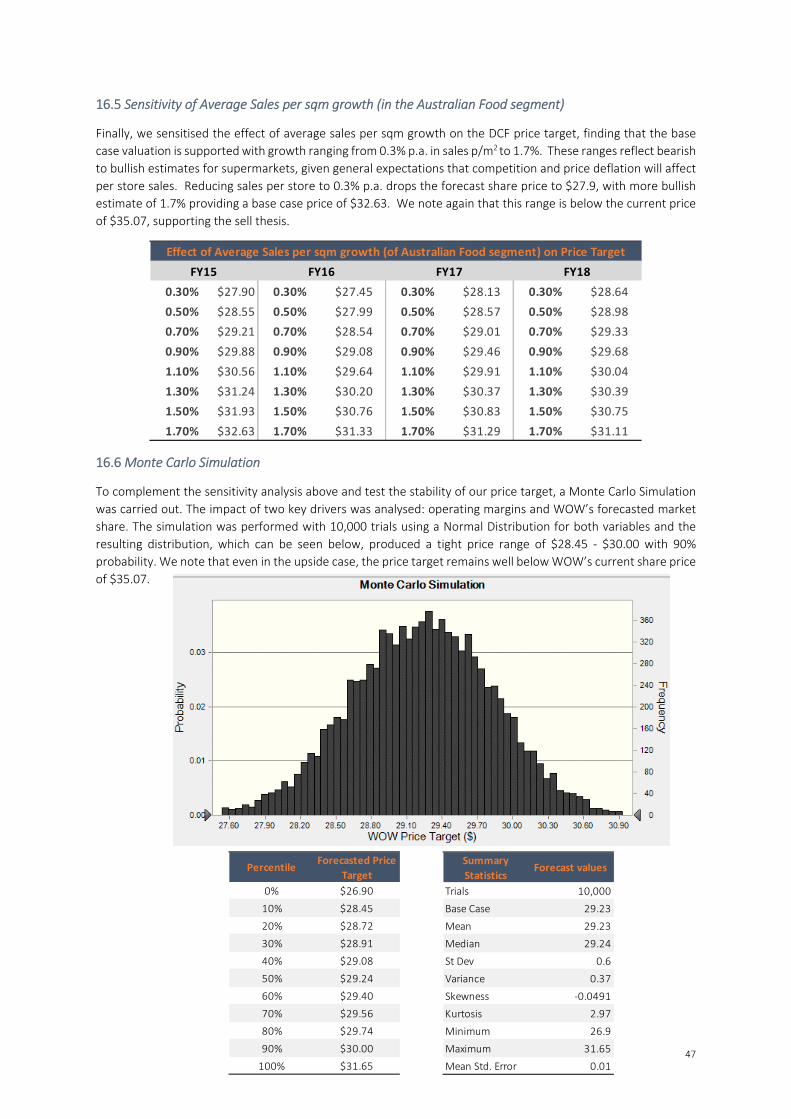
47
16.5 Sensitivity of Average Sales per sqm growth (in the Australian Food segment)
Finally, we sensitised the effect of average sales per sqm growth on the DCF price target, finding that the base
case valuation is supported with growth ranging from 0.3% p.a. in sales p/m2 to 1.7%. These ranges reflect bearish
to bullish estimates for supermarkets, given general expectations that competition and price deflation will affect
per store sales. Reducing sales per store to 0.3% p.a. drops the forecast share price to $27.9, with more bullish
estimate of 1.7% providing a base case price of $32.63. We note again that this range is below the current price
of $35.07, supporting the sell thesis.
16.6 Monte Carlo Simulation
To complement the sensitivity analysis above and test the stability of our price target, a Monte Carlo Simulation
was carried out. The impact of two key drivers was analysed: operating margins and WOW’s forecasted market
share. The simulation was performed with 10,000 trials using a Normal Distribution for both variables and the
resulting distribution, which can be seen below, produced a tight price range of $28.45 ‐ $30.00 with 90%
probability. We note that even in the upside case, the price target remains well below WOW’s current share price
of $35.07.
Effect of Average Sales per sqm growth (of Australian Food segment) on Price Target
FY15 FY16 FY17 FY18
0.30% $27.90 0.30% $27.45 0.30% $28.13 0.30% $28.64
0.50% $28.55 0.50% $27.99 0.50% $28.57 0.50% $28.98
0.70% $29.21 0.70% $28.54 0.70% $29.01 0.70% $29.33
0.90% $29.88 0.90% $29.08 0.90% $29.46 0.90% $29.68
1.10% $30.56 1.10% $29.64 1.10% $29.91 1.10% $30.04
1.30% $31.24 1.30% $30.20 1.30% $30.37 1.30% $30.39
1.50% $31.93 1.50% $30.76 1.50% $30.83 1.50% $30.75
1.70% $32.63 1.70% $31.33 1.70% $31.29 1.70% $31.11
Summary
StatisticsForecast values
Trials 10,000
Base Case 29.23
Mean 29.23
Median 29.24
St Dev 0.6
Variance 0.37
Skewness ‐0.0491
Kurtosis 2.97
Minimum 26.9
Maximum 31.65
Mean Std. Error 0.01
PercentileForecasted Price
Target
0% $26.90
10% $28.45
20% $28.72
30% $28.91
40% $29.08
50% $29.24
60% $29.40
70% $29.56
80% $29.74
90% $30.00
100% $31.65
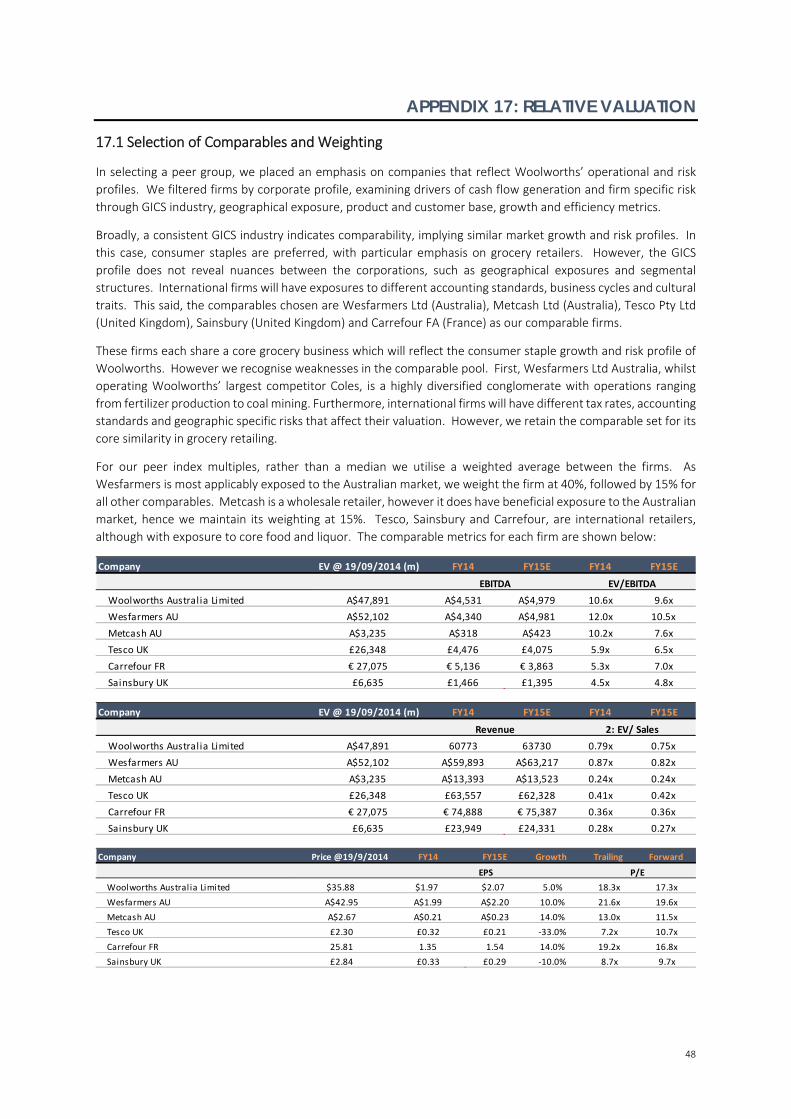
48
APPENDIX 17: RELATIVE VALUATION
17.1 Selection of Comparables and Weighting
In selecting a peer group, we placed an emphasis on companies that reflect Woolworths’ operational and risk
profiles. We filtered firms by corporate profile, examining drivers of cash flow generation and firm specific risk
through GICS industry, geographical exposure, product and customer base, growth and efficiency metrics.
Broadly, a consistent GICS industry indicates comparability, implying similar market growth and risk profiles. In
this case, consumer staples are preferred, with particular emphasis on grocery retailers. However, the GICS
profile does not reveal nuances between the corporations, such as geographical exposures and segmental
structures. International firms will have exposures to different accounting standards, business cycles and cultural
traits. This said, the comparables chosen are Wesfarmers Ltd (Australia), Metcash Ltd (Australia), Tesco Pty Ltd
(United Kingdom), Sainsbury (United Kingdom) and Carrefour FA (France) as our comparable firms.
These firms each share a core grocery business which will reflect the consumer staple growth and risk profile of
Woolworths. However we recognise weaknesses in the comparable pool. First, Wesfarmers Ltd Australia, whilst
operating Woolworths’ largest competitor Coles, is a highly diversified conglomerate with operations ranging
from fertilizer production to coal mining. Furthermore, international firms will have different tax rates, accounting
standards and geographic specific risks that affect their valuation. However, we retain the comparable set for its
core similarity in grocery retailing.
For our peer index multiples, rather than a median we utilise a weighted average between the firms. As
Wesfarmers is most applicably exposed to the Australian market, we weight the firm at 40%, followed by 15% for
all other comparables. Metcash is a wholesale retailer, however it does have beneficial exposure to the Australian
market, hence we maintain its weighting at 15%. Tesco, Sainsbury and Carrefour, are international retailers,
although with exposure to core food and liquor. The comparable metrics for each firm are shown below:
Company EV @ 19/09/2014 (m) FY14 FY15E FY14 FY15E
Woolworths Australia Limited A$47,891 A$4,531 A$4,979 10.6x 9.6x
Wesfarmers AU A$52,102 A$4,340 A$4,981 12.0x 10.5x
Metcash AU A$3,235 A$318 A$423 10.2x 7.6x
Tesco UK £26,348 £4,476 £4,075 5.9x 6.5x
Carrefour FR € 27,075 € 5,136 € 3,863 5.3x 7.0x
Sainsbury UK £6,635 £1,466 £1,395 4.5x 4.8x
EBITDA EV/EBITDA
Company EV @ 19/09/2014 (m) FY14 FY15E FY14 FY15E
Woolworths Australia Limited A$47,891 60773 63730 0.79x 0.75x
Wesfarmers AU A$52,102 A$59,893 A$63,217 0.87x 0.82x
Metcash AU A$3,235 A$13,393 A$13,523 0.24x 0.24x
Tesco UK £26,348 £63,557 £62,328 0.41x 0.42x
Carrefour FR € 27,075 € 74,888 € 75,387 0.36x 0.36x
Sainsbury UK £6,635 £23,949 £24,331 0.28x 0.27x
Revenue 2: EV/ Sales
Company Price @19/9/2014 FY14 FY15E Growth Trailing Forward
Woolworths Australia Limited $35.88 $1.97 $2.07 5.0% 18.3x 17.3x
Wesfarmers AU A$42.95 A$1.99 A$2.20 10.0% 21.6x 19.6x
Metcash AU A$2.67 A$0.21 A$0.23 14.0% 13.0x 11.5x
Tesco UK £2.30 £0.32 £0.21 ‐33.0% 7.2x 10.7x
Carrefour FR 25.81 1.35 1.54 14.0% 19.2x 16.8x
Sainsbury UK £2.84 £0.33 £0.29 ‐10.0% 8.7x 9.7x
EPS P/E
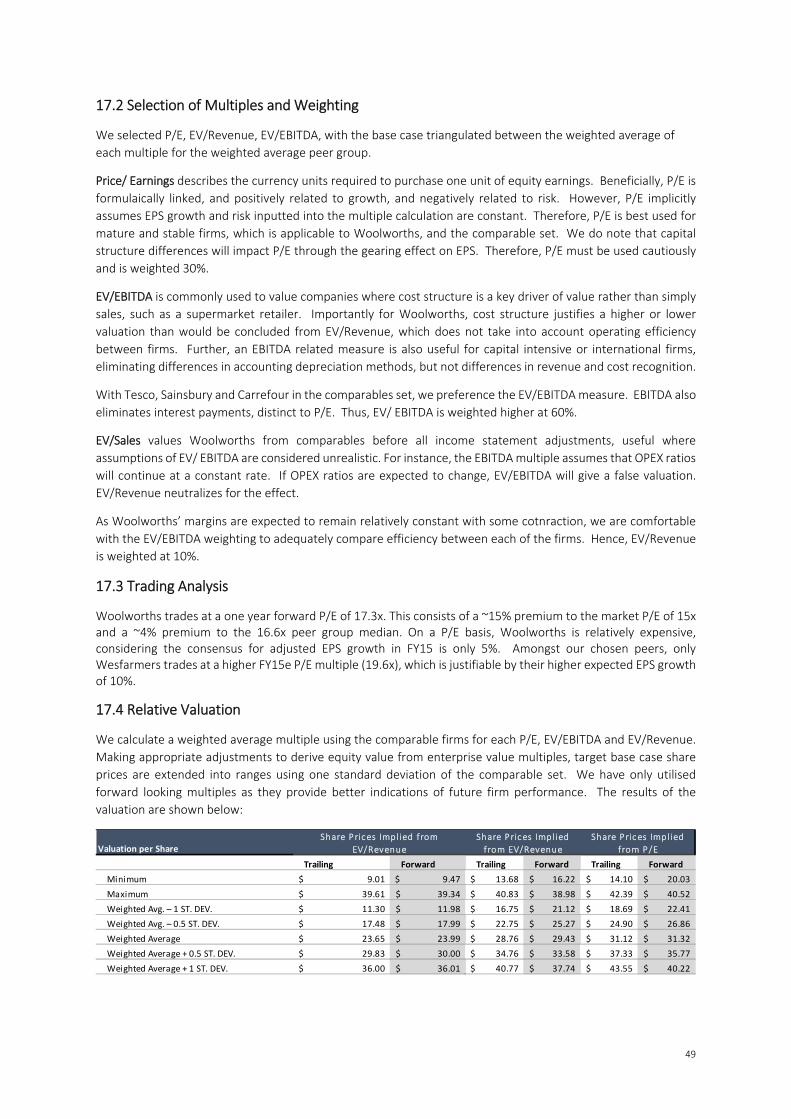
49
17.2 Selection of Multiples and Weighting
We selected P/E, EV/Revenue, EV/EBITDA, with the base case triangulated between the weighted average of
each multiple for the weighted average peer group.
Price/ Earnings describes the currency units required to purchase one unit of equity earnings. Beneficially, P/E is
formulaically linked, and positively related to growth, and negatively related to risk. However, P/E implicitly
assumes EPS growth and risk inputted into the multiple calculation are constant. Therefore, P/E is best used for
mature and stable firms, which is applicable to Woolworths, and the comparable set. We do note that capital
structure differences will impact P/E through the gearing effect on EPS. Therefore, P/E must be used cautiously
and is weighted 30%.
EV/EBITDA is commonly used to value companies where cost structure is a key driver of value rather than simply
sales, such as a supermarket retailer. Importantly for Woolworths, cost structure justifies a higher or lower
valuation than would be concluded from EV/Revenue, which does not take into account operating efficiency
between firms. Further, an EBITDA related measure is also useful for capital intensive or international firms,
eliminating differences in accounting depreciation methods, but not differences in revenue and cost recognition.
With Tesco, Sainsbury and Carrefour in the comparables set, we preference the EV/EBITDA measure. EBITDA also
eliminates interest payments, distinct to P/E. Thus, EV/ EBITDA is weighted higher at 60%.
EV/Sales values Woolworths from comparables before all income statement adjustments, useful where
assumptions of EV/ EBITDA are considered unrealistic. For instance, the EBITDA multiple assumes that OPEX ratios
will continue at a constant rate. If OPEX ratios are expected to change, EV/EBITDA will give a false valuation.
EV/Revenue neutralizes for the effect.
As Woolworths’ margins are expected to remain relatively constant with some cotnraction, we are comfortable
with the EV/EBITDA weighting to adequately compare efficiency between each of the firms. Hence, EV/Revenue
is weighted at 10%.
17.3 Trading Analysis
Woolworths trades at a one year forward P/E of 17.3x. This consists of a ~15% premium to the market P/E of 15x and a ~4% premium to the 16.6x peer group median. On a P/E basis, Woolworths is relatively expensive, considering the consensus for adjusted EPS growth in FY15 is only 5%. Amongst our chosen peers, only Wesfarmers trades at a higher FY15e P/E multiple (19.6x), which is justifiable by their higher expected EPS growth of 10%.
17.4 Relative Valuation
We calculate a weighted average multiple using the comparable firms for each P/E, EV/EBITDA and EV/Revenue.
Making appropriate adjustments to derive equity value from enterprise value multiples, target base case share
prices are extended into ranges using one standard deviation of the comparable set. We have only utilised
forward looking multiples as they provide better indications of future firm performance. The results of the
valuation are shown below:
Valuation per Share
Trailing Forward Trailing Forward Trailing Forward
Minimum 9.01$ 9.47$ 13.68$ 16.22$ 14.10$ 20.03$
Maximum 39.61$ 39.34$ 40.83$ 38.98$ 42.39$ 40.52$
Weighted Avg. – 1 ST. DEV. 11.30$ 11.98$ 16.75$ 21.12$ 18.69$ 22.41$
Weighted Avg. – 0.5 ST. DEV. 17.48$ 17.99$ 22.75$ 25.27$ 24.90$ 26.86$
Weighted Average 23.65$ 23.99$ 28.76$ 29.43$ 31.12$ 31.32$
Weighted Average + 0.5 ST. DEV. 29.83$ 30.00$ 34.76$ 33.58$ 37.33$ 35.77$
Weighted Average + 1 ST. DEV. 36.00$ 36.01$ 40.77$ 37.74$ 43.55$ 40.22$
Share Prices Impl ied from
EV/Revenue
Share Prices Implied
from EV/Revenue
Share Prices Implied
from P/E
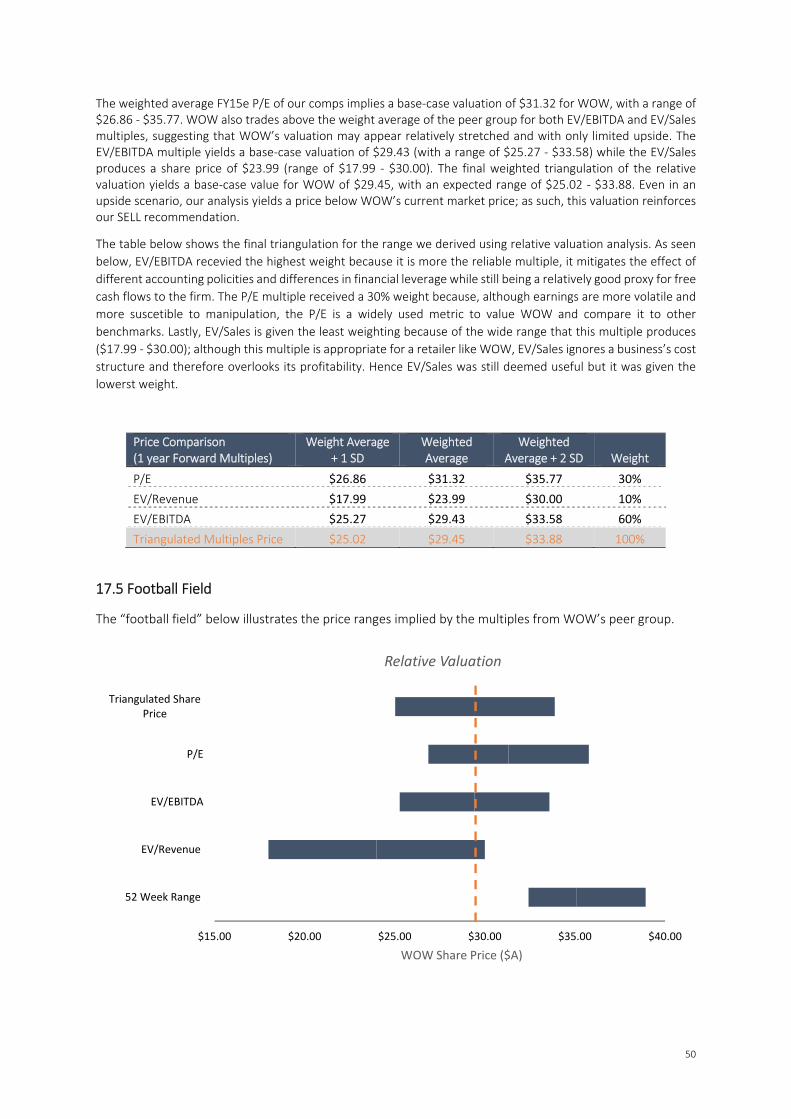
50
The weighted average FY15e P/E of our comps implies a base‐case valuation of $31.32 for WOW, with a range of $26.86 ‐ $35.77. WOW also trades above the weight average of the peer group for both EV/EBITDA and EV/Sales multiples, suggesting that WOW’s valuation may appear relatively stretched and with only limited upside. The EV/EBITDA multiple yields a base‐case valuation of $29.43 (with a range of $25.27 ‐ $33.58) while the EV/Sales produces a share price of $23.99 (range of $17.99 ‐ $30.00). The final weighted triangulation of the relative valuation yields a base‐case value for WOW of $29.45, with an expected range of $25.02 ‐ $33.88. Even in an upside scenario, our analysis yields a price below WOW’s current market price; as such, this valuation reinforces our SELL recommendation.
The table below shows the final triangulation for the range we derived using relative valuation analysis. As seen
below, EV/EBITDA recevied the highest weight because it is more the reliable multiple, it mitigates the effect of
different accounting policities and differences in financial leverage while still being a relatively good proxy for free
cash flows to the firm. The P/E multiple received a 30% weight because, although earnings are more volatile and
more suscetible to manipulation, the P/E is a widely used metric to value WOW and compare it to other
benchmarks. Lastly, EV/Sales is given the least weighting because of the wide range that this multiple produces
($17.99 ‐ $30.00); although this multiple is appropriate for a retailer like WOW, EV/Sales ignores a business’s cost
structure and therefore overlooks its profitability. Hence EV/Sales was still deemed useful but it was given the
lowerst weight.
Price Comparison (1 year Forward Multiples)
Weight Average + 1 SD
Weighted Average
Weighted Average + 2 SD Weight
P/E $26.86 $31.32 $35.77 30%
EV/Revenue $17.99 $23.99 $30.00 10%
EV/EBITDA $25.27 $29.43 $33.58 60%
Triangulated Multiples Price $25.02 $29.45 $33.88 100%
17.5 Football Field
The “football field” below illustrates the price ranges implied by the multiples from WOW’s peer group.
$15.00 $20.00 $25.00 $30.00 $35.00 $40.00
52 Week Range
EV/Revenue
EV/EBITDA
P/E
Triangulated SharePrice
WOW Share Price ($A)
Relative Valuation
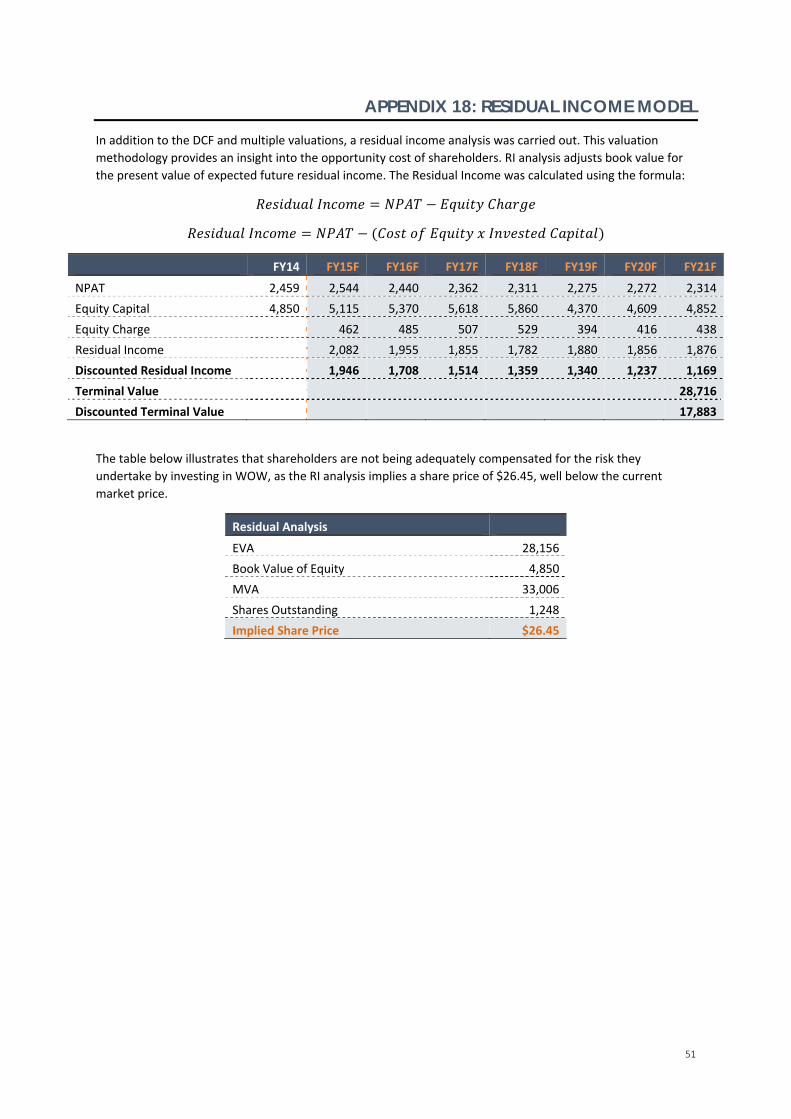
51
APPENDIX 18: RESIDUAL INCOME MODEL
In addition to the DCF and multiple valuations, a residual income analysis was carried out. This valuation
methodology provides an insight into the opportunity cost of shareholders. RI analysis adjusts book value for
the present value of expected future residual income. The Residual Income was calculated using the formula:
FY14 FY15F FY16F FY17F FY18F FY19F FY20F FY21F
NPAT 2,459 2,544 2,440 2,362 2,311 2,275 2,272 2,314
Equity Capital 4,850 5,115 5,370 5,618 5,860 4,370 4,609 4,852
Equity Charge 462 485 507 529 394 416 438
Residual Income 2,082 1,955 1,855 1,782 1,880 1,856 1,876
Discounted Residual Income 1,946 1,708 1,514 1,359 1,340 1,237 1,169
Terminal Value 28,716
Discounted Terminal Value 17,883
The table below illustrates that shareholders are not being adequately compensated for the risk they
undertake by investing in WOW, as the RI analysis implies a share price of $26.45, well below the current
market price.
Residual Analysis
EVA 28,156
Book Value of Equity 4,850
MVA 33,006
Shares Outstanding 1,248
Implied Share Price $26.45
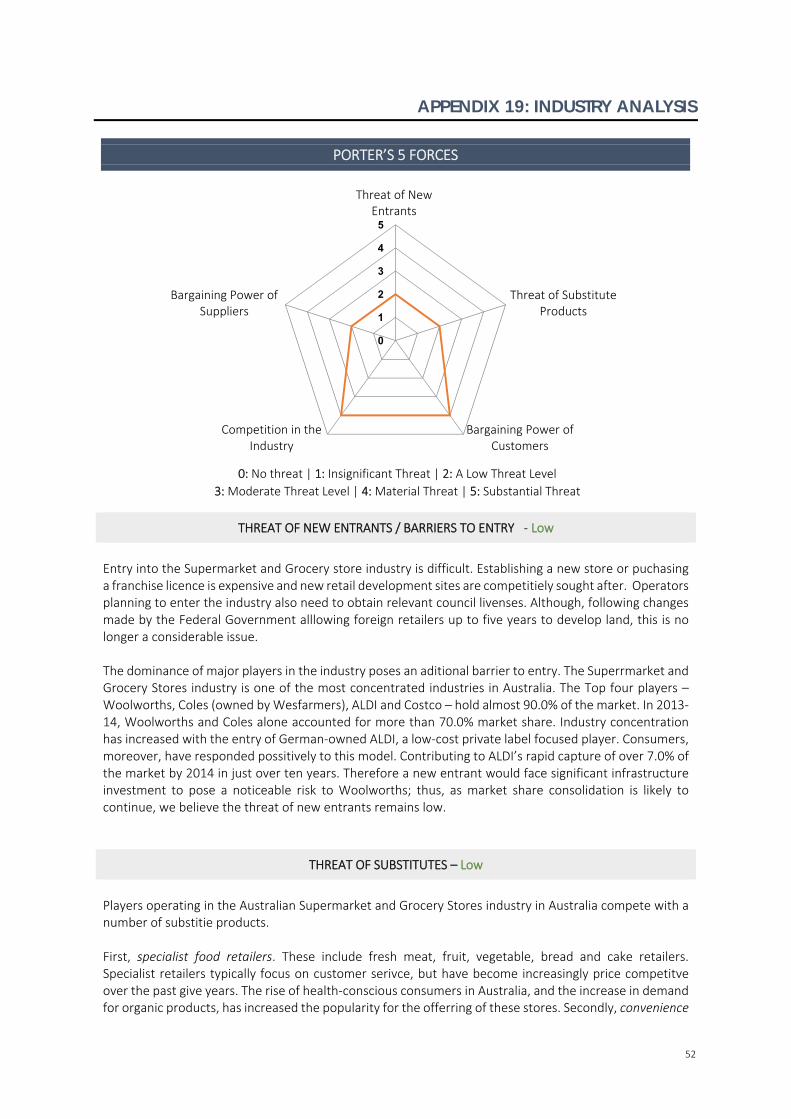
52
0
1
2
3
4
5
Threat of NewEntrants
Threat of SubstituteProducts
Bargaining Power ofCustomers
Competition in theIndustry
Bargaining Power ofSuppliers
APPENDIX 19: INDUSTRY ANALYSIS
PORTER’S 5 FORCES
THREAT OF NEW ENTRANTS / BARRIERS TO ENTRY ‐ Low
Entry into the Supermarket and Grocery store industry is difficult. Establishing a new store or puchasing a franchise licence is expensive and new retail development sites are competitiely sought after. Operators planning to enter the industry also need to obtain relevant council livenses. Although, following changes made by the Federal Government alllowing foreign retailers up to five years to develop land, this is no longer a considerable issue. The dominance of major players in the industry poses an aditional barrier to entry. The Superrmarket and Grocery Stores industry is one of the most concentrated industries in Australia. The Top four players – Woolworths, Coles (owned by Wesfarmers), ALDI and Costco – hold almost 90.0% of the market. In 2013‐14, Woolworths and Coles alone accounted for more than 70.0% market share. Industry concentration has increased with the entry of German‐owned ALDI, a low‐cost private label focused player. Consumers, moreover, have responded possitively to this model. Contributing to ALDI’s rapid capture of over 7.0% of the market by 2014 in just over ten years. Therefore a new entrant would face significant infrastructure investment to pose a noticeable risk to Woolworths; thus, as market share consolidation is likely to continue, we believe the threat of new entrants remains low.
THREAT OF SUBSTITUTES – Low
Players operating in the Australian Supermarket and Grocery Stores industry in Australia compete with a number of substitie products. First, specialist food retailers. These include fresh meat, fruit, vegetable, bread and cake retailers. Specialist retailers typically focus on customer serivce, but have become increasingly price competitve over the past give years. The rise of health‐conscious consumers in Australia, and the increase in demand for organic products, has increased the popularity for the offerring of these stores. Secondly, convenience
0: No threat | 1: Insignificant Threat | 2: A Low Threat Level
3: Moderate Threat Level | 4: Material Threat | 5: Substantial Threat
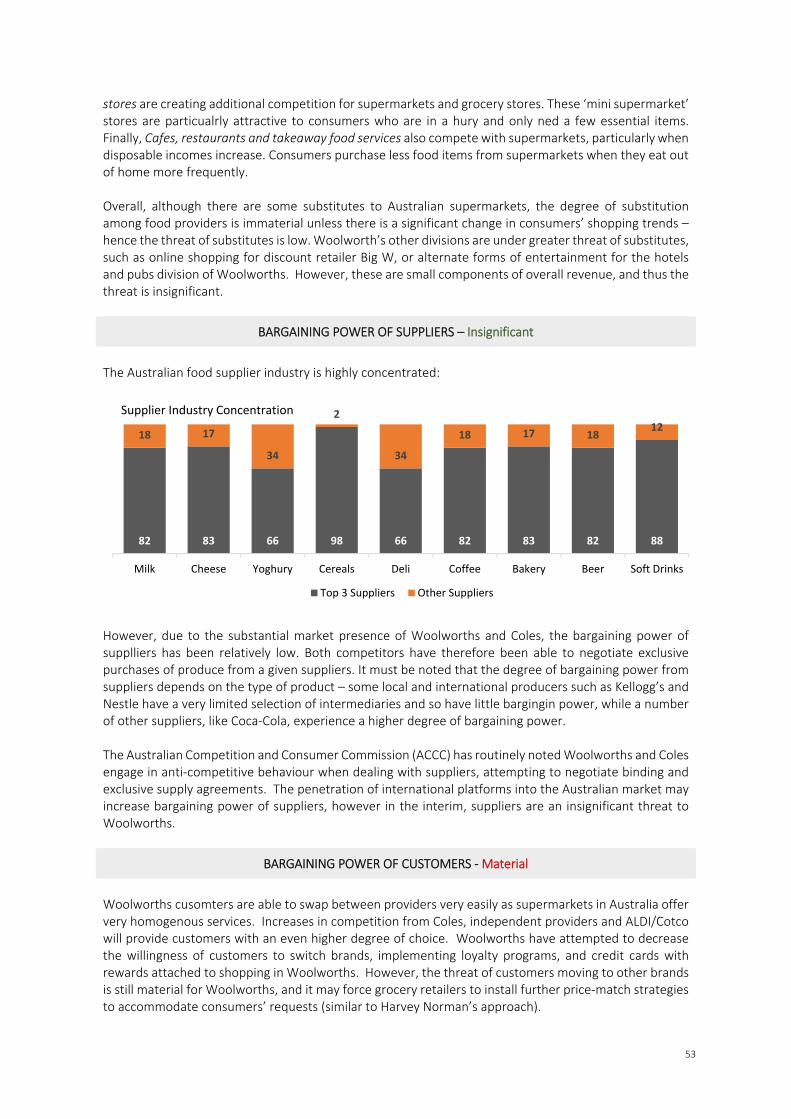
53
stores are creating additional competition for supermarkets and grocery stores. These ‘mini supermarket’ stores are particualrly attractive to consumers who are in a hury and only ned a few essential items. Finally, Cafes, restaurants and takeaway food services also compete with supermarkets, particularly when disposable incomes increase. Consumers purchase less food items from supermarkets when they eat out of home more frequently. Overall, although there are some substitutes to Australian supermarkets, the degree of substitution among food providers is immaterial unless there is a significant change in consumers’ shopping trends – hence the threat of substitutes is low. Woolworth’s other divisions are under greater threat of substitutes, such as online shopping for discount retailer Big W, or alternate forms of entertainment for the hotels and pubs division of Woolworths. However, these are small components of overall revenue, and thus the threat is insignificant.
BARGAINING POWER OF SUPPLIERS – Insignificant
The Australian food supplier industry is highly concentrated:
However, due to the substantial market presence of Woolworths and Coles, the bargaining power of supplliers has been relatively low. Both competitors have therefore been able to negotiate exclusive purchases of produce from a given suppliers. It must be noted that the degree of bargaining power from suppliers depends on the type of product – some local and international producers such as Kellogg’s and Nestle have a very limited selection of intermediaries and so have little bargingin power, while a number of other suppliers, like Coca‐Cola, experience a higher degree of bargaining power. The Australian Competition and Consumer Commission (ACCC) has routinely noted Woolworths and Coles engage in anti‐competitive behaviour when dealing with suppliers, attempting to negotiate binding and exclusive supply agreements. The penetration of international platforms into the Australian market may increase bargaining power of suppliers, however in the interim, suppliers are an insignificant threat to Woolworths.
BARGAINING POWER OF CUSTOMERS ‐ Material
Woolworths cusomters are able to swap between providers very easily as supermarkets in Australia offer very homogenous services. Increases in competition from Coles, independent providers and ALDI/Cotco will provide customers with an even higher degree of choice. Woolworths have attempted to decrease the willingness of customers to switch brands, implementing loyalty programs, and credit cards with rewards attached to shopping in Woolworths. However, the threat of customers moving to other brands is still material for Woolworths, and it may force grocery retailers to install further price‐match strategies to accommodate consumers’ requests (similar to Harvey Norman’s approach).
82 83 66 98 66 82 83 82 88
18 17
34
2
34
18 17 1812
Milk Cheese Yoghury Cereals Deli Coffee Bakery Beer Soft Drinks
Supplier Industry Concentration
Top 3 Suppliers Other Suppliers
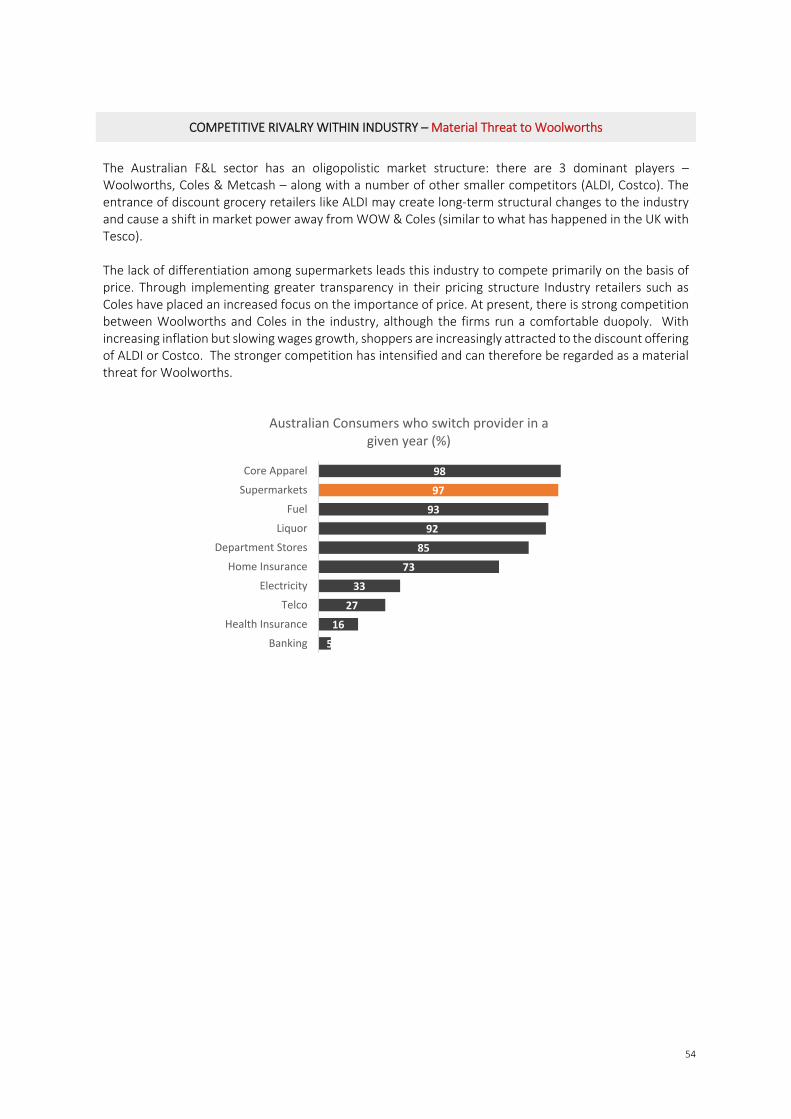
54
COMPETITIVE RIVALRY WITHIN INDUSTRY – Material Threat to Woolworths
The Australian F&L sector has an oligopolistic market structure: there are 3 dominant players – Woolworths, Coles & Metcash – along with a number of other smaller competitors (ALDI, Costco). The entrance of discount grocery retailers like ALDI may create long‐term structural changes to the industry and cause a shift in market power away from WOW & Coles (similar to what has happened in the UK with Tesco). The lack of differentiation among supermarkets leads this industry to compete primarily on the basis of price. Through implementing greater transparency in their pricing structure Industry retailers such as Coles have placed an increased focus on the importance of price. At present, there is strong competition between Woolworths and Coles in the industry, although the firms run a comfortable duopoly. With increasing inflation but slowing wages growth, shoppers are increasingly attracted to the discount offering of ALDI or Costco. The stronger competition has intensified and can therefore be regarded as a material threat for Woolworths.
98
97
93
92
85
73
33
27
16
5
Core Apparel
Supermarkets
Fuel
Liquor
Department Stores
Home Insurance
Electricity
Telco
Health Insurance
Banking
Australian Consumers who switch provider in a given year (%)
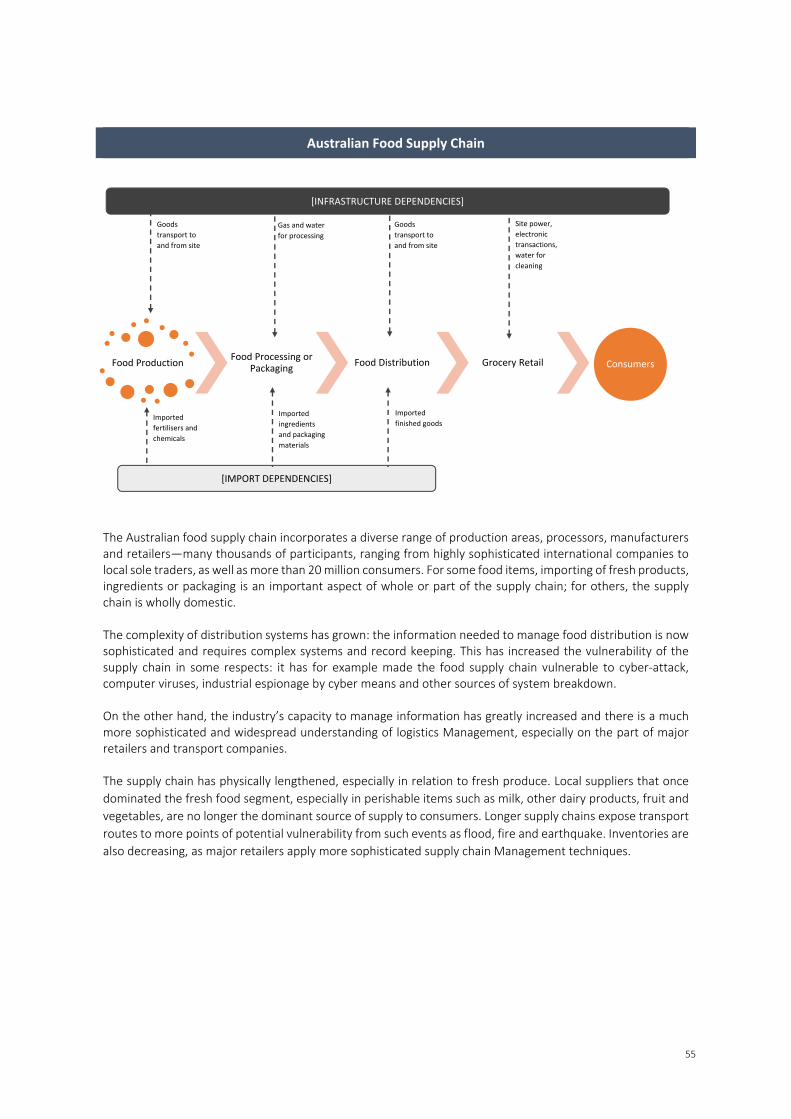
55
Australian Food Supply Chain
The Australian food supply chain incorporates a diverse range of production areas, processors, manufacturers and retailers—many thousands of participants, ranging from highly sophisticated international companies to local sole traders, as well as more than 20 million consumers. For some food items, importing of fresh products, ingredients or packaging is an important aspect of whole or part of the supply chain; for others, the supply chain is wholly domestic. The complexity of distribution systems has grown: the information needed to manage food distribution is now sophisticated and requires complex systems and record keeping. This has increased the vulnerability of the supply chain in some respects: it has for example made the food supply chain vulnerable to cyber‐attack, computer viruses, industrial espionage by cyber means and other sources of system breakdown. On the other hand, the industry’s capacity to manage information has greatly increased and there is a much more sophisticated and widespread understanding of logistics Management, especially on the part of major retailers and transport companies. The supply chain has physically lengthened, especially in relation to fresh produce. Local suppliers that once
dominated the fresh food segment, especially in perishable items such as milk, other dairy products, fruit and
vegetables, are no longer the dominant source of supply to consumers. Longer supply chains expose transport
routes to more points of potential vulnerability from such events as flood, fire and earthquake. Inventories are
also decreasing, as major retailers apply more sophisticated supply chain Management techniques.
Site power,
electronic
transactions,
water for
cleaning
Goods
transport to
and from site
Gas and water
for processing
Goods
transport to
and from site
[INFRASTRUCTURE DEPENDENCIES]
[IMPORT DEPENDENCIES]
Food ProductionFood Processing or
PackagingFood Distribution Grocery Retail Consumers
Imported
fertilisers and
chemicals
Imported
ingredients
and packaging
materials
Imported
finished goods
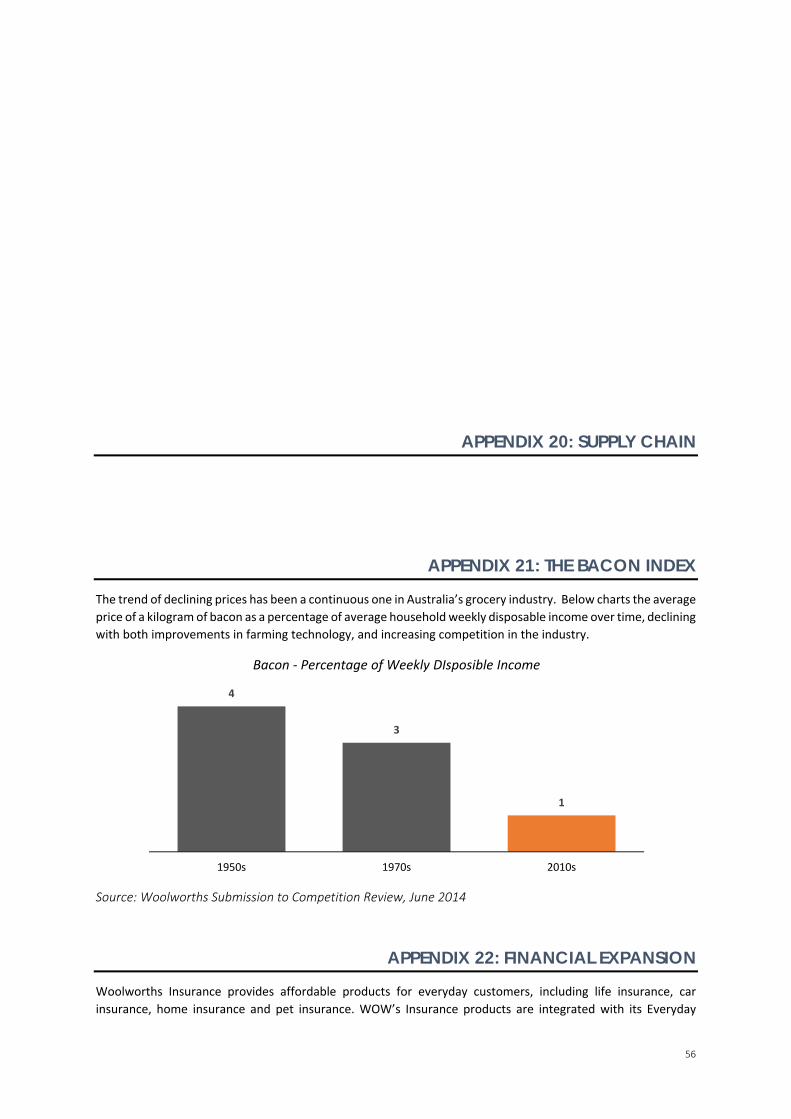
56
APPENDIX 20: SUPPLY CHAIN
APPENDIX 21: THE BACON INDEX
The trend of declining prices has been a continuous one in Australia’s grocery industry. Below charts the average
price of a kilogram of bacon as a percentage of average household weekly disposable income over time, declining
with both improvements in farming technology, and increasing competition in the industry.
Source: Woolworths Submission to Competition Review, June 2014
APPENDIX 22: FINANCIAL EXPANSION
Woolworths Insurance provides affordable products for everyday customers, including life insurance, car
insurance, home insurance and pet insurance. WOW’s Insurance products are integrated with its Everyday
4
3
1
1950s 1970s 2010s
Bacon ‐ Percentage of Weekly DIsposible Income
57
Rewards loyalty program as well as to members who hold Qantas Frequent Flyer (QFF) credit cards; this allows
customers to earn QFF points when they purchase insurance premiums. Woolworths provides insurance through
two partners: Swiss Re, which is a large, global reinsurance firm, and The Hollard Group, an international
insurance service provider. Essentially WOW leverages the resources of these established providers; generally
Swiss Re will act as the reinsurer to Hollard, the underwriter. WOW then carries out the marketing of the
insurance product offering and handles the customer relationships. In June 2014, Woolworths announced a
partnership with Visa for WOW’s Money business. The partnership aims to deliver consumer credit products to
WOW’s main outlets, including Woolworths, Dan Murphy’s, BWS and Masters.
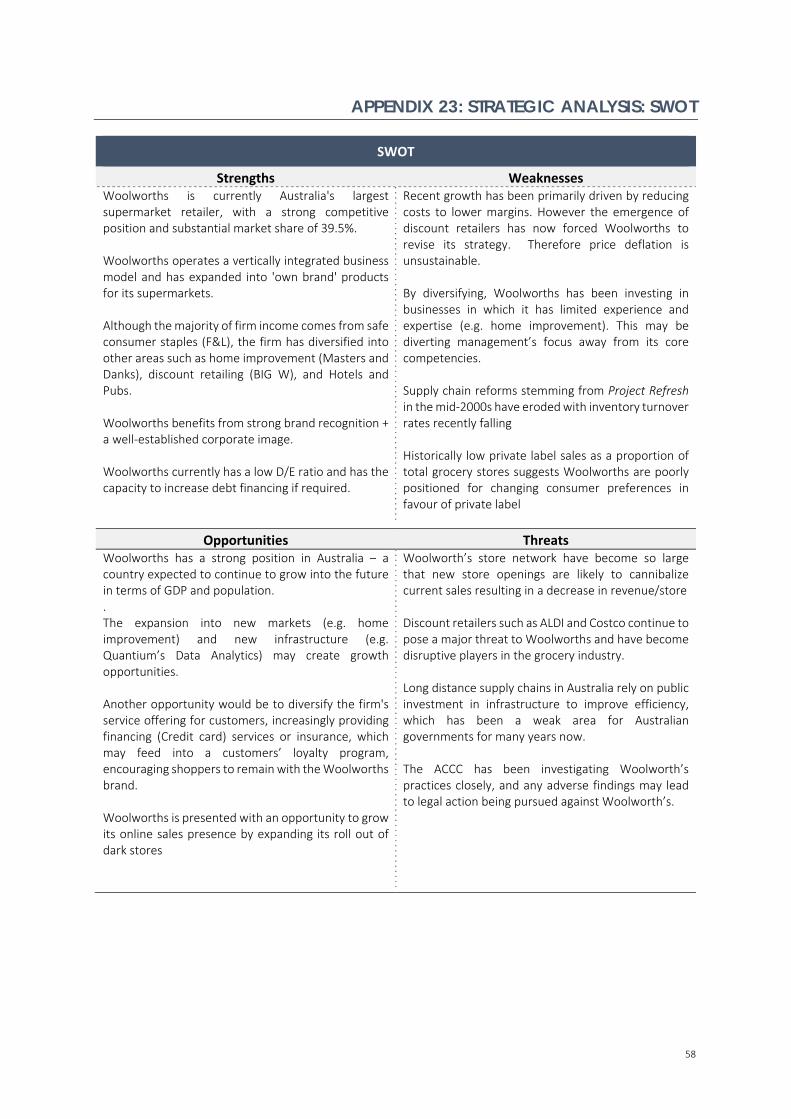
58
APPENDIX 23: STRATEGIC ANALYSIS: SWOT
SWOT
Strengths Weaknesses Woolworths is currently Australia's largest supermarket retailer, with a strong competitive position and substantial market share of 39.5%. Woolworths operates a vertically integrated business model and has expanded into 'own brand' products for its supermarkets. Although the majority of firm income comes from safe consumer staples (F&L), the firm has diversified into other areas such as home improvement (Masters and Danks), discount retailing (BIG W), and Hotels and Pubs. Woolworths benefits from strong brand recognition + a well‐established corporate image. Woolworths currently has a low D/E ratio and has the capacity to increase debt financing if required.
Recent growth has been primarily driven by reducing costs to lower margins. However the emergence of discount retailers has now forced Woolworths to revise its strategy. Therefore price deflation is unsustainable. By diversifying, Woolworths has been investing in businesses in which it has limited experience and expertise (e.g. home improvement). This may be diverting management’s focus away from its core competencies. Supply chain reforms stemming from Project Refresh in the mid‐2000s have eroded with inventory turnover rates recently falling Historically low private label sales as a proportion of total grocery stores suggests Woolworths are poorly positioned for changing consumer preferences in favour of private label
Opportunities Threats Woolworths has a strong position in Australia – a country expected to continue to grow into the future in terms of GDP and population. . The expansion into new markets (e.g. home improvement) and new infrastructure (e.g. Quantium’s Data Analytics) may create growth opportunities. Another opportunity would be to diversify the firm's service offering for customers, increasingly providing financing (Credit card) services or insurance, which may feed into a customers’ loyalty program, encouraging shoppers to remain with the Woolworths brand. Woolworths is presented with an opportunity to grow its online sales presence by expanding its roll out of dark stores
Woolworth’s store network have become so large that new store openings are likely to cannibalize current sales resulting in a decrease in revenue/store Discount retailers such as ALDI and Costco continue to pose a major threat to Woolworths and have become disruptive players in the grocery industry. Long distance supply chains in Australia rely on public investment in infrastructure to improve efficiency, which has been a weak area for Australian governments for many years now. The ACCC has been investigating Woolworth’s practices closely, and any adverse findings may lead to legal action being pursued against Woolworth’s.
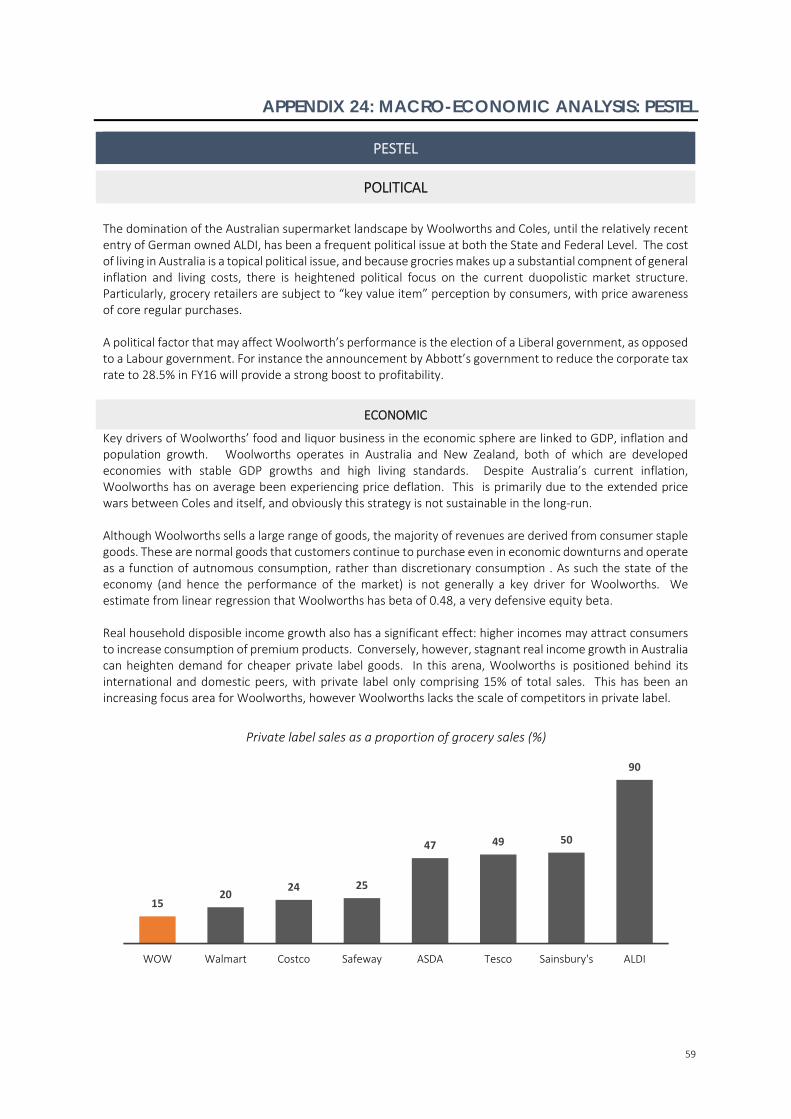
59
APPENDIX 24: MACRO-ECONOMIC ANALYSIS: PESTEL
PESTEL
POLITICAL
The domination of the Australian supermarket landscape by Woolworths and Coles, until the relatively recent entry of German owned ALDI, has been a frequent political issue at both the State and Federal Level. The cost of living in Australia is a topical political issue, and because grocries makes up a substantial compnent of general inflation and living costs, there is heightened political focus on the current duopolistic market structure. Particularly, grocery retailers are subject to “key value item” perception by consumers, with price awareness of core regular purchases. A political factor that may affect Woolworth’s performance is the election of a Liberal government, as opposed to a Labour government. For instance the announcement by Abbott’s government to reduce the corporate tax rate to 28.5% in FY16 will provide a strong boost to profitability.
ECONOMIC
Key drivers of Woolworths’ food and liquor business in the economic sphere are linked to GDP, inflation and population growth. Woolworths operates in Australia and New Zealand, both of which are developed economies with stable GDP growths and high living standards. Despite Australia’s current inflation, Woolworths has on average been experiencing price deflation. This is primarily due to the extended price wars between Coles and itself, and obviously this strategy is not sustainable in the long‐run. Although Woolworths sells a large range of goods, the majority of revenues are derived from consumer staple goods. These are normal goods that customers continue to purchase even in economic downturns and operate as a function of autnomous consumption, rather than discretionary consumption . As such the state of the economy (and hence the performance of the market) is not generally a key driver for Woolworths. We estimate from linear regression that Woolworths has beta of 0.48, a very defensive equity beta. Real household disposible income growth also has a significant effect: higher incomes may attract consumers to increase consumption of premium products. Conversely, however, stagnant real income growth in Australia can heighten demand for cheaper private label goods. In this arena, Woolworths is positioned behind its international and domestic peers, with private label only comprising 15% of total sales. This has been an increasing focus area for Woolworths, however Woolworths lacks the scale of competitors in private label.
1520
24 25
47 49 50
90
WOW Walmart Costco Safeway ASDA Tesco Sainsbury's ALDI
Private label sales as a proportion of grocery sales (%)
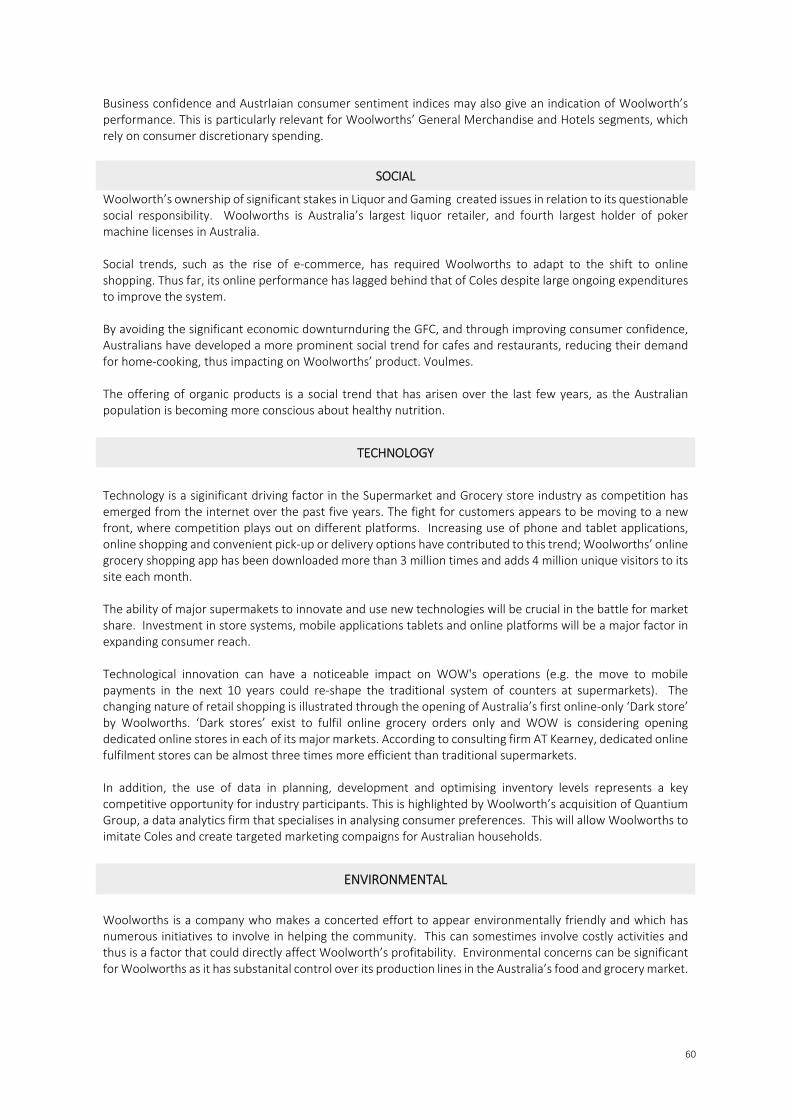
60
Business confidence and Austrlaian consumer sentiment indices may also give an indication of Woolworth’s performance. This is particularly relevant for Woolworths’ General Merchandise and Hotels segments, which rely on consumer discretionary spending.
SOCIAL
Woolworth’s ownership of significant stakes in Liquor and Gaming created issues in relation to its questionable social responsibility. Woolworths is Australia’s largest liquor retailer, and fourth largest holder of poker machine licenses in Australia. Social trends, such as the rise of e‐commerce, has required Woolworths to adapt to the shift to online shopping. Thus far, its online performance has lagged behind that of Coles despite large ongoing expenditures to improve the system. By avoiding the significant economic downturnduring the GFC, and through improving consumer confidence, Australians have developed a more prominent social trend for cafes and restaurants, reducing their demand for home‐cooking, thus impacting on Woolworths’ product. Voulmes. The offering of organic products is a social trend that has arisen over the last few years, as the Australian population is becoming more conscious about healthy nutrition.
TECHNOLOGY
Technology is a siginificant driving factor in the Supermarket and Grocery store industry as competition has emerged from the internet over the past five years. The fight for customers appears to be moving to a new front, where competition plays out on different platforms. Increasing use of phone and tablet applications, online shopping and convenient pick‐up or delivery options have contributed to this trend; Woolworths’ online grocery shopping app has been downloaded more than 3 million times and adds 4 million unique visitors to its site each month. The ability of major supermakets to innovate and use new technologies will be crucial in the battle for market share. Investment in store systems, mobile applications tablets and online platforms will be a major factor in expanding consumer reach. Technological innovation can have a noticeable impact on WOW's operations (e.g. the move to mobile payments in the next 10 years could re‐shape the traditional system of counters at supermarkets). The changing nature of retail shopping is illustrated through the opening of Australia’s first online‐only ‘Dark store’ by Woolworths. ‘Dark stores’ exist to fulfil online grocery orders only and WOW is considering opening dedicated online stores in each of its major markets. According to consulting firm AT Kearney, dedicated online fulfilment stores can be almost three times more efficient than traditional supermarkets. In addition, the use of data in planning, development and optimising inventory levels represents a key competitive opportunity for industry participants. This is highlighted by Woolworth’s acquisition of Quantium Group, a data analytics firm that specialises in analysing consumer preferences. This will allow Woolworths to imitate Coles and create targeted marketing compaigns for Australian households.
ENVIRONMENTAL
Woolworths is a company who makes a concerted effort to appear environmentally friendly and which has numerous initiatives to involve in helping the community. This can somestimes involve costly activities and thus is a factor that could directly affect Woolworth’s profitability. Environmental concerns can be significant for Woolworths as it has substanital control over its production lines in the Australia’s food and grocery market.
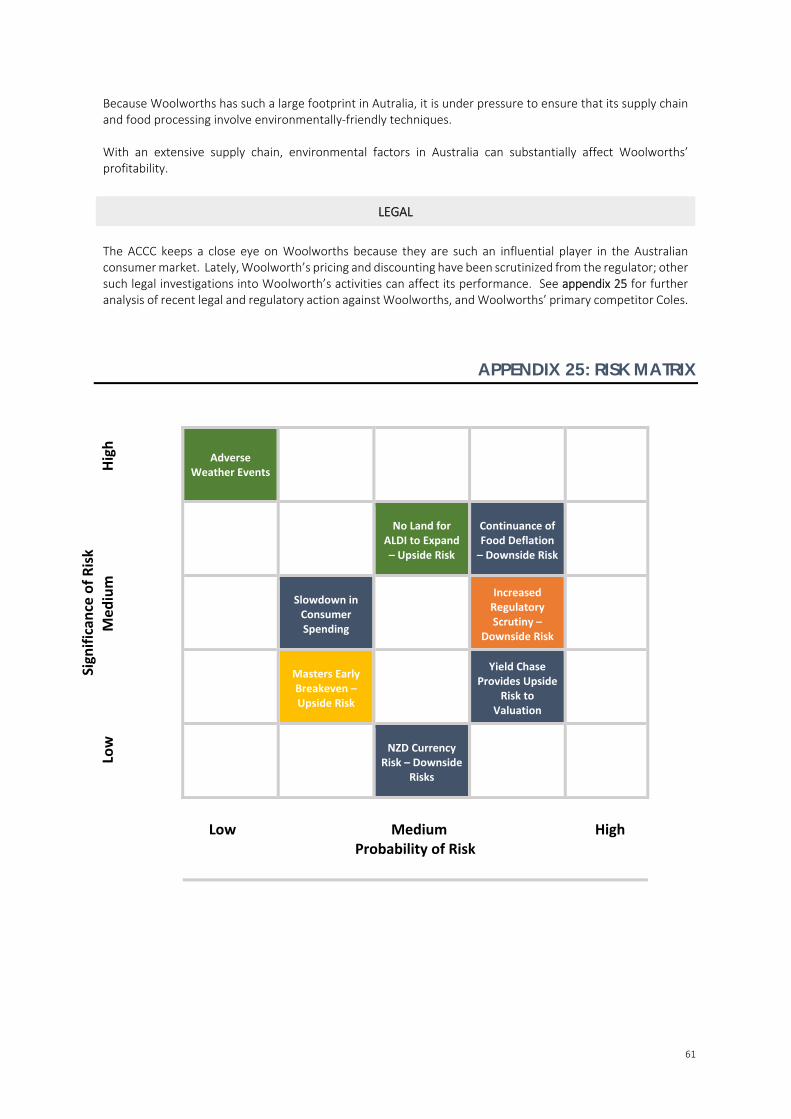
61
Because Woolworths has such a large footprint in Autralia, it is under pressure to ensure that its supply chain and food processing involve environmentally‐friendly techniques. With an extensive supply chain, environmental factors in Australia can substantially affect Woolworths’ profitability.
LEGAL
The ACCC keeps a close eye on Woolworths because they are such an influential player in the Australian consumer market. Lately, Woolworth’s pricing and discounting have been scrutinized from the regulator; other such legal investigations into Woolworth’s activities can affect its performance. See appendix 25 for further analysis of recent legal and regulatory action against Woolworths, and Woolworths’ primary competitor Coles.
APPENDIX 25: RISK MATRIX
Significan
ce of Risk
Low M
edium H
igh
Adverse Weather Events
I)
R) No Land for
ALDI to Expand – Upside Risk
Continuance of Food Deflation – Downside Risk
E1) Slowdown in Consumer Spending
Increased Regulatory Scrutiny –
Downside Risk
(4)
O(1)
Masters Early Breakeven – Upside Risk
Yield Chase Provides Upside
Risk to Valuation
I1) NZD Currency
Risk – Downside Risks
Low Medium High Probability of Risk
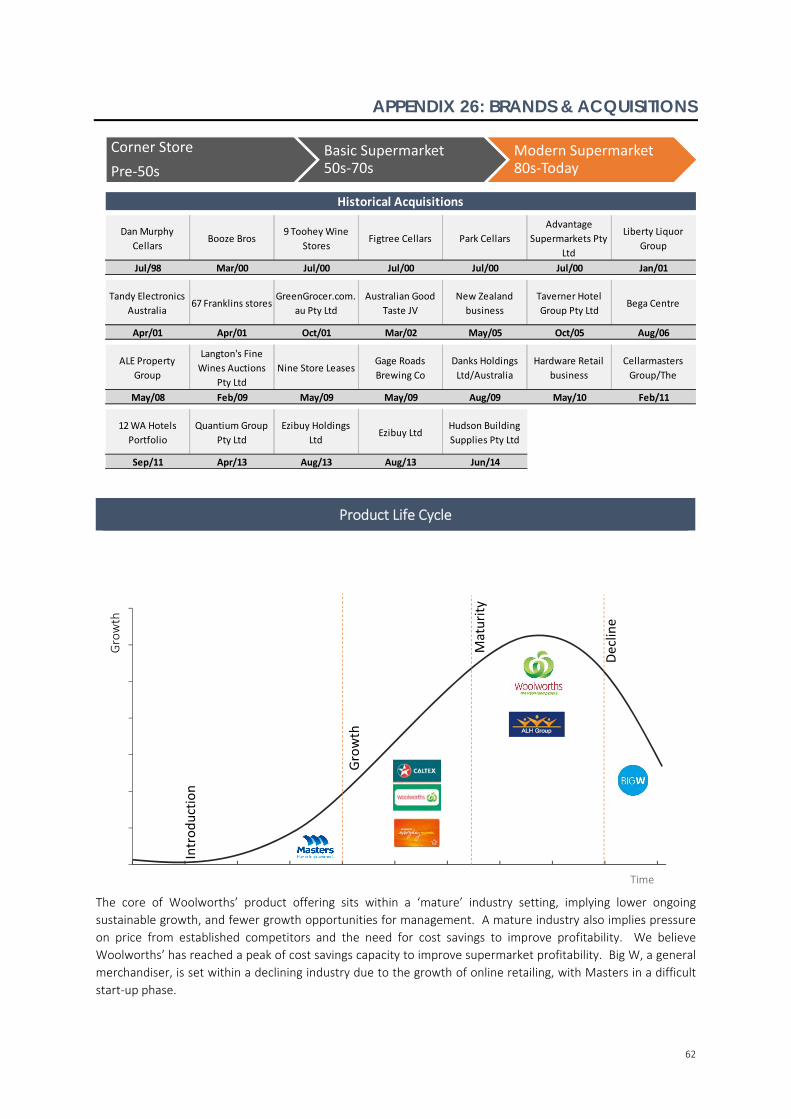
62
APPENDIX 26: BRANDS & ACQUISITIONS
Product Life Cycle
The core of Woolworths’ product offering sits within a ‘mature’ industry setting, implying lower ongoing
sustainable growth, and fewer growth opportunities for management. A mature industry also implies pressure
on price from established competitors and the need for cost savings to improve profitability. We believe
Woolworths’ has reached a peak of cost savings capacity to improve supermarket profitability. Big W, a general
merchandiser, is set within a declining industry due to the growth of online retailing, with Masters in a difficult
start‐up phase.
94
96
98
100
102
104
106
108
03 09 09 09 03 10 09 10 03 11 09 11 03 12 09 12 03 13 09 13 03 14
Growth
Time
Introduction
Growth
Maturity
Decline
Corner Store
Pre‐50s
Basic Supermarket50s‐70s
Modern Supermarket80s‐Today
Historical Acquisitions
Dan Murphy
CellarsBooze Bros
9 Toohey Wine
StoresFigtree Cellars Park Cellars
Advantage
Supermarkets Pty
Ltd
Liberty Liquor
Group
Jul/98 Mar/00 Jul/00 Jul/00 Jul/00 Jul/00 Jan/01
Tandy Electronics
Australia67 Franklins stores
GreenGrocer.com.
au Pty Ltd
Australian Good
Taste JV
New Zealand
business
Taverner Hotel
Group Pty LtdBega Centre
Apr/01 Apr/01 Oct/01 Mar/02 May/05 Oct/05 Aug/06
ALE Property
Group
Langton's Fine
Wines Auctions
Pty Ltd
Nine Store LeasesGage Roads
Brewing Co
Danks Holdings
Ltd/Australia
Hardware Retail
business
Cellarmasters
Group/The
May/08 Feb/09 May/09 May/09 Aug/09 May/10 Feb/11
12 WA Hotels
Portfolio
Quantium Group
Pty Ltd
Ezibuy Holdings
LtdEzibuy Ltd
Hudson Building
Supplies Pty Ltd
Sep/11 Apr/13 Aug/13 Aug/13 Jun/14
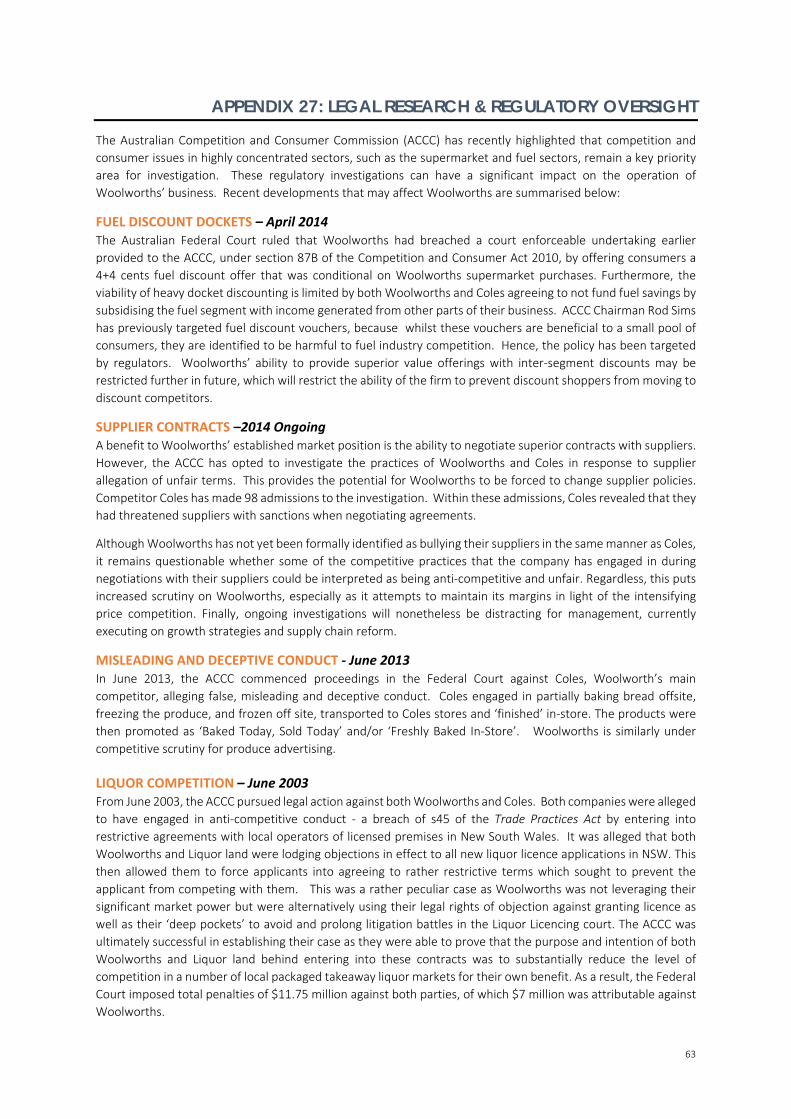
63
APPENDIX 27: LEGAL RESEARCH & REGULATORY OVERSIGHT
The Australian Competition and Consumer Commission (ACCC) has recently highlighted that competition and
consumer issues in highly concentrated sectors, such as the supermarket and fuel sectors, remain a key priority
area for investigation. These regulatory investigations can have a significant impact on the operation of
Woolworths’ business. Recent developments that may affect Woolworths are summarised below:
FUEL DISCOUNT DOCKETS – April 2014 The Australian Federal Court ruled that Woolworths had breached a court enforceable undertaking earlier
provided to the ACCC, under section 87B of the Competition and Consumer Act 2010, by offering consumers a
4+4 cents fuel discount offer that was conditional on Woolworths supermarket purchases. Furthermore, the
viability of heavy docket discounting is limited by both Woolworths and Coles agreeing to not fund fuel savings by
subsidising the fuel segment with income generated from other parts of their business. ACCC Chairman Rod Sims
has previously targeted fuel discount vouchers, because whilst these vouchers are beneficial to a small pool of
consumers, they are identified to be harmful to fuel industry competition. Hence, the policy has been targeted
by regulators. Woolworths’ ability to provide superior value offerings with inter‐segment discounts may be
restricted further in future, which will restrict the ability of the firm to prevent discount shoppers from moving to
discount competitors.
SUPPLIER CONTRACTS –2014 Ongoing A benefit to Woolworths’ established market position is the ability to negotiate superior contracts with suppliers.
However, the ACCC has opted to investigate the practices of Woolworths and Coles in response to supplier
allegation of unfair terms. This provides the potential for Woolworths to be forced to change supplier policies.
Competitor Coles has made 98 admissions to the investigation. Within these admissions, Coles revealed that they
had threatened suppliers with sanctions when negotiating agreements.
Although Woolworths has not yet been formally identified as bullying their suppliers in the same manner as Coles,
it remains questionable whether some of the competitive practices that the company has engaged in during
negotiations with their suppliers could be interpreted as being anti‐competitive and unfair. Regardless, this puts
increased scrutiny on Woolworths, especially as it attempts to maintain its margins in light of the intensifying
price competition. Finally, ongoing investigations will nonetheless be distracting for management, currently
executing on growth strategies and supply chain reform.
MISLEADING AND DECEPTIVE CONDUCT ‐ June 2013 In June 2013, the ACCC commenced proceedings in the Federal Court against Coles, Woolworth’s main
competitor, alleging false, misleading and deceptive conduct. Coles engaged in partially baking bread offsite,
freezing the produce, and frozen off site, transported to Coles stores and ‘finished’ in‐store. The products were
then promoted as ‘Baked Today, Sold Today’ and/or ‘Freshly Baked In‐Store’. Woolworths is similarly under
competitive scrutiny for produce advertising.
LIQUOR COMPETITION – June 2003 From June 2003, the ACCC pursued legal action against both Woolworths and Coles. Both companies were alleged
to have engaged in anti‐competitive conduct ‐ a breach of s45 of the Trade Practices Act by entering into
restrictive agreements with local operators of licensed premises in New South Wales. It was alleged that both
Woolworths and Liquor land were lodging objections in effect to all new liquor licence applications in NSW. This
then allowed them to force applicants into agreeing to rather restrictive terms which sought to prevent the
applicant from competing with them. This was a rather peculiar case as Woolworths was not leveraging their
significant market power but were alternatively using their legal rights of objection against granting licence as
well as their ‘deep pockets’ to avoid and prolong litigation battles in the Liquor Licencing court. The ACCC was
ultimately successful in establishing their case as they were able to prove that the purpose and intention of both
Woolworths and Liquor land behind entering into these contracts was to substantially reduce the level of
competition in a number of local packaged takeaway liquor markets for their own benefit. As a result, the Federal
Court imposed total penalties of $11.75 million against both parties, of which $7 million was attributable against
Woolworths.
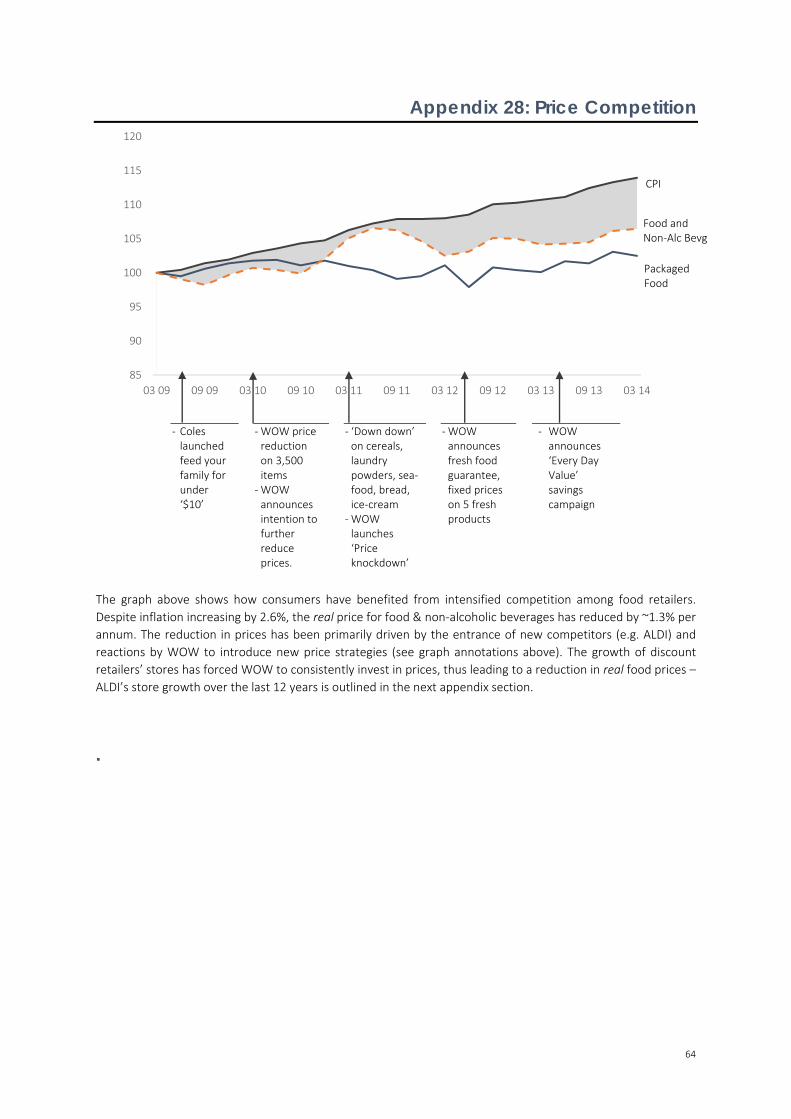
64
Appendix 28: Price Competition
The graph above shows how consumers have benefited from intensified competition among food retailers.
Despite inflation increasing by 2.6%, the real price for food & non‐alcoholic beverages has reduced by ~1.3% per
annum. The reduction in prices has been primarily driven by the entrance of new competitors (e.g. ALDI) and
reactions by WOW to introduce new price strategies (see graph annotations above). The growth of discount
retailers’ stores has forced WOW to consistently invest in prices, thus leading to a reduction in real food prices –
ALDI’s store growth over the last 12 years is outlined in the next appendix section.
.
‐ Coles launched feed your family for under ‘$10’
‐ WOW price reduction on 3,500 items
‐ WOW announces intention to further reduce prices.
‐ ‘Down down’ on cereals, laundry powders, sea‐food, bread, ice‐cream
‐ WOW launches ‘Price knockdown’
‐ WOW announces fresh food guarantee, fixed prices on 5 fresh products
‐ WOW announces ‘Every Day Value’ savings campaign
85
90
95
100
105
110
115
120
03 09 09 09 03 10 09 10 03 11 09 11 03 12 09 12 03 13 09 13 03 14
CPI
Food and Non‐Alc Bevg
PackagedFood
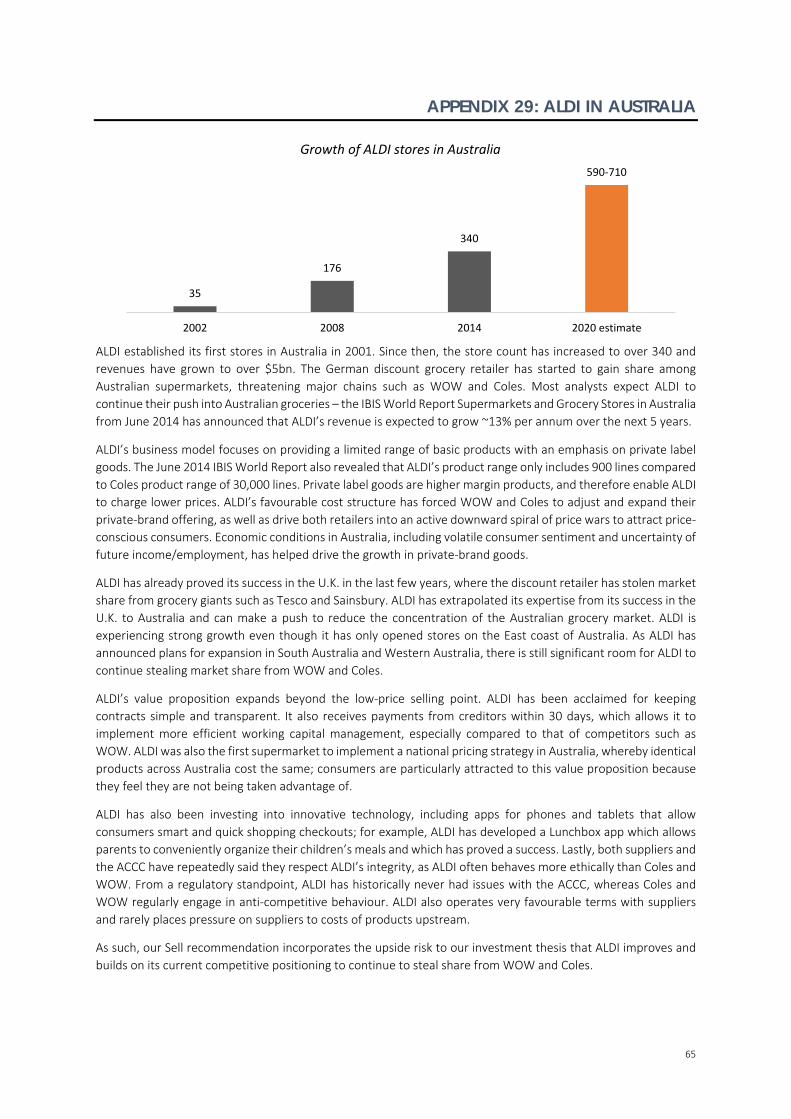
65
APPENDIX 29: ALDI IN AUSTRALIA
ALDI established its first stores in Australia in 2001. Since then, the store count has increased to over 340 and
revenues have grown to over $5bn. The German discount grocery retailer has started to gain share among
Australian supermarkets, threatening major chains such as WOW and Coles. Most analysts expect ALDI to
continue their push into Australian groceries – the IBIS World Report Supermarkets and Grocery Stores in Australia
from June 2014 has announced that ALDI’s revenue is expected to grow ~13% per annum over the next 5 years.
ALDI’s business model focuses on providing a limited range of basic products with an emphasis on private label
goods. The June 2014 IBIS World Report also revealed that ALDI’s product range only includes 900 lines compared
to Coles product range of 30,000 lines. Private label goods are higher margin products, and therefore enable ALDI
to charge lower prices. ALDI’s favourable cost structure has forced WOW and Coles to adjust and expand their
private‐brand offering, as well as drive both retailers into an active downward spiral of price wars to attract price‐
conscious consumers. Economic conditions in Australia, including volatile consumer sentiment and uncertainty of
future income/employment, has helped drive the growth in private‐brand goods.
ALDI has already proved its success in the U.K. in the last few years, where the discount retailer has stolen market
share from grocery giants such as Tesco and Sainsbury. ALDI has extrapolated its expertise from its success in the
U.K. to Australia and can make a push to reduce the concentration of the Australian grocery market. ALDI is
experiencing strong growth even though it has only opened stores on the East coast of Australia. As ALDI has
announced plans for expansion in South Australia and Western Australia, there is still significant room for ALDI to
continue stealing market share from WOW and Coles.
ALDI’s value proposition expands beyond the low‐price selling point. ALDI has been acclaimed for keeping
contracts simple and transparent. It also receives payments from creditors within 30 days, which allows it to
implement more efficient working capital management, especially compared to that of competitors such as
WOW. ALDI was also the first supermarket to implement a national pricing strategy in Australia, whereby identical
products across Australia cost the same; consumers are particularly attracted to this value proposition because
they feel they are not being taken advantage of.
ALDI has also been investing into innovative technology, including apps for phones and tablets that allow
consumers smart and quick shopping checkouts; for example, ALDI has developed a Lunchbox app which allows
parents to conveniently organize their children’s meals and which has proved a success. Lastly, both suppliers and
the ACCC have repeatedly said they respect ALDI’s integrity, as ALDI often behaves more ethically than Coles and
WOW. From a regulatory standpoint, ALDI has historically never had issues with the ACCC, whereas Coles and
WOW regularly engage in anti‐competitive behaviour. ALDI also operates very favourable terms with suppliers
and rarely places pressure on suppliers to costs of products upstream.
As such, our Sell recommendation incorporates the upside risk to our investment thesis that ALDI improves and
builds on its current competitive positioning to continue to steal share from WOW and Coles.
35
176
340
590‐710
2002 2008 2014 2020 estimate
Growth of ALDI stores in Australia

66
APPENDIX 30: KEY MANAGEMENT PERSONNEL
GRANT O’BRIEN Managing Director and Chief Executive Officer Mr. O’Brien’s experience at Woolworths extends 25 years, as he started at the businesses as an accountant in Purity Supermarkets in Tasmania, a division of Woolworths Ltd. Grant was appointed the Managing Director and Chief Executive Officer in 2011.
DAVID MARR Chief Financial Officer Mr. Marr was appointed as Chief Financial Officer in February of 2014. Prior to taking on this position, he was the General Manager Corporate Finance. Previously, he was General Manager Finance for Woolworths Supermarkets. Prior to joining Woolworths Australia, David has extensive experience as Supply Chain Director‐Non Food at Tesco plc, UK, prior to which he was UK Commercial Finance Director for almost three years.
TYEERD JEGEN Managing Director of Australian Supermarkets and Petrol
Tjeerd Jegen was appointed Managing Director of Australian Supermarkets and Petrol in 2011. Prior to this, Tjeerd was Chief Executive Officer of Tesco Malaysia. Tjeerd has held store operations, commercial, marketing and general Management roles with three leading international retailers – Royal Ahold, Metro Group and Tesco, in seven countries.
STEVE GREENTREE Director of Business Development
Mr. Greentree has held many roles within Woolworths all around Australia. Before being appointed Director of Business Development in 2013, he held positions including Chief Operating Office for Australian Supermarkets, Commercial Director of Supermarkets, General Manager of Liquor Group and General Manager of Woolworths Private Label.
BRADFORD BANDUCCI Managing Director of Liquor
Brad Banducci was appointed Director of Liquor in April 2012 and he oversees WOW’s alcohol‐relatd businesses, including Dan Murphy’s and BWS. Banducci has plenty of business experience in the beverage industry. He spent 14 years at the Boston Consulting Group, where he was VP and Director.
ALISTAIR MCGEORGE Managing Director of Big W Mr McGeorge is regarded as a retail guru after having accumulated over 20 years of senoir mgmt experience in the Clothing and Apparel industry in the UK. He is well‐respected for knowing how to turnaround struggling businesses. Mr. McGeorge was appointed MD of Big W on June 1, 2014. He has held important roles, including Chairman of New Look, CEO of Matalan Retail and CEO of Shop Direct Home Shopping.
MATT TYSON Managing Director of Home Improvement Mr. Tyson has life‐long experience in the Home Improvement market as well as retail operations and logistics globally. Mr. Tyson had a long career at UK Home Improvement retailer Kingfisher and was also APAC CEO of B&Q as well as CEO of Castorama in Russia.
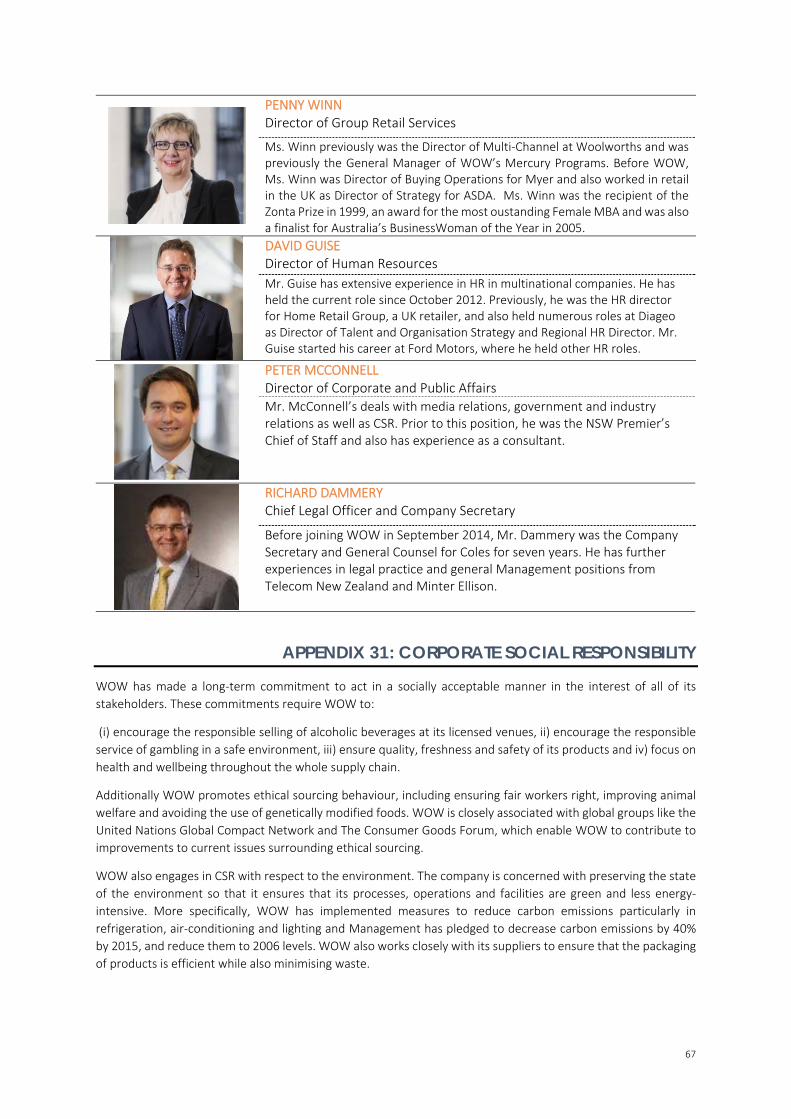
67
PENNY WINN Director of Group Retail Services
Ms. Winn previously was the Director of Multi‐Channel at Woolworths and was previously the General Manager of WOW’s Mercury Programs. Before WOW, Ms. Winn was Director of Buying Operations for Myer and also worked in retail in the UK as Director of Strategy for ASDA. Ms. Winn was the recipient of the Zonta Prize in 1999, an award for the most oustanding Female MBA and was also a finalist for Australia’s BusinessWoman of the Year in 2005.
DAVID GUISE Director of Human Resources
Mr. Guise has extensive experience in HR in multinational companies. He has held the current role since October 2012. Previously, he was the HR director for Home Retail Group, a UK retailer, and also held numerous roles at Diageo as Director of Talent and Organisation Strategy and Regional HR Director. Mr. Guise started his career at Ford Motors, where he held other HR roles.
PETER MCCONNELL Director of Corporate and Public Affairs
Mr. McConnell’s deals with media relations, government and industry relations as well as CSR. Prior to this position, he was the NSW Premier’s Chief of Staff and also has experience as a consultant.
RICHARD DAMMERY Chief Legal Officer and Company Secretary
Before joining WOW in September 2014, Mr. Dammery was the Company Secretary and General Counsel for Coles for seven years. He has further experiences in legal practice and general Management positions from Telecom New Zealand and Minter Ellison.
APPENDIX 31: CORPORATE SOCIAL RESPONSIBILITY
WOW has made a long‐term commitment to act in a socially acceptable manner in the interest of all of its
stakeholders. These commitments require WOW to:
(i) encourage the responsible selling of alcoholic beverages at its licensed venues, ii) encourage the responsible
service of gambling in a safe environment, iii) ensure quality, freshness and safety of its products and iv) focus on
health and wellbeing throughout the whole supply chain.
Additionally WOW promotes ethical sourcing behaviour, including ensuring fair workers right, improving animal
welfare and avoiding the use of genetically modified foods. WOW is closely associated with global groups like the
United Nations Global Compact Network and The Consumer Goods Forum, which enable WOW to contribute to
improvements to current issues surrounding ethical sourcing.
WOW also engages in CSR with respect to the environment. The company is concerned with preserving the state
of the environment so that it ensures that its processes, operations and facilities are green and less energy‐
intensive. More specifically, WOW has implemented measures to reduce carbon emissions particularly in
refrigeration, air‐conditioning and lighting and Management has pledged to decrease carbon emissions by 40%
by 2015, and reduce them to 2006 levels. WOW also works closely with its suppliers to ensure that the packaging
of products is efficient while also minimising waste.
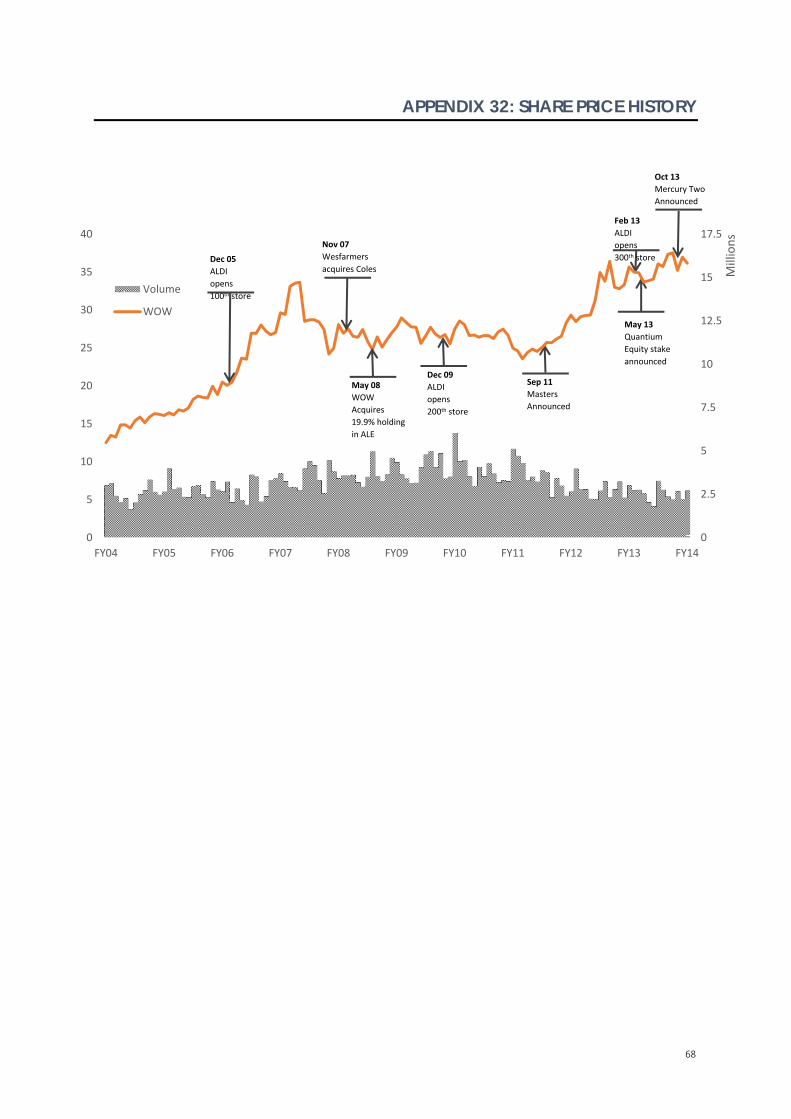
68
APPENDIX 32: SHARE PRICE HISTORY
May 13
Quantium
Equity stake
announced
Sep 11
Masters
Announced
Dec 09
ALDI
opens
200th store
Oct 13
Mercury Two
Announced
Feb 13
ALDI
opens
300th store Dec 05
ALDI
opens
100th store
0
2.5
5
7.5
10
12.5
15
17.5
0
5
10
15
20
25
30
35
40
FY04 FY05 FY06 FY07 FY08 FY09 FY10 FY11 FY12 FY13 FY14
Millions
Volume
WOW
Nov 07
Wesfarmers
acquires Coles
May 08
WOW
Acquires
19.9% holding
in ALE
69
APPENDIX 33: GLOSSARY
ABS – Australian Bureau of Statistics
ASX – Australian Stock Exchange
ACCC – Australian Competition and Consumer Commission
AFGC – Australian Food and Grocery Council
ALH Group – The Australian Leisure and Hospitality Group operates licensed venues and retail
outlets across Australia, including pubs, sport bars, cafes, nightclubs and gambling venues. It is
owned by Woolworths.
ASX – Australian Stock Exchange
Carbon Disclosure Project Leadership Index – An index that assigns scores to businesses for the
quality of company’s disclosures with regards to its greenhouse gas emissions.
CPI – Consumer Price Index; Australian measure of inflation
Everyday Rewards – Woolworths loyalty rewards program
F&L – Food & Liquor Segment
GICS – Global Inudstry Classification Standard
HFS – Hollard Financial Services (Woolworths’ insurance policy provider)
KVI – Known Value Items
Mercury Two – A business transformation project initiated by Woolworths in October 2013
aimed at integrating its supply chain across different segments to improve efficiency.
ML – megalitres (in the context of Petrol Volumes), 1,000,000 Litres
Project Refresh – a program implemented by Woolworths to improve process efficiencies in
the supply chain and enable WOW to realize cost reductions. The project was first announced
in 1999 and it contributed to WOW’s strong performance in the mid‐2000s.
RBA – Reserve Bank of Australia
Sales p/sqm – price per square metre (e.g. Sales p/sqm = sales per square metre)
SKU – Stock Keeping Unit, a product stocked by a retailer
TGR‐ Terminal Growth Rate
ULP – Unleaded Petrol
WOW – Woolworths Limited
70
APPENDIX 34: REFERENCE LIST
ALDI 2010, Submission to the Productivity Commission Issues Paper May 2010, ALDI, Victoria.
ATKearney 2013, Online Retail is Front and Center in the Quest for Growth, ATKearney, Sydney.
Australian Bureau of Statistics 2014, Apparent Consumption of Alcohol, Australia 2013‐2014, ABS,
Canberra.
Australian Bureau of Statistics 2014, Household Expenditure Survey and Survey of Income and Housing
2013‐2014, ABS, Canberra.
Australian Competition and Consumer Commission 2008, Report of the ACCC Inquiry into the
Competitiveness of Retail Prices for Standard Groceries, ACCC, Canberra.
Australian Competition and Consumer Commission 2013, Report of the ACCC into the prices, costs and
profits of unleaded petrol in Australia, ACCC, Canberra.
Australian Food and Grocery Council 2013, 2020: Industry at a Crossroads, AFGC, Sydney.
Australian Food and Grocery Council 2014, Competitiveness & Sustainable Growth: Challenges for the
Australian Food and Grocery Industry, AFGC, Sydney.
Bain & Company 2012, The New Reality for Grocery Suppliers in Australia, Bain & Company, Sydney.
Deloitte 2013, Global Powers of Retailing 2013: Retail Beyond, Deloitte, Sydney.
Department of Agriculture, Fisheries and Forestry 2004, Price Determination in the Australian Food
Industry, DAFF, Canberra.
Department of Agriculture, Fisheries and Forestry 2012, Resilience in the Australian Food Supply
Chain, DAFF, Canberra.
IBISWorld 2014, Industry Report G4000 Fuel Retailing in Australia, IBISWorld, New York
IBISWorld 2014, Industry Report G4111 Supermarkets and Grocery Stores in Australia, IBISWorld, New
York.
IBISWorld 2014, Industry Report G4123 Liquor Retailing in Australia, IBISWorld, New York.
IBISWorld 2014, Industry Report G4231 Hardware and Building Supplies Retailing in Australia,
IBISWorld, New York.
71
IBISWorld 2014, Industry Report G4520 Pubs, Bars and Nightclubs in Australia, IBISWorld, New York.
Jones, E. 2005 'Liquor Retailing and the Coles/Woolworths Juggernaut', Journal of Australian Political
Economy, vol.55, pp. 23‐47.
MarketLine 2012, Sainsbury’s and Tesco: Retaining Market Share During the Credit Crunch, Informa,
Sydney.
MarketLine 2014, Industry Profile: Hotels and Motels in Australia, Informa, Sydney.
Regulation: Planning, Zoning and Development Assessments, Woolworths Ltd, Sydney.
Roy Morgan Research 2013, Finding No. 4946: State of the Nation’s $24billion online retail trade:
Internet shopping becomes the new Australian norm, Roy Morgan, Sydney
Woolworths Ltd 2008, Annual Report, Woolworths Ltd, Sydney.
Woolworths Ltd 2009, Annual Report, Woolworths Ltd, Sydney.
Woolworths Ltd 2010, Annual Report, Woolworths Ltd, Sydney.
Woolworths Ltd 2010, Productivity Commission Performance Benchmarking of Australian Business
Woolworths Ltd 2011, Annual Report, Woolworths Ltd, Sydney.
Woolworths Ltd 2012, Annual Report, Woolworths Ltd, Sydney.
Woolworths Ltd 2013, Annual Report, Woolworths Ltd, Sydney.
Woolworths Ltd 2014, Annual Report, Woolworths Ltd, Sydney.
72
Disclosures: Ownership and material conflicts of interest:
The author(s), or a member of their household, of this report does not hold a financial interest in the securities of this company.
The author(s), or a member of their household, of this report does not know of the existence of any conflicts of interest that might bias the
content or publication of this report.
Receipt of compensation:
Compensation of the author(s) of this report is not based on investment banking revenue.
Position as a officer or director:
The author(s), or a member of their household, does not serve as an officer, director or advisory board member of the subject company.
Market making:
The author(s) does not act as a market maker in the subject company’s securities.
Disclaimer:
The information set forth herein has been obtained or derived from sources generally available to the public and believed by the author(s) to be
reliable, but the author(s) does not make any representation or warranty, express or implied, as to its accuracy or completeness. The information
is not intended to be used as the basis of any investment decisions by any person or entity. This information does not constitute investment
advice, nor is it an offer or a solicitation of an offer to buy or sell any security. This report should not be considered to be a recommendation by
any individual affiliated with CFA Society of Sydney, CFA Institute or the CFA Institute Research Challenge with regard to this company’s stock.
CFA Institute Research Challenge