Embed Size (px)
Citation preview

CFA Society of IndianapolisFinancial Planning Association of Greater Indiana
State of the Credit Cycle: Past vs. PrologueSeptember 18, 2015
Glenn Reynolds, CFA
Nathan Wenger, CFA
2
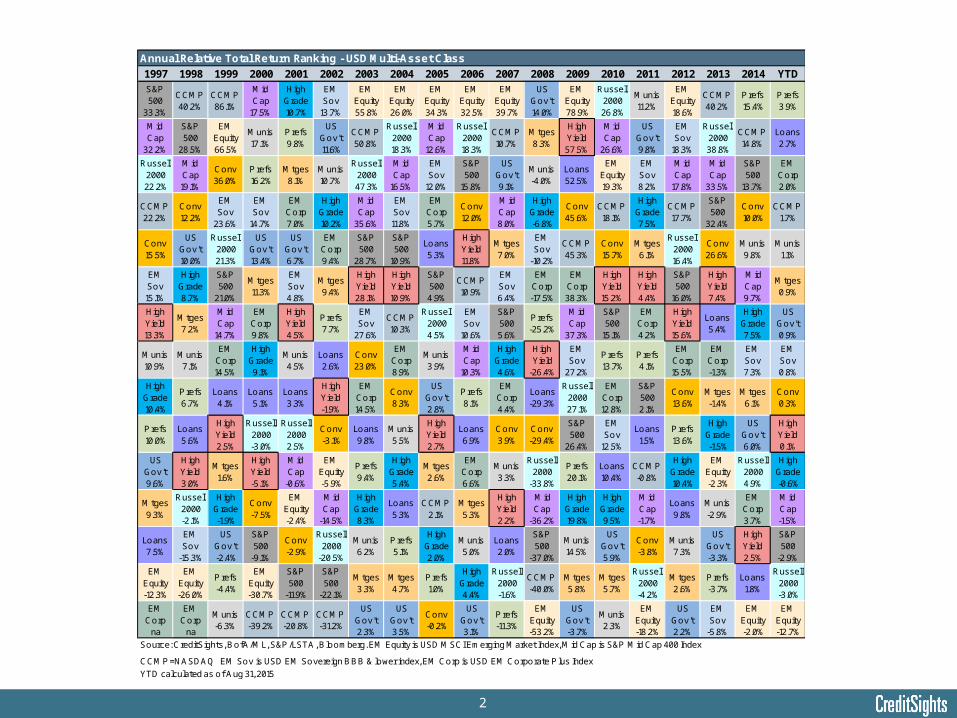
Annual Relative Total Return Ranking - USD Multi-Asset Class
1997 1998 1999 2000 2001 2002 2003 2004 2005 2006 2007 2008 2009 2010 2011 2012 2013 2014 YTDS&P 500
33.3%
CCMP 40.2%
CCMP 86.1%
Mid Cap
17.5%
High Grade 10.7%
EM Sov
13.7%
EM Equity 55.8%
EM Equity 26.0%
EM Equity 34.3%
EM Equity 32.5%
EM Equity 39.7%
US Gov't 14.0%
EM Equity 78.9%
Russell 2000 26.8%
Munis 11.2%
EM Equity 18.6%
CCMP 40.2%
P refs 15.4%
P refs 3.9%
Mid Cap
32.2%
S&P 500
28.5%
EM Equity 66.5%
Munis 17.1%
P refs 9.8%
US Gov't 11.6%
CCMP 50.8%
Russell 2000 18.3%
Mid Cap
12.6%
Russell 2000 18.3%
CCMP 10.7%
Mtges 8.3%
High Yield 57.5%
Mid Cap
26.6%
US Gov't 9.8%
EM Sov
18.3%
Russell 2000 38.8%
CCMP 14.8%
Loans 2.7%
Russell 2000 22.2%
Mid Cap 19.1%
Conv 36.0%
P refs 16.2%
Mtges 8.1%
Munis 10.7%
Russell 2000 47.3%
Mid Cap
16.5%
EM Sov
12.0%
S&P 500
15.8%
US Gov't 9.1%
Munis -4.0%
Loans 52.5%
EM Equity 19.3%
EM Sov 8.2%
Mid Cap
17.8%
Mid Cap
33.5%
S&P 500
13.7%
EM Corp 2.0%
CCMP 22.2%
Conv 12.2%
EM Sov
23.6%
EM Sov
14.7%
EM Corp 7.0%
High Grade 10.2%
Mid Cap
35.6%
EM Sov 11.8%
EM Corp 5.7%
Conv 12.0%
Mid Cap 8.0%
High Grade -6.8%
Conv 45.6%
CCMP 18.1%
High Grade 7.5%
CCMP 17.7%
S&P 500
32.4%
Conv 10.0%
CCMP 1.7%
Conv 15.5%
US Gov't 10.0%
Russell 2000 21.3%
US Gov't 13.4%
US Gov't 6.7%
EM Corp 9.4%
S&P 500
28.7%
S&P 500
10.9%
Loans 5.3%
High Yield 11.8%
Mtges 7.0%
EM Sov
-10.2%
CCMP 45.3%
Conv 15.7%
Mtges 6.1%
Russell 2000 16.4%
Conv 26.6%
Munis 9.8%
Munis 1.1%
EM Sov 15.1%
High Grade 8.7%
S&P 500
21.0%
Mtges 11.3%
EM Sov 4.8%
Mtges 9.4%
High Yield 28.1%
High Yield 10.9%
S&P 500 4.9%
CCMP 10.9%
EM Sov 6.4%
EM Corp -17.5%
EM Corp 38.3%
High Yield 15.2%
High Yield 4.4%
S&P 500
16.0%
High Yield 7.4%
Mid Cap 9.7%
Mtges 0.9%
High Yield 13.3%
Mtges 7.2%
Mid Cap
14.7%
EM Corp 9.8%
High Yield 4.5%
P refs 7.7%
EM Sov
27.6%
CCMP 10.3%
Russell 2000 4.5%
EM Sov
10.6%
S&P 500 5.6%
P refs -25.2%
Mid Cap
37.3%
S&P 500
15.1%
EM Corp 4.2%
High Yield 15.6%
Loans 5.4%
High Grade 7.5%
US Gov't 0.9%
Munis 10.9%
Munis 7.1%
EM Corp 14.5%
High Grade 9.1%
Munis 4.5%
Loans 2.6%
Conv 23.0%
EM Corp 8.9%
Munis 3.9%
Mid Cap
10.3%
High Grade 4.6%
High Yield
-26.4%
EM Sov
27.2%
P refs 13.7%
P refs 4.1%
EM Corp 15.5%
EM Corp -1.3%
EM Sov 7.3%
EM Sov 0.8%
High Grade 10.4%
P refs 6.7%
Loans 4.1%
Loans 5.1%
Loans 3.3%
High Yield -1.9%
EM Corp 14.5%
Conv 8.3%
US Gov't 2.8%
P refs 8.1%
EM Corp 4.4%
Loans -29.3%
Russell 2000 27.1%
EM Corp 12.8%
S&P 500 2.1%
Conv 13.6%
Mtges -1.4%
Mtges 6.1%
Conv 0.3%
P refs 10.0%
Loans 5.6%
High Yield 2.5%
Russell 2000 -3.0%
Russell 2000 2.5%
Conv -3.1%
Loans 9.8%
Munis 5.5%
High Yield 2.7%
Loans 6.9%
Conv 3.9%
Conv -29.4%
S&P 500
26.4%
EM Sov
12.5%
Loans 1.5%
P refs 13.6%
High Grade -1.5%
US Gov't 6.0%
High Yield 0.1%
US Gov't 9.6%
High Yield 3.0%
Mtges 1.6%
High Yield -5.1%
Mid Cap
-0.6%
EM Equity -5.9%
P refs 9.4%
High Grade 5.4%
Mtges 2.6%
EM Corp 6.6%
Munis 3.3%
Russell 2000
-33.8%
P refs 20.1%
Loans 10.4%
CCMP -0.8%
High Grade 10.4%
EM Equity -2.3%
Russell 2000 4.9%
High Grade -0.6%
Mtges 9.3%
Russell 2000 -2.1%
High Grade -1.9%
Conv -7.5%
EM Equity -2.4%
Mid Cap
-14.5%
High Grade 8.3%
Loans 5.3%
CCMP 2.1%
Mtges 5.3%
High Yield 2.2%
Mid Cap
-36.2%
High Grade 19.8%
High Grade 9.5%
Mid Cap -1.7%
Loans 9.8%
Munis -2.9%
EM Corp 3.7%
Mid Cap -1.5%
Loans 7.5%
EM Sov
-15.3%
US Gov't -2.4%
S&P 500
-9.1%
Conv -2.9%
Russell 2000
-20.5%
Munis 6.2%
P refs 5.1%
High Grade 2.0%
Munis 5.0%
Loans 2.0%
S&P 500
-37.0%
Munis 14.5%
US Gov't 5.9%
Conv -3.8%
Munis 7.3%
US Gov't -3.3%
High Yield 2.5%
S&P 500
-2.9%
EM Equity -12.3%
EM Equity -26.0%
P refs -4.4%
EM Equity -30.7%
S&P 500
-11.9%
S&P 500
-22.1%
Mtges 3.3%
Mtges 4.7%
P refs 1.0%
High Grade 4.4%
Russell 2000 -1.6%
CCMP -40.0%
Mtges 5.8%
Mtges 5.7%
Russell 2000 -4.2%
Mtges 2.6%
P refs -3.7%
Loans 1.8%
Russell 2000 -3.0%
EM Corp
na
EM Corp
na
Munis -6.3%
CCMP -39.2%
CCMP -20.8%
CCMP -31.2%
US Gov't 2.3%
US Gov't 3.5%
Conv -0.2%
US Gov't 3.1%
P refs -11.3%
EM Equity -53.2%
US Gov't -3.7%
Munis 2.3%
EM Equity -18.2%
US Gov't 2.2%
EM Sov
-5.8%
EM Equity -2.0%
EM Equity -12.7%
Source: CreditSights, BofA/ML, S&P /LSTA, Bloomberg. EM Equity is USD MSCI Emerging Market Index, M id Cap is S&P Mid Cap 400 Index
CCMP =NASDAQ EM Sov is USD EM Sovereign BBB & lower index, EM Corp is USD EM Corporate P lus IndexYTD calculated as of Aug 31, 2015
3
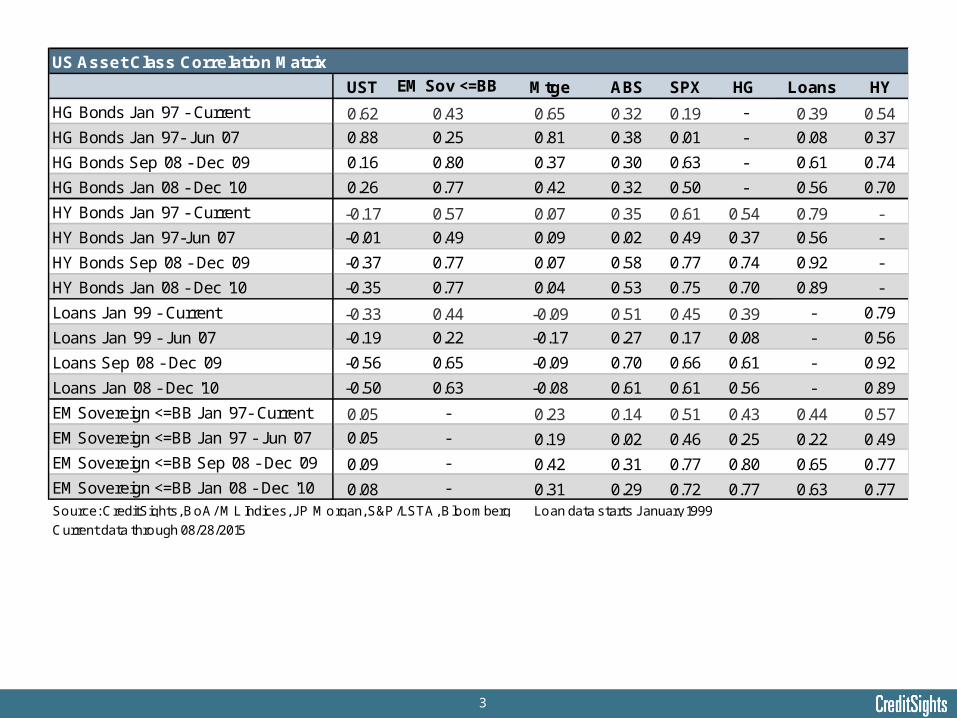
US Asset Class Correlation Matrix
UST EM Sov <=BB Mtge ABS SPX HG Loans HY
HG Bonds Jan '97 - Current 0.62 0.43 0.65 0.32 0.19 - 0.39 0.54
HG Bonds Jan '97- Jun '07 0.88 0.25 0.81 0.38 0.01 - 0.08 0.37
HG Bonds Sep '08 - Dec '09 0.16 0.80 0.37 0.30 0.63 - 0.61 0.74
HG Bonds Jan '08 - Dec '10 0.26 0.77 0.42 0.32 0.50 - 0.56 0.70
HY Bonds Jan '97 - Current -0.17 0.57 0.07 0.35 0.61 0.54 0.79 -
HY Bonds Jan '97-Jun '07 -0.01 0.49 0.09 0.02 0.49 0.37 0.56 -
HY Bonds Sep '08 - Dec '09 -0.37 0.77 0.07 0.58 0.77 0.74 0.92 -
HY Bonds Jan '08 - Dec '10 -0.35 0.77 0.04 0.53 0.75 0.70 0.89 -
Loans Jan '99 - Current -0.33 0.44 -0.09 0.51 0.45 0.39 - 0.79
Loans Jan '99 - Jun '07 -0.19 0.22 -0.17 0.27 0.17 0.08 - 0.56
Loans Sep '08 - Dec '09 -0.56 0.65 -0.09 0.70 0.66 0.61 - 0.92
Loans Jan '08 - Dec '10 -0.50 0.63 -0.08 0.61 0.61 0.56 - 0.89
EM Sovereign <=BB Jan '97- Current 0.05 - 0.23 0.14 0.51 0.43 0.44 0.57
EM Sovereign <=BB Jan '97 - Jun '07 0.05 - 0.19 0.02 0.46 0.25 0.22 0.49
EM Sovereign <=BB Sep '08 - Dec '09 0.09 - 0.42 0.31 0.77 0.80 0.65 0.77
EM Sovereign <=BB Jan '08 - Dec '10 0.08 - 0.31 0.29 0.72 0.77 0.63 0.77Source: CreditSights, BoA/ ML Indices, J P Morgan, S&P /LSTA, Bloomberg Loan data starts J anuary 1999Current data through 08/28/2015
4
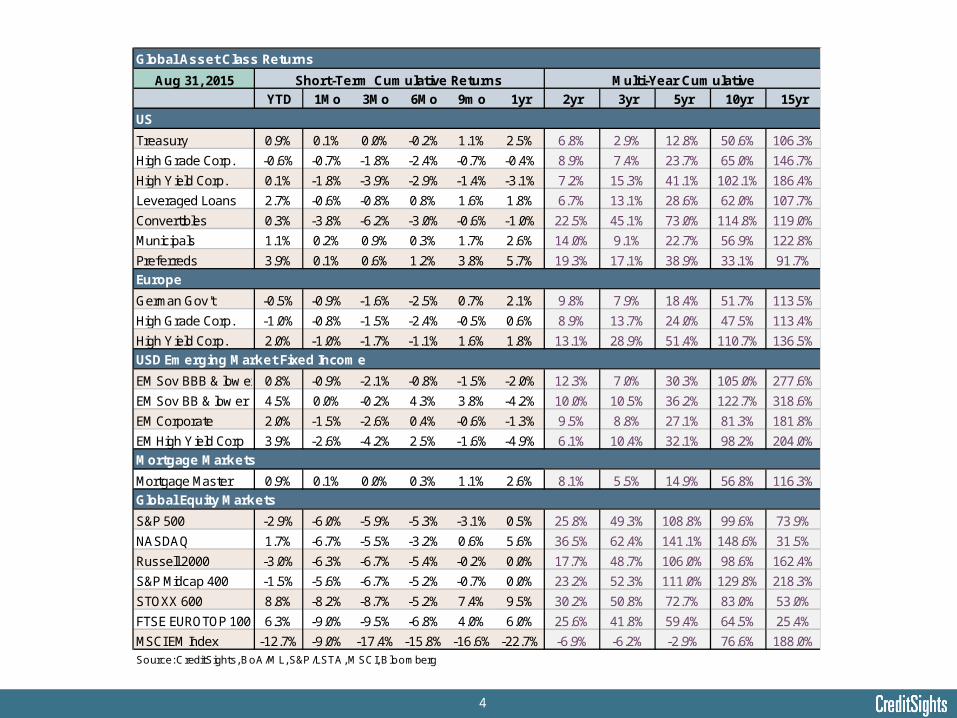
Global Asset Class Returns
Aug 31, 2015
YTD 1Mo 3Mo 6Mo 9mo 1yr 2yr 3yr 5yr 10yr 15yr
US
Treasury 0.9% 0.1% 0.0% -0.2% 1.1% 2.5% 6.8% 2.9% 12.8% 50.6% 106.3%
High Grade Corp. -0.6% -0.7% -1.8% -2.4% -0.7% -0.4% 8.9% 7.4% 23.7% 65.0% 146.7%
High Yield Corp. 0.1% -1.8% -3.9% -2.9% -1.4% -3.1% 7.2% 15.3% 41.1% 102.1% 186.4%
Leveraged Loans 2.7% -0.6% -0.8% 0.8% 1.6% 1.8% 6.7% 13.1% 28.6% 62.0% 107.7%
Convertibles 0.3% -3.8% -6.2% -3.0% -0.6% -1.0% 22.5% 45.1% 73.0% 114.8% 119.0%
Municipals 1.1% 0.2% 0.9% 0.3% 1.7% 2.6% 14.0% 9.1% 22.7% 56.9% 122.8%
Preferreds 3.9% 0.1% 0.6% 1.2% 3.8% 5.7% 19.3% 17.1% 38.9% 33.1% 91.7%
Europe
German Gov't -0.5% -0.9% -1.6% -2.5% 0.7% 2.1% 9.8% 7.9% 18.4% 51.7% 113.5%
High Grade Corp. -1.0% -0.8% -1.5% -2.4% -0.5% 0.6% 8.9% 13.7% 24.0% 47.5% 113.4%
High Yield Corp. 2.0% -1.0% -1.7% -1.1% 1.6% 1.8% 13.1% 28.9% 51.4% 110.7% 136.5%
USD Emerging Market Fixed Income
EM Sov BBB & low er 0.8% -0.9% -2.1% -0.8% -1.5% -2.0% 12.3% 7.0% 30.3% 105.0% 277.6%
EM Sov BB & low er 4.5% 0.0% -0.2% 4.3% 3.8% -4.2% 10.0% 10.5% 36.2% 122.7% 318.6%
EM Corporate 2.0% -1.5% -2.6% 0.4% -0.6% -1.3% 9.5% 8.8% 27.1% 81.3% 181.8%
EM High Yield Corp 3.9% -2.6% -4.2% 2.5% -1.6% -4.9% 6.1% 10.4% 32.1% 98.2% 204.0%
Mortgage Markets
Mortgage Master 0.9% 0.1% 0.0% 0.3% 1.1% 2.6% 8.1% 5.5% 14.9% 56.8% 116.3%
Global Equity Markets
S&P 500 -2.9% -6.0% -5.9% -5.3% -3.1% 0.5% 25.8% 49.3% 108.8% 99.6% 73.9%
NASDAQ 1.7% -6.7% -5.5% -3.2% 0.6% 5.6% 36.5% 62.4% 141.1% 148.6% 31.5%
Russell 2000 -3.0% -6.3% -6.7% -5.4% -0.2% 0.0% 17.7% 48.7% 106.0% 98.6% 162.4%
S&P Midcap 400 -1.5% -5.6% -6.7% -5.2% -0.7% 0.0% 23.2% 52.3% 111.0% 129.8% 218.3%
STOXX 600 8.8% -8.2% -8.7% -5.2% 7.4% 9.5% 30.2% 50.8% 72.7% 83.0% 53.0%
FTSE EUROTOP 100 6.3% -9.0% -9.5% -6.8% 4.0% 6.0% 25.6% 41.8% 59.4% 64.5% 25.4%
MSCI EM Index -12.7% -9.0% -17.4% -15.8% -16.6% -22.7% -6.9% -6.2% -2.9% 76.6% 188.0%Source: CreditSights, BoA/ML, S&P /LSTA, MSCI, Bloomberg
Multi-Year CumulativeShort-Term Cumulative Returns
5
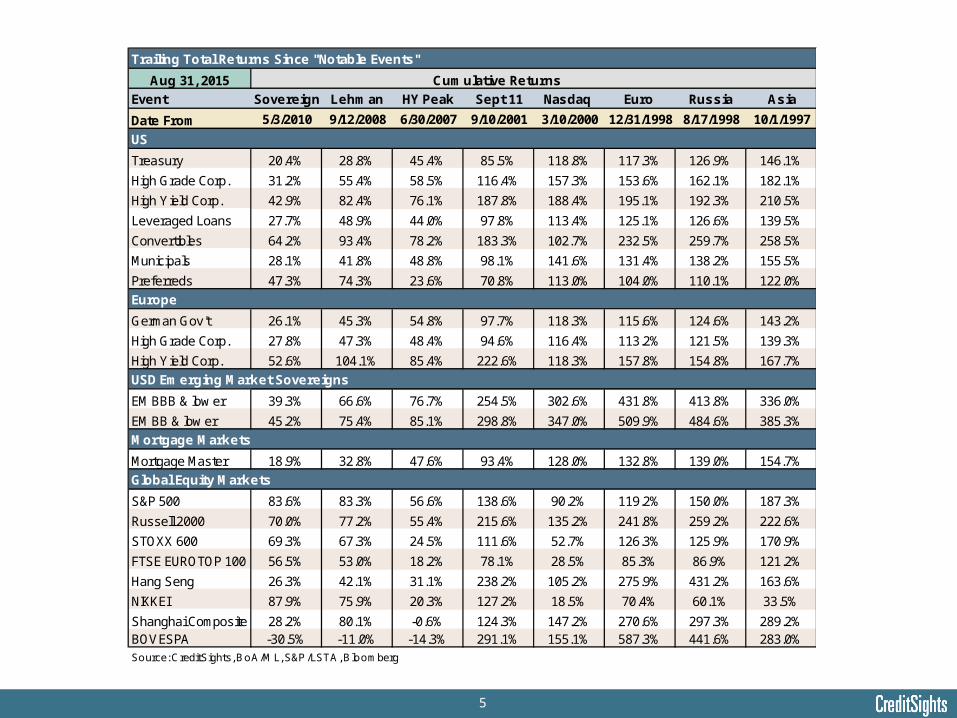
Trailing Total Returns Since "Notable Events"
Aug 31, 2015
Event Sovereign Lehman HY Peak Sept 11 Nasdaq Euro Russia Asia
Date From 5/3/2010 9/12/2008 6/30/2007 9/10/2001 3/10/2000 12/31/1998 8/17/1998 10/1/1997
US
Treasury 20.4% 28.8% 45.4% 85.5% 118.8% 117.3% 126.9% 146.1%
High Grade Corp. 31.2% 55.4% 58.5% 116.4% 157.3% 153.6% 162.1% 182.1%
High Yield Corp. 42.9% 82.4% 76.1% 187.8% 188.4% 195.1% 192.3% 210.5%
Leveraged Loans 27.7% 48.9% 44.0% 97.8% 113.4% 125.1% 126.6% 139.5%
Convertibles 64.2% 93.4% 78.2% 183.3% 102.7% 232.5% 259.7% 258.5%
Municipals 28.1% 41.8% 48.8% 98.1% 141.6% 131.4% 138.2% 155.5%
Preferreds 47.3% 74.3% 23.6% 70.8% 113.0% 104.0% 110.1% 122.0%
Europe
German Gov't 26.1% 45.3% 54.8% 97.7% 118.3% 115.6% 124.6% 143.2%
High Grade Corp. 27.8% 47.3% 48.4% 94.6% 116.4% 113.2% 121.5% 139.3%
High Yield Corp. 52.6% 104.1% 85.4% 222.6% 118.3% 157.8% 154.8% 167.7%
USD Emerging Market Sovereigns
EM BBB & low er 39.3% 66.6% 76.7% 254.5% 302.6% 431.8% 413.8% 336.0%
EM BB & low er 45.2% 75.4% 85.1% 298.8% 347.0% 509.9% 484.6% 385.3%
Mortgage Markets
Mortgage Master 18.9% 32.8% 47.6% 93.4% 128.0% 132.8% 139.0% 154.7%
Global Equity Markets
S&P 500 83.6% 83.3% 56.6% 138.6% 90.2% 119.2% 150.0% 187.3%
Russell 2000 70.0% 77.2% 55.4% 215.6% 135.2% 241.8% 259.2% 222.6%
STOXX 600 69.3% 67.3% 24.5% 111.6% 52.7% 126.3% 125.9% 170.9%
FTSE EUROTOP 100 56.5% 53.0% 18.2% 78.1% 28.5% 85.3% 86.9% 121.2%
Hang Seng 26.3% 42.1% 31.1% 238.2% 105.2% 275.9% 431.2% 163.6%
NIKKEI 87.9% 75.9% 20.3% 127.2% 18.5% 70.4% 60.1% 33.5%
Shanghai Composite 28.2% 80.1% -0.6% 124.3% 147.2% 270.6% 297.3% 289.2%BOVESPA -30.5% -11.0% -14.3% 291.1% 155.1% 587.3% 441.6% 283.0%Source: CreditSights, BoA/ML, S&P /LSTA, Bloomberg
Cumulative Returns
6
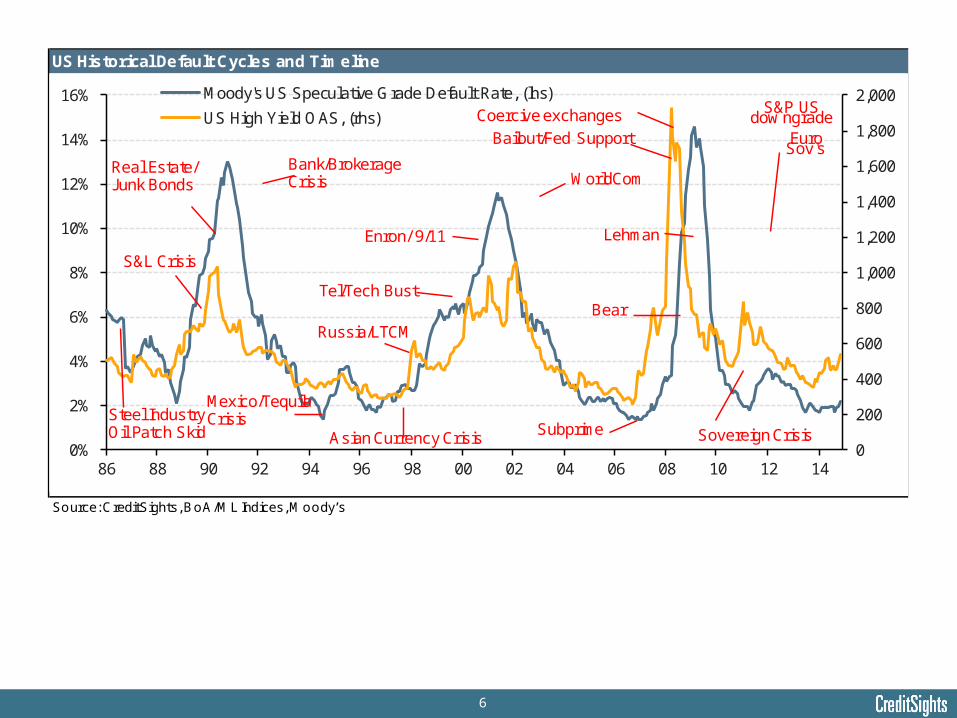
US Historical Default Cycles and Timeline
Source: CreditSights, BoA/ML Indices, Moody’s
0
200
400
600
800
1,000
1,200
1,400
1,600
1,800
2,000
0%
2%
4%
6%
8%
10%
12%
14%
16%
86 88 90 92 94 96 98 00 02 04 06 08 10 12 14
Moody's US Speculative Grade Default Rate, (lhs)
US High Yield OAS, (rhs)
Steel IndustryOil Patch Skid
Real Estate/Junk Bonds
S&L Crisis
Bank/Brokerage Crisis
Russia/LTCM
Enron/ 9/11
Asian Currency Crisis
Tel/Tech Bust
Subprime
Bear
Bailout/Fed Support
S&P US dow ngrade
Euro Sov's
Lehman
WorldCom
Sovereign Crisis
Mexico/Tequila Crisis
Coercive exchanges
7
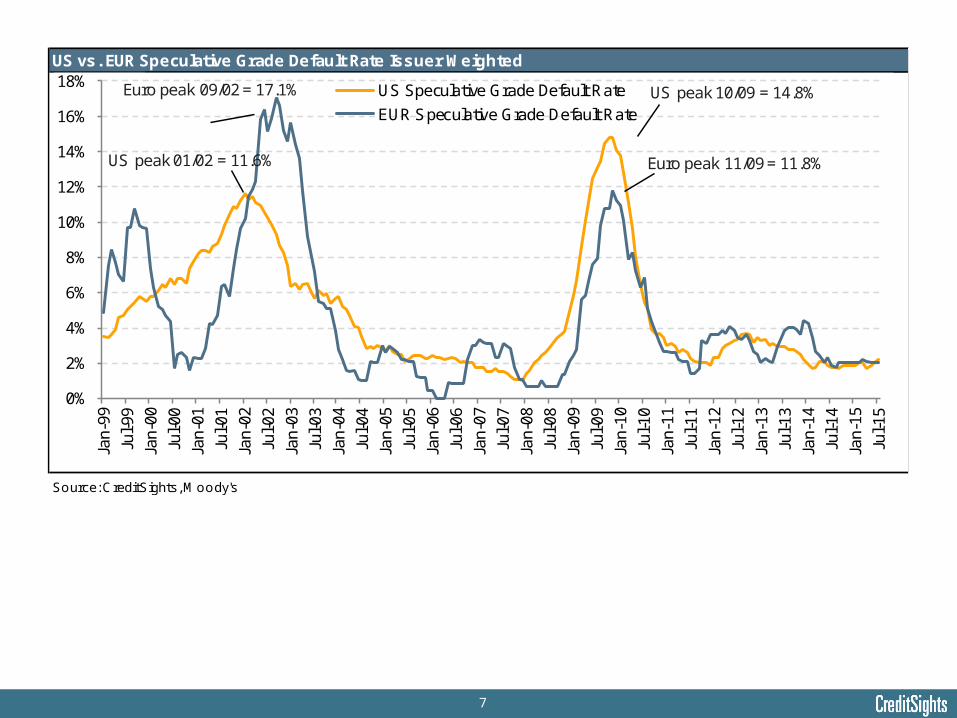
US vs. EUR Speculative Grade Default Rate Issuer Weighted
Source: CreditSights, Moody's
0%
2%
4%
6%
8%
10%
12%
14%
16%
18%Ja
n-99
Jul-9
9
Jan-
00
Jul-0
0
Jan-
01
Jul-0
1
Jan-
02
Jul-0
2
Jan-
03
Jul-0
3
Jan-
04
Jul-0
4
Jan-
05
Jul-0
5
Jan-
06
Jul-0
6
Jan-
07
Jul-0
7
Jan-
08
Jul-0
8
Jan-
09
Jul-0
9
Jan-
10
Jul-1
0
Jan-
11
Jul-1
1
Jan-
12
Jul-1
2
Jan-
13
Jul-1
3
Jan-
14
Jul-1
4
Jan-
15
Jul-1
5
US Speculative Grade Default Rate
EUR Speculative Grade Default RateUS peak 10/09 = 14.8%Euro peak 09/02 = 17.1%
US peak 01/02 = 11.6% Euro peak 11/09 = 11.8%
8
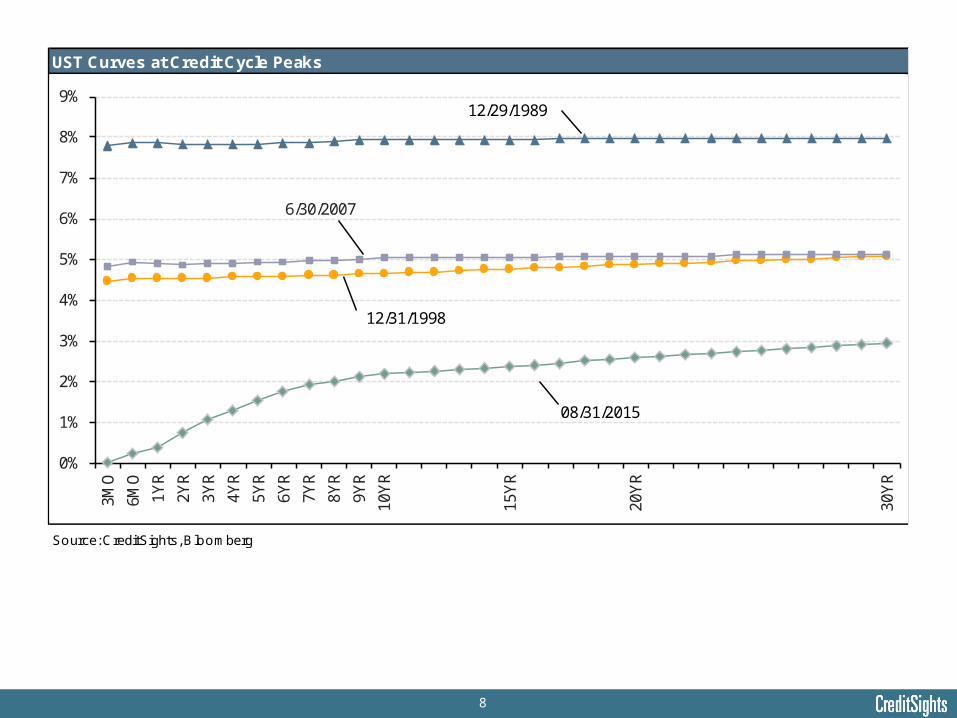
UST Curves at Credit Cycle Peaks
Source: CreditSights, Bloomberg
0%
1%
2%
3%
4%
5%
6%
7%
8%
9%3M
O
6MO
1YR
2YR
3YR
4YR
5YR
6YR
7YR
8YR
9YR
10Y
R
15Y
R
20Y
R
30Y
R
12/29/1989
08/31/2015
12/31/1998
6/30/2007
9
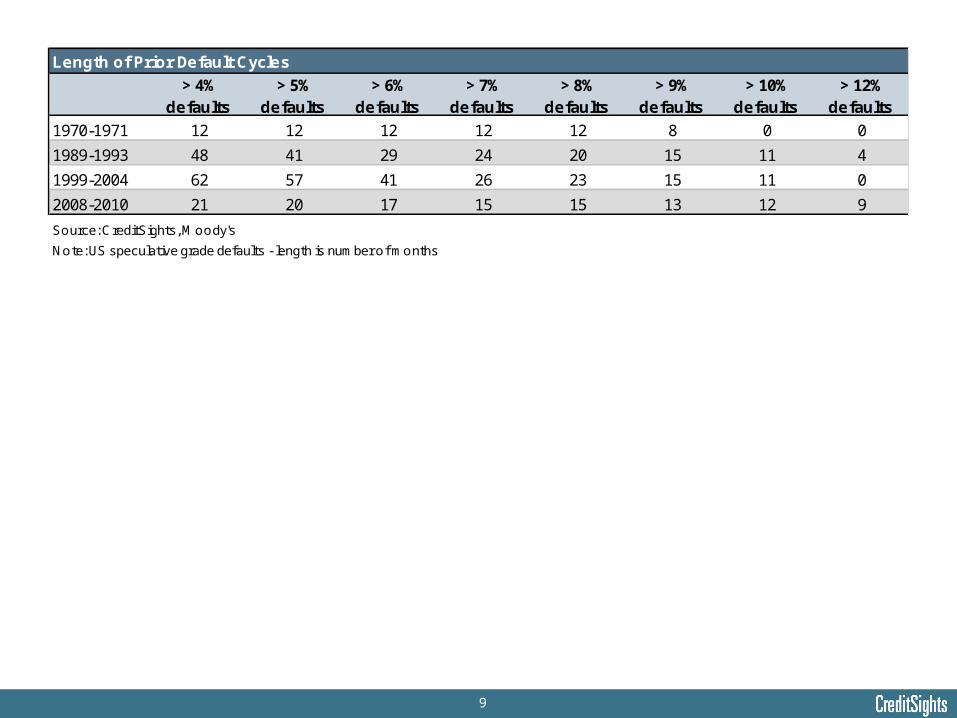
Length of Prior Default Cycles
> 4% defaults
> 5% defaults
> 6% defaults
> 7% defaults
> 8% defaults
> 9% defaults
> 10% defaults
> 12% defaults
1970-1971 12 12 12 12 12 8 0 0
1989-1993 48 41 29 24 20 15 11 4
1999-2004 62 57 41 26 23 15 11 0
2008-2010 21 20 17 15 15 13 12 9
Source: CreditSights, Moody's
Note: US speculative grade defaults - length is number of months
10
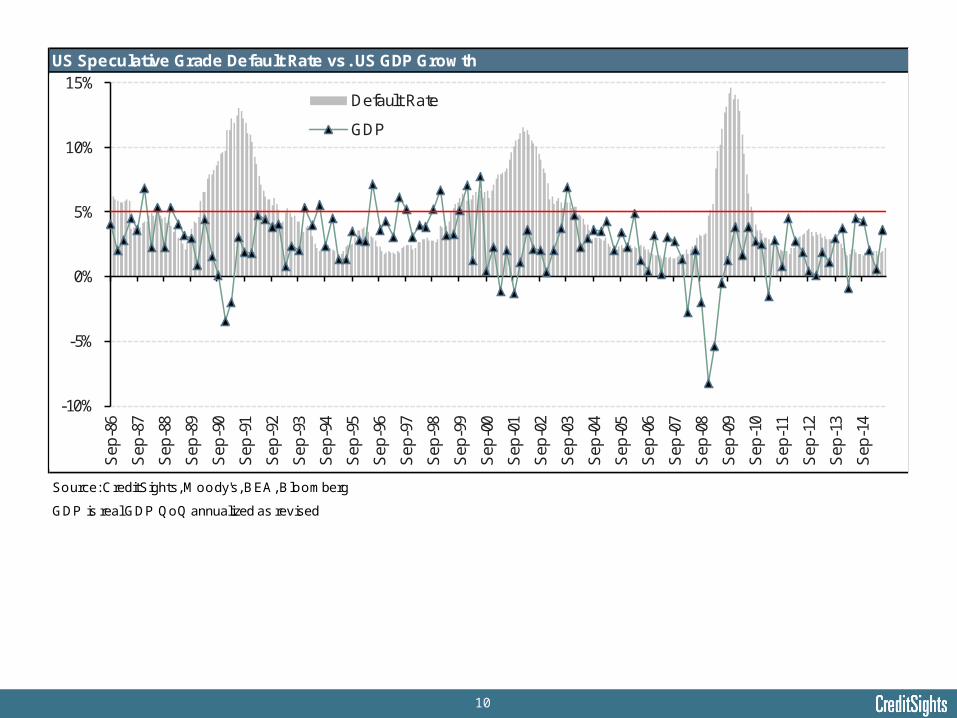
US Speculative Grade Default Rate vs. US GDP Growth
Source: CreditSights, Moody's, BEA, Bloomberg
GDP is real GDP QoQ annualized as revised
-10%
-5%
0%
5%
10%
15%
Sep
-86
Sep
-87
Sep
-88
Sep
-89
Sep
-90
Sep
-91
Sep
-92
Sep
-93
Sep
-94
Sep
-95
Sep
-96
Sep
-97
Sep
-98
Sep
-99
Sep
-00
Sep
-01
Sep
-02
Sep
-03
Sep
-04
Sep
-05
Sep
-06
Sep
-07
Sep
-08
Sep
-09
Sep
-10
Sep
-11
Sep
-12
Sep
-13
Sep
-14
Default Rate
GDP
11
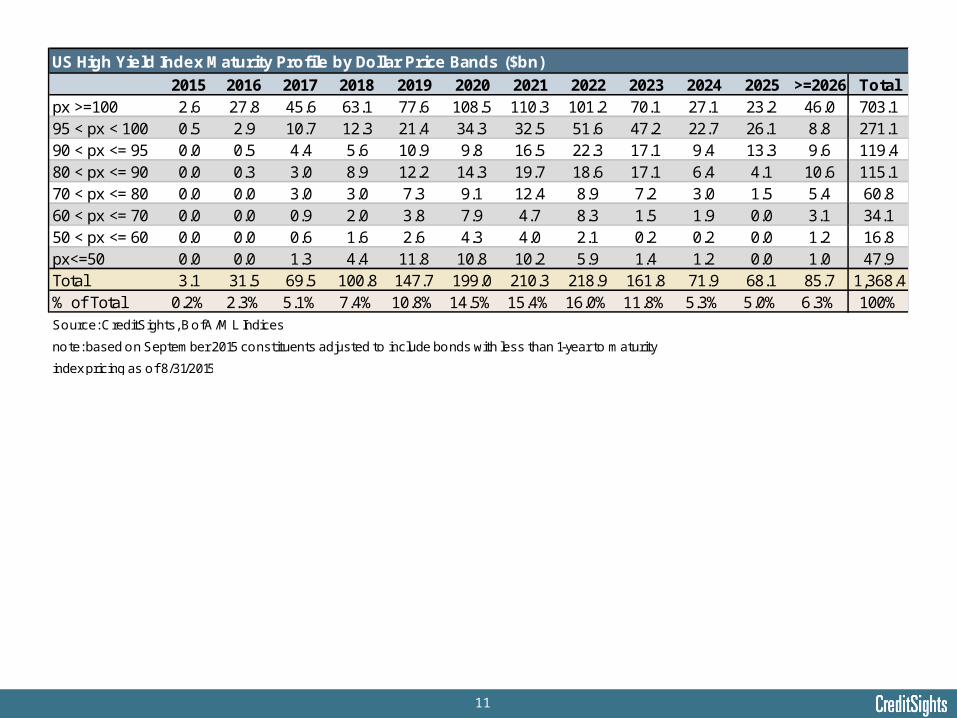
US High Yield Index Maturity Profile by Dollar Price Bands ($bn)
2015 2016 2017 2018 2019 2020 2021 2022 2023 2024 2025 >=2026 Totalpx >=100 2.6 27.8 45.6 63.1 77.6 108.5 110.3 101.2 70.1 27.1 23.2 46.0 703.195 < px < 100 0.5 2.9 10.7 12.3 21.4 34.3 32.5 51.6 47.2 22.7 26.1 8.8 271.190 < px <= 95 0.0 0.5 4.4 5.6 10.9 9.8 16.5 22.3 17.1 9.4 13.3 9.6 119.480 < px <= 90 0.0 0.3 3.0 8.9 12.2 14.3 19.7 18.6 17.1 6.4 4.1 10.6 115.170 < px <= 80 0.0 0.0 3.0 3.0 7.3 9.1 12.4 8.9 7.2 3.0 1.5 5.4 60.860 < px <= 70 0.0 0.0 0.9 2.0 3.8 7.9 4.7 8.3 1.5 1.9 0.0 3.1 34.150 < px <= 60 0.0 0.0 0.6 1.6 2.6 4.3 4.0 2.1 0.2 0.2 0.0 1.2 16.8px<=50 0.0 0.0 1.3 4.4 11.8 10.8 10.2 5.9 1.4 1.2 0.0 1.0 47.9Total 3.1 31.5 69.5 100.8 147.7 199.0 210.3 218.9 161.8 71.9 68.1 85.7 1,368.4% of Total 0.2% 2.3% 5.1% 7.4% 10.8% 14.5% 15.4% 16.0% 11.8% 5.3% 5.0% 6.3% 100%
Source: CreditSights, BofA/ML Indices
note: based on September 2015 constituents adjusted to include bonds with less than 1-year to maturity
index pricing as of 8/31/2015
12
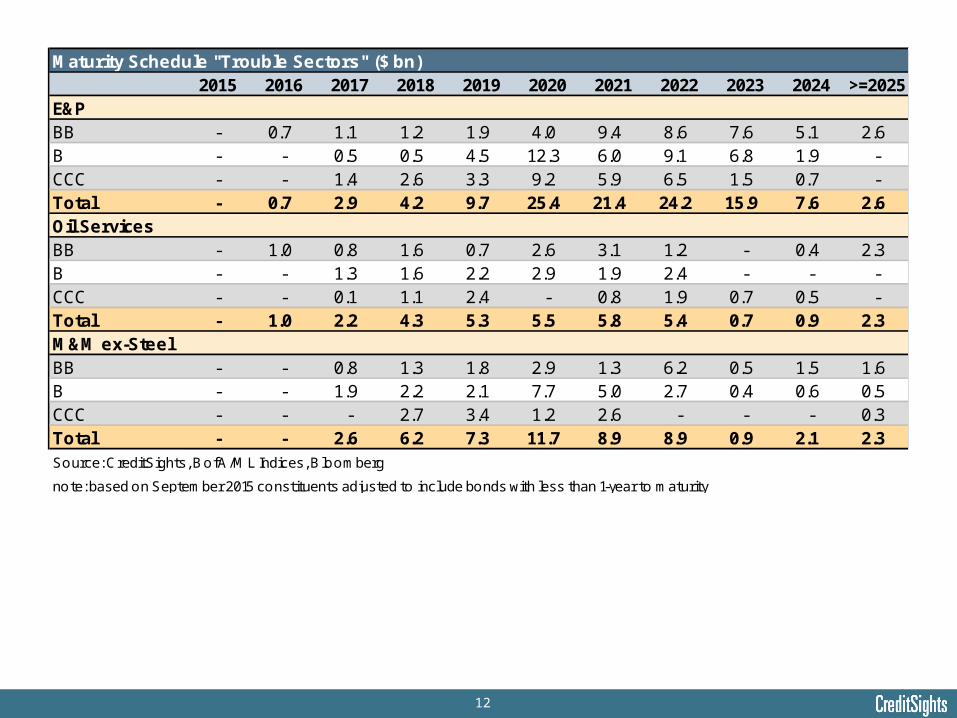
Maturity Schedule "Trouble Sectors" ($ bn)2015 2016 2017 2018 2019 2020 2021 2022 2023 2024 >=2025
E&PBB - 0.7 1.1 1.2 1.9 4.0 9.4 8.6 7.6 5.1 2.6B - - 0.5 0.5 4.5 12.3 6.0 9.1 6.8 1.9 -CCC - - 1.4 2.6 3.3 9.2 5.9 6.5 1.5 0.7 -Total - 0.7 2.9 4.2 9.7 25.4 21.4 24.2 15.9 7.6 2.6Oil ServicesBB - 1.0 0.8 1.6 0.7 2.6 3.1 1.2 - 0.4 2.3B - - 1.3 1.6 2.2 2.9 1.9 2.4 - - -CCC - - 0.1 1.1 2.4 - 0.8 1.9 0.7 0.5 -Total - 1.0 2.2 4.3 5.3 5.5 5.8 5.4 0.7 0.9 2.3M&M ex-SteelBB - - 0.8 1.3 1.8 2.9 1.3 6.2 0.5 1.5 1.6B - - 1.9 2.2 2.1 7.7 5.0 2.7 0.4 0.6 0.5CCC - - - 2.7 3.4 1.2 2.6 - - - 0.3Total - - 2.6 6.2 7.3 11.7 8.9 8.9 0.9 2.1 2.3
Source: CreditSights, BofA/ML Indices, Bloomberg
note: based on September 2015 constituents adjusted to include bonds with less than 1-year to maturity
13
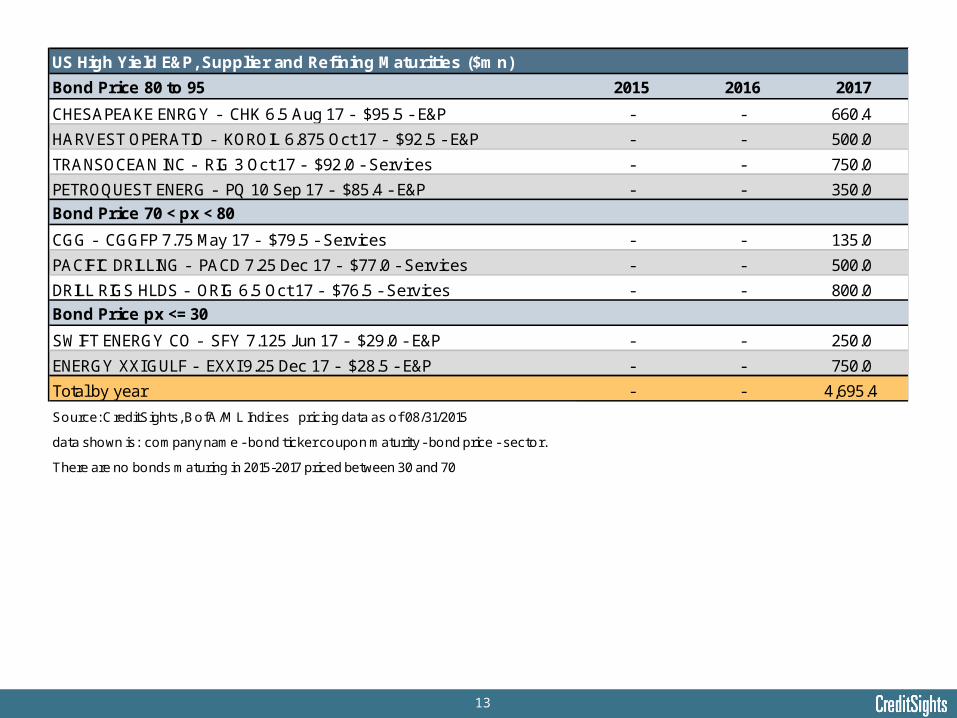
US High Yield E&P, Supplier and Refining Maturities ($mn)
Bond Price 80 to 95 2015 2016 2017
CHESAPEAKE ENRGY - CHK 6.5 Aug 17 - $95.5 - E&P - - 660.4
HARVEST OPERATIO - KOROIL 6.875 Oct 17 - $92.5 - E&P - - 500.0
TRANSOCEAN INC - RIG 3 Oct 17 - $92.0 - Services - - 750.0
PETROQUEST ENERG - PQ 10 Sep 17 - $85.4 - E&P - - 350.0
Bond Price 70 < px < 80
CGG - CGGFP 7.75 May 17 - $79.5 - Services - - 135.0
PACIFIC DRILLING - PACD 7.25 Dec 17 - $77.0 - Services - - 500.0
DRILL RIGS HLDS - ORIG 6.5 Oct 17 - $76.5 - Services - - 800.0
Bond Price px <= 30
SWIFT ENERGY CO - SFY 7.125 Jun 17 - $29.0 - E&P - - 250.0
ENERGY XXI GULF - EXXI 9.25 Dec 17 - $28.5 - E&P - - 750.0
Total by year - - 4,695.4
Source: CreditSights, BofA/ML Indices pricing data as of 08/31/2015
data shown is: company name - bond ticker coupon maturity - bond price - sector.
There are no bonds maturing in 2015-2017 priced between 30 and 70
14
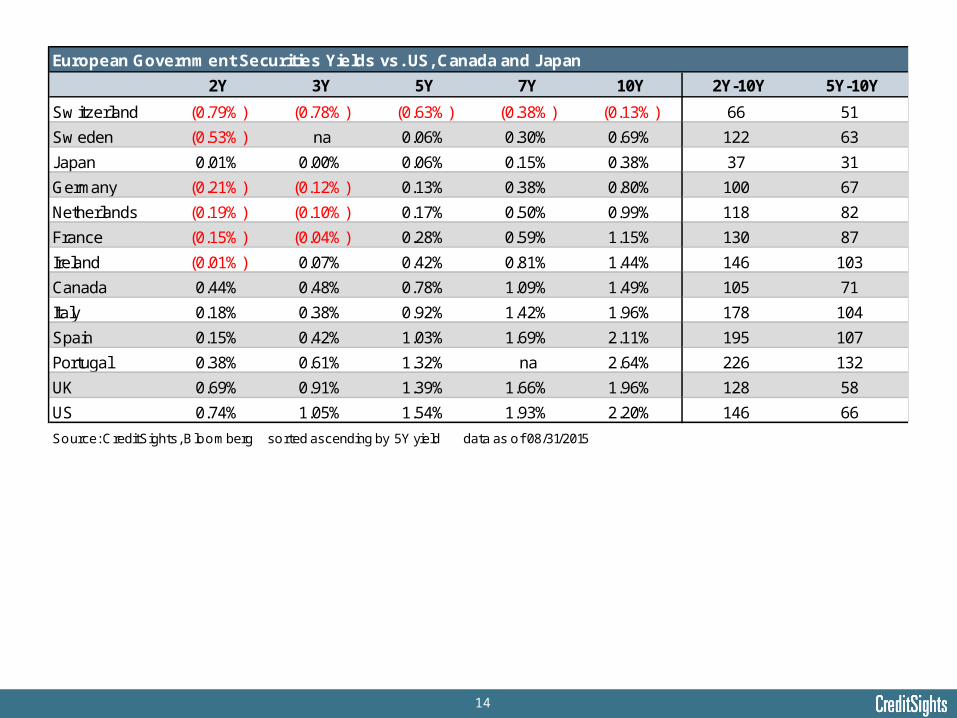
European Government Securities Yields vs. US, Canada and Japan
2Y 3Y 5Y 7Y 10Y 2Y-10Y 5Y-10Y
Sw itzerland (0.79%) (0.78%) (0.63%) (0.38%) (0.13%) 66 51
Sw eden (0.53%) na 0.06% 0.30% 0.69% 122 63
Japan 0.01% 0.00% 0.06% 0.15% 0.38% 37 31
Germany (0.21%) (0.12%) 0.13% 0.38% 0.80% 100 67
Netherlands (0.19%) (0.10%) 0.17% 0.50% 0.99% 118 82
France (0.15%) (0.04%) 0.28% 0.59% 1.15% 130 87
Ireland (0.01%) 0.07% 0.42% 0.81% 1.44% 146 103
Canada 0.44% 0.48% 0.78% 1.09% 1.49% 105 71
Italy 0.18% 0.38% 0.92% 1.42% 1.96% 178 104
Spain 0.15% 0.42% 1.03% 1.69% 2.11% 195 107
Portugal 0.38% 0.61% 1.32% na 2.64% 226 132
UK 0.69% 0.91% 1.39% 1.66% 1.96% 128 58
US 0.74% 1.05% 1.54% 1.93% 2.20% 146 66
Source: CreditSights, Bloomberg sorted ascending by 5Y yield data as of 08/31/2015
15
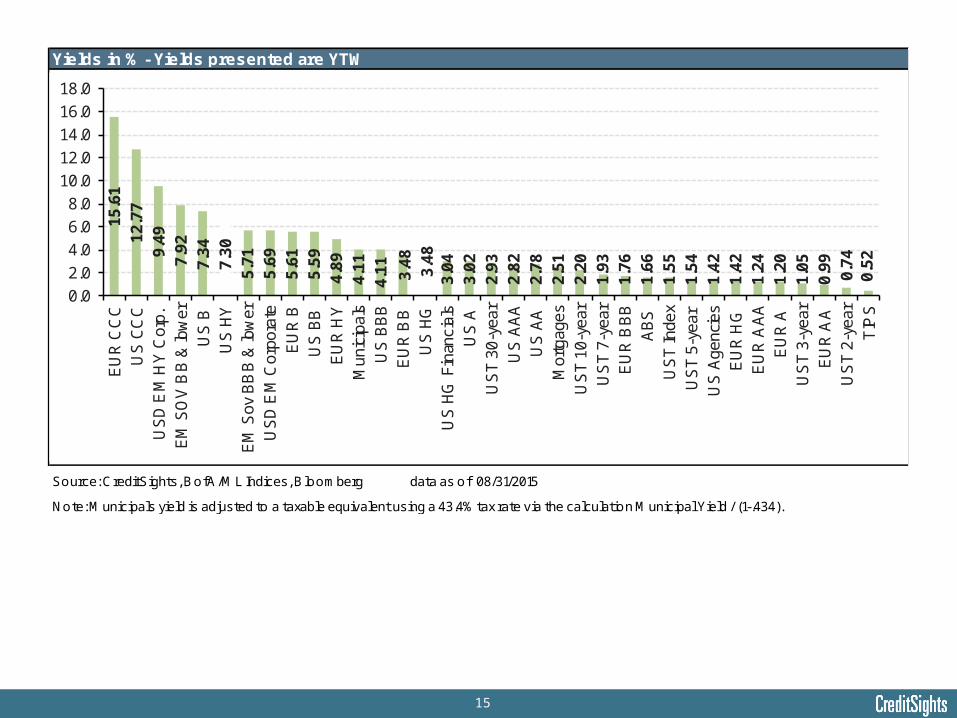
Yields in % - Yields presented are YTW
Source: CreditSights, BofA/ML Indices, Bloomberg data as of 08/31/2015
Note: Municipals yield is adjusted to a taxable equivalent using a 43.4% tax rate via the calculation Municipal Yield / (1-.434).
15.6
112
.77
9.49
7.92
7.34
7.30
5.71
5.69
5.61
5.59
4.89
4.11
4.11 3.48
3.48
3.04
3.02
2.93
2.82
2.78
2.51
2.20
1.93
1.76
1.66
1.55
1.54
1.42
1.42
1.24
1.20
1.05
0.99
0.74
0.52
0.0
2.0
4.0
6.0
8.0
10.0
12.0
14.0
16.0
18.0
EU
R C
CC
US
CC
CU
SD
EM
HY
Cor
p.E
M S
OV
BB
& lo
wer
US
BU
S H
YE
M S
ov B
BB
& lo
wer
US
D E
M C
orpo
rate
EU
R B
US
BB
EU
R H
YM
unic
ipal
sU
S B
BB
EU
R B
BU
S H
GU
S H
G F
inan
cial
sU
S A
US
T 30
-yea
rU
S A
AA
US
AA
Mor
tgag
esU
ST
10-y
ear
US
T 7-
year
EU
R B
BB
AB
SU
ST
Inde
xU
ST
5-ye
arU
S A
genc
ies
EU
R H
GE
UR
AA
AE
UR
AU
ST
3-ye
arE
UR
AA
US
T 2-
year
TIP
S
16
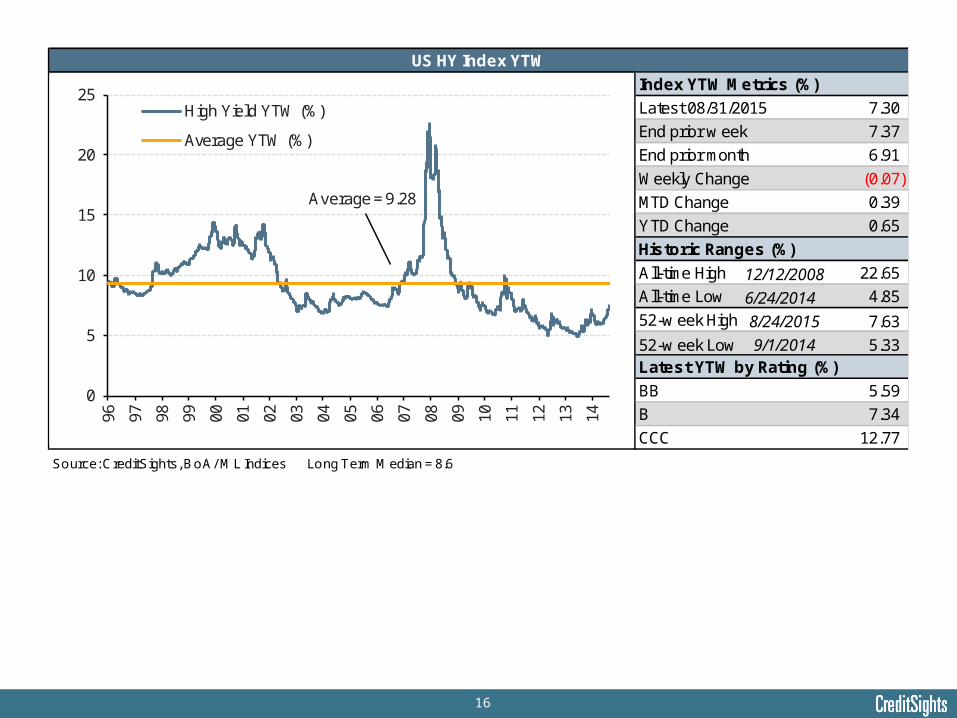
Index YTW Metrics (%)
Latest 08/31/2015 7.30
End prior w eek 7.37
End prior month 6.91
Weekly Change (0.07)
MTD Change 0.39
YTD Change 0.65
Historic Ranges (%)
All-time High 12/12/2008 22.65
All-time Low 6/24/2014 4.85
52-w eek High 8/24/2015 7.63
52-w eek Low 9/1/2014 5.33Latest YTW by Rating (%)
BB 5.59
B 7.34
CCC 12.77
Source: CreditSights, BoA/ ML Indices Long Term Median = 8.6
US HY Index YTW
0
5
10
15
20
2596 97 98 99 00 01 02 03 04 05 06 07 08 09 10 11 12 13 14
High Yield YTW (%)
Average YTW (%)
Average = 9.28

17
Latest Metrics 8/31/2015
HY YTW 7.30%
HG YTW 3.48%
HY-HG Differential 3.82%
Differential / HG YTW 110%
One w eek ago 113%
One month ago 107%
Historic Ranges
All-time High 12/18/2008 174%
All-time Low 10/17/1997 24%
52-w eek High 8/24/2015 129%
52-w eek Low 9/2/2014 78%Long-term Averages
5 yr average 98%
10 yr average 86%
15 yr average 87%
Source: CreditSights, BofA/ML Indices long term median = 76%
Incremental US HY Yield as % of US HG Yield
0%
20%
40%
60%
80%
100%
120%
140%
160%
180%
200%
96 97 98 99 00 01 02 03 04 05 06 07 08 09 10 11 12 13 14
US HY to HG %
Average
Average = 78%
18
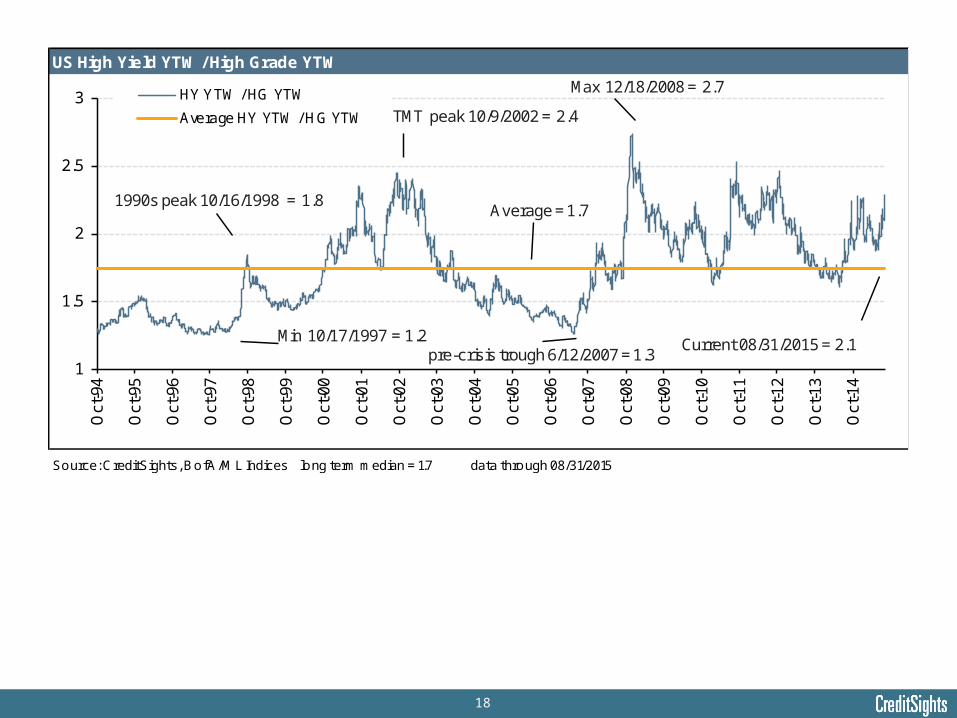
US High Yield YTW / High Grade YTW
Source: CreditSights, BofA/ML Indices long term median = 1.7 data through 08/31/2015
1
1.5
2
2.5
3O
ct-9
4
Oct
-95
Oct
-96
Oct
-97
Oct
-98
Oct
-99
Oct
-00
Oct
-01
Oct
-02
Oct
-03
Oct
-04
Oct
-05
Oct
-06
Oct
-07
Oct
-08
Oct
-09
Oct
-10
Oct
-11
Oct
-12
Oct
-13
Oct
-14
HY YTW / HG YTW
Average HY YTW / HG YTW
Max 12/18/2008 = 2.7
Min 10/17/1997 = 1.2
Average = 1.7
Current 08/31/2015 = 2.1
1990s peak 10/16/1998 = 1.8
TMT peak 10/9/2002 = 2.4
pre-crisis trough 6/12/2007 = 1.3
19
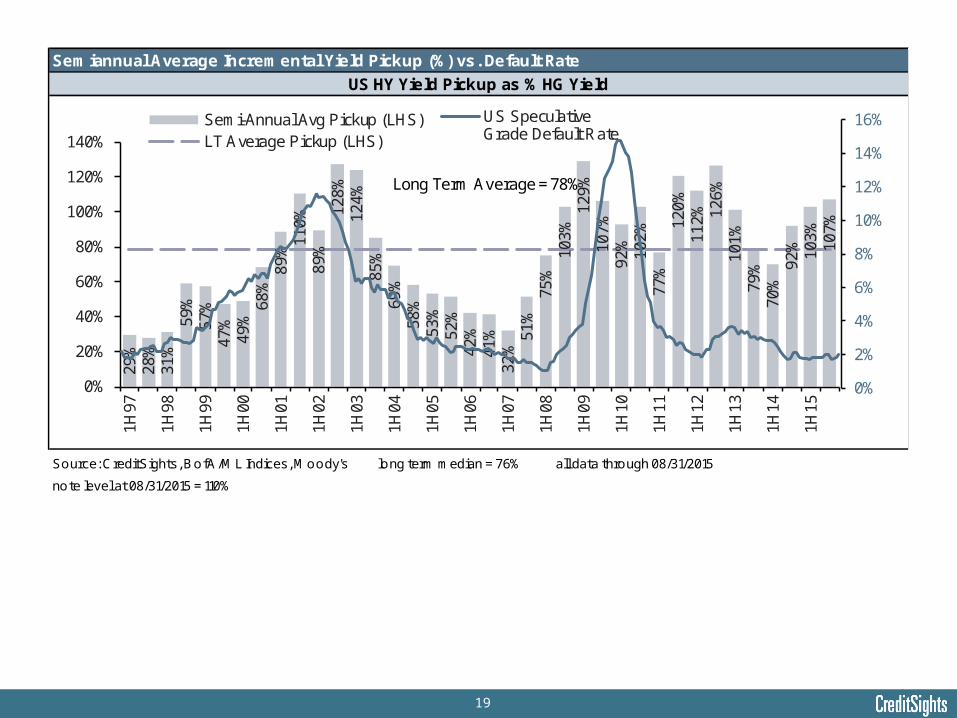
Source: CreditSights, BofA/ML Indices, Moody's long term median = 76% all data through 08/31/2015
note level at 08/31/2015 = 110%
Semiannual Average Incremental Yield Pickup (%) vs. Default Rate
US HY Yield Pickup as % HG Yield
29%
28%
31%
59%
57%
47%
49%
68%
89%
110%
89%
128%
124%
85%
69%
58%
53%
52%
42%
41%
32%
51%
75%
103%
129%
107%
92% 102%
77%
120%
112% 12
6%10
1%79
%70
%92
% 103%
107%
0%
20%
40%
60%
80%
100%
120%
140%1H
97
1H98
1H99
1H00
1H01
1H02
1H03
1H04
1H05
1H06
1H07
1H08
1H09
1H10
1H11
1H12
1H13
1H14
1H15
Semi-Annual Avg Pickup (LHS)LT Average Pickup (LHS)
0%
2%
4%
6%
8%
10%
12%
14%
16%US SpeculativeGrade Default Rate
Long Term Average = 78%
20
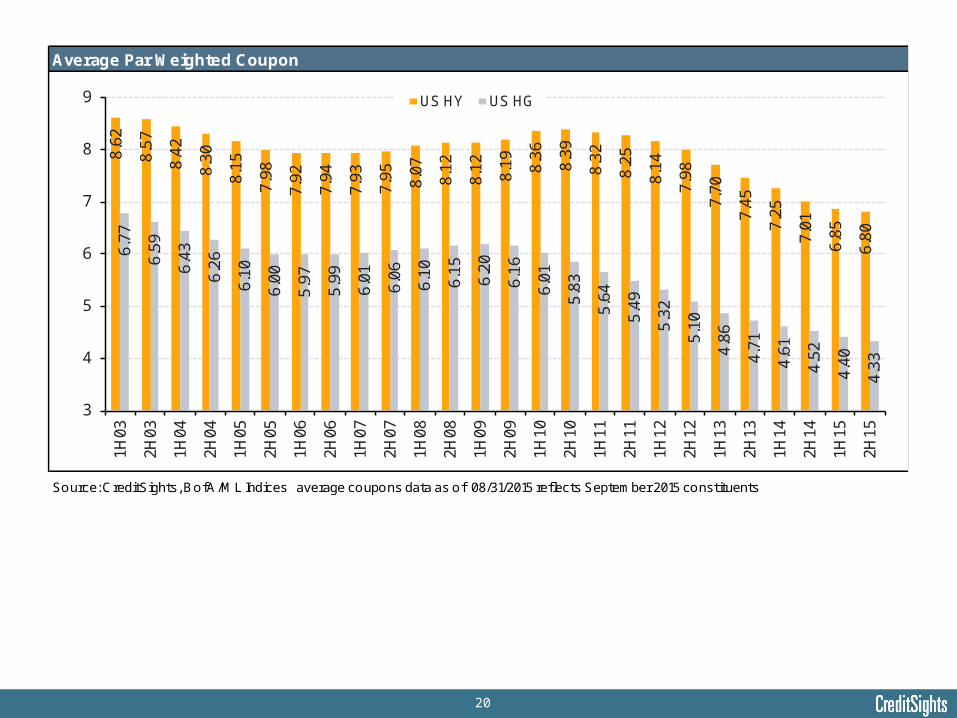
Average Par Weighted Coupon
Source: CreditSights, BofA/ML Indices average coupons data as of 08/31/2015 reflects September 2015 constituents
8.62
8.57
8.42
8.30
8.15
7.98
7.92
7.94
7.93
7.95 8.07
8.12
8.12
8.19 8.36
8.39
8.32
8.25
8.14
7.98
7.70
7.45
7.25
7.01
6.85
6.80
6.77
6.59
6.43
6.26
6.10
6.00
5.97
5.99
6.01
6.06
6.10
6.15
6.20
6.16
6.01
5.83
5.64
5.49
5.32
5.10
4.86
4.71
4.61
4.52
4.40
4.33
3
4
5
6
7
8
9
1H03
2H03
1H04
2H04
1H05
2H05
1H06
2H06
1H07
2H07
1H08
2H08
1H09
2H09
1H10
2H10
1H11
2H11
1H12
2H12
1H13
2H13
1H14
2H14
1H15
2H15
US HY US HG
21
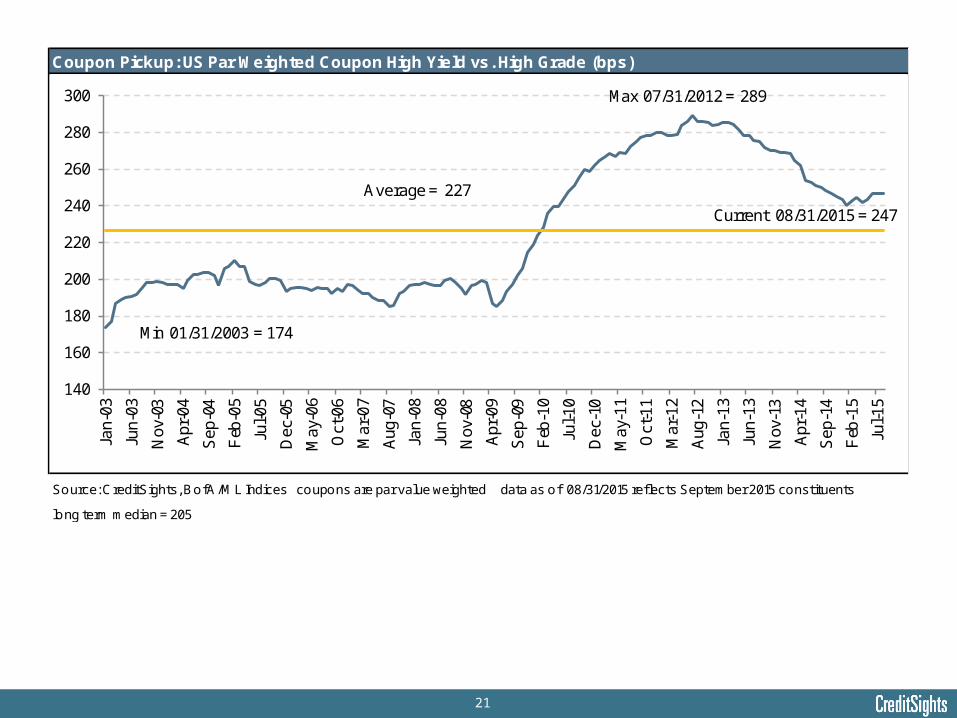
Coupon Pickup: US Par Weighted Coupon High Yield vs. High Grade (bps)
Source: CreditSights, BofA/ML Indices coupons are par value weighted data as of 08/31/2015 reflects September 2015 constituents
long term median = 205
140
160
180
200
220
240
260
280
300Ja
n-03
Jun-
03
Nov
-03
Apr
-04
Sep
-04
Feb
-05
Jul-0
5
Dec
-05
May
-06
Oct
-06
Mar
-07
Aug
-07
Jan-
08
Jun-
08
Nov
-08
Apr
-09
Sep
-09
Feb
-10
Jul-1
0
Dec
-10
May
-11
Oct
-11
Mar
-12
Aug
-12
Jan-
13
Jun-
13
Nov
-13
Apr
-14
Sep
-14
Feb
-15
Jul-1
5
Current 08/31/2015 = 247
Max 07/31/2012 = 289
Min 01/31/2003 = 174
Average = 227
22
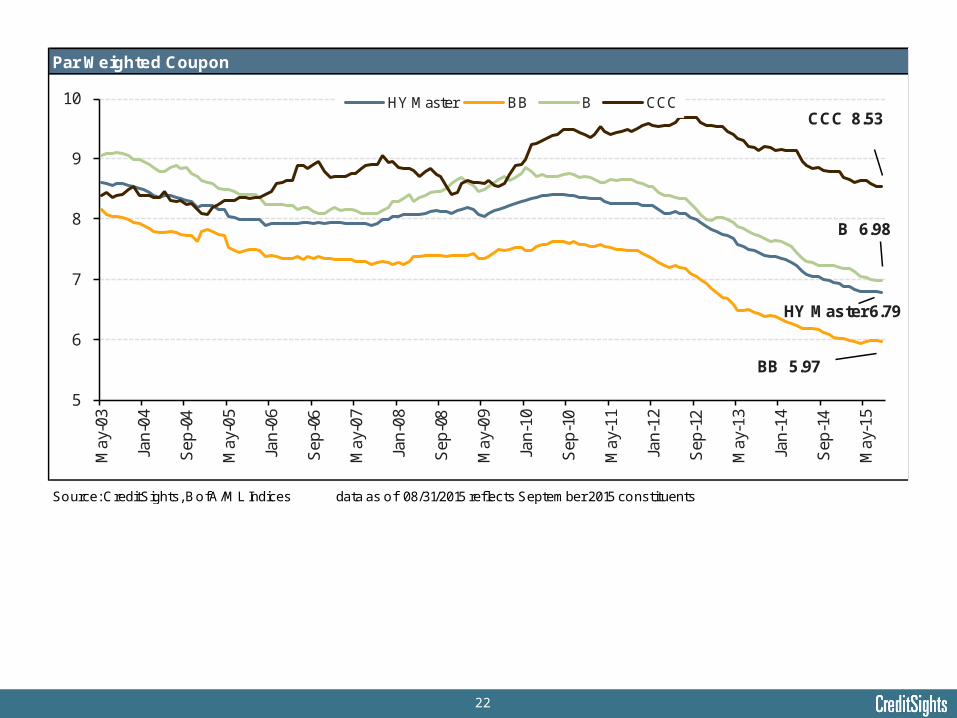
Par Weighted Coupon
Source: CreditSights, BofA/ML Indices data as of 08/31/2015 reflects September 2015 constituents
5
6
7
8
9
10M
ay-0
3
Jan-
04
Sep
-04
May
-05
Jan-
06
Sep
-06
May
-07
Jan-
08
Sep
-08
May
-09
Jan-
10
Sep
-10
May
-11
Jan-
12
Sep
-12
May
-13
Jan-
14
Sep
-14
May
-15
HY Master BB B CCC
HY Master 6.79
BB 5.97
B 6.98
CCC 8.53
23
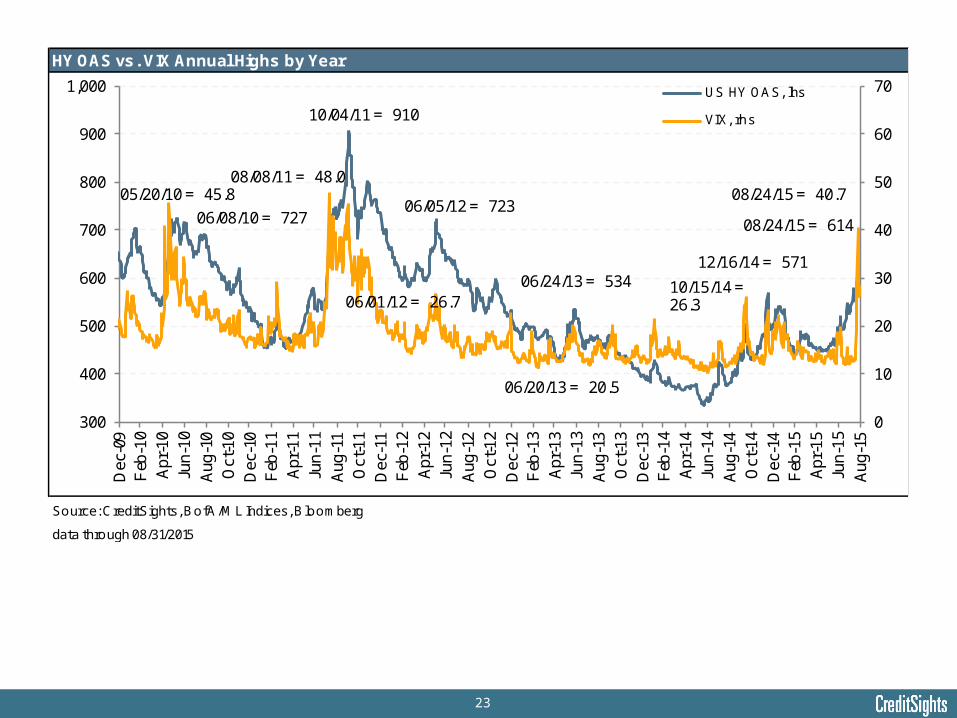
HY OAS vs. VIX Annual Highs by Year
Source: CreditSights, BofA/ML Indices, Bloomberg
data through 08/31/2015
0
10
20
30
40
50
60
70
300
400
500
600
700
800
900
1,000
Dec
-09
Feb
-10
Apr
-10
Jun-
10A
ug-1
0O
ct-1
0D
ec-1
0F
eb-1
1A
pr-1
1Ju
n-11
Aug
-11
Oct
-11
Dec
-11
Feb
-12
Apr
-12
Jun-
12A
ug-1
2O
ct-1
2D
ec-1
2F
eb-1
3A
pr-1
3Ju
n-13
Aug
-13
Oct
-13
Dec
-13
Feb
-14
Apr
-14
Jun-
14A
ug-1
4O
ct-1
4D
ec-1
4F
eb-1
5A
pr-1
5Ju
n-15
Aug
-15
US HY OAS, lhs
VIX, rhs
05/20/10 = 45.808/08/11 = 48.0
06/01/12 = 26.7
06/20/13 = 20.5
10/15/14 = 26.3
06/08/10 = 727
10/04/11 = 910
06/05/12 = 723
06/24/13 = 53412/16/14 = 571
08/24/15 = 614
08/24/15 = 40.7
24
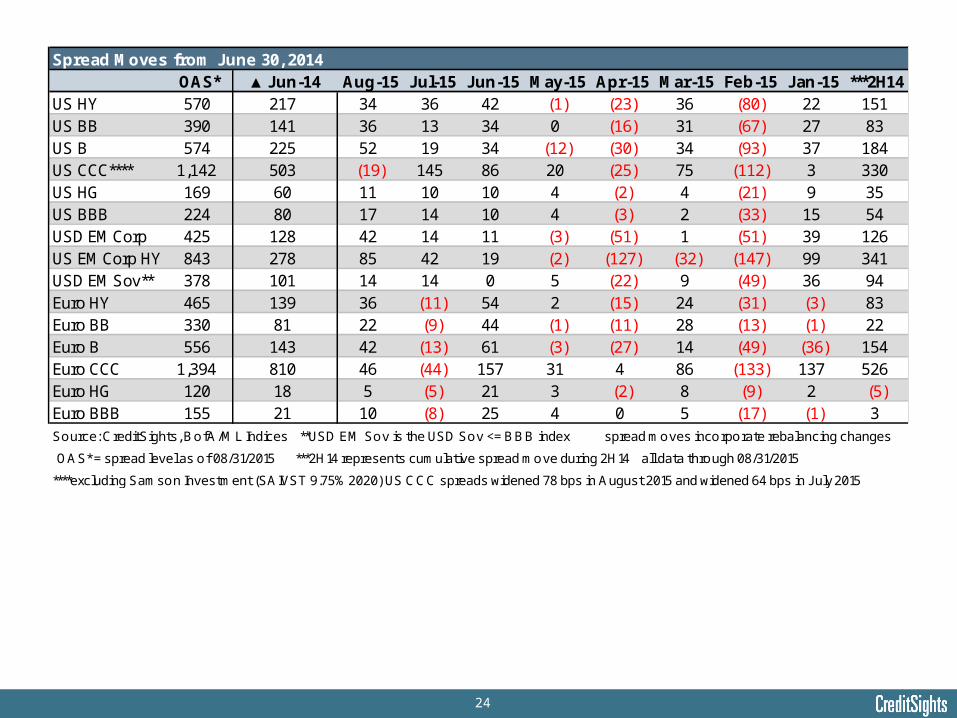
Spread Moves from June 30, 2014OAS* ▲Jun-14 Aug-15 Jul-15 Jun-15 May-15 Apr-15 Mar-15 Feb-15 Jan-15 ***2H14
US HY 570 217 34 36 42 (1) (23) 36 (80) 22 151US BB 390 141 36 13 34 0 (16) 31 (67) 27 83US B 574 225 52 19 34 (12) (30) 34 (93) 37 184US CCC**** 1,142 503 (19) 145 86 20 (25) 75 (112) 3 330US HG 169 60 11 10 10 4 (2) 4 (21) 9 35US BBB 224 80 17 14 10 4 (3) 2 (33) 15 54USD EM Corp 425 128 42 14 11 (3) (51) 1 (51) 39 126US EM Corp HY 843 278 85 42 19 (2) (127) (32) (147) 99 341USD EM Sov** 378 101 14 14 0 5 (22) 9 (49) 36 94Euro HY 465 139 36 (11) 54 2 (15) 24 (31) (3) 83Euro BB 330 81 22 (9) 44 (1) (11) 28 (13) (1) 22Euro B 556 143 42 (13) 61 (3) (27) 14 (49) (36) 154Euro CCC 1,394 810 46 (44) 157 31 4 86 (133) 137 526Euro HG 120 18 5 (5) 21 3 (2) 8 (9) 2 (5)Euro BBB 155 21 10 (8) 25 4 0 5 (17) (1) 3
Source: CreditSights, BofA/ML Indices **USD EM Sov is the USD Sov <= BBB index spread moves incorporate rebalancing changes
OAS* = spread level as of 08/31/2015 ***2H14 represents cumulative spread move during 2H14 all data through 08/31/2015
****excluding Samson Investment (SAIVST 9.75% 2020) US CCC spreads widened 78 bps in August 2015 and widened 64 bps in J uly 2015
25
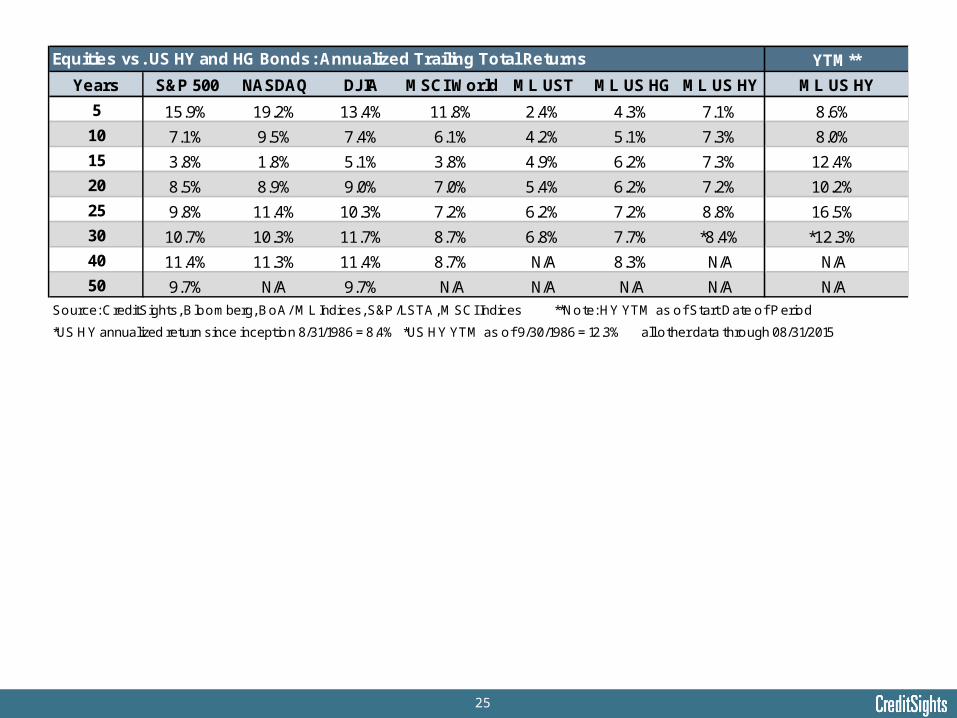
YTM**
Years S&P 500 NASDAQ DJIA MSCI World ML UST ML US HG ML US HY ML US HY
5 15.9% 19.2% 13.4% 11.8% 2.4% 4.3% 7.1% 8.6%
10 7.1% 9.5% 7.4% 6.1% 4.2% 5.1% 7.3% 8.0%
15 3.8% 1.8% 5.1% 3.8% 4.9% 6.2% 7.3% 12.4%
20 8.5% 8.9% 9.0% 7.0% 5.4% 6.2% 7.2% 10.2%
25 9.8% 11.4% 10.3% 7.2% 6.2% 7.2% 8.8% 16.5%
30 10.7% 10.3% 11.7% 8.7% 6.8% 7.7% *8.4% *12.3%
40 11.4% 11.3% 11.4% 8.7% N/A 8.3% N/A N/A
50 9.7% N/A 9.7% N/A N/A N/A N/A N/A
Source: CreditSights, Bloomberg, BoA/ ML Indices, S&P /LSTA, MSCI Indices **Note: HY YTM as of Start Date of P eriod
*US HY annualized return since inception 8/31/1986 = 8.4% *US HY YTM as of 9/30/1986 = 12.3% all other data through 08/31/2015
Equities vs. US HY and HG Bonds: Annualized Trailing Total Returns
26
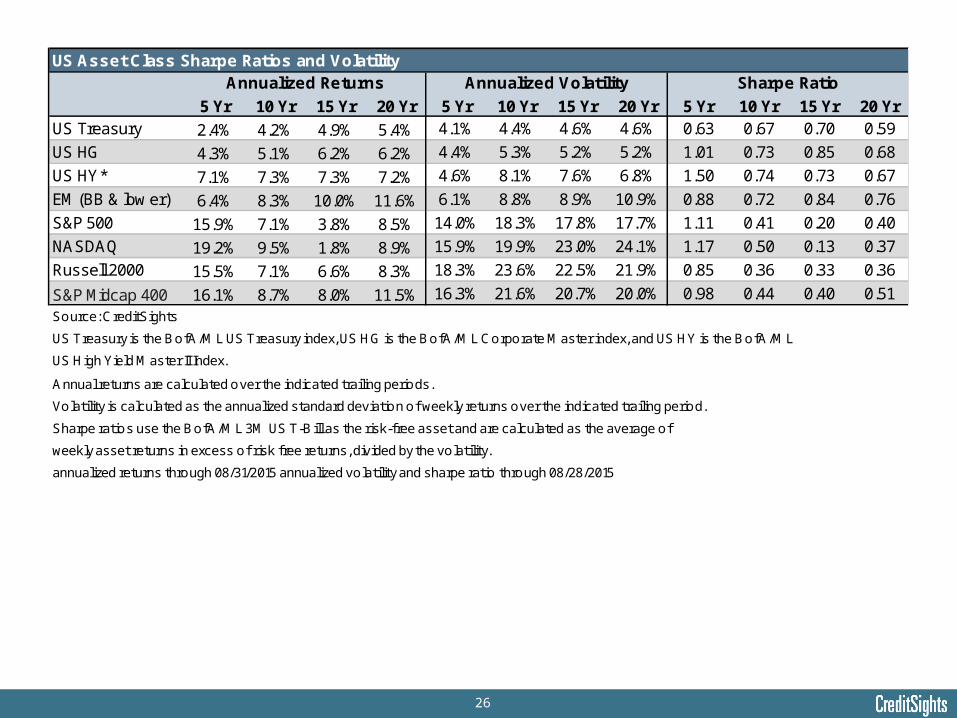
US Asset Class Sharpe Ratios and Volatility
5 Yr 10 Yr 15 Yr 20 Yr 5 Yr 10 Yr 15 Yr 20 Yr 5 Yr 10 Yr 15 Yr 20 YrUS Treasury 2.4% 4.2% 4.9% 5.4% 4.1% 4.4% 4.6% 4.6% 0.63 0.67 0.70 0.59
US HG 4.3% 5.1% 6.2% 6.2% 4.4% 5.3% 5.2% 5.2% 1.01 0.73 0.85 0.68
US HY* 7.1% 7.3% 7.3% 7.2% 4.6% 8.1% 7.6% 6.8% 1.50 0.74 0.73 0.67
EM (BB & low er) 6.4% 8.3% 10.0% 11.6% 6.1% 8.8% 8.9% 10.9% 0.88 0.72 0.84 0.76
S&P 500 15.9% 7.1% 3.8% 8.5% 14.0% 18.3% 17.8% 17.7% 1.11 0.41 0.20 0.40
NASDAQ 19.2% 9.5% 1.8% 8.9% 15.9% 19.9% 23.0% 24.1% 1.17 0.50 0.13 0.37
Russell 2000 15.5% 7.1% 6.6% 8.3% 18.3% 23.6% 22.5% 21.9% 0.85 0.36 0.33 0.36
S&P Midcap 400 16.1% 8.7% 8.0% 11.5% 16.3% 21.6% 20.7% 20.0% 0.98 0.44 0.40 0.51
Source: CreditSights
US Treasury is the BofA/ML US Treasury index, US HG is the BofA/ML Corporate Master index, and US HY is the BofA/ML
US High Yield Master II Index.
Annual returns are calculated over the indicated trailing periods.
Volatility is calculated as the annualized standard deviation of weekly returns over the indicated trailing period.
Sharpe ratios use the BofA/ML 3M US T-Bill as the risk-free asset and are calculated as the average of
weekly asset returns in excess of risk free returns, divided by the volatility.
annualized returns through 08/31/2015 annualized volatility and sharpe ratio through 08/28/2015
Annualized Returns Annualized Volatility Sharpe Ratio
27
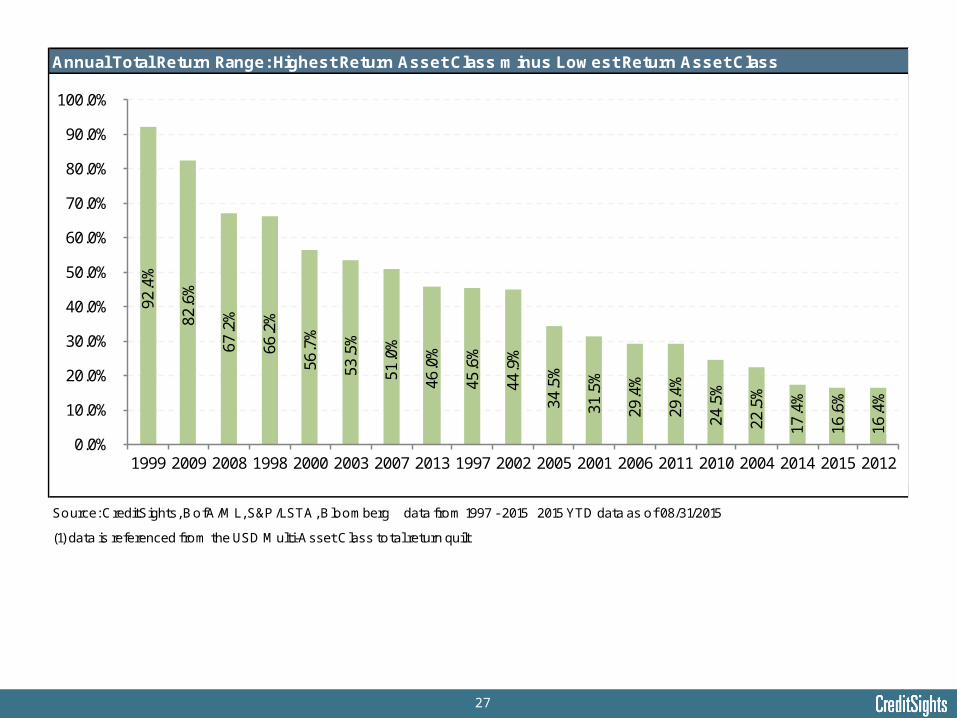
Annual Total Return Range: Highest Return Asset Class minus Lowest Return Asset Class
Source: CreditSights, BofA/ML, S&P /LSTA, Bloomberg data from 1997 - 2015 2015 YTD data as of 08/31/2015
(1) data is referenced from the USD Multi-Asset Class total return quilt
92.4
%
82.6
%
67.2
%
66.2
%
56.7
%
53.5
%
51.0
%
46.0
%
45.6
%
44.9
%
34.5
%
31.5
%
29.4
%
29.4
%
24.5
%
22.5
%
17.4
%
16.6
%
16.4
%
0.0%
10.0%
20.0%
30.0%
40.0%
50.0%
60.0%
70.0%
80.0%
90.0%
100.0%
1999 2009 2008 1998 2000 2003 2007 2013 1997 2002 2005 2001 2006 2011 2010 2004 2014 2015 2012
28
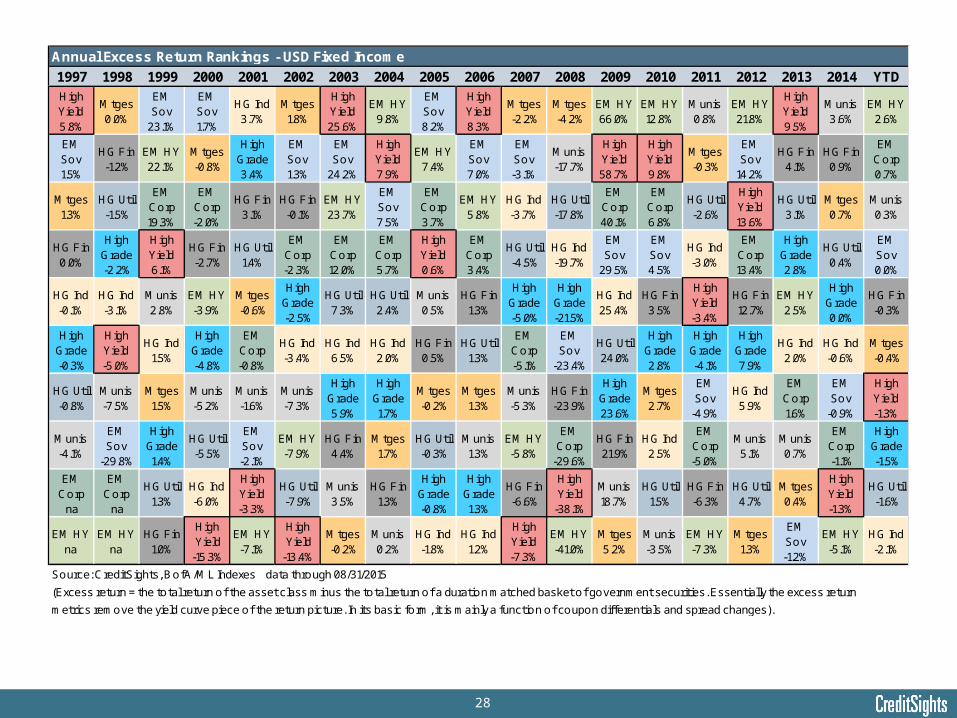
Annual Excess Return Rankings - USD Fixed Income
1997 1998 1999 2000 2001 2002 2003 2004 2005 2006 2007 2008 2009 2010 2011 2012 2013 2014 YTD
High Yield 5.8%
Mtges 0.0%
EM Sov
23.1%
EM Sov 1.7%
HG Ind 3.7%
Mtges 1.8%
High Yield 25.6%
EM HY 9.8%
EM Sov 8.2%
High Yield 8.3%
Mtges -2.2%
Mtges -4.2%
EM HY 66.0%
EM HY 12.8%
Munis 0.8%
EM HY 21.8%
High Yield 9.5%
Munis 3.6%
EM HY 2.6%
EM Sov 1.5%
HG Fin -1.2%
EM HY 22.1%
Mtges -0.8%
High Grade 3.4%
EM Sov 1.3%
EM Sov
24.2%
High Yield 7.9%
EM HY 7.4%
EM Sov 7.0%
EM Sov -3.1%
Munis -17.7%
High Yield 58.7%
High Yield 9.8%
Mtges -0.3%
EM Sov
14.2%
HG Fin 4.1%
HG Fin 0.9%
EM Corp 0.7%
Mtges 1.3%
HG Util -1.5%
EM Corp 19.3%
EM Corp -2.0%
HG Fin 3.1%
HG Fin -0.1%
EM HY 23.7%
EM Sov 7.5%
EM Corp 3.7%
EM HY 5.8%
HG Ind -3.7%
HG Util -17.8%
EM Corp 40.1%
EM Corp 6.8%
HG Util -2.6%
High Yield 13.6%
HG Util 3.1%
Mtges 0.7%
Munis 0.3%
HG Fin 0.0%
High Grade -2.2%
High Yield 6.1%
HG Fin -2.7%
HG Util 1.4%
EM Corp -2.3%
EM Corp 12.0%
EM Corp 5.7%
High Yield 0.6%
EM Corp 3.4%
HG Util -4.5%
HG Ind -19.7%
EM Sov
29.5%
EM Sov 4.5%
HG Ind -3.0%
EM Corp 13.4%
High Grade 2.8%
HG Util 0.4%
EM Sov 0.0%
HG Ind -0.1%
HG Ind -3.1%
Munis 2.8%
EM HY -3.9%
Mtges -0.6%
High Grade -2.5%
HG Util 7.3%
HG Util 2.4%
Munis 0.5%
HG Fin 1.3%
High Grade -5.0%
High Grade -21.5%
HG Ind 25.4%
HG Fin 3.5%
High Yield -3.4%
HG Fin 12.7%
EM HY 2.5%
High Grade 0.0%
HG Fin -0.3%
High Grade -0.3%
High Yield -5.0%
HG Ind 1.5%
High Grade -4.8%
EM Corp -0.8%
HG Ind -3.4%
HG Ind 6.5%
HG Ind 2.0%
HG Fin 0.5%
HG Util 1.3%
EM Corp -5.1%
EM Sov
-23.4%
HG Util 24.0%
High Grade 2.8%
High Grade -4.1%
High Grade 7.9%
HG Ind 2.0%
HG Ind -0.6%
Mtges -0.4%
HG Util -0.8%
Munis -7.5%
Mtges 1.5%
Munis -5.2%
Munis -1.6%
Munis -7.3%
High Grade 5.9%
High Grade 1.7%
Mtges -0.2%
Mtges 1.3%
Munis -5.3%
HG Fin -23.9%
High Grade 23.6%
Mtges 2.7%
EM Sov
-4.9%
HG Ind 5.9%
EM Corp 1.6%
EM Sov
-0.9%
High Yield -1.3%
Munis -4.1%
EM Sov
-29.8%
High Grade 1.4%
HG Util -5.5%
EM Sov -2.1%
EM HY -7.9%
HG Fin 4.4%
Mtges 1.7%
HG Util -0.3%
Munis 1.3%
EM HY -5.8%
EM Corp
-29.6%
HG Fin 21.9%
HG Ind 2.5%
EM Corp -5.0%
Munis 5.1%
Munis 0.7%
EM Corp -1.1%
High Grade -1.5%
EM Corp
na
EM Corp
na
HG Util 1.3%
HG Ind -6.0%
High Yield -3.3%
HG Util -7.9%
Munis 3.5%
HG Fin 1.3%
High Grade -0.8%
High Grade 1.3%
HG Fin -6.6%
High Yield
-38.1%
Munis 18.7%
HG Util 1.5%
HG Fin -6.3%
HG Util 4.7%
Mtges 0.4%
High Yield -1.3%
HG Util -1.6%
EM HY na
EM HY na
HG Fin 1.0%
High Yield
-15.3%
EM HY -7.1%
High Yield
-13.4%
Mtges -0.2%
Munis 0.2%
HG Ind -1.8%
HG Ind 1.2%
High Yield -7.3%
EM HY -41.0%
Mtges 5.2%
Munis -3.5%
EM HY -7.3%
Mtges 1.3%
EM Sov -1.2%
EM HY -5.1%
HG Ind -2.1%
Source: CreditSights, BofA/ML Indexes data through 08/31/2015
(Excess return = the total return of the asset class minus the total return of a duration matched basket of government securities. Essentially the excess return
metrics remove the yield curve piece of the return picture. In its basic form, it is mainly a function of coupon differentials and spread changes).
29
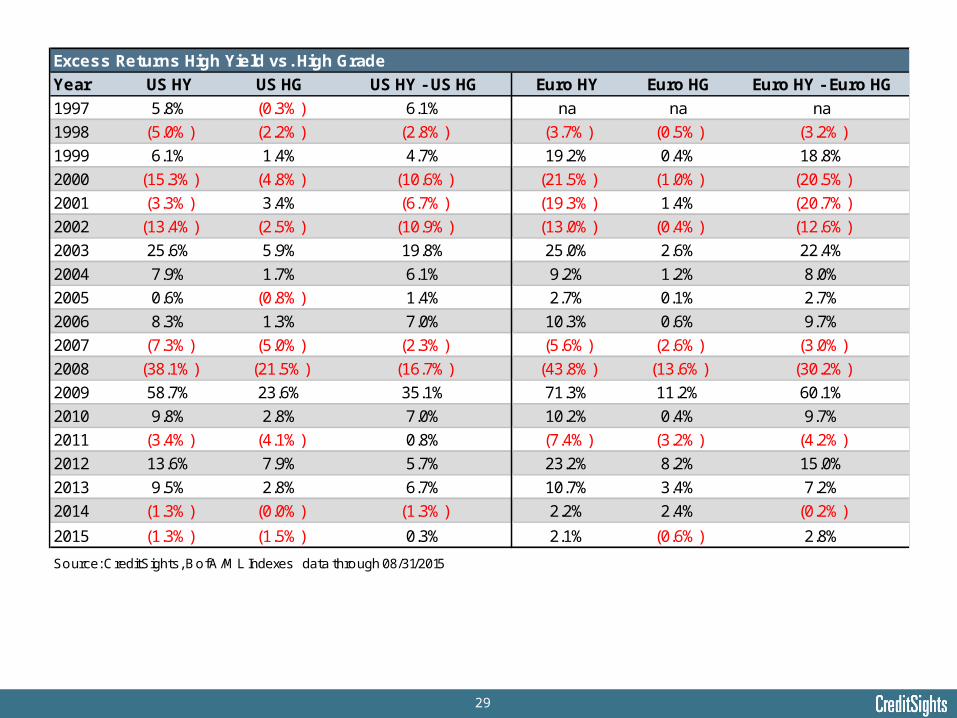
Excess Returns High Yield vs. High Grade
Year US HY US HG US HY - US HG Euro HY Euro HG Euro HY - Euro HG
1997 5.8% (0.3%) 6.1% na na na
1998 (5.0%) (2.2%) (2.8%) (3.7%) (0.5%) (3.2%)
1999 6.1% 1.4% 4.7% 19.2% 0.4% 18.8%
2000 (15.3%) (4.8%) (10.6%) (21.5%) (1.0%) (20.5%)
2001 (3.3%) 3.4% (6.7%) (19.3%) 1.4% (20.7%)
2002 (13.4%) (2.5%) (10.9%) (13.0%) (0.4%) (12.6%)
2003 25.6% 5.9% 19.8% 25.0% 2.6% 22.4%
2004 7.9% 1.7% 6.1% 9.2% 1.2% 8.0%
2005 0.6% (0.8%) 1.4% 2.7% 0.1% 2.7%
2006 8.3% 1.3% 7.0% 10.3% 0.6% 9.7%
2007 (7.3%) (5.0%) (2.3%) (5.6%) (2.6%) (3.0%)
2008 (38.1%) (21.5%) (16.7%) (43.8%) (13.6%) (30.2%)
2009 58.7% 23.6% 35.1% 71.3% 11.2% 60.1%
2010 9.8% 2.8% 7.0% 10.2% 0.4% 9.7%
2011 (3.4%) (4.1%) 0.8% (7.4%) (3.2%) (4.2%)
2012 13.6% 7.9% 5.7% 23.2% 8.2% 15.0%
2013 9.5% 2.8% 6.7% 10.7% 3.4% 7.2%
2014 (1.3%) (0.0%) (1.3%) 2.2% 2.4% (0.2%)
2015 (1.3%) (1.5%) 0.3% 2.1% (0.6%) 2.8%
Source: CreditSights, BofA/ML Indexes data through 08/31/2015
30
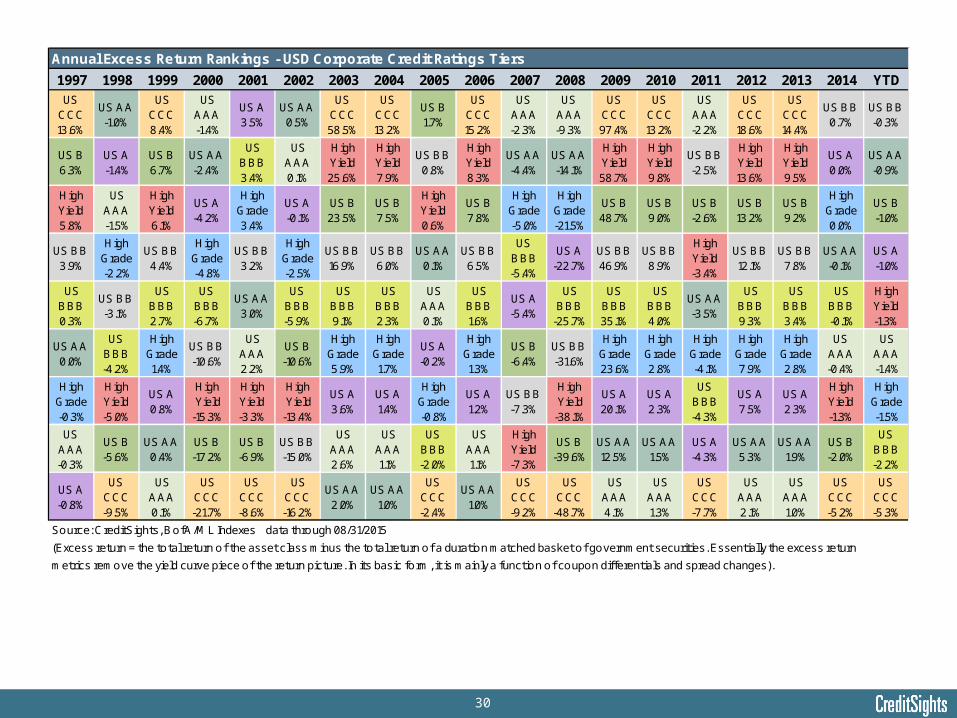
Annual Excess Return Rankings - USD Corporate Credit Ratings Tiers
1997 1998 1999 2000 2001 2002 2003 2004 2005 2006 2007 2008 2009 2010 2011 2012 2013 2014 YTD
US CCC 13.6%
US AA -1.0%
US CCC 8.4%
US AAA -1.4%
US A 3.5%
US AA 0.5%
US CCC 58.5%
US CCC 13.2%
US B 1.7%
US CCC 15.2%
US AAA -2.3%
US AAA -9.3%
US CCC 97.4%
US CCC 13.2%
US AAA -2.2%
US CCC 18.6%
US CCC 14.4%
US BB 0.7%
US BB -0.3%
US B 6.3%
US A -1.4%
US B 6.7%
US AA -2.4%
US BBB 3.4%
US AAA 0.1%
High Yield 25.6%
High Yield 7.9%
US BB 0.8%
High Yield 8.3%
US AA -4.4%
US AA -14.1%
High Yield 58.7%
High Yield 9.8%
US BB -2.5%
High Yield 13.6%
High Yield 9.5%
US A 0.0%
US AA -0.9%
High Yield 5.8%
US AAA -1.5%
High Yield 6.1%
US A -4.2%
High Grade 3.4%
US A -0.1%
US B 23.5%
US B 7.5%
High Yield 0.6%
US B 7.8%
High Grade -5.0%
High Grade -21.5%
US B 48.7%
US B 9.0%
US B -2.6%
US B 13.2%
US B 9.2%
High Grade 0.0%
US B -1.0%
US BB 3.9%
High Grade -2.2%
US BB 4.4%
High Grade -4.8%
US BB 3.2%
High Grade -2.5%
US BB 16.9%
US BB 6.0%
US AA 0.1%
US BB 6.5%
US BBB -5.4%
US A -22.7%
US BB 46.9%
US BB 8.9%
High Yield -3.4%
US BB 12.1%
US BB 7.8%
US AA -0.1%
US A -1.0%
US BBB 0.3%
US BB -3.1%
US BBB 2.7%
US BBB -6.7%
US AA 3.0%
US BBB -5.9%
US BBB 9.1%
US BBB 2.3%
US AAA 0.1%
US BBB 1.6%
US A -5.4%
US BBB
-25.7%
US BBB 35.1%
US BBB 4.0%
US AA -3.5%
US BBB 9.3%
US BBB 3.4%
US BBB -0.1%
High Yield -1.3%
US AA 0.0%
US BBB -4.2%
High Grade 1.4%
US BB -10.6%
US AAA 2.2%
US B -10.6%
High Grade 5.9%
High Grade 1.7%
US A -0.2%
High Grade 1.3%
US B -6.4%
US BB -31.6%
High Grade 23.6%
High Grade 2.8%
High Grade -4.1%
High Grade 7.9%
High Grade 2.8%
US AAA -0.4%
US AAA -1.4%
High Grade -0.3%
High Yield -5.0%
US A 0.8%
High Yield
-15.3%
High Yield -3.3%
High Yield
-13.4%
US A 3.6%
US A 1.4%
High Grade -0.8%
US A 1.2%
US BB -7.3%
High Yield
-38.1%
US A 20.1%
US A 2.3%
US BBB -4.3%
US A 7.5%
US A 2.3%
High Yield -1.3%
High Grade -1.5%
US AAA -0.3%
US B -5.6%
US AA 0.4%
US B -17.2%
US B -6.9%
US BB -15.0%
US AAA 2.6%
US AAA 1.1%
US BBB -2.0%
US AAA 1.1%
High Yield -7.3%
US B -39.6%
US AA 12.5%
US AA 1.5%
US A -4.3%
US AA 5.3%
US AA 1.9%
US B -2.0%
US BBB -2.2%
US A -0.8%
US CCC -9.5%
US AAA 0.1%
US CCC -21.7%
US CCC -8.6%
US CCC -16.2%
US AA 2.0%
US AA 1.0%
US CCC -2.4%
US AA 1.0%
US CCC -9.2%
US CCC
-48.7%
US AAA 4.1%
US AAA 1.3%
US CCC -7.7%
US AAA 2.1%
US AAA 1.0%
US CCC -5.2%
US CCC -5.3%
Source: CreditSights, BofA/ML Indexes data through 08/31/2015
(Excess return = the total return of the asset class minus the total return of a duration matched basket of government securities. Essentially the excess return
metrics remove the yield curve piece of the return picture. In its basic form, it is mainly a function of coupon differentials and spread changes).
31
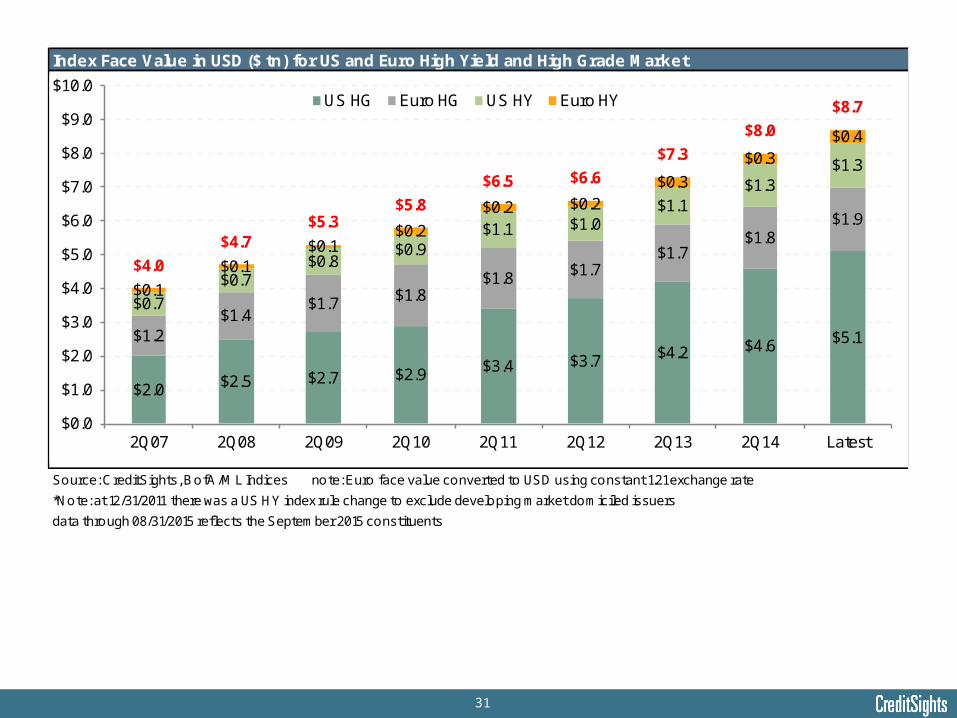
Index Face Value in USD ($ tn) for US and Euro High Yield and High Grade Market
Source: CreditSights, BofA/ML Indices note: Euro face value converted to USD using constant 1.21 exchange rate
*Note: at 12/31/2011 there was a US HY index rule change to exclude developing market domiciled issuers
data through 08/31/2015 reflects the September 2015 constituents
$2.0 $2.5 $2.7 $2.9 $3.4 $3.7 $4.2 $4.6 $5.1$1.2$1.4
$1.7 $1.8$1.8 $1.7
$1.7$1.8
$1.9
$0.7
$0.7$0.8
$0.9$1.1 $1.0
$1.1$1.3
$1.3
$0.1
$0.1$0.1
$0.2
$0.2 $0.2$0.3
$0.3$0.4
$4.0
$4.7$5.3
$5.8
$6.5 $6.6
$7.3
$8.0
$8.7
$0.0
$1.0
$2.0
$3.0
$4.0
$5.0
$6.0
$7.0
$8.0
$9.0
$10.0
2Q07 2Q08 2Q09 2Q10 2Q11 2Q12 2Q13 2Q14 Latest
US HG Euro HG US HY Euro HY
32
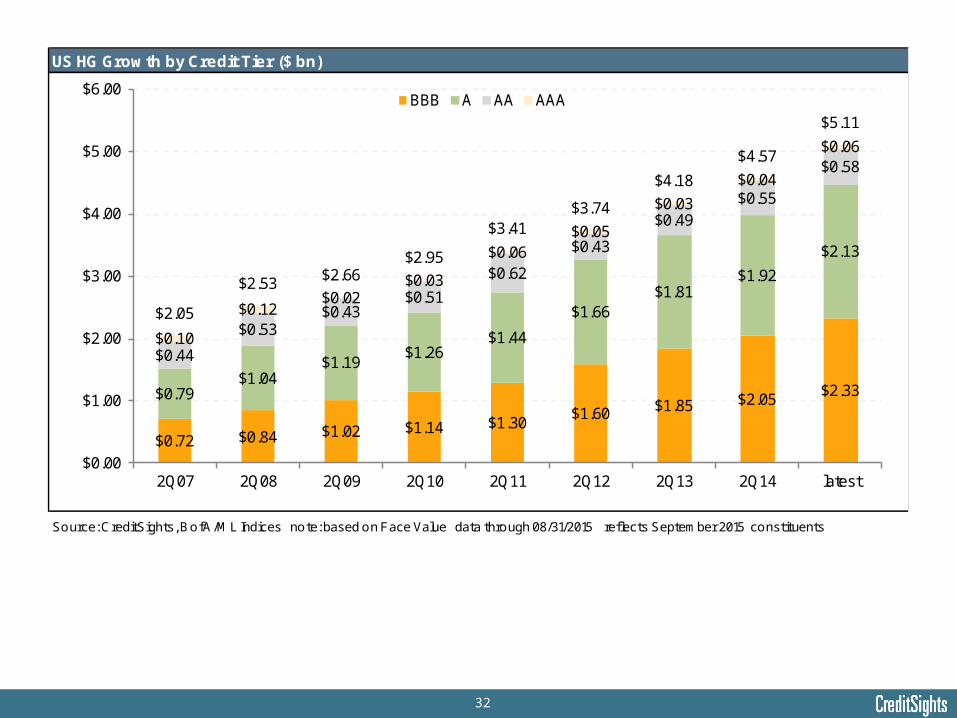
US HG Growth by Credit Tier ($ bn)
Source: CreditSights, BofA/ML Indices note: based on Face Value data through 08/31/2015 reflects September 2015 constituents
$0.72 $0.84 $1.02 $1.14 $1.30$1.60 $1.85 $2.05 $2.33$0.79
$1.04$1.19
$1.26$1.44
$1.66$1.81
$1.92
$2.13
$0.44
$0.53$0.43
$0.51
$0.62
$0.43
$0.49$0.55
$0.58
$0.10
$0.12$0.02
$0.03
$0.06$0.05
$0.03
$0.04
$0.06
$2.05
$2.53 $2.66$2.95
$3.41$3.74
$4.18
$4.57
$5.11
$0.00
$1.00
$2.00
$3.00
$4.00
$5.00
$6.00
2Q07 2Q08 2Q09 2Q10 2Q11 2Q12 2Q13 2Q14 latest
BBB A AA AAA
33
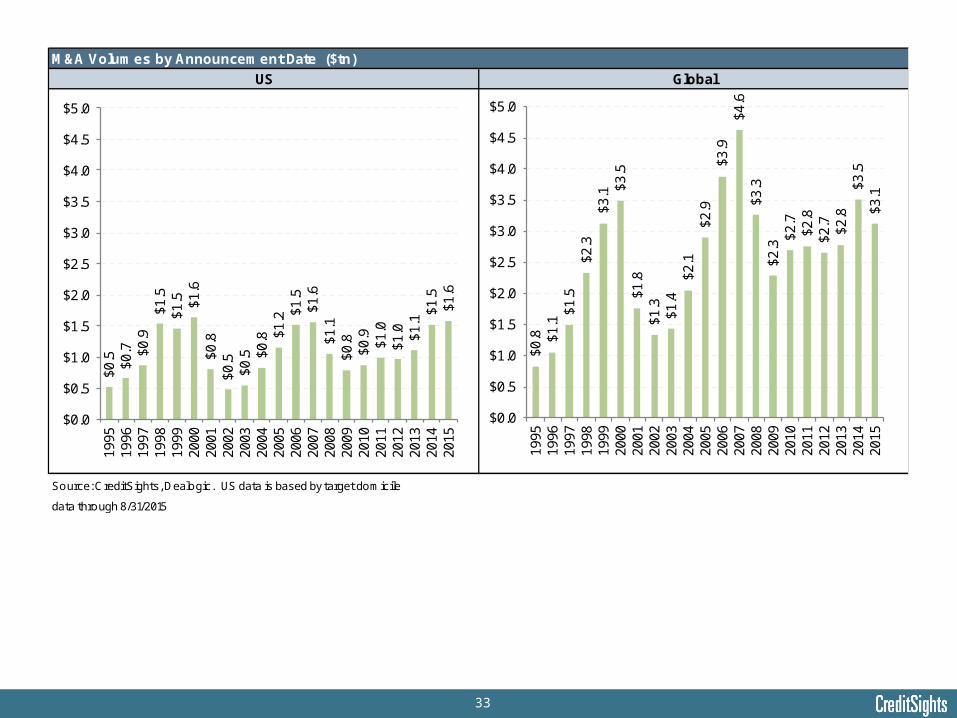
M&A Volumes by Announcement Date ($tn)
Source: CreditSights, Dealogic. US data is based by target domicile
data through 8/31/2015
US Global
$0.5 $0
.7 $0.9
$1.5
$1.5 $1
.6$0
.8$0
.5$0
.5 $0.8 $1
.2 $1.5
$1.6
$1.1
$0.8
$0.9
$1.0
$1.0 $1
.1$1
.5$1
.6
$0.0
$0.5
$1.0
$1.5
$2.0
$2.5
$3.0
$3.5
$4.0
$4.5
$5.019
9519
9619
9719
9819
9920
0020
0120
0220
0320
0420
0520
0620
0720
0820
0920
1020
1120
1220
1320
1420
15
$0.8 $1
.1$1
.5$2
.3$3
.1 $3.5
$1.8
$1.3
$1.4
$2.1
$2.9
$3.9
$4.6
$3.3
$2.3
$2.7
$2.8
$2.7 $2
.8$3
.5$3
.1
$0.0
$0.5
$1.0
$1.5
$2.0
$2.5
$3.0
$3.5
$4.0
$4.5
$5.0
1995
1996
1997
1998
1999
2000
2001
2002
2003
2004
2005
2006
2007
2008
2009
2010
2011
2012
2013
2014
2015
34
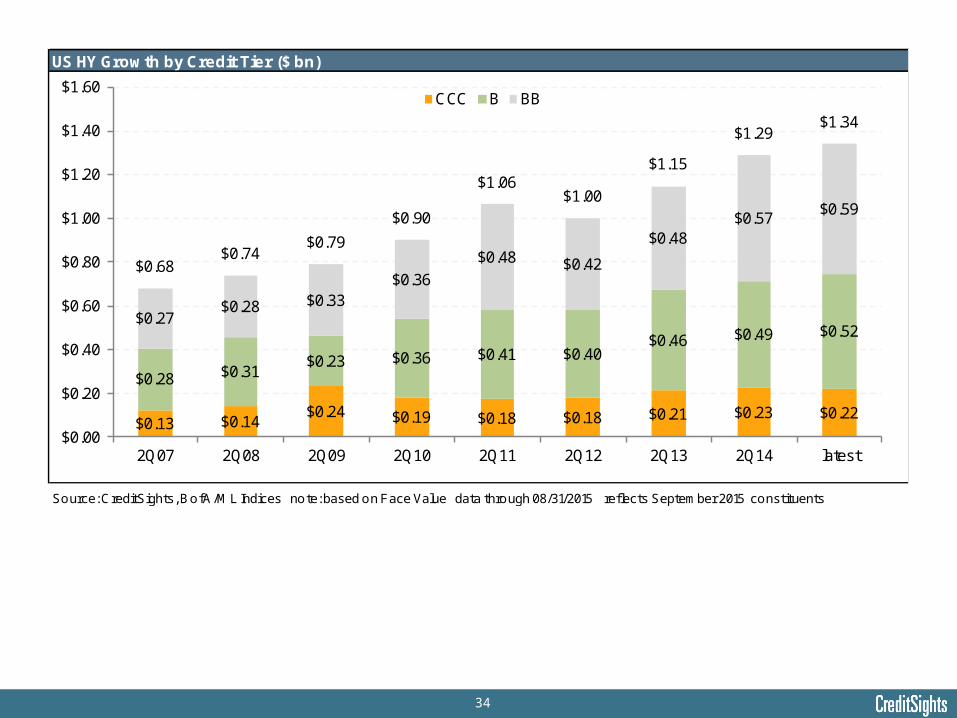
US HY Growth by Credit Tier ($ bn)
Source: CreditSights, BofA/ML Indices note: based on Face Value data through 08/31/2015 reflects September 2015 constituents
$0.13 $0.14$0.24 $0.19 $0.18 $0.18 $0.21 $0.23 $0.22
$0.28 $0.31$0.23 $0.36 $0.41 $0.40
$0.46 $0.49 $0.52$0.27
$0.28 $0.33$0.36
$0.48 $0.42
$0.48$0.57
$0.59
$0.68$0.74
$0.79
$0.90
$1.06$1.00
$1.15
$1.29$1.34
$0.00
$0.20
$0.40
$0.60
$0.80
$1.00
$1.20
$1.40
$1.60
2Q07 2Q08 2Q09 2Q10 2Q11 2Q12 2Q13 2Q14 latest
CCC B BB
35
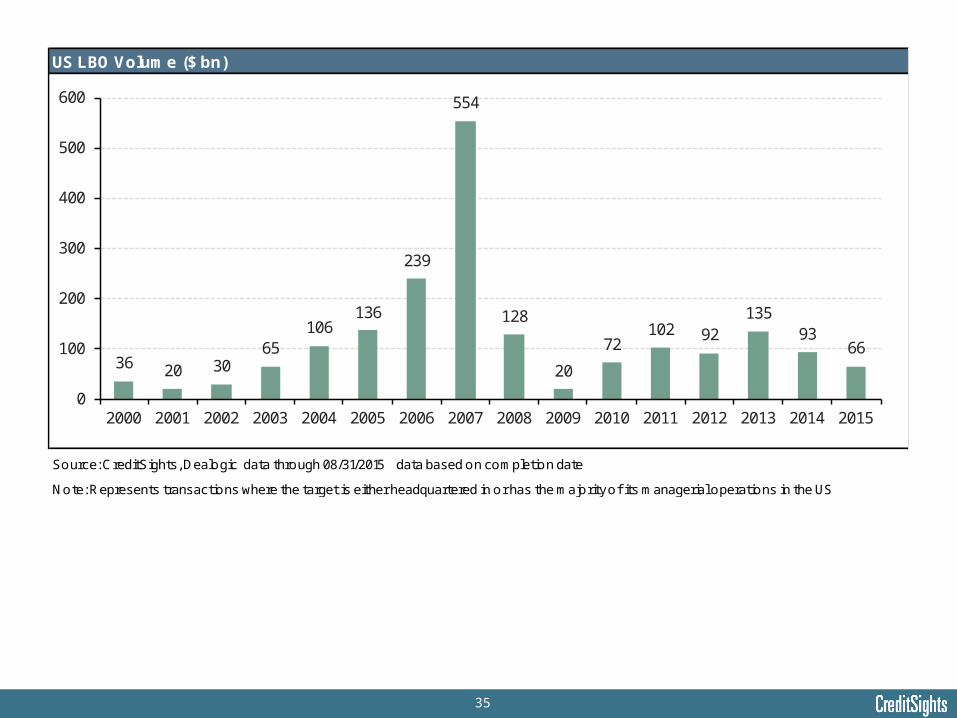
US LBO Volume ($ bn)
Source: CreditSights, Dealogic data through 08/31/2015 data based on completion date
Note: Represents transactions where the target is either headquartered in or has the majority of its managerial operations in the US
36 20 3065
106136
239
554
128
20
72102 92
13593
66
0
100
200
300
400
500
600
2000 2001 2002 2003 2004 2005 2006 2007 2008 2009 2010 2011 2012 2013 2014 2015
36
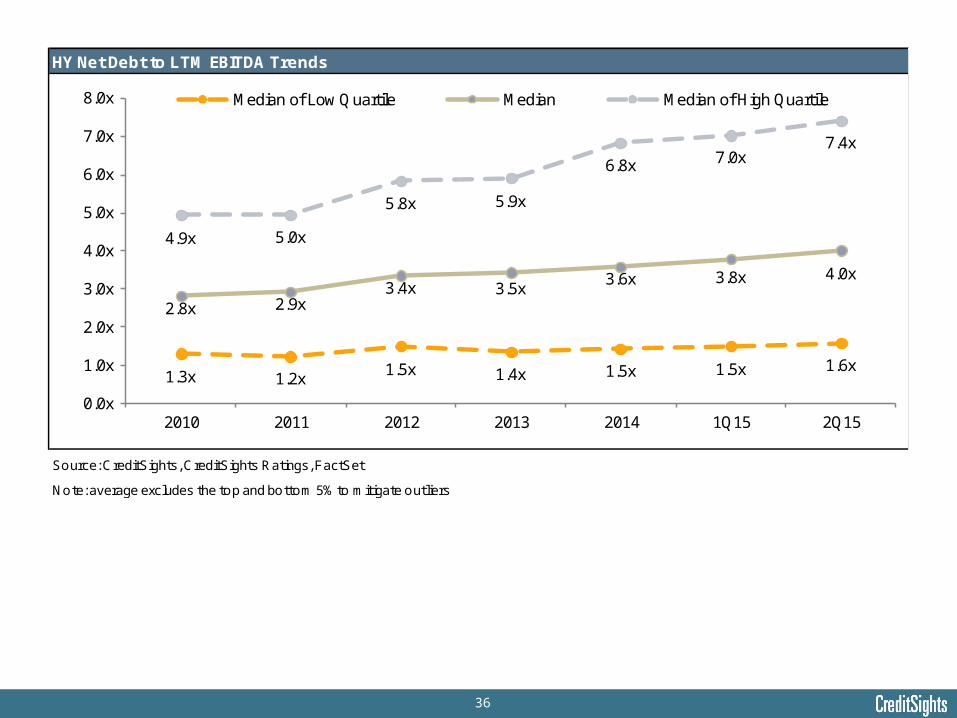
HY Net Debt to LTM EBITDA Trends
Source: CreditSights, CreditSights Ratings, FactSet
Note: average excludes the top and bottom 5% to mitigate outliers
1.3x 1.2x1.5x 1.4x 1.5x 1.5x 1.6x
2.8x 2.9x3.4x 3.5x
3.6x 3.8x 4.0x
4.9x 5.0x
5.8x 5.9x
6.8x 7.0x7.4x
0.0x
1.0x
2.0x
3.0x
4.0x
5.0x
6.0x
7.0x
8.0x
2010 2011 2012 2013 2014 1Q15 2Q15
Median of Low Quartile Median Median of High Quartile
37
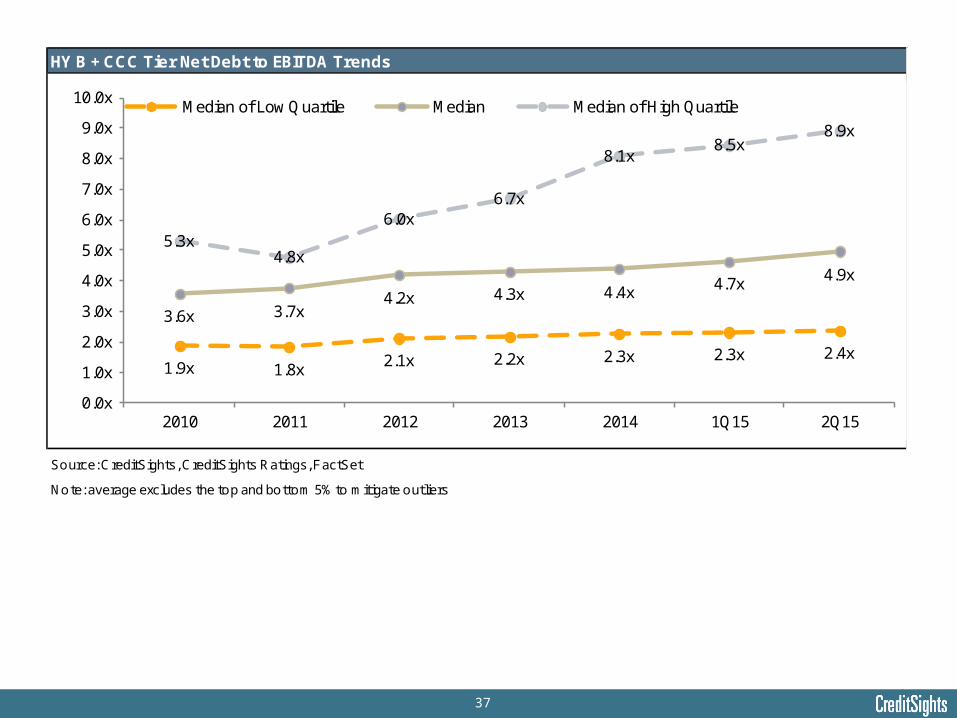
HY B + CCC Tier Net Debt to EBITDA Trends
Source: CreditSights, CreditSights Ratings, FactSet
Note: average excludes the top and bottom 5% to mitigate outliers
1.9x 1.8x2.1x 2.2x 2.3x 2.3x 2.4x
3.6x 3.7x4.2x 4.3x 4.4x 4.7x 4.9x
5.3x4.8x
6.0x6.7x
8.1x8.5x
8.9x
0.0x
1.0x
2.0x
3.0x
4.0x
5.0x
6.0x
7.0x
8.0x
9.0x
10.0x
2010 2011 2012 2013 2014 1Q15 2Q15
Median of Low Quartile Median Median of High Quartile
38
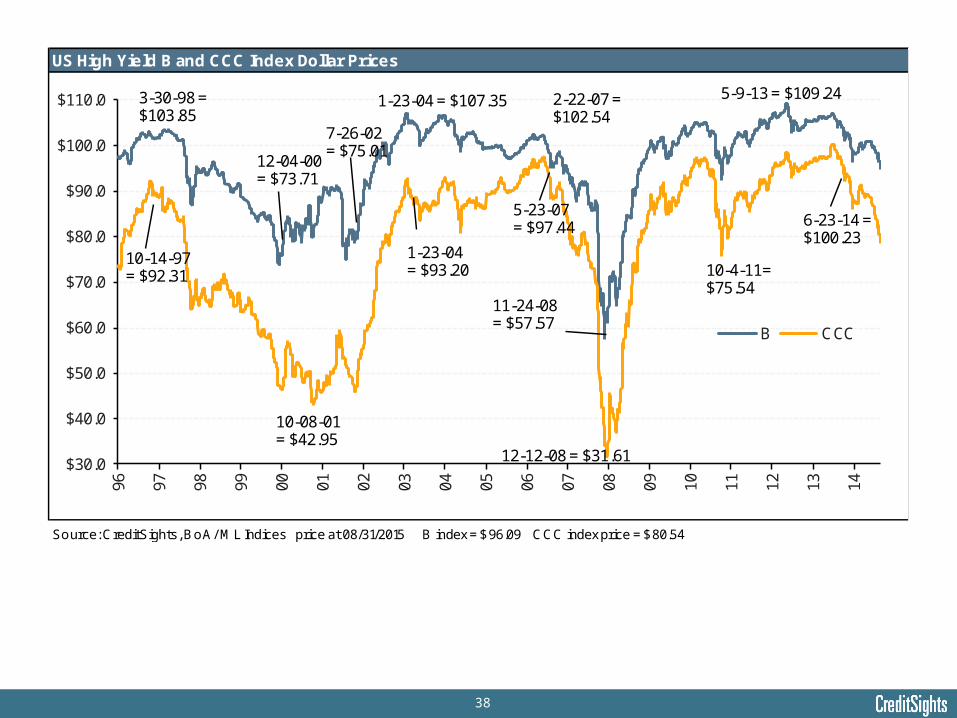
US High Yield B and CCC Index Dollar Prices
Source: CreditSights, BoA/ ML Indices price at 08/31/2015 B index = $96.09 CCC index price = $80.54
$30.0
$40.0
$50.0
$60.0
$70.0
$80.0
$90.0
$100.0
$110.096 97 98 99 00 01 02 03 04 05 06 07 08 09 10 11 12 13 14
B CCC
5-9-13 = $109.24
11-24-08 = $57.57
6-23-14 = $100.23
12-12-08 = $31.61
10-08-01= $42.95
12-04-00 = $73.71
1-23-04 = $107.35
5-23-07 = $97.44
1-23-04 = $93.20
7-26-02 = $75.01
3-30-98 = $103.85
10-14-97 = $92.31
2-22-07 = $102.54
10-4-11= $75.54
39
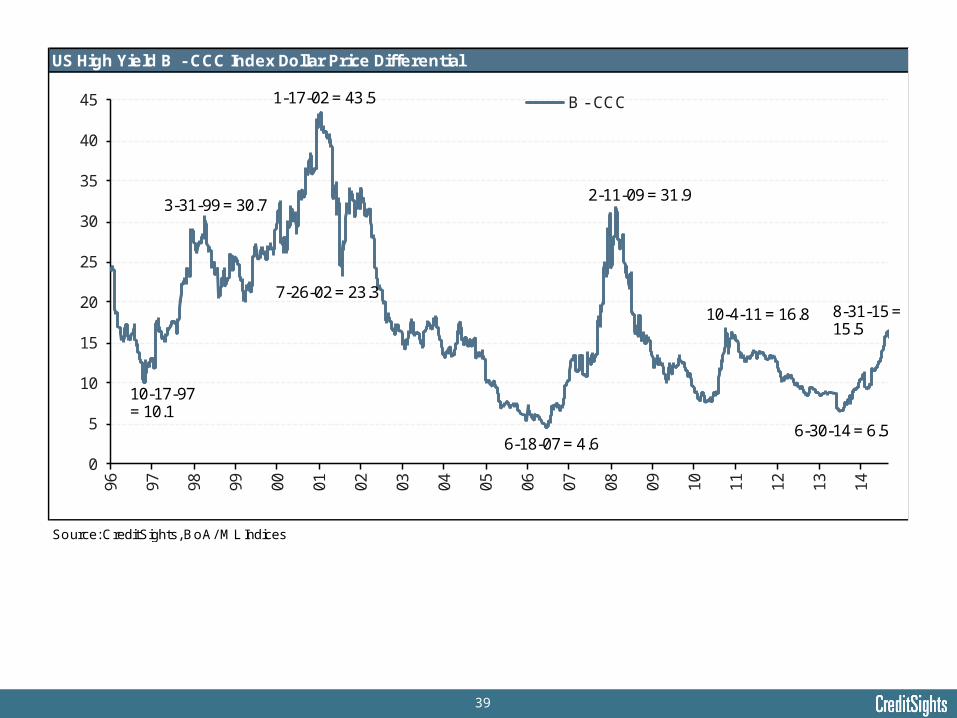
US High Yield B - CCC Index Dollar Price Differential
Source: CreditSights, BoA/ ML Indices
0
5
10
15
20
25
30
35
40
4596 97 98 99 00 01 02 03 04 05 06 07 08 09 10 11 12 13 14
B - CCC
10-17-97 = 10.1
3-31-99 = 30.7
1-17-02 = 43.5
2-11-09 = 31.9
6-18-07 = 4.6
8-31-15 = 15.5
7-26-02 = 23.310-4-11 = 16.8
6-30-14 = 6.5
40
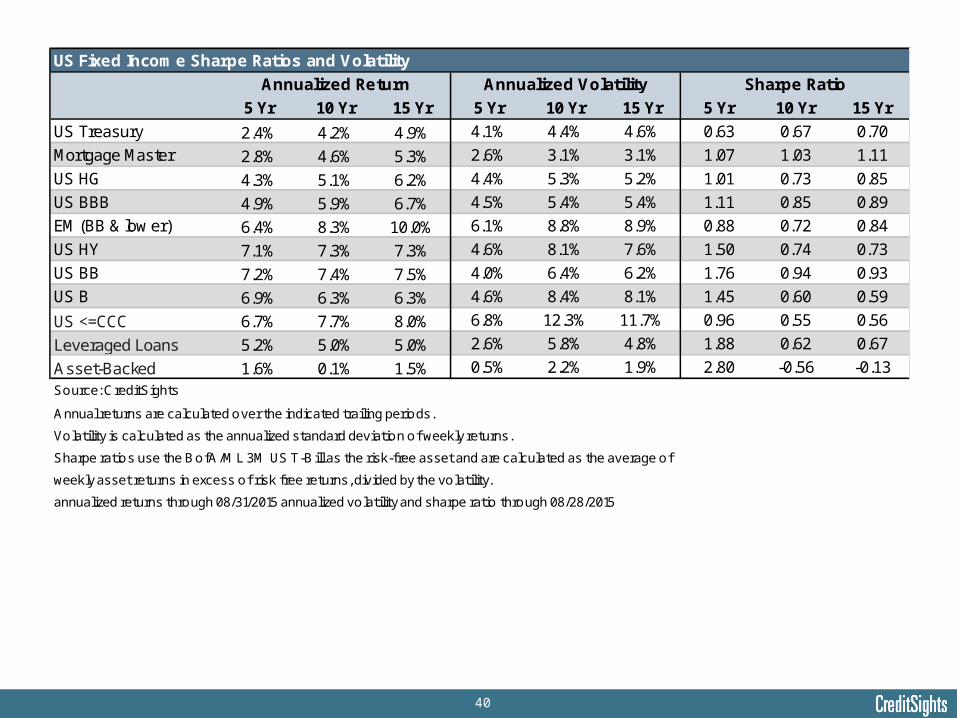
US Fixed Income Sharpe Ratios and Volatility
5 Yr 10 Yr 15 Yr 5 Yr 10 Yr 15 Yr 5 Yr 10 Yr 15 Yr
US Treasury 2.4% 4.2% 4.9% 4.1% 4.4% 4.6% 0.63 0.67 0.70
Mortgage Master 2.8% 4.6% 5.3% 2.6% 3.1% 3.1% 1.07 1.03 1.11
US HG 4.3% 5.1% 6.2% 4.4% 5.3% 5.2% 1.01 0.73 0.85
US BBB 4.9% 5.9% 6.7% 4.5% 5.4% 5.4% 1.11 0.85 0.89
EM (BB & low er) 6.4% 8.3% 10.0% 6.1% 8.8% 8.9% 0.88 0.72 0.84
US HY 7.1% 7.3% 7.3% 4.6% 8.1% 7.6% 1.50 0.74 0.73
US BB 7.2% 7.4% 7.5% 4.0% 6.4% 6.2% 1.76 0.94 0.93
US B 6.9% 6.3% 6.3% 4.6% 8.4% 8.1% 1.45 0.60 0.59
US <=CCC 6.7% 7.7% 8.0% 6.8% 12.3% 11.7% 0.96 0.55 0.56
Leveraged Loans 5.2% 5.0% 5.0% 2.6% 5.8% 4.8% 1.88 0.62 0.67
Asset-Backed 1.6% 0.1% 1.5% 0.5% 2.2% 1.9% 2.80 -0.56 -0.13
Source: CreditSights
Annual returns are calculated over the indicated trailing periods.
Volatility is calculated as the annualized standard deviation of weekly returns.
Sharpe ratios use the BofA/ML 3M US T-Bill as the risk-free asset and are calculated as the average of
weekly asset returns in excess of risk free returns, divided by the volatility.
annualized returns through 08/31/2015 annualized volatility and sharpe ratio through 08/28/2015
Annualized Return Annualized Volatility Sharpe Ratio
41
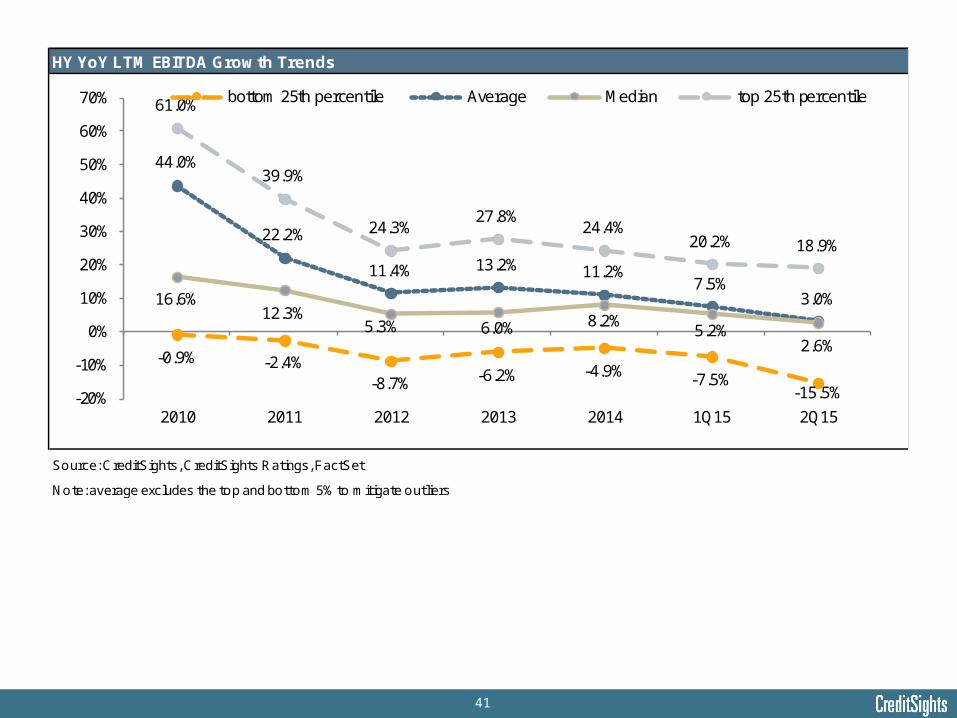
HY YoY LTM EBITDA Growth Trends
Source: CreditSights, CreditSights Ratings, FactSet
Note: average excludes the top and bottom 5% to mitigate outliers
-0.9% -2.4%-8.7% -6.2% -4.9% -7.5%
-15.5%
44.0%
22.2%
11.4% 13.2% 11.2%7.5%
3.0%16.6%12.3%
5.3% 6.0% 8.2%5.2%
2.6%
61.0%
39.9%
24.3%27.8%
24.4%20.2% 18.9%
-20%
-10%
0%
10%
20%
30%
40%
50%
60%
70%
2010 2011 2012 2013 2014 1Q15 2Q15
bottom 25th percentile Average Median top 25th percentile
42
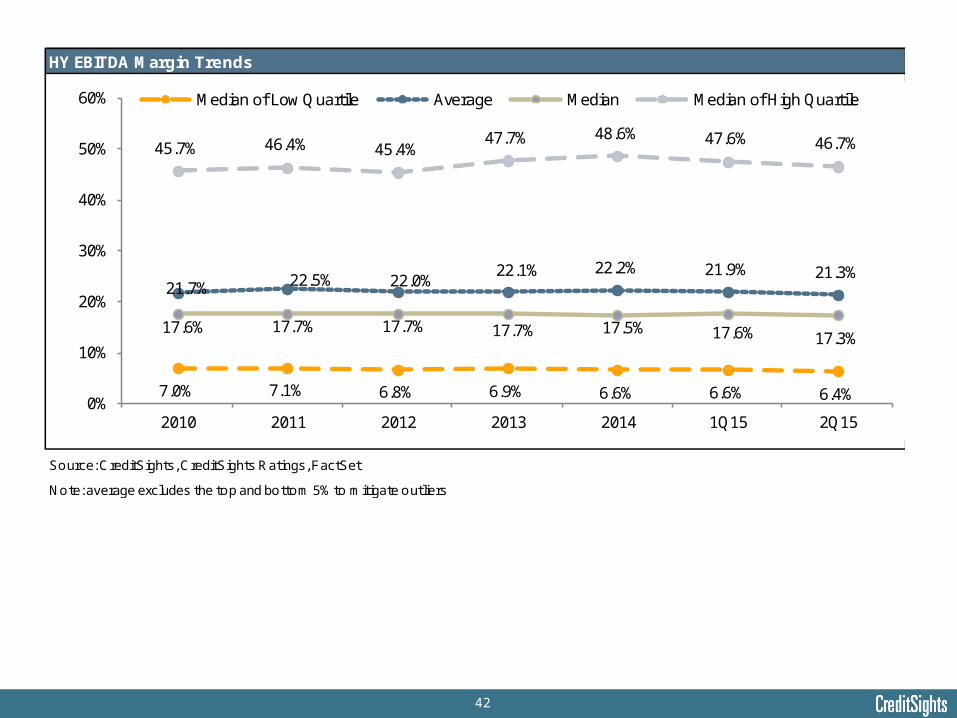
HY EBITDA Margin Trends
Source: CreditSights, CreditSights Ratings, FactSet
Note: average excludes the top and bottom 5% to mitigate outliers
7.0% 7.1% 6.8% 6.9% 6.6% 6.6% 6.4%
21.7% 22.5% 22.0% 22.1% 22.2% 21.9% 21.3%
17.6% 17.7% 17.7% 17.7% 17.5% 17.6% 17.3%
45.7% 46.4% 45.4% 47.7% 48.6% 47.6% 46.7%
0%
10%
20%
30%
40%
50%
60%
2010 2011 2012 2013 2014 1Q15 2Q15
Median of Low Quartile Average Median Median of High Quartile
43
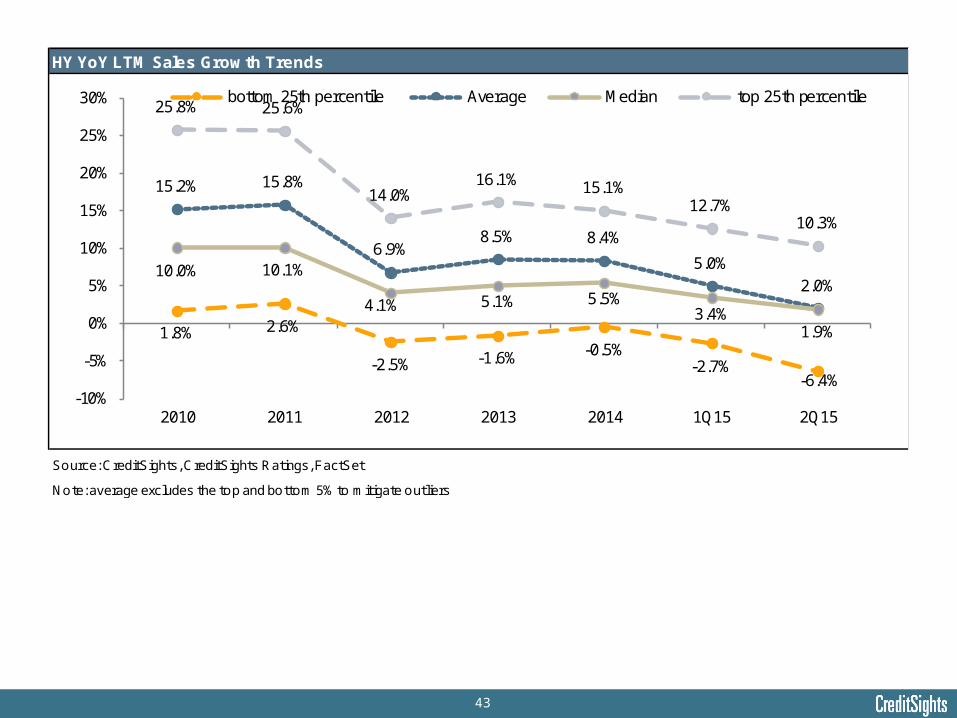
HY YoY LTM Sales Growth Trends
Source: CreditSights, CreditSights Ratings, FactSet
Note: average excludes the top and bottom 5% to mitigate outliers
1.8% 2.6%
-2.5% -1.6% -0.5%-2.7%
-6.4%
15.2% 15.8%
6.9%8.5% 8.4%
5.0%2.0%
10.0% 10.1%
4.1% 5.1% 5.5%3.4%
1.9%
25.8% 25.6%
14.0%16.1% 15.1%
12.7%10.3%
-10%
-5%
0%
5%
10%
15%
20%
25%
30%
2010 2011 2012 2013 2014 1Q15 2Q15
bottom 25th percentile Average Median top 25th percentile
44
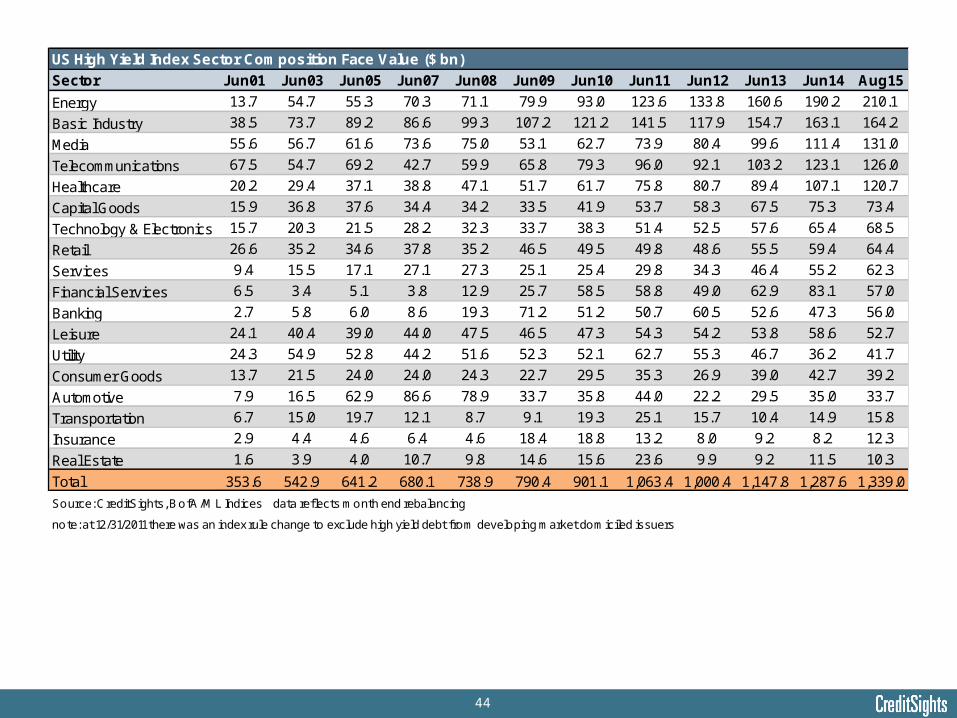
US High Yield Index Sector Composition Face Value ($ bn)
Sector Jun01 Jun03 Jun05 Jun07 Jun08 Jun09 Jun10 Jun11 Jun12 Jun13 Jun14 Aug15
Energy 13.7 54.7 55.3 70.3 71.1 79.9 93.0 123.6 133.8 160.6 190.2 210.1
Basic Industry 38.5 73.7 89.2 86.6 99.3 107.2 121.2 141.5 117.9 154.7 163.1 164.2
Media 55.6 56.7 61.6 73.6 75.0 53.1 62.7 73.9 80.4 99.6 111.4 131.0
Telecommunications 67.5 54.7 69.2 42.7 59.9 65.8 79.3 96.0 92.1 103.2 123.1 126.0
Healthcare 20.2 29.4 37.1 38.8 47.1 51.7 61.7 75.8 80.7 89.4 107.1 120.7
Capital Goods 15.9 36.8 37.6 34.4 34.2 33.5 41.9 53.7 58.3 67.5 75.3 73.4
Technology & Electronics 15.7 20.3 21.5 28.2 32.3 33.7 38.3 51.4 52.5 57.6 65.4 68.5
Retail 26.6 35.2 34.6 37.8 35.2 46.5 49.5 49.8 48.6 55.5 59.4 64.4
Services 9.4 15.5 17.1 27.1 27.3 25.1 25.4 29.8 34.3 46.4 55.2 62.3
Financial Services 6.5 3.4 5.1 3.8 12.9 25.7 58.5 58.8 49.0 62.9 83.1 57.0
Banking 2.7 5.8 6.0 8.6 19.3 71.2 51.2 50.7 60.5 52.6 47.3 56.0
Leisure 24.1 40.4 39.0 44.0 47.5 46.5 47.3 54.3 54.2 53.8 58.6 52.7
Utility 24.3 54.9 52.8 44.2 51.6 52.3 52.1 62.7 55.3 46.7 36.2 41.7
Consumer Goods 13.7 21.5 24.0 24.0 24.3 22.7 29.5 35.3 26.9 39.0 42.7 39.2
Automotive 7.9 16.5 62.9 86.6 78.9 33.7 35.8 44.0 22.2 29.5 35.0 33.7
Transportation 6.7 15.0 19.7 12.1 8.7 9.1 19.3 25.1 15.7 10.4 14.9 15.8
Insurance 2.9 4.4 4.6 6.4 4.6 18.4 18.8 13.2 8.0 9.2 8.2 12.3
Real Estate 1.6 3.9 4.0 10.7 9.8 14.6 15.6 23.6 9.9 9.2 11.5 10.3
Total 353.6 542.9 641.2 680.1 738.9 790.4 901.1 1,063.4 1,000.4 1,147.8 1,287.6 1,339.0
Source: CreditSights, BofA/ML Indices data reflects month end rebalancing
note: at 12/31/2011 there was an index rule change to exclude high yield debt from developing market domiciled issuers
45
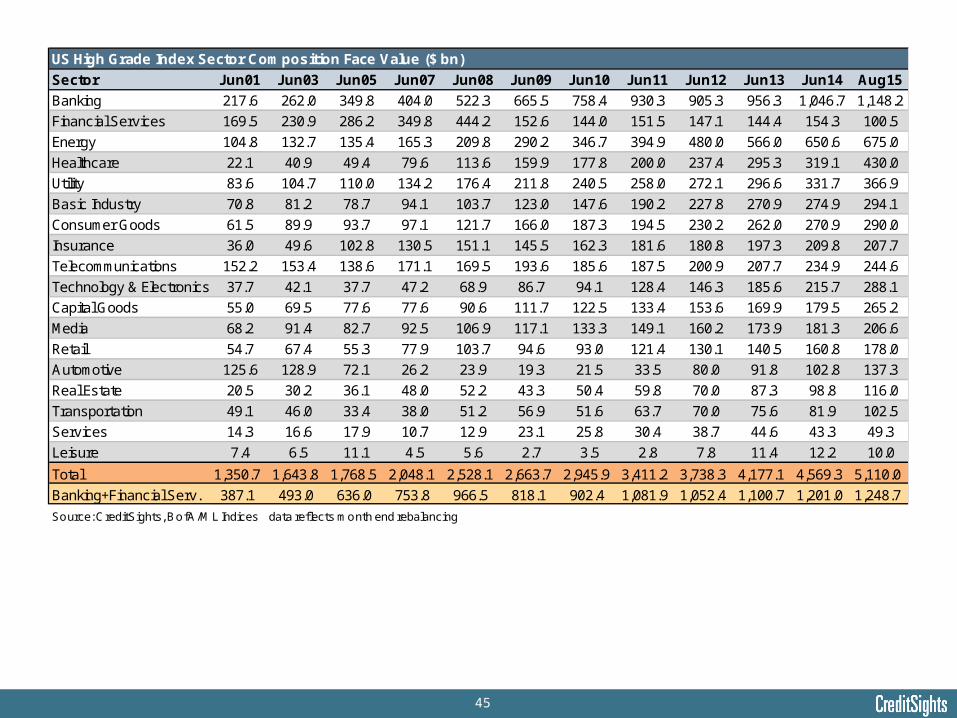
US High Grade Index Sector Composition Face Value ($ bn)
Sector Jun01 Jun03 Jun05 Jun07 Jun08 Jun09 Jun10 Jun11 Jun12 Jun13 Jun14 Aug15
Banking 217.6 262.0 349.8 404.0 522.3 665.5 758.4 930.3 905.3 956.3 1,046.7 1,148.2
Financial Services 169.5 230.9 286.2 349.8 444.2 152.6 144.0 151.5 147.1 144.4 154.3 100.5
Energy 104.8 132.7 135.4 165.3 209.8 290.2 346.7 394.9 480.0 566.0 650.6 675.0
Healthcare 22.1 40.9 49.4 79.6 113.6 159.9 177.8 200.0 237.4 295.3 319.1 430.0
Utility 83.6 104.7 110.0 134.2 176.4 211.8 240.5 258.0 272.1 296.6 331.7 366.9
Basic Industry 70.8 81.2 78.7 94.1 103.7 123.0 147.6 190.2 227.8 270.9 274.9 294.1
Consumer Goods 61.5 89.9 93.7 97.1 121.7 166.0 187.3 194.5 230.2 262.0 270.9 290.0
Insurance 36.0 49.6 102.8 130.5 151.1 145.5 162.3 181.6 180.8 197.3 209.8 207.7
Telecommunications 152.2 153.4 138.6 171.1 169.5 193.6 185.6 187.5 200.9 207.7 234.9 244.6
Technology & Electronics 37.7 42.1 37.7 47.2 68.9 86.7 94.1 128.4 146.3 185.6 215.7 288.1
Capital Goods 55.0 69.5 77.6 77.6 90.6 111.7 122.5 133.4 153.6 169.9 179.5 265.2
Media 68.2 91.4 82.7 92.5 106.9 117.1 133.3 149.1 160.2 173.9 181.3 206.6
Retail 54.7 67.4 55.3 77.9 103.7 94.6 93.0 121.4 130.1 140.5 160.8 178.0
Automotive 125.6 128.9 72.1 26.2 23.9 19.3 21.5 33.5 80.0 91.8 102.8 137.3
Real Estate 20.5 30.2 36.1 48.0 52.2 43.3 50.4 59.8 70.0 87.3 98.8 116.0
Transportation 49.1 46.0 33.4 38.0 51.2 56.9 51.6 63.7 70.0 75.6 81.9 102.5
Services 14.3 16.6 17.9 10.7 12.9 23.1 25.8 30.4 38.7 44.6 43.3 49.3
Leisure 7.4 6.5 11.1 4.5 5.6 2.7 3.5 2.8 7.8 11.4 12.2 10.0
Total 1,350.7 1,643.8 1,768.5 2,048.1 2,528.1 2,663.7 2,945.9 3,411.2 3,738.3 4,177.1 4,569.3 5,110.0
Banking+Financial Serv. 387.1 493.0 636.0 753.8 966.5 818.1 902.4 1,081.9 1,052.4 1,100.7 1,201.0 1,248.7
Source: CreditSights, BofA/ML Indices data reflects month end rebalancing
46
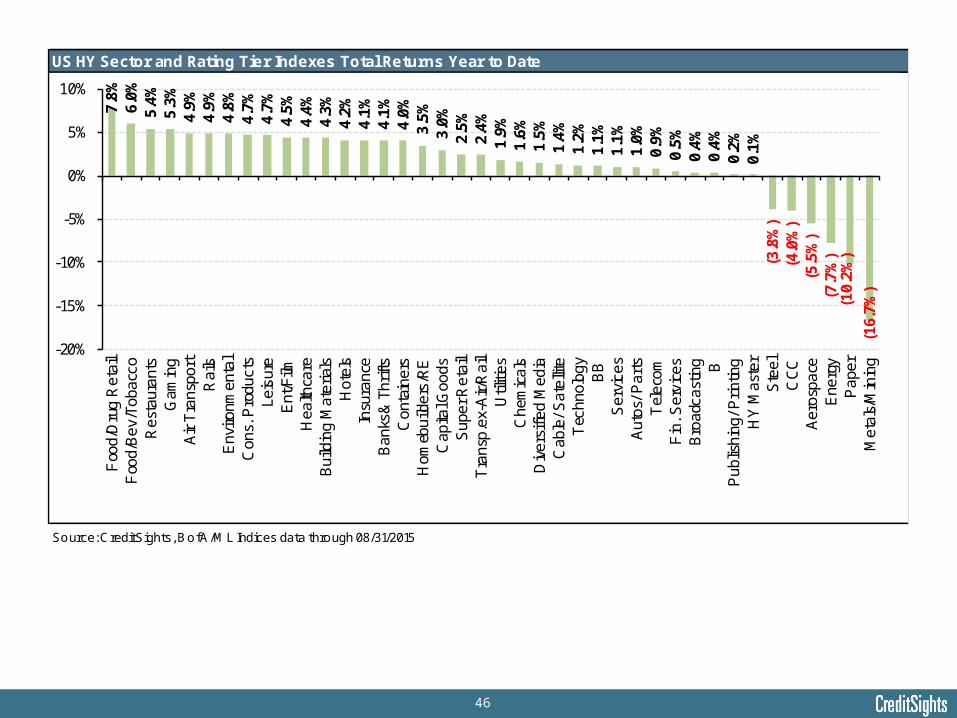
US HY Sector and Rating Tier Indexes Total Returns Year to Date
Source: CreditSights, BofA/ML Indices data through 08/31/2015
7.8%
6.0%
5.4%
5.3%
4.9%
4.9%
4.8%
4.7%
4.7%
4.5%
4.4%
4.3%
4.2%
4.1%
4.1%
4.0%
3.5%
3.0%
2.5%
2.4%
1.9%
1.6%
1.5%
1.4%
1.2%
1.1%
1.1%
1.0%
0.9%
0.5%
0.4%
0.4%
0.2%
0.1%
(3.8
%)
(4.0
%)
(5.5
%)
(7.7
%)
(10.
2%)
(16.
7%)
-20%
-15%
-10%
-5%
0%
5%
10%
Foo
d/D
rug
Ret
ail
Foo
d/B
ev/T
obac
coR
esta
uran
tsG
amin
gA
ir T
rans
port
Rai
lsE
nviro
nmen
tal
Con
s. P
rodu
cts
Leis
ure
Ent
/Film
Hea
lthca
reB
uild
ing
Mat
eria
lsH
otel
sIn
sura
nce
Ban
ks&
Thr
ifts
Con
tain
ers
Hom
ebui
lder
s/R
EC
apita
l Goo
dsS
uper
Ret
ail
Tra
nsp.
ex-A
ir/R
ail
Util
ities
Che
mic
als
Div
ersi
fied
Med
iaC
able
/ Sat
ellit
eT
echn
olog
yB
BS
ervi
ces
Aut
os/ P
arts
Tel
ecom
Fin
. Ser
vice
sB
road
cast
ing B
Pub
lishi
ng/ P
rintin
gH
Y M
aste
rS
teel
CC
CA
eros
pace
Ene
rgy
Pap
erM
etal
s/M
inin
g

47
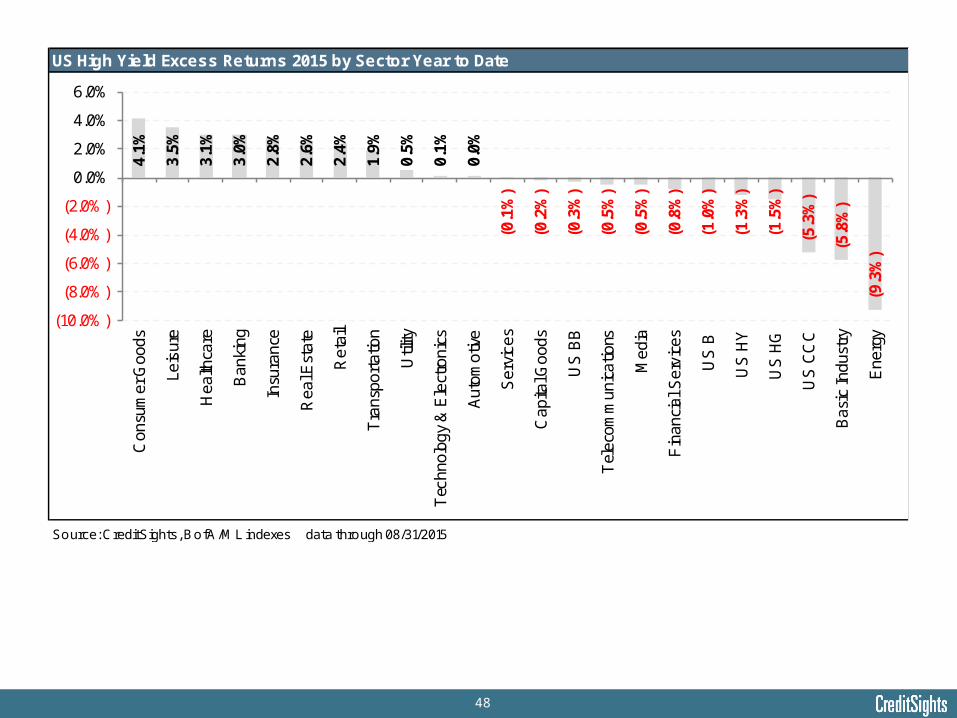
US High Yield Excess Returns 2015 by Sector Year to Date
Source: CreditSights, BofA/ML indexes data through 08/31/2015
4.1%
3.5%
3.1%
3.0%
2.8%
2.6%
2.4%
1.9%
0.5%
0.1%
0.0%
(0.1
%)
(0.2
%)
(0.3
%)
(0.5
%)
(0.5
%)
(0.8
%)
(1.0
%)
(1.3
%)
(1.5
%)
(5.3
%)
(5.8
%)
(9.3
%)
(10.0%)
(8.0%)
(6.0%)
(4.0%)
(2.0%)
0.0%
2.0%
4.0%
6.0%
Con
sum
er G
oods
Leis
ure
Hea
lthca
re
Ban
king
Insu
ranc
e
Rea
l Est
ate
Ret
ail
Tra
nspo
rtat
ion
Util
ity
Tec
hnol
ogy
& E
lect
roni
cs
Aut
omot
ive
Ser
vice
s
Cap
ital G
oods
US
BB
Tel
ecom
mun
icat
ions
Med
ia
Fin
anci
al S
ervi
ces
US
B
US
HY
US
HG
US
CC
C
Bas
ic In
dust
ry
Ene
rgy
48
US High Yield Excess Returns 2015 by Sector Year to Date
Source: CreditSights, BofA/ML indexes data through 08/31/2015
4.1%
3.5%
3.1%
3.0%
2.8%
2.6%
2.4%
1.9%
0.5%
0.1%
0.0%
(0.1
%)
(0.2
%)
(0.3
%)
(0.5
%)
(0.5
%)
(0.8
%)
(1.0
%)
(1.3
%)
(1.5
%)
(5.3
%)
(5.8
%)
(9.3
%)
(10.0%)
(8.0%)
(6.0%)
(4.0%)
(2.0%)
0.0%
2.0%
4.0%
6.0%
Con
sum
er G
oods
Leis
ure
Hea
lthca
re
Ban
king
Insu
ranc
e
Rea
l Est
ate
Ret
ail
Tra
nspo
rtat
ion
Util
ity
Tec
hnol
ogy
& E
lect
roni
cs
Aut
omot
ive
Ser
vice
s
Cap
ital G
oods
US
BB
Tel
ecom
mun
icat
ions
Med
ia
Fin
anci
al S
ervi
ces
US
B
US
HY
US
HG
US
CC
C
Bas
ic In
dust
ry
Ene
rgy
49
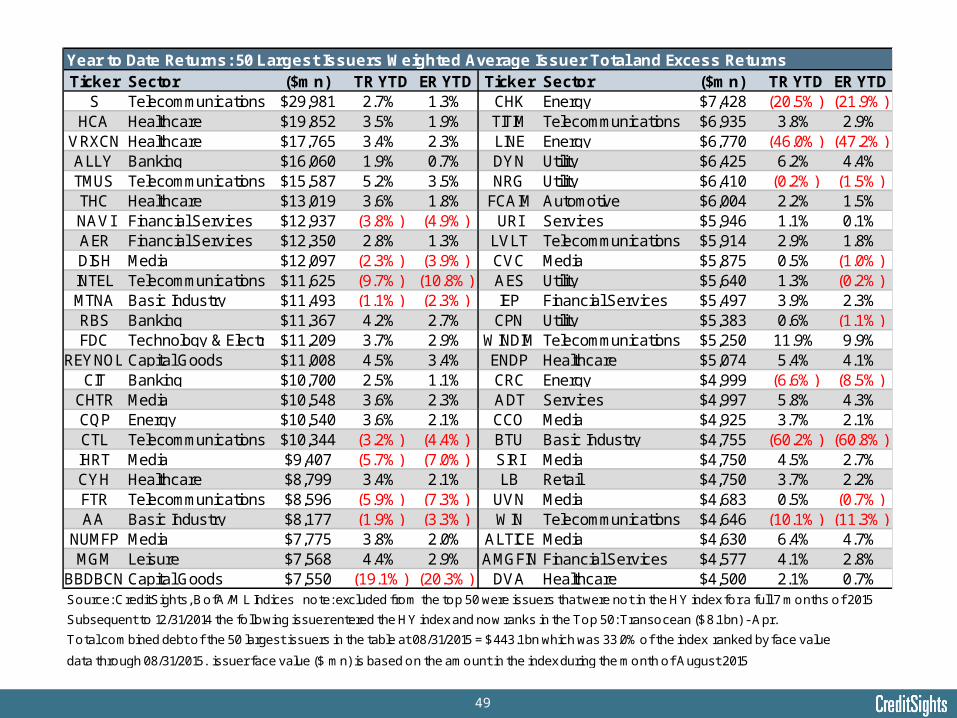
Year to Date Returns: 50 Largest Issuers Weighted Average Issuer Total and Excess Returns Ticker Sector ($mn) TR YTD ER YTD Ticker Sector ($mn) TR YTD ER YTD
S Telecommunications $29,981 2.7% 1.3% CHK Energy $7,428 (20.5%) (21.9%)HCA Healthcare $19,852 3.5% 1.9% TITIM Telecommunications $6,935 3.8% 2.9%
VRXCN Healthcare $17,765 3.4% 2.3% LINE Energy $6,770 (46.0%) (47.2%)ALLY Banking $16,060 1.9% 0.7% DYN Utility $6,425 6.2% 4.4%TMUS Telecommunications $15,587 5.2% 3.5% NRG Utility $6,410 (0.2%) (1.5%)THC Healthcare $13,019 3.6% 1.8% FCAIM Automotive $6,004 2.2% 1.5%NAVI Financial Services $12,937 (3.8%) (4.9%) URI Services $5,946 1.1% 0.1%AER Financial Services $12,350 2.8% 1.3% LVLT Telecommunications $5,914 2.9% 1.8%DISH Media $12,097 (2.3%) (3.9%) CVC Media $5,875 0.5% (1.0%)INTEL Telecommunications $11,625 (9.7%) (10.8%) AES Utility $5,640 1.3% (0.2%)MTNA Basic Industry $11,493 (1.1%) (2.3%) IEP Financial Services $5,497 3.9% 2.3%RBS Banking $11,367 4.2% 2.7% CPN Utility $5,383 0.6% (1.1%)FDC Technology & Electronics$11,209 3.7% 2.9% WINDIM Telecommunications $5,250 11.9% 9.9%
REYNOL Capital Goods $11,008 4.5% 3.4% ENDP Healthcare $5,074 5.4% 4.1%CIT Banking $10,700 2.5% 1.1% CRC Energy $4,999 (6.6%) (8.5%)
CHTR Media $10,548 3.6% 2.3% ADT Services $4,997 5.8% 4.3%CQP Energy $10,540 3.6% 2.1% CCO Media $4,925 3.7% 2.1%CTL Telecommunications $10,344 (3.2%) (4.4%) BTU Basic Industry $4,755 (60.2%) (60.8%)IHRT Media $9,407 (5.7%) (7.0%) SIRI Media $4,750 4.5% 2.7%CYH Healthcare $8,799 3.4% 2.1% LB Retail $4,750 3.7% 2.2%FTR Telecommunications $8,596 (5.9%) (7.3%) UVN Media $4,683 0.5% (0.7%)AA Basic Industry $8,177 (1.9%) (3.3%) WIN Telecommunications $4,646 (10.1%) (11.3%)
NUMFP Media $7,775 3.8% 2.0% ALTICE Media $4,630 6.4% 4.7%MGM Leisure $7,568 4.4% 2.9% AMGFIN Financial Services $4,577 4.1% 2.8%
BBDBCN Capital Goods $7,550 (19.1%) (20.3%) DVA Healthcare $4,500 2.1% 0.7%Source: CreditSights, BofA/ML Indices note: excluded from the top 50 were issuers that were not in the HY index for a full 7 months of 2015
Subsequent to 12/31/2014 the following issuer entered the HY index and now ranks in the Top 50: Transocean ($8.1 bn) - Apr.
Total combined debt of the 50 largest issuers in the table at 08/31/2015 = $443.1 bn which was 33.0% of the index ranked by face value
data through 08/31/2015. issuer face value ($ mn) is based on the amount in the index during the month of August 2015
50
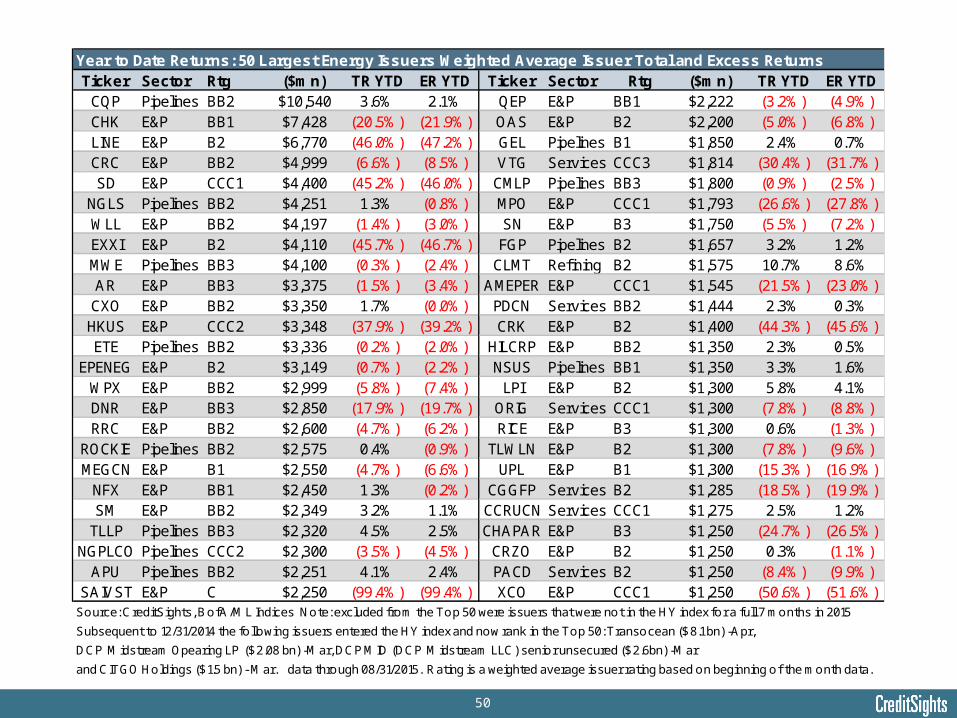
Year to Date Returns: 50 Largest Energy Issuers Weighted Average Issuer Total and Excess Returns Ticker Sector Rtg ($mn) TR YTD ER YTD Ticker Sector Rtg ($mn) TR YTD ER YTD
CQP Pipelines BB2 $10,540 3.6% 2.1% QEP E&P BB1 $2,222 (3.2%) (4.9%)CHK E&P BB1 $7,428 (20.5%) (21.9%) OAS E&P B2 $2,200 (5.0%) (6.8%)LINE E&P B2 $6,770 (46.0%) (47.2%) GEL Pipelines B1 $1,850 2.4% 0.7%CRC E&P BB2 $4,999 (6.6%) (8.5%) VTG Services CCC3 $1,814 (30.4%) (31.7%)SD E&P CCC1 $4,400 (45.2%) (46.0%) CMLP Pipelines BB3 $1,800 (0.9%) (2.5%)
NGLS Pipelines BB2 $4,251 1.3% (0.8%) MPO E&P CCC1 $1,793 (26.6%) (27.8%)WLL E&P BB2 $4,197 (1.4%) (3.0%) SN E&P B3 $1,750 (5.5%) (7.2%)EXXI E&P B2 $4,110 (45.7%) (46.7%) FGP Pipelines B2 $1,657 3.2% 1.2%MWE Pipelines BB3 $4,100 (0.3%) (2.4%) CLMT Refining B2 $1,575 10.7% 8.6%AR E&P BB3 $3,375 (1.5%) (3.4%) AMEPER E&P CCC1 $1,545 (21.5%) (23.0%)CXO E&P BB2 $3,350 1.7% (0.0%) PDCN Services BB2 $1,444 2.3% 0.3%HKUS E&P CCC2 $3,348 (37.9%) (39.2%) CRK E&P B2 $1,400 (44.3%) (45.6%)ETE Pipelines BB2 $3,336 (0.2%) (2.0%) HILCRP E&P BB2 $1,350 2.3% 0.5%
EPENEG E&P B2 $3,149 (0.7%) (2.2%) NSUS Pipelines BB1 $1,350 3.3% 1.6%WPX E&P BB2 $2,999 (5.8%) (7.4%) LPI E&P B2 $1,300 5.8% 4.1%DNR E&P BB3 $2,850 (17.9%) (19.7%) ORIG Services CCC1 $1,300 (7.8%) (8.8%)RRC E&P BB2 $2,600 (4.7%) (6.2%) RICE E&P B3 $1,300 0.6% (1.3%)
ROCKIE Pipelines BB2 $2,575 0.4% (0.9%) TLWLN E&P B2 $1,300 (7.8%) (9.6%)MEGCN E&P B1 $2,550 (4.7%) (6.6%) UPL E&P B1 $1,300 (15.3%) (16.9%)
NFX E&P BB1 $2,450 1.3% (0.2%) CGGFP Services B2 $1,285 (18.5%) (19.9%)SM E&P BB2 $2,349 3.2% 1.1% CCRUCN Services CCC1 $1,275 2.5% 1.2%
TLLP Pipelines BB3 $2,320 4.5% 2.5% CHAPAR E&P B3 $1,250 (24.7%) (26.5%)NGPLCO Pipelines CCC2 $2,300 (3.5%) (4.5%) CRZO E&P B2 $1,250 0.3% (1.1%)
APU Pipelines BB2 $2,251 4.1% 2.4% PACD Services B2 $1,250 (8.4%) (9.9%)SAIVST E&P C $2,250 (99.4%) (99.4%) XCO E&P CCC1 $1,250 (50.6%) (51.6%)
Source: CreditSights, BofA/ML Indices Note: excluded from the Top 50 were issuers that were not in the HY index for a full 7 months in 2015
Subsequent to 12/31/2014 the following issuers entered the HY index and now rank in the Top 50: Transocean ($8.1 bn) -Apr,
DCP M idstream Opearing LP ($2.08 bn) -Mar, DCP MID (DCP M idstream LLC) senior unsecured ($2.6bn) -Mar
and CITGO Holdings ($1.5 bn) - Mar. data through 08/31/2015. Rating is a weighted average issuer rating based on beginning of the month data.
51
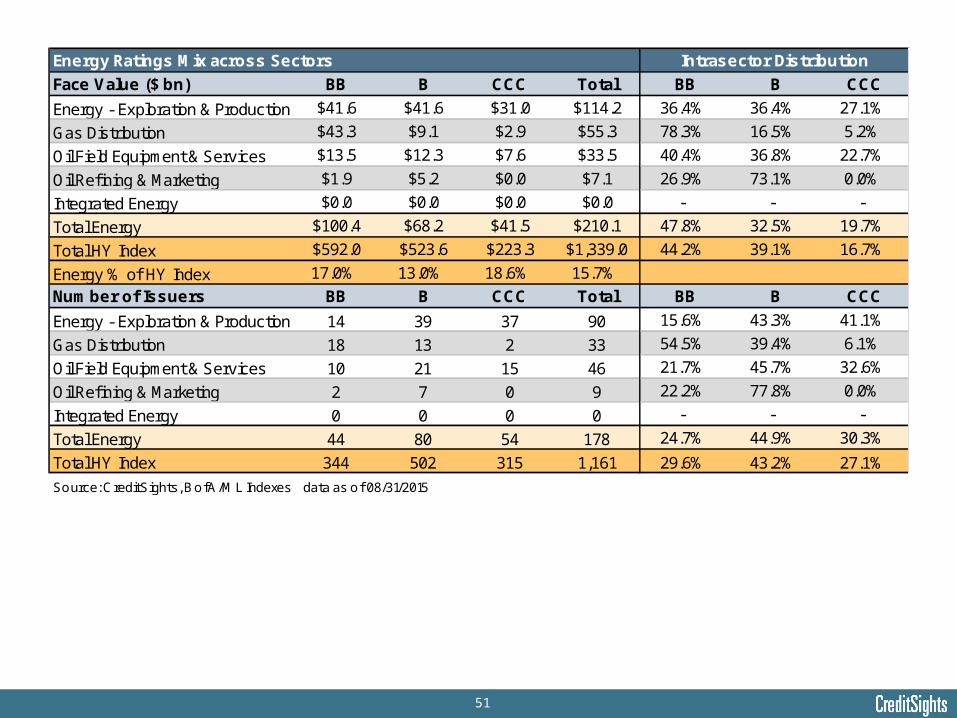
Energy Ratings Mix across Sectors
Face Value ($ bn) BB B CCC Total BB B CCC
Energy - Exploration & Production $41.6 $41.6 $31.0 $114.2 36.4% 36.4% 27.1%
Gas Distribution $43.3 $9.1 $2.9 $55.3 78.3% 16.5% 5.2%
Oil Field Equipment & Services $13.5 $12.3 $7.6 $33.5 40.4% 36.8% 22.7%
Oil Refining & Marketing $1.9 $5.2 $0.0 $7.1 26.9% 73.1% 0.0%
Integrated Energy $0.0 $0.0 $0.0 $0.0 - - -
Total Energy $100.4 $68.2 $41.5 $210.1 47.8% 32.5% 19.7%
Total HY Index $592.0 $523.6 $223.3 $1,339.0 44.2% 39.1% 16.7%
Energy % of HY Index 17.0% 13.0% 18.6% 15.7%
Number of Issuers BB B CCC Total BB B CCC
Energy - Exploration & Production 14 39 37 90 15.6% 43.3% 41.1%
Gas Distribution 18 13 2 33 54.5% 39.4% 6.1%
Oil Field Equipment & Services 10 21 15 46 21.7% 45.7% 32.6%
Oil Refining & Marketing 2 7 0 9 22.2% 77.8% 0.0%
Integrated Energy 0 0 0 0 - - -
Total Energy 44 80 54 178 24.7% 44.9% 30.3%
Total HY Index 344 502 315 1,161 29.6% 43.2% 27.1%
Source: CreditSights, BofA/ML Indexes data as of 08/31/2015
Intrasector Distribution
52
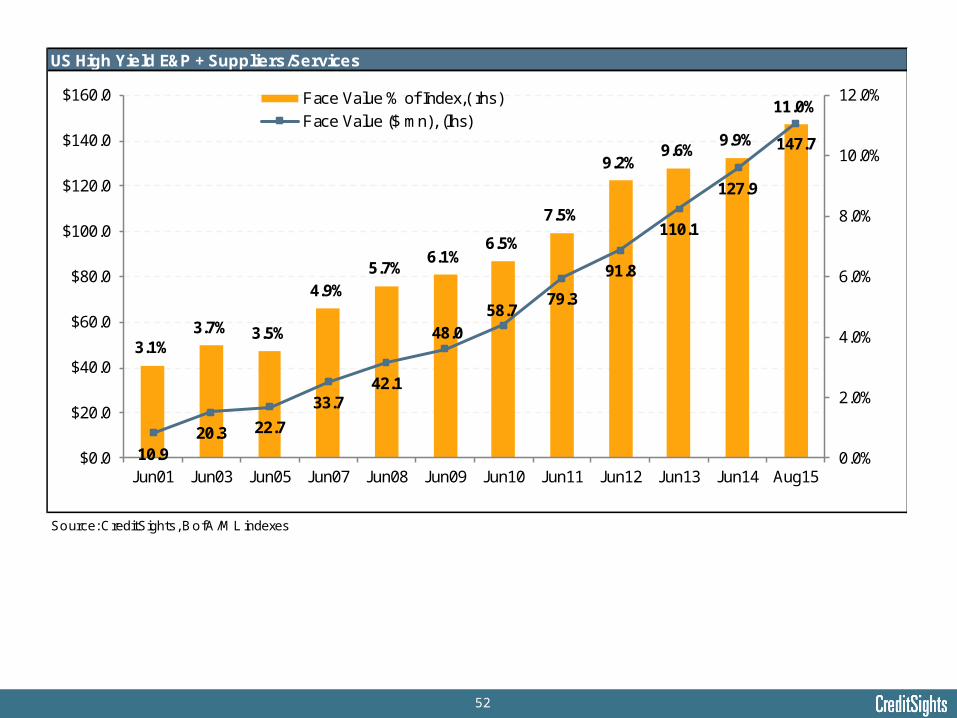
US High Yield E&P + Suppliers/Services
Source: CreditSights, BofA/ML indexes
3.1% 3.7% 3.5%
4.9% 5.7%
6.1% 6.5%
7.5%
9.2% 9.6%
9.9%
11.0%
10.920.3 22.7
33.742.1
48.058.7
79.3
91.8
110.1
127.9
147.7
0.0%
2.0%
4.0%
6.0%
8.0%
10.0%
12.0%
$0.0
$20.0
$40.0
$60.0
$80.0
$100.0
$120.0
$140.0
$160.0
Jun01 Jun03 Jun05 Jun07 Jun08 Jun09 Jun10 Jun11 Jun12 Jun13 Jun14 Aug15
Face Value % of Index,( rhs)
Face Value ($ mn), (lhs)
53
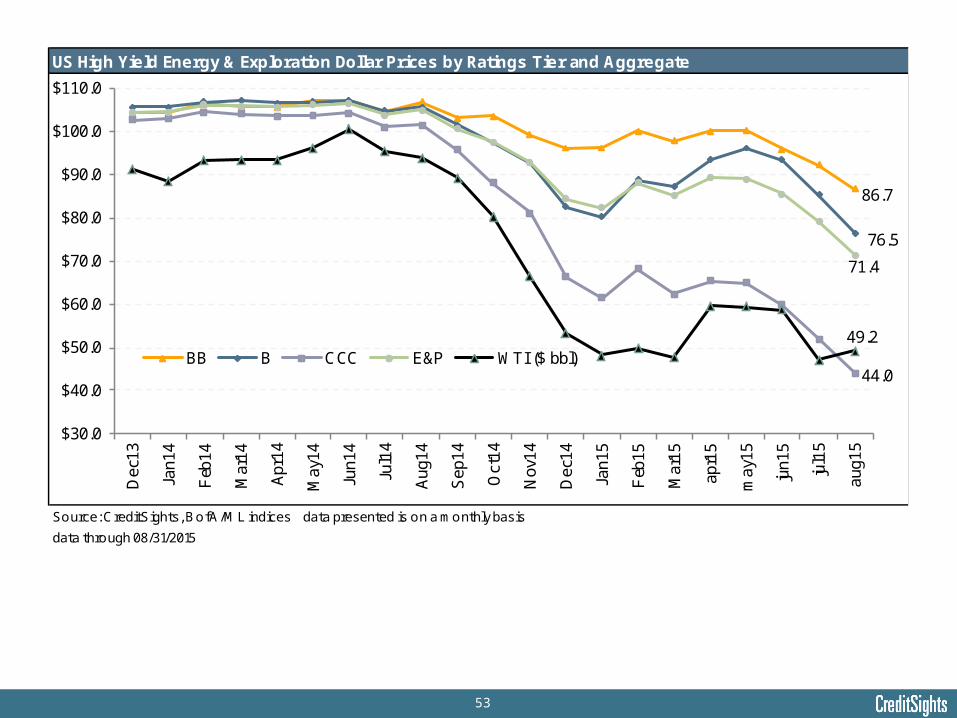
US High Yield Energy & Exploration Dollar Prices by Ratings Tier and Aggregate
Source: CreditSights, BofA/ML indices data presented is on a monthly basis
data through 08/31/2015
$30.0
$40.0
$50.0
$60.0
$70.0
$80.0
$90.0
$100.0
$110.0
Dec
13
Jan1
4
Feb
14
Mar
14
Apr
14
May
14
Jun1
4
Jul1
4
Aug
14
Sep
14
Oct
14
Nov
14
Dec
14
Jan1
5
Feb
15
Mar
15
apr1
5
may
15
jun1
5
jul1
5
aug1
5
BB B CCC E&P WTI ($ bbl)
86.7
76.5
44.0
49.2
71.4
54
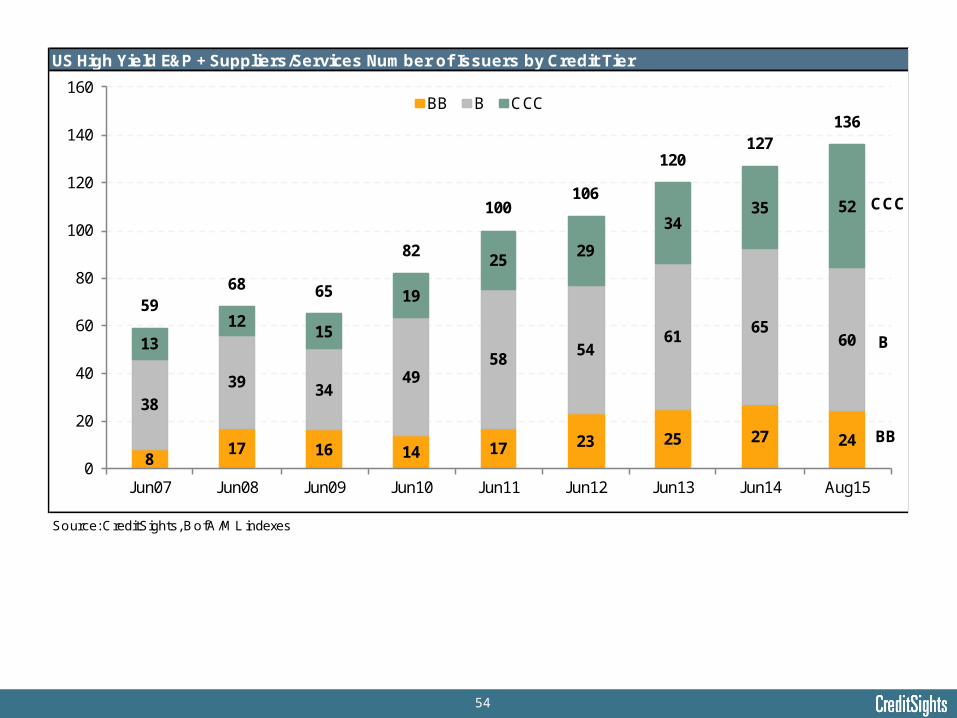
US High Yield E&P + Suppliers/Services Number of Issuers by Credit Tier
Source: CreditSights, BofA/ML indexes
817 16 14 17 23 25 27 24
38
39 3449
5854
6165
601312
15
19
2529
3435 52
5968 65
82
100106
120127
136
0
20
40
60
80
100
120
140
160
Jun07 Jun08 Jun09 Jun10 Jun11 Jun12 Jun13 Jun14 Aug15
BB B CCC
BB
B
CCC

55
Appendix
56
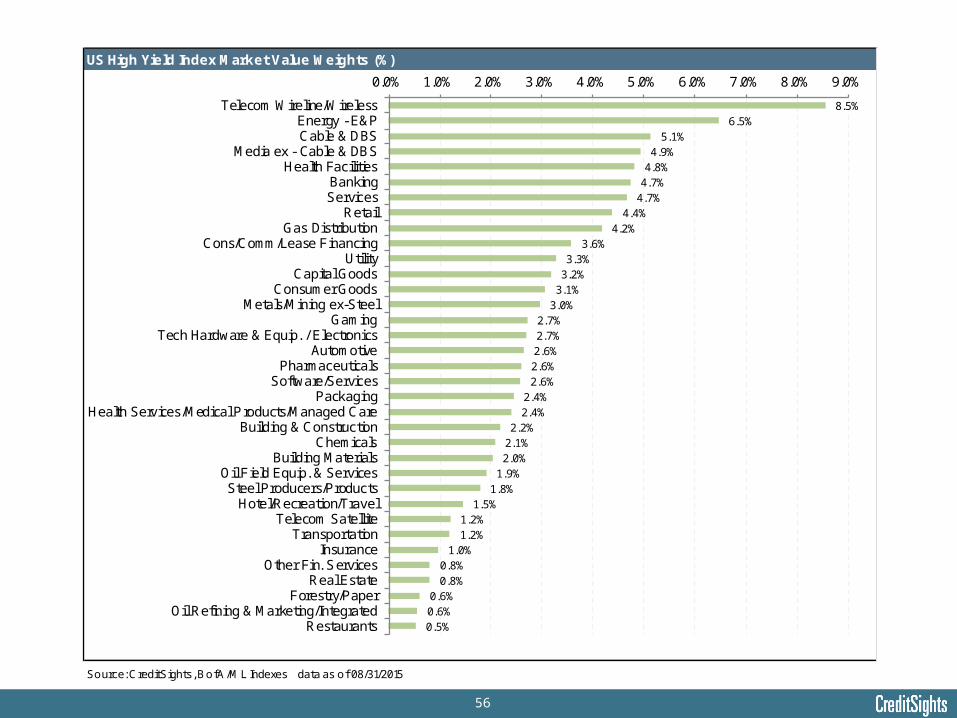
US High Yield Index Market Value Weights (%)
Source: CreditSights, BofA/ML Indexes data as of 08/31/2015
8.5% 6.5%
5.1% 4.9%
4.8% 4.7%
4.7% 4.4%
4.2% 3.6%
3.3% 3.2%
3.1% 3.0%
2.7% 2.7% 2.6% 2.6% 2.6%
2.4% 2.4%
2.2% 2.1% 2.0%
1.9% 1.8%
1.5% 1.2% 1.2%
1.0% 0.8% 0.8%
0.6% 0.6% 0.5%
0.0% 1.0% 2.0% 3.0% 4.0% 5.0% 6.0% 7.0% 8.0% 9.0%
Telecom Wireline/WirelessEnergy - E&PCable & DBS
Media ex - Cable & DBSHealth Facilities
BankingServices
RetailGas Distribution
Cons/Comm/Lease FinancingUtility
Capital GoodsConsumer Goods
Metals/Mining ex-SteelGaming
Tech Hardware & Equip. / ElectronicsAutomotive
PharmaceuticalsSoftware/Services
PackagingHealth Services/Medical Products/Managed Care
Building & ConstructionChemicals
Building MaterialsOil Field Equip. & ServicesSteel Producers/Products
Hotel/Recreation/TravelTelecom Satellite
TransportationInsurance
Other Fin. ServicesReal Estate
Forestry/PaperOil Refining & Marketing/Integrated
Restaurants
57
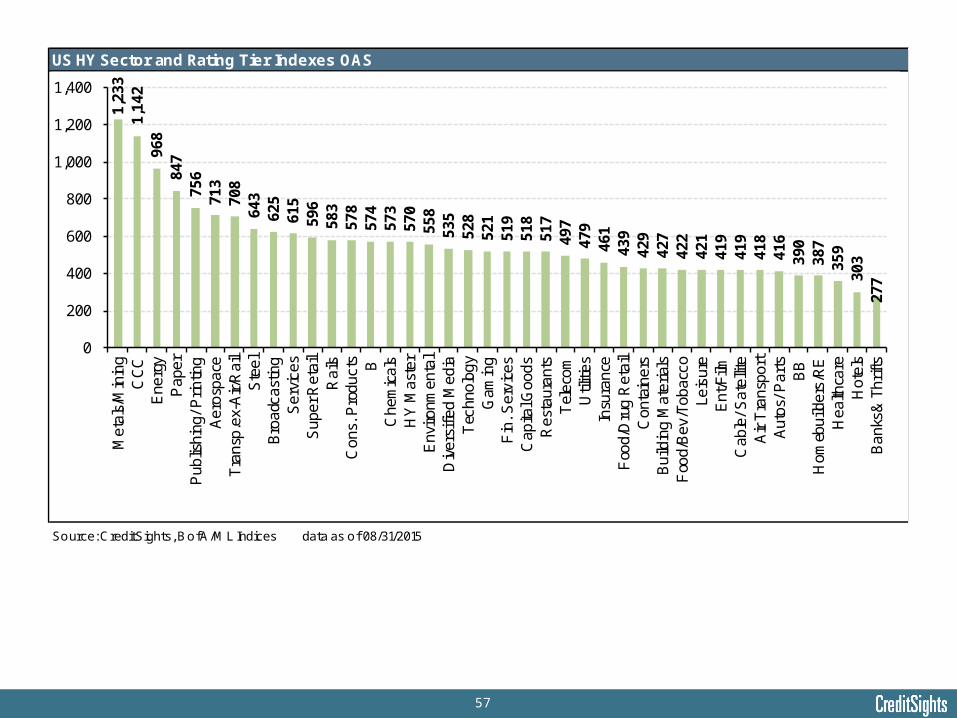
US HY Sector and Rating Tier Indexes OAS
Source: CreditSights, BofA/ML Indices data as of 08/31/2015
1,23
3 1,
142
968
847
756
713
708
643
625
615
596
583
578
574
573
570
558
535
528
521
519
518
517
497
479
461
439
429
427
422
421
419
419
418
416
390
387
359
303
277
0
200
400
600
800
1,000
1,200
1,400
Met
als/
Min
ing
CC
CE
nerg
yP
aper
Pub
lishi
ng/ P
rintin
gA
eros
pace
Tra
nsp.
ex-A
ir/R
ail
Ste
elB
road
cast
ing
Ser
vice
sS
uper
Ret
ail
Rai
lsC
ons.
Pro
duct
s BC
hem
ical
sH
Y M
aste
rE
nviro
nmen
tal
Div
ersi
fied
Med
iaT
echn
olog
yG
amin
gF
in. S
ervi
ces
Cap
ital G
oods
Res
taur
ants
Tel
ecom
Util
ities
Insu
ranc
eF
ood/
Dru
g R
etai
lC
onta
iner
sB
uild
ing
Mat
eria
lsF
ood/
Bev
/Tob
acco
Leis
ure
Ent
/Film
Cab
le/ S
atel
lite
Air
Tra
nspo
rtA
utos
/ Par
tsB
BH
omeb
uild
ers/
RE
Hea
lthca
reH
otel
sB
anks
& T
hrift
s
58
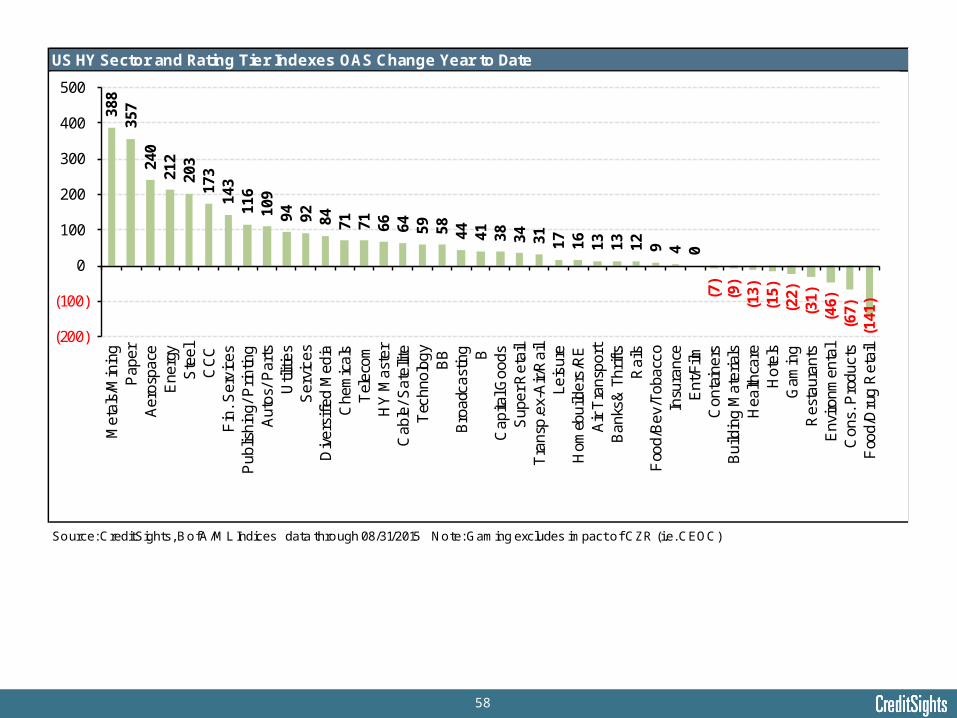
US HY Sector and Rating Tier Indexes OAS Change Year to Date
Source: CreditSights, BofA/ML Indices data through 08/31/2015 Note: Gaming excludes impact of CZR (i.e. CEOC)
388
357
240
212
203
173
143
116
109
94
92
84
71
71
66
64
59
58
44
41
38
34
31
17
16
13
13
12
9 4 0 (7
)(9
)(1
3)(1
5)(2
2)(3
1)(4
6)(6
7)(1
41)
(200)
(100)
0
100
200
300
400
500
Met
als/
Min
ing
Pap
erA
eros
pace
Ene
rgy
Ste
elC
CC
Fin
. Ser
vice
sP
ublis
hing
/ Prin
ting
Aut
os/ P
arts
Util
ities
Ser
vice
sD
iver
sifie
d M
edia
Che
mic
als
Tel
ecom
HY
Mas
ter
Cab
le/ S
atel
lite
Tec
hnol
ogy
BB
Bro
adca
stin
g BC
apita
l Goo
dsS
uper
Ret
ail
Tra
nsp.
ex-A
ir/R
ail
Leis
ure
Hom
ebui
lder
s/R
EA
ir T
rans
port
Ban
ks&
Thr
ifts
Rai
lsF
ood/
Bev
/Tob
acco
Insu
ranc
eE
nt/F
ilmC
onta
iner
sB
uild
ing
Mat
eria
lsH
ealth
care
Hot
els
Gam
ing
Res
taur
ants
Env
ironm
enta
lC
ons.
Pro
duct
sF
ood/
Dru
g R
etai
l
59
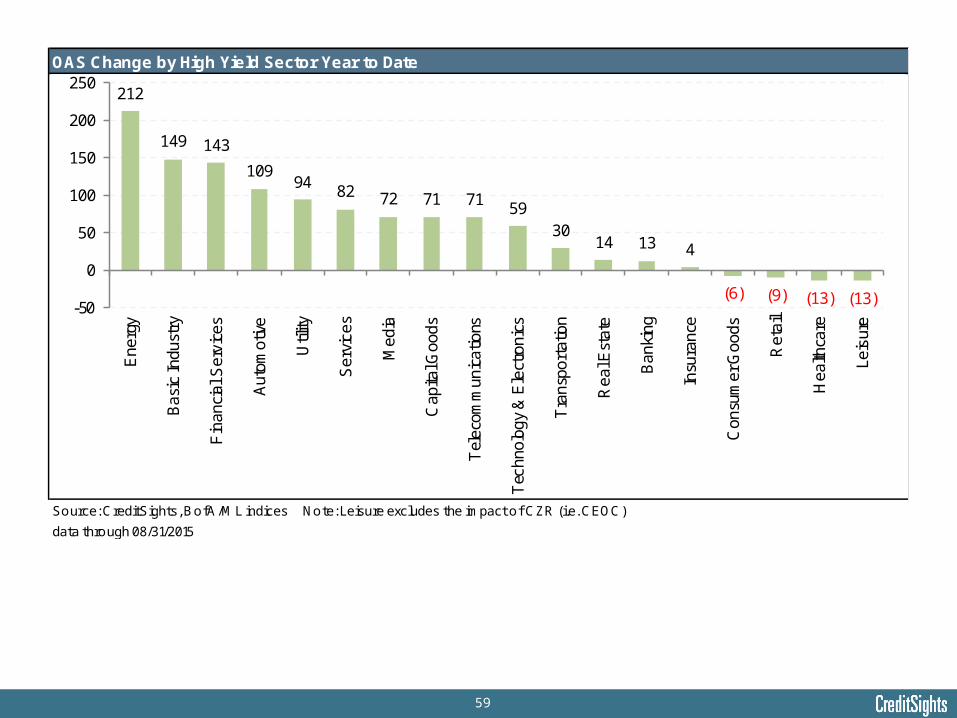
OAS Change by High Yield Sector Year to Date
Source: CreditSights, BofA/ML indices Note: Leisure excludes the impact of CZR (i.e. CEOC)
data through 08/31/2015
212
149 143
109 94
82 72 71 71 59 30
14 13 4
(6) (9) (13) (13)-50
0
50
100
150
200
250
Ene
rgy
Bas
ic In
dust
ry
Fin
anci
al S
ervi
ces
Aut
omot
ive
Util
ity
Ser
vice
s
Med
ia
Cap
ital G
oods
Tel
ecom
mun
icat
ions
Tec
hnol
ogy
& E
lect
roni
cs
Tra
nspo
rtat
ion
Rea
l Est
ate
Ban
king
Insu
ranc
e
Con
sum
er G
oods
Ret
ail
Hea
lthca
re
Leis
ure
60
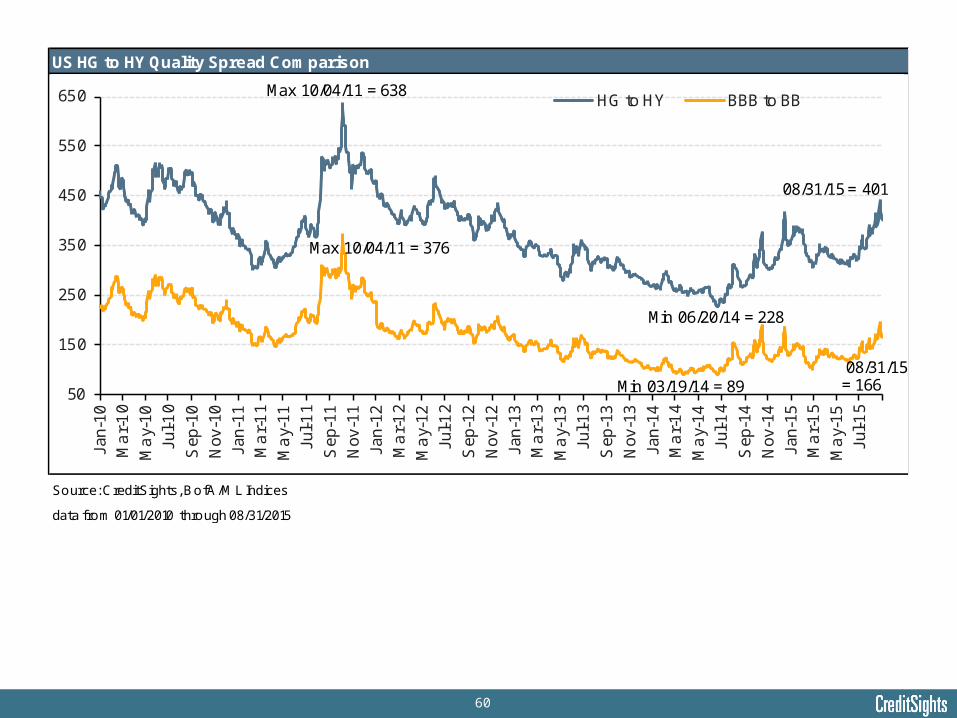
US HG to HY Quality Spread Comparison
Source: CreditSights, BofA/ML Indices
data from 01/01/2010 through 08/31/2015
50
150
250
350
450
550
650Ja
n-10
Ma
r-1
0
Ma
y-10
Jul-1
0
Sep
-10
Nov
-10
Jan-
11M
ar-
11
Ma
y-11
Jul-1
1
Sep
-11
Nov
-11
Jan-
12
Ma
r-1
2
Ma
y-12
Jul-1
2
Sep
-12
Nov
-12
Jan-
13M
ar-
13
Ma
y-13
Jul-1
3
Sep
-13
Nov
-13
Jan-
14M
ar-
14
Ma
y-14
Jul-1
4
Sep
-14
Nov
-14
Jan-
15M
ar-
15
Ma
y-15
Jul-1
5
HG to HY BBB to BBMax 10/04/11 = 638
08/31/15 = 401
Min 06/20/14 = 228
Max 10/04/11 = 376
08/31/15 = 166Min 03/19/14 = 89

61
US HG to HY Quality Spread (OAS) Averages Across Key Time Horizons
HG to HY Level BBB to BB Level
Current 08/31/2015 401 Current 08/31/2015 1662H14 306 2H14 1321H14 261 1H14 101
2H11 491 2H11 265
1H11 339 1H11 174
from 5/1/2010 (sovereign crisis) to current 368 from 5/1/2010 (sovereign crisis) to current 170
1H10 to current 372 1H10 to current 173
Post-crisis from 6/30/2009 to current 390 Post-crisis from 6/30/2009 to current 183
1H04 to 1H07 (the bubble years ) 252 1H04 to 1H07 (the bubble years ) 109
1997 - 1998 (Asia-Russia-LTCM) 263 1997 - 1998 (Asia-Russia-LTCM) 95
Post HY peak through crisis (6/30/07 to 6/30/09) 650 Post HY peak through crisis (6/30/07 to 6/30/09) 285
Bear-Lehman-TARP-Trough 3/1/08 to 6/30/09 804 Bear-Lehman-TARP-Trough 3/1/08 to 6/30/09 335
Long Term excluding 9/30/2008 to 6/30/2009 391 Long Term excluding 9/30/2008 to 6/30/2009 164
Long Term pre-2007 HY Peak 1/1/97 to 6/30/07 391 Long Term pre-2007 HY Peak 1/1/97 to 6/30/07 149
Long Term Average from 12/31/1996 418 Long Term Average from 12/31/1996 174
Long Term Median from 12/31/1996 373 Long Term Median from 12/31/1996 152
Source: CreditSights, BofA/ML Indices data through 08/31/2015
62
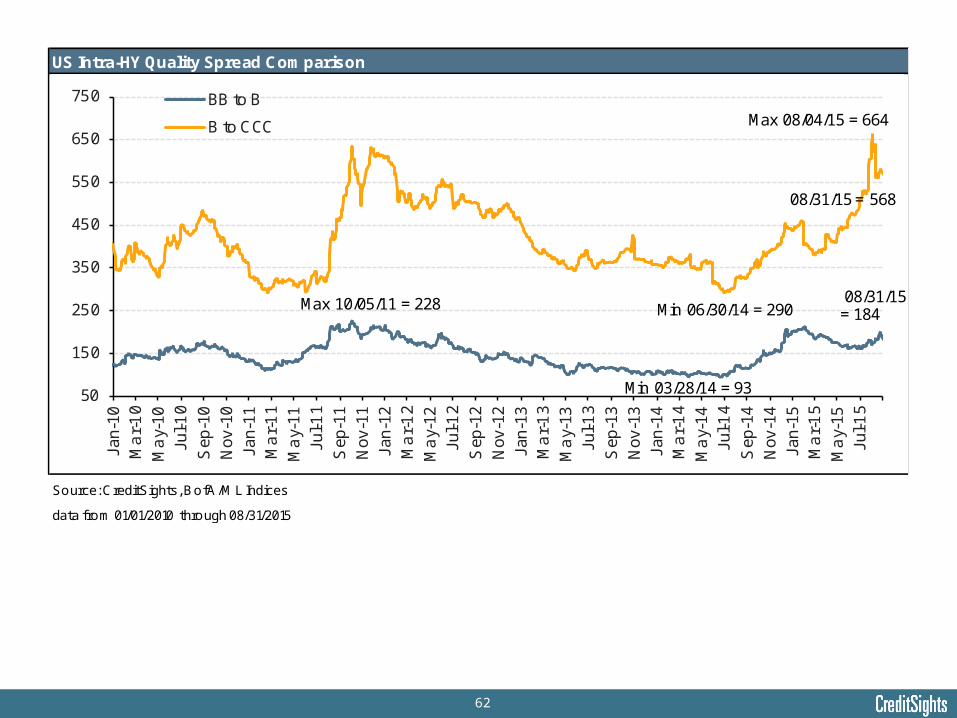
US Intra-HY Quality Spread Comparison
Source: CreditSights, BofA/ML Indices
data from 01/01/2010 through 08/31/2015
50
150
250
350
450
550
650
750Ja
n-10
Ma
r-1
0
Ma
y-10
Jul-1
0
Sep
-10
Nov
-10
Jan-
11M
ar-
11
Ma
y-11
Jul-1
1
Sep
-11
Nov
-11
Jan-
12M
ar-
12
Ma
y-12
Jul-1
2
Sep
-12
Nov
-12
Jan-
13M
ar-
13
Ma
y-13
Jul-1
3
Sep
-13
Nov
-13
Jan-
14M
ar-
14
Ma
y-14
Jul-1
4
Sep
-14
Nov
-14
Jan-
15M
ar-
15
Ma
y-15
Jul-1
5
BB to B
B to CCC
Max 10/05/11 = 228
Min 03/28/14 = 93
08/31/15 = 184
Max 08/04/15 = 664
Min 06/30/14 = 290
08/31/15 = 568
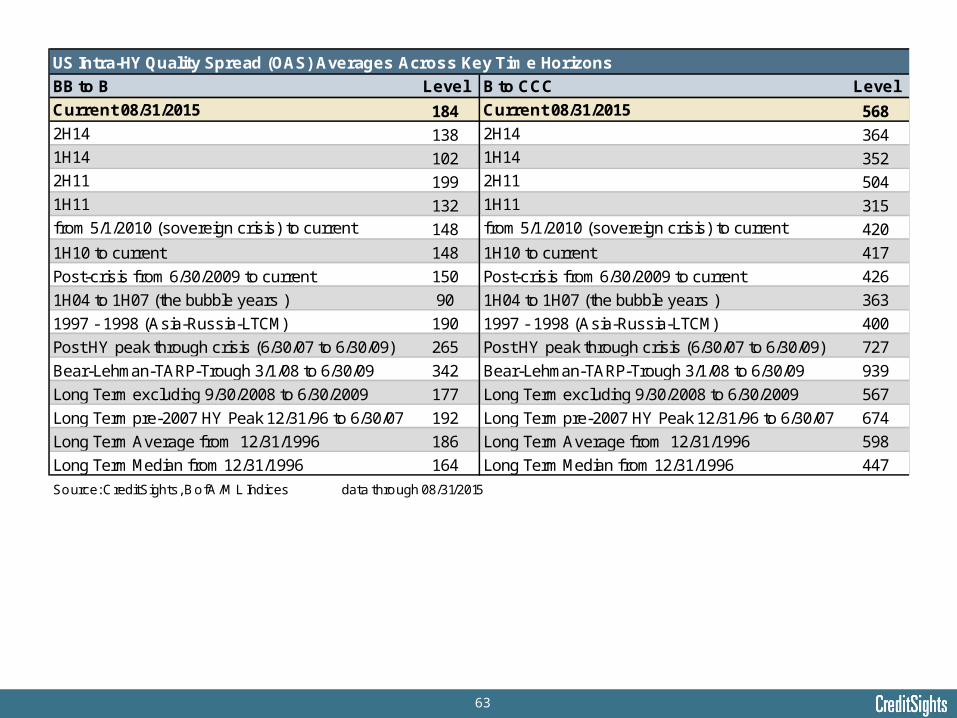
63
US Intra-HY Quality Spread (OAS) Averages Across Key Time Horizons
BB to B Level B to CCC Level
Current 08/31/2015 184 Current 08/31/2015 5682H14 138 2H14 3641H14 102 1H14 3522H11 199 2H11 5041H11 132 1H11 315from 5/1/2010 (sovereign crisis) to current 148 from 5/1/2010 (sovereign crisis) to current 420
1H10 to current 148 1H10 to current 417
Post-crisis from 6/30/2009 to current 150 Post-crisis from 6/30/2009 to current 426
1H04 to 1H07 (the bubble years ) 90 1H04 to 1H07 (the bubble years ) 363
1997 - 1998 (Asia-Russia-LTCM) 190 1997 - 1998 (Asia-Russia-LTCM) 400
Post HY peak through crisis (6/30/07 to 6/30/09) 265 Post HY peak through crisis (6/30/07 to 6/30/09) 727
Bear-Lehman-TARP-Trough 3/1/08 to 6/30/09 342 Bear-Lehman-TARP-Trough 3/1/08 to 6/30/09 939
Long Term excluding 9/30/2008 to 6/30/2009 177 Long Term excluding 9/30/2008 to 6/30/2009 567
Long Term pre-2007 HY Peak 12/31/96 to 6/30/07 192 Long Term pre-2007 HY Peak 12/31/96 to 6/30/07 674
Long Term Average from 12/31/1996 186 Long Term Average from 12/31/1996 598
Long Term Median from 12/31/1996 164 Long Term Median from 12/31/1996 447
Source: CreditSights, BofA/ML Indices data through 08/31/2015

64
UST Curve 1994 : The Tightening Year
Source: CreditSights, Federal Reserve
3%
4%
5%
6%
7%
8%
3MO
6MO
1YR
2YR
3YR
4YR
5YR
6YR
7YR
8YR
9YR
10Y
R
15Y
R
20Y
R
30Y
R
12/31/1993
3/31/1994
6/30/1994
9/30/1994
12/30/1994
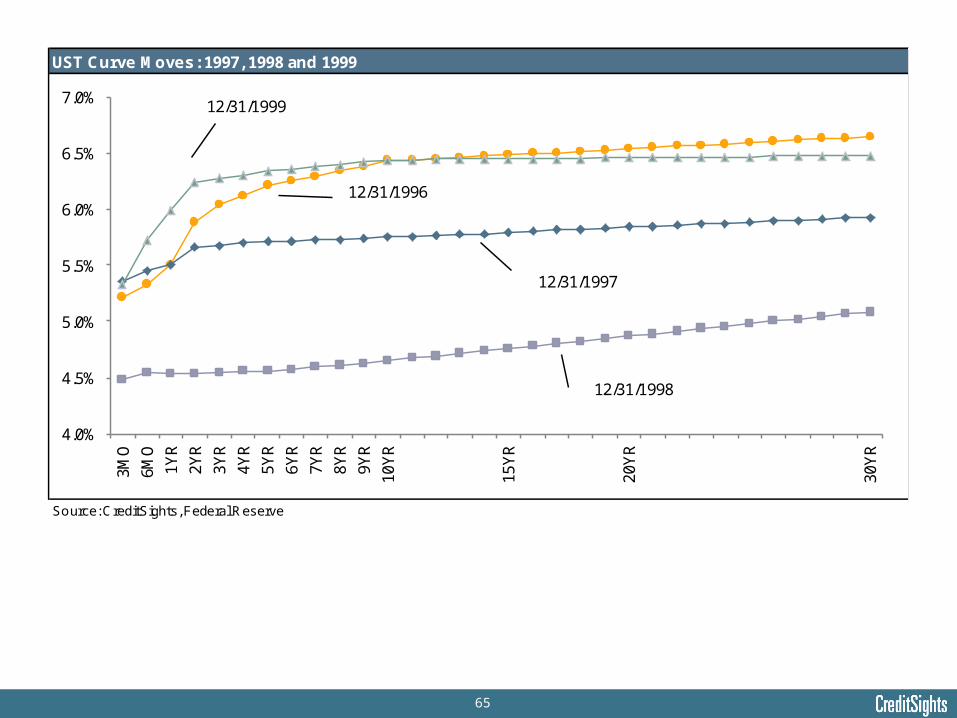
65
UST Curve Moves: 1997, 1998 and 1999
Source: CreditSights, Federal Reserve
4.0%
4.5%
5.0%
5.5%
6.0%
6.5%
7.0%
3MO
6MO
1YR
2YR
3YR
4YR
5YR
6YR
7YR
8YR
9YR
10Y
R
15Y
R
20Y
R
30Y
R
12/31/1996
12/31/1997
12/31/1998
12/31/1999
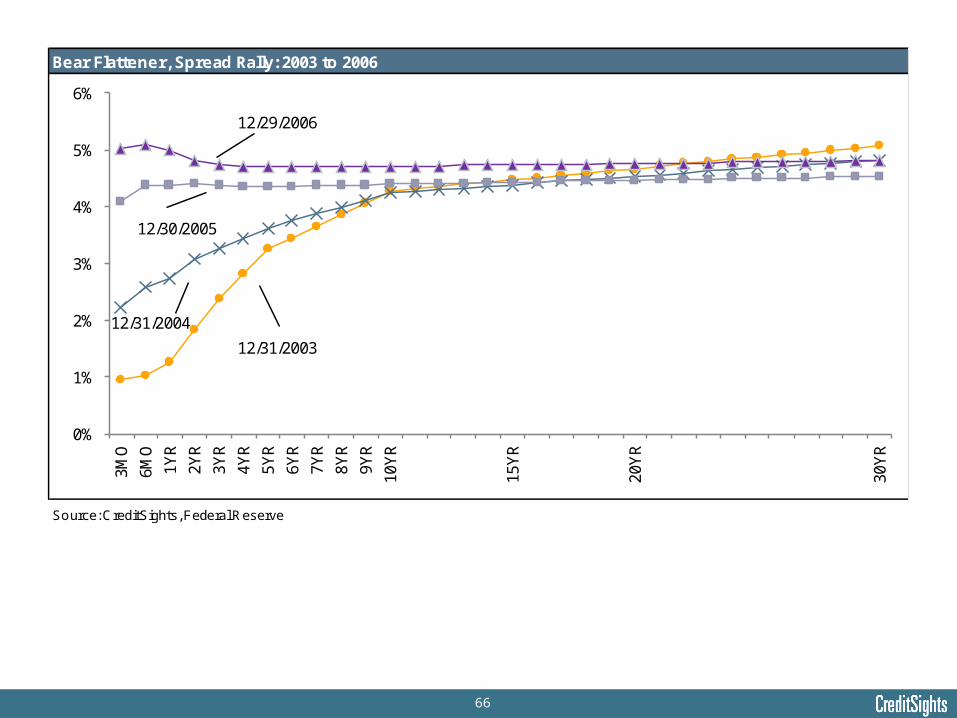
66
Bear Flattener, Spread Rally: 2003 to 2006
Source: CreditSights, Federal Reserve
0%
1%
2%
3%
4%
5%
6%
3MO
6MO
1YR
2YR
3YR
4YR
5YR
6YR
7YR
8YR
9YR
10Y
R
15Y
R
20Y
R
30Y
R
12/31/2003
12/31/2004
12/30/2005
12/29/2006
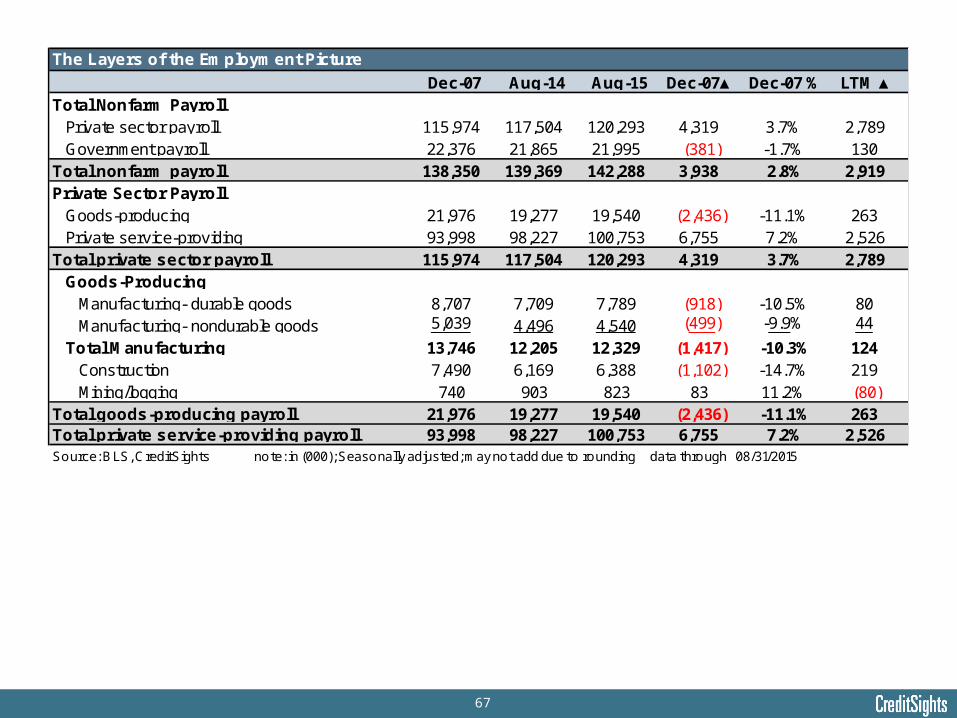
67
Dec-07 Aug-14 Aug-15 Dec-07▲ Dec-07 % LTM ▲Total Nonfarm Payroll Private sector payroll 115,974 117,504 120,293 4,319 3.7% 2,789 Government payroll 22,376 21,865 21,995 (381) -1.7% 130Total nonfarm payroll 138,350 139,369 142,288 3,938 2.8% 2,919Private Sector Payroll Goods-producing 21,976 19,277 19,540 (2,436) -11.1% 263 Private service-providing 93,998 98,227 100,753 6,755 7.2% 2,526Total private sector payroll 115,974 117,504 120,293 4,319 3.7% 2,789 Goods-Producing Manufacturing- durable goods 8,707 7,709 7,789 (918) -10.5% 80 Manufacturing- nondurable goods 5,039 4,496 4,540 (499) -9.9% 44
Total Manufacturing 13,746 12,205 12,329 (1,417) -10.3% 124 Construction 7,490 6,169 6,388 (1,102) -14.7% 219 Mining/logging 740 903 823 83 11.2% (80)Total goods-producing payroll 21,976 19,277 19,540 (2,436) -11.1% 263Total private service-providing payroll 93,998 98,227 100,753 6,755 7.2% 2,526Source: BLS, CreditSights note: in (000); Seasonally adjusted; may not add due to rounding data through 08/31/2015
The Layers of the Employment Picture
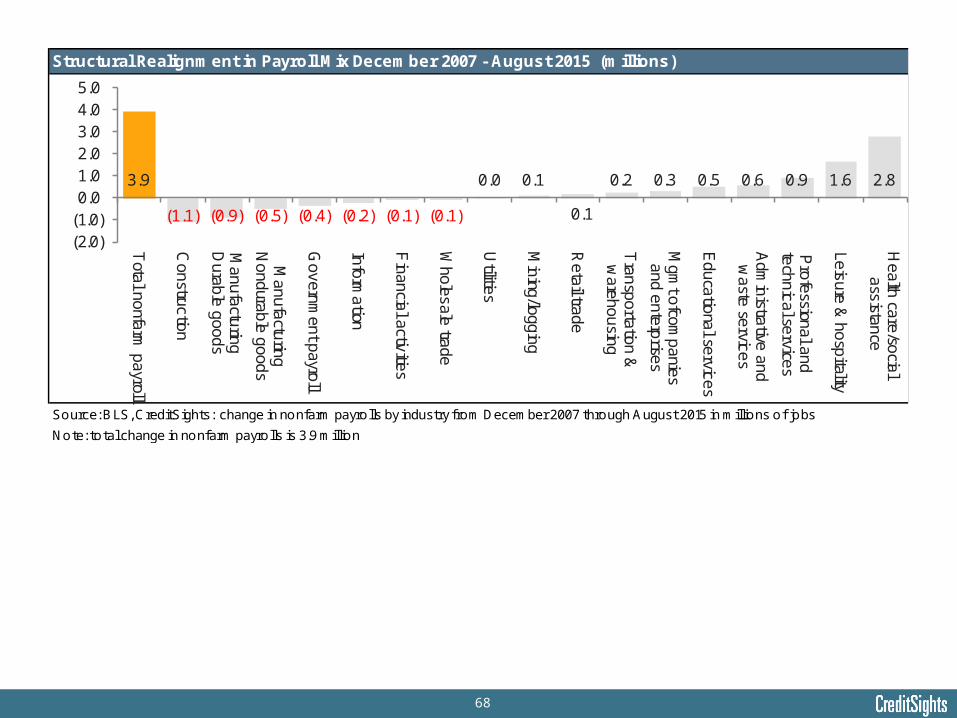
68
Source: BLS, CreditSights: change in nonfarm payrolls by industry from December 2007 through August 2015 in millions of jobs
Note: total change in nonfarm payrolls is 3.9 million
Structural Realignment in Payroll Mix December 2007 - August 2015 (millions)
3.9
(1.1) (0.9) (0.5) (0.4) (0.2) (0.1) (0.1)
0.0 0.1
0.1
0.2 0.3 0.5 0.6 0.9 1.6 2.8
(2.0)(1.0)0.01.02.03.04.05.0
Total nonfarm
payroll
Construction
Manufacturing
Durable goods
Manufacturing
Nondurable goods
Governm
ent payroll
Information
Financial activities
Wholesale trade
Utilities
Mining/logging
Retail trade
Transportation &w
arehousing
Mgm
t ofcompanies
and enterprises
Educational services
Adm
inistrative andw
aste services
Professional and
technical services
Leisure & hospitality
Health care/social
assistance
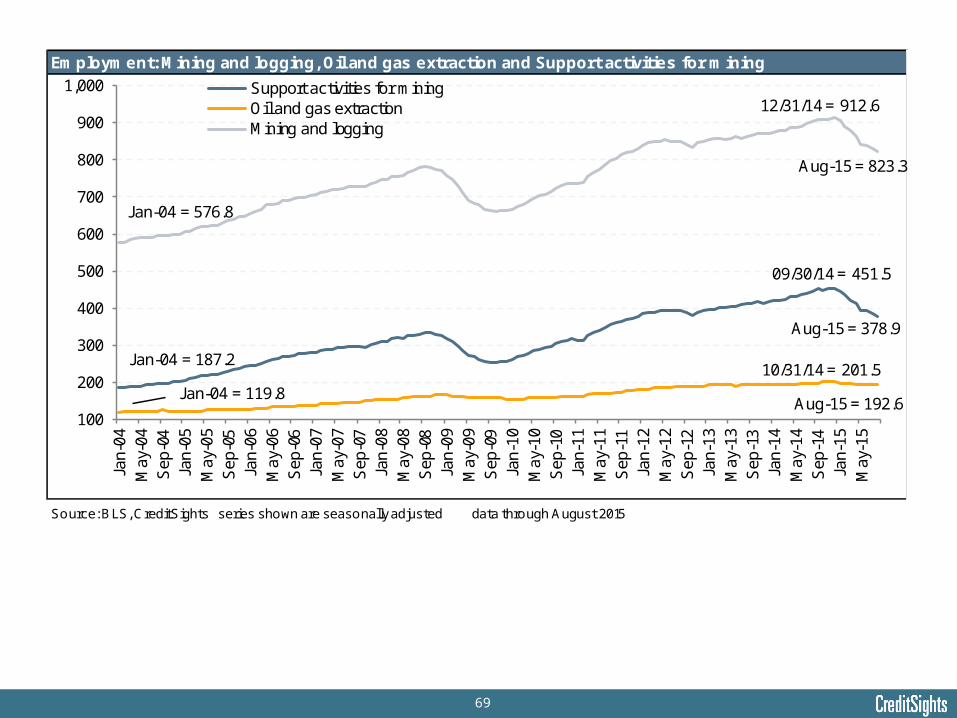
69
Employment: Mining and logging, Oil and gas extraction and Support activities for mining
Source: BLS, CreditSights series shown are seasonally adjusted data through August 2015
100
200
300
400
500
600
700
800
900
1,000
Jan-
04M
ay-0
4S
ep-0
4Ja
n-05
May
-05
Sep
-05
Jan-
06M
ay-0
6S
ep-0
6Ja
n-07
May
-07
Sep
-07
Jan-
08M
ay-0
8S
ep-0
8Ja
n-09
May
-09
Sep
-09
Jan-
10M
ay-1
0S
ep-1
0Ja
n-11
May
-11
Sep
-11
Jan-
12M
ay-1
2S
ep-1
2Ja
n-13
May
-13
Sep
-13
Jan-
14M
ay-1
4S
ep-1
4Ja
n-15
May
-15
Support activities for miningOil and gas extractionMining and logging
Jan-04 = 187.2
Aug-15 = 378.9
Jan-04 = 119.8Aug-15 = 192.6
Jan-04 = 576.8
Aug-15 = 823.3
12/31/14 = 912.6
09/30/14 = 451.5
10/31/14 = 201.5
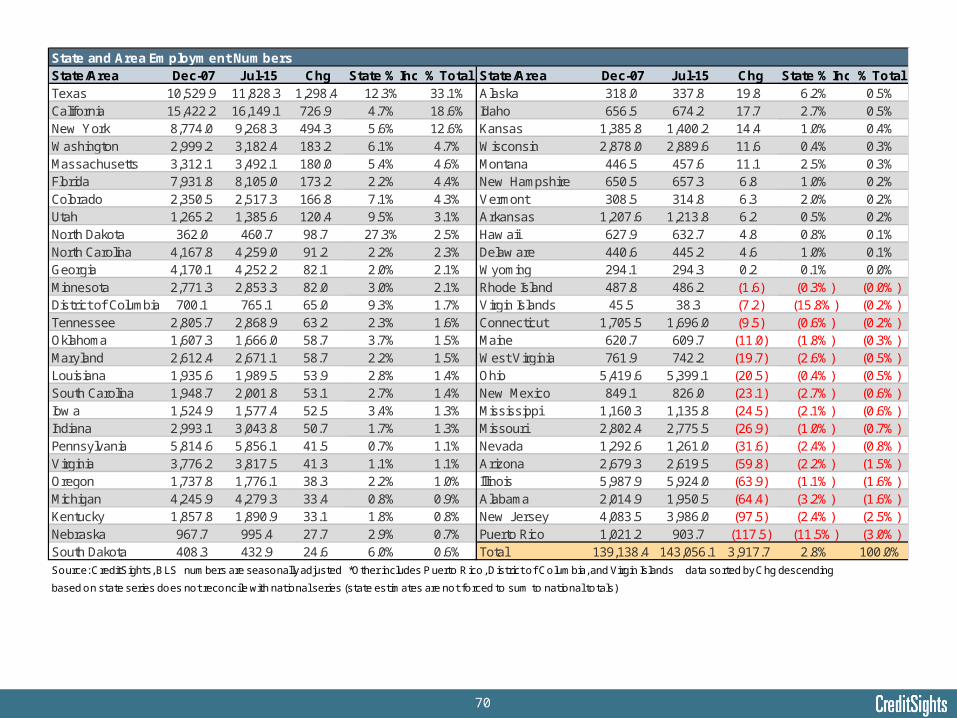
70
State and Area Employment Numbers State/Area Dec-07 Jul-15 Chg State % Inc % Total State/Area Dec-07 Jul-15 Chg State % Inc % TotalTexas 10,529.9 11,828.3 1,298.4 12.3% 33.1% Alaska 318.0 337.8 19.8 6.2% 0.5%California 15,422.2 16,149.1 726.9 4.7% 18.6% Idaho 656.5 674.2 17.7 2.7% 0.5%New York 8,774.0 9,268.3 494.3 5.6% 12.6% Kansas 1,385.8 1,400.2 14.4 1.0% 0.4%Washington 2,999.2 3,182.4 183.2 6.1% 4.7% Wisconsin 2,878.0 2,889.6 11.6 0.4% 0.3%Massachusetts 3,312.1 3,492.1 180.0 5.4% 4.6% Montana 446.5 457.6 11.1 2.5% 0.3%Florida 7,931.8 8,105.0 173.2 2.2% 4.4% New Hampshire 650.5 657.3 6.8 1.0% 0.2%Colorado 2,350.5 2,517.3 166.8 7.1% 4.3% Vermont 308.5 314.8 6.3 2.0% 0.2%Utah 1,265.2 1,385.6 120.4 9.5% 3.1% Arkansas 1,207.6 1,213.8 6.2 0.5% 0.2%North Dakota 362.0 460.7 98.7 27.3% 2.5% Haw aii 627.9 632.7 4.8 0.8% 0.1%North Carolina 4,167.8 4,259.0 91.2 2.2% 2.3% Delaw are 440.6 445.2 4.6 1.0% 0.1%Georgia 4,170.1 4,252.2 82.1 2.0% 2.1% Wyoming 294.1 294.3 0.2 0.1% 0.0%Minnesota 2,771.3 2,853.3 82.0 3.0% 2.1% Rhode Island 487.8 486.2 (1.6) (0.3%) (0.0%)District of Columbia 700.1 765.1 65.0 9.3% 1.7% Virgin Islands 45.5 38.3 (7.2) (15.8%) (0.2%)Tennessee 2,805.7 2,868.9 63.2 2.3% 1.6% Connecticut 1,705.5 1,696.0 (9.5) (0.6%) (0.2%)Oklahoma 1,607.3 1,666.0 58.7 3.7% 1.5% Maine 620.7 609.7 (11.0) (1.8%) (0.3%)Maryland 2,612.4 2,671.1 58.7 2.2% 1.5% West Virginia 761.9 742.2 (19.7) (2.6%) (0.5%)Louisiana 1,935.6 1,989.5 53.9 2.8% 1.4% Ohio 5,419.6 5,399.1 (20.5) (0.4%) (0.5%)South Carolina 1,948.7 2,001.8 53.1 2.7% 1.4% New Mexico 849.1 826.0 (23.1) (2.7%) (0.6%)Iow a 1,524.9 1,577.4 52.5 3.4% 1.3% Mississippi 1,160.3 1,135.8 (24.5) (2.1%) (0.6%)Indiana 2,993.1 3,043.8 50.7 1.7% 1.3% Missouri 2,802.4 2,775.5 (26.9) (1.0%) (0.7%)Pennsylvania 5,814.6 5,856.1 41.5 0.7% 1.1% Nevada 1,292.6 1,261.0 (31.6) (2.4%) (0.8%)Virginia 3,776.2 3,817.5 41.3 1.1% 1.1% Arizona 2,679.3 2,619.5 (59.8) (2.2%) (1.5%)Oregon 1,737.8 1,776.1 38.3 2.2% 1.0% Illinois 5,987.9 5,924.0 (63.9) (1.1%) (1.6%)Michigan 4,245.9 4,279.3 33.4 0.8% 0.9% Alabama 2,014.9 1,950.5 (64.4) (3.2%) (1.6%)Kentucky 1,857.8 1,890.9 33.1 1.8% 0.8% New Jersey 4,083.5 3,986.0 (97.5) (2.4%) (2.5%)Nebraska 967.7 995.4 27.7 2.9% 0.7% Puerto Rico 1,021.2 903.7 (117.5) (11.5%) (3.0%)South Dakota 408.3 432.9 24.6 6.0% 0.6% Total 139,138.4 143,056.1 3,917.7 2.8% 100.0%
Source: CreditSights, BLS numbers are seasonally adjusted *Other includes P uerto Rico, District of Columbia, and Virgin Islands data sorted by Chg descending
based on state series does not reconcile with national series (state estimates are not forced to sum to national totals)

71
S&P Case Shiller 20-City Home Price Index
Source: Bloomberg, S&P Case Shiller, CreditSights Note: data is seasonally adjusted
90
110
130
150
170
190
210
230F
eb-0
0
Aug
-00
Feb
-01
Aug
-01
Feb
-02
Aug
-02
Feb
-03
Aug
-03
Feb
-04
Aug
-04
Feb
-05
Aug
-05
Feb
-06
Aug
-06
Feb
-07
Aug
-07
Feb
-08
Aug
-08
Feb
-09
Aug
-09
Feb
-10
Aug
-10
Feb
-11
Aug
-11
Feb
-12
Aug
-12
Feb
-13
Aug
-13
Feb
-14
Aug
-14
Feb
-15
06/30/2015 = 178.9
4/30/2006 = 206.6
1/31/2012 = 137.1
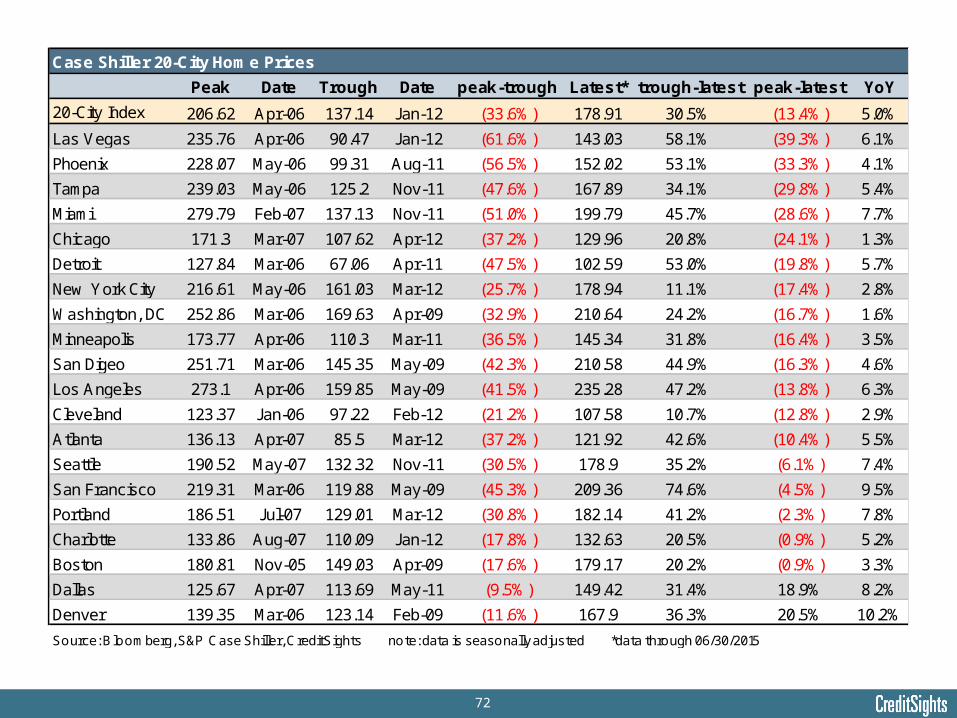
72
Case Shiller 20-City Home Prices
Peak Date Trough Date peak-trough Latest* trough-latest peak-latest YoY
20-City Index 206.62 Apr-06 137.14 Jan-12 (33.6%) 178.91 30.5% (13.4%) 5.0%
Las Vegas 235.76 Apr-06 90.47 Jan-12 (61.6%) 143.03 58.1% (39.3%) 6.1%
Phoenix 228.07 May-06 99.31 Aug-11 (56.5%) 152.02 53.1% (33.3%) 4.1%
Tampa 239.03 May-06 125.2 Nov-11 (47.6%) 167.89 34.1% (29.8%) 5.4%
Miami 279.79 Feb-07 137.13 Nov-11 (51.0%) 199.79 45.7% (28.6%) 7.7%
Chicago 171.3 Mar-07 107.62 Apr-12 (37.2%) 129.96 20.8% (24.1%) 1.3%
Detroit 127.84 Mar-06 67.06 Apr-11 (47.5%) 102.59 53.0% (19.8%) 5.7%
New York City 216.61 May-06 161.03 Mar-12 (25.7%) 178.94 11.1% (17.4%) 2.8%
Washington, DC 252.86 Mar-06 169.63 Apr-09 (32.9%) 210.64 24.2% (16.7%) 1.6%
Minneapolis 173.77 Apr-06 110.3 Mar-11 (36.5%) 145.34 31.8% (16.4%) 3.5%
San Digeo 251.71 Mar-06 145.35 May-09 (42.3%) 210.58 44.9% (16.3%) 4.6%
Los Angeles 273.1 Apr-06 159.85 May-09 (41.5%) 235.28 47.2% (13.8%) 6.3%
Cleveland 123.37 Jan-06 97.22 Feb-12 (21.2%) 107.58 10.7% (12.8%) 2.9%
Atlanta 136.13 Apr-07 85.5 Mar-12 (37.2%) 121.92 42.6% (10.4%) 5.5%
Seattle 190.52 May-07 132.32 Nov-11 (30.5%) 178.9 35.2% (6.1%) 7.4%
San Francisco 219.31 Mar-06 119.88 May-09 (45.3%) 209.36 74.6% (4.5%) 9.5%
Portland 186.51 Jul-07 129.01 Mar-12 (30.8%) 182.14 41.2% (2.3%) 7.8%
Charlotte 133.86 Aug-07 110.09 Jan-12 (17.8%) 132.63 20.5% (0.9%) 5.2%
Boston 180.81 Nov-05 149.03 Apr-09 (17.6%) 179.17 20.2% (0.9%) 3.3%
Dallas 125.67 Apr-07 113.69 May-11 (9.5%) 149.42 31.4% 18.9% 8.2%
Denver 139.35 Mar-06 123.14 Feb-09 (11.6%) 167.9 36.3% 20.5% 10.2%
Source: Bloomberg, S&P Case Shiller, CreditSights note: data is seasonally adjusted *data through 06/30/2015
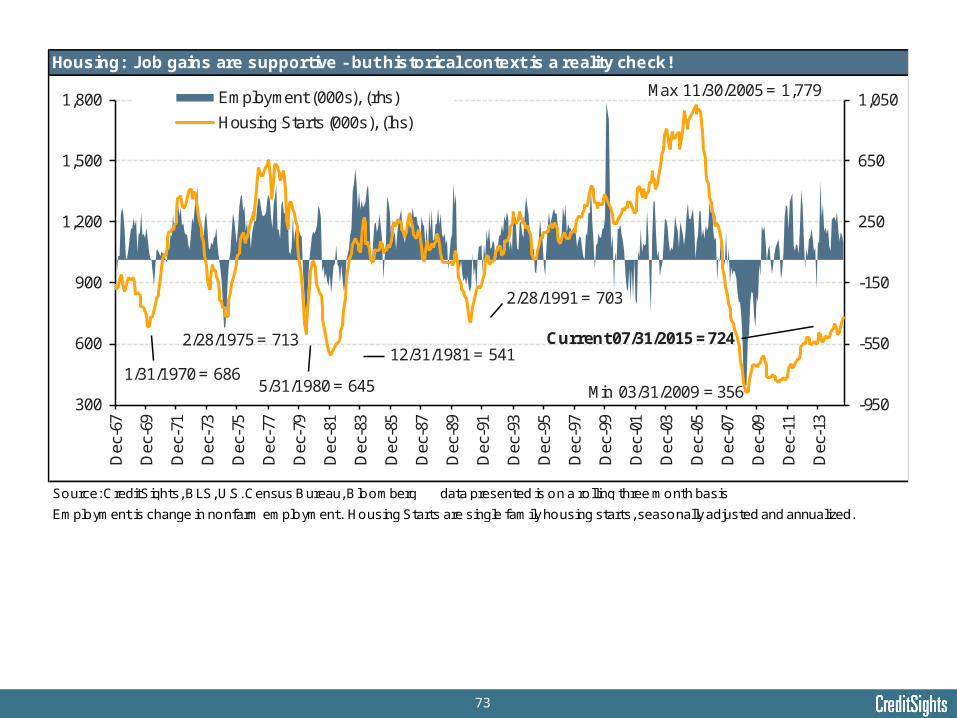
73
Employment is change in nonfarm employment. Housing Starts are single family housing starts, seasonally adjusted and annualized.
Housing: Job gains are supportive - but historical context is a reality check!
Source: CreditSights, BLS, U.S. Census Bureau, Bloomberg data presented is on a rolling three month basis
-950
-550
-150
250
650
1,050
300
600
900
1,200
1,500
1,800D
ec-6
7
Dec
-69
Dec
-71
Dec
-73
Dec
-75
Dec
-77
Dec
-79
Dec
-81
Dec
-83
Dec
-85
Dec
-87
Dec
-89
Dec
-91
Dec
-93
Dec
-95
Dec
-97
Dec
-99
Dec
-01
Dec
-03
Dec
-05
Dec
-07
Dec
-09
Dec
-11
Dec
-13
Employment (000s), (rhs)
Housing Starts (000s), (lhs)
Min 03/31/2009 = 356
Max 11/30/2005 = 1,779
12/31/1981 = 541Current 07/31/2015 = 724
2/28/1991 = 703
5/31/1980 = 6451/31/1970 = 686
2/28/1975 = 713
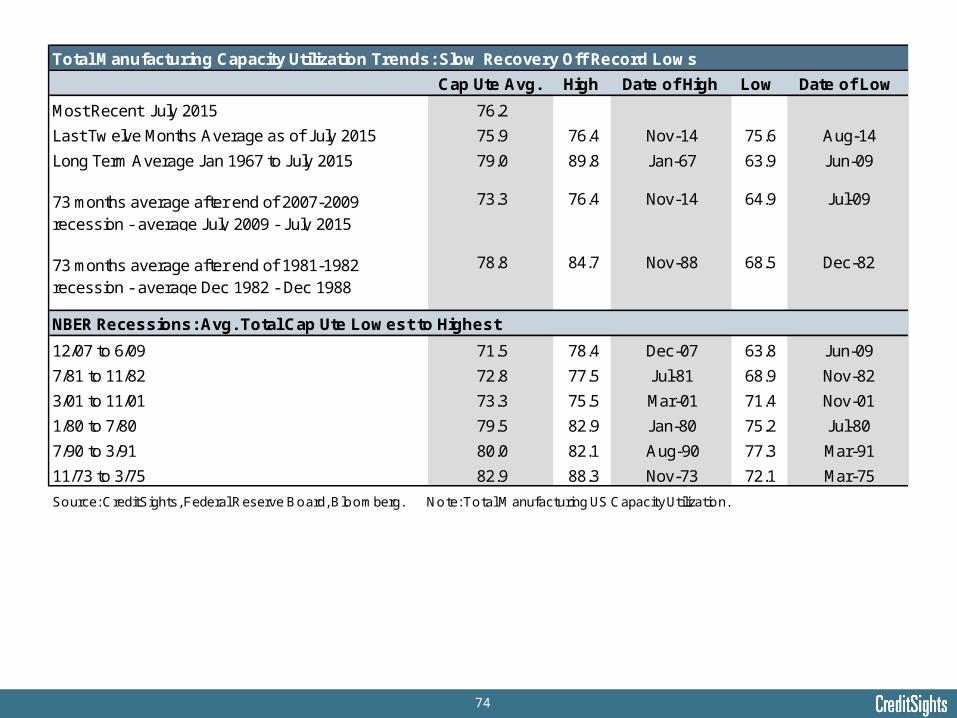
74
Total Manufacturing Capacity Utilization Trends: Slow Recovery Off Record Lows
Cap Ute Avg. High Date of High Low Date of Low
Most Recent July 2015 76.2
Last Tw elve Months Average as of July 2015 75.9 76.4 Nov-14 75.6 Aug-14
Long Term Average Jan 1967 to July 2015 79.0 89.8 Jan-67 63.9 Jun-09
73.3 76.4 Nov-14 64.9 Jul-09
78.8 84.7 Nov-88 68.5 Dec-82
NBER Recessions: Avg. Total Cap Ute Lowest to Highest
12/07 to 6/09 71.5 78.4 Dec-07 63.8 Jun-09
7/81 to 11/82 72.8 77.5 Jul-81 68.9 Nov-82
3/01 to 11/01 73.3 75.5 Mar-01 71.4 Nov-01
1/80 to 7/80 79.5 82.9 Jan-80 75.2 Jul-80
7/90 to 3/91 80.0 82.1 Aug-90 77.3 Mar-91
11/73 to 3/75 82.9 88.3 Nov-73 72.1 Mar-75
Source: CreditSights, Federal Reserve Board, Bloomberg. Note: Total Manufacturing US Capacity Utilization.
73 months average after end of 2007-2009 recession - average July 2009 - July 2015
73 months average after end of 1981-1982 recession - average Dec 1982 - Dec 1988
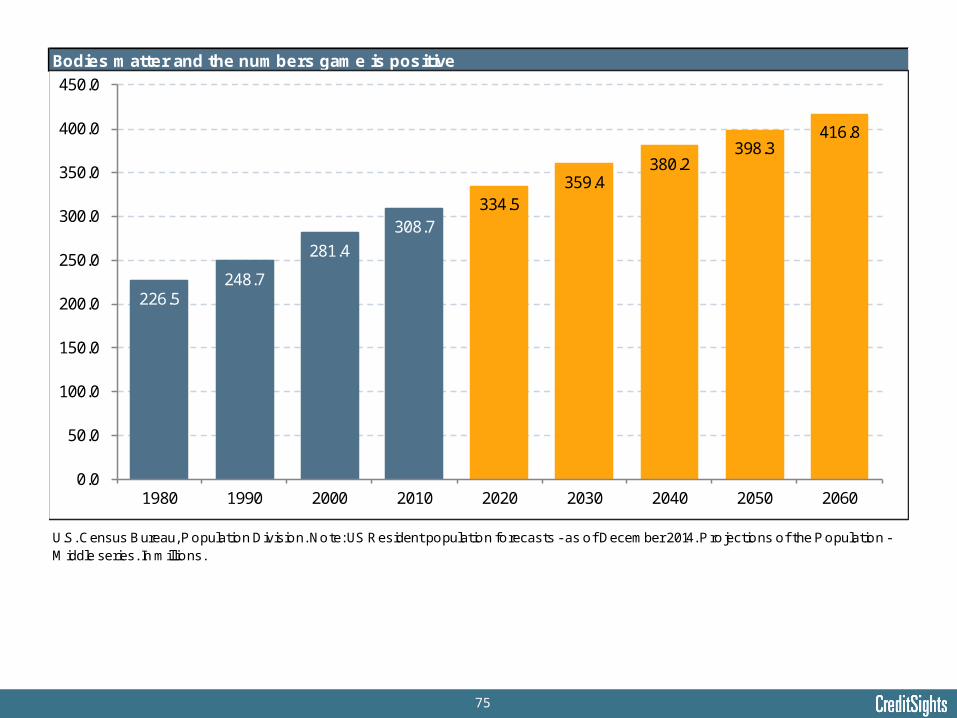
75
Bodies matter and the numbers game is positive
U.S. Census Bureau, P opulation Division. Note: US Resident population forecasts - as of December 2014. P rojections of the P opulation - M iddle series. In millions.
226.5 248.7
281.4
308.7 334.5
359.4 380.2
398.3 416.8
0.0
50.0
100.0
150.0
200.0
250.0
300.0
350.0
400.0
450.0
1980 1990 2000 2010 2020 2030 2040 2050 2060
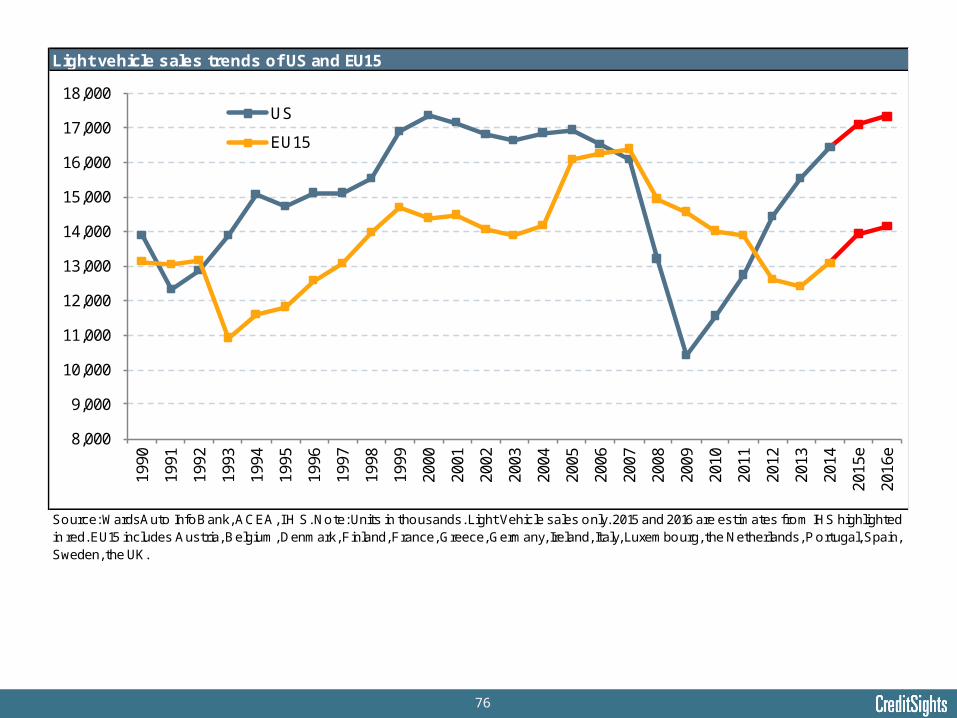
76
Light vehicle sales trends of US and EU15
Source: WardsAuto InfoBank, ACEA, I H S. Note: Units in thousands. Light Vehicle sales only. 2015 and 2016 are estimates from IHS highlighted in red. EU15 includes Austria, Belgium, Denmark, Finland, France, Greece, Germany, Ireland, Italy, Luxembourg, the Netherlands, P ortugal, Spain, Sweden, the UK.
8,000
9,000
10,000
11,000
12,000
13,000
14,000
15,000
16,000
17,000
18,000
1990
1991
1992
1993
1994
1995
1996
1997
1998
1999
2000
2001
2002
2003
2004
2005
2006
2007
2008
2009
2010
2011
2012
2013
2014
2015
e
2016
e
US
EU15
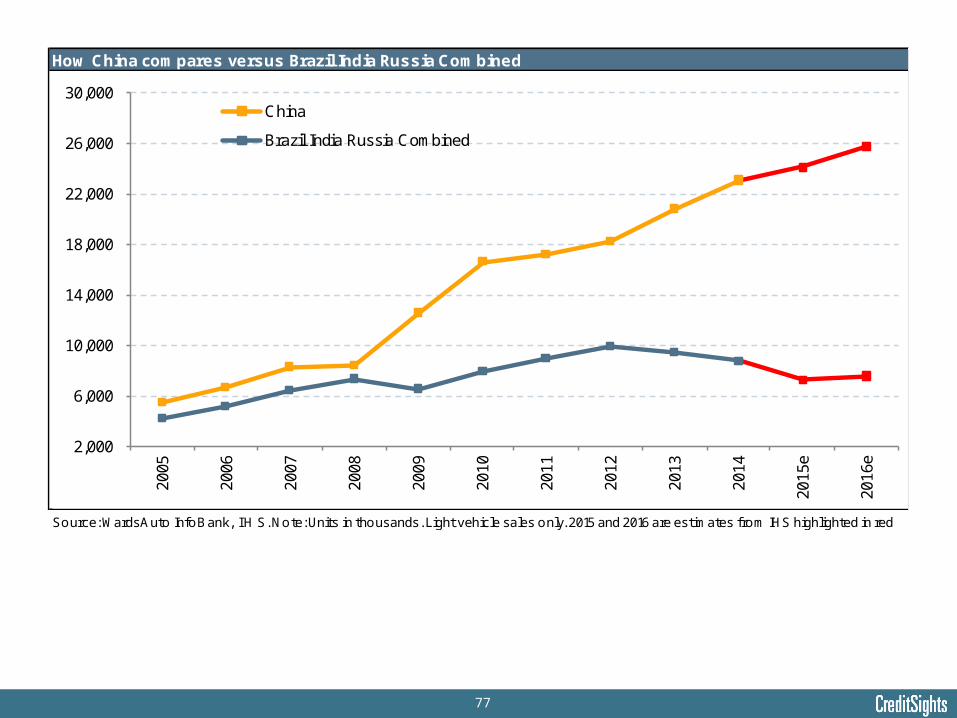
77
How China compares versus Brazil India Russia Combined
Source: WardsAuto InfoBank, I H S. Note: Units in thousands. Light vehicle sales only. 2015 and 2016 are estimates from IHS highlighted in red
2,000
6,000
10,000
14,000
18,000
22,000
26,000
30,000
2005
2006
2007
2008
2009
2010
2011
2012
2013
2014
2015
e
2016
e
China
Brazil India Russia Combined
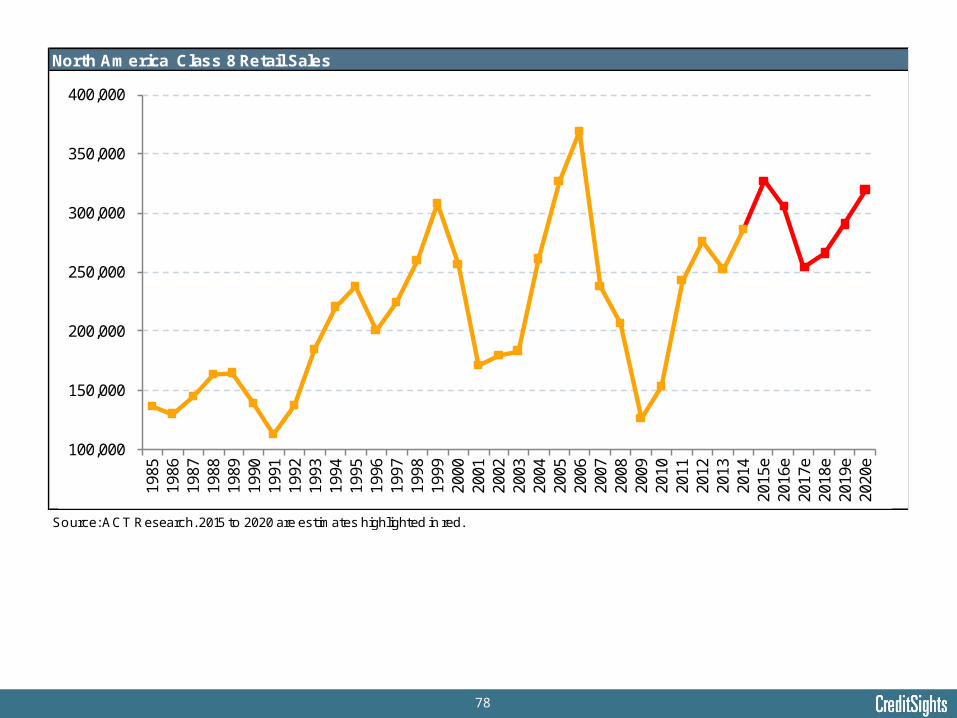
78
North America Class 8 Retail Sales
Source: ACT Research. 2015 to 2020 are estimates highlighted in red.
100,000
150,000
200,000
250,000
300,000
350,000
400,000
1985
1986
1987
1988
1989
1990
1991
1992
1993
1994
1995
1996
1997
1998
1999
2000
2001
2002
2003
2004
2005
2006
2007
2008
2009
2010
2011
2012
2013
2014
2015
e20
16e
2017
e20
18e
2019
e20
20e
79
Copyright CreditSights 2015.
All rights reserved. Reproduction of this report, even for internal distribution, is strictly prohibited. The information in this report has been obtained from sources believed to be reliable; however, neither its accuracy, nor completeness, nor the opinions based thereon are guaranteed. If you have any questions regarding the contents of this report contact CreditSights at [email protected]. BondScore, CreditSights Ratings, ratings products and related information are provided by CreditSights Analytics, LLC. CreditSights Limited is authorised and regulated by the Financial Conduct Authority (FCA). This product is not intended for use in the UK by Private Customers, as defined by the FCA.
Certain data appearing herein is owned by, and used under license from, certain third parties. Please see Legal Notices for important information and limitations regarding such data. For CreditSights' terms of use, please see Terms & Conditions.