Embed Size (px)
Citation preview
A! I!f"#r$%&'( I!)*$++$*'"!....
CentreforfacultyDevelopment
GO
projectAb",* *&-...
Patrick Dinnen & Anthea Foyer were hired by the Centre for Faculty Development {CFD}, University of Toronto at St Michael’s Hospital to create in interactive infographic to celebrate their 10th Anniversary. The CFD was looking for a way to highlight:
+ the associated institutionsThere are 9 main institutions, some of these have up to 19 associated institutions, as well as several other connected institutions. Most of these are local but a few are regional or international.
+ The teachers, learners & staff There are 3000+ people that have been associated with the CFD over the past ten years.
+ The Education & its ImpactTestimonials from past participants make it obvious that this program is impactful for the people that have attended.
+ ... and most importantly ... The connectionsThe CFD is most proud of the way it has created connections between institutions and people. It was very important to them that this was showcased in this projects.
ourideaW&$* w- %r"%.-/...
T! "r#$%# $& #&'$'(&', (&f!r)$%(v#, *!#%(" $&+ *$r%("(*$%!r, -*#r(#&"# f!r $.. CFD /%$0#1!.+#r/ (&".2+(&' %1# U&(v#r/(%, $&+ H3*(%$. )$&$'#)#&%, "2rr#&% $&+ *$/% f$"(.(%$!r/ & .#$r&#r/, $/ w#.. $/ f!r 4%2r# .#$r&#r/ $&+ !%1#r (&%#r#/%#+ *$r%(#/.
I% w!2.+ "!&/(/% !f $& (&%#r$"%(v# (&/%$..$%(!& %1$% w!2.+ $..!w /%$0#1!.+#r/ {#v#&% $%%#&+##/}, (& $ *.$,4. w$,, %! .#$r& )!r# $b!2% %1# CFD (& %1# $r#$/ %1#, $r# )3% *r!2+ !f.
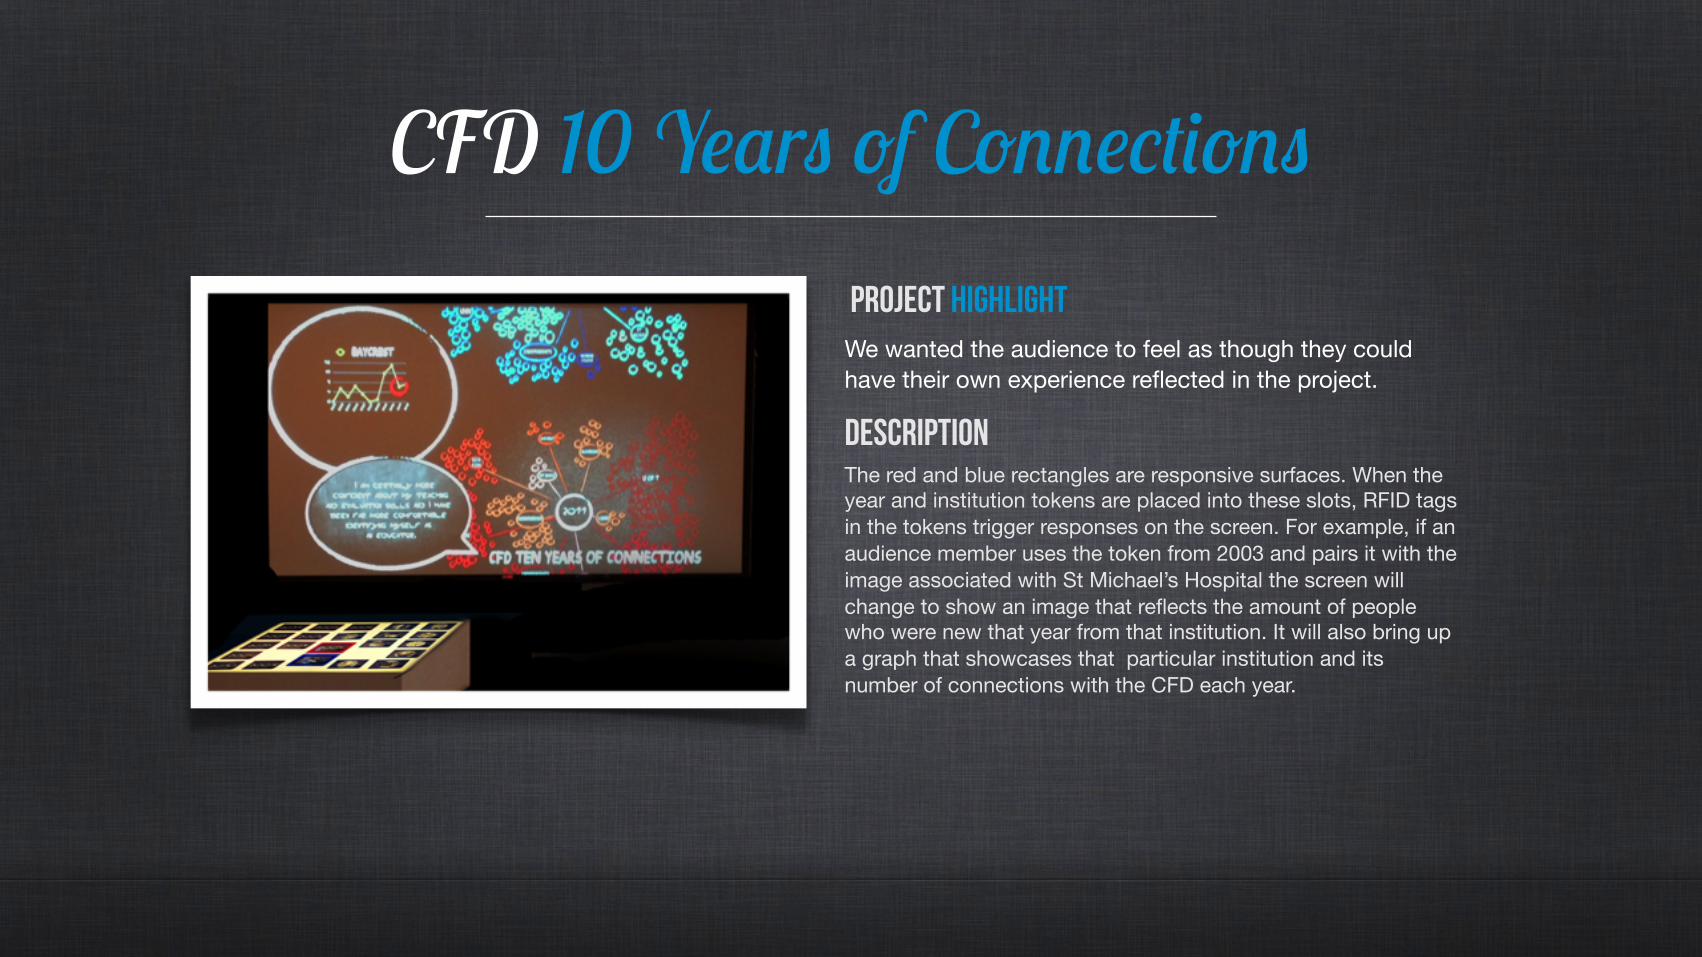
PROJECT HIghlightWe wanted the audience to feel as though they could have their own experience reflected in the project.
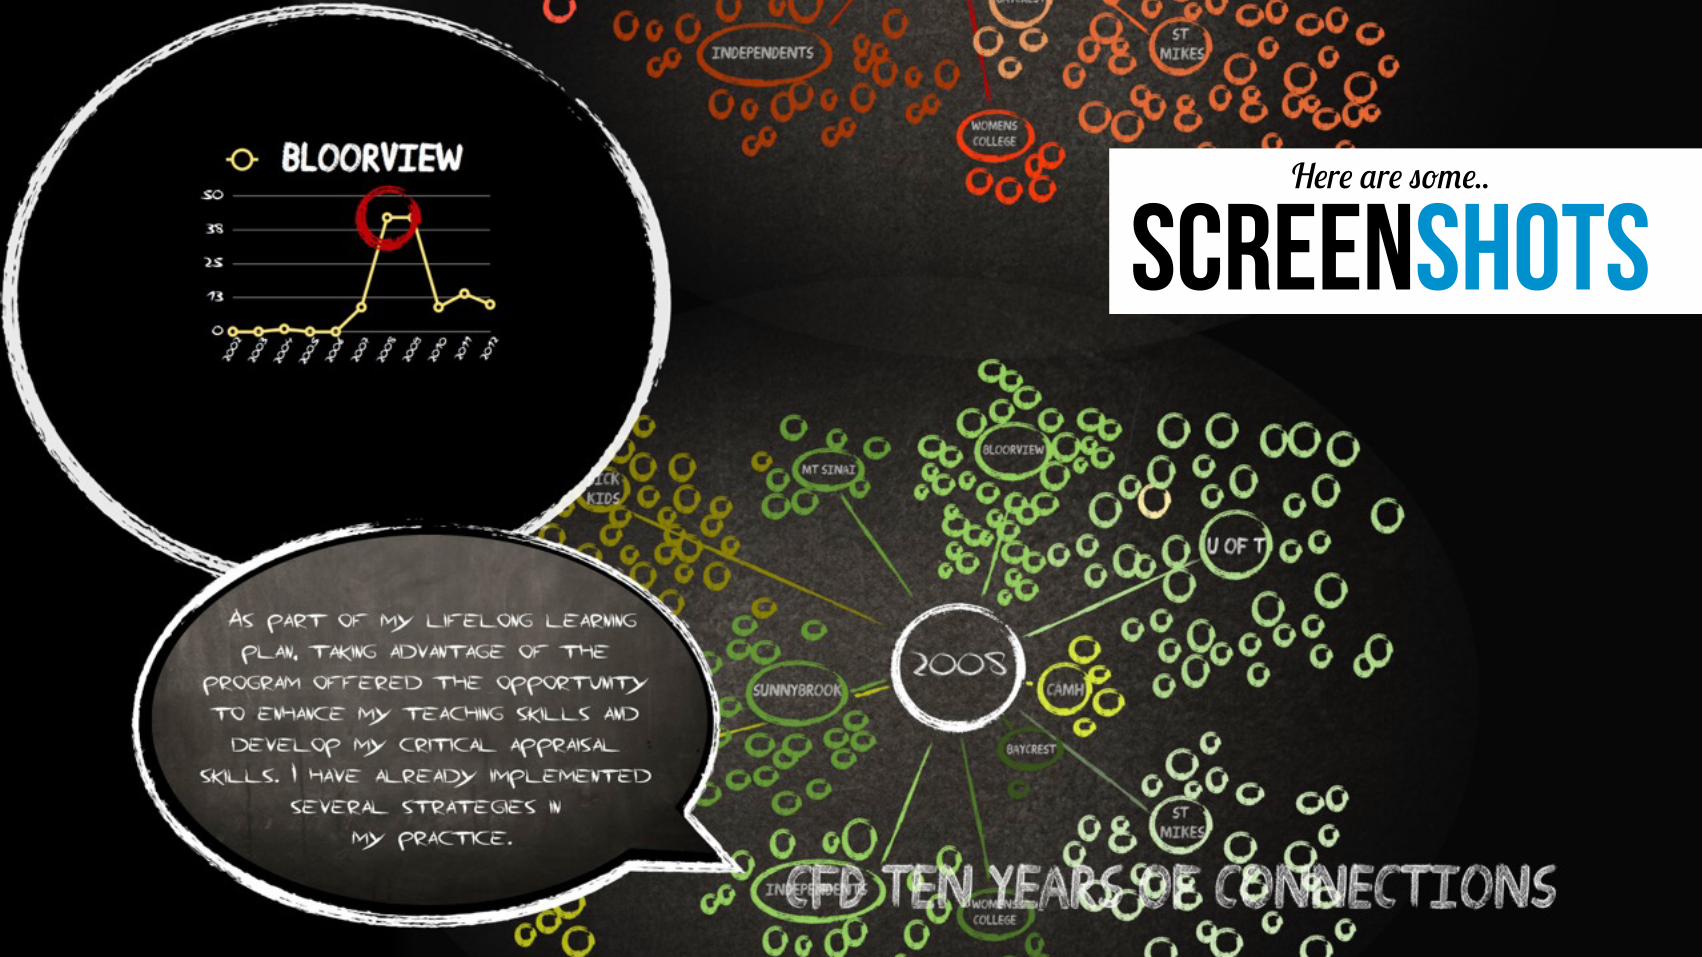
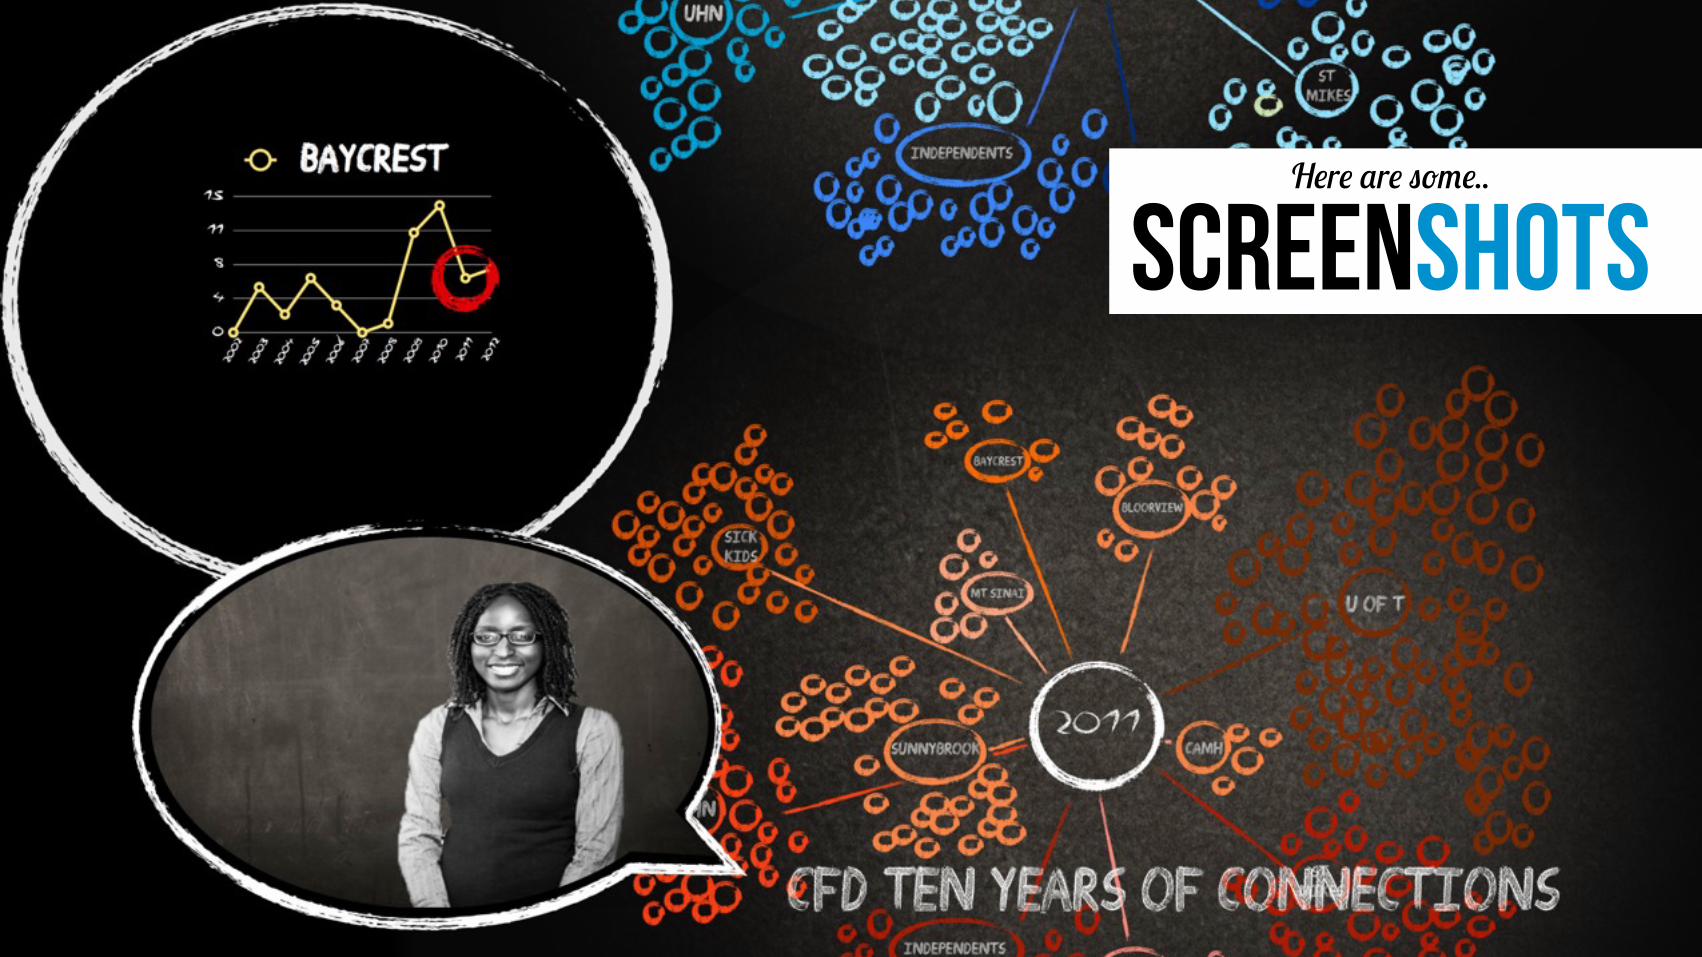
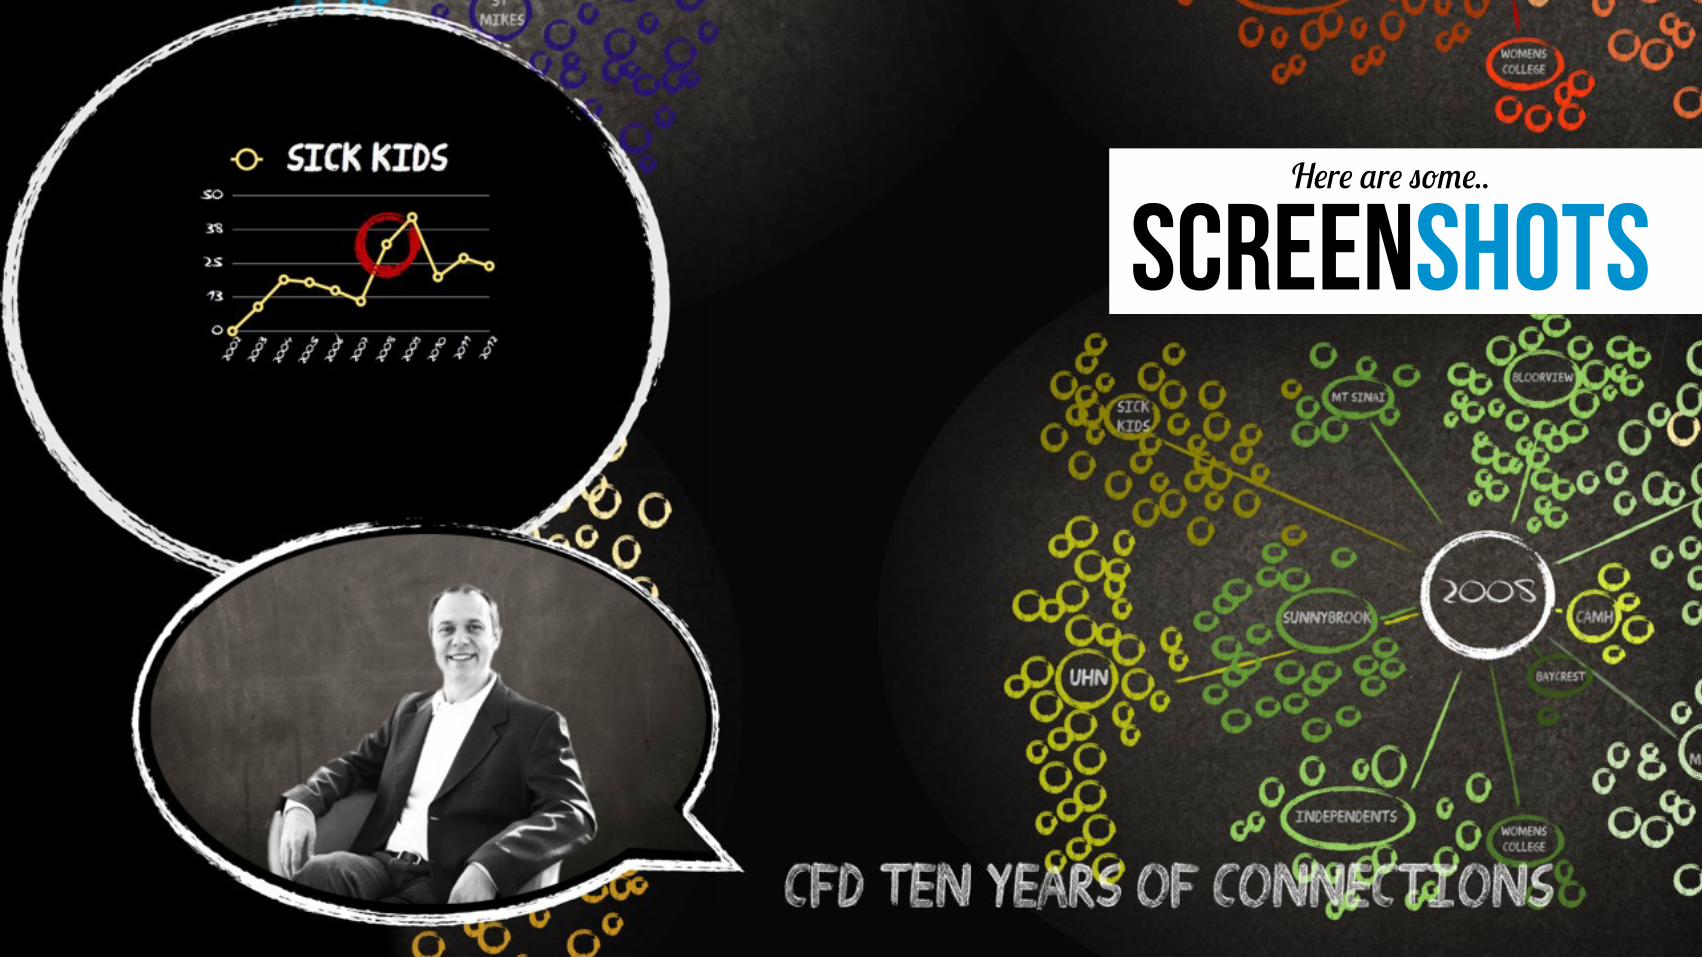
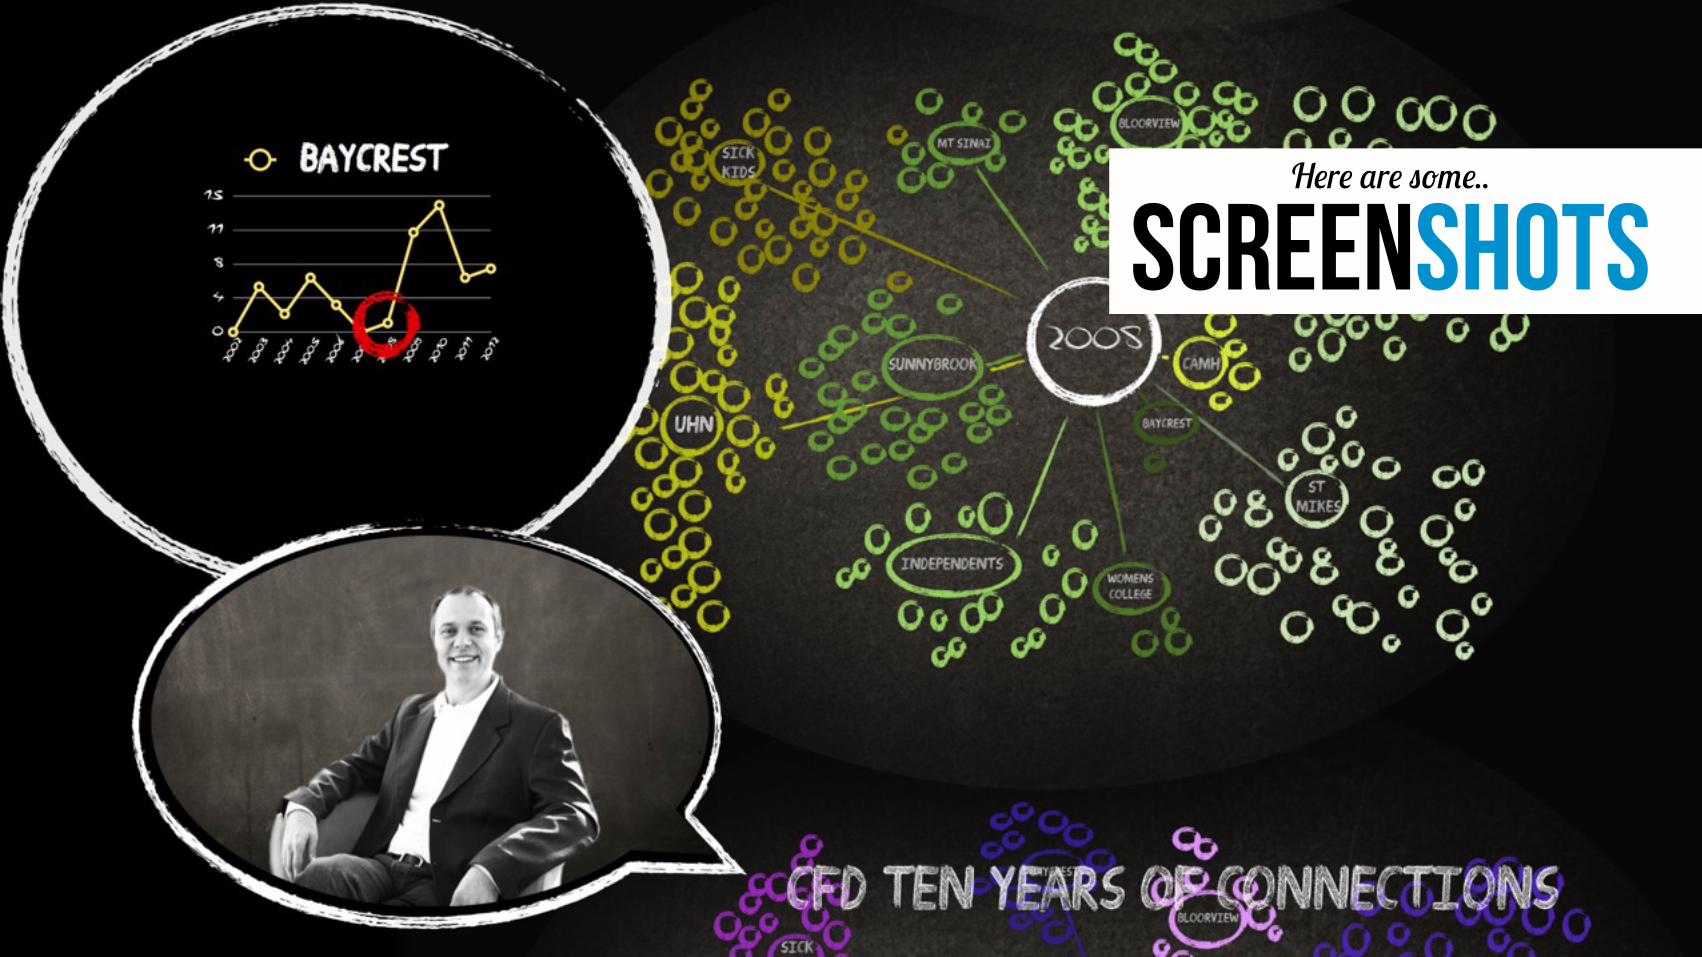
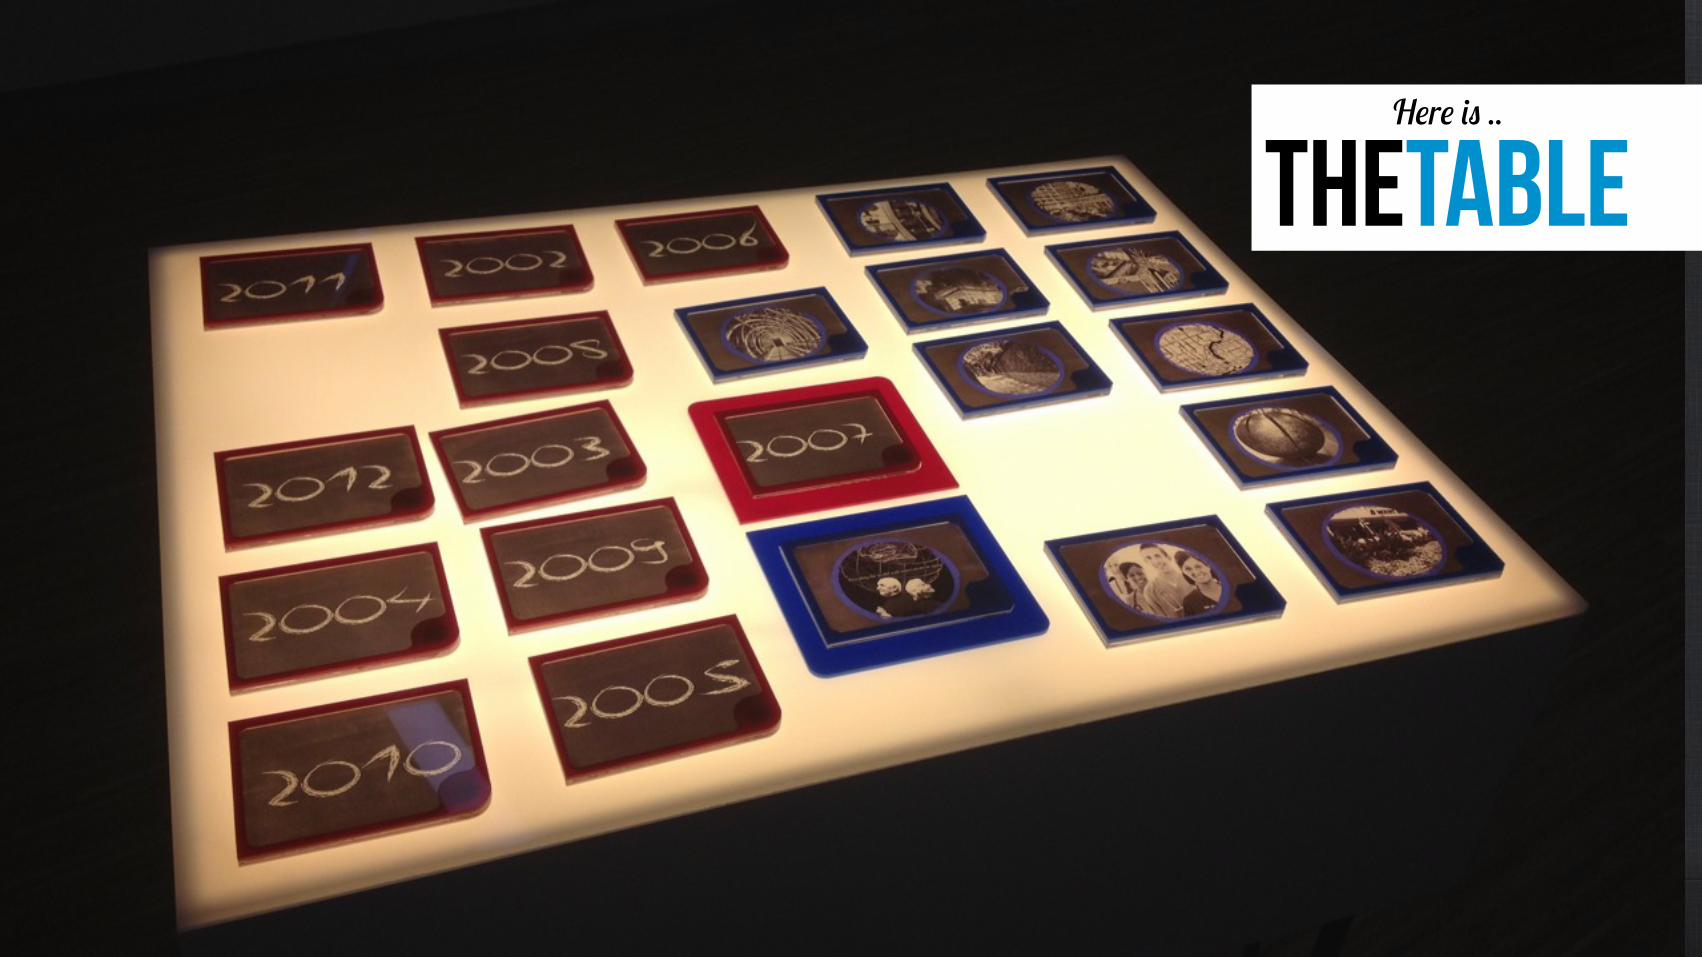
DescriptionThe red and blue rectangles are responsive surfaces. When the year and institution tokens are placed into these slots, RFID tags in the tokens trigger responses on the screen. For example, if an audience member uses the token from 2003 and pairs it with the image associated with St Michael’s Hospital the screen will change to show an image that reflects the amount of people who were new that year from that institution. It will also bring up a graph that showcases that particular institution and its number of connections with the CFD each year.
CFD 10 Y-$r) "f C"!!-(*'"!)
CFD 10 Y-$r) "f C"!!-(*'"!)
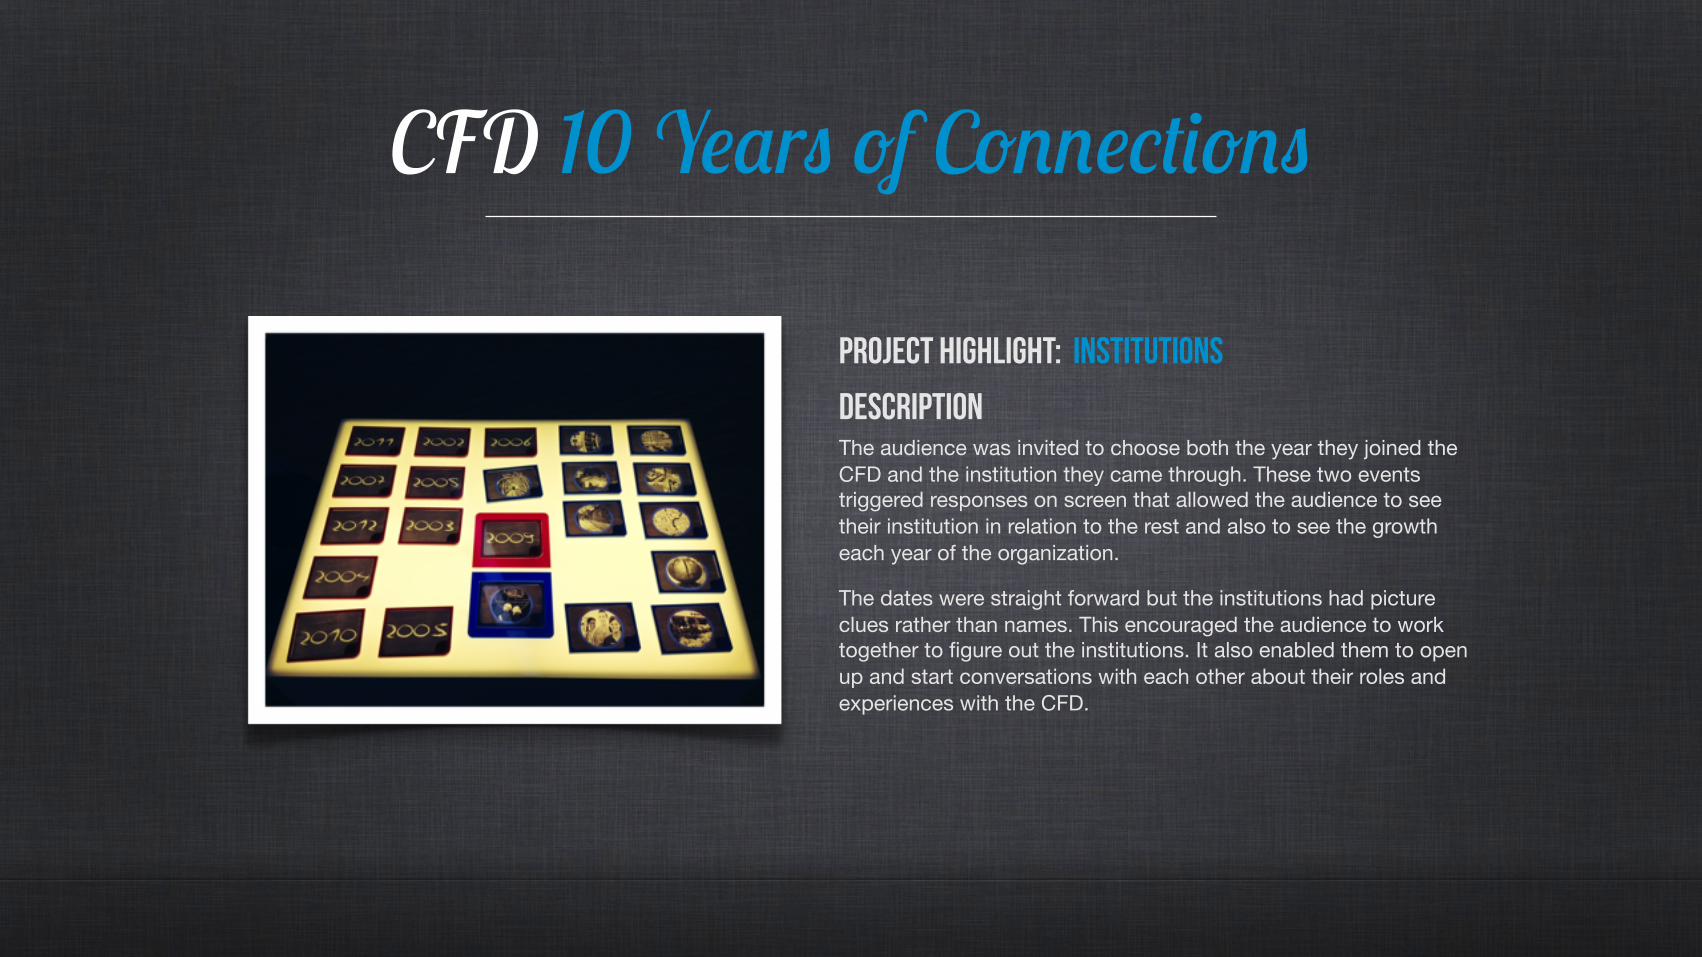
PROJECT HIghlight: institutions
DescriptionThe audience was invited to choose both the year they joined the CFD and the institution they came through. These two events triggered responses on screen that allowed the audience to see their institution in relation to the rest and also to see the growth each year of the organization.
The dates were straight forward but the institutions had picture clues rather than names. This encouraged the audience to work together to figure out the institutions. It also enabled them to open up and start conversations with each other about their roles and experiences with the CFD.
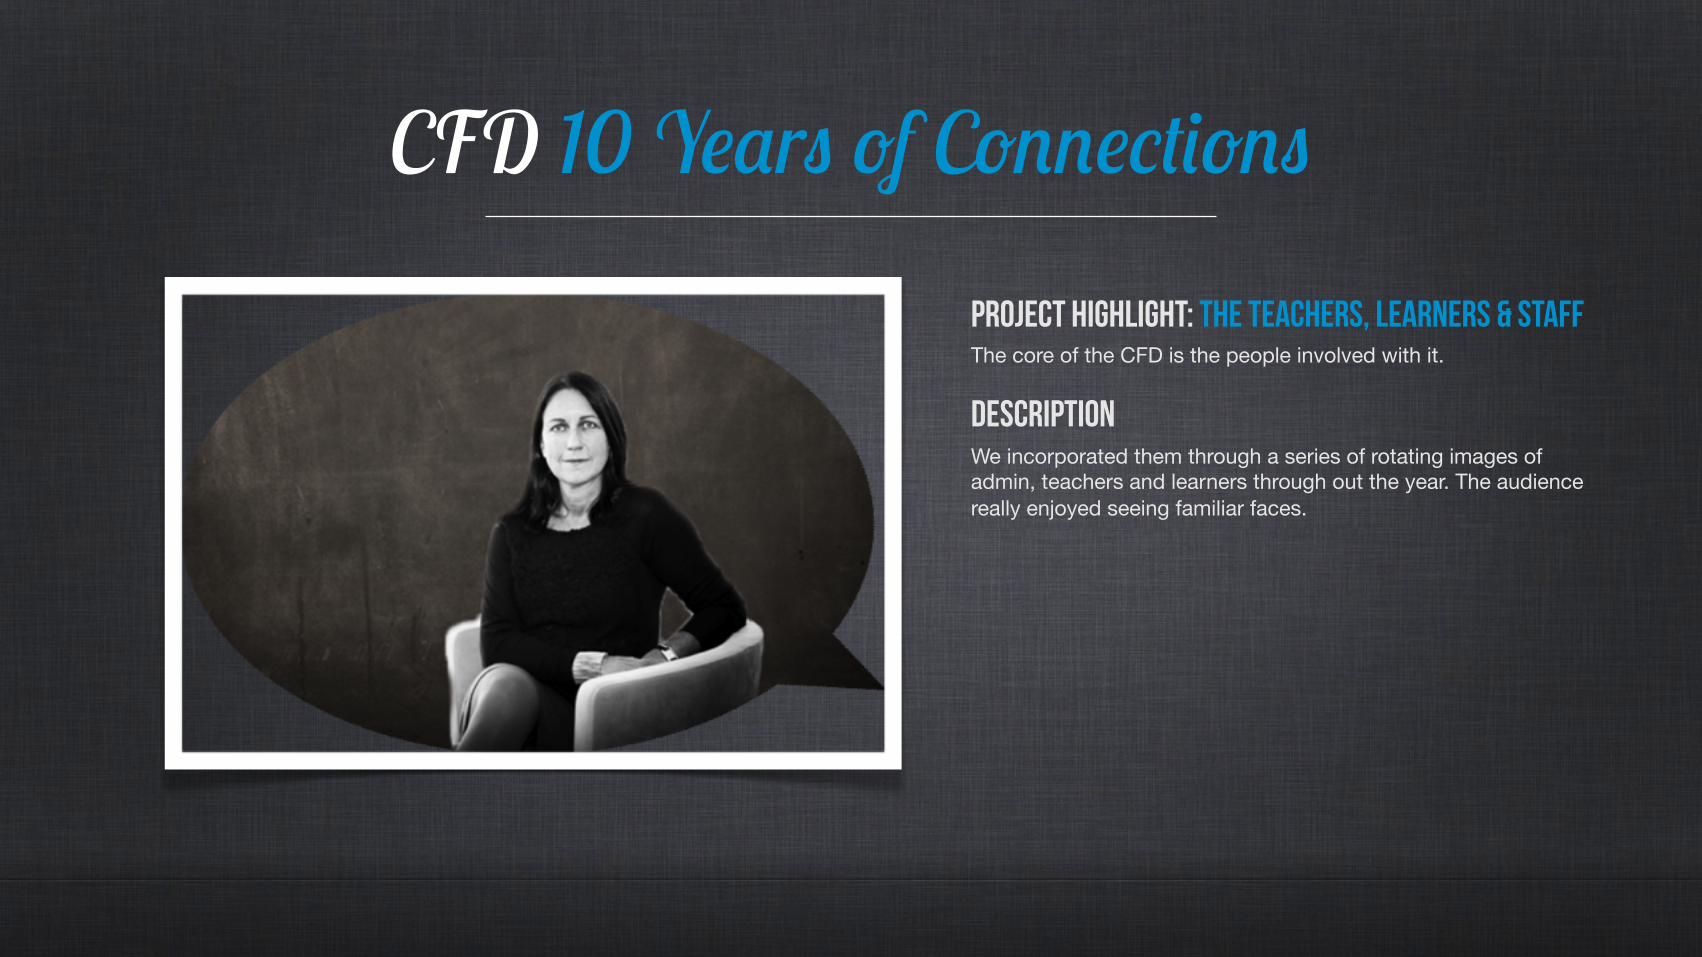
PROJECT HIghlight: The teachers, learners & staff The core of the CFD is the people involved with it.
DescriptionWe incorporated them through a series of rotating images of admin, teachers and learners through out the year. The audience really enjoyed seeing familiar faces.
CFD 10 Y-$r) "f C"!!-(*'"!)
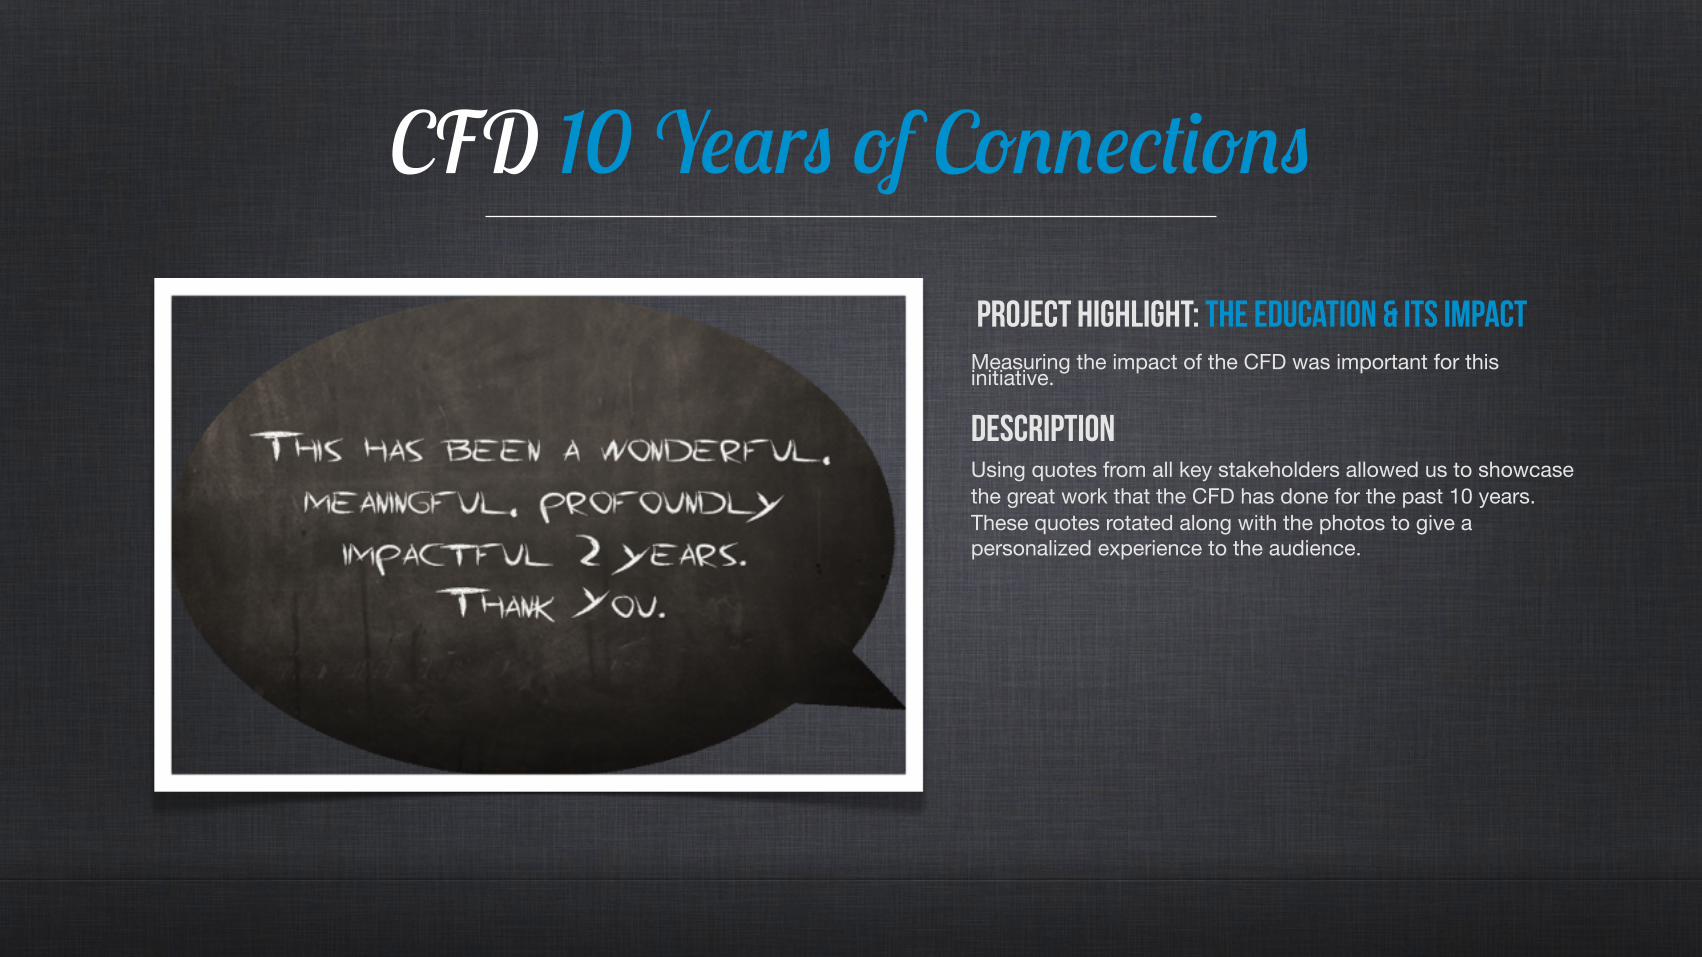
PROJECT HIghlight: The Education & its ImpactMeasuring the impact of the CFD was important for this initiative.
DescriptionUsing quotes from all key stakeholders allowed us to showcase the great work that the CFD has done for the past 10 years. These quotes rotated along with the photos to give a personalized experience to the audience.
CFD 10 Y-$r) "f C"!!-(*'"!)
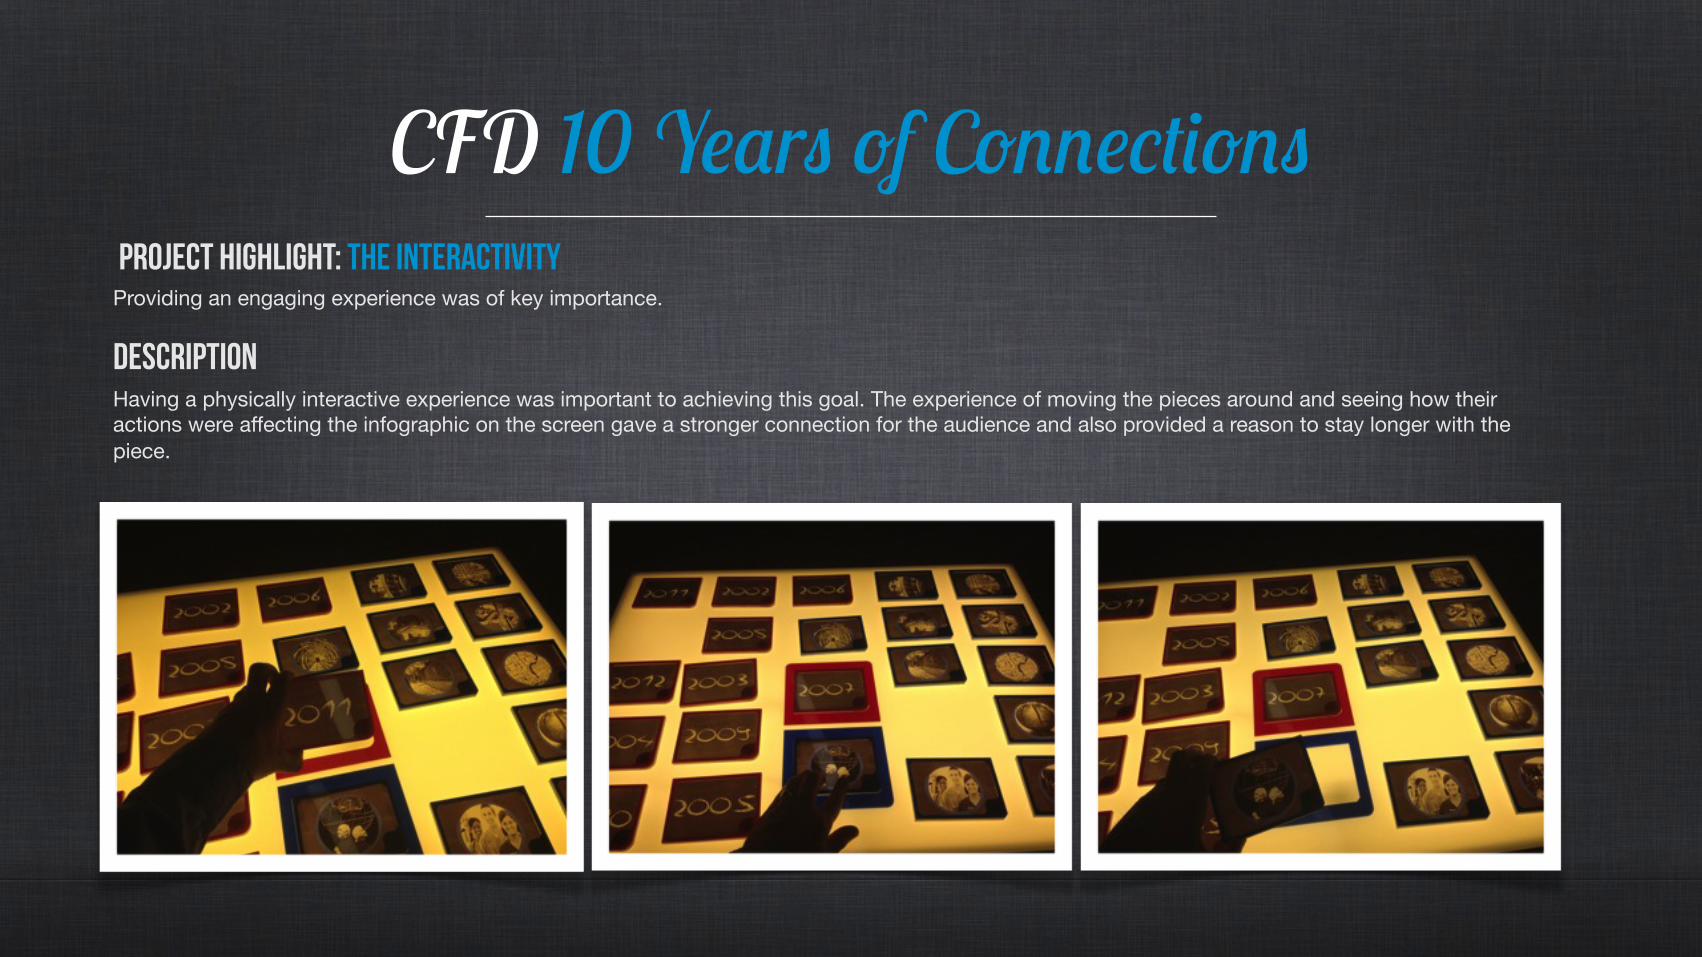
PROJECT HIghlight: The InteractivityProviding an engaging experience was of key importance.
DescriptionHaving a physically interactive experience was important to achieving this goal. The experience of moving the pieces around and seeing how their actions were affecting the infographic on the screen gave a stronger connection for the audience and also provided a reason to stay longer with the piece.
CFD 10 Y-$r) "f C"!!-(*'"!)
G$++-r0
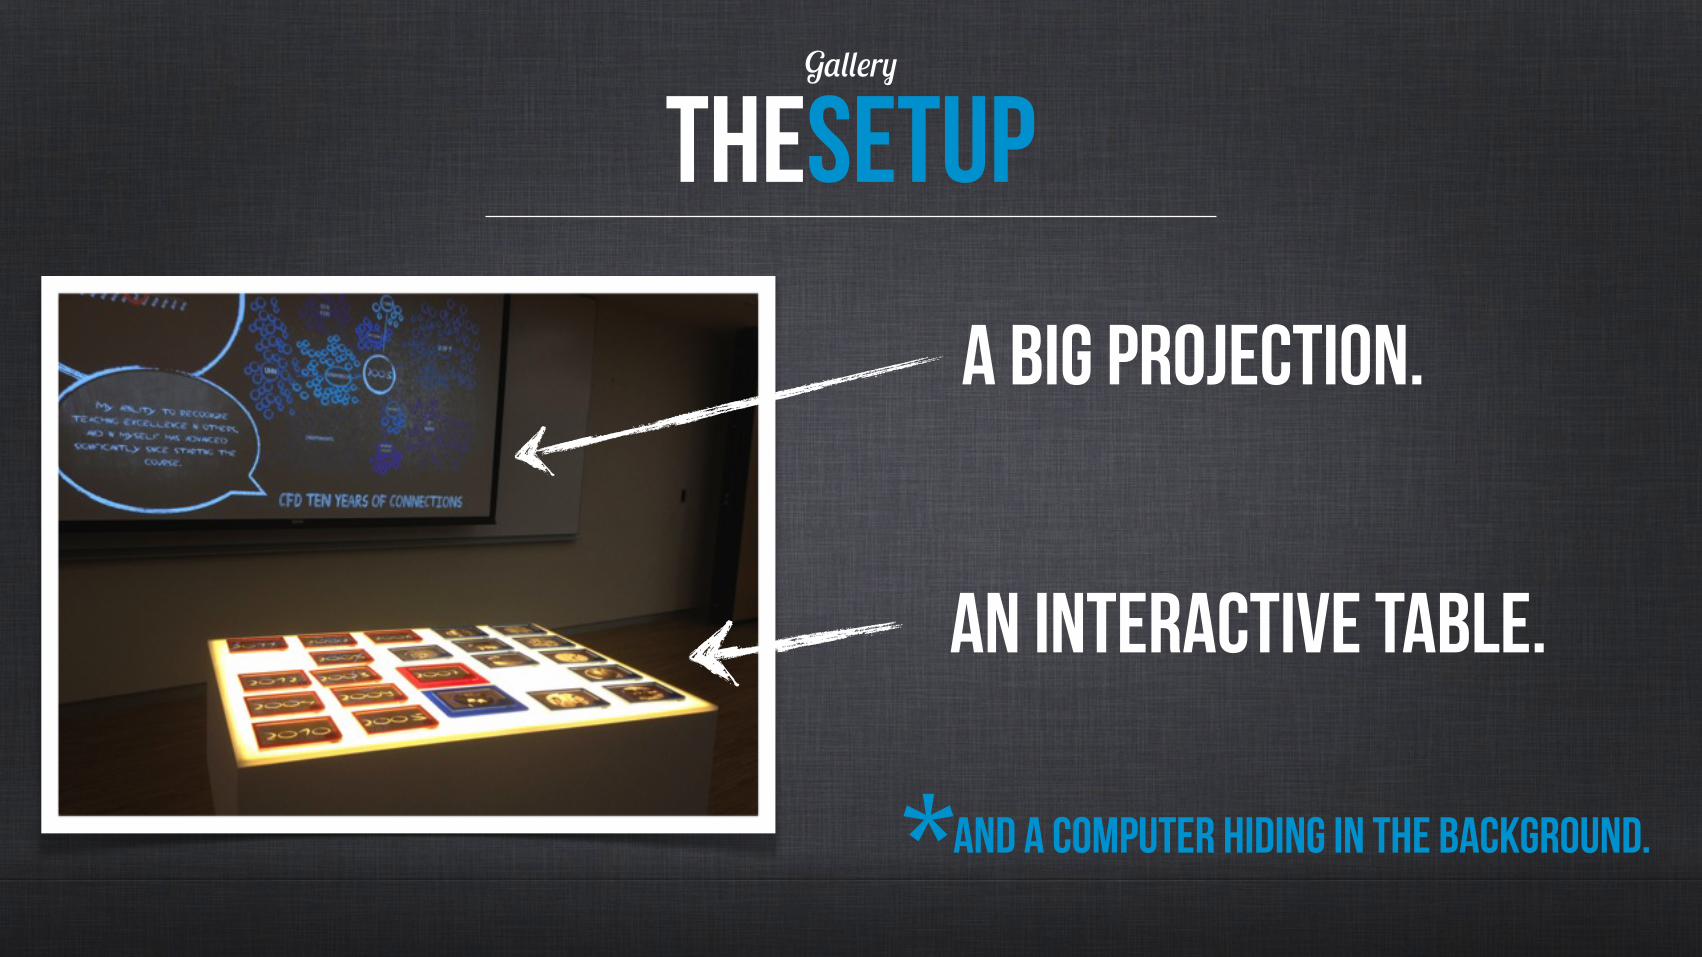
theSetup
A big projection.
an interactive table.
and a computer hiding in the background. *
G$++-r0
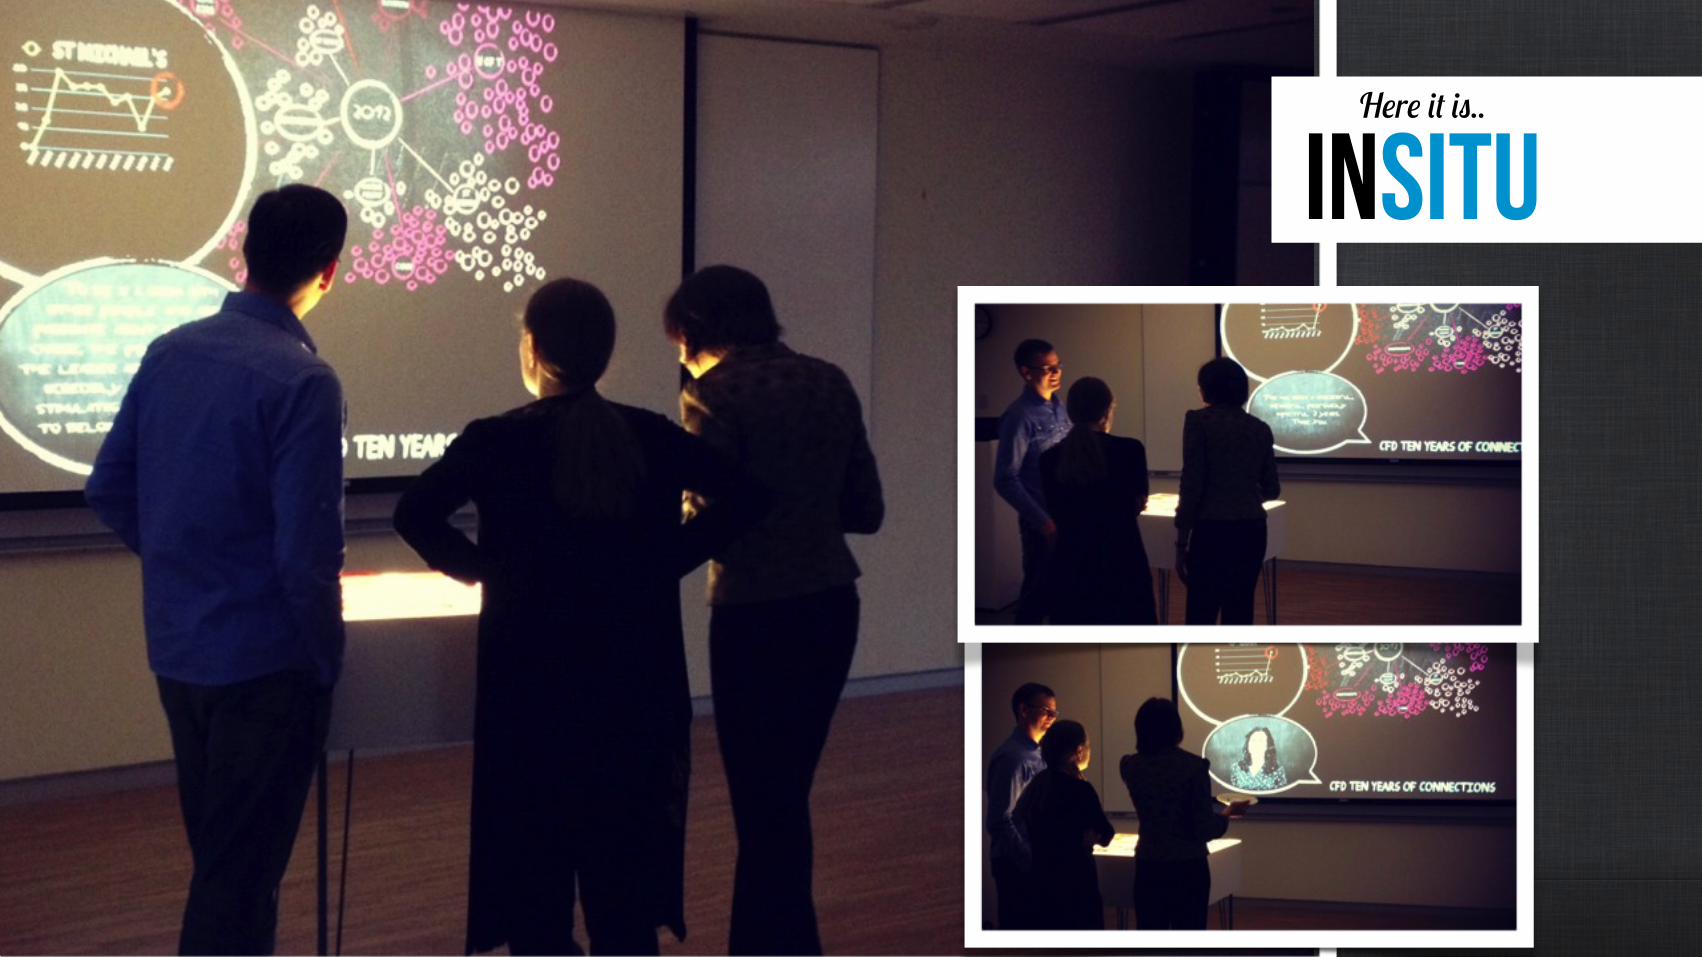
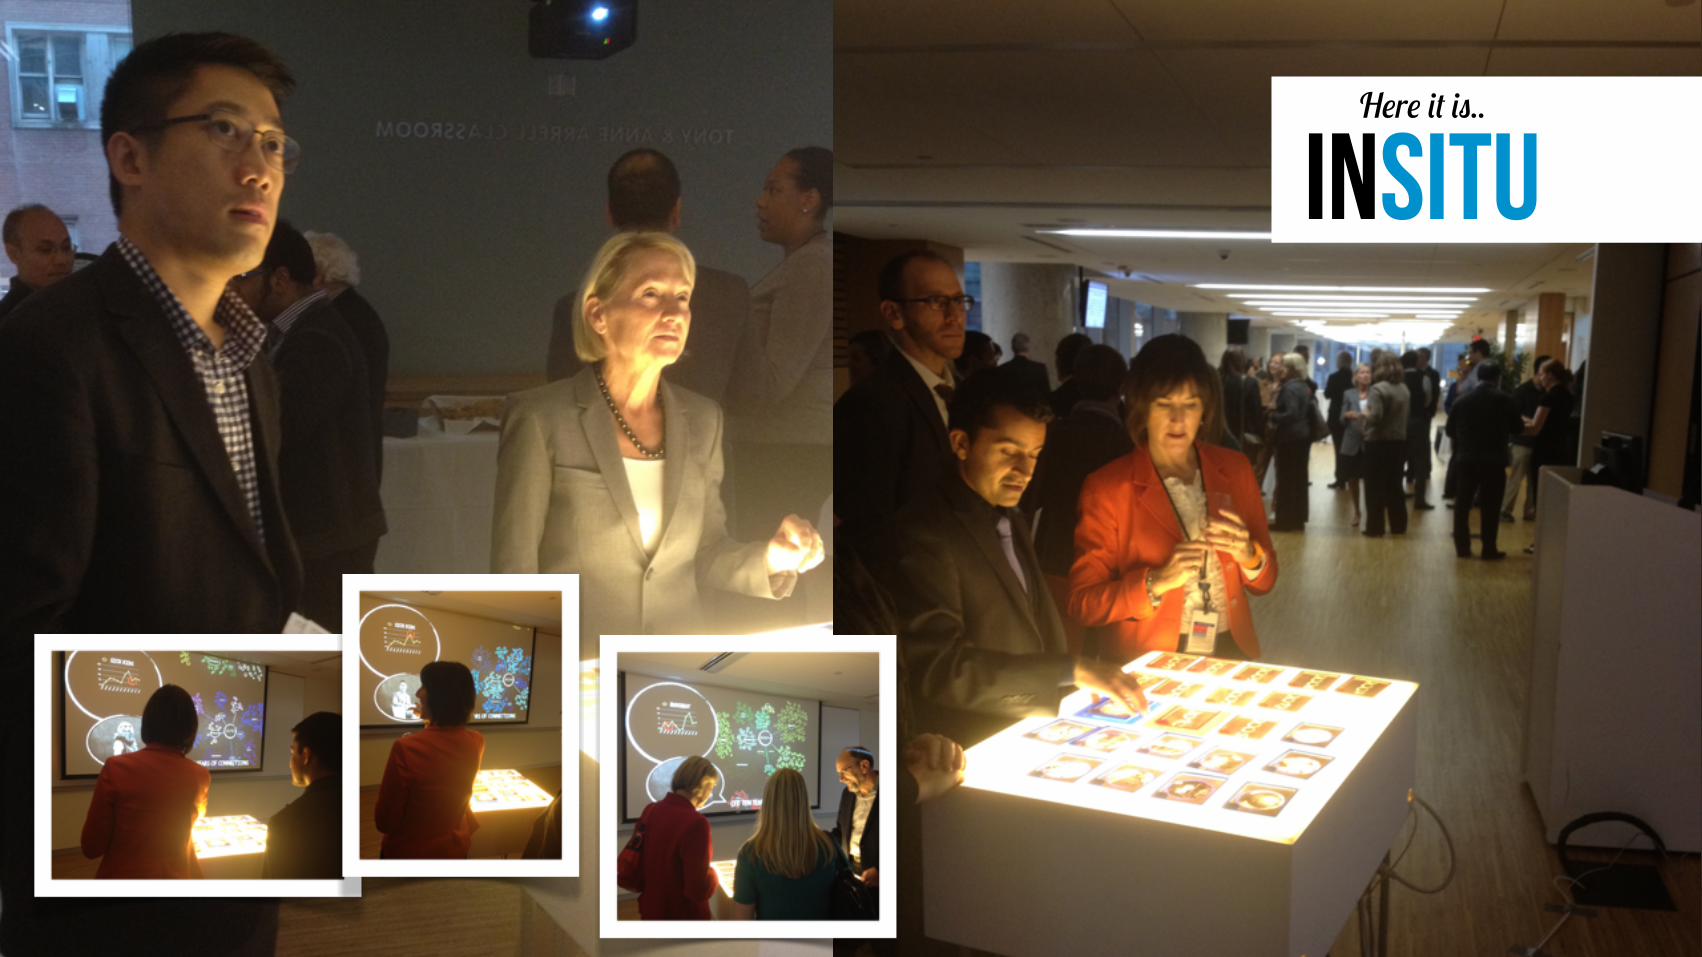
inSitu insituH-r- '* ')..
G$++-r0
inSitu insituH-r- '* ')..
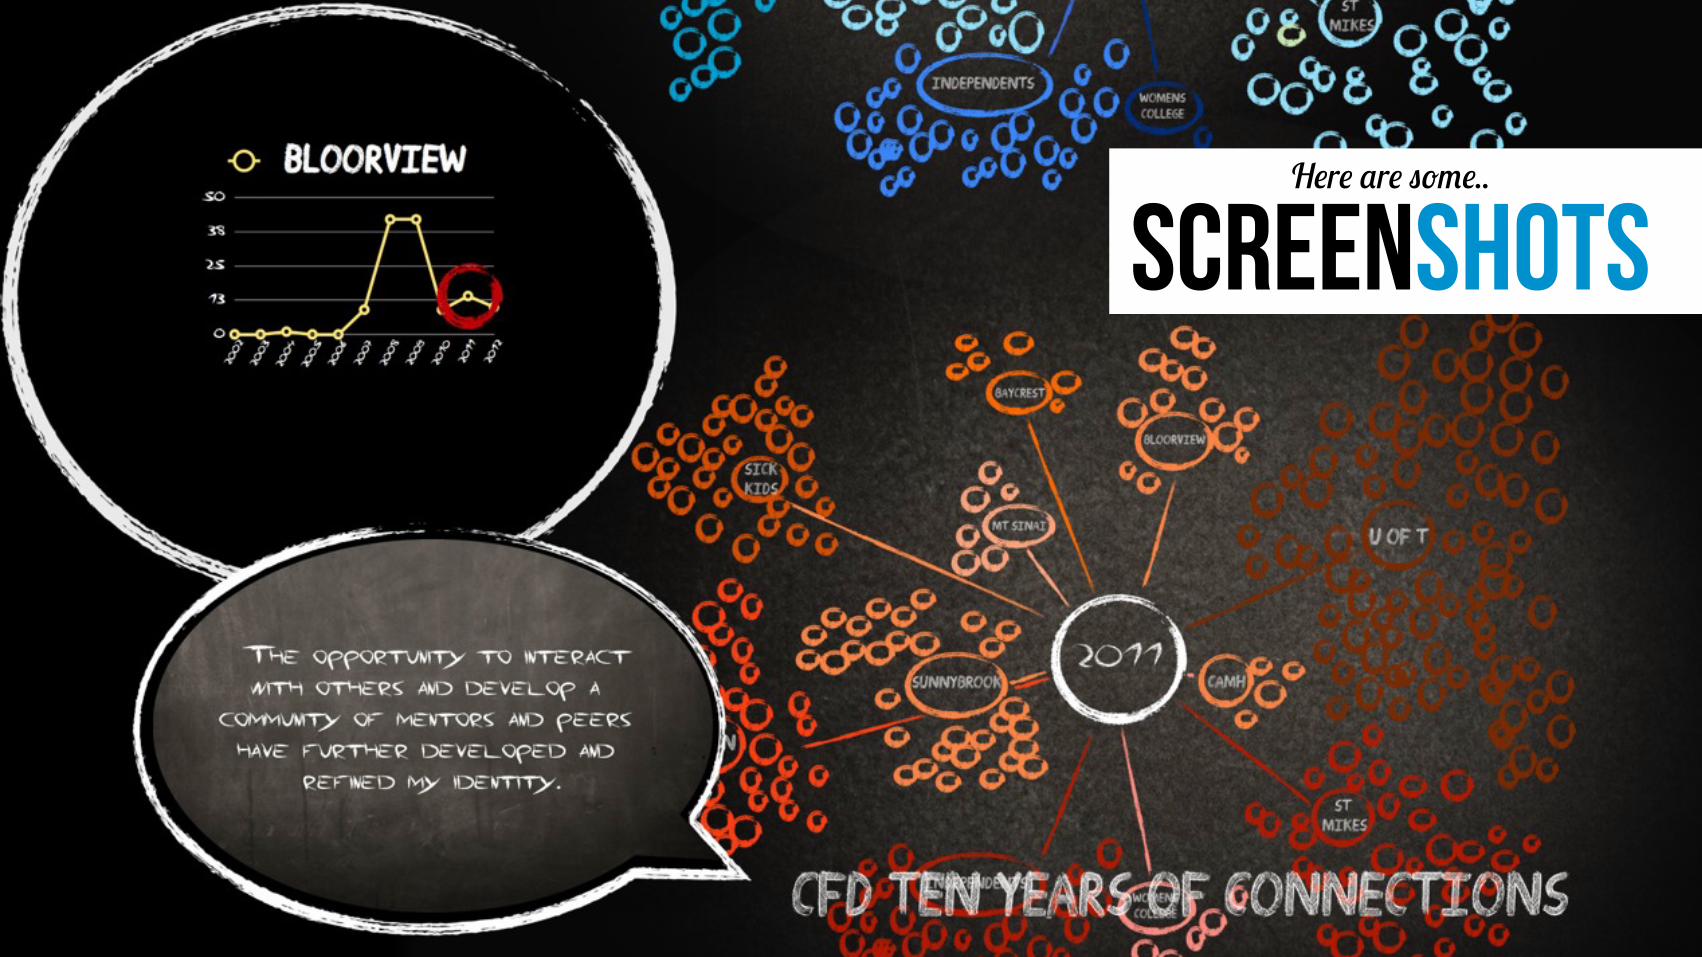
ScreenshotsH-r- $r- )"1-..
ScreenshotsH-r- $r- )"1-..
ScreenshotsH-r- $r- )"1-..
ScreenshotsH-r- $r- )"1-..
ScreenshotsH-r- $r- )"1-..
ScreenshotsH-r- $r- )"1-..
ScreenshotsH-r- $r- )"1-..
thetableH-r- ') ..
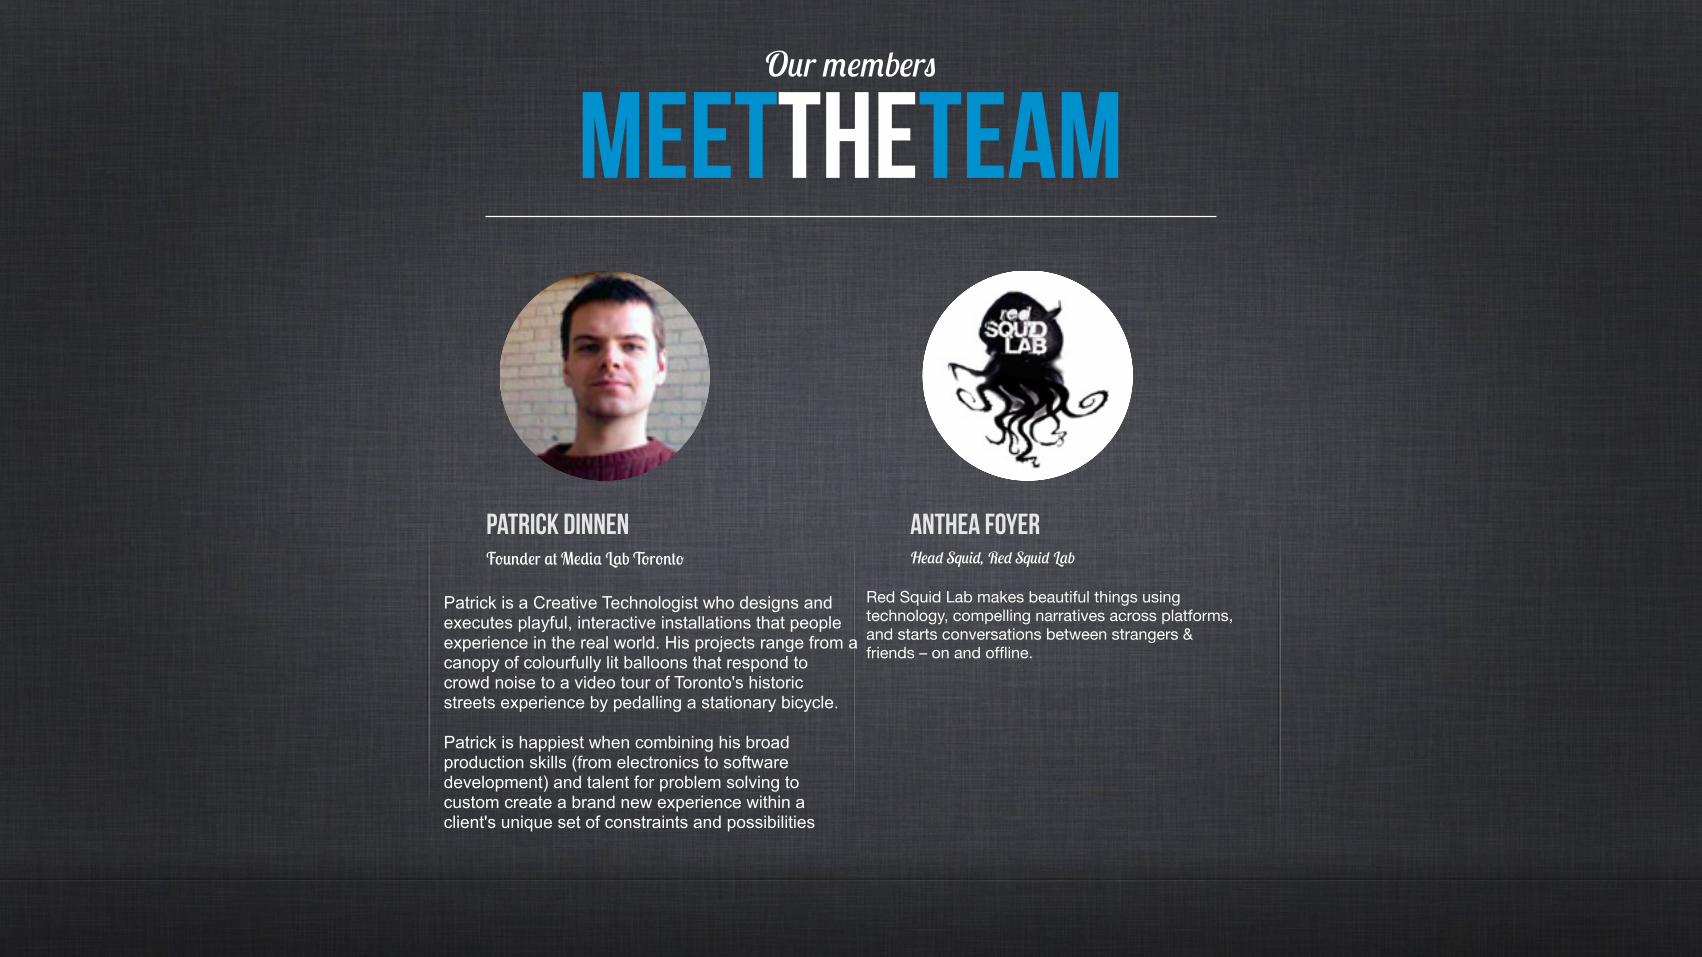
Anthea Foyer H-$/ Sq,'/, R-/ Sq,'/ L$b
Red Squid Lab makes beautiful things using technology, compelling narratives across platforms, and starts conversations between strangers & friends – on and offline.
Patrick DinnenF!"#$%r &' M%$(& L&b T!r!#'!
Patrick is a Creative Technologist who designs and executes playful, interactive installations that people experience in the real world. His projects range from a canopy of colourfully lit balloons that respond to crowd noise to a video tour of Toronto's historic streets experience by pedalling a stationary bicycle.
Patrick is happiest when combining his broad production skills (from electronics to software development) and talent for problem solving to custom create a brand new experience within a client's unique set of constraints and possibilities
MeettheteamO,r 1-1b-r)
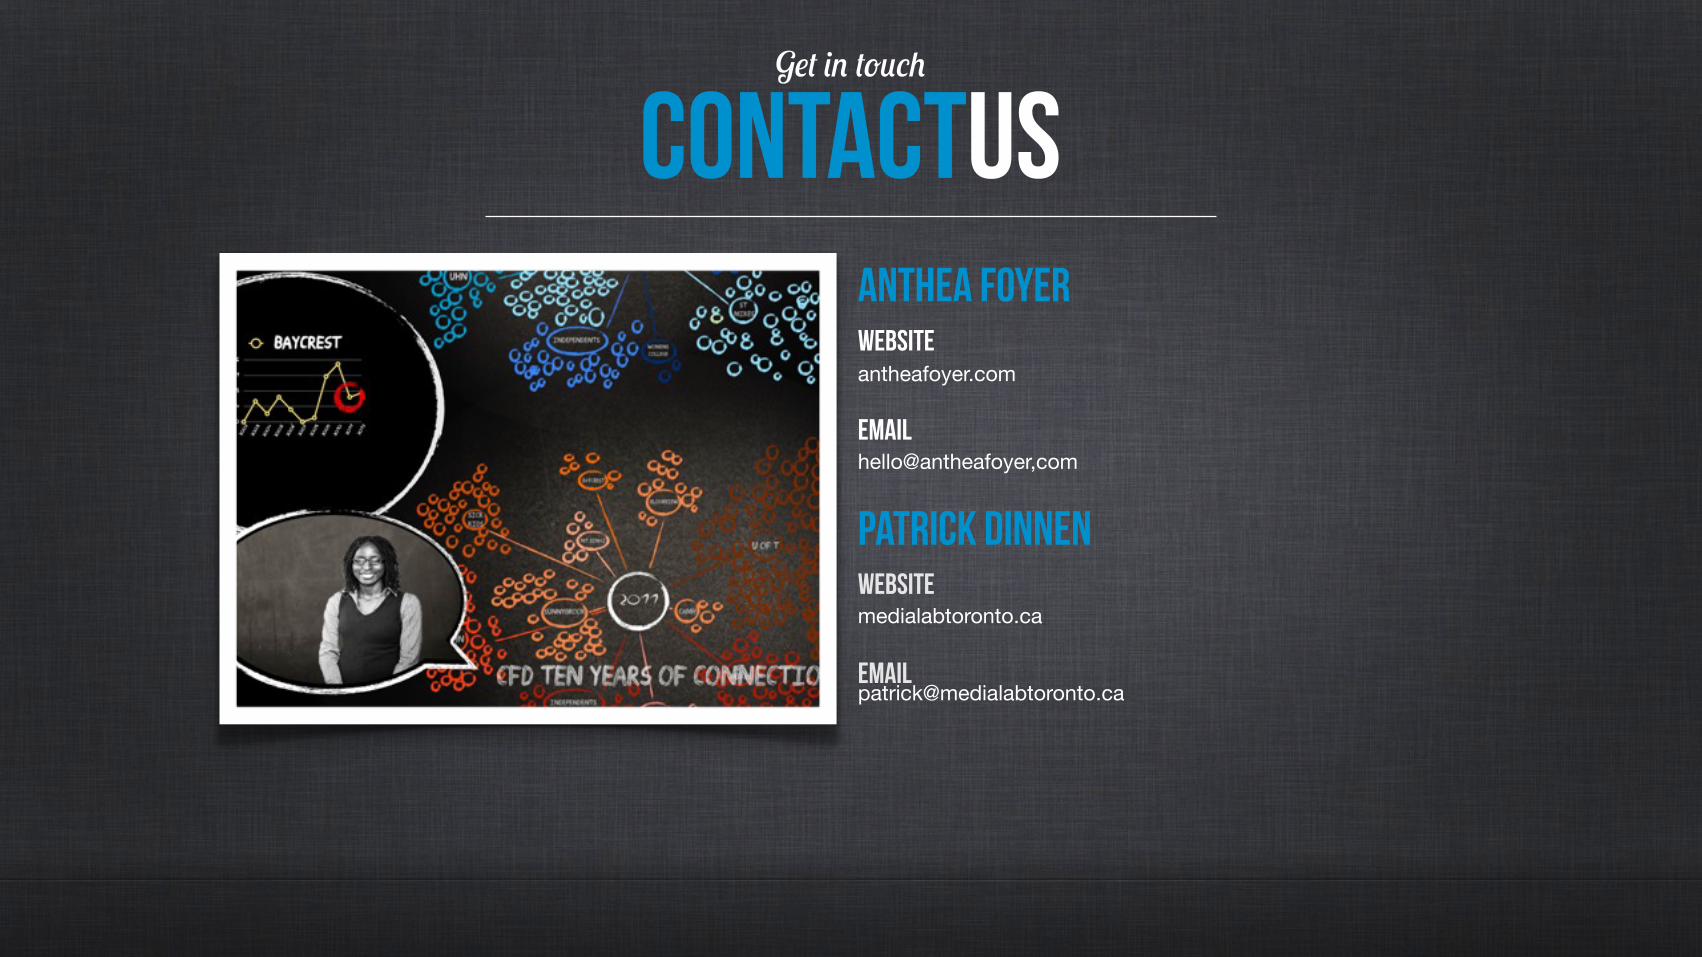
ContactUsG-* '! *",(&
Anthea foyerWebsiteantheafoyer.com
Emailhello@antheafoyer,com
Patrick DinnenWebsitemedialabtoronto.ca