Embed Size (px)
Citation preview
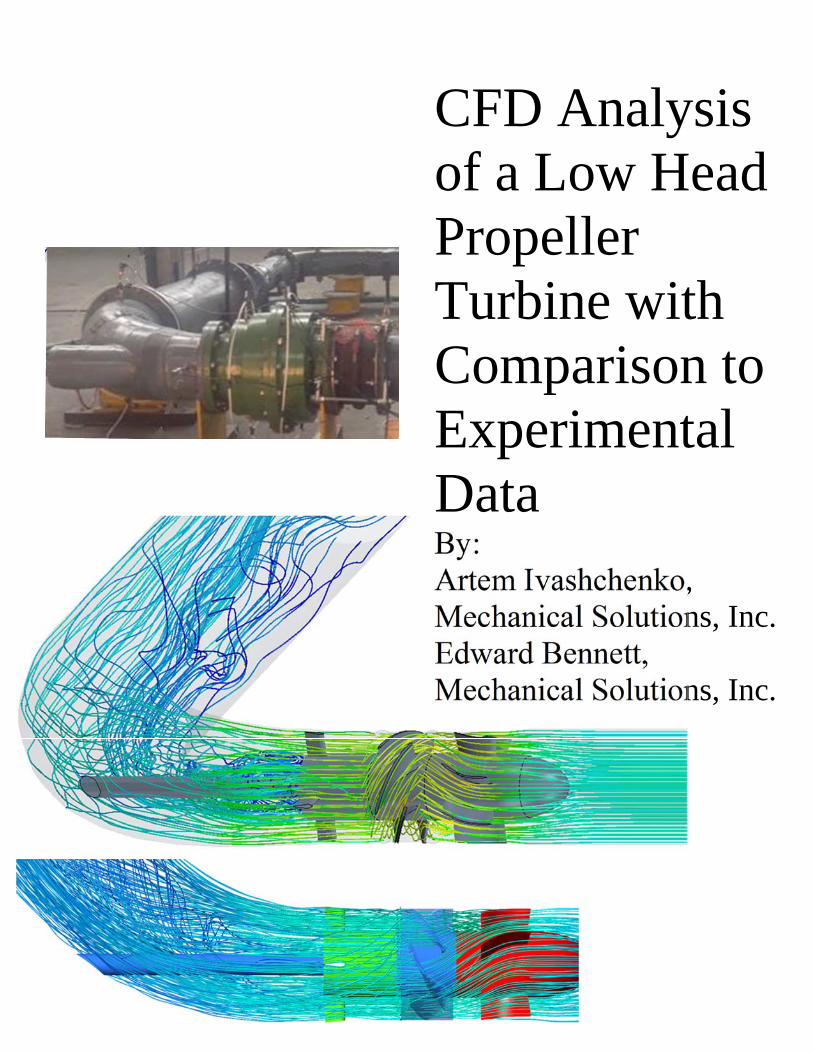
CFD Analysis of a Low Head Propeller Turbine with Comparison to Experimental Data By: Artem Ivashchenko, Mechanical Solutions, Inc.Edward Bennett, Mechanical Solutions, Inc.

1
CFD Analysis of a Low Head Propeller Turbine with Comparison to Experimental Data
By: Artem Ivashchenko, P.E., and Edward M. Bennett, Ph.D.
Mechanical Solutions, Inc., USA
Prepared for: HydroVision 2017
ABSTRACT Mechanical Solutions, Inc. (MSI) was contracted to perform several CFD analyses of an axial hydroturbine, with the purpose of validating the experimental data obtained by a hydroturbine test loop. The turbine in question was an axial turbine with a generator integrated into the runner shroud, designed as a single unit that could be dropped into a suitably-sized pipe. Additionally, MSI was to suggest possible modifications to the turbine geometry based on the results of the CFD analyses. MSI employed two CFD codes, ANSYS CFX and STAR-CCM+, which were used to conduct several transient analyses, three of which are detailed in this paper. The results of the transient analyses revealed good correlation between the numerical predictions and the experimental data. Both codes closely predicted the pressures measured by the physical pressure taps in the turbine. However, both codes consistently overpredicted the torque extracted by the turbine, and, as a result, the turbine efficiency. The predictions from STAR-CCM+ for turbine efficiency were consistently closer to the experimental results than those made by CFX. The majority of the torque losses occurred in the annular cavity above the runner shroud formed by the generator, where viscous drag on the rotating surfaces nullified 12% of the torque produced by the runner blades at the target operating conditions. An effort should thus be made to minimize the shroud diameter and axial length of the runner portion of the generator to minimize the losses due to drag. On the other hand, the draft tube and stay vane sections represented relatively minor sources of pressure losses for this configuration, and the drag on the exposed shaft in the draft tube was minimal.
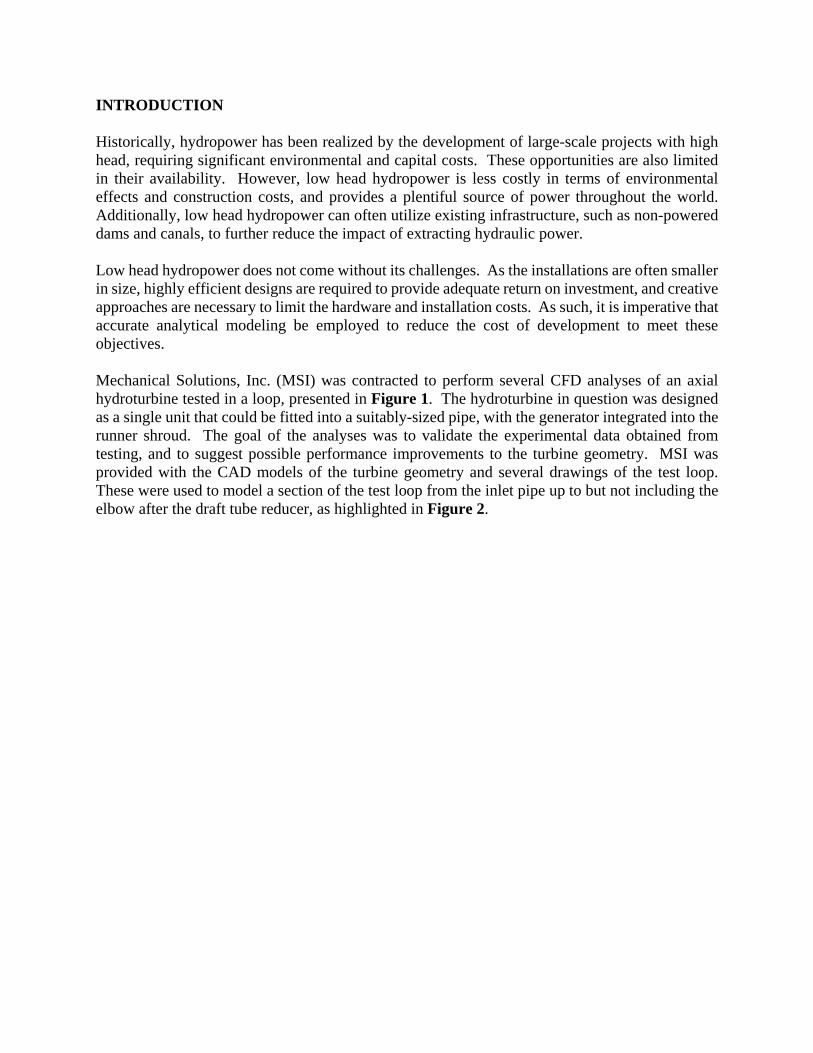
INTRODUCTION Historically, hydropower has been realized by the development of large-scale projects with high head, requiring significant environmental and capital costs. These opportunities are also limited in their availability. However, low head hydropower is less costly in terms of environmental effects and construction costs, and provides a plentiful source of power throughout the world. Additionally, low head hydropower can often utilize existing infrastructure, such as non-powered dams and canals, to further reduce the impact of extracting hydraulic power. Low head hydropower does not come without its challenges. As the installations are often smaller in size, highly efficient designs are required to provide adequate return on investment, and creative approaches are necessary to limit the hardware and installation costs. As such, it is imperative that accurate analytical modeling be employed to reduce the cost of development to meet these objectives. Mechanical Solutions, Inc. (MSI) was contracted to perform several CFD analyses of an axial hydroturbine tested in a loop, presented in Figure 1. The hydroturbine in question was designed as a single unit that could be fitted into a suitably-sized pipe, with the generator integrated into the runner shroud. The goal of the analyses was to validate the experimental data obtained from testing, and to suggest possible performance improvements to the turbine geometry. MSI was provided with the CAD models of the turbine geometry and several drawings of the test loop. These were used to model a section of the test loop from the inlet pipe up to but not including the elbow after the draft tube reducer, as highlighted in Figure 2.
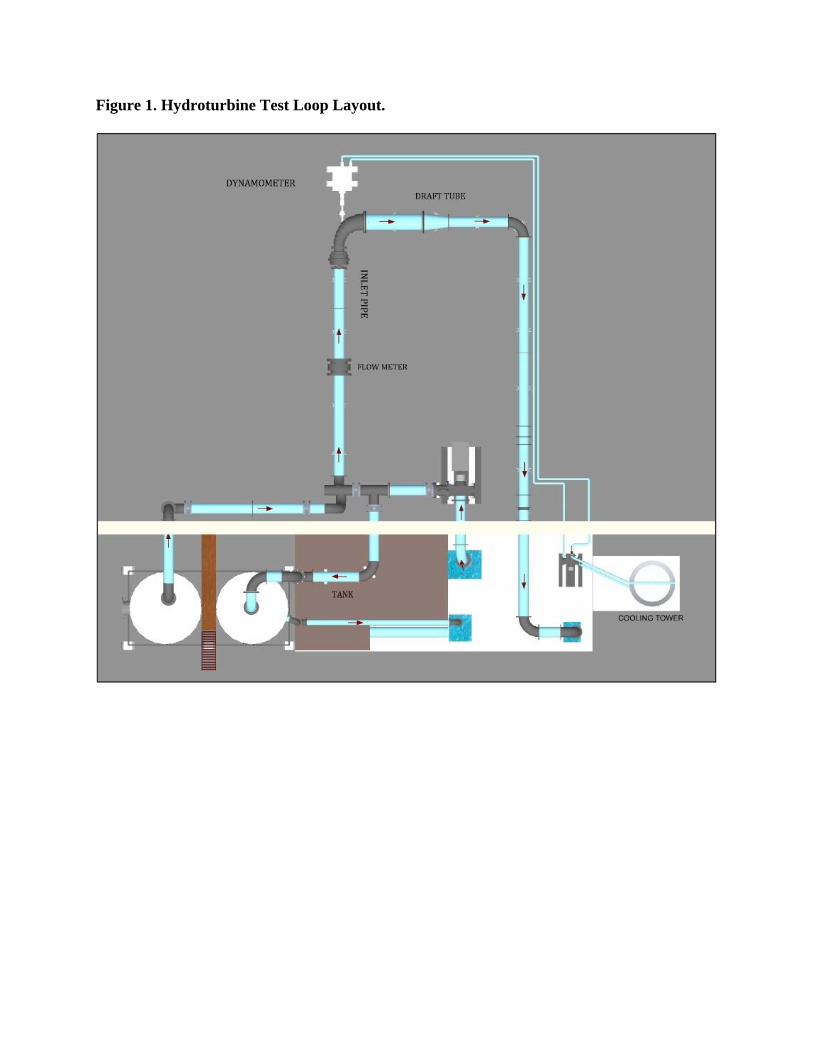
Figure 1. Hydroturbine Test Loop Layout.
Figure 2. The Boundaries of the CFD Model.
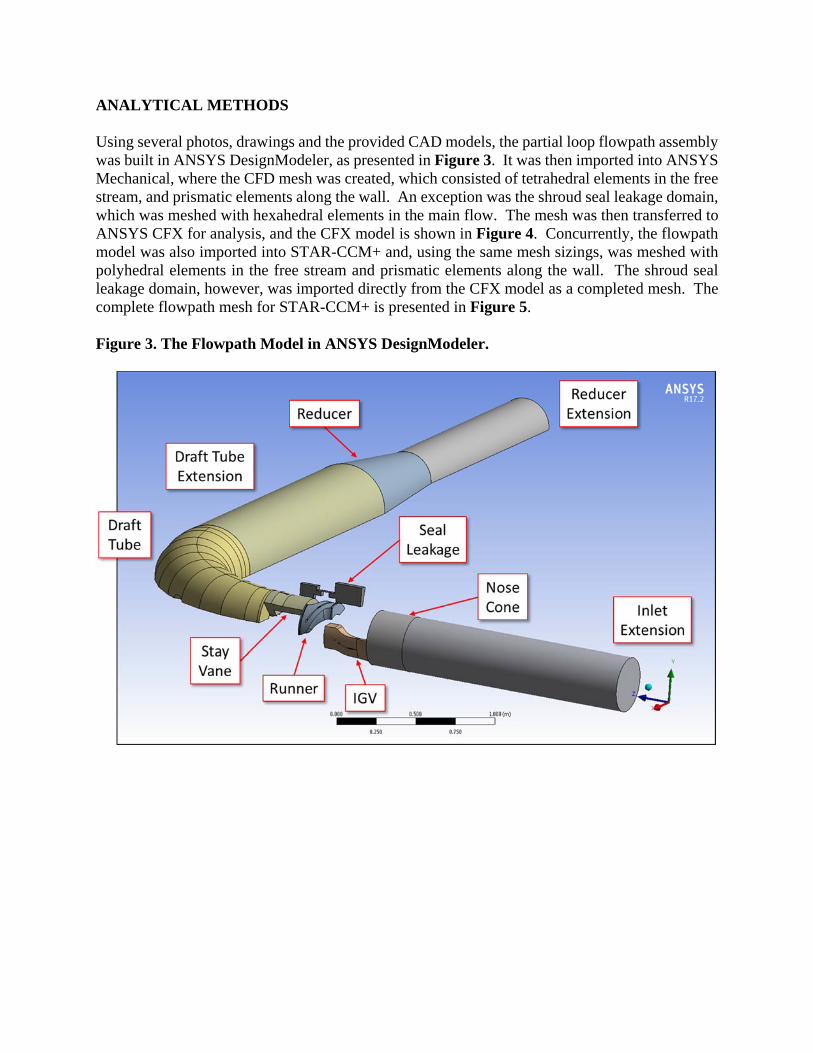
ANALYTICAL METHODS Using several photos, drawings and the provided CAD models, the partial loop flowpath assembly was built in ANSYS DesignModeler, as presented in Figure 3. It was then imported into ANSYS Mechanical, where the CFD mesh was created, which consisted of tetrahedral elements in the free stream, and prismatic elements along the wall. An exception was the shroud seal leakage domain, which was meshed with hexahedral elements in the main flow. The mesh was then transferred to ANSYS CFX for analysis, and the CFX model is shown in Figure 4. Concurrently, the flowpath model was also imported into STAR-CCM+ and, using the same mesh sizings, was meshed with polyhedral elements in the free stream and prismatic elements along the wall. The shroud seal leakage domain, however, was imported directly from the CFX model as a completed mesh. The complete flowpath mesh for STAR-CCM+ is presented in Figure 5. Figure 3. The Flowpath Model in ANSYS DesignModeler.
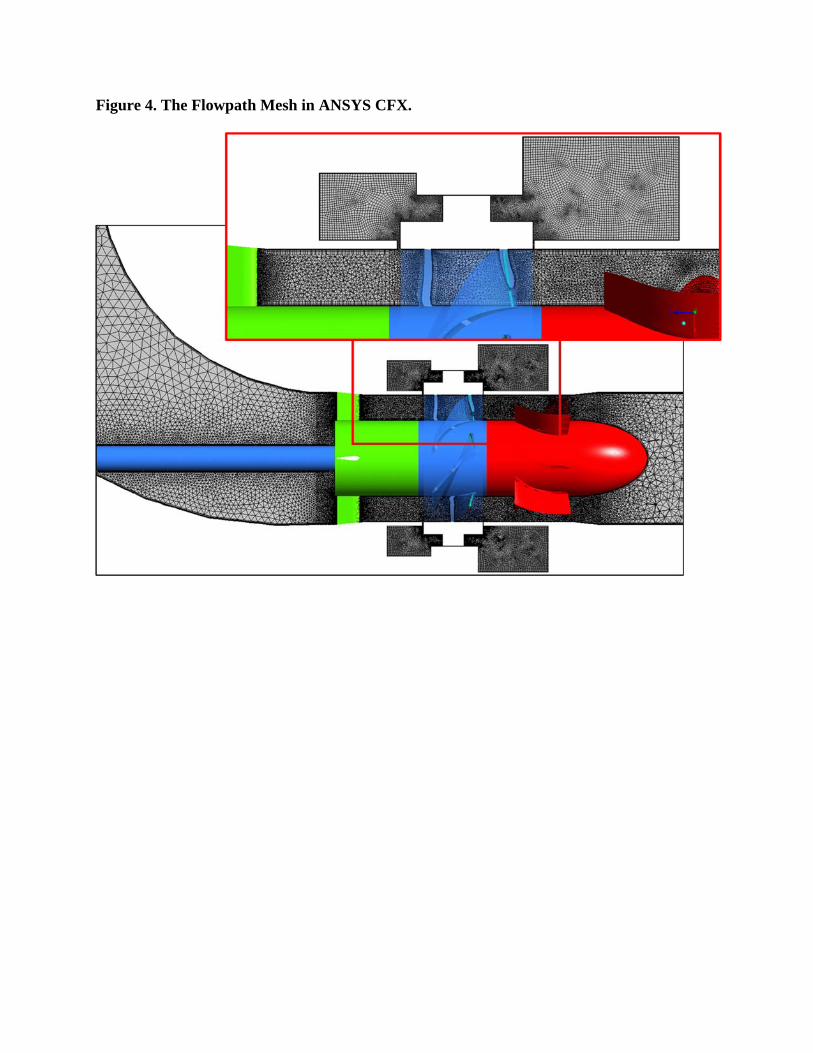
Figure 4. The Flowpath Mesh in ANSYS CFX.
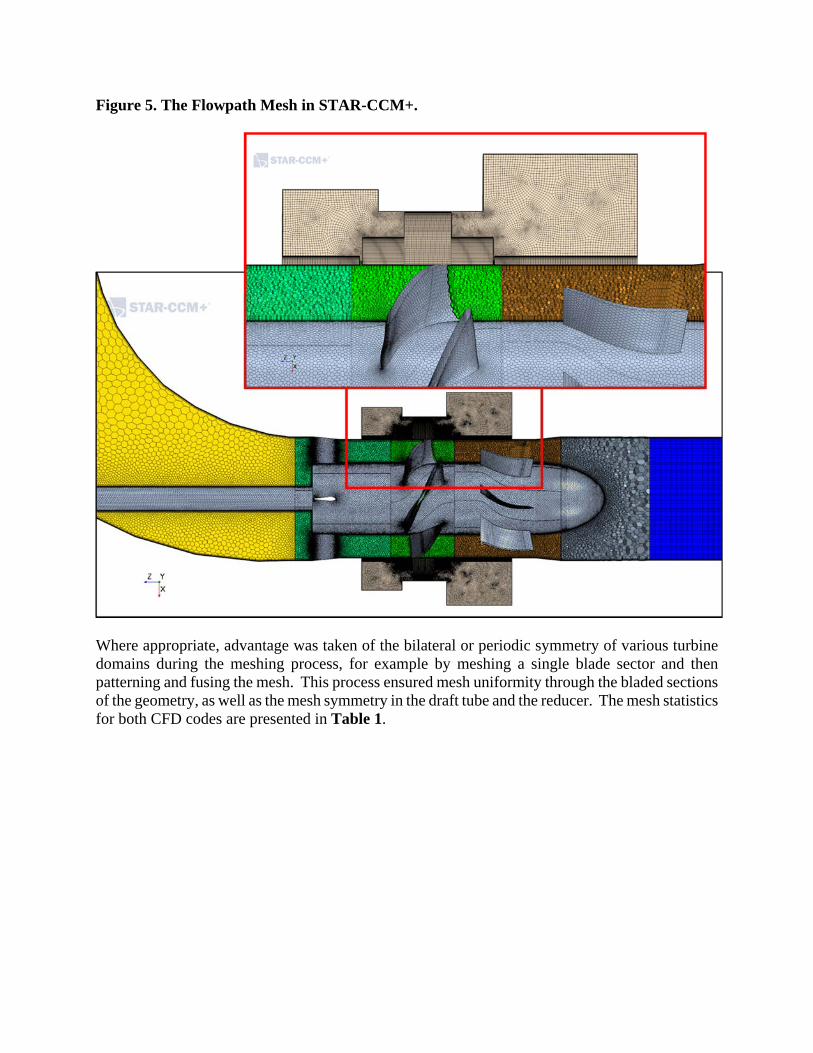
Figure 5. The Flowpath Mesh in STAR-CCM+.
Where appropriate, advantage was taken of the bilateral or periodic symmetry of various turbine domains during the meshing process, for example by meshing a single blade sector and then patterning and fusing the mesh. This process ensured mesh uniformity through the bladed sections of the geometry, as well as the mesh symmetry in the draft tube and the reducer. The mesh statistics for both CFD codes are presented in Table 1.
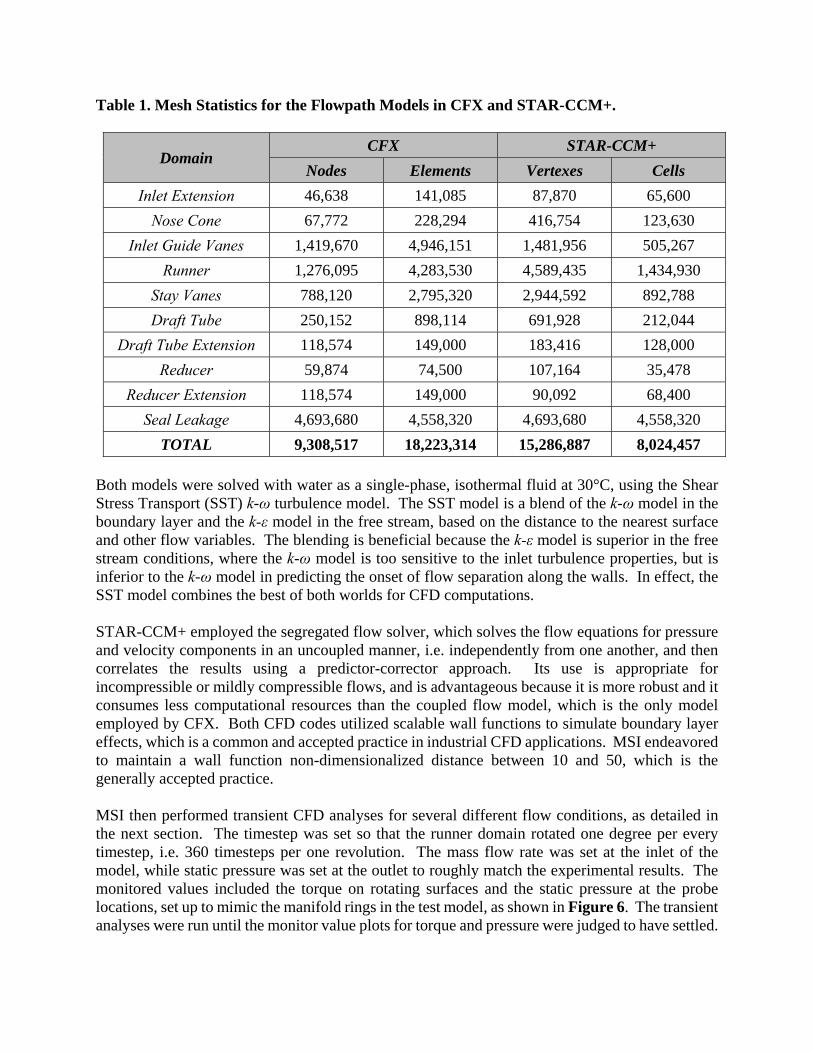
Table 1. Mesh Statistics for the Flowpath Models in CFX and STAR-CCM+.
Domain CFX STAR-CCM+
Nodes Elements Vertexes Cells
Inlet Extension 46,638 141,085 87,870 65,600
Nose Cone 67,772 228,294 416,754 123,630
Inlet Guide Vanes 1,419,670 4,946,151 1,481,956 505,267
Runner 1,276,095 4,283,530 4,589,435 1,434,930
Stay Vanes 788,120 2,795,320 2,944,592 892,788
Draft Tube 250,152 898,114 691,928 212,044
Draft Tube Extension 118,574 149,000 183,416 128,000
Reducer 59,874 74,500 107,164 35,478
Reducer Extension 118,574 149,000 90,092 68,400
Seal Leakage 4,693,680 4,558,320 4,693,680 4,558,320
TOTAL 9,308,517 18,223,314 15,286,887 8,024,457 Both models were solved with water as a single-phase, isothermal fluid at 30°C, using the Shear Stress Transport (SST) k-ω turbulence model. The SST model is a blend of the k-ω model in the boundary layer and the k-ε model in the free stream, based on the distance to the nearest surface and other flow variables. The blending is beneficial because the k-ε model is superior in the free stream conditions, where the k-ω model is too sensitive to the inlet turbulence properties, but is inferior to the k-ω model in predicting the onset of flow separation along the walls. In effect, the SST model combines the best of both worlds for CFD computations. STAR-CCM+ employed the segregated flow solver, which solves the flow equations for pressure and velocity components in an uncoupled manner, i.e. independently from one another, and then correlates the results using a predictor-corrector approach. Its use is appropriate for incompressible or mildly compressible flows, and is advantageous because it is more robust and it consumes less computational resources than the coupled flow model, which is the only model employed by CFX. Both CFD codes utilized scalable wall functions to simulate boundary layer effects, which is a common and accepted practice in industrial CFD applications. MSI endeavored to maintain a wall function non-dimensionalized distance between 10 and 50, which is the generally accepted practice. MSI then performed transient CFD analyses for several different flow conditions, as detailed in the next section. The timestep was set so that the runner domain rotated one degree per every timestep, i.e. 360 timesteps per one revolution. The mass flow rate was set at the inlet of the model, while static pressure was set at the outlet to roughly match the experimental results. The monitored values included the torque on rotating surfaces and the static pressure at the probe locations, set up to mimic the manifold rings in the test model, as shown in Figure 6. The transient analyses were run until the monitor value plots for torque and pressure were judged to have settled.
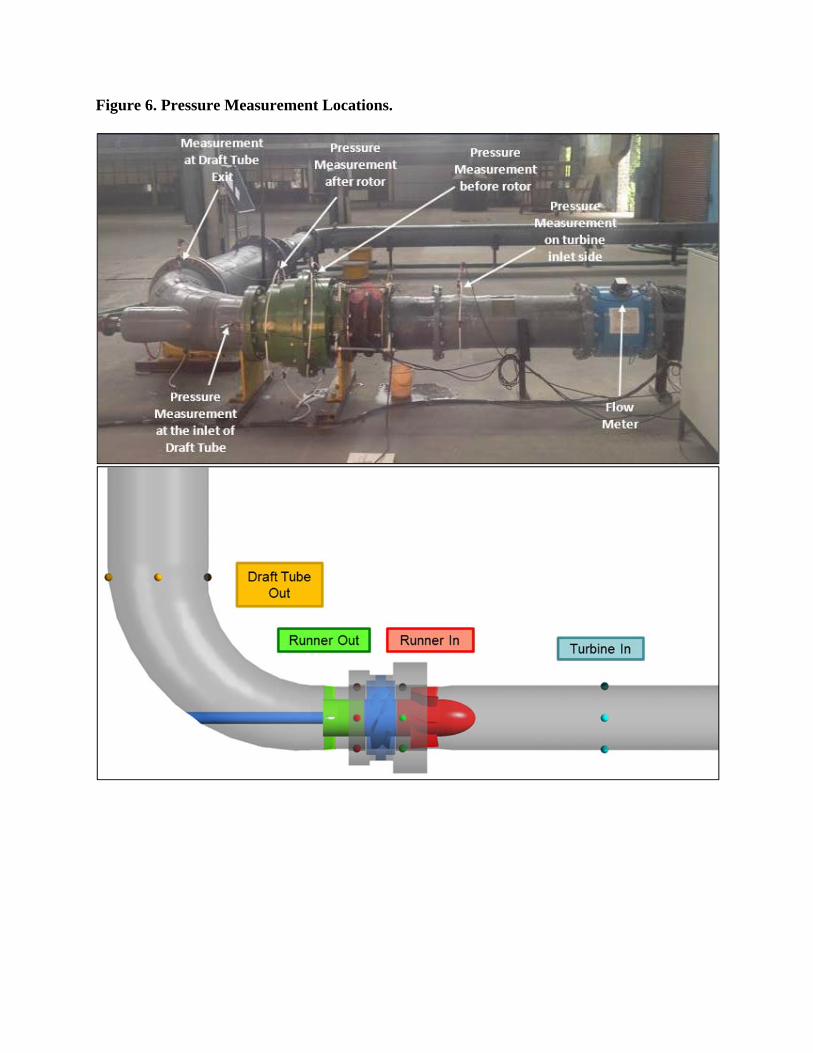
Figure 6. Pressure Measurement Locations.
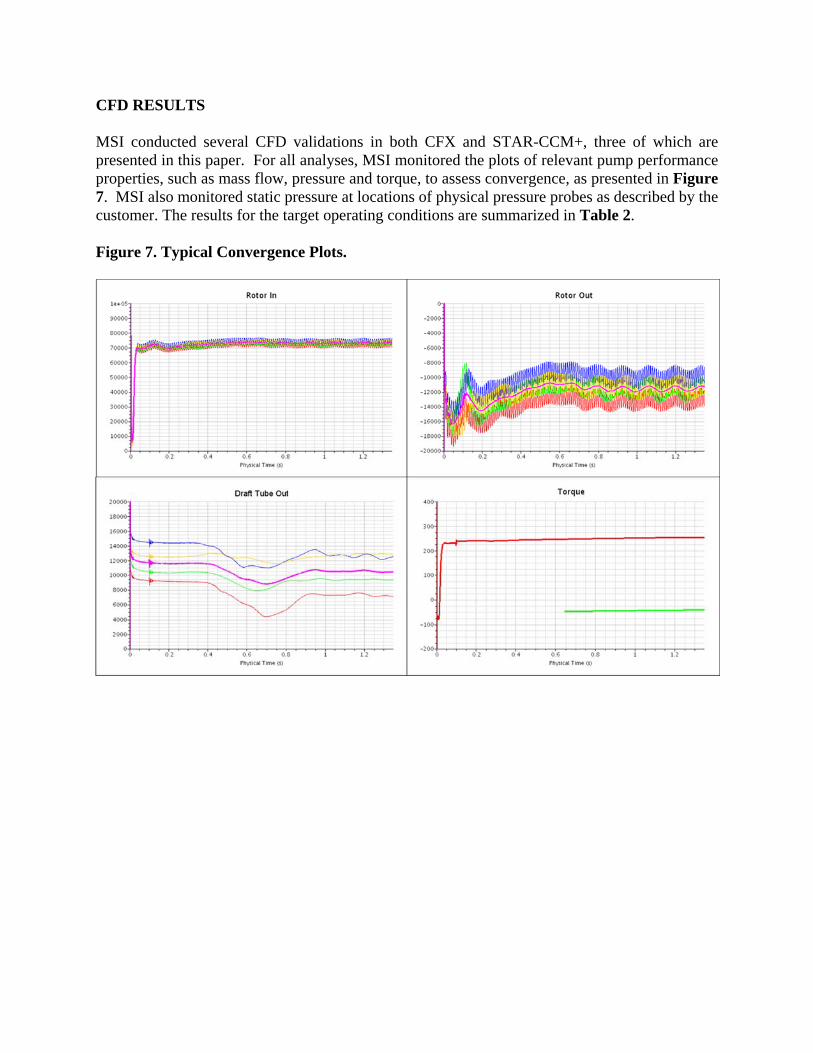
CFD RESULTS MSI conducted several CFD validations in both CFX and STAR-CCM+, three of which are presented in this paper. For all analyses, MSI monitored the plots of relevant pump performance properties, such as mass flow, pressure and torque, to assess convergence, as presented in Figure 7. MSI also monitored static pressure at locations of physical pressure probes as described by the customer. The results for the target operating conditions are summarized in Table 2. Figure 7. Typical Convergence Plots.
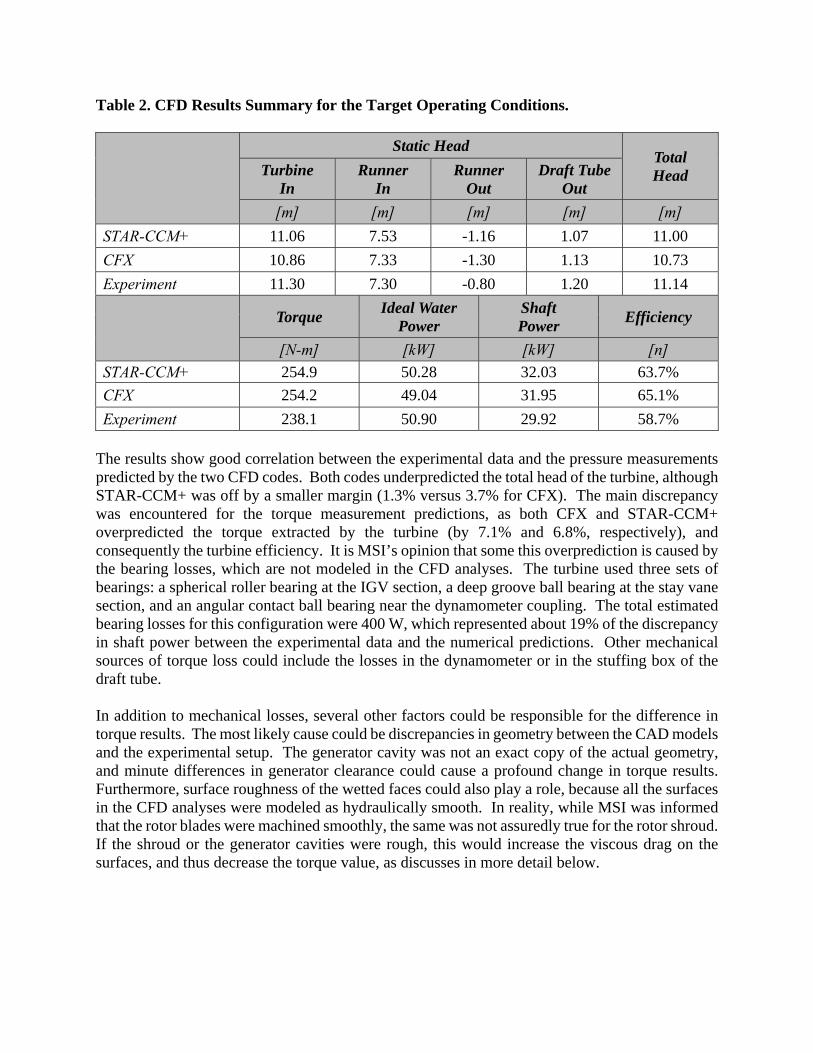
Table 2. CFD Results Summary for the Target Operating Conditions.
Static Head Total Head Turbine
In Runner
In Runner
Out Draft Tube
Out
[m] [m] [m] [m] [m]
STAR-CCM+ 11.06 7.53 -1.16 1.07 11.00
CFX 10.86 7.33 -1.30 1.13 10.73
Experiment 11.30 7.30 -0.80 1.20 11.14
Torque
Ideal Water Power
Shaft Power
Efficiency
[N-m] [kW] [kW] [n]
STAR-CCM+ 254.9 50.28 32.03 63.7%
CFX 254.2 49.04 31.95 65.1%
Experiment 238.1 50.90 29.92 58.7% The results show good correlation between the experimental data and the pressure measurements predicted by the two CFD codes. Both codes underpredicted the total head of the turbine, although STAR-CCM+ was off by a smaller margin (1.3% versus 3.7% for CFX). The main discrepancy was encountered for the torque measurement predictions, as both CFX and STAR-CCM+ overpredicted the torque extracted by the turbine (by 7.1% and 6.8%, respectively), and consequently the turbine efficiency. It is MSI’s opinion that some this overprediction is caused by the bearing losses, which are not modeled in the CFD analyses. The turbine used three sets of bearings: a spherical roller bearing at the IGV section, a deep groove ball bearing at the stay vane section, and an angular contact ball bearing near the dynamometer coupling. The total estimated bearing losses for this configuration were 400 W, which represented about 19% of the discrepancy in shaft power between the experimental data and the numerical predictions. Other mechanical sources of torque loss could include the losses in the dynamometer or in the stuffing box of the draft tube. In addition to mechanical losses, several other factors could be responsible for the difference in torque results. The most likely cause could be discrepancies in geometry between the CAD models and the experimental setup. The generator cavity was not an exact copy of the actual geometry, and minute differences in generator clearance could cause a profound change in torque results. Furthermore, surface roughness of the wetted faces could also play a role, because all the surfaces in the CFD analyses were modeled as hydraulically smooth. In reality, while MSI was informed that the rotor blades were machined smoothly, the same was not assuredly true for the rotor shroud. If the shroud or the generator cavities were rough, this would increase the viscous drag on the surfaces, and thus decrease the torque value, as discusses in more detail below.
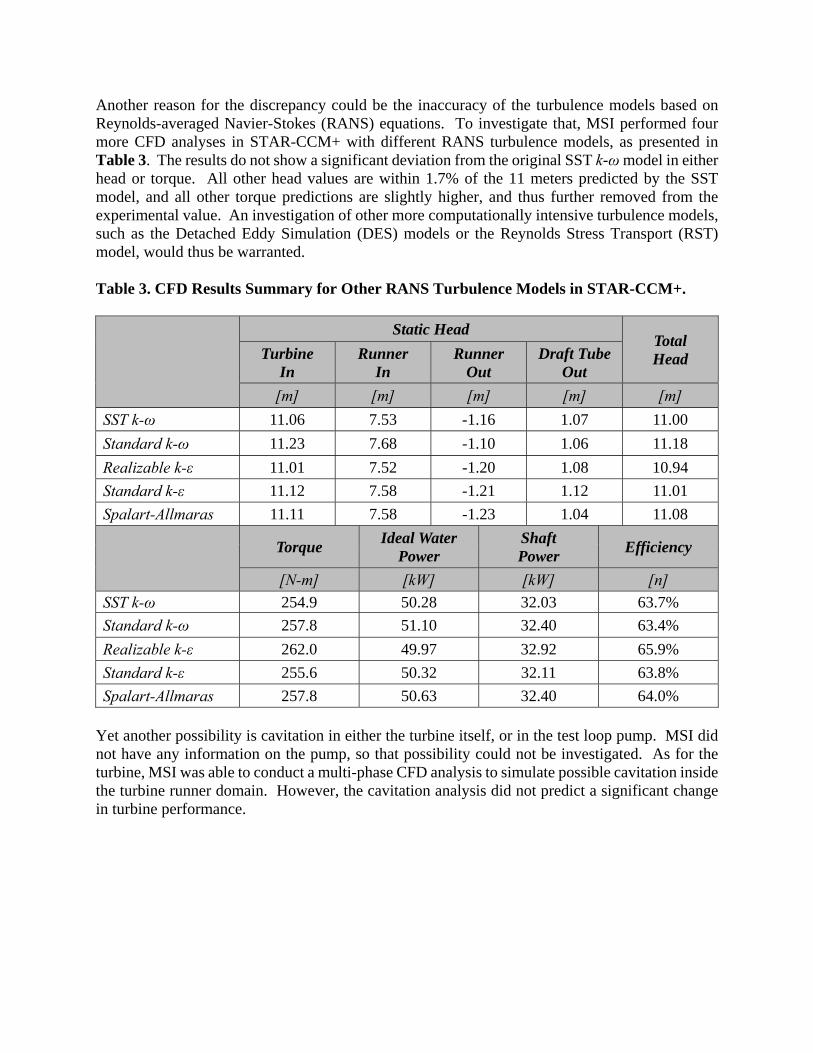
Another reason for the discrepancy could be the inaccuracy of the turbulence models based on Reynolds-averaged Navier-Stokes (RANS) equations. To investigate that, MSI performed four more CFD analyses in STAR-CCM+ with different RANS turbulence models, as presented in Table 3. The results do not show a significant deviation from the original SST k-ω model in either head or torque. All other head values are within 1.7% of the 11 meters predicted by the SST model, and all other torque predictions are slightly higher, and thus further removed from the experimental value. An investigation of other more computationally intensive turbulence models, such as the Detached Eddy Simulation (DES) models or the Reynolds Stress Transport (RST) model, would thus be warranted. Table 3. CFD Results Summary for Other RANS Turbulence Models in STAR-CCM+.
Static Head Total Head Turbine
In Runner
In Runner
Out Draft Tube
Out
[m] [m] [m] [m] [m]
SST k-ω 11.06 7.53 -1.16 1.07 11.00
Standard k-ω 11.23 7.68 -1.10 1.06 11.18
Realizable k-ε 11.01 7.52 -1.20 1.08 10.94
Standard k-ε 11.12 7.58 -1.21 1.12 11.01
Spalart-Allmaras 11.11 7.58 -1.23 1.04 11.08
Torque
Ideal Water Power
Shaft Power
Efficiency
[N-m] [kW] [kW] [n]
SST k-ω 254.9 50.28 32.03 63.7%
Standard k-ω 257.8 51.10 32.40 63.4%
Realizable k-ε 262.0 49.97 32.92 65.9%
Standard k-ε 255.6 50.32 32.11 63.8%
Spalart-Allmaras 257.8 50.63 32.40 64.0% Yet another possibility is cavitation in either the turbine itself, or in the test loop pump. MSI did not have any information on the pump, so that possibility could not be investigated. As for the turbine, MSI was able to conduct a multi-phase CFD analysis to simulate possible cavitation inside the turbine runner domain. However, the cavitation analysis did not predict a significant change in turbine performance.
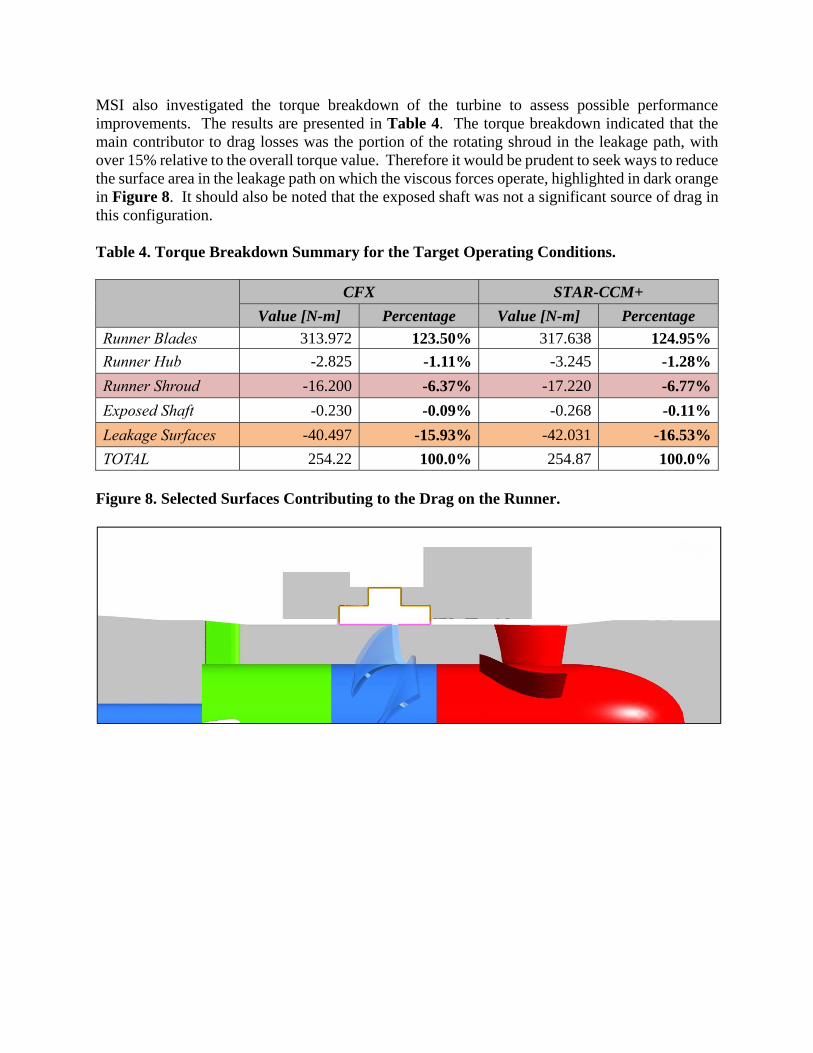
MSI also investigated the torque breakdown of the turbine to assess possible performance improvements. The results are presented in Table 4. The torque breakdown indicated that the main contributor to drag losses was the portion of the rotating shroud in the leakage path, with over 15% relative to the overall torque value. Therefore it would be prudent to seek ways to reduce the surface area in the leakage path on which the viscous forces operate, highlighted in dark orange in Figure 8. It should also be noted that the exposed shaft was not a significant source of drag in this configuration. Table 4. Torque Breakdown Summary for the Target Operating Conditions.
CFX STAR-CCM+
Value [N-m] Percentage Value [N-m] Percentage
Runner Blades 313.972 123.50% 317.638 124.95%
Runner Hub -2.825 -1.11% -3.245 -1.28%
Runner Shroud -16.200 -6.37% -17.220 -6.77%
Exposed Shaft -0.230 -0.09% -0.268 -0.11%
Leakage Surfaces -40.497 -15.93% -42.031 -16.53%
TOTAL 254.22 100.0% 254.87 100.0% Figure 8. Selected Surfaces Contributing to the Drag on the Runner.
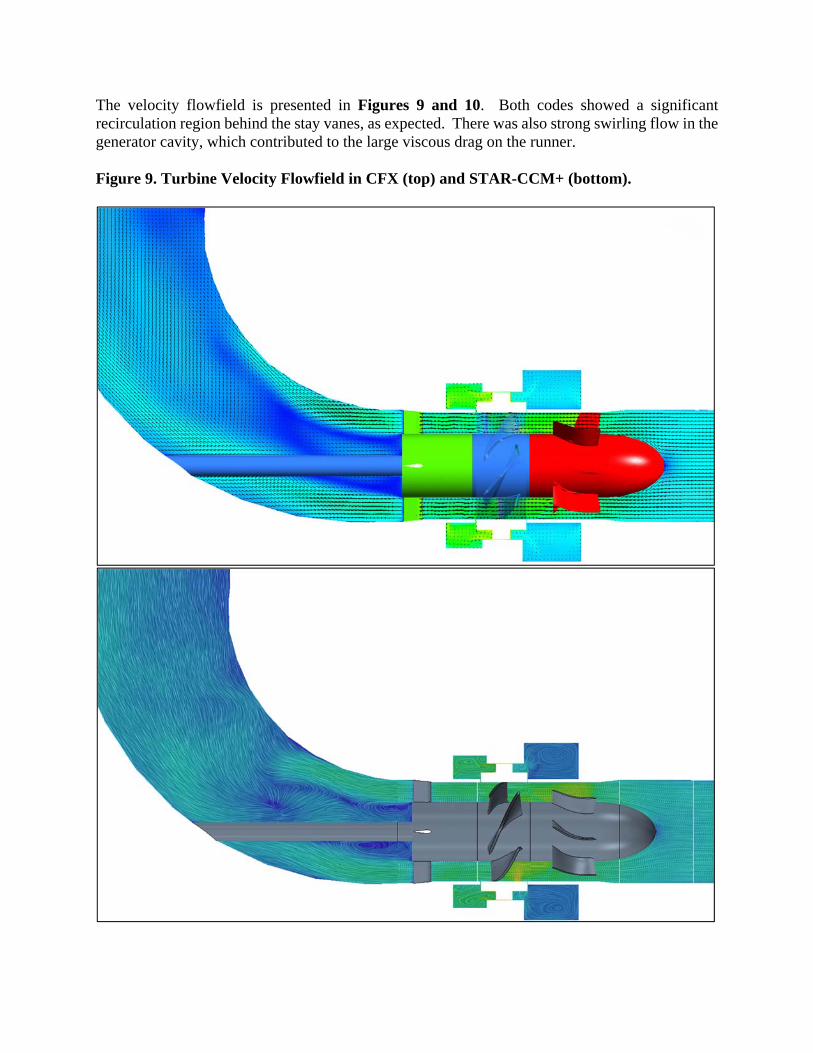
The velocity flowfield is presented in Figures 9 and 10. Both codes showed a significant recirculation region behind the stay vanes, as expected. There was also strong swirling flow in the generator cavity, which contributed to the large viscous drag on the runner. Figure 9. Turbine Velocity Flowfield in CFX (top) and STAR-CCM+ (bottom).
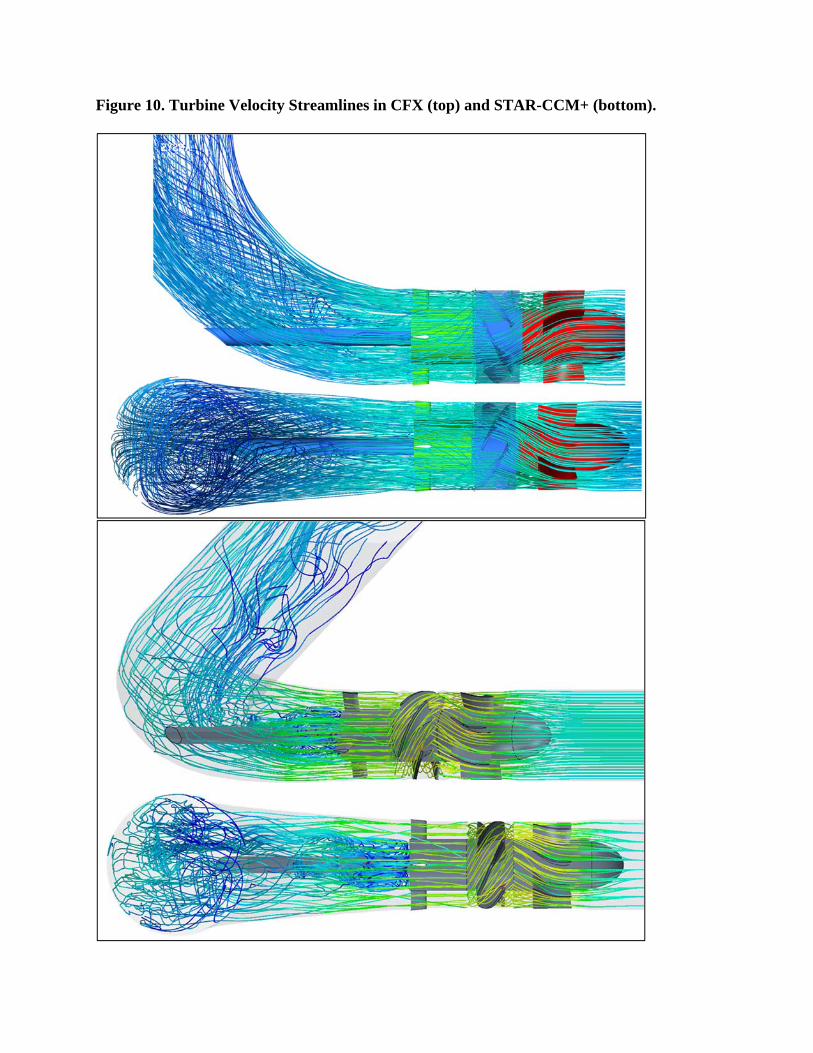
Figure 10. Turbine Velocity Streamlines in CFX (top) and STAR-CCM+ (bottom).
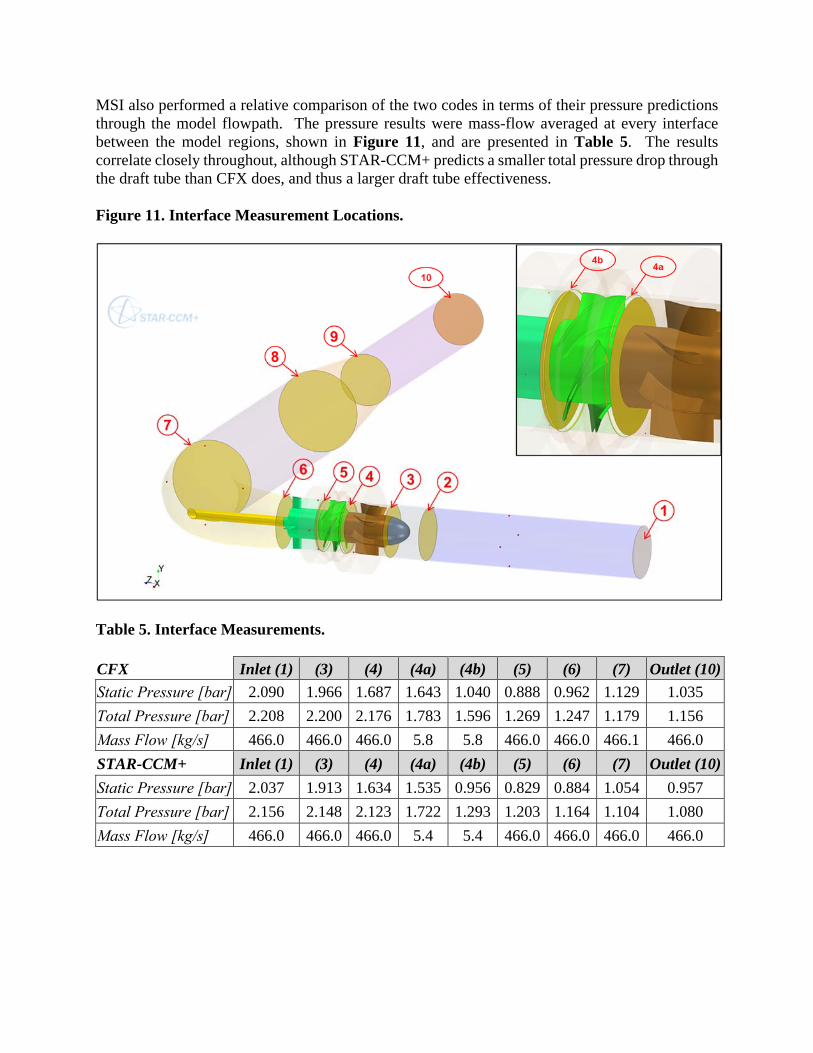
MSI also performed a relative comparison of the two codes in terms of their pressure predictions through the model flowpath. The pressure results were mass-flow averaged at every interface between the model regions, shown in Figure 11, and are presented in Table 5. The results correlate closely throughout, although STAR-CCM+ predicts a smaller total pressure drop through the draft tube than CFX does, and thus a larger draft tube effectiveness. Figure 11. Interface Measurement Locations.
Table 5. Interface Measurements. CFX Inlet (1) (3) (4) (4a) (4b) (5) (6) (7) Outlet (10)
Static Pressure [bar] 2.090 1.966 1.687 1.643 1.040 0.888 0.962 1.129 1.035
Total Pressure [bar] 2.208 2.200 2.176 1.783 1.596 1.269 1.247 1.179 1.156
Mass Flow [kg/s] 466.0 466.0 466.0 5.8 5.8 466.0 466.0 466.1 466.0
STAR-CCM+ Inlet (1) (3) (4) (4a) (4b) (5) (6) (7) Outlet (10)
Static Pressure [bar] 2.037 1.913 1.634 1.535 0.956 0.829 0.884 1.054 0.957
Total Pressure [bar] 2.156 2.148 2.123 1.722 1.293 1.203 1.164 1.104 1.080
Mass Flow [kg/s] 466.0 466.0 466.0 5.4 5.4 466.0 466.0 466.0 466.0
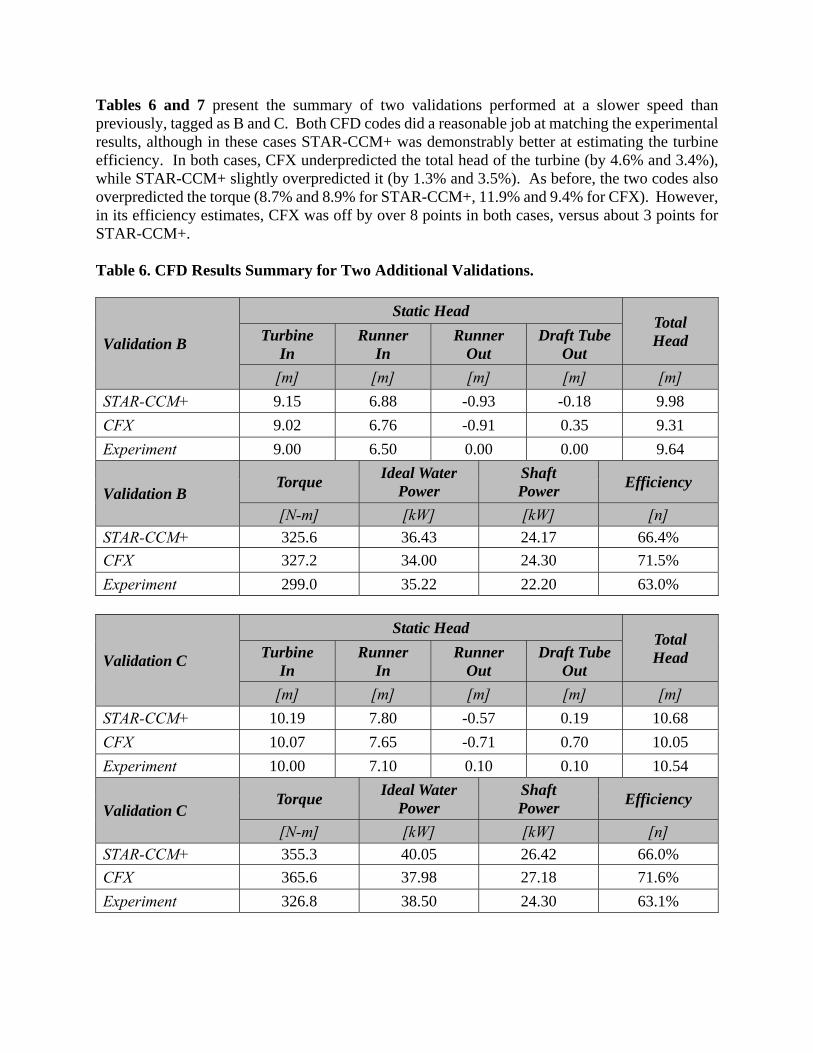
Tables 6 and 7 present the summary of two validations performed at a slower speed than previously, tagged as B and C. Both CFD codes did a reasonable job at matching the experimental results, although in these cases STAR-CCM+ was demonstrably better at estimating the turbine efficiency. In both cases, CFX underpredicted the total head of the turbine (by 4.6% and 3.4%), while STAR-CCM+ slightly overpredicted it (by 1.3% and 3.5%). As before, the two codes also overpredicted the torque (8.7% and 8.9% for STAR-CCM+, 11.9% and 9.4% for CFX). However, in its efficiency estimates, CFX was off by over 8 points in both cases, versus about 3 points for STAR-CCM+. Table 6. CFD Results Summary for Two Additional Validations.
Validation B
Static Head Total Head Turbine
In Runner
In Runner
Out Draft Tube
Out
[m] [m] [m] [m] [m]
STAR-CCM+ 9.15 6.88 -0.93 -0.18 9.98
CFX 9.02 6.76 -0.91 0.35 9.31
Experiment 9.00 6.50 0.00 0.00 9.64
Validation B Torque
Ideal Water Power
Shaft Power
Efficiency
[N-m] [kW] [kW] [n]
STAR-CCM+ 325.6 36.43 24.17 66.4%
CFX 327.2 34.00 24.30 71.5%
Experiment 299.0 35.22 22.20 63.0%
Validation C
Static Head Total Head Turbine
In Runner
In Runner
Out Draft Tube
Out
[m] [m] [m] [m] [m]
STAR-CCM+ 10.19 7.80 -0.57 0.19 10.68
CFX 10.07 7.65 -0.71 0.70 10.05
Experiment 10.00 7.10 0.10 0.10 10.54
Validation C Torque
Ideal Water Power
Shaft Power
Efficiency
[N-m] [kW] [kW] [n]
STAR-CCM+ 355.3 40.05 26.42 66.0%
CFX 365.6 37.98 27.18 71.6%
Experiment 326.8 38.50 24.30 63.1%
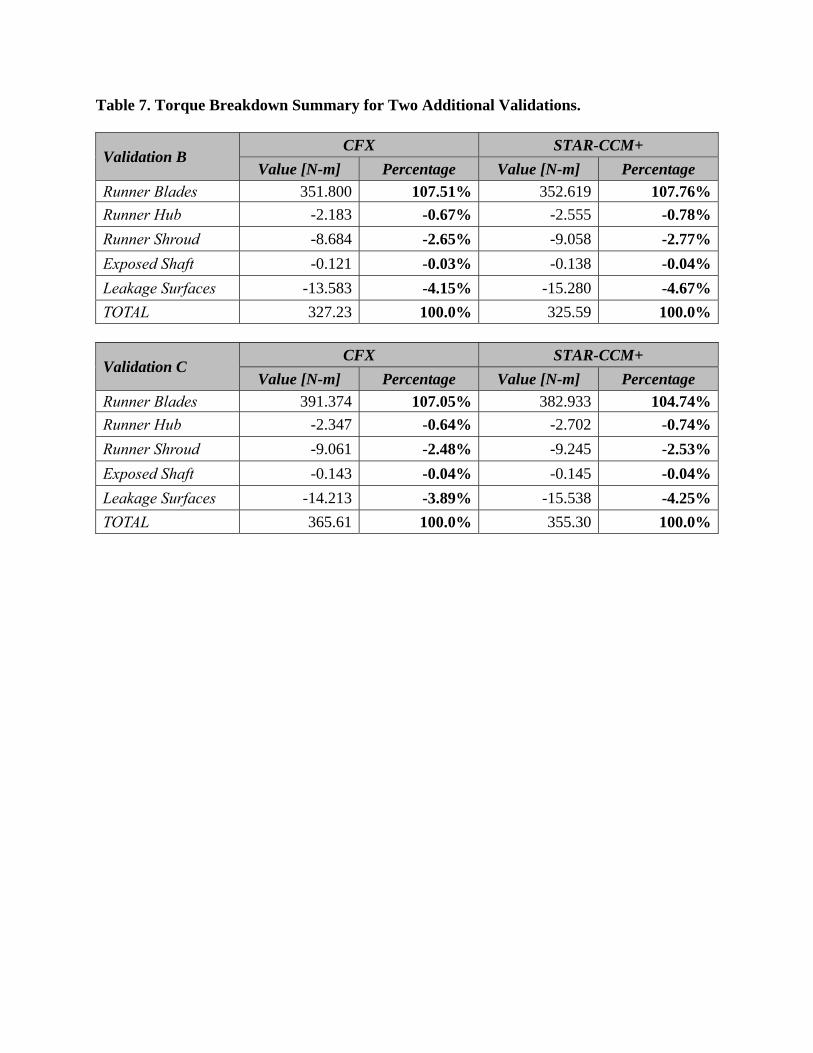
Table 7. Torque Breakdown Summary for Two Additional Validations.
Validation B CFX STAR-CCM+
Value [N-m] Percentage Value [N-m] Percentage
Runner Blades 351.800 107.51% 352.619 107.76%
Runner Hub -2.183 -0.67% -2.555 -0.78%
Runner Shroud -8.684 -2.65% -9.058 -2.77%
Exposed Shaft -0.121 -0.03% -0.138 -0.04%
Leakage Surfaces -13.583 -4.15% -15.280 -4.67%
TOTAL 327.23 100.0% 325.59 100.0%
Validation C CFX STAR-CCM+
Value [N-m] Percentage Value [N-m] Percentage
Runner Blades 391.374 107.05% 382.933 104.74%
Runner Hub -2.347 -0.64% -2.702 -0.74%
Runner Shroud -9.061 -2.48% -9.245 -2.53%
Exposed Shaft -0.143 -0.04% -0.145 -0.04%
Leakage Surfaces -14.213 -3.89% -15.538 -4.25%
TOTAL 365.61 100.0% 355.30 100.0%
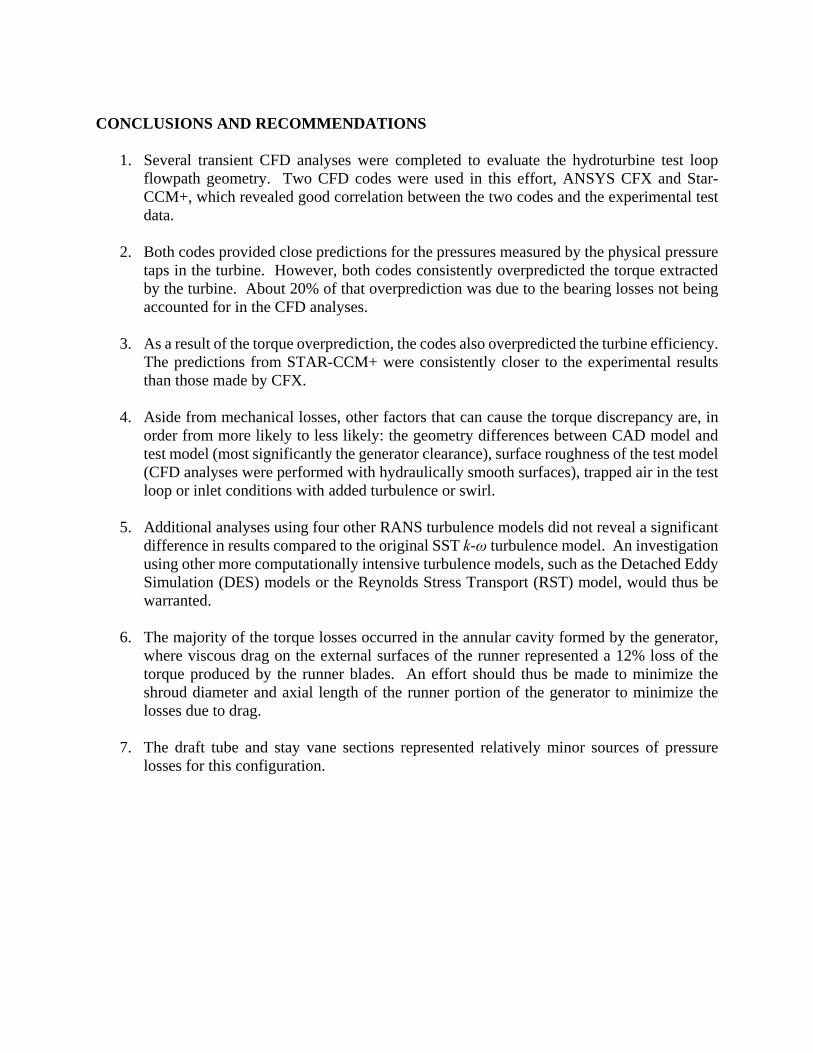
CONCLUSIONS AND RECOMMENDATIONS
1. Several transient CFD analyses were completed to evaluate the hydroturbine test loop flowpath geometry. Two CFD codes were used in this effort, ANSYS CFX and Star-CCM+, which revealed good correlation between the two codes and the experimental test data.
2. Both codes provided close predictions for the pressures measured by the physical pressure taps in the turbine. However, both codes consistently overpredicted the torque extracted by the turbine. About 20% of that overprediction was due to the bearing losses not being accounted for in the CFD analyses.
3. As a result of the torque overprediction, the codes also overpredicted the turbine efficiency. The predictions from STAR-CCM+ were consistently closer to the experimental results than those made by CFX.
4. Aside from mechanical losses, other factors that can cause the torque discrepancy are, in order from more likely to less likely: the geometry differences between CAD model and test model (most significantly the generator clearance), surface roughness of the test model (CFD analyses were performed with hydraulically smooth surfaces), trapped air in the test loop or inlet conditions with added turbulence or swirl.
5. Additional analyses using four other RANS turbulence models did not reveal a significant difference in results compared to the original SST k-ω turbulence model. An investigation using other more computationally intensive turbulence models, such as the Detached Eddy Simulation (DES) models or the Reynolds Stress Transport (RST) model, would thus be warranted.
6. The majority of the torque losses occurred in the annular cavity formed by the generator, where viscous drag on the external surfaces of the runner represented a 12% loss of the torque produced by the runner blades. An effort should thus be made to minimize the shroud diameter and axial length of the runner portion of the generator to minimize the losses due to drag.
7. The draft tube and stay vane sections represented relatively minor sources of pressure losses for this configuration.
AUTHORS Artem Ivashchenko, P.E., is a project engineer who, as a CFD analyst, has handled a variety of assignments involving investigative fluid dynamic analysis of a wide array of turbomachinery components, from centrifugal pumps and hydroturbines to compressors, medical devices and washing machines. He is a licensed engineer in the states of New Jersey and Colorado. Dr. Edward M. Bennett is the Vice President of Fluids Engineering at MSI. He has been involved with fluid dynamics and the aero/hydrodynamic design of turbomachinery for the past thirty five years, including numerous Francis, Kaplan and Pelton hydroturbines. He graduated from the Naval Academy, and holds a Ph.D. in Fluid Mechanics from Johns Hopkins University. REFERENCES Spalart, P. R. and Allmaras, S. R., "A One-Equation Turbulence Model for Aerodynamic Flows", AIAA Paper 92-0439, 1992. Wilcox C. D., “Turbulence Modeling for CFD”, 2nd Ed., DCW Industries, 1998. Menter, F. R., "Two-Equation Eddy-Viscosity Turbulence Models for Engineering Applications", AIAA Journal, 32 (8): 1598–1605, 1994. ANSYS/CFX Version 17 Users’ Manual. STAR-CCM+ Version 12 Users’ Manual.