Embed Size (px)
Citation preview
1
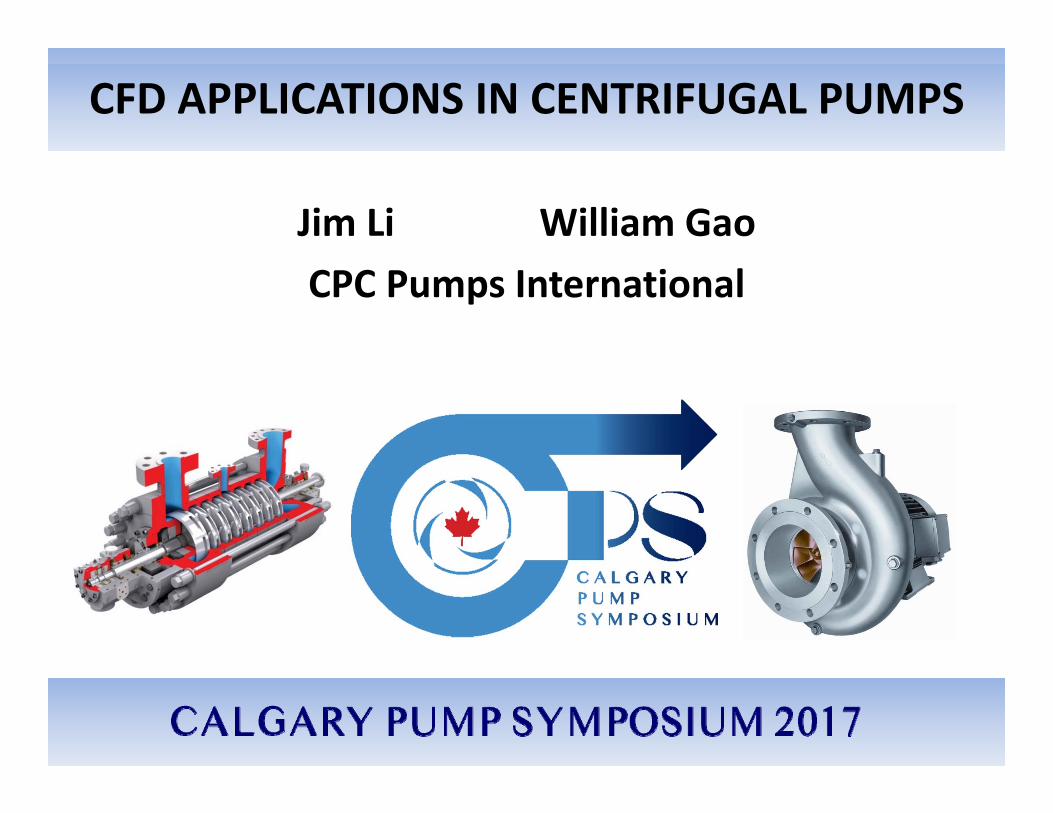
Jim Li William GaoCPC Pumps International
CFD APPLICATIONS IN CENTRIFUGAL PUMPS
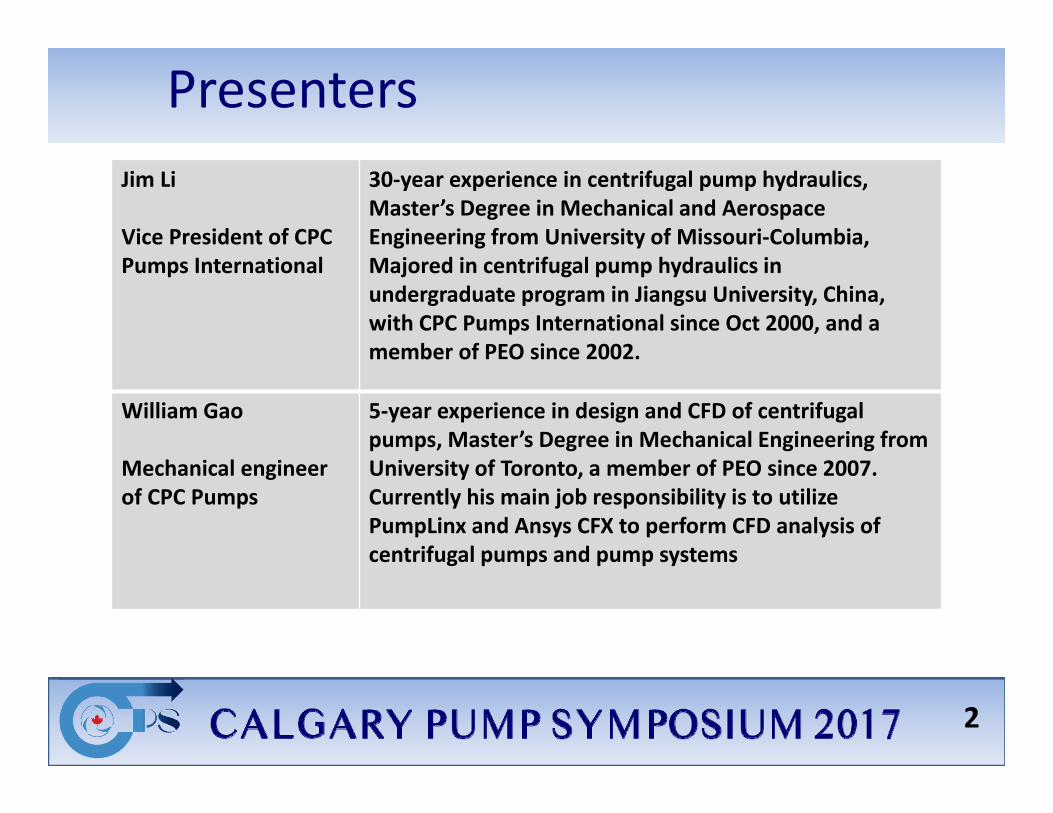
Jim Li
Vice President of CPC Pumps International
30‐year experience in centrifugal pump hydraulics, Master’s Degree in Mechanical and Aerospace Engineering from University of Missouri‐Columbia, Majored in centrifugal pump hydraulics in undergraduate program in Jiangsu University, China, with CPC Pumps International since Oct 2000, and a member of PEO since 2002.
William Gao
Mechanical engineer of CPC Pumps
5‐year experience in design and CFD of centrifugal pumps, Master’s Degree in Mechanical Engineering from University of Toronto, a member of PEO since 2007. Currently his main job responsibility is to utilize PumpLinx and Ansys CFX to perform CFD analysis of centrifugal pumps and pump systems
Presenters
2
Overview
• Centrifugal pump designTraditional design method relied on empirical data, performance could only be verified when tested. It was time consuming and costly if performance was not satisfactory. Today, tools are available for CFD analysis, performance simulation before a design is finalized.
• CFD software AvailableAnsys CFX/Fluent, StarCD, OpenFoam, Flow 3d, NemecaFine, Xflow, Ensight, Pumplinx, Turbodesign, etc.
• CFD ApplicationsPerformance prediction of centrifugal pumps, parametric studies, cavitation analysis, drooping curve correction, axial thrust evaluations, seal chamber pressure calculations, etc.
3
Parametric Study
Utilize CFD to study how design variables affect performance, NPSHr, axial thrust, etc. Optimize pump parameters such as impeller inlet diameter, inlet vane angle, outlet vane angle, outlet width, volute throat area, passage way in two‐stage and multistage pump casings, etc. to achieve satisfactory results.
4
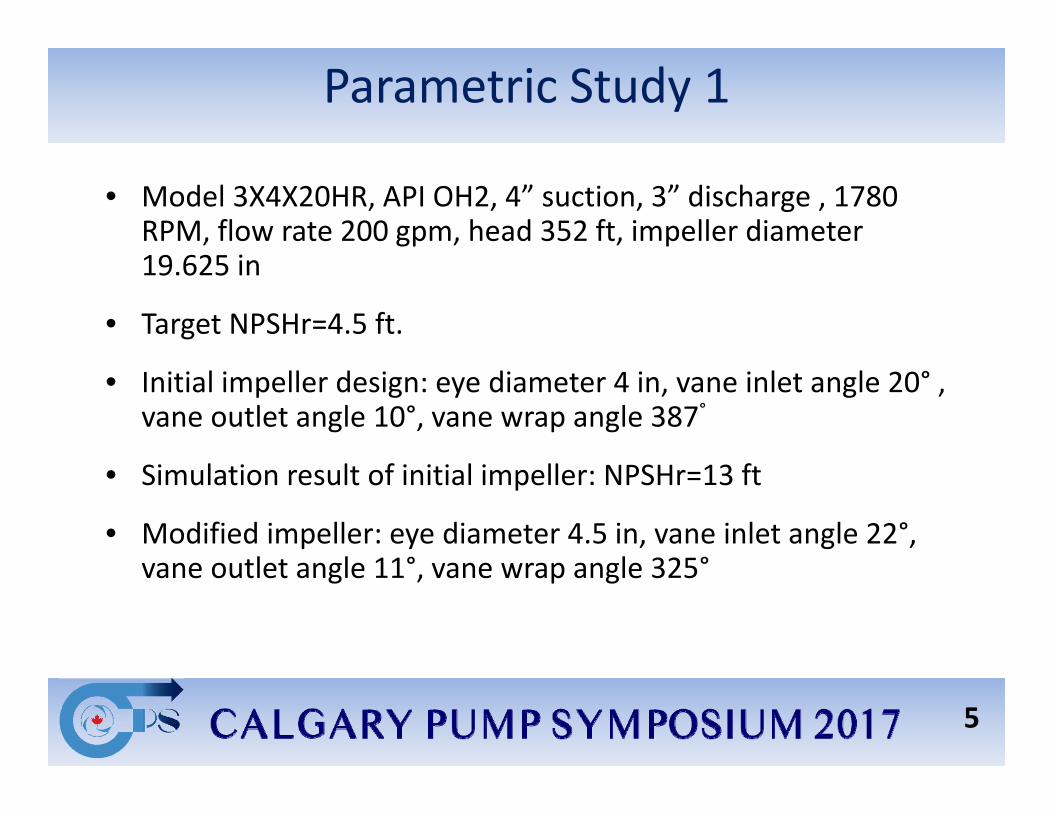
Parametric Study 1
• Model 3X4X20HR, API OH2, 4” suction, 3” discharge , 1780 RPM, flow rate 200 gpm, head 352 ft, impeller diameter 19.625 in
• Target NPSHr=4.5 ft.
• Initial impeller design: eye diameter 4 in, vane inlet angle 20° , vane outlet angle 10°, vane wrap angle 387°
• Simulation result of initial impeller: NPSHr=13 ft
• Modified impeller: eye diameter 4.5 in, vane inlet angle 22°, vane outlet angle 11°, vane wrap angle 325°
5
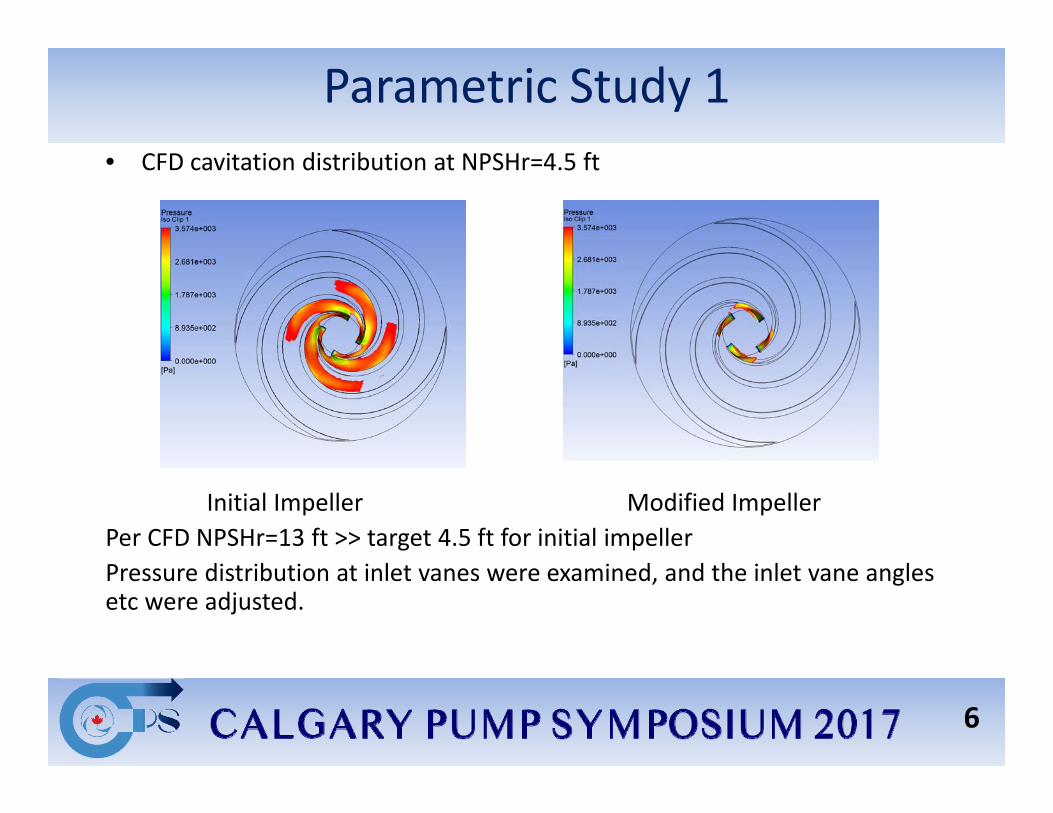
Parametric Study 1• CFD cavitation distribution at NPSHr=4.5 ft
Initial Impeller Modified ImpellerPer CFD NPSHr=13 ft >> target 4.5 ft for initial impellerPressure distribution at inlet vanes were examined, and the inlet vane angles etc were adjusted.
6
Parametric Study 1
Modified impeller: CFD NPSHr=3 ft
First test: NPSHr=5.3ft
Finally test with good vane inlet cleaning NPSHr=4.5 ft
7
Parametric Study 2
3X4X7 VP‐B, API OH3, 4” suction, 3” discharge, 3550 RPM, flow rate 350 gpm, head 173 ft, impeller diameter 6.625 in
Issue: Flat H‐Q curve
Factors affecting head rise:• Number of vanes• Vane outlet angle• Vane inlet design• Impeller opening at OD• Volute throat area
8
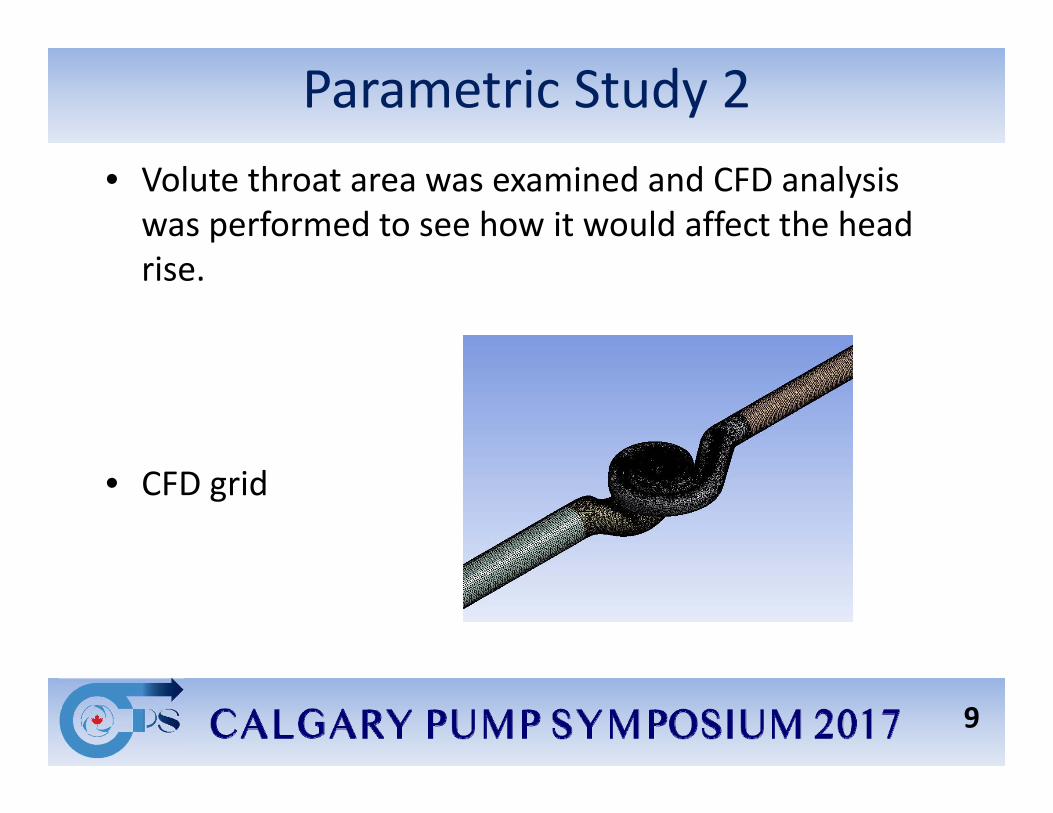
Parametric Study 2• Volute throat area was examined and CFD analysis was performed to see how it would affect the head rise.
• CFD grid
9
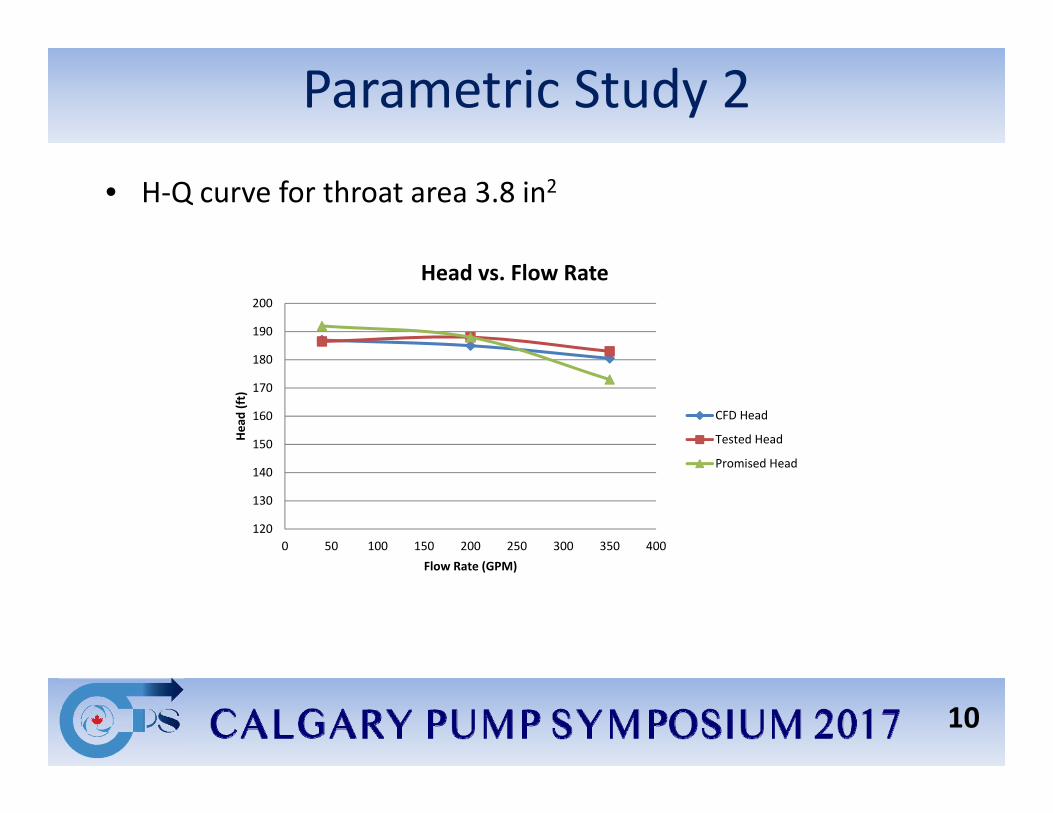
Parametric Study 2
• H‐Q curve for throat area 3.8 in2
10
120
130
140
150
160
170
180
190
200
0 50 100 150 200 250 300 350 400
Head (ft)
Flow Rate (GPM)
Head vs. Flow Rate
CFD Head
Tested Head
Promised Head
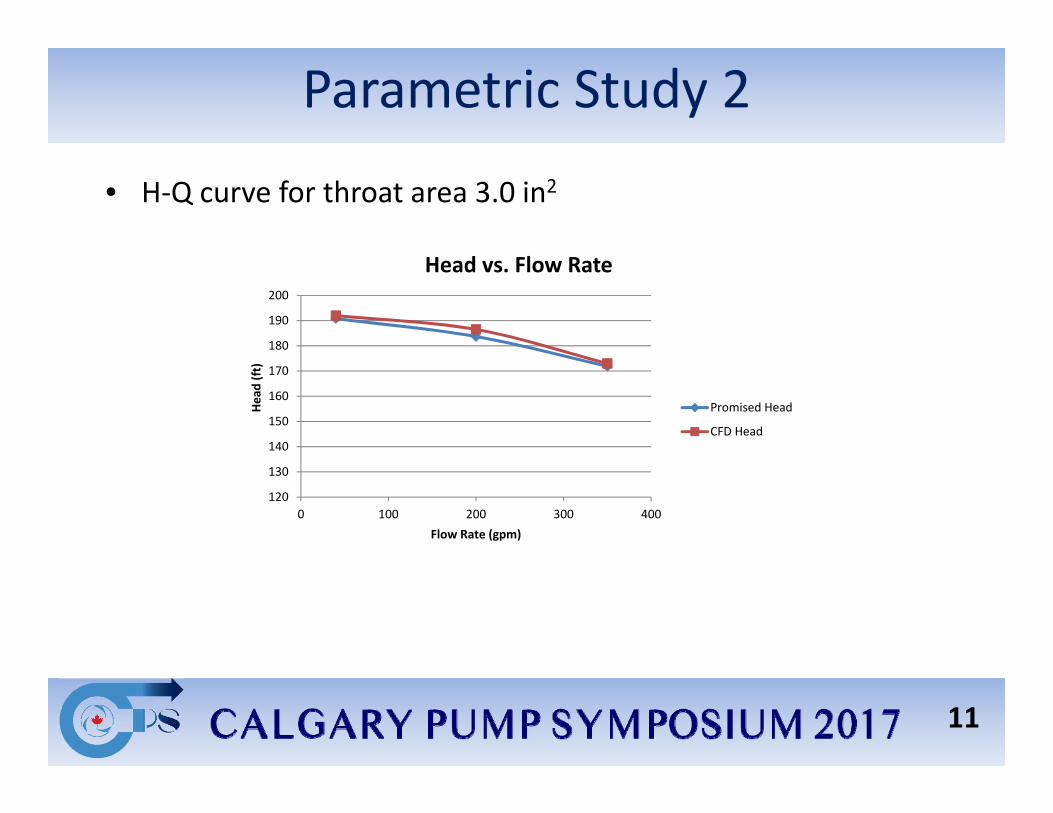
Parametric Study 2
• H‐Q curve for throat area 3.0 in2
11
120
130
140
150
160
170
180
190
200
0 100 200 300 400
Head (ft)
Flow Rate (gpm)
Head vs. Flow Rate
Promised Head
CFD Head
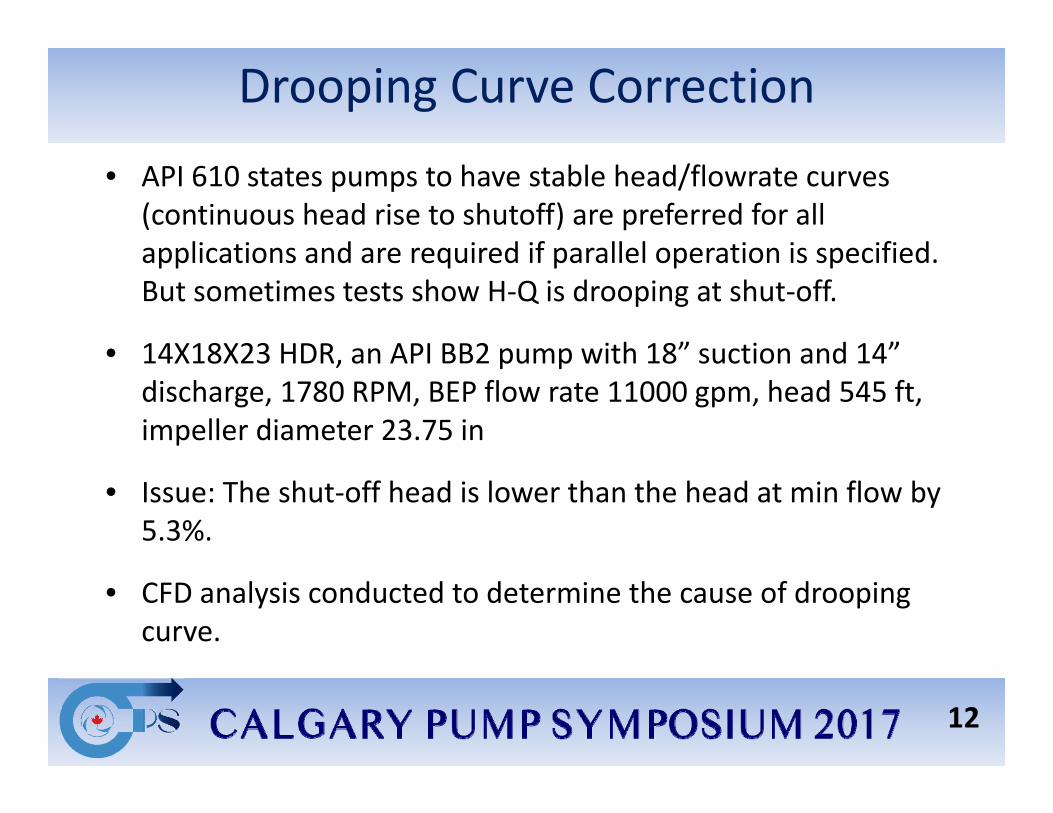
Drooping Curve Correction
• API 610 states pumps to have stable head/flowrate curves (continuous head rise to shutoff) are preferred for all applications and are required if parallel operation is specified. But sometimes tests show H‐Q is drooping at shut‐off.
• 14X18X23 HDR, an API BB2 pump with 18” suction and 14” discharge, 1780 RPM, BEP flow rate 11000 gpm, head 545 ft, impeller diameter 23.75 in
• Issue: The shut‐off head is lower than the head at min flow by 5.3%.
• CFD analysis conducted to determine the cause of drooping curve.
12
Drooping Curve Correction
Factors affecting drooping H‐Q curve:• Volute design esp. cutwater and passage expansion• Pre‐rotation at vanes inlets• Impeller opening at outside diameter• Vane outlet angle
CFD Analysis done on the influence of the volute cutwater• CFD first performed for as designed/built cutwater size/shape• CFD then performed for cutwater size/shape by prediction to achieve
satisfactory H‐Q curve shape.
13
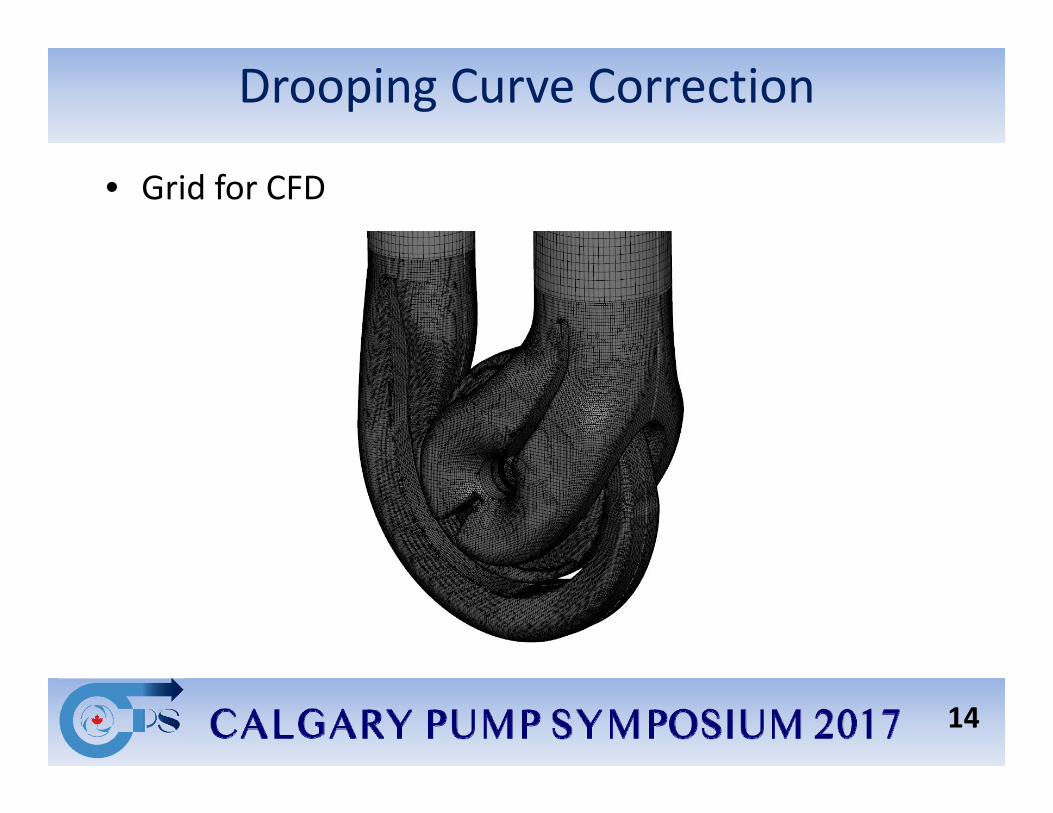
Drooping Curve Correction
• Grid for CFD
14
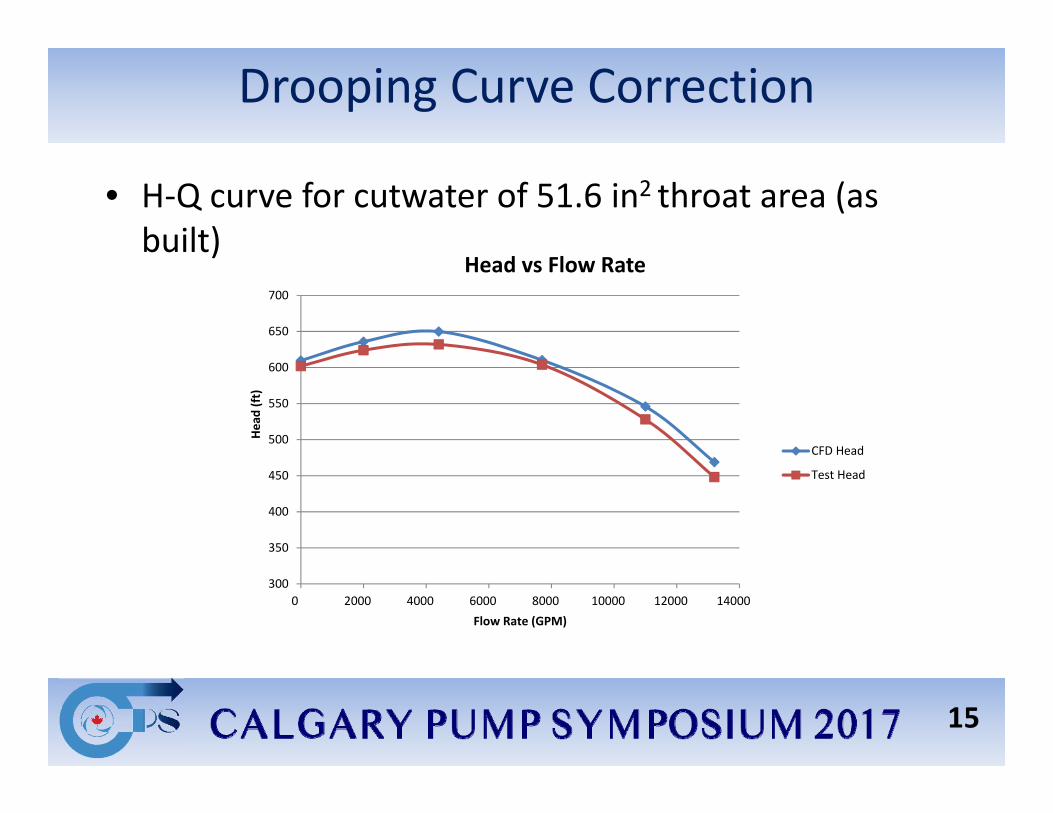
Drooping Curve Correction
• H‐Q curve for cutwater of 51.6 in2 throat area (as built)
15
300
350
400
450
500
550
600
650
700
0 2000 4000 6000 8000 10000 12000 14000
Head (ft)
Flow Rate (GPM)
Head vs Flow Rate
CFD Head
Test Head
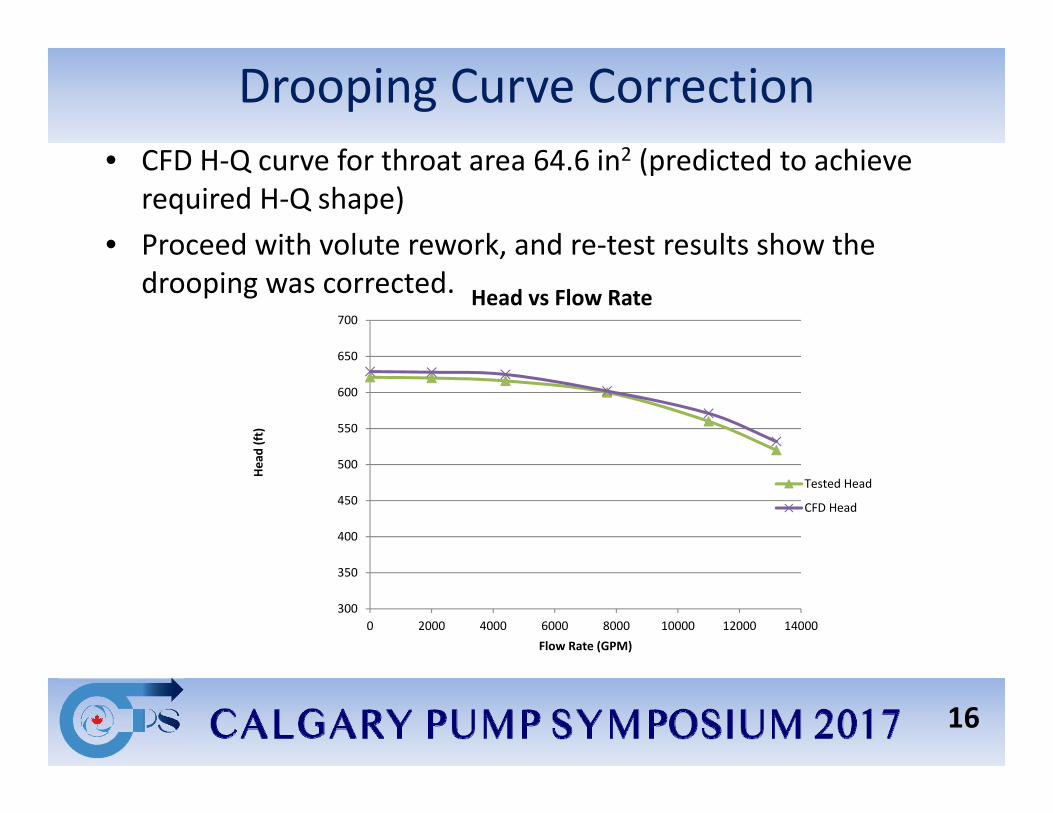
Drooping Curve Correction• CFD H‐Q curve for throat area 64.6 in2 (predicted to achieve
required H‐Q shape)• Proceed with volute rework, and re‐test results show the
drooping was corrected.
16
300
350
400
450
500
550
600
650
700
0 2000 4000 6000 8000 10000 12000 14000
Head (ft)
Flow Rate (GPM)
Head vs Flow Rate
Tested Head
CFD Head
Semi‐open Impeller Design Verification
• Some design parameters of open/semi‐open impeller pumps are difficult to quantify their effect on performance, for example such as the clearance between the open vanes and wear plate on NPSHr, the clearance between the pumping vanes and cover on the axial thrust and seal chamber pressure, especially when pumping liquid is not water.
• Model 6X8X28 HOR, an API OH2 with a semi‐open impeller, 8” suction, 6” discharge, 1665 RPM, flow rate 760 gpm, differential head 693 ft, impeller diameter 28.25 in, pumping liquid specific gravity 0.778, viscosity 8.36cSt, suction perssure ‐8psi
• Axial thrust and Seal chamber pressure to be evaluated for actual pumping liquid
17
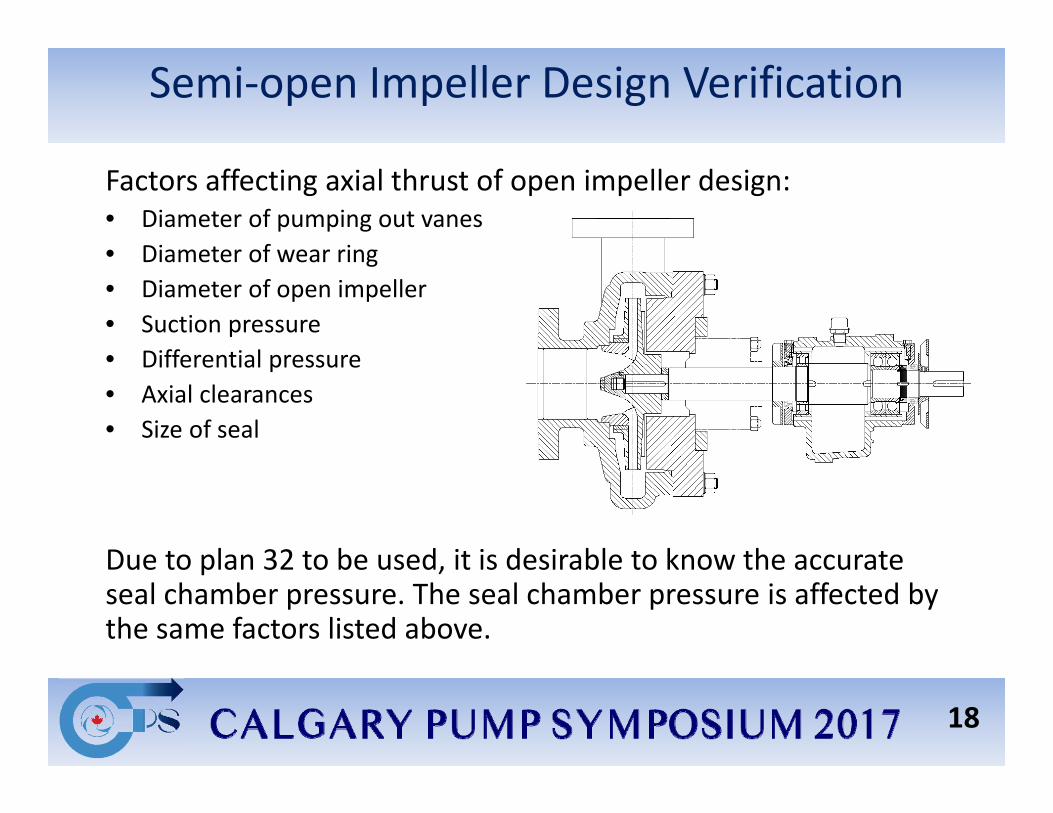
Semi‐open Impeller Design Verification
Factors affecting axial thrust of open impeller design:• Diameter of pumping out vanes• Diameter of wear ring• Diameter of open impeller• Suction pressure• Differential pressure• Axial clearances• Size of seal
Due to plan 32 to be used, it is desirable to know the accurate seal chamber pressure. The seal chamber pressure is affected by the same factors listed above.
18
Semi‐open Impeller Design Verification
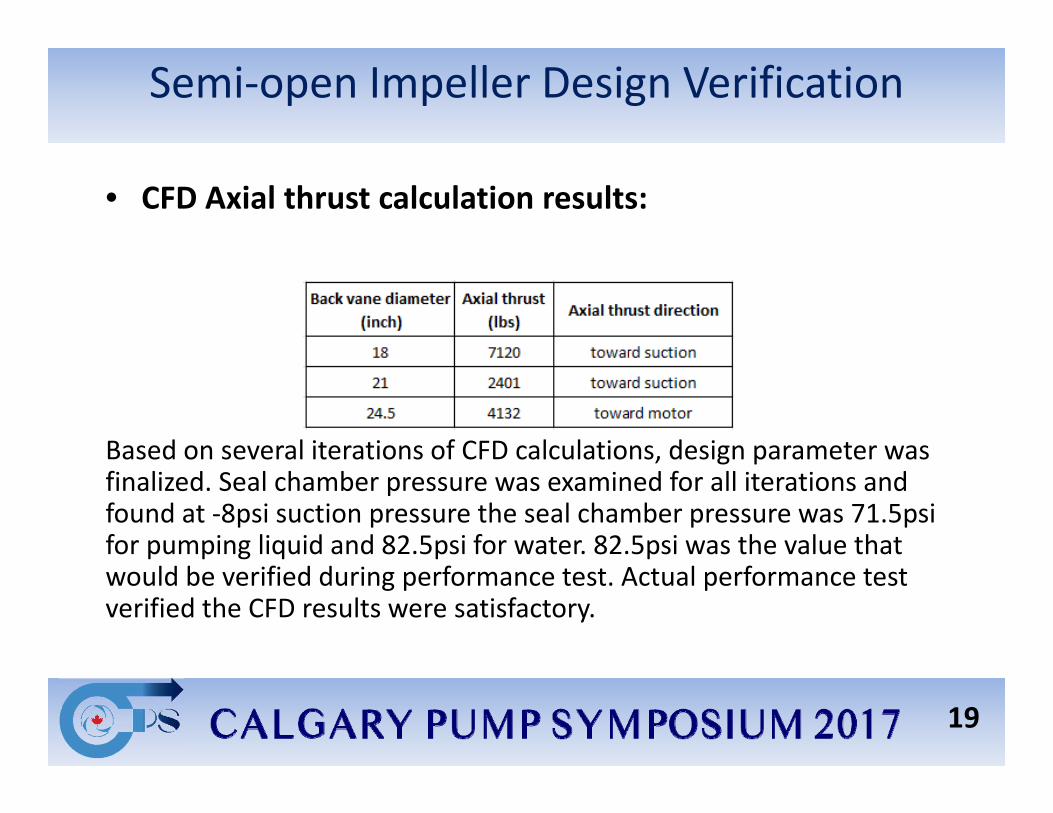
• CFD Axial thrust calculation results:
Based on several iterations of CFD calculations, design parameter was finalized. Seal chamber pressure was examined for all iterations and found at ‐8psi suction pressure the seal chamber pressure was 71.5psi for pumping liquid and 82.5psi for water. 82.5psi was the value that would be verified during performance test. Actual performance test verified the CFD results were satisfactory.
19
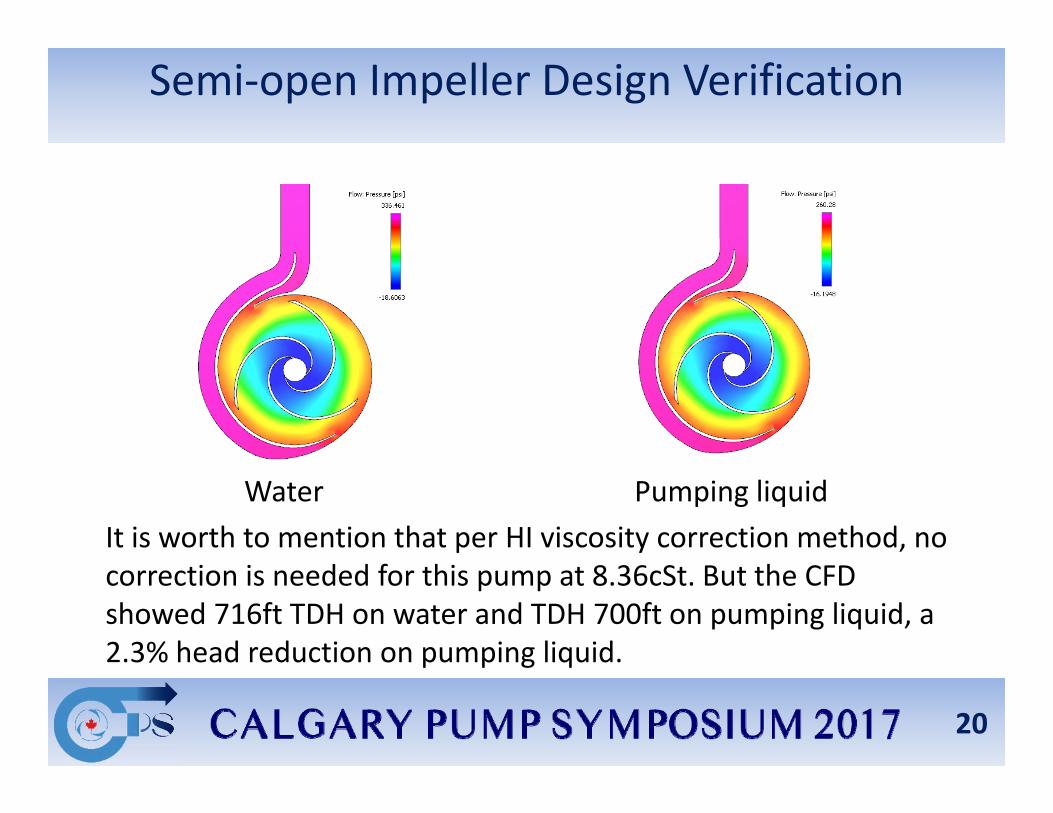
Semi‐open Impeller Design Verification
Water Pumping liquidIt is worth to mention that per HI viscosity correction method, no correction is needed for this pump at 8.36cSt. But the CFD showed 716ft TDH on water and TDH 700ft on pumping liquid, a 2.3% head reduction on pumping liquid.
20
Seal Chamber Pressure Calculation
• Proper seal chamber pressure ensures successful seal reliability. Empirical method is available for calculations. However, when very accurate seal chamber pressure is desired, manual calculation or empirical method may not be good enough.
• Pump model 3X4X13 HR, API OH2, suction diameter 4 in, discharge diameter 3 in, speed 3560 RPM, rated flow rate 545 gpm, head 604 ft, impeller diameter 12.625 in. Rated suction pressure 555 psig, viscosity 0.23cp, seal flush plans 11/72/75
• CFD purpose: customer required seal chamber pressure around 675 psig at rated suction pressure, and flush flow rate at 10 gpm to make sure the seal’s proper operation and the pressure adequately above the vapor pressure, while keep is the lowest due to high suction pressure. Use CFD to decide plan 11 orifice size
21
Seal Chamber Pressure Calculation
22
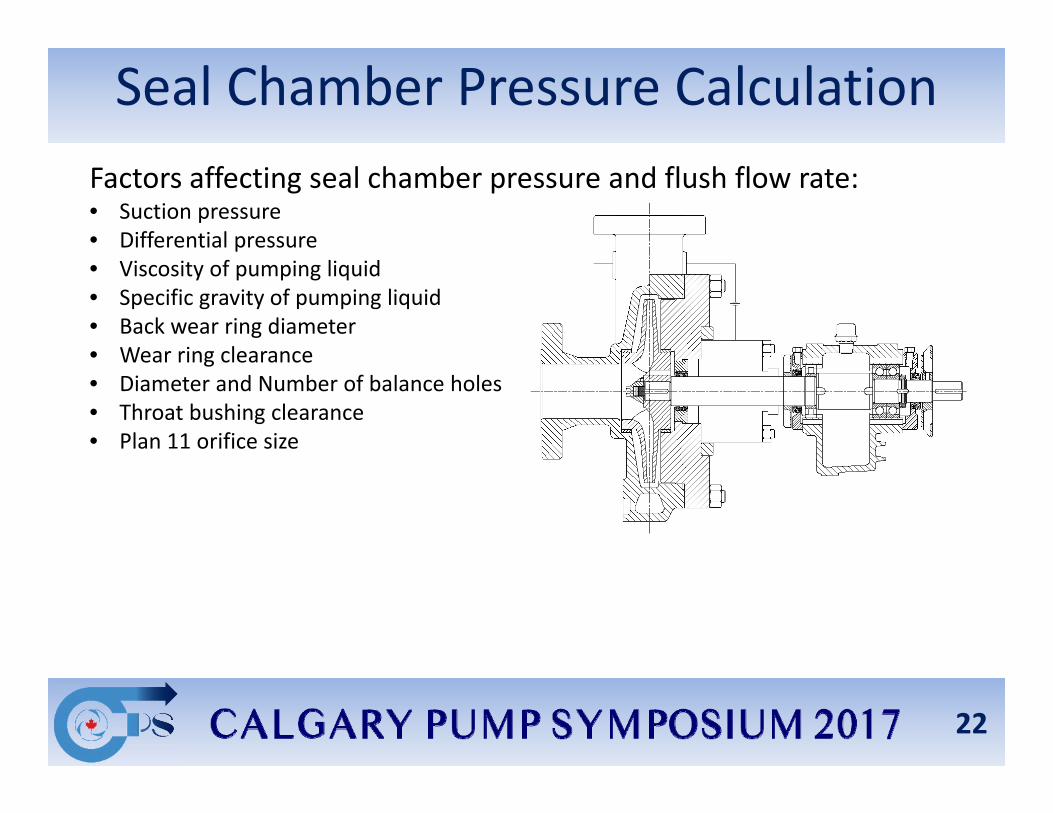
Factors affecting seal chamber pressure and flush flow rate:• Suction pressure• Differential pressure• Viscosity of pumping liquid• Specific gravity of pumping liquid• Back wear ring diameter• Wear ring clearance• Diameter and Number of balance holes• Throat bushing clearance• Plan 11 orifice size
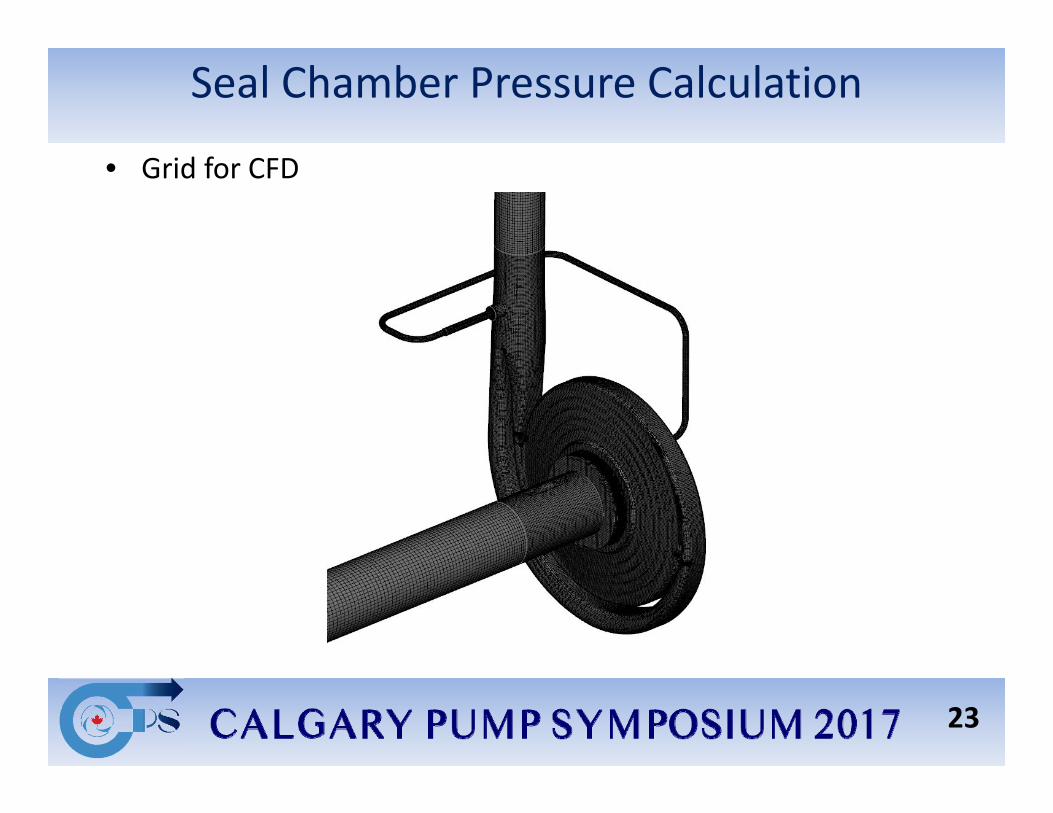
Seal Chamber Pressure Calculation
• Grid for CFD
23
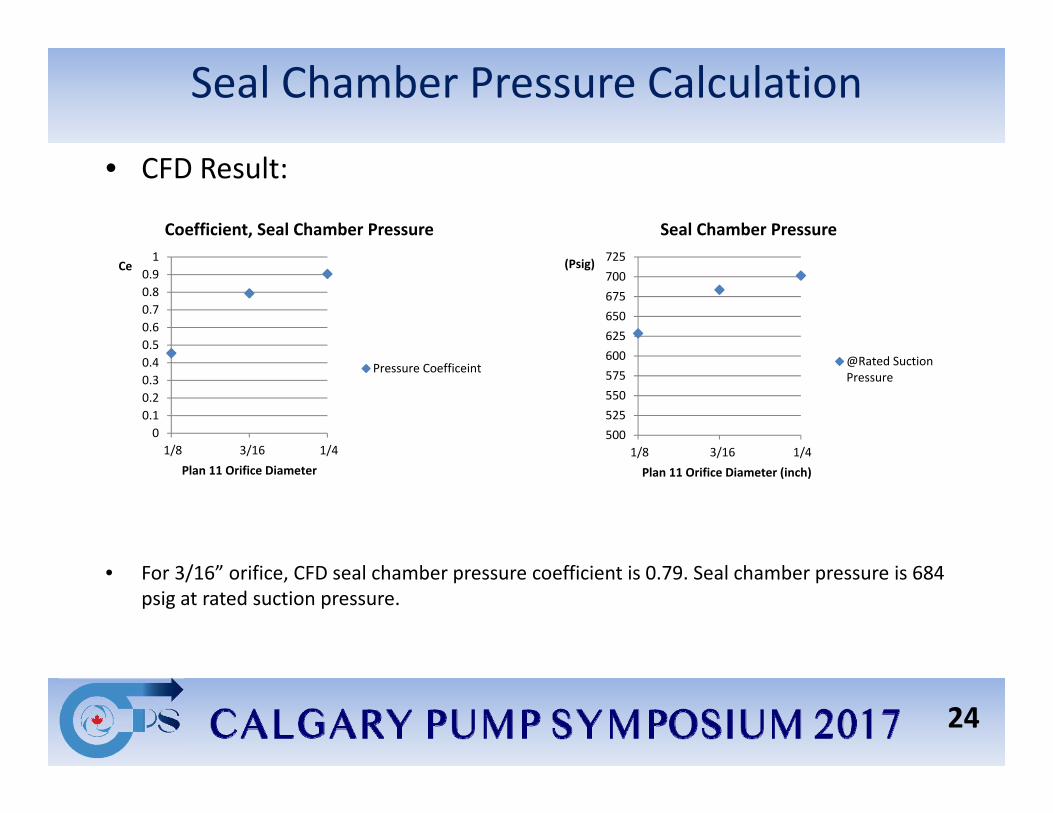
Seal Chamber Pressure Calculation
• CFD Result:
• For 3/16” orifice, CFD seal chamber pressure coefficient is 0.79. Seal chamber pressure is 684 psig at rated suction pressure.
24
00.10.20.30.40.50.60.70.80.91
1/8 3/16 1/4
Ce
Plan 11 Orifice Diameter
Coefficient, Seal Chamber Pressure
Pressure Coefficeint
500525550575600625650675700725
1/8 3/16 1/4
(Psig)
Plan 11 Orifice Diameter (inch)
Seal Chamber Pressure
@Rated SuctionPressure
Seal Chamber Pressure Calculation
• Water test showed seal chamber pressure coefficient was 0.71. Converted to pumping liquid, the seal chamber pressure is 671 psig at rated suction pressure.
• 3/16” orifice is determined as suitable.
25
Mixer Performance Study• CFD modeling and analysis was made for a mixer to examine
its mixing effect when mixing three streams of fluids with different properties: viscosity, specific gravity and temperature. The evaluation of mixing effect was performed by examining the volumetric distribution of each stream at the outlet of the mixer
26
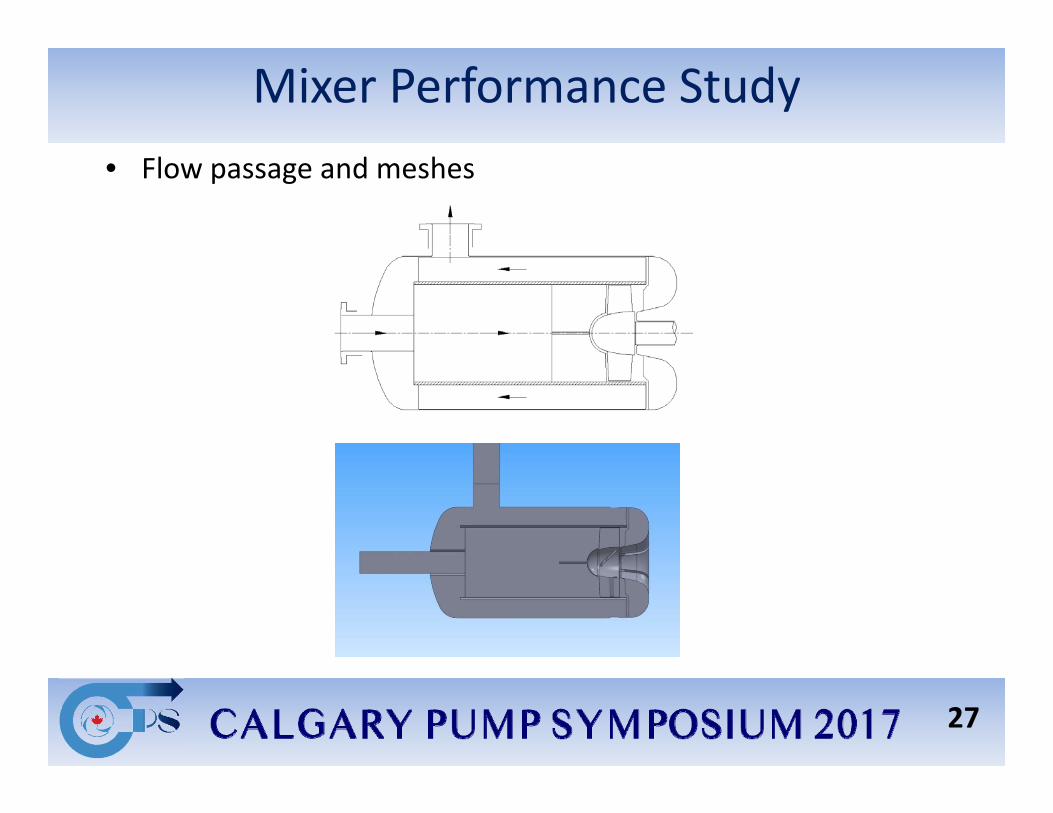
Mixer Performance Study• Flow passage and meshes
27
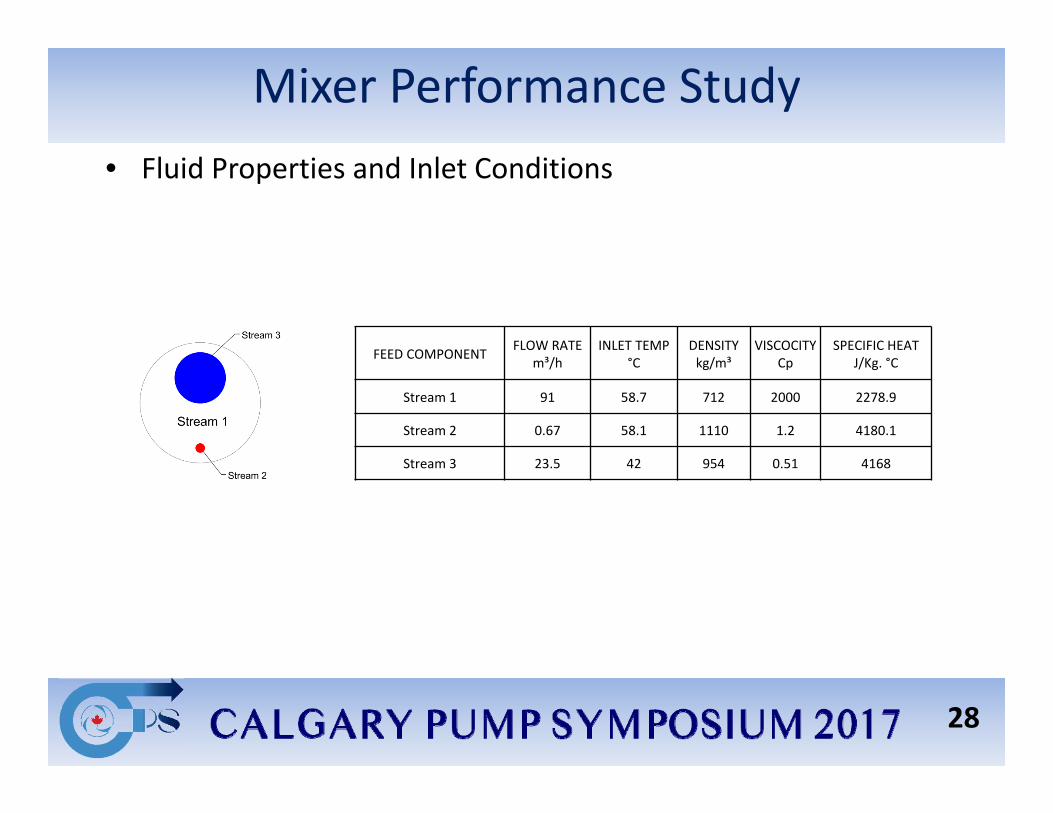
Mixer Performance Study• Fluid Properties and Inlet Conditions
28
FEED COMPONENT FLOW RATE m³/h
INLET TEMP °C
DENSITY kg/m³
VISCOCITY Cp
SPECIFIC HEAT J/Kg. °C
Stream 1 91 58.7 712 2000 2278.9
Stream 2 0.67 58.1 1110 1.2 4180.1
Stream 3 23.5 42 954 0.51 4168
Mixer Performance Study
• Streamlines
29
Mixer Performance Study
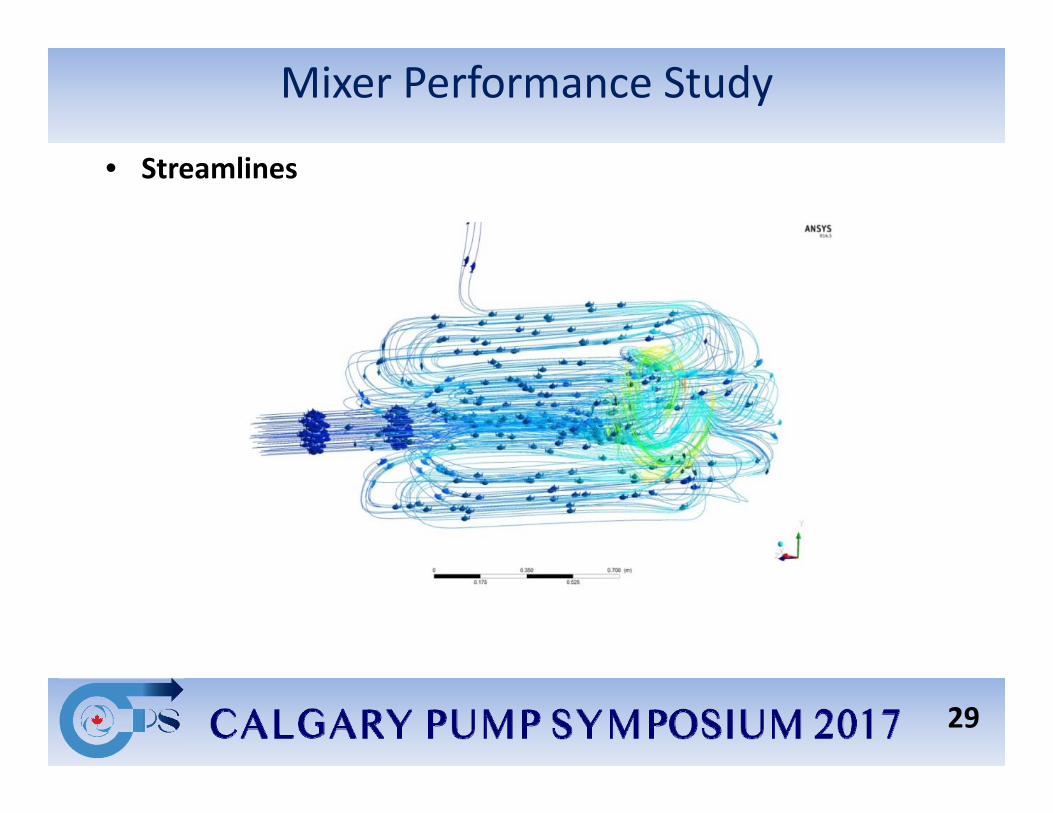
• Above figure shows that some flow enters and exits the mixer while most of the flow circulates inside the mixer. The mass flow of all fluids through the inlet, outlet and the propeller is calculated as shown in table 1
Table 1 Mass Flow Rate of All Fluids (kg/s)
• From the values in table 1, it is interpreted that the rotating propeller mixes the fluids more than thirty times before they exit
30
Inlet Outlet Propeller24.52 24.53 788.4
Mixer Performance Study
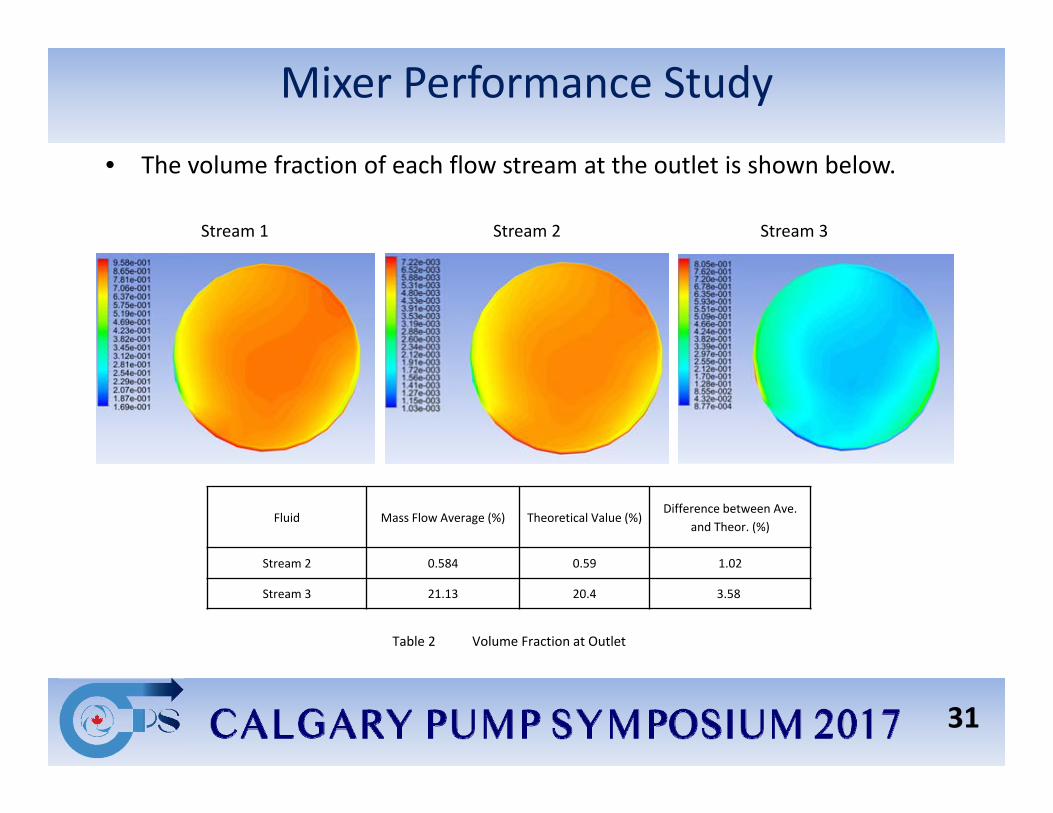
• The volume fraction of each flow stream at the outlet is shown below.
Stream 1 Stream 2 Stream 3
31
Fluid Mass Flow Average (%) Theoretical Value (%)Difference between Ave.
and Theor. (%)
Stream 2 0.584 0.59 1.02
Stream 3 21.13 20.4 3.58
Table 2 Volume Fraction at Outlet
Mixer Performance Study
• Results:CFD analysis shows that the fluid at outlet is uniform after mixing. This predicts that the mixer will be able to mix the three streams of liquids well.
32
CFD Study of a Multi‐stage Centrifugal Pump
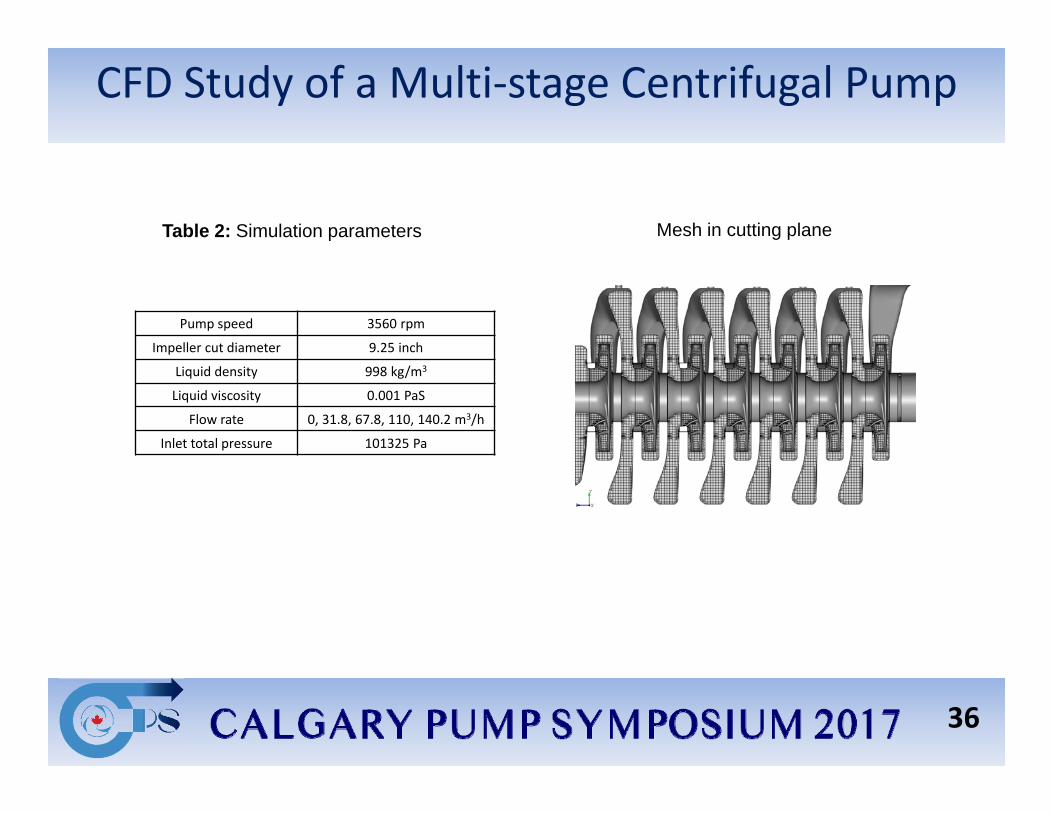
• A horizontally split double volute 14‐stage centrifugal pump with opposed impeller configuration. The two series of impellers are installed back to back to balance the axial thrust generated by the rotating element. The design flow rate is 118m3/h, design head is 1430m, rotating speed is 3560 RPM, and impeller design dimeter is 9.5 inch. The pump specific speed is 20.1(SI). For the rated point of 110 m3/h flowrate and 1285 m head, the test impeller diameter is 9.25 inch
• The complete pump with all the geometry details is included in the 3D CFD model. The focus of the study was on the performance simulation and the characteristics of multistage pump flow patterns
33
CFD Study of a Multi‐stage Centrifugal Pump
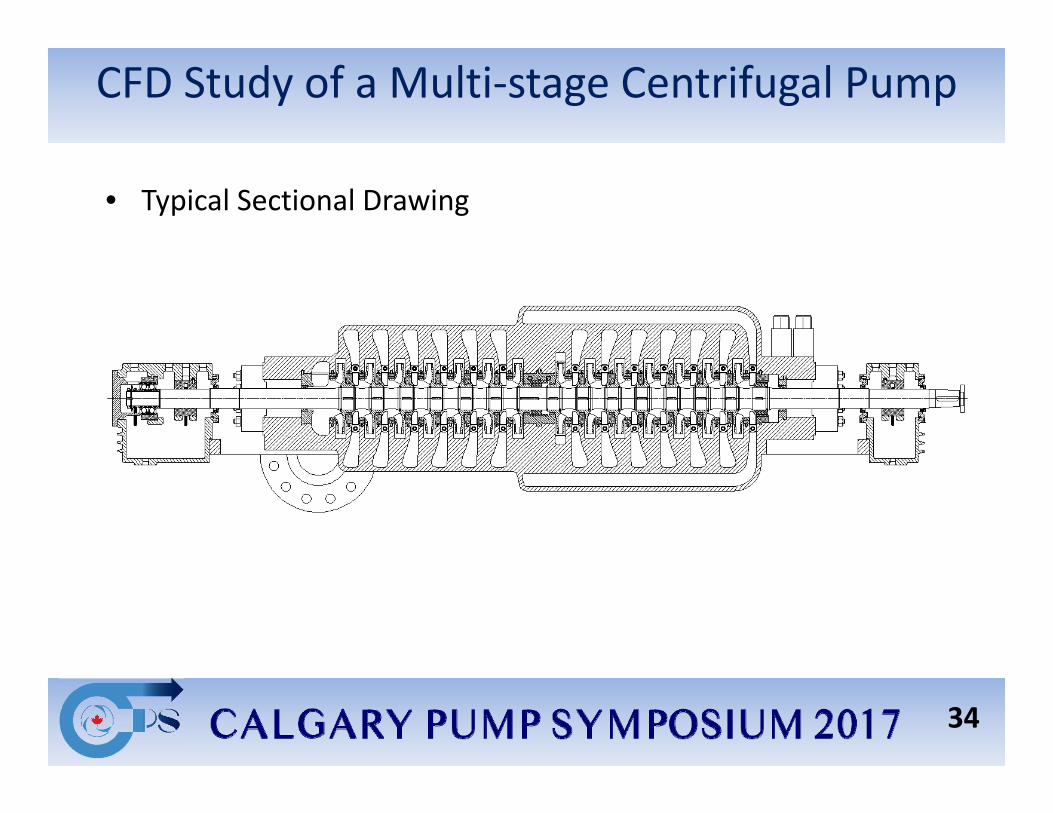
• Typical Sectional Drawing
34
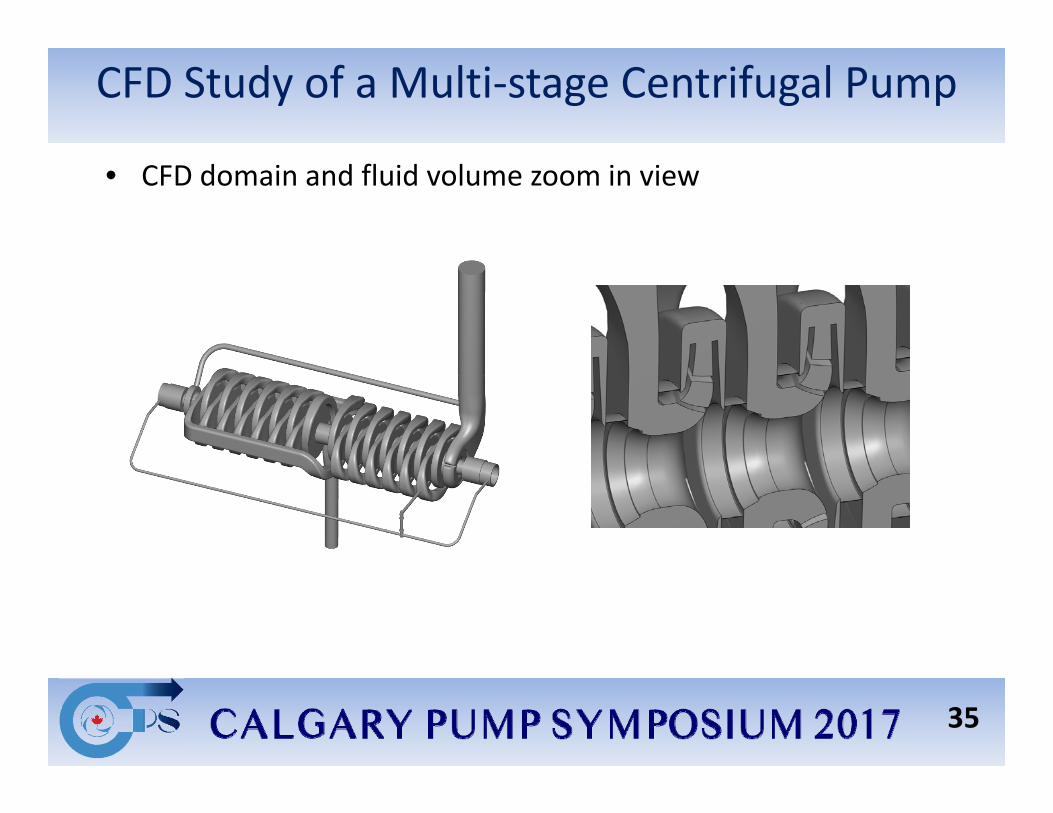
CFD Study of a Multi‐stage Centrifugal Pump
• CFD domain and fluid volume zoom in view
35
CFD Study of a Multi‐stage Centrifugal Pump
36
Table 2: Simulation parameters
Pump speed 3560 rpm
Impeller cut diameter 9.25 inch
Liquid density 998 kg/m3
Liquid viscosity 0.001 PaS
Flow rate 0, 31.8, 67.8, 110, 140.2 m3/h
Inlet total pressure 101325 Pa
Mesh in cutting plane
CFD Study of a Multi‐stage Centrifugal Pump
37
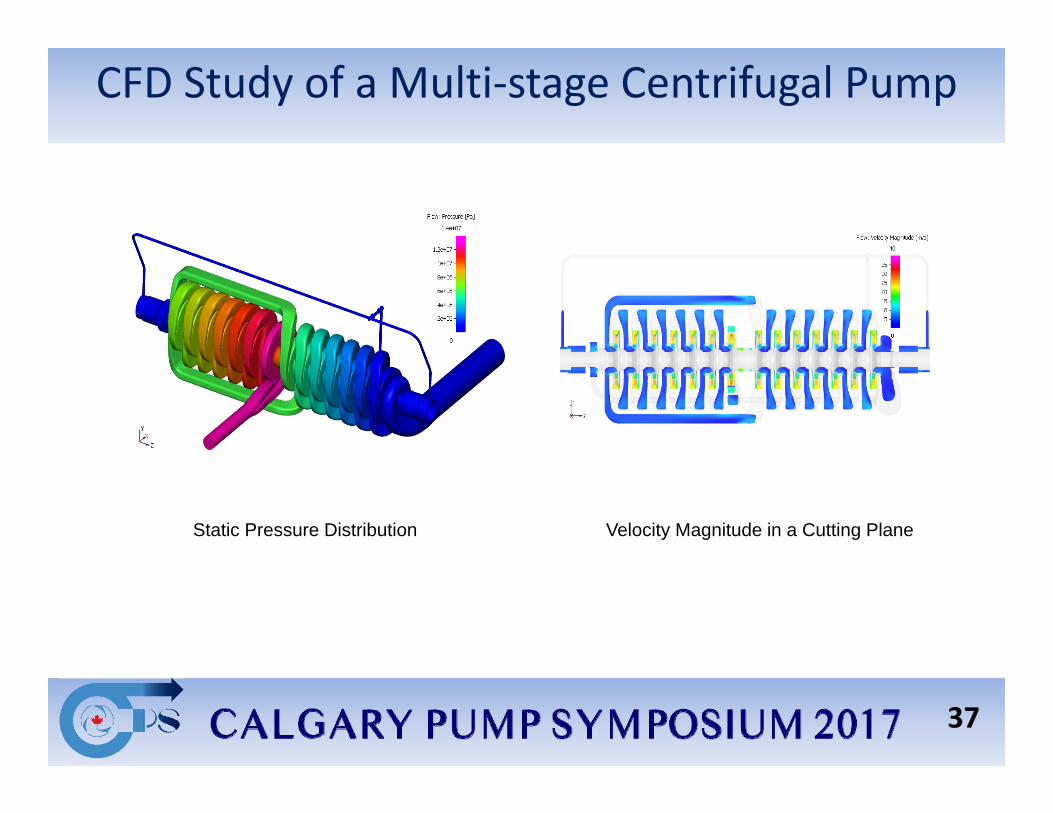
Static Pressure Distribution Velocity Magnitude in a Cutting Plane
CFD Study of a Multi‐stage Centrifugal Pump
38
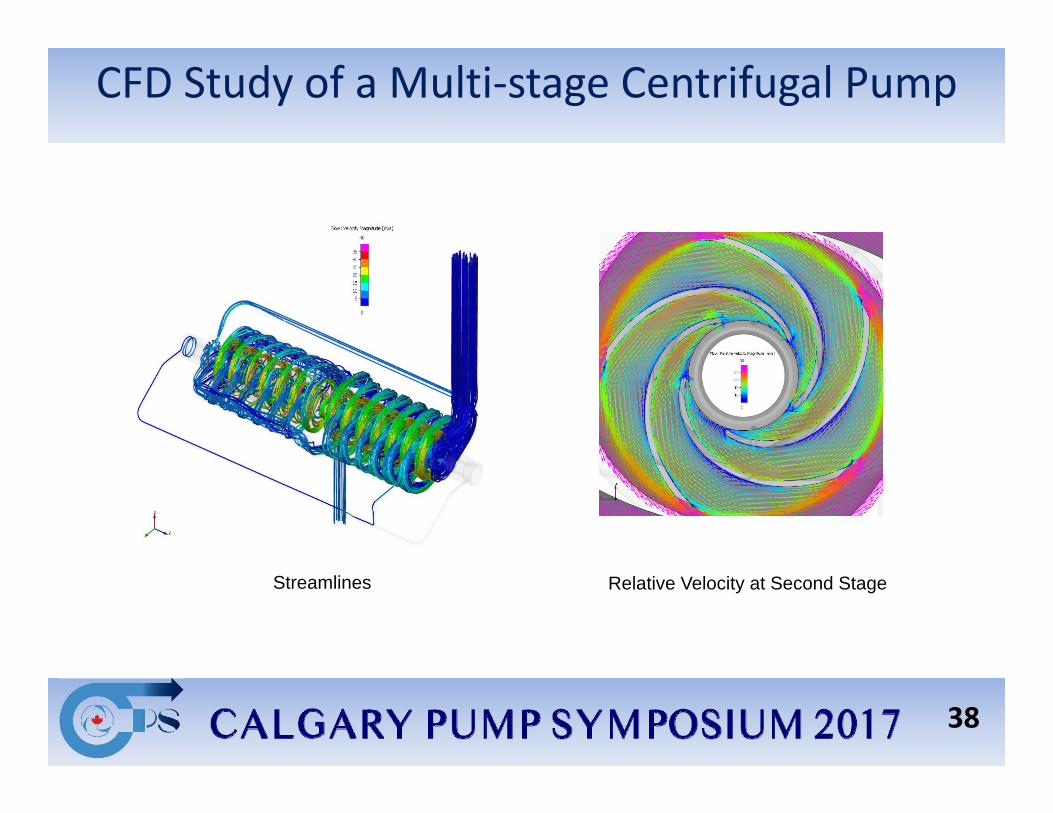
Streamlines Relative Velocity at Second Stage
CFD Study of a Multi‐stage Centrifugal Pump
39
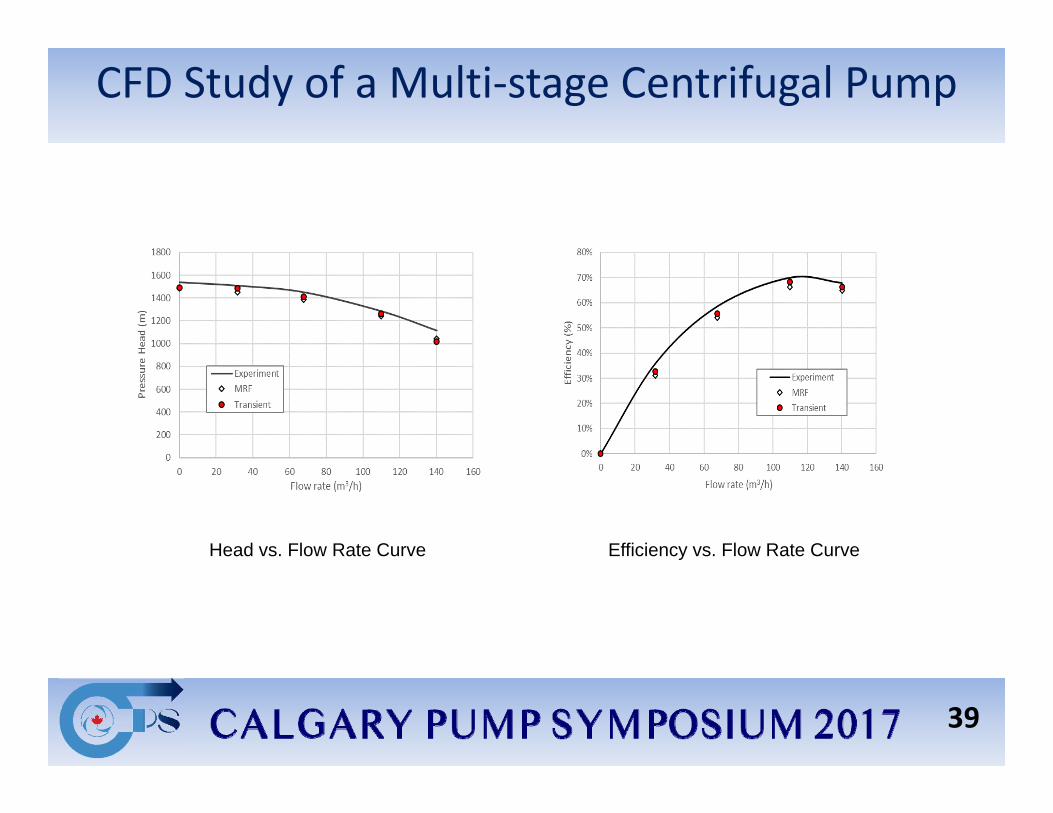
Head vs. Flow Rate Curve Efficiency vs. Flow Rate Curve
CFD Study of a Multi‐stage Centrifugal Pump
• RESULTS:CFD predictions were validated against available experiment data. Predictedpump performance matches well with test results. CFD simulation alsoreveals lot of details of the flow field such as pressure/velocity distributionand transition, which potentially can be used to better understand andfurther improve the pump design.
40
CONCLUSIONS• CFD approach has been routinely used in pump performance prediction,
parametric study, cavitation analysis, drooping curve correction, axial thrust evaluation, seal chamber pressure calculation, etc. Accuracy is satisfactory in most applications. It makes it possible to examine the hydraulic characteristics in the whole passage way and to find any design flaws. It provides an effective tool in design and manufacturing of centrifugal pumps.
• It is especially valuable if proven accurate when simulate the performance on a specific pumping liquid that is not water.
• To make better use of CFD software, further work shall be on (to developers):1), to improve accuracy, stability and convergence of calculations2), applications in very high viscosity calculation3), application in fluid‐structure interaction (for FEA, vibration study, etc.)
41