Embed Size (px)
Citation preview

CFD for Wastewater CaseStudies: Sedimentation, Mixing
and Disinfection
Randal SamstagCivil and Sanitary Engineer
Ed WickleinCarollo Engineers
Joel DucosteNorth Carolina State University
Stephen SaundersIbis Group CFD

Case Study: Activated Sludge Clarifier
• Radial flow clarifier
• Questions:
– Optimum Depth?
– Optimum Inlet ?
– Optimum Feedwell?
– Optimum Effluent Zone?

Case Study: Activated Sludge ClarifierExisting Condition CFD

Case Study: Activated Sludge ClarifierAlternative Inlet Configurations

Case Study: Activated Sludge ClarifierAlternative Velocity Vector Plans
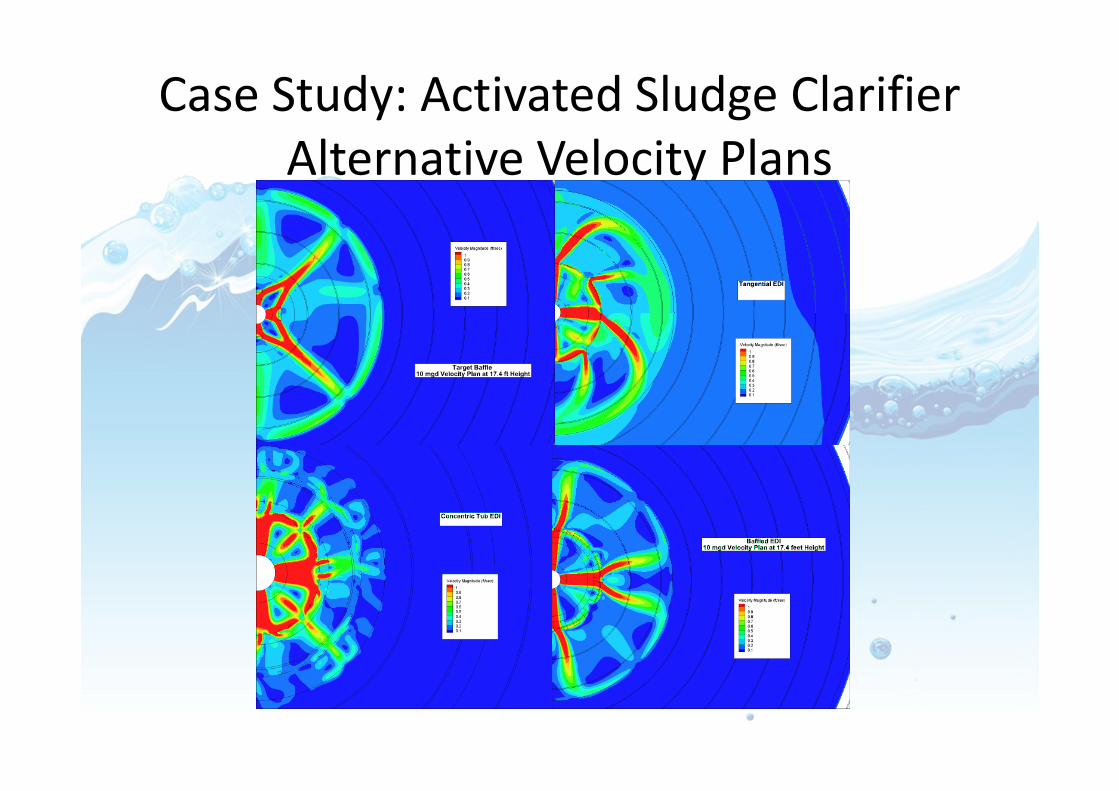
Case Study: Activated Sludge ClarifierAlternative Velocity Plans

Case Study: Activated Sludge ClarifierAlternative Velocity Profiles

Case Study: Activated Sludge ClarifierComparison Solids Profiles
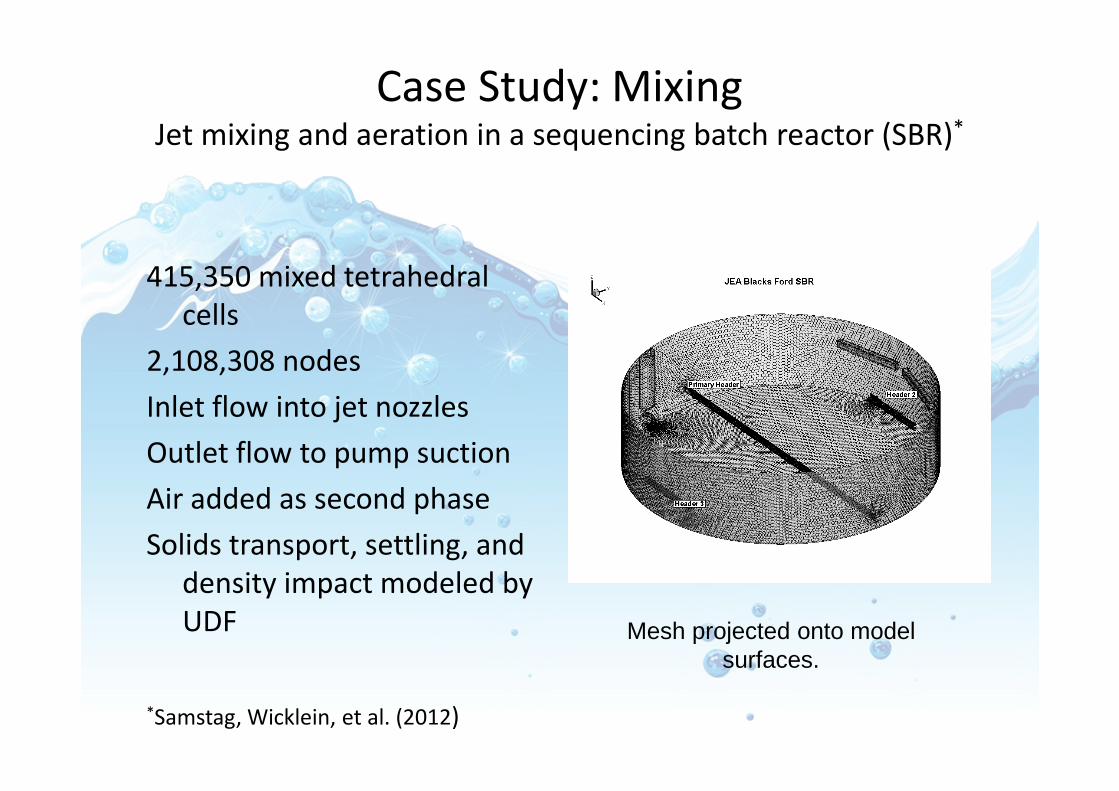
Case Study: MixingJet mixing and aeration in a sequencing batch reactor (SBR)*
415,350 mixed tetrahedralcells
2,108,308 nodes
Inlet flow into jet nozzles
Outlet flow to pump suction
Air added as second phase
Solids transport, settling, anddensity impact modeled byUDF
*Samstag, Wicklein, et al. (2012)
Mesh projected onto modelsurfaces.
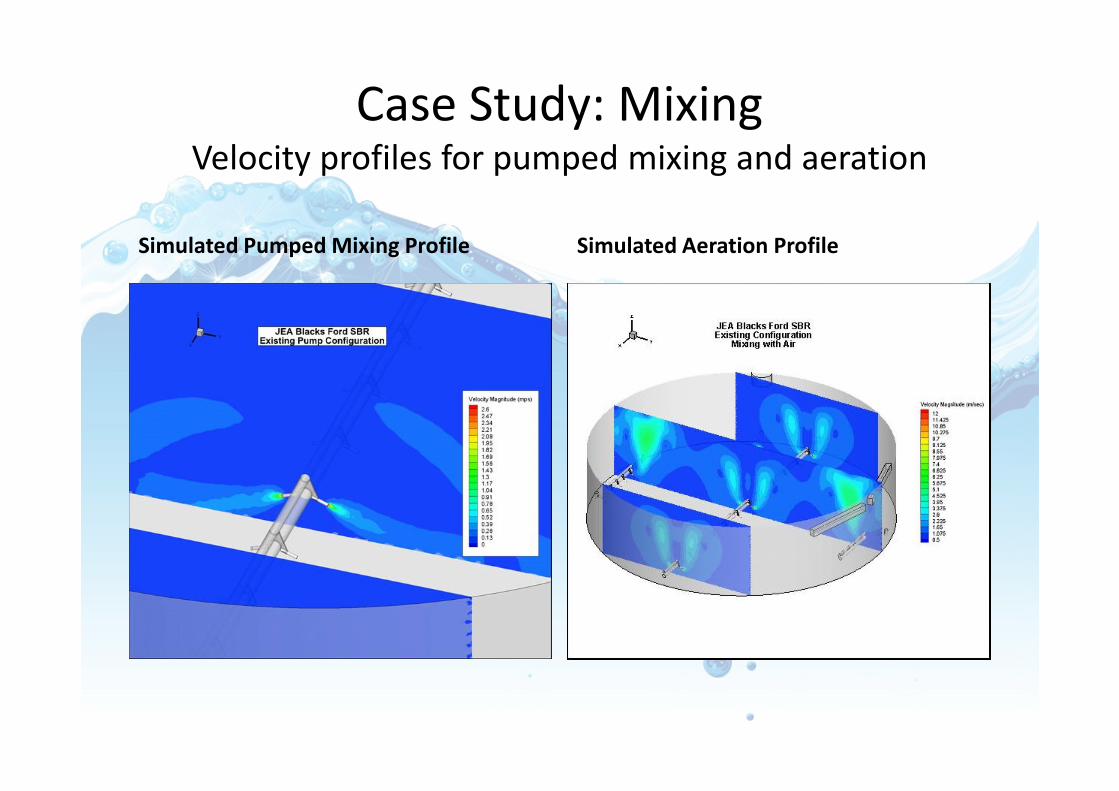
Case Study: MixingVelocity profiles for pumped mixing and aeration
Simulated Pumped Mixing Profile Simulated Aeration Profile
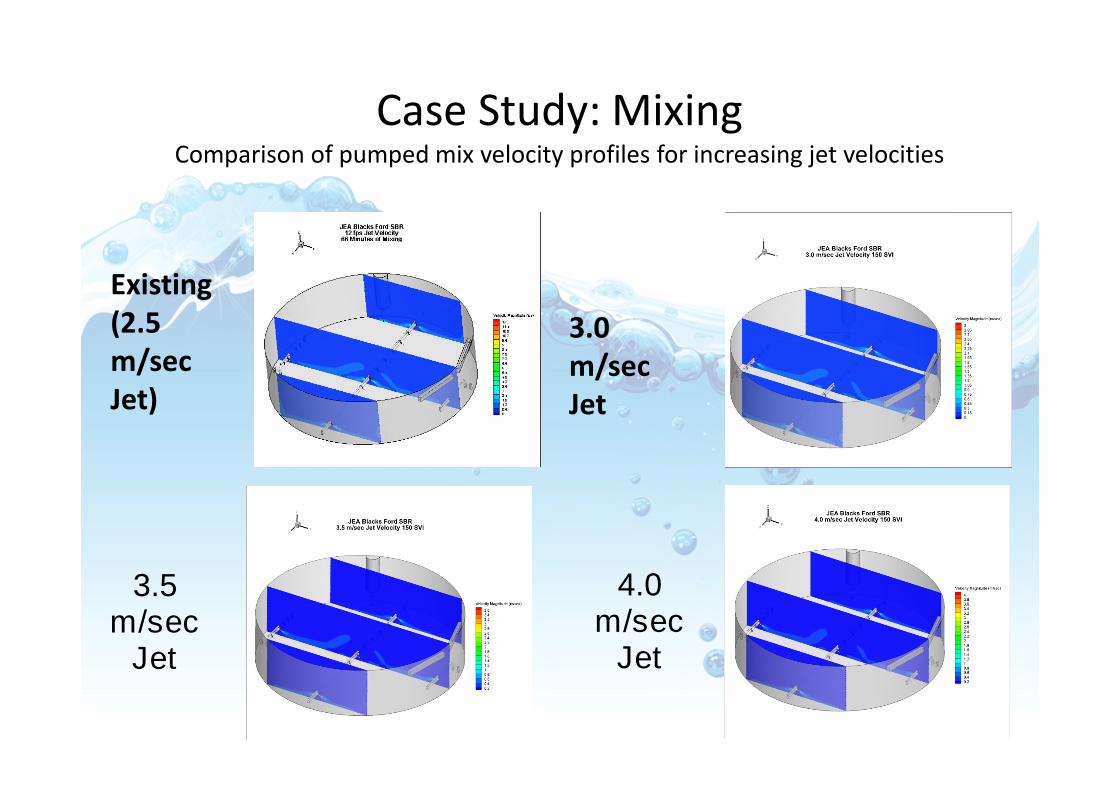
Case Study: MixingComparison of pumped mix velocity profiles for increasing jet velocities
Existing(2.5m/secJet)
3.0m/secJet
3.5m/sec
Jet
4.0m/sec
Jet

Case Study: MixingComparison of solids profiles for increasing jet velocities
Existing(2.5m/secJet)
3.0m/secJet
3.5m/sec
Jet
4.0m/sec
Jet
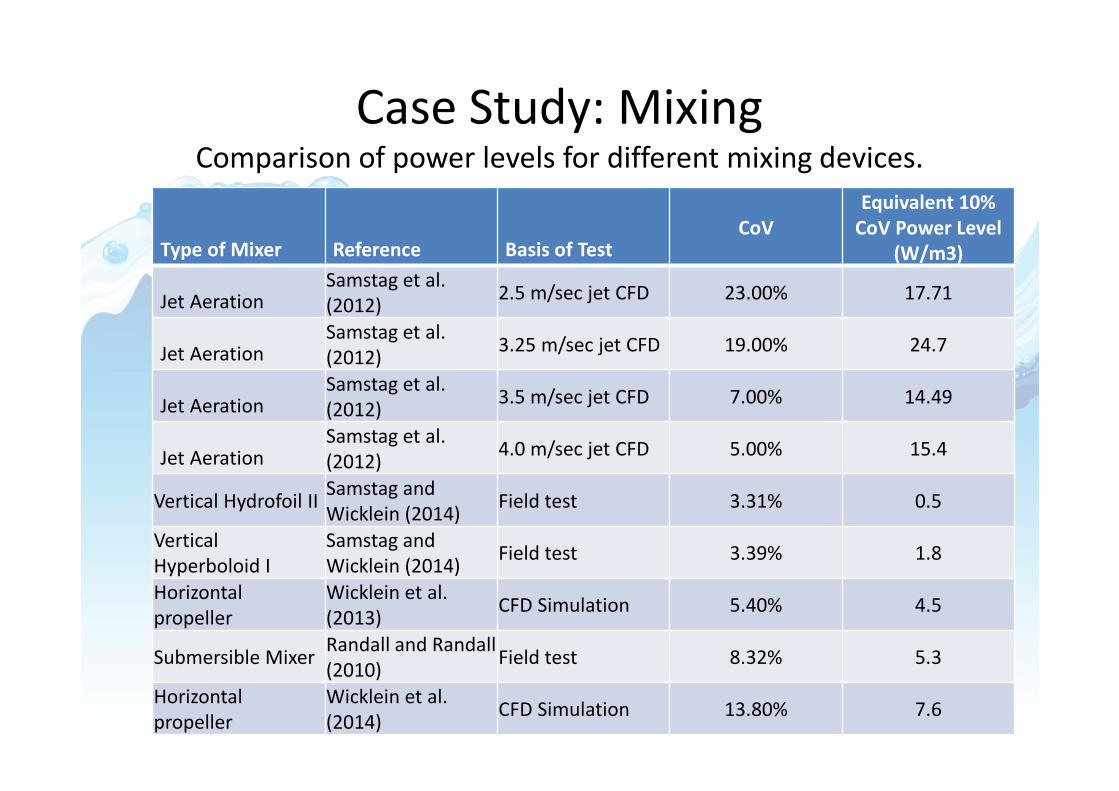
Case Study: MixingComparison of power levels for different mixing devices.
Type of Mixer Reference Basis of TestCoV
Equivalent 10%CoV Power Level
(W/m3)
Jet AerationSamstag et al.(2012)
2.5 m/sec jet CFD 23.00% 17.71
Jet AerationSamstag et al.(2012)
3.25 m/sec jet CFD 19.00% 24.7
Jet AerationSamstag et al.(2012)
3.5 m/sec jet CFD 7.00% 14.49
Jet AerationSamstag et al.(2012)
4.0 m/sec jet CFD 5.00% 15.4
Vertical Hydrofoil IISamstag andWicklein (2014)
Field test 3.31% 0.5
VerticalHyperboloid I
Samstag andWicklein (2014)
Field test 3.39% 1.8
Horizontalpropeller
Wicklein et al.(2013)
CFD Simulation 5.40% 4.5
Submersible MixerRandall and Randall(2010)
Field test 8.32% 5.3
Horizontalpropeller
Wicklein et al.(2014)
CFD Simulation 13.80% 7.6

Case Study: MixingComparison of density-coupled and neutral density simulations
Density-coupled
Solids transport modelcalculates the local solidsconcentration based onflow regime.
The influence of the localsolids concentration on thelocal density is theniteratively calculated.
This approach was verified bythe field solids profile testdata.
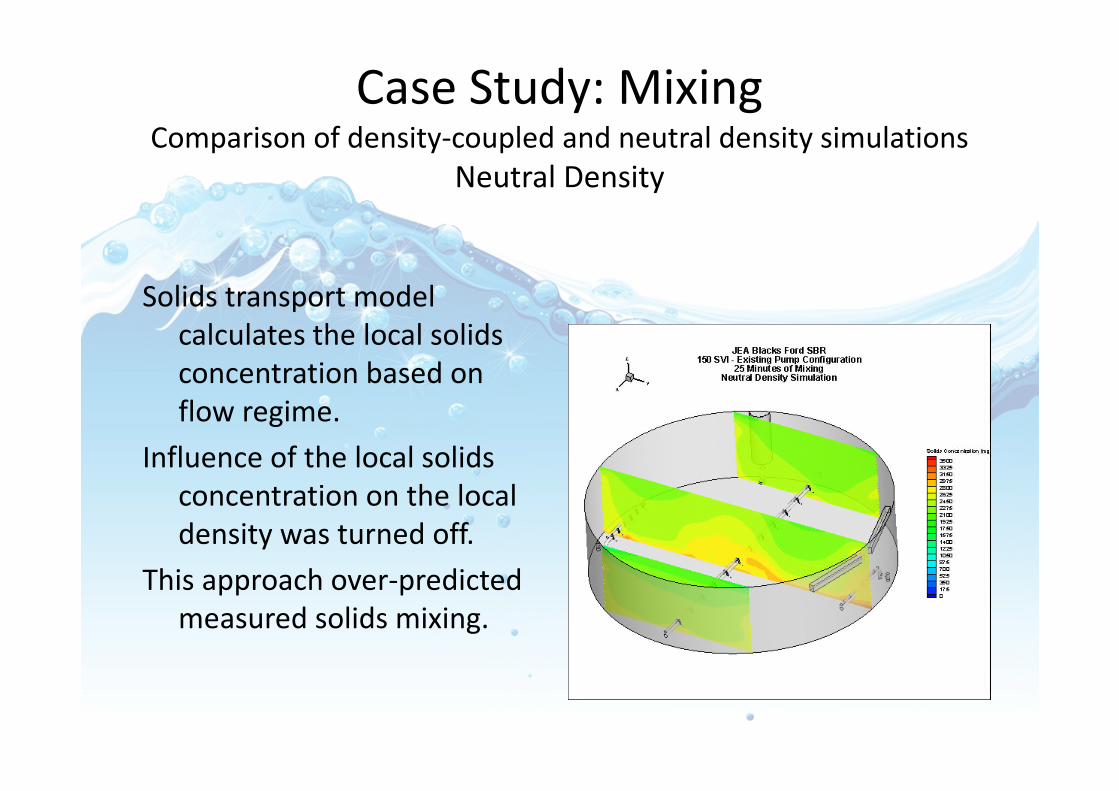
Case Study: MixingComparison of density-coupled and neutral density simulations
Neutral Density
Solids transport modelcalculates the local solidsconcentration based onflow regime.
Influence of the local solidsconcentration on the localdensity was turned off.
This approach over-predictedmeasured solids mixing.
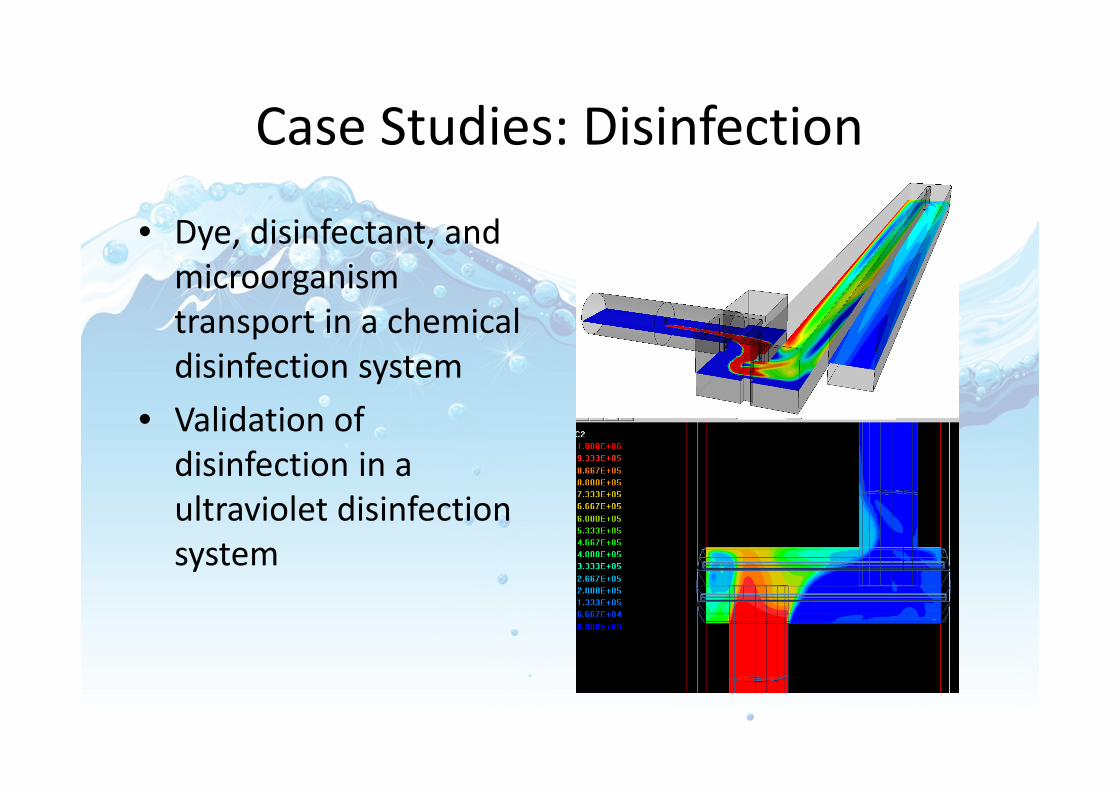
Case Studies: Disinfection
• Dye, disinfectant, andmicroorganismtransport in a chemicaldisinfection system
• Validation ofdisinfection in aultraviolet disinfectionsystem
0
0.1
0.2
0.3
0.4
0.5
0.6
0.7
0.8
0.9
1
0 0.5 1 1.5
no
rmali
zed
co
ncen
trati
on
t/TTDT
Residence Time Dstribution
T10
TTDT
T90
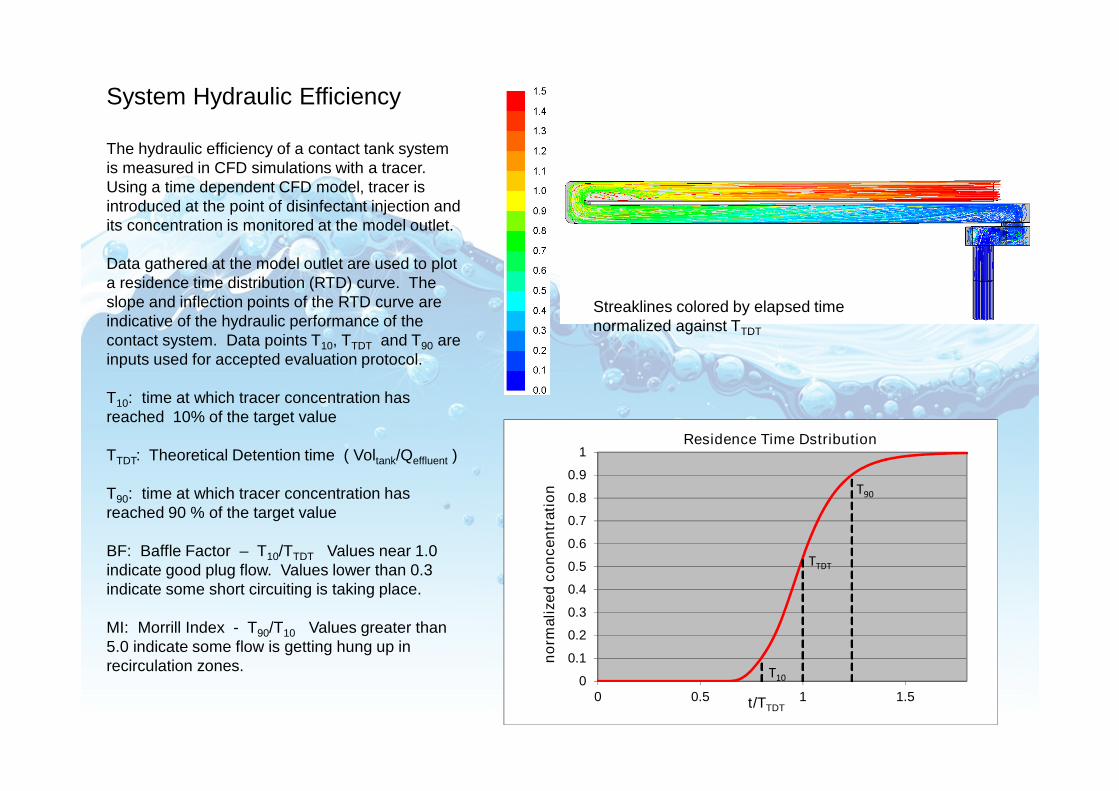
System Hydraulic Efficiency
The hydraulic efficiency of a contact tank systemis measured in CFD simulations with a tracer.Using a time dependent CFD model, tracer isintroduced at the point of disinfectant injection andits concentration is monitored at the model outlet.
Data gathered at the model outlet are used to plota residence time distribution (RTD) curve. Theslope and inflection points of the RTD curve areindicative of the hydraulic performance of thecontact system. Data points T10, TTDT and T90 areinputs used for accepted evaluation protocol.
T10: time at which tracer concentration hasreached 10% of the target value
TTDT: Theoretical Detention time ( Voltank/Qeffluent )
T90: time at which tracer concentration hasreached 90 % of the target value
BF: Baffle Factor – T10/TTDT Values near 1.0indicate good plug flow. Values lower than 0.3indicate some short circuiting is taking place.
MI: Morrill Index - T90/T10 Values greater than5.0 indicate some flow is getting hung up inrecirculation zones.
Streaklines colored by elapsed timenormalized against TTDT
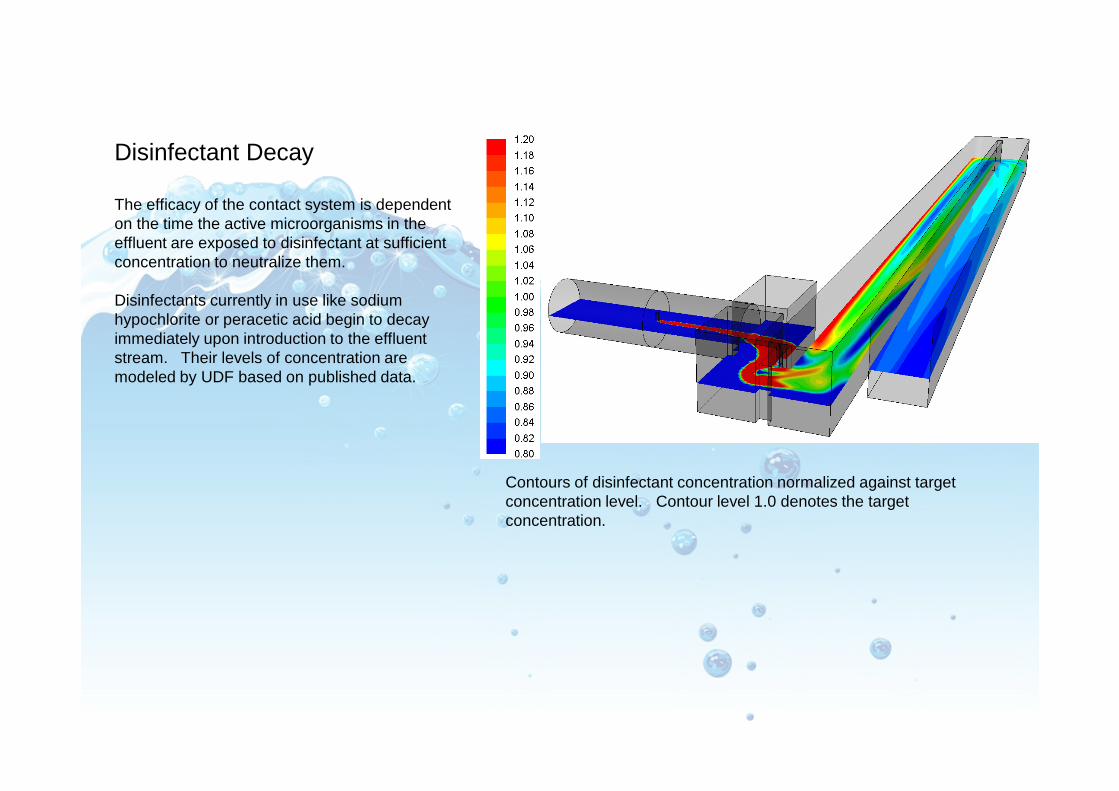
Disinfectant Decay
The efficacy of the contact system is dependenton the time the active microorganisms in theeffluent are exposed to disinfectant at sufficientconcentration to neutralize them.
Disinfectants currently in use like sodiumhypochlorite or peracetic acid begin to decayimmediately upon introduction to the effluentstream. Their levels of concentration aremodeled by UDF based on published data.
Contours of disinfectant concentration normalized against targetconcentration level. Contour level 1.0 denotes the targetconcentration.

Log(N/N0) (bio. organisms)
Neutralization ofMicroorganisms
The rates at which microorganisms areneutralized are specific to the disinfectant in useand the target microorganism. For example,different coliforms will have differing sensitivitiesto the disinfectant in use. Their neutralization issimulated using UDF’s based on published data.
Contours of microorganism population. N is the localpopulation and N0 is the population in the effluent prior toexposure to the disinfectant.
UV Reactor Validation and the use of CFD
• In an effort to quantify the UV reactorperformance, UV reactors must be validated atdifferent flow rates, water quality conditions, andlamp power settings– Reason:
• to determine if the target reduction equivalent dose (RED) isbeing met
• To ensure that the performance can be monitored with a UVsensor.
• Validation tests are the only means of confirmingUV reactor performance since UV does not leavea measurable disinfectant residual
Validation• Validation tests can be performed:
– Onsite at the WTP
• May not be practical or can be cost prohibitive for largeWTPs.
– Offsite at designated validation facilities
• Tests are performed under conditions that mimic the rangeof possible conditions seen at the intended WTP
• Tests are performed assuming a worst case hydrauliccondition, which is assumed by placing an elbow upstreamfrom the reactor inlet

• Investigate the impact of an upstream elbow in a pilot-scale UV reactor using biodosimetry measurements.
• Perform numerical simulations of the pilot-scalereactor to evaluate model performance.
• Perform simulations of a full-scale reactor withalternative upstream elbow configurations using avalidated model.
Validation Objectives
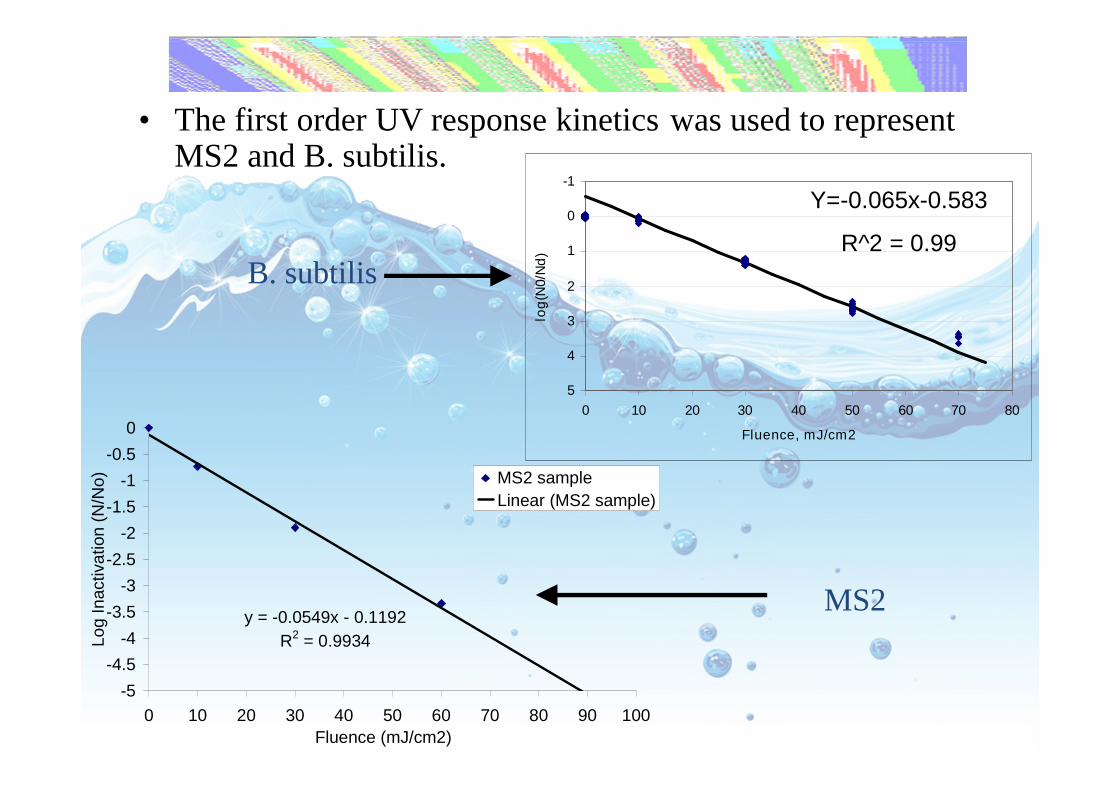
Methods: Microbial UV Response Kinetics
-1
0
1
2
3
4
5
0 10 20 30 40 50 60 70 80
Fluence, mJ/cm2
log
(N0/N
d)
• The first order UV response kinetics was used to representMS2 and B. subtilis.
B. subtilis
MS2y = -0.0549x - 0.1192
R2 = 0.9934
-5
-4.5
-4
-3.5
-3
-2.5
-2
-1.5
-1
-0.5
0
0 10 20 30 40 50 60 70 80 90 100
Fluence (mJ/cm2)
Lo
gIn
activa
tion
(N/N
o) MS2 sample
Linear (MS2 sample)
Y=-0.065x-0.583
R^2 = 0.99
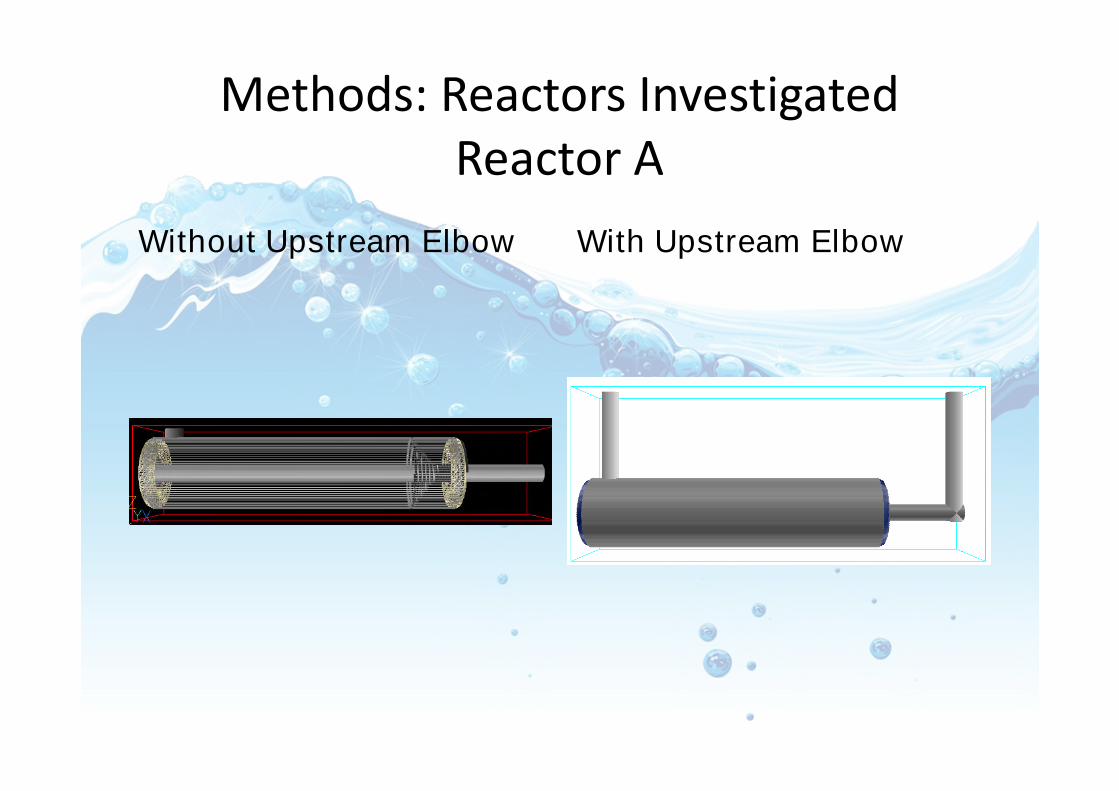
Methods: Reactors InvestigatedReactor A
Without Upstream Elbow With Upstream Elbow
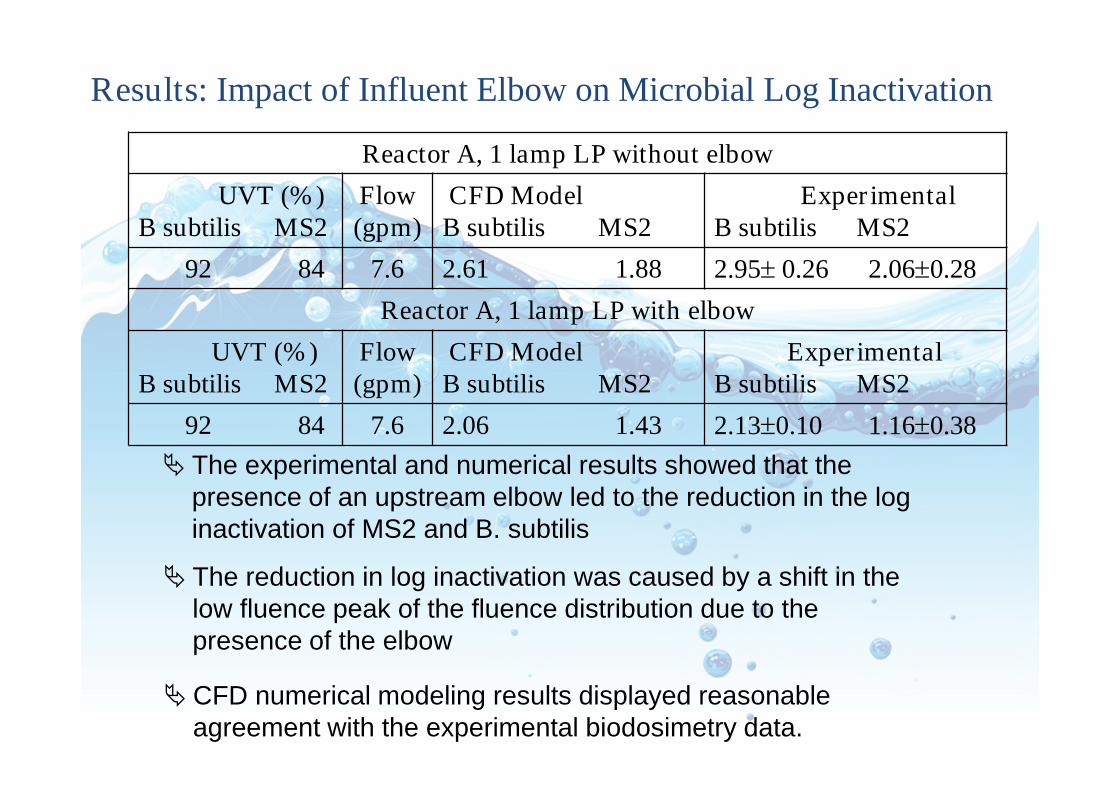
Results: Impact of Influent Elbow on Microbial Log Inactivation
The experimental and numerical results showed that thepresence of an upstream elbow led to the reduction in the loginactivation of MS2 and B. subtilis
The reduction in log inactivation was caused by a shift in thelow fluence peak of the fluence distribution due to thepresence of the elbow
CFD numerical modeling results displayed reasonableagreement with the experimental biodosimetry data.
Reactor A, 1 lamp LP without elbow
UVT (%)B subtilis MS2
Flow(gpm)
CFD ModelB subtilis MS2
ExperimentalB subtilis MS2
92 84 7.6 2.61 1.88 2.95 0.26 2.060.28
Reactor A, 1 lamp LP with elbow
UVT (%)B subtilis MS2
Flow(gpm)
CFD ModelB subtilis MS2
ExperimentalB subtilis MS2
92 84 7.6 2.06 1.43 2.130.10 1.160.38
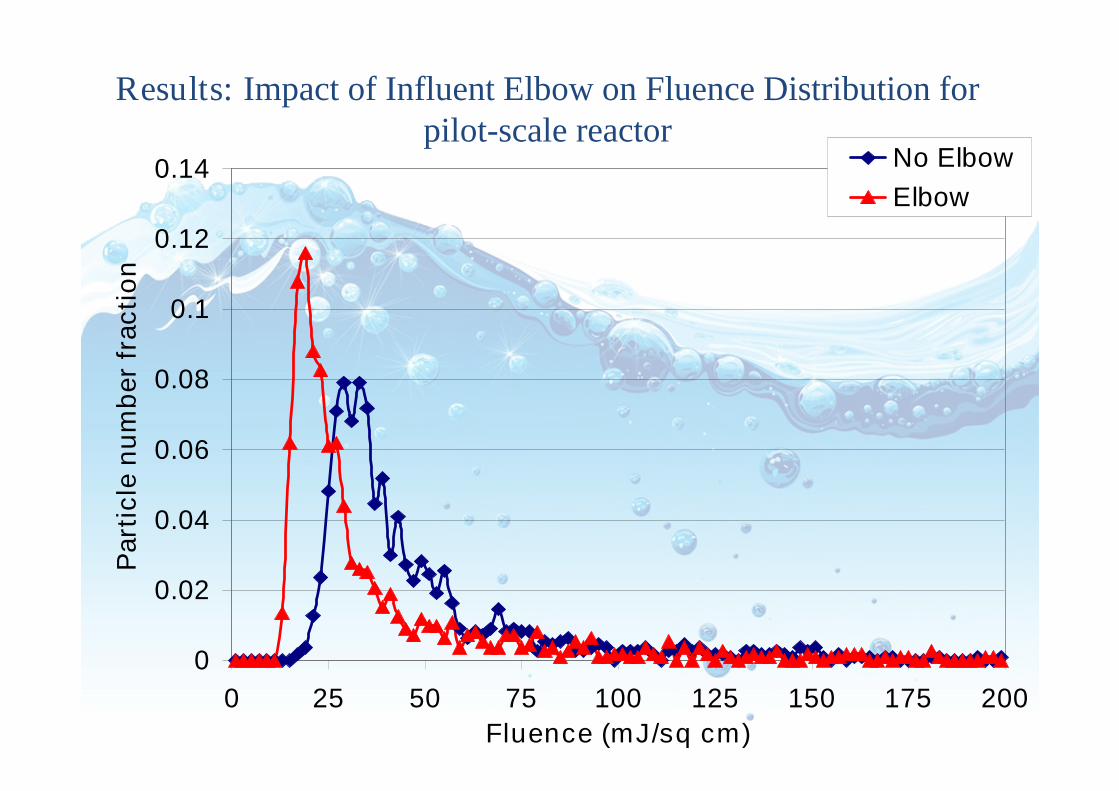
Results: Impact of Influent Elbow on Fluence Distribution forpilot-scale reactor
0
0.02
0.04
0.06
0.08
0.1
0.12
0.14
0 25 50 75 100 125 150 175 200
Fluence (mJ/sq cm)
Part
icle
nu
mb
er
fracti
on
No Elbow
Elbow
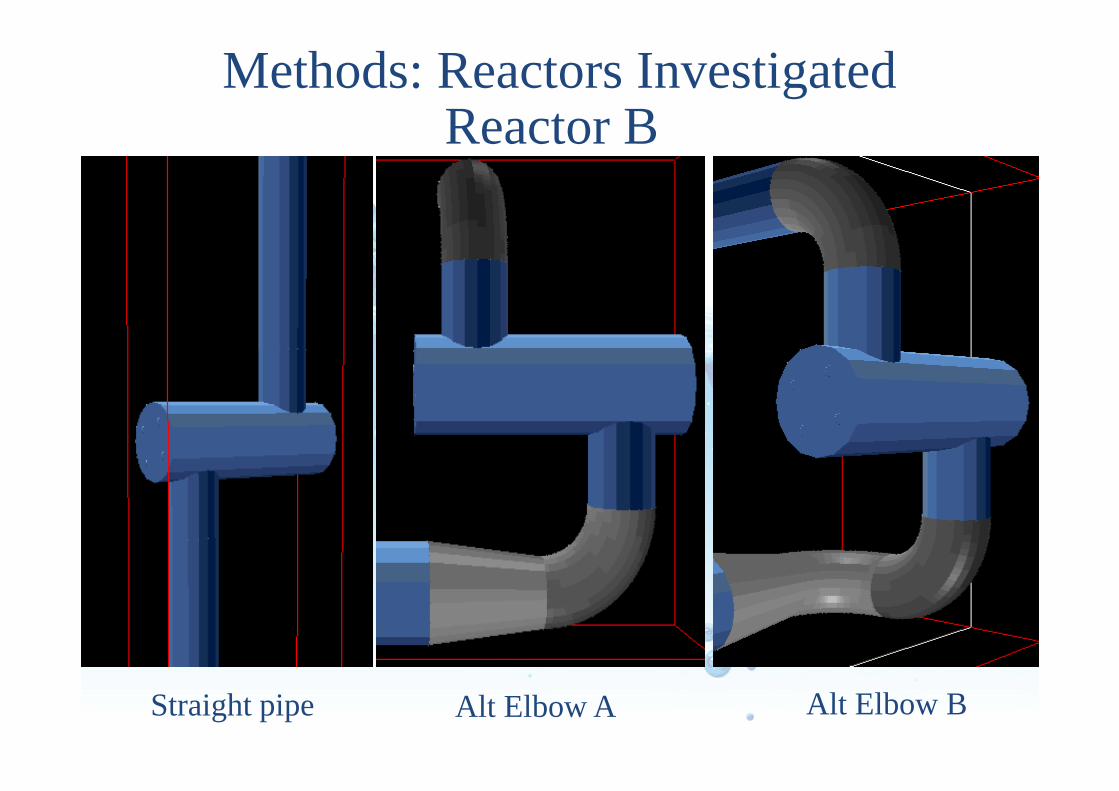
Methods: Reactors Investigated
Straight pipe
Reactor B
Alt Elbow A Alt Elbow B
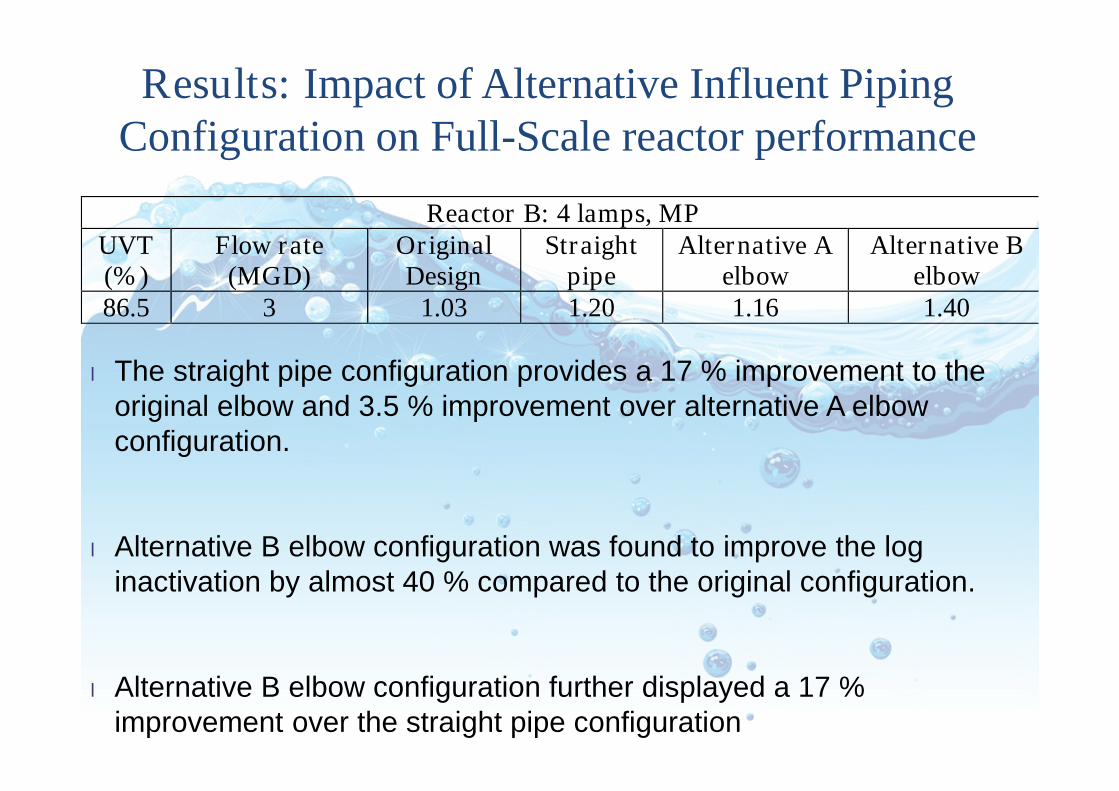
Results: Impact of Alternative Influent PipingConfiguration on Full-Scale reactor performance
l The straight pipe configuration provides a 17 % improvement to theoriginal elbow and 3.5 % improvement over alternative A elbowconfiguration.
l Alternative B elbow configuration was found to improve the loginactivation by almost 40 % compared to the original configuration.
l Alternative B elbow configuration further displayed a 17 %improvement over the straight pipe configuration
Reactor B: 4 lamps, MPUVT(%)
Flow rate(MGD)
OriginalDesign
Straightpipe
Alternative Aelbow
Alternative Belbow
86.5 3 1.03 1.20 1.16 1.40

Results: Eulerian representation of microbial transport in Reactor B
Original
configuration
Straight pipe
configuration
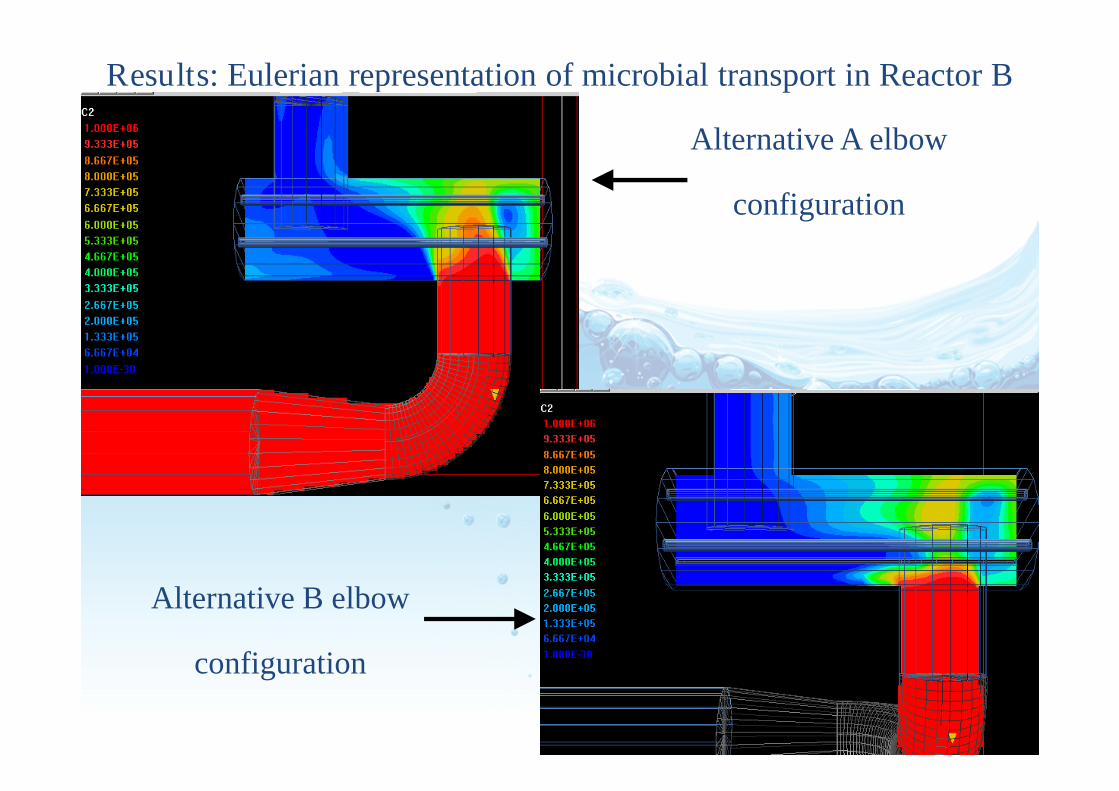
Results: Eulerian representation of microbial transport in Reactor B
Alternative A elbow
configuration
Alternative B elbow
configuration
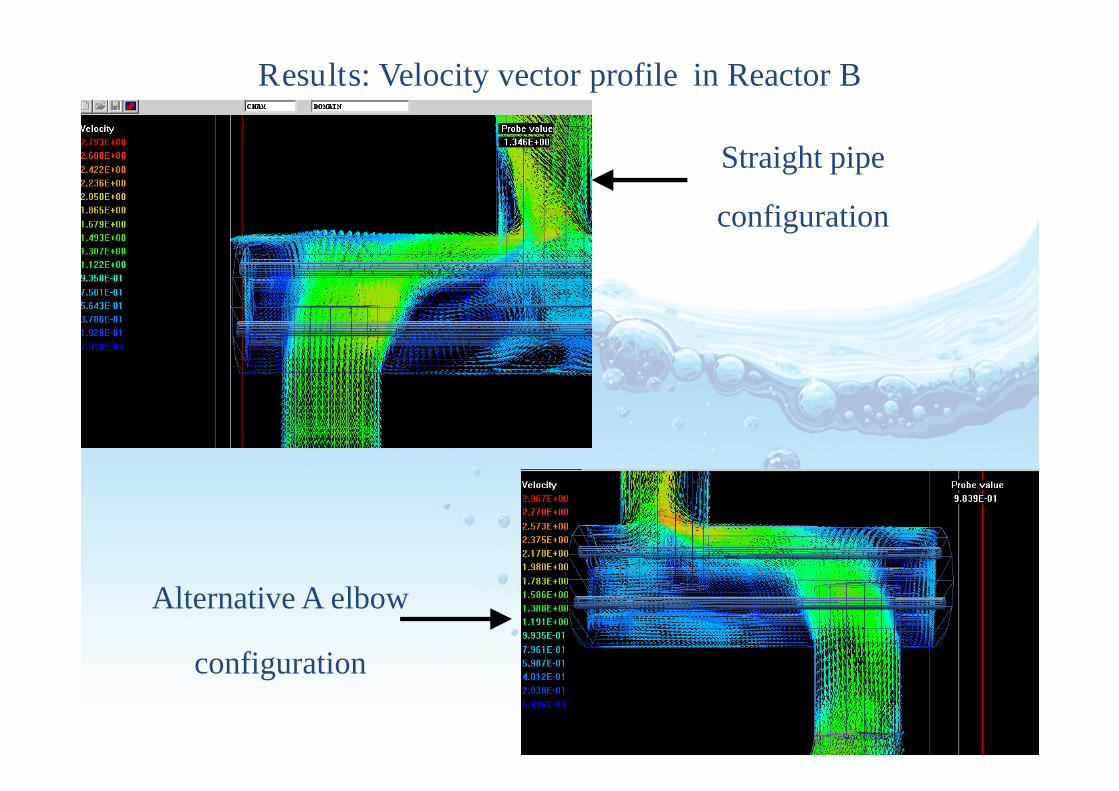
Results: Velocity vector profile in Reactor B
Alternative A elbow
configuration
Straight pipe
configuration
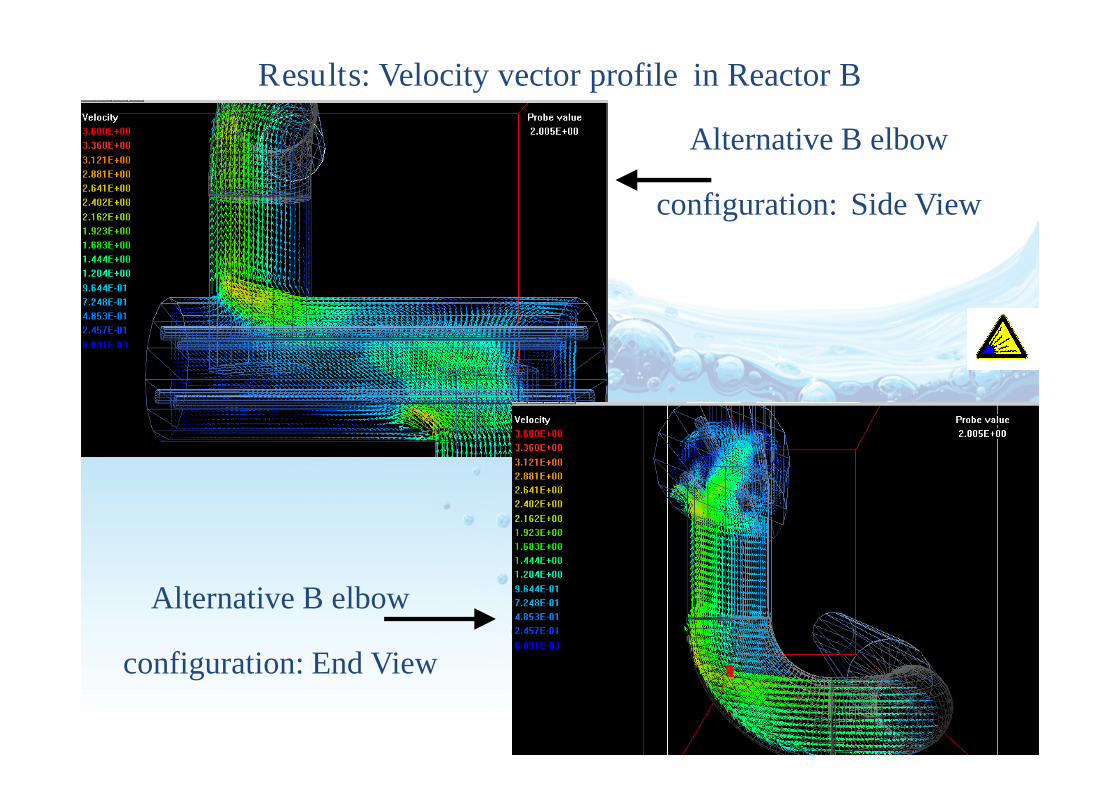
Results: Velocity vector profile in Reactor B
Alternative B elbow
configuration: Side View
Alternative B elbow
configuration: End View

Results: Impact of Alternative Influent PipingConfiguration on Full-Scale reactor performance
• The Microbial transport and velocity vector analyses forReactor B revealed:
– There may be more reactor short circuiting with the initial elbow, thestraight pipe, and alternative A elbow configurations than withalternative B elbow configuration
– The improved performance with alternative B elbow was due to thechange in direction of the core fluid in the elbow away from theoutlet.
– The combined impact of a recirculation zone with the centrifugal andpressure forces acting on the fluid in the initial and alternative Aelbow configurations causes a greater fraction of the microorganismsto move towards the outlet