Embed Size (px)
Citation preview

DURKACZ, J., ISLAM, S., CHAN, R., FONG, E., GILLIES, H., KARNIK, A. and MULLAN, T. 2021. CFD modelling and prototype testing of a vertical axis wind turbines in planetary cluster formation. Energy reports [online],
7(Supplement 3): 6th International conference on advances on clean energy research 2021 (ICACER 2021), 15-17 April 2021, [virtual conference], pages 119-126. Available from: https://doi.org/10.1016/j.egyr.2021.06.019
© 2021 The Authors. Published by Elsevier Ltd.
This document was downloaded from https://openair.rgu.ac.uk
CFD modelling and prototype testing of a vertical axis wind turbines in planetary cluster formation.
DURKACZ, J., ISLAM, S., CHAN, R., FONG, E., GILLIES, H., KARNIK, A. and MULLAN, T.
2021

Available online at www.sciencedirect.com
iF2vep
t
h2o
PI
ScienceDirect
Energy Reports 7 (2021) 119–126www.elsevier.com/locate/egyr
6th International Conference on Advances on Clean Energy Research, ICACER 2021 April15–17, 2021, Barcelona, Spain
CFD modelling and prototype testing of a Vertical Axis WindTurbines in planetary cluster formation
Jack Durkacz∗, Sheikh Islam, Ryan Chan, Ethan Fong, Hamish Gillies, Aditya Karnik,Thomas Mullan
Robert Gordon University, Garthdee Road, Aberdeen AB10 7JG, United Kingdom
Received 21 May 2021; accepted 9 June 2021
Abstract
This study aims to improve the applicability of Vertical Axis Wind Turbines (VAWTs) by investigating their feasibil-ty in a novel planetary cluster configuration by observing its effect on efficiency and overall power density. Computationalluid Dynamics (CFD) simulations were carried out using a two-dimensional vertical axis wind turbine model in ANSYS Fluent020 R1. This software was used to solve the transient k-omega (SST) turbulence model. For the isolated VAWT the windelocity, rotor radius and tip speed ratio were varied to find the optimum turbine performance at a given parameter. A peakfficiency of 34.05% was attained and equivalent configuration used as the “sun” turbine in the novel planetary design. Thearametric study of the novel set up was conducted with the PCD (Pitch Circle Diameter) and oblique angular (φ) position of
the smaller “planet” turbines being varied in relation to the “sun” turbine. The planetary system was then evaluated in terms ofefficiency improvements against the isolated VAWT model. Use of the “planet” turbines resulted in power extraction from thefree stream which in turn creates varying wind velocities and improved the efficiency of the central “sun” turbine. The optimalPCD was found to be 5D (3.75 m) and the optimum angular position of the “planets” was discovered at 30◦. Ultimately thisgave a percentage increase of 1.01% from 33.04% to 34.05% when comparing the “sun” turbine of the planetary arrangementto the optimum isolated respectively. An average improvement of 4% over the range of tip speed ratios (TSR) was found.Lastly, a scale model of the isolated VAWT was constructed and tested through wind tunnel experiments. The characteristiccurve correlation was found between the CFD and experimental results which allowed validation of the CFD models.c⃝ 2021 The Authors. Published by Elsevier Ltd. This is an open access article under the CC BY license
(http://creativecommons.org/licenses/by/4.0/).
Peer-review under responsibility of the scientific committee of the 6th International Conference on Advances on Clean Energy Research, ICACER,2021.
Keywords: Vertical Axis Wind Turbine (VAWT); Novel planetary turbine cluster; CFD; Wind tunnel
1. Introduction
With fossil fuels being one of the main contributors to the destruction of the environment and combined withhe finite capacity of oil and gas reserves, the world is looking for a sustainable alternative energy source to help
∗ Corresponding author.E-mail addresses: [email protected] (J. Durkacz), [email protected] (S. Islam).
ttps://doi.org/10.1016/j.egyr.2021.06.019352-4847/ c⃝ 2021 The Authors. Published by Elsevier Ltd. This is an open access article under the CC BY license (http://creativecommons.rg/licenses/by/4.0/).
eer-review under responsibility of the scientific committee of the 6th International Conference on Advances on Clean Energy Research,CACER, 2021.

J. Durkacz, S. Islam, R. Chan et al. Energy Reports 7 (2021) 119–126
iagcel
Hp
meet the global energy demand [1]. Wind energy has emerged as one of the most viable options in terms of powergeneration and commerciality, as turbine technology advancements lead to increased performance. The majority ofthe research has currently been invested into horizontal axis wind turbines (HAWTs) due to the large power outputand increased efficiencies when compared against Vertical Axis Wind Turbines (VAWTs). Despite this, VAWTs dohave a number of advantages over the HAWT and thus have in recent times become subject to interest as moreoptions for sustainable power generation are required. The VAWT can be configured in two different set ups, liftturbine (Darrieus) and drag turbine (Savonius) which refer to the aerodynamic force component which generatesthe driving force. Savonius VAWTs utilize half cylindrical blades attached at either side which generate a dragdifferential between the convex and concave parts of the blade. However, Darrieus VAWTs utilize typical airfoilshape blades which result in a pressure differential between the airfoil surfaces which in turn generates a lift forces,turning the central shaft and generating power [2].
The main benefit of the VAWT when compared against the HAWT is the omni-directional capabilities allowingt to utilize the winds energy in any wind direction and consequently do not require a yaw and pitch system whichdd significantly to the cost [2]. One limitation of VAWTs is the lower efficiency due to only a fraction of the bladesenerating torque during rotation resulting in lower efficiencies but to combat this lower performance the idea oflustering VAWTs has been introduced [3]. VAWTs can interact synergistically when placed in close proximity toach other as the turbines extract power from the free stream which can create areas of varying wind velocity,eading to improved efficiency of the whole farm [4].
Dabiri [5] investigated the use of counter rotating VAWTs to achieve enhanced power density compared toAWT farms. Field tests indicate that arranging VAWTs in this layout may allow significant improvement of theower density when compared to the current HAWT range of 2 to 3 W/m2. This was found to be due to the
VAWTs extracting energy from adjacent wakes and wind flowing above the farm. Further studies from Brownstein,Kinzel and Dabiri [6] were carried out to test the hypothesis that downstream VAWT performance enhancementwas the consequence of flow acceleration adjacent to upstream turbine due to bluff body blockage, which providesappropriately positioned downstream turbines with higher freestream velocity. The work positioned a turbine at theinlet of a wind tunnel and positioned a second turbine in various downstream positions. This gave the downstreamturbine a 120% peak performance increase compared to the upstream and ultimately displayed that the downstreamturbine is impacted positively on the basis that it was not in the direct wake of the upstream.
Computational fluid dynamics (CFD) is the preferred testing method due to in-depth analysis combined withlow cost and flexibility. It is especially useful in the initial design stage as it allows configurations to be alteredand optimized for performance, this was previously done through physical prototype testing which increased initialcosts. CFD simulations are the common approach for testing VAWT cluster arrangements for these reasons and canbe validated through experimental testing also.
Zheng, Zheng and Zhao [4] used CFD to study four different rotor arrangements to indicate the wake effecton power production of the set up. The study found that the cluster arrangement significantly impacts each of theturbine’s performances differently with both positive and negative outcomes. The arrangement with one upstreamrotor and two parallel downstream rotors enhanced the downstream rotors by 11.3% but negatively impacted theupstream. The configuration with two upstream parallel rotors and one downstream only gave efficiency increases tothe downstream due to the accelerated flow. Similarly, Mohammed, Ibrahim and Elbaz [7] found that a three VAWTcluster configuration with two downstream resulted in increased efficiencies for the two downstream rotors andreduced efficiencies for the upstream singular rotor. The paper found that this was a result of blockage caused by thetwo downstream rotors which reduced the flow rate, resulting in the wake of the upstream rotor not developing fully.It must also be noted that there are often discrepancies between 2D CFD and experimental results. Franchina [8]states that this is mainly due models’ inability to investigate crucial features such as trailing vortices and related tiplosses. Experimental results are also known to have inconsistencies due to recirculating flow, sensor vibration andhuman error which cause differences between CFD and experimental.
The purpose of this study is to investigate the fluid flow around a planetary VAWT cluster arrangement toanalyse the impact of the smaller “planet” turbines on the “sun” turbine efficiency and overall power density.Initially, numerical analysis is completed using CFD to validate the chosen airfoil geometry, then the design isoptimized for both the isolated VAWT [9] and novel planetary VAWT designs. A small-scale prototype model wasthen manufactured and tested though wind tunnel experiments to verify the CFD results of the isolated VAWT
configuration.120

J. Durkacz, S. Islam, R. Chan et al. Energy Reports 7 (2021) 119–126
2Fmacwaa
Table 1. Model parameters used for rotor numerical CFD simulations.
Model parameter Symbol and value Model parameter Symbol and value
Domain Length (m) L = 45 Pitch Circle Diameter (m) PCD = Variable (3.75, 5.25, 7.5)Inlet Length (m) L i = 15 Planetary Oblique Angles (◦) φ = Variable (0, 30, 60, 90)Outlet Length (m) Lo = 30 Inlet velocity (m/s) U = VariableDomain Width (m) W = 30 Angular Velocity (rad/s) ω = VariableAirfoil NACA Type NACA 7715 Solver Type Pressure-BasedChord Length (m) c = 1 Turbulence model K-Omega SSTAirfoil Radius (m) R = 1.5 Inlet: turbulence Intensity 2%Rotor Radius (m) Rr = 2 Inlet: Turbulence Length Scale (m) 3Core Radius (m) Rotor Height (m) Rc = 1 H = 1 Outlet: Backflow Turbulent Intensity 2.2Planetary Scale PS = 0.25 Outlet: Backflow Turbulent Viscosity Ratio 0.1
2. Numerical analysis
The CFD simulations performed for this investigation were carried out using two dimensional ANSYS Fluent020 R1. Design Modeller was used to model the geometry and mesh for the isolated and cluster VAWT models.igs. 1 and 2 display the numerical model geometry for the VAWT models and the boundary conditions for theseodels. Table 1 provides additional model parameter values and settings. The governing equations for the simulation
re based on continuity and momentum equations and are solved using the k-omega (SST) turbulence modelombined with the sliding mesh motion (SMM) transient modelling technique [10,11]. The accuracy of predictionsithin a 2D simulation are very grid/mesh sensitive and so an extensive mesh sensitivity analysis was performed to
chieve a suitable agreement between computational cost and result accuracy. The numerical investigation includedn in-depth validation of an isolated rotor follow by the study of a planetary cluster arrangement.
Fig. 1. (a) Computational domain; (b) Boundary conditions.
Fig. 2. (a) Isolated turbine (b) Planetary arrangement setup.
121
J. Durkacz, S. Islam, R. Chan et al. Energy Reports 7 (2021) 119–126
pt
dotddete
3
3
aoo
a
2.1. Isolated rotor and planetary cluster arrangement
Firstly, the isolated rotor model was validated by performing a range of simulations for varying TSR’s. Then thelanetary arrangement was made using the same rotor dimensions for the sun turbine of the planetary arrangemento evaluate the effectiveness of the cluster setup.
The lift-based Darrieus-turbine design consisted of three NACA 7715 airfoil blades of 1 m chord length. Theesign has a rotor diameter of 3 m, and the grid dimensions were chosen appropriately as to allow proper analysisf fluid flow during the turbine’s performance. The distance from the inlet to the rotor was five rotor diameterso allow flow to stabilize before entering the rotor region. The distance from the rotor to the outlet was ten rotoriameters to allow proper formation of the downstream wake. The width of the domain was a total of ten rotoriameters and the symmetry boundary condition setting was applied to minimize the blockage and recirculationffects on the recorded results. To evaluate the turbine performances, report definitions were created to record theorque every time step, these files were then accessed and exported to find the average torque over one rotation forach rotor.
. CFD modelling results and discussion
.1. Planetary arrangement optimization
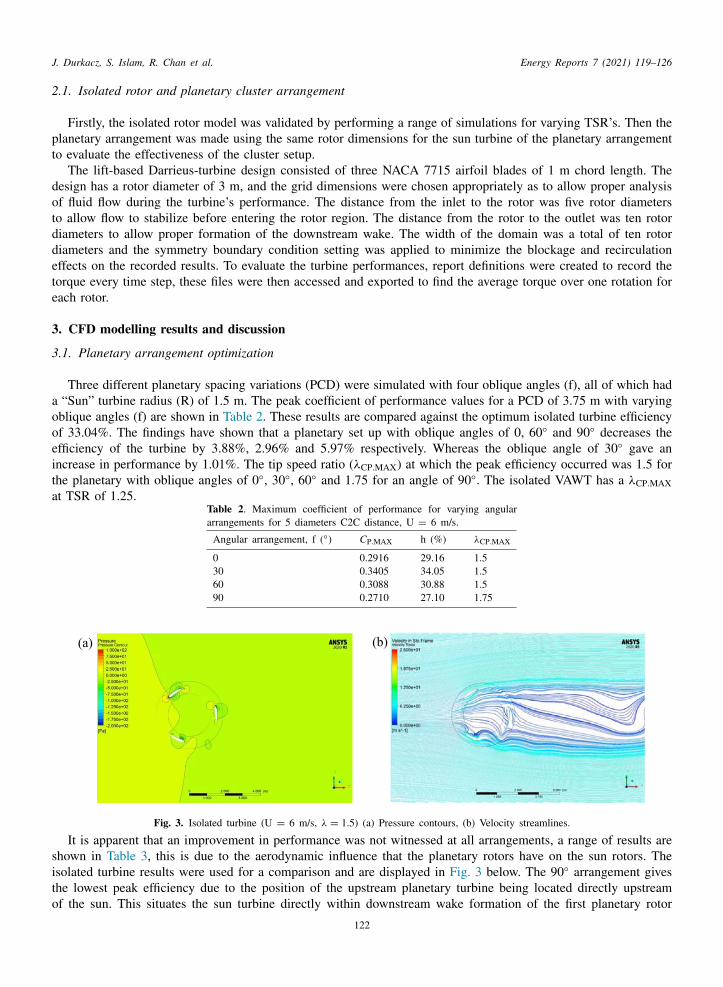
Three different planetary spacing variations (PCD) were simulated with four oblique angles (f), all of which had“Sun” turbine radius (R) of 1.5 m. The peak coefficient of performance values for a PCD of 3.75 m with varyingblique angles (f) are shown in Table 2. These results are compared against the optimum isolated turbine efficiencyf 33.04%. The findings have shown that a planetary set up with oblique angles of 0, 60◦ and 90◦ decreases the
efficiency of the turbine by 3.88%, 2.96% and 5.97% respectively. Whereas the oblique angle of 30◦ gave anincrease in performance by 1.01%. The tip speed ratio (λCP.MAX) at which the peak efficiency occurred was 1.5 forthe planetary with oblique angles of 0◦, 30◦, 60◦ and 1.75 for an angle of 90◦. The isolated VAWT has a λCP.MAXt TSR of 1.25.
Table 2. Maximum coefficient of performance for varying angulararrangements for 5 diameters C2C distance, U = 6 m/s.
Angular arrangement, f (◦) CP.MAX h (%) λCP.MAX
0 0.2916 29.16 1.530 0.3405 34.05 1.560 0.3088 30.88 1.590 0.2710 27.10 1.75
Fig. 3. Isolated turbine (U = 6 m/s, λ = 1.5) (a) Pressure contours, (b) Velocity streamlines.
It is apparent that an improvement in performance was not witnessed at all arrangements, a range of results areshown in Table 3, this is due to the aerodynamic influence that the planetary rotors have on the sun rotors. Theisolated turbine results were used for a comparison and are displayed in Fig. 3 below. The 90◦ arrangement givesthe lowest peak efficiency due to the position of the upstream planetary turbine being located directly upstreamof the sun. This situates the sun turbine directly within downstream wake formation of the first planetary rotor
122

J. Durkacz, S. Islam, R. Chan et al. Energy Reports 7 (2021) 119–126
Table 3. Coefficient of performance for varying TSR for 5 diametersC2C distance, U = 6 m/s.
TSR, λ Isolated,CP
Planetary30◦, CP
CPdifference
0.75 0.1125 0.1146 0.00211 0.2562 0.2363 −0.01991.25 0.3304 0.3111 −0.01981.51.7522.25
0.30570.23850.154980.0576
0.34050.30180.26490.1976
0.03480.06330.109920.14
which greatly reduces the suns performance. Thereafter the 0◦ and 60◦ arrangements also experience reduced peakperformance when compared against isolated results. These two arrangements are similar in setup but are mirroredaround the x-axis. These arrangements appear to impact the pressure field on the upper side of the closest bladewhich disrupts the pressure gradient. Therefor due to this pressure distribution alteration around the blades theinduced lift force is reduced. The highlight of this study was the 30◦ arrangement which achieved an increasedpeak performance of 34.05% which is 3.48% higher than its isolated counterpart. This arrangement consists of twoequally spaced upstream planetary rotors accompanied by a downstream planetary rotor which is situated directlyin the wake of the sun. Due the location of the downstream planetary rotor it is obsolete in this setup. However asshown in Fig. 4, the two upstream rotors have a positive impact, by increasing the pressure on the upper side of thetop blade therefor increasing the pressure gradient which is desirable for generation of lift force. Meanwhile thesecond upstream planetary rotor appears to stabilize the pressure around the blade allowing it to rotate with easearound the rest of its rotation. This allows for improved performance of the sun turbine.
Fig. 4. 30◦ planetary turbine (U = 6 m/s, λ = 1.5) (a) Pressure contours, (b) Velocity streamlines.
3.2. Isolated and planetary arrangement comparison
Comparison of the central planetary turbine in its optimum configuration and an isolated turbine is illustratedin Fig. 5. The planetary arrangement (34.05%) exhibits an approximate 1% increase in efficiency compared to theisolated turbine (33.093%). From 0.75 to 1.25 TSR, the efficiency curves closely follow each other however theplanetary turbine exhibits a peak at 1.5 TSR whist the isolated peaks at 1.25. At a TSR greater than 1.35 the planetaryturbine can produce higher efficiencies which suggests that the surrounding turbines are able to benefit the centralturbine. A peak efficiency increase of 14.02% is seen at a TSR of 2. Much of the key characteristics of the pressurecontours are preserved from the isolated turbine to the planetary arrangement (Figs. 3a and 4a respectively). Notabledifferences are especially prominent on the returning blade of the planetary turbine highlighted by higher pressurebehind the trailing edge and the absence of a low-pressure gradient on the inside edge of the blade. The bladeapproaching the oncoming airstream experiences a larger region of high pressure at its leading edge which may bedue to the convergence of the airstream between the central turbine and the planet turbine above it. Observations of
the isolated and planetary streamlines show that flow behind the sun turbine is more unstable and turbulent which123

J. Durkacz, S. Islam, R. Chan et al. Energy Reports 7 (2021) 119–126
(prhp
Fig. 5. Cp versus TSR (λ): Isolated turbine and planetary turbine.
is highlighted by a large vortex adjacent to the planet turbine (Fig. 4b). General downstream flow disturbance fromthe front two planet turbines is minimal.
4. Isolated VAWT experimental testing
4.1. Experimental setup and design
To validate numerical CFD predictions for an isolated VAWT, the use of an experimental setup was developedand tested using a wind tunnel in laboratory settings. The three-bladed Darrieus VAWT design can be seen in Fig. 6and detailed dimensions and specifications shown Table 4. The turbine experimental setup incorporated a DatumElectronics M425 Rotary Torque Sensor, shown in Fig. 6, through which torque (T), power (Ps) and angular velocity(ω) could be monitored and recorded. Windspeed was measured using a vane anemometer at five points across theoutlet area and averaged to give a wind tunnel velocity (Uave). Using the recorded parameters, wind power (Pw),coefficient of power (Cp) and subsequently efficiency (η) were calculated.
Table 4. Experimental VAWT Model Parameters and Dimensions.
Parameter Symbol and value Parameter Symbol and value
Airfoil Type NACA 7715 Blade Length (mm) L = 260Chord Length (mm) c = 100 Rotor Diameter (mm) D = 200Number of Blades N = 3 Wind Tunnel Outlet Area (mm) 460 × 460
4.2. Experimental testing results and discussion
A comparison of the experimental results was also made with those from SMM & Moving Reference FrameMRF) CFD models with matching dimensions at 12 ms−1, displayed in Fig. 7. Experimental data points wereroduced by averaging the output power at each RPM which occurred at least five times over a two-minute periodecorded by the torque sensor. The results showed that while underpredicting, the efficiency the CFD results alsoad an increasing efficiency with TSR that did not reach a peak within the given range, clarifying why a ‘traditional’ower curve was not exhibited by the experimental data.
124

J. Durkacz, S. Islam, R. Chan et al. Energy Reports 7 (2021) 119–126
Fig. 6. Experimental model in testing (a) Braking system, (b) Torque sensor, (c) Tape, (d) Vane anemometer.
Fig. 7. Cp versus TSR (λ): Experimental turbine and CFD.
5. Future work
Ongoing study into the design of the planetary turbine cluster is being conducted by the authors includingthe use of drag turbines for the planetary turbines to investigate the increased wake effect on the sun turbine.Further parametric studies include the investigation of increased outer turbine sizes to increase the overall powerdensity of the setup. An experimental model of the planetary cluster is also being designed to further validate thework conducted. An artificial neural network model is also being investigated to rapidly reduce the time betweensimulation to results. Finally, suggestions on further work include the implementation of the planetary cluster in afarm setting to investigate the commercial viability of the design.
6. Conclusion
The novel planetary turbine was successfully modelled and simulated on ANSYS 2020 R1 to solve the SST k-omega turbulence model and Navier–Stokes equations. The study found an optimal parameter configuration of 30◦, 5diameter spacings at 6m/s inlet velocity giving a peak efficiency of approximately 34%. The upstream turbines werefound to work synergistically with the sun turbine by increasing the pressure gradient and stabilizing the pressurefield as the blades rotate providing a 1% improvement in peak efficiency. Experimental analysis was conductedto validate the simulations of the isolated turbine. A good agreement in trends was observed between the CFDpredicted results and experimental analyses carried out.
125

J. Durkacz, S. Islam, R. Chan et al. Energy Reports 7 (2021) 119–126
h
R
Declaration of competing interest
The authors declare that they have no known competing financial interests or personal relationships that couldave appeared to influence the work reported in this paper.
eferences[1] Hand B, Kelly G, Cashman A. Aerodynamic design and performance parameters of a lift-type vertical axis wind turbine: A
comprehensive review. Renew Sustain Energy Rev 2021;139(2021):110699.[2] Möllerström E, et al. A historical review of vertical axis wind turbines rate 100kW and above. Renew Sustain Energy Rev
2019;105(1):1–13.[3] Barnes A, Hughes B. Determining the impact of VAWT farm configurations on power output. Renew Energy 2019;143(1):1111–20.[4] Zheng HD, Zheng XY, Zhao SX. Arrangement of clustered straight-bladed wind turbines. Energy 2020;200(2020):117563.[5] Dabiri JO. Potential order-of-magnitude enhancement of wind farm power density via counter-rotating vertical-axis wind turbine arrays.
J Renew Sustain Energy 2010;3(4):1–24.[6] Brownstein ID, Kinzel M, Dabiri JO. Performance enhancement of downstream vertical-axis wind turbines. J Renew Sustain Energy
2016;8(1):1–18.[7] Mohamed OS, Ibrahim A, Elbaz AM. CFD Investigation of the multiple rotors darrieus type turbine performance. In: Branchini L, et
al., editors. Turbo expo: Power for land, sea, and air. Pheonix, AZ: ASME; 2019.[8] Manshadi MD. The importance of turbulence reduction in assessment of wind tunnel flow quality. In: Lerner JC, Boldes U, editors.
Wind tunnels and experimental fluid dynamics research. London: IntechOpen; 2011.[9] Stout C, et al. Efficiency improvement of vertical axis wind turbines with an upstream deflector. Energy Procedia 2017;118(2017):141–8.
[10] Rezaeiha A, Montazeri H, Blocken B. On the accuracy of turbulence models for CFD simulations of vertical axis wind turbines.Energy 2019;180(Aug):838–57.
[11] Könözsy L. The k-omega shear-stress transport (SST) turbulence model. In: A new hypothesis on the anisotropic Reynolds stress tensorfor turbulent flows. Cham: Springer; 2019, p. 57–66.
126