Embed Size (px)
Citation preview

0
CFO Handbook
Publication Date: October 2019

1
CFO Handbook
Copyright © 2019 by
DELTACPE LLC
All rights reserved. No part of this course may be reproduced in any form or by any means, without permission
in writing from the publisher.
The author is not engaged by this text or any accompanying lecture or electronic media in the rendering of legal,
tax, accounting, or similar professional services. While the legal, tax, and accounting issues discussed in this ma-
terial have been reviewed with sources believed to be reliable, concepts discussed can be affected by changes in
the law or in the interpretation of such laws since this text was printed. For that reason, the accuracy and com-
pleteness of this information and the author's opinions based thereon cannot be guaranteed. In addition, state
or local tax laws and procedural rules may have a material impact on the general discussion. As a result, the
strategies suggested may not be suitable for every individual. Before taking any action, all references and cita-
tions should be checked and updated accordingly.
This publication is designed to provide accurate and authoritative information in regard to the subject matter
covered. It is sold with the understanding that the publisher is not engaged in rendering legal, accounting, or
other professional service. If legal advice or other expert advice is required, the services of a competent profes-
sional person should be sought.
—-From a Declaration of Principles jointly adopted by a committee of the American Bar Association and a Com-
mittee of Publishers and Associations.

2
Course Description
The world of the CFO is in constant flux; today’s CFO is tomorrow’s CEO or chairman. The contemporary CFO
should be at the elbow of the CEO, a strategic partner and advisor to the CEO. To fulfill the expectations and ef-
fectively operate as a key member of the leadership team, CFOs need a broad perspective and a wide set of ca-
pabilities and skills. This course is designed to help CFOs and future aspiring CFOs in enhancing competence
through learning the tools and techniques that support sustainable business success. It also shares good practic-
es and ideas that apply in performing a CFO role. In particular, it contains the following topics:
• The changing and expanding role of the CFO and skills needed in the future
• Key topics in financial reporting such as revenue, leases, fixed assets, and inventory
• Accounting changes and error corrections and proper treatments of them
• Securities and Exchange Commission (SEC) filing requirements and its disclosure review process
• Cybersecurity disclosure requirements for public companies
• Sarbanes-Oxley Act key provisions and recommended compliance structure
• Asset and liability management (e.g., cash, accounts receivable, inventory)
• Financial planning processes including strategic planning and budgeting
• Analysis of cost behavior and cost prediction
• Forecasting techniques such as break-even analysis, contribution margin analysis, and margin of sale
• Capital investment analysis techniques (e.g., payback period, discount rate, internal rate of return)
• Analysis of financial statements including comparative financial statements and ratio analysis
• Risk management principles focused on enterprise risk management and the lines of defense model
• The basics of accounting for derivatives and hedge accounting
• The concept of risk and return of an investment and types of investments
• The Capital Asset Pricing Model
• Financial management strategies for multinational companies
• Features of modern accounting information systems (e.g. procure-to-pay, inventory optimization)
• Benefits of emerging technologies including Big Data, blockchain, robotic process automation, and cloud
• Performance management structure; balanced scorecard and key performance indicators
• Characteristics of a world-class finance organization
• Internal control principles including components, limitations, and types of controls
Field of Study Accounting
Level of Knowledge Basic to Intermediate
Prerequisite None
Advanced Preparation None
3
Table of Contents
INTRODUCTION .................................................................................................................................................................... i
PART I: PROFILING THE MODERN CFO................................................................................................................................ 1
Chapter 1: The CFO as a Strategic Partner ......................................................................................................................... 2
Learning Objectives: ................................................................................................................................................................ 2
The Roles and Expectations of the Modern CFO ...................................................................................................................... 3
The Changing Role of the CFO ............................................................................................................................................. 3
The Duties of a Modern CFO ............................................................................................................................................... 6
CFO vs. Controller ............................................................................................................................................................... 9
The Next-Generation CFO ...................................................................................................................................................... 11
Talent and Capability ........................................................................................................................................................ 11
Transformation in the Digital Age ..................................................................................................................................... 13
Chapter 1 Review Questions .................................................................................................................................................. 17
PART II: REPORTING VALUE .............................................................................................................................................. 18
Chapter 2: The Financial Statements ............................................................................................................................... 19
Learning Objectives ............................................................................................................................................................... 19
The Role of the CFO ............................................................................................................................................................... 19
Objectives of Financial Reporting .......................................................................................................................................... 20
The Common Financial Statements ....................................................................................................................................... 21
The Income Statement .......................................................................................................................................................... 23
Key Elements ..................................................................................................................................................................... 23
Income Statement Formats .............................................................................................................................................. 25
The Balance Sheet ................................................................................................................................................................. 27
Key Elements ..................................................................................................................................................................... 27
Balance Sheet Limitations ................................................................................................................................................. 30
Chapter 2 - Section 1 Review Questions ................................................................................................................................ 31
Statement of Cash Flows ....................................................................................................................................................... 32
Cash and Cash Equivalents ................................................................................................................................................ 32
Classification of Cash Flows .............................................................................................................................................. 33
Accrual Basis of Accounting .............................................................................................................................................. 38
Preparation of the Statement of Cash Flows .................................................................................................................... 39
Gross vs. Net Cash Flows ................................................................................................................................................... 43
IFRS Differences Affecting the Statement of Cash Flows ....................................................................................................... 45
4
Notes to Financial Statements ............................................................................................................................................... 45
Chapter 2 - Section 2 Review Questions ................................................................................................................................ 46
Chapter 3: Principles of Financial Reporting .................................................................................................................... 47
Learning Objectives: .............................................................................................................................................................. 47
The Role of the CFO ............................................................................................................................................................... 47
Financial Accounting vs. Management Accounting .............................................................................................................. 48
Key Financial Accounting Areas ............................................................................................................................................. 49
Revenue Recognition ........................................................................................................................................................ 49
Leases ................................................................................................................................................................................ 53
Consolidation .................................................................................................................................................................... 58
Chapter 3 Section 1 Review Questions ................................................................................................................................. 63
Key Financial Accounting Areas ............................................................................................................................................. 64
Fixed Assets ....................................................................................................................................................................... 64
Inventory ........................................................................................................................................................................... 68
Earnings per Share ............................................................................................................................................................ 71
Accounting Changes and Error Corrections ........................................................................................................................... 75
Definition of Accounting Changes ..................................................................................................................................... 75
Change in Accounting Principle ......................................................................................................................................... 76
Change in Accounting Estimate ........................................................................................................................................ 81
Change in Reporting Entity ............................................................................................................................................... 82
Correction of an Error ....................................................................................................................................................... 83
Chapter 3 - Section 2 Review Questions ................................................................................................................................ 86
PART III: ENSURING REGULATORY COMPLIANCE .............................................................................................................. 87
Chapter 4: Securities and Exchange Commission Filings ................................................................................................. 88
Learning Objectives: .............................................................................................................................................................. 88
The Role of the CFO ............................................................................................................................................................... 88
Periodic Reporting Requirements .......................................................................................................................................... 89
Accelerated Filer vs. Non-Accelerated Filer Status ........................................................................................................... 89
Major Corporate Forms .................................................................................................................................................... 89
Segmental Reporting ......................................................................................................................................................... 93
The Failure of (or Late) Filing ............................................................................................................................................ 95
Cybersecurity Disclosure Requirements ................................................................................................................................. 96
Risk Factors ....................................................................................................................................................................... 96
MD&A................................................................................................................................................................................ 97
Financial Statement Disclosures ....................................................................................................................................... 98
The SEC Disclosure Review Process ........................................................................................................................................ 99
The Scope of Review ......................................................................................................................................................... 99
5
The Review Process ......................................................................................................................................................... 101
Chapter 4 Review Questions ................................................................................................................................................ 105
Chapter 5: The Sarbanes-Oxley Act ............................................................................................................................... 106
Learning Objectives: ............................................................................................................................................................ 106
The Role of the CFO ............................................................................................................................................................. 106
SOX Section 404 − Management Assessment of Internal Controls ..................................................................................... 107
Evaluation of Control Deficiency ..................................................................................................................................... 107
Examples of Significant Deficiencies and Material Weaknesses ..................................................................................... 109
Management Internal Control Report ............................................................................................................................ 111
Assessment of Process Maturity for Internal Control over Financial Reporting ............................................................. 113
SOX Section 302 − Corporate Responsibility for Financial Reports ...................................................................................... 116
SOX Section 906 − Corporate Responsibility for Financial Reports ...................................................................................... 117
Alternative Sarbanes-Oxley Compliance Structures ............................................................................................................ 118
Chapter 5 Review Questions ................................................................................................................................................ 121
PART IV: ASSET AND LIABILITY MANAGEMENT .............................................................................................................. 122
Chapter 6: Working Capital and Cash Management ...................................................................................................... 123
Learning Objectives ............................................................................................................................................................. 123
The Role of the CFO ............................................................................................................................................................. 123
The Concept of Working Capital .......................................................................................................................................... 124
Cash Management .............................................................................................................................................................. 125
The Significance of Cash Management ........................................................................................................................... 125
Techniques for Optimizing Cash...................................................................................................................................... 126
Opportunity Cost of Foregoing a Cash Discount ............................................................................................................. 131
Accounts Receivable Management ..................................................................................................................................... 132
Inventory Management ....................................................................................................................................................... 134
Accounts Payable Management .......................................................................................................................................... 135
Chapter 6 Review Questions ................................................................................................................................................ 137
PART V: PROVIDING STRATEGIC FINANCE SUPPORT AND ANALYSIS .............................................................................. 138
Chapter 7: The Financial Planning Process .................................................................................................................... 139
Learning Objectives ............................................................................................................................................................. 139
The Role of the CFO ............................................................................................................................................................. 139
Strategic Planning ............................................................................................................................................................... 140
The Concept of Strategic Planning .................................................................................................................................. 140

6
Short-Term Plans ............................................................................................................................................................. 141
Long-Term Plans .............................................................................................................................................................. 141
Budgeting for Planning and Control .................................................................................................................................... 142
The Concept of Budgeting ............................................................................................................................................... 142
Budgetary Process ........................................................................................................................................................... 143
Types of Budgets ............................................................................................................................................................. 144
Types of Budget Reports ................................................................................................................................................. 150
Other Considerations ...................................................................................................................................................... 152
Chapter 7 Review Questions ................................................................................................................................................ 156
Chapter 8: Financial Forecasting Techniques ................................................................................................................. 157
Learning Objectives: ............................................................................................................................................................ 157
The Role of the CFO ............................................................................................................................................................. 157
Analysis of Cost Behavior and Cost Prediction..................................................................................................................... 158
Costs by Behavior ............................................................................................................................................................ 158
Methods for Estimating Costs ......................................................................................................................................... 160
Break-Even and Contribution Margin Analysis .................................................................................................................... 163
The Concept of Cost-Volume-Profit Analysis .................................................................................................................. 163
Contribution Margin (CM) ............................................................................................................................................... 163
Break-Even Analysis ........................................................................................................................................................ 165
Margin of Safety .............................................................................................................................................................. 167
Sales Mix Analysis ........................................................................................................................................................... 168
Chapter 8 Review Questions ................................................................................................................................................ 170
Chapter 9: Capital Investment Analysis ......................................................................................................................... 171
Learning Objectives ............................................................................................................................................................. 171
The Role of the CFO ............................................................................................................................................................. 171
The Concept of Capital Budgeting ....................................................................................................................................... 172
The Definition of Capital Budgeting ................................................................................................................................ 172
Types of Long-Term Investment Decisions ..................................................................................................................... 172
Features of Investment Projects ..................................................................................................................................... 173
The Uses of Capital Budgeting ........................................................................................................................................ 173
Techniques for Evaluating Investment Proposals ................................................................................................................ 174
Discount Rate .................................................................................................................................................................. 174
Payback Period ................................................................................................................................................................ 177
Discounted Payback Period ............................................................................................................................................. 178
Accounting Rate of Return .............................................................................................................................................. 179
Net Present Value ........................................................................................................................................................... 180
Internal Rate of Return ................................................................................................................................................... 181
Profitability Index ............................................................................................................................................................ 182
Capital Rationing ................................................................................................................................................................. 183

7
Selecting the Best Mix of Projects with a Limited Budget .............................................................................................. 183
Handling Mutually Exclusive Investments....................................................................................................................... 183
Income Taxes and Investment Decisions ............................................................................................................................. 185
Chapter 9 Review Questions ................................................................................................................................................ 187
Chapter 10: Financial Statement Analysis ..................................................................................................................... 188
Learning Objectives: ............................................................................................................................................................ 188
The Role of the CFO ............................................................................................................................................................. 188
Techniques of Financial Analysis ......................................................................................................................................... 189
Comparative Financial Statements ................................................................................................................................. 189
Ratio Analysis .................................................................................................................................................................. 195
The Operating Cycle of a Business ....................................................................................................................................... 198
Chapter 10 - Section 1 Review Questions ............................................................................................................................ 200
Evaluation of Financial Outcomes ....................................................................................................................................... 201
Liquidity Ratios: Analyzing Short-Term Cash Needs ....................................................................................................... 201
Activity Ratios: Analyzing the Efficient Use of Assets ..................................................................................................... 202
Leverage Ratios: Measuring the Ability to Pay Long-Term Debt .................................................................................... 205
Profitability Ratios: Analyzing Operating Activities ......................................................................................................... 206
Market Ratios: Analyzing Financial Returns to Investors ................................................................................................ 215
Cash Flow Coverage (Adequacy) Ratios .......................................................................................................................... 218
Chapter 10 - Section 2 Review Questions ............................................................................................................................ 221
PART VI: OPTIMIZING PROFITABILITY AND MITIGATING RISKS ...................................................................................... 222
Chapter 11: Risk Management Strategy ........................................................................................................................ 223
Learning Objectives: ............................................................................................................................................................ 223
The Role of the CFO ............................................................................................................................................................. 223
Enterprise Risk Management Principles .............................................................................................................................. 224
Key Concepts of Risk Management ................................................................................................................................. 225
Enterprise Risk Management vs. Traditional Risk Management Approaches ................................................................ 228
Components of Enterprise Risk Management ................................................................................................................ 232
The Risk Assessment Process .......................................................................................................................................... 233
Other Considerations ...................................................................................................................................................... 240
The Three Lines of Defense Model ....................................................................................................................................... 242
The First Line of Defense ................................................................................................................................................. 244
The Second Line of Defense ............................................................................................................................................ 244
The Third Line of Defense ............................................................................................................................................... 244
Other Considerations ...................................................................................................................................................... 246
Fraud Risk Assessment ........................................................................................................................................................ 246
Chapter 11 Review Questions .............................................................................................................................................. 248

8
Chapter 12: Derivative Instruments and Hedge Accounting ......................................................................................... 249
Learning Objectives: ............................................................................................................................................................ 249
The Role of the CFO ............................................................................................................................................................. 249
Derivatives and Hedge ......................................................................................................................................................... 250
The Characteristics of Derivative Instruments ................................................................................................................ 250
Concepts of Hedge Accounting ....................................................................................................................................... 252
Principles of Hedge Accounting ........................................................................................................................................... 253
Hedge Criteria ................................................................................................................................................................. 253
Types of Hedges .............................................................................................................................................................. 254
Chapter 12 Review Questions .............................................................................................................................................. 259
Chapter 13: Corporate Investments .............................................................................................................................. 260
Learning Objectives: ............................................................................................................................................................ 260
The Role of the CFO ............................................................................................................................................................. 260
Risk vs. Return ..................................................................................................................................................................... 261
Types of Investments ........................................................................................................................................................... 264
The Capital Asset Pricing Model (CAPM) ............................................................................................................................. 269
Chapter 13 Review Questions .............................................................................................................................................. 272
Chapter 14: International Finance ................................................................................................................................. 273
Learning Objectives: ............................................................................................................................................................ 273
The Role of the CFO ............................................................................................................................................................. 273
Essentials for Multinational Corporations ........................................................................................................................... 274
The Features of MNCs ..................................................................................................................................................... 274
The Types of Foreign Operations .................................................................................................................................... 274
Types of International Risks ................................................................................................................................................. 275
Currency Risk ................................................................................................................................................................... 275
Political and Credit Risk ................................................................................................................................................... 277
Foreign Exchange Rate Determination ................................................................................................................................ 278
Direct vs. Indirect Quotation ........................................................................................................................................... 278
Spot vs. Forward Exchange Rates ................................................................................................................................... 278
Forward Premium or Discount ........................................................................................................................................ 279
Cross Rates ...................................................................................................................................................................... 281
Foreign Exchange Exposure ................................................................................................................................................. 282
Types of Foreign Exchange Risk ...................................................................................................................................... 282
Ways to Neutralize Foreign Exchange Risk ..................................................................................................................... 283
Nature of Transaction Exposure .......................................................................................................................................... 285
Transferring Exposure ..................................................................................................................................................... 285

9
Net Transaction Exposure ............................................................................................................................................... 285
Methods of Reducing Operating Exposure .......................................................................................................................... 286
Matching Cash Flows ...................................................................................................................................................... 286
Global Diversification ...................................................................................................................................................... 286
Financing Strategies ........................................................................................................................................................ 287
Chapter 14 Review Questions .............................................................................................................................................. 288
PART VII: ACHIEVING OPERATIONAL EXCELLENCE ........................................................................................................... 289
Chapter 15: Information Technology ............................................................................................................................. 290
Learning Objectives ............................................................................................................................................................. 290
The Role of the CFO ............................................................................................................................................................. 290
Accounting Information Systems ......................................................................................................................................... 291
Credit and Collection Management ................................................................................................................................ 291
Procure-to-Pay ................................................................................................................................................................ 292
Fixed Asset System .......................................................................................................................................................... 294
Inventory Optimization Software .................................................................................................................................... 296
Modern Close Software .................................................................................................................................................. 297
E-Budgeting ..................................................................................................................................................................... 299
Leveraging Technology ........................................................................................................................................................ 300
Advanced Data Analytics ................................................................................................................................................. 300
Blockchain Technology .................................................................................................................................................... 301
Robotic Process Automation ........................................................................................................................................... 302
Cloud Computing ............................................................................................................................................................ 304
Chapter 15 Review Questions .............................................................................................................................................. 308
Chapter 16: Performance Management ........................................................................................................................ 309
Learning Objectives ............................................................................................................................................................. 309
The Role of the CFO ............................................................................................................................................................. 309
Balanced Scorecard ............................................................................................................................................................. 309
The Concept of Balanced Scorecard ............................................................................................................................... 309
The Four Dimensions of Performance ............................................................................................................................ 311
Key Performance Indicators ................................................................................................................................................. 314
The Development of Performance Measures ................................................................................................................. 314
Performance Measures that Every CFO Should Know .................................................................................................... 315
Benchmarking ...................................................................................................................................................................... 317
Chapter 16 Review Questions .............................................................................................................................................. 319
Chapter 17: Modern Finance Organizations .................................................................................................................. 320
Learning Objectives ............................................................................................................................................................. 320

10
The Role of the CFO ............................................................................................................................................................. 320
The Evolving Finance Function ............................................................................................................................................ 321
Vision, Goals and Practices ............................................................................................................................................. 321
Characteristics of a World-Class Finance Organization ................................................................................................... 323
Building Effective Internal Control Systems ......................................................................................................................... 324
Elements of Internal Control Systems ............................................................................................................................. 324
Limitations of Internal Controls ...................................................................................................................................... 327
Types of Internal Controls ............................................................................................................................................... 327
Cost-Benefit Relationships .............................................................................................................................................. 329
Chapter 17 Review Questions .............................................................................................................................................. 331
Appendix A: Best Practices of Disclosing Material Cybersecurity Breach ........................................................................ 332
Appendix B: Financial Statement Disclosure − Data Breach ............................................................................................. 333
Appendix C: Examples of Circumstances that May be Deficiencies, Significant Deficiencies, or Material Weaknesses .... 335
Deficiencies in the Design of Controls .................................................................................................................................. 335
Failures in the Operation of Internal Control ....................................................................................................................... 336
Appendix D: A List of Questions Management Needs to Answer for Sarbanes-Oxley Compliance ................................... 337
Appendix E: Example of a Statement of Risk Management Vision, Mission, Goals and Objectives .................................. 338
Appendix F: Three Lines of Defense - Recommended Practices by COSO ......................................................................... 339
Appendix G: Financial Statement Disclosure - Derivative Financial Instruments and Hedging Activities .......................... 341
Appendix H: International Business Planning Checklist.................................................................................................... 345
Appendix I: Examples of International Business Risks ...................................................................................................... 354
Appendix J: Developing an Automation Strategy ............................................................................................................ 355
Solutions to Review Questions ........................................................................................................................................ 356
Chapter 1 Review Questions ................................................................................................................................................ 356
Chapter 2 Section 1 Review Questions ................................................................................................................................ 357
Chapter 2 Section 2 Review Questions ................................................................................................................................ 358
Chapter 3 Section 1 Review Questions ................................................................................................................................ 359
Chapter 3 Section 2 Review Questions ................................................................................................................................ 361
Chapter 4 Review Questions ................................................................................................................................................ 362
Chapter 5 Review Questions ................................................................................................................................................ 364
Chapter 6 Review Questions ................................................................................................................................................ 365
11
Chapter 7 Review Questions ................................................................................................................................................ 367
Chapter 8 Review Questions ................................................................................................................................................ 368
Chapter 9 Review Questions ................................................................................................................................................ 369
Chapter 10 Section 1 Review Questions .............................................................................................................................. 370
Chapter 10 Section 2 Review Questions .............................................................................................................................. 372
Chapter 11 Review Questions .............................................................................................................................................. 374
Chapter 12 Review Questions .............................................................................................................................................. 375
Chapter 13 Review Questions .............................................................................................................................................. 376
Chapter 14 Review Questions .............................................................................................................................................. 377
Chapter 15 Review Questions .............................................................................................................................................. 379
Chapter 16 Review Questions .............................................................................................................................................. 380
Chapter 17 Review Questions .............................................................................................................................................. 381
Glossary ........................................................................................................................................................................... 383
Index ............................................................................................................................................................................... 388

i
INTRODUCTION In the changing business landscape where volatility, uncertainty, risk, and disruption are becoming more preva-
lent, the role of the CFO has undergone an evolution. CFOs continue to be stretched and scrutinized. In addition
to financial reporting, planning and analysis, CEOs and boards expect the CFO to contribute to the major deci-
sions, such as growth strategy, risk management strategy, and investment strategy. Key issues and emerging
priorities affecting the future role of the CFO include:
• A spotlight on talent, capability and behaviors in the top finance role (Part I)
• An enhanced financial reporting to promote transparency, accuracy, and compliance (Part II)
• An increasing personal stake in, and accountability for, regulatory adherence and compliance (Part III)
• The appropriate policies of capital investment, cash availability and shareholder return (Part IV and Part V )
• The necessity of controlling cost, managing risk and maintaining liquidity (Part IV and Part VI)
• An ability to support, monitor, and provide assistance in the execution of budgets and forecasts (Part V)
• Higher expectations from other stakeholders on the adequacy of financial plans (Part V)
• A greater scrutiny of the effectiveness of risk management approaches (Part VI)
• The ability to calibrate business risks and to advise on appropriate actions (Part VI)
• Effective hedges against market risks (e.g., interest rate risk, foreign exchange risk) using derivatives (Part
VI)
• A need to develop a finance department that works effectively on the global stage (Part VI)
• The incorporation of new technologies to improve finance processes and drive business insight (Part VII)
• A growing pressure to transform the finance functions to drive better customer service (Part VII)
• The need to implement and monitor effective internal control systems (Part VII)
This course is designed to help CFOs navigate these issues. It is divided into seven parts, which provide guidance
to the issues faced by the CFO and the finance and accounting functions.
Part I: Profiling the Modern CFO (Chapter 1) details principles guiding the role and expectations of a CFO. It cap-
tures the key requirements including the key competencies required by CFOs today and for tomorrow. It also
describes the ever-expanding role of the CFO, and how CFOs are transforming their departments and revamping
their teams to deal with the growing complexity.
Part II: Reporting Value (Chapters 2-3) covers the objectives and uses of financial statements. It also discusses
the key financial accounting requirements including revenue recognition, leases, consolidation, fixed assets, in-
ventory, and earnings per share. The different types of accounting changes and errors are also noted.
Part III: Ensuring Regulatory Compliance (Chapters 4-5) addresses one of the most fundamental roles of CFOs -
ensuring compliance with financial controls and financial reporting requirements. It focuses on the Securities
and Exchange Commission (SEC) filing requirements and key provisions of the Sarbanes-Oxley Act. It covers the
SEC disclosure review process to help CFOs respond to any potential SEC queries, including areas where the SEC
staff may challenge the accounting treatment or request enhanced disclosure.

ii
Part IV: Asset and Liability Management (Chapter 6) shares insights into managing cash, receivables, inventory
and accounts payable to order to support the CFO in maximizing return and minimizing the liquidity and busi-
ness risk.
Part V: Providing Strategic Finance Support and Analysis (Chapters 7-10) focuses on the planning required so
that CFOs can provide assistance in the budgetary and forecasting process. It highlights forecasting techniques,
including break-even analysis, contribution margin analysis, margin of sale, and sales mix analysis, in order to
support CFOs in strategy formulation. It also introduces the general concepts behind capital budgeting, along
with six methods for selecting the best alternatives among capital projects. Finally, it discusses the most com-
mon financial ratios (e.g., profit margin, inventory ratio, debt ratio) that allow the CFO to evaluate various as-
pects of a company’s operating and financial performance.
Part VI: Optimizing Profitability and Mitigating Risks (Chapters 11-14) deals with how to establish robust risk
management practices. It addresses what CFOs should know about the principles of enterprise risk manage-
ment, the concept of the ‘lines of defense’ model, and the importance of fraud risk assessment. Moreover, it
covers the basics of hedge accounting, a useful tool for organizations that experience financial statement volatil-
ity. It also recognizes the risks associated with derivatives. The types of risks applied to designing a portfolio are
identified. A sophisticated value-based analytics (the Capital Asset Pricing Model), is introduced as well. The fi-
nancial management of overseas operations for multinational companies is explained. Finally, strategies for
managing foreign exchange exposure are highlighted.
Part VII: Achieving Operational Excellence (Chapters 15-17) discusses how modern CFOs should embrace new
technologies to reduce costs, improve operational efficiency and strengthen processes. It also explores the
anatomy of a Balanced Scorecard strategy to support CFOs in creating an action plan to move them from an or-
ganization that just reports to an organization that drives business performance with key performance indica-
tors. It discusses some common performance measures used by accounting professionals as well. Finally, it fo-
cuses on the practices that today’s best-in-class CFOs follow and insights into building an effective internal con-
trol framework.
1
PART I:
PROFILING
THE MODERN CFO
2
Chapter 1: The CFO as a Strategic Partner
Learning Objectives:
After completing this section, you will be able to:
• Identify the key responsibilities of the CFO position
• Recognize the changing role and expectations of today’s CFO
• Differentiate between the role of a CFO and controller
Prior to the 1990s, the CFO’s role was typically the gatekeeper of the financial health of an organization, over-
seeing the financial controls and infrastructure. Since then, the range of responsibilities has expanded due to an
increased competitive marketplace. CFO’s must respond to rapid changes, such as new national and interna-
tional financial regulations and procedures, the updates to industry practices, and the effects of the global
economy. As a result, CFOs are under pressure to deliver fast and reliable reporting to management and stake-
holders.
CFOs know that they can no longer just assume their traditional role. Instead, for CFOs to deliver value as their
duties evolve, they must build skills in other areas of the business; playing a more active leadership role, rethink-
ing their usual approaches to overcoming external pressures, and finding new investment opportunities. Faced
with increasing demands and limited resources, CFOs must find ways to increase the efficiency and effectiveness
of the finance department.
This chapter explains who CFOs are, what they do, and why it matters. You will find the answers to questions
that are of interest to the CFO, such as:
• How is the CFO role evolving?
• What is the most critical expertise, knowledge, and experience to assuming the role of CFO?
• What are key development areas for aspiring finance leaders?
• How does emerging technology transform the role of CFO?
3
The Roles and Expectations of the Modern CFO
The Changing Role of the CFO
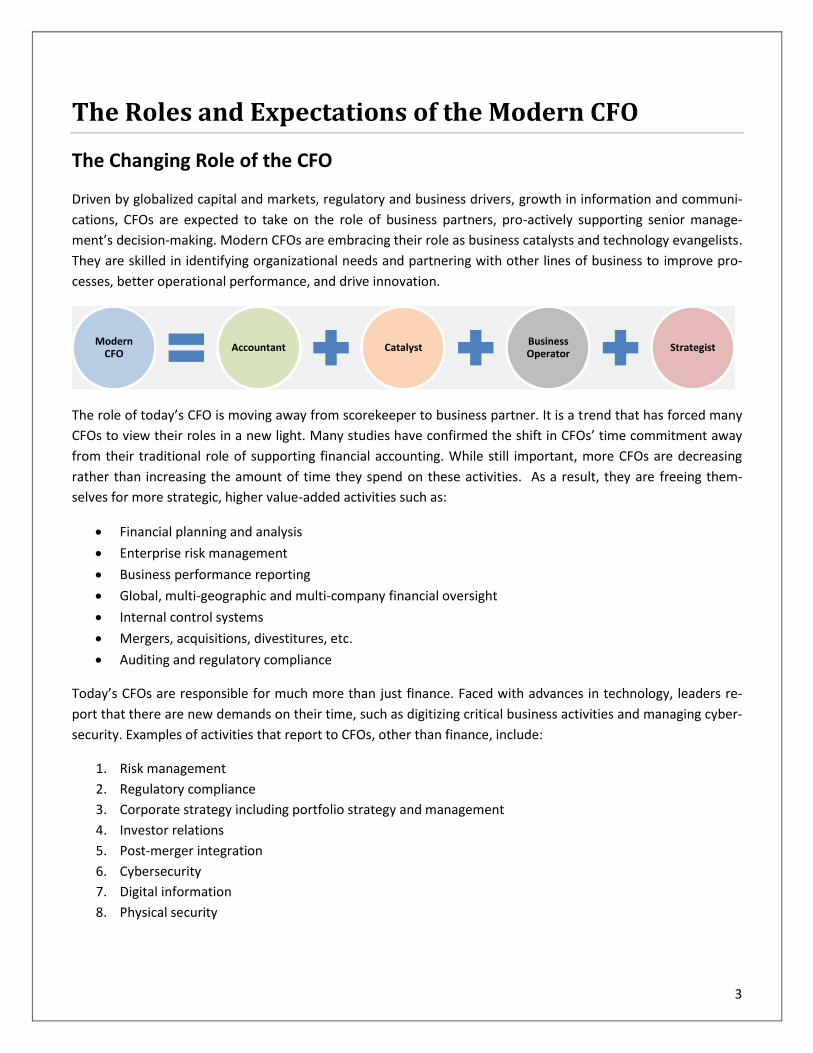
Driven by globalized capital and markets, regulatory and business drivers, growth in information and communi-
cations, CFOs are expected to take on the role of business partners, pro-actively supporting senior manage-
ment’s decision-making. Modern CFOs are embracing their role as business catalysts and technology evangelists.
They are skilled in identifying organizational needs and partnering with other lines of business to improve pro-
cesses, better operational performance, and drive innovation.
The role of today’s CFO is moving away from scorekeeper to business partner. It is a trend that has forced many
CFOs to view their roles in a new light. Many studies have confirmed the shift in CFOs’ time commitment away
from their traditional role of supporting financial accounting. While still important, more CFOs are decreasing
rather than increasing the amount of time they spend on these activities. As a result, they are freeing them-
selves for more strategic, higher value-added activities such as:
• Financial planning and analysis
• Enterprise risk management
• Business performance reporting
• Global, multi-geographic and multi-company financial oversight
• Internal control systems
• Mergers, acquisitions, divestitures, etc.
• Auditing and regulatory compliance
Today’s CFOs are responsible for much more than just finance. Faced with advances in technology, leaders re-
port that there are new demands on their time, such as digitizing critical business activities and managing cyber-
security. Examples of activities that report to CFOs, other than finance, include:
1. Risk management
2. Regulatory compliance
3. Corporate strategy including portfolio strategy and management
4. Investor relations
5. Post-merger integration
6. Cybersecurity
7. Digital information
8. Physical security
StrategistBusiness Operator
CatalystAccountantModern
CFO

4
CFOs have been striving to transform the finance function from an inward-looking organization focused primari-
ly on financial reporting, to one that spends more time focused on strategic decision-making and value creation.
The CFO is now recognized as a partner to the CEO, requiring a broader set of skills and responsibilities. CEOs
and boards are expecting the CFO to contribute to almost all major decisions including growth and acquisition
strategy, as well as the evaluation of investments. Thus, the top requirements of the board from a CFO are:
Today’s CFOs often need to spend one-third of their time communicating with their finance team and stake-
holders, it is not enough for them to just produce and report the financial results. It is increasingly important for
CFOs to understand how the organization arrived at those results and to provide insights from those results. An
evolving CFO increasingly understands the business across all lines, not just the financial aspects. He/she needs
to know, for instance, what revenue increase expectation Marketing has in launching a discounted price cam-
paign, or why Production has decided to change electrical cables requiring another sizeable investment.
Ernst & Young highlighted six principal activities that represent the contribution of today’s top CFOs, including:
1. Ensuring business decisions are grounded in solid financial criteria.
2. Providing insight and analysis to support the CEO and other senior managers.
3. Leading key initiatives in finance that support overall strategic goals.
4. Funding, enabling and executing the strategy set by the CEO.
5. Developing and defining the overall strategy for the organization.
6. Communicating the organization’s progress on strategic goals to external stakeholders.
The following table summarizes the key skills of evolving CFOs and suggestions about how to improve these
skills:
Strategic Thinking
• Keep abreast of the latest business developments, thinking and practices.
• Embrace and leverage information technology and deploy data analytics to spot
trends and changes in the business environment.
• Partner with other C-suite executives to develop operation plans and strategies.
• Plan scenarios and evaluate different options for application.
Communication
• Learn to handle and leverage to new forms of media (e.g. social media).
• Review internal information capture, retrieval and reporting processes to ensure
timely, accurate and transparent responses.
• Communicate changes in strategy and direction to internal stakeholders in a
timely and detailed manner.
Risk Management
• Keep abreast of the latest risk management developments, practices and ERM
models.
• Develop full understanding of changes in business profile and models.
Strategic partnerAnnual budgeting
and outlook forecasting
Risk managementCommunication and
influencing skills

5
• Revalidate existing risks, identify new risks, and measure changes in risk profile
and impact of the risks in the risk register.
• Review the ERM framework to ensure appropriate processes and procedures are
in place to either mitigate or minimize the risks.
Analysis and
Advisory
• Build knowledge of data analytics and analytical tools and their use.
• Apply analytics on the organization’s financial and operational data to reduce
the cost per transaction, monitor gross margins across product or service lines,
and identify anomalies or unusual transactions.
• Leverage analysis and provide feedback to operations and other departments for
improvements to policies and processes.
People
Management
• Support continuing education of finance staff including developing and enhanc-
ing technical competency and analysis skills.
• Help the finance team build the necessary platform to partner other functions to
improve operational performance.
Source: EY, Ready for the future economy? 2016
To ensure a well-governed organization, it is critical to have professional accountants in key finance leadership
roles. In particular, the CFO should be a vital part of a chain of actors, including the governing body (e.g. board of
directors), CEO, audit committee, and auditor. They all have their respective responsibilities to ensure that busi-
ness reporting provides relevant, accurate, and comparable information on the financial position and perfor-
mance of an organization. In addition, the transparency, financial stability, and performance of governments and
public sector organizations are closely linked with the quality and professionalism of the CFO and the finance
function.
How can the CFO help to ensure that the board makes good use of its limited time?
1. Plan carefully, even aggressively, in securing the time required to focus on the most important issues, for ex-
ample, by giving priority and quality time to strategic discussions and fitting the routine issues around them ra-
ther than the other way around.
2. Manage expectations, for example, it may not be possible or wise to complete a major strategic discussion in
one day. It may need to be supported by site visits, specialized briefings and/or in-depth work on historic and
future performance before all these strands can be brought together to make strategic decisions.
3. Use opportunities for free-flowing conversation, for example, at dinners the night before the Board meeting.
These can also be valuable for leveraging the diverse talents of the non-executive directors by getting them to
talk about their skills and experience.
4. Think carefully about what the board needs to hear and don’t assume that the 40-slide presentation is al-
ways the best approach. Instead, make strategic use of pre-reads and concentrate on facilitating a meaningful
discussion.
Source: Chartered Institute of Management Accountants, The Role of the CFO on the Modern Board, 2017
6
The Duties of a Modern CFO
The CFO is at the center of the corporate universe because of the need for organizations to capture, manage and
leverage data to enhance an organization’s performance. Thus, the skills, knowledge, and experience that a pro-
fessional accountant brings to the CFO role should be acknowledged. It is a true advantage, uniting an ethical
approach and a technical mindset with strong business acumen. This section discusses the requirements of suc-
cessful CFOs, along with their primary duties.
Examples of the core expertise of a CFO include:
1. Leadership skills to drive change in all financial matters.
2. Carrying out strategic plans to achieve corporate goals.
3. Funding the organization’s operations.
4. Identifying financial and risk issues in relation to corporate strategy.
5. Setting and communicating the vision and strategy for finance.
6. Forecasting future performance.
7. Communicating financial information and risks effectively.
8. Monitoring progress against strategy and identifying corrective action where required.
To take the CFO role to the next level − adding value, gaining more respect, and increasing salary, the modern
CFO must integrate the following core knowledge points when funding, enabling, and executing strategy:
• Operational and strategic planning
• Awareness of the organization risk profile
• Knowledge of industry practices, structures, challenges and businesses
• Detailed knowledge of products and service lines
• Knowledge of competitive performance
• Understanding finance and accounting processes and implications for the business operating model
• Capital management
• Operational/financial risk management
• Performance management systems
• Project financing
• The components and the interdependencies of the accounting system
• Implication for change
Together with core expertise and knowledge, a successful CFO usually has the following key experiences:
• Strategy development
• Business plans development and implementation
• Pricing and profitability analysis
• Cost management
• Planning and forecasting
• Operational/financial risk management
7
• Financial planning and reporting
• Financial process improvement and transformation
• International exposure (e.g., managing diverse teams, understanding global markets)
• Dealing with mergers or acquisitions
• Managing relationships with external parties (e.g., regulators, auditors, investors)
CFOs’ expertise, knowledge, and experience are essential elements in an effective leadership team as well as for
ensuring strong management practices and information systems, supported by an appropriate infrastructure
and ethical culture. Robert Half identifies the following typical job duties for the CFO:
1. Directing accounting policies, procedures and internal controls.
2. Providing strategic management of the accounting and finance functions.
3. Recommending improvements to ensure the integrity of a company’s financial information.
4. Managing or overseeing the relationship with independent auditors.
5. Collaborating with CIOs on technology decisions.
6. Overseeing financial systems implementations and upgrades.
7. Managing relationships with investors and investment institutions.
8. Identifying and managing business risks and insurance requirements.
As businesses grow in complexity and size, so do the expectations of a CFO. In addition to being the financial
gatekeeper, the CFO is also expected to participate in driving the organization toward achieving its objectives.
For example, CFOs are called upon more often to apply their analytical and business skills to more strategically
oriented organizational issues, increasing the value that they provide to their organization. A highly influential
CFO usually spends the most time on the following tasks:
• Strategic business planning
• Working capital and cash flow management
• Risk management
• Financial policy making and planning
• Corporate governance
• Financial reporting
• Investment strategy and management
• Regulatory compliance
• Investor relations and stakeholder management

8
The following represents a snapshot of the average CFO compensation and background for public and private
sectors.
Portrait of a CFO
Public Private Median base salary $300,00 $200,000 Median annual bonus $99,000 $ 42,000 Median total compensation, including salary, bonus, long- term compensation and value of all benefits
$513,000 $285,000
Eligible to receive cash-based long-term incentives 22% 23% Eligible stock-based long-term incentives 89% 46% Employment contracts prevalence 88% 47% Most popular CFO contract provision is change-in-control severance, based on number of months
46% 41%
Eligible to participate in a defined benefit plan 30% 14% Has a master’s degree 48% 53% Years in current position 6 7 Female 22% 19% Male 78% 81%
Source: Grant Thornton, Financial Executive Compensation Report 2017
In summary, modern CFOs are expected to be both a strategist and a controller, focusing on growth and cost
management. They must combine traditional qualities with new responsibilities. The duties of operational effi-
ciency, compliance with corporate and regulatory standards, and safeguarding the integrity of company and
stakeholder data are still firmly on the CFO’s agenda. Moreover, CFOs continue to be responsible for financial
management, accounting and control, as well as areas such as IT, HR and risk management in smaller and pri-
vately-owned firms. They unite in-depth financial expertise with additional capabilities in IT, legal, HR and pro-
curement, and the ability to drive change. These attributes and many more seem very much in the CFO skill set,
as the role becomes increasingly strategic.
Professional Accountants in Business
Professional accountants working in business can typically be found in four types of roles: as value creators, en-
ablers, preservers, and reporters. The CFO principles relate to these roles and need to ensure success in each by:
1. Creating value: Developing strategies for sustainable value creation;
2. Enabling value: Supporting the governing body and senior management in making decisions and facilitating
the understanding of performance of organizational functions or units;
3. Preserving value: Asset and liability management, managing risk in relation to setting and achieving the or-
ganization’s objectives, and implementing and monitoring effective internal control systems; and
4. Reporting value: Ensuring relevant and useful internal and external business reporting.
Depending on the route they have taken, professional accountants may have trained and qualified while work-
ing in public accounting and, later in their career, moved to work for an organization. Others, typically known as
management accountants, have trained and qualified within a corporate or public sector environment.
Source: International Federation of Accountants (IFAC), The Role and Expectation of a CFO, 2013

9
CFO vs. Controller
As the head of the finance areas of a company, the CFO usually reports directly to the CEO and may have a seat
on the board. The CFO often assists the chief operating officer (COO) on all strategic and tactical matters, be-
cause the CFO understands managing budgets, and forecasting and sourcing new funds. In larger companies,
the financial operations overseen by the CFO are split into two branches; one headed by the Controller and the
other by the Treasurer.
The CFO and the Controller are two primary types of financial leaders within an organization. The CFO and the
Controller play very important, yet different roles within growing companies. In general, the CFO is a strategist,
a key member of the senior management team. The Controller’s responsibilities are primarily accounting in na-
ture, including budgets, forecasts and cost accounting.
The CFO, the finance leader of an organization, has primary responsibility for managing the organization’s fi-
nances, including financial planning, management of financial risks, record-keeping, and financial reporting. In
some sectors, the CFO is also in charge of data analysis. An evolving CFO focuses on the following tasks:
• Advises management/board on business fundamentals/growth strategy
• Helps address strategic issues and serves as the right hand to the CEO
• Facilitates the development and implementation of corporate strategies
• Assures adequate capital or growth by assisting with financing and leveraging available debt
• Manages cash flow and communicates the cash needs and future cash projections
• Builds a technology infrastructure enabling standardized processes to eliminate redundant tasks
• Directs accounting systems, policies and procedures
Board of Directors
President (CEO)
Vice President Operations
(COO)
Vice President Finance (CFO)
Treasurer
Financial Planning
Capital Expenditure
Cash & Credit Investment
Controller
Financial Accounting
Cost Accounting
Tax
Vice President Marketing

10
• Deploys forecasting and performance techniques to measure performance and provide insight
• Oversees long-term planning and risk management
• Manages stock option issuance and tracking
• Maintains outside relationships with regulators, auditors, and legal advisors
• Enhances investor relationships by guiding investors on business performance
The Controller, the organization’s chief operational accounting expert, is a tactician who is primarily concerned
with ensuring the smooth day-to-day accounting and financial operations. Specifically, the Controller is expected
to:
• Develop and implement accounting policies and procedures
• Manage day-to-day accounting operations (e.g., accounts receivable, accounts payable, payroll)
• Create accurate financial statements in a timely manner
• Implement accounting software and develop chart of accounts
• Analyze budget to actual activity and investigate discrepancies
• Prepare financial management reports and tax reports in a timely manner
• Build and manage the operations of the accounting department
• Manage annual audit preparation and process
As the expectations of the role of CFO continue to shift from stewardship to strategy and execution, the CFO’s
demands on controllers have evolved. Now, Controller responsibilities include an expansion to support strategic
organizational initiatives. The CFO depends heavily on a strong second-in-command, the Controller, who must
assume many of the CFO’s traditional finance and accounting responsibilities. In this capacity, the Controller
frees the CFO to work more closely with the CEO in decision-making efforts.
Do I need a CFO or a Controller?
The determination of what level of skills is needed should be based on the state of the company, and where it
expects to be in the near term. The Controller can cover the fundamentals and ‘hold the fort down’ over a peri-
od of time, while the company focuses on other critical issues. But with that comes the limitations of a not hav-
ing a participative and strategic leader with a strong financial background. Many times, a very hands-on CFO can
cover the activities of a Controller.
If a dynamic organization is ready for growth, the investment in a CFO will benefit the company, not only in
completing the tasks of the Controller, but in providing the additional foundation and leadership needed to take
the organization to the next level. With years of experience, networks and skills, comes a notable increase in
cost. An organization can best determine if it needs a CFO or a Controller by understanding the skills needed, the
momentum of the company and the associated costs.
Interim CFO and/or Controller solutions can offer the right skills at the right time and may be a lower cost solu-
tion for a growing company. Interim executives can be part of a company’s management team from as little as
several hours a week to as much as full time—and only when needed.
Source: The Brenner Group, Do I need a CFO or a Controller?

11
The Next-Generation CFO
Talent and Capability
The CFO role will continue to evolve. To succeed in today’s business environment and to thrive in tomorrow’s,
the CFO needs to excel in the following five areas:
As businesses face greater uncertainty, the CFO is expected to focus on driving profitability through minimizing
costs, managing pricing structures and maximizing the effectiveness of capital allocation. Future CFOs will be
charged with strict scrutiny of capital expenditures, optimizing capital structure, and minimizing liquidity risk and
preparing for the eventualities of uncertain economic times (e.g., difficulties in obtaining bank credit, late pay-
ments from clients, etc.). To balance the numerous challenges that lie ahead, CFOs may consider the following
imperatives:
1. Facilitate a common and unifying perspective on the organization’s strategic objectives, opportunities
and threats by participating in strategy development and validation, implementation and evaluation.
2. Optimize the company’s position within its ecosystem to differentiate and create sustainable perfor-
mance improvements among all the stakeholders; balancing short-term gain and long-term vision.
3. Ensure that the finance and accounting functions deliver proactive business partnering and serve as a
role model for other functions in the areas of transparency, quality, ethics and innovation.
Tomorrow's CFO
Thinking and acting
strategically
Understanding emerging
technology
Coaching to optimize
performance
Investing in and retaining
talent
Communicating complex
financial results
Short-term gain
Long-term vision

12
4. Ensure the finance and accounting function is adaptive and changes with the organization.
5. Create an environment where employees and stakeholders understand the organization’s vision and as-
pirations.
6. Develop forward-looking insight to anticipate and respond to future events.
7. Create operational dexterity to institute business controls and streamline the enterprise, making it suffi-
ciently agile and speedy to take advantage of rapidly emerging opportunities.
8. Create and maintain sustainable value for shareholders and stakeholders (maximum revenue, minimum
costs, maximum economic value and sustainability)
In other words, future finance leaders need to offer a diversity of skills, such financial expertise and techniques,
social and communication skills, and tremendous flexibility. The importance of these skills is illustrated in the
following competency framework developed by the American Institute of Certified Public Accountants (AICPA):
Source: Chartered Global Management Accountant (CGMA), A CFO’s Key Competencies for the Future, 2016
The common behavioral characteristics of the most successful CFOs include:
• Highly interactive, and consensus-oriented leaders
• Attentive to others, involving them in discussion and responding to their input
• Using a thinking style that combines creative problem solving and focused action
• Highly developed analytical skills with the ability to identify trends and patterns
• High levels of ambiguity tolerance, empathy and confidence
The International Federation of Accountants (IFAC) also identifies the following five principles to understand the
changing expectations, scope, and mandate of the future CFO or equivalent (e.g., a finance director, vice presi-
dent of finance). These principles capture the key requirements of the CFO role and highlight what professional
accountants need to do to prepare for finance leadership.
In the context of the business
To influence people
Lead within the organization
Apply accounting and finance skills
Technical
Skills
Business
Skills
Leadership
Skills
People
Skills

13
Five Principles Guiding the Role and Expectations of a CFO
1. Be an effective organizational leader and a key member of senior manage-ment;
2. Balance the responsibilities of stewardship with business partnership;
3. Act as the integrator and navigator for the organization;
4. Be an effective leader of the finance and accounting function; and
5. Bring professional qualities to the role and the organization.
CFOs rely on mission-critical information and analysis that can help company executives and management make
more knowledgeable decisions about their business strategies, the marketplace and the competition. Technical
skills in finance and accounting areas, professionalism, ethical governance and accountability are all a given. As-
piring CFOs need to arm themselves with leadership skills, communication skills, people management skills, and
also have the tools to help cultivate collaboration and trust. The key roles and competencies considered most
important in the future for a CFO are summarized in the following “future mold of a CFO”:
Source: Chartered Global Management Accountant (CGMA), A CFO’s Key Competencies for the Future, 2016
Transformation in the Digital Age
CFOs and their teams recognize the importance of adopting new technologies to improve processes, reduce
costs, and provide insightful information. Technology is not only becoming more advanced, but it is cheaper to
acquire and more accessible. Advances in digital technology are transforming the delivery of financial services.
For example, mobile computing, online tools, visual business and cloud-based infrastructure and applications
Shift in the Role of a CFO
Profitable Growth
Governance
Integrator &
Navigator
Finance & Accounting
Leader
Adaptive Finance
& Accounting
Function
Strategic Manage-
ment
Organiza-tional
Leadership
Organiza-tion Vision
& Aspiration
StakeholderValue
Value Creation & Preserva-
tion

14
allow greater freedom for accounting professionals to work at any time, and any place, rather than being re-
strained to a traditional office setting. In addition, integrated enterprise tools include all features of planning,
budgeting, forecasting and reporting, leading to dramatic improvements in productivity and a single source of
information.
According to Oracle, Thriving in the Digital Age: A Guide for Modern Finance Leaders, historically, CFOs relied on
hierarchical networks for information about what would have been happening in their markets. They had to put
up with a time lag and a risk that data may have been corrupted in the process. Now, the digital age allows un-
mediated contact direct from the business units and the market; instantly and in pure form. What really sets one
CFO apart from another is a solid understanding of the business and how it works. Oracle suggests that a CFO
can harness this “wisdom of crowds”; from infrequent reporting to continuous sharing, as demonstrated in the
following figure:
According to PwC, advances in digital technology support the CFOs in providing meaningful analysis in the fol-
lowing ways:
• Timely and accurate data
CFO
CFO
Information Reaches the CFO: Traditional Busi-
ness
Information Reaches
the CFO: Crowd-led
Business

15
• Secure and stable environments
• Easily accessible data
• User self-service
• Simple to use technology tools
• Integrated systems
• Automated workflow
McKinsey recently calculated the impact of digitization on competitiveness and found that industry leaders who
have embraced digitization across the entire enterprise have revenues, profit margins, and stock prices 20 to 30
percent higher than digital laggards. Details of how modern CFOs engage with new technologies are discussed in
Chapter 15 - Information Technology.
How to Meet the Future Challenges of the CFO Role?
1. Gain a breadth of finance experience; diversity is more important than vertical focus. Considering experi-
ence in areas such as wide range of finance roles (i.e., mix of accounting, auditing, controller, treasury, tax), in-
ternational experience, major strategic change project (e.g., cost restructure, IT, M&A).
2. Develop commercial insight; consider stepping outside finance. For example, the CFO role should be primar-
ily about being a leader of the entire organization rather than just being the head of the finance function.
3. Build a balance between traditional finance and other skills. While the requirement for traditional finance
skills (e.g., cost management, cash flow and controls) remains critical, successful CFOs will be distinguished by
their ability to communicate effectively and build strong stakeholder relationships and networks as well as exe-
cute strategy and to lead teams with diverse skills.
4. Look for leadership opportunities and team-building skills. It is almost impossible for a CFO to be an expert
in the complete range of activities under his or her control, especially when IT, sourcing, and other functions are
added to the CFO’s remit. It’s therefore essential for CFOs to be able to build the right team dynamics around
them and to have superb talent development and coaching skills.
5. Gain international exposure, especially in emerging markets. As global companies become increasingly po-
larized between fast-growing, immature markets and slow-growing, mature ones, CFOs who have experience of
managing both will be in high demand.
6. Participate in or lead finance transformation initiatives and major change programs. A growing number of
organizations have set up shared service centers to handle the more transactional aspects of finance. Thus, ex-
perience of managing the ongoing relationship with the shared service provider has become an important part
of the toolkit for CFOs.
7. Seek M&A experience — both in transaction planning and post-merger integration. The economic recovery
should herald a return of M&A activity, giving future finance leaders a good opportunity to demonstrate their
strategic and leadership skills. Examples of M&A activities or initiatives include initial public offerings, imple-
menting shared service/outsourcing, cost reduction projects, and entry into new markets.

16
8. Get exposure to the market and its stakeholders; communications skills are a differentiator. CFOs should
seek to build relationships with a wide range of stakeholders including banks, equity and bond investors, regula-
tors, rating agencies, analysts and the media.
9. Proactively build effective relationships with the board. CFOs must become attuned to boardroom dynam-
ics, and build effective relationships with key board members, including the CEO, the Chairman, and the Chair of
the Audit Committee.
Source: EY, The evolving role of today’s CFO, 2014

17
Chapter 1 Review Questions
1. What is the involvement of the CFO with the risk management process?
A. Providing independent evaluations of preventative and detective measures.
B. Developing full understanding of changes in business profile and models.
C. Defining the principles of operation and implementing the company’s long- and short-term plans.
D. Setting security policies and procedures that provide adequate business application protection.
2. CFOs are usually concerned with which of the following tasks?
A. Preparation of tax returns
B. Developing a chart of accounts
C. Protection of assets
D. Investor relations
3. The treasury function is usually NOT concerned with which of the following activities?
A. Financial reporting
B. Short-term financing
C. Cash custody and banking
D. Credit extension and collection of bad debts

18
PART II:
REPORTING VALUE
19
Chapter 2: The Financial Statements
Learning Objectives
After completing this section, you will be able to:
• Recognize the use of and the objectives for the financial statements
• Identify the differences between a single-step income statement and a multiple-step income statement
• Recognize the key activities reported on the cash flow statement
• Identify the differences between the direct method and the indirect method
• Recognize how footnote disclosures are used
The Role of the CFO
Appropriate financial statement presentation is key to achieving the primary objectives of financial reporting,
which includes providing useful information to investors, lenders, creditors, and other stakeholders. Under-
standing financial statements is critical to CFOs because they have financial and managerial responsibilities, su-
pervising all phases of financial and accounting activity. Their teams are responsible for maintaining timely and
accurate financial statements and reports to provide information that:
1. Is useful to those making investment and credit decisions, assuming that those individuals have a rea-
sonable understanding of business and economic activities,
2. Is meaningful to managers so that they are able to identify trends and areas for improvement,
3. Is helpful to current and potential investors and creditors and other users such as labor and government
agencies in assessing the amount, timing, and uncertainty of future cash flows,
4. Discloses economic resources, claims to those resources, and the changes therein.
This chapter discusses the objectives of financial reporting and the key elements contained within different fi-
nancial statements. Classification of cash flows can often be a challenge, especially for items related to nonre-
curring transactions. This chapter also provides examples and considerations that will offer CFOs insight into ap-
propriate presentation of the statement of cash flows in accordance with U.S. Generally Accepted Accounting
Principles (GAAP).

20
Objectives of Financial Reporting
Financial reporting provides information that is useful in making business and economic decisions. The objec-
tives of general-purpose financial reporting primarily come from the needs of external users who must rely on
the information that management communicates to them.
SFAC (Statement of Financial Accounting Concepts) No. 1 describes the objectives of financial reporting. Finan-
cial reporting has the following major objectives:
1. Financial reporting should provide information that is useful to present and potential investors and creditors
and other users in making rational investment, credit, and similar decisions. The information should be
comprehensive to those who have a reasonable understanding of business and economic activities and are
willing to study the information with reasonable diligence.
2. Financial reporting should provide information to help present and potential investors and creditors and
other users in assessing the amounts, timing, and uncertainty of prospective cash receipts from dividends or
interest and the proceeds from the sales, redemption, or maturity of securities or loans. Since investors’ and
creditors’ cash flows are related to enterprise cash flows, financial reporting should provide information to
help investors, creditors, and others assess the amounts, timing, and uncertainty of prospective net cash in-
flows to the related enterprise.
3. Financial reporting should provide information about the economic resources of an enterprise, the claims to
those resources (obligations of the enterprise to transfer resources to other entities and owners’ equity),
and the effects of transactions, events, and circumstances that change its resources and claims to those re-
sources.
The primary focus of financial reporting is to include information about earnings and its components. Earnings
analysis gives clues to:
Financial reporting should also provide information about how well management has performed its stewardship
function. Management is responsible not only for the custody and safekeeping of enterprise resources, but also
for their efficient profitable use.
Through financial reporting, management can provide significant financial information to users, identifying
events and circumstances and explaining the financial effects on the enterprise. This information only goes so
far, though. All investors, creditors, and others must do their own critical evaluation and assessment, and not
rely exclusively on a presentation by management.
Management’s performance
Long-term earning capabilities
Future earnings
Risks associated with lending to and
investing in the enterprise

21
The Common Financial Statements
Financial decisions are typically based on the information generated from the accounting system. Financial man-
agement, stockholders, potential investors, and creditors are concerned with how well the company is doing.
The three reports generated by the accounting system and included in the company's annual report are the bal-
ance sheet, income statement, and statement of cash flows. Although the form of these financial statements
may vary among different businesses or other economic units, their basic purposes do not change.
The balance sheet portrays the financial position of the organization at a particular point in time. It shows what
the company owns (assets), how much the company owes to vendors and lenders (liabilities), and what is left
(assets minus liabilities, known as equity or net worth). A balance sheet is a snapshot of the company's financial
position as of a certain date. The balance sheet equation can be stated as: Assets - Liabilities = Stockholders' Eq-
uity.
The income statement, on the other hand, measures the operating performance for a specified period of time
(e.g. for the year ended December 31, 20X9). If the balance sheet is a snapshot, the income statement is a mo-
tion picture. The income statement serves as the bridge between two consecutive balance sheets. Simply put,
the balance sheet indicates the wealth of your company and the income statement tells how your company did
last year or last quarter.
The balance sheet and the income statement tell different things about a company. For example, the fact that
the company made a big profit last year does not necessarily mean it is liquid (has the ability to pay current lia-
bilities using current assets) or solvent (noncurrent assets are enough to meet noncurrent liabilities). A company
may have reported a significant net income but still have a deficient net worth. In other words, to find out how
your organization is doing, you need both statements. The income statement summarizes a company's operat-
ing results for the accounting period; these results are reflected in the equity (net worth) on the balance sheet.
This relationship is shown in Exhibit 2-1 on the following page.
The statement of cash flows shows the sources and uses of cash, which is a basis for cash flow analysis for man-
agement. The statement aids in answering vital questions like "where was money obtained?" and "where was
money put and for what purpose?" By reviewing the statement of cash flows, one can see the effects of major
policy decisions because the statement presents the effects of cash on all significant operating, investing, and
financing activities. This statement, as shown in Exhibit 2-1, provides useful information about the inflows and
outflows of cash that cannot be found in the balance sheet and income statement.

22
Exhibit 2-1
The Balance Sheet and Income Statement
Exhibit 2-2 shows how these statements, including the statement of retained earnings, tie together with numer-
ical figures. The beginning amount of cash ($30 million) from the 20x6 balance sheet is added to the net increase
or decrease in cash (from the statement of cash flows) to derive the cash balance ($40 million) as reported on
the 20x7 balance sheet. Similarly, the retained earnings balance as reported on the 20x7 balance sheet comes
from the beginning retained earnings balance (20x6 balance sheet) plus net income for the period (from the in-
come statement) less dividends paid.
Exhibit 2-2
How Financial Statements Tie Together

23
The Income Statement
Key Elements
The four major components of an income statement are revenues, expenses, gains, and losses:
Highlights of the Income Statement
Revenues Expenses Gains Losses
Actual or expected in-
flows of cash or other
assets or reductions in
liabilities resulting from
producing, delivering, or
providing goods or ser-
vices constituting an en-
tity's major or central
operations.
Actual or expected out-
flows of cash or other
assets or incurrences of
liabilities resulting from
producing, delivering, or
providing goods or ser-
vices constituting an en-
tity's major or central
operations.
Increases in equity or net
assets from peripheral or
incidental activities of an
entity and from all other
transactions except
those resulting from rev-
enues or investments by
shareholders or owners.
Decreases in equity or
net assets from periph-
eral or incidental activi-
ties of an entity and from
all other transactions
except those resulting
from expenses or distri-
butions to shareholders
or owners.
Revenue is the increase in capital arising from the sale of merchandise or the performance of services. When
revenue is earned, it results in an increase in either cash (money received) or accounts receivable (amounts
owed to you by customers). Revenue is recognized when:
• It is realized or realizable (goods or services are converted or convertible to cash or claims to cash or re-
ceivables), and
• It is earned (the earning process is complete or virtually complete when the entity has substantially
completed what it must do to receive the benefits represented by the revenues).
Revenue from selling products is usually recognized on the date of delivery of goods to customers. Revenue
from services performed is usually recognized when the services have been rendered and are billable. The con-
cept of revenue recognition is discussed in Chapter 3 - Revenue Recognition.
Expenses decrease capital and result from performing activities necessary to generate revenue. Expenses that
reduce net income can be categorized as the cost of goods sold and selling and general administrative expendi-
tures necessary to conduct business operations (e.g., rent expense, salary expense, depreciation expense) dur-
ing the period. Expenses are generally recognized when incurred. Expenses are “matched” against revenues and
should be recorded in the same accounting period. Expenses that benefit several periods, such as depreciation,
should be allocated systematically over relevant periods.
Net income is the amount by which total revenue exceeds total expenses. The resulting profit is added to the
retained earnings account (accumulated earnings of a company since its inception less dividends). If total ex-
penses are greater than total revenue, a net loss results, decreasing retained earnings.

24
Revenue does not necessarily mean a receipt of cash, and expense does not automatically imply a cash pay-
ment. Net income and net cash flow (cash receipts less cash payments) are different. For example, taking out a
bank loan generates cash, but this cash is not revenue since no merchandise has been sold and no services have
been provided. Furthermore, owners’ equity does not change as the loan represents a liability, rather than a
stockholders' investment, and must be repaid. Here’s how a traditional income statement is organized:
Income Statement Snapshot
Revenue
Funds that arise from the sale of merchandise (as by retail business), or the performance of services for a customer or a client (as by a lawyer). Revenue from sales of merchandise or sales of services are often identified merely as sales. Other terms used to identify sources of revenue include professional fees, commission revenue, and fares earned. When revenue is earned, it results in an increase in either Cash or Accounts Receivable.
Variable Costs Costs vary directly with activity.
Direct Material Costs
The cost of the raw materials and components used to create a product.
Direct Labor Costs The cost of the labor used to create a product.
Inventory Carrying The cost of having inventory available for sale but not yet sold.
Total Variable Costs
Cost of Goods Sold (COGS) The cost of making the products sold.
Contribution Margin The difference between sales and the variable costs of the product or ser-vice, also called marginal income. It is the amount of money available to cover fixed costs and generate profits.
Period Costs Costs are charged to expense in the period incurred.
Depreciation The amount of plant asset cost allocated to each accounting period benefit-ing from the plant asset's use.
Research & Devel-opment (R&D)
The investment the company makes in developing new products or improv-ing existing ones.
Marketing Expense The investment the company makes in advertising, selling, and distributing products.
Administrative Ex-pense
The cost of operating a business such as legal services.
Total Period Costs The costs of operating the business.
Earnings Before Interest & Taxes (EBIT), or Net Margin
Revenues minus variable costs (contribution margin) minus period costs.
Interest Expense The expense of a company’s financing strategy.
Taxes The revenue a company pays to the government.
Net Income Revenues minus variable costs minus period costs minus interest expenses and taxes.

25
Income Statement Formats
The income statement can be presented in a single-step format or the multistep format. The single-step format
contains just two sections: Revenues - Expenses = Net Income. The revenue section includes sales revenue, in-
terest income, gains, and all other types of revenues. The expense section includes cost of goods sold, selling
and administrative expenses, interest expense, losses, and taxes. The single-step format does not emphasize any
one type of revenue or expense, and therefore any potential problems with classifying revenues and expenses
are eliminated.
An example of a single-step income statement is shown in Exhibit 2-3. Entities that choose the single-step for-
mat for income statement presentation break out income tax expense separately at the bottom of the state-
ment placing it directly after the caption “income before taxes.” Although this is not strictly in accordance with
the single-step concept, which requires income tax expense to be included in the expenses category it is done to
enhance the comparability of the entity's income statement to other entities.
Exhibit 2-3: Example of Single-Step Income Statement
XYZ Company
Income Statement
For the Year Ended December 31, 20X8
REVENUES
Net sales $3,000,000
Interest income 120,000
Dividend income 45,000
Rental income 36,000
Gain on sale 150,500
Total revenues $3,351,500
EXPENSES
Cost of goods sold $2,000,000
Selling expenses 700,000
Administrative expenses 250,000
Interest expense 65,000
Loss on disposal 55,000
Income tax expense 110,500
Total expenses 3,180,500
NET INCOME $ 171,000
Less: Net income attributable to the noncontrolling interest (10,000)
Net income attributable to XYZ Company 161,000
EARNINGS PER SHARE (500,000 shares) $ .34
A multistep income statement is used to emphasize certain sections and relationships. For example, subtotals
are used to show decision-useful line items such as gross margin and operating income separately from non-
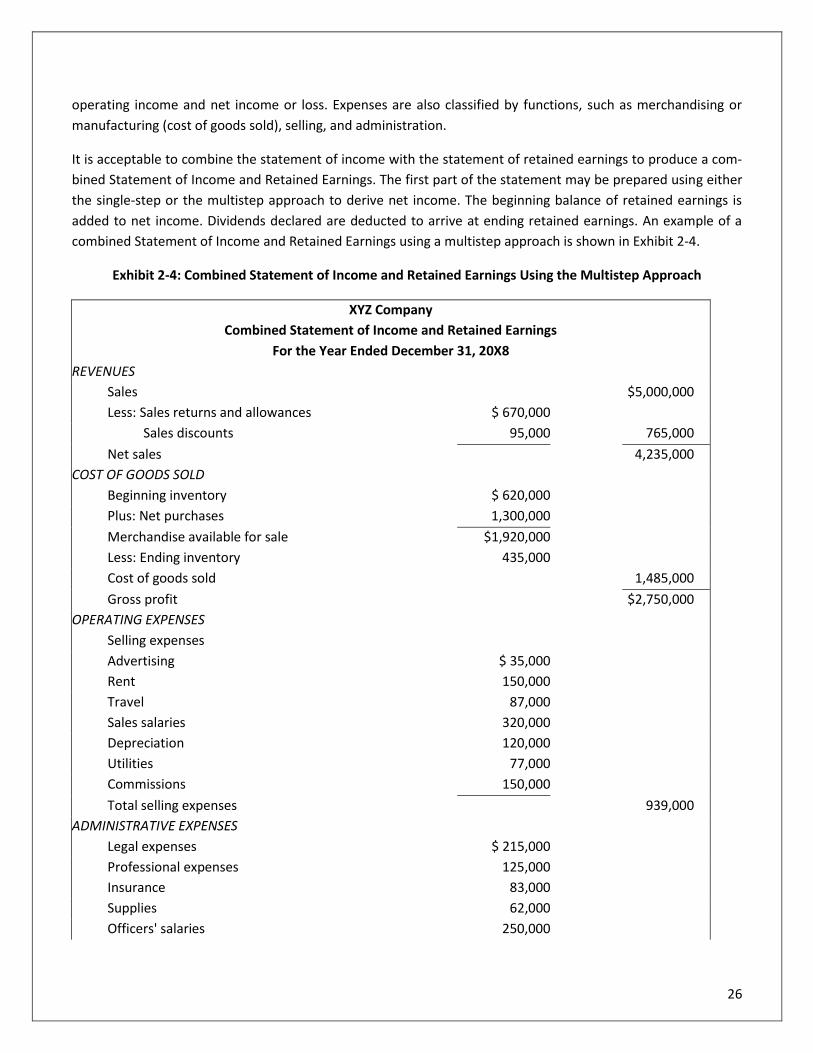
26
operating income and net income or loss. Expenses are also classified by functions, such as merchandising or
manufacturing (cost of goods sold), selling, and administration.
It is acceptable to combine the statement of income with the statement of retained earnings to produce a com-
bined Statement of Income and Retained Earnings. The first part of the statement may be prepared using either
the single-step or the multistep approach to derive net income. The beginning balance of retained earnings is
added to net income. Dividends declared are deducted to arrive at ending retained earnings. An example of a
combined Statement of Income and Retained Earnings using a multistep approach is shown in Exhibit 2-4.
Exhibit 2-4: Combined Statement of Income and Retained Earnings Using the Multistep Approach
XYZ Company
Combined Statement of Income and Retained Earnings
For the Year Ended December 31, 20X8
REVENUES
Sales $5,000,000
Less: Sales returns and allowances $ 670,000
Sales discounts 95,000 765,000
Net sales 4,235,000
COST OF GOODS SOLD
Beginning inventory $ 620,000
Plus: Net purchases 1,300,000
Merchandise available for sale $1,920,000
Less: Ending inventory 435,000
Cost of goods sold 1,485,000
Gross profit $2,750,000
OPERATING EXPENSES
Selling expenses
Advertising $ 35,000
Rent 150,000
Travel 87,000
Sales salaries 320,000
Depreciation 120,000
Utilities 77,000
Commissions 150,000
Total selling expenses 939,000
ADMINISTRATIVE EXPENSES
Legal expenses $ 215,000
Professional expenses 125,000
Insurance 83,000
Supplies 62,000
Officers' salaries 250,000

27
Miscellaneous office expenses 35,000
Total administrative expenses 770,000
INCOME FROM OPERATIONS $1,041,000
OTHER REVENUES AND GAINS
Interest income $ 370,000
Dividend income 425,000
Rental income 325,000
Gain on sale 175,000
Total 1,295,000
$2,336,000
OTHER EXPENSES AND LOSSES
Interest expense $ 400,000
Loss on disposal 395,000
Total $ 795,000
INCOME BEFORE TAXES $1,541,000
Income tax expense (30%) 462,300
NET INCOME $1,078,700
Less: Net income attributable to the noncontrolling inter-
est (25,000)
Net income attributable to XYZ Company $1,053,700
Beginning Retained Earnings 800,000
$1,878,700
Less: Cash dividends declared and paid (650,000)
Ending Retained Earnings $1,228,700
EARNINGS PER SHARE (500,000 shares) $ 2.16
Income statements are generally presented in the formats noted above, however, reporting entities can also
present an income statement by function (e.g., cost of sales, selling expense, administrative expense) or by na-
ture (e.g., payroll expense, advertising expense, rent expense).
The Balance Sheet
Key Elements
The balance sheet is usually presented in one of the following formats:
1. Account form: Assets = Liabilities + Owners’ equity
2. Report form: Assets – Liabilities + Owners’ equity

28
Assets are probable economic benefits obtained or controlled by a particular entity as a result of past transac-
tions or events. Future economic benefits refers to the capacity of an asset to benefit the enterprise by being
exchanged for something else of value to the enterprise, by being used to produce something of value to the
enterprise, or by being used to settle its liabilities. The future economic benefits of assets usually result in net
cash inflows to the enterprise. Assets are recognized in the financial statements when:
1. The item meets the definition of an asset.
2. It can be measured with sufficient reliability.
3. The information about it is capable of making a difference in user decisions, and
4. The information about the item is reliable.
There are two categories of assets; Current Assets and Long-Term Assets. Current Assets are transactions that
can be converted into cash in less than a year such as cash itself, accounts receivable, and inventory. Long-Term
or fixed assets are things in which a company has a long-term investment such as land and buildings, or plant
and equipment.
Liabilities are probable future sacrifices of economic benefits arising from present obligations of a particular en-
tity to transfer assets or provide services to other entities in the future as a result of past transactions or events.
Three essential characteristics of an accounting liability include the following:
1. A duty or obligation to pay exists.
2. The duty is virtually unavoidable by a particular entity.
3. The event obligating the enterprise has occurred.
Liabilities are also divided into two categories; current Liabilities and Long-Term Liabilities. Current liabilities are
debts a company has to pay within a year such as accounts payable, accrued expenses - that’s expenses a com-
pany owes but has not yet paid, and short-term debt, such as a loan a company took out to cover working ex-
penses. Long-term debt is debt that a company has more than one year to pay, such as mortgages or bonds.
Equity is the residual interest in the assets of an entity that remains after deducting its liabilities. In a business
enterprise, the equity or capital is the ownership interest. The stockholders’ equity section of a corporate bal-
ance sheet is usually divided into three parts:
1. Capital stock—The par or stated value of the shares issued.
2. Additional paid-in capital—Primarily the excess of the amounts paid in over the par or stated value.
3. Retained earnings—the undistributed earnings of the corporation.
Corporate capital stock may be either preferred stock or common stock. Preferred stock usually has preferences
over common stock relating to dividends and claims to assets if the corporation is dissolved. Common stock car-
ries the right to vote in corporate affairs and to share in residual profits. A corporation may issue par value, stat-
ed value, or no-par capital stock. Par value or stated value refers to a specific dollar amount per share which is
printed on the stock certificate. Such values are frequently merely nominal amounts. The par or stated value of
stock has no direct relationship to the share’s market value. However, they frequently represent the corpora-
tion’s legal capital as defined by state laws. Legal capital refers to the minimum amount that the corporation

29
may not pay out in dividends. Additional paid-in-capital includes the excess of the price paid for the stock over
its par or stated value.
Retained earnings represents the accumulated earnings of the corporation less dividends distributed to share-
holders. A negative balance in the retained earnings account is referred to as a deficit. The retained earnings
account does not represent cash or any other asset. The directors of a corporation may restrict, reserve, or ap-
propriate retained earnings to show that it cannot be used to distribute assets as dividends. Retained earnings
may be appropriated as result of a legal, contractual, or discretionary requirement. The appropriation of re-
tained earning does not set aside or reserve cash or any other asset.
The basic structure of a balance sheet is shown in the following table:
Balance Sheet
Assets Things of value owned by the business. Examples include cash, machines, and buildings.
Current Assets Assets that can converted to cash within the year.
Cash Includes deposits in banks available for current operations at the balance sheet date plus cash on hand consisting of currency, undeposited checks, and money orders.
Accounts Receivable Amounts due from customers for services performed or merchandise sold on credit.
Inventory The quantity of goods available for sale at any given time.
Total Current Assets These are the assets used to operate a company’s business.
Fixed Assets Assets that have a long-term use or value, including land, building, and equipment.
Property, Plant and Equipment
The purchase price that a company paid for the land, buildings, and equip-ment that a company uses to create the products or services.
Accumulated De-preciation
The value of plant and equipment that a company has used up while operat-ing the business over time.
Total Fixed Assets The net value of a company’s property, plant, and equipment.
Total Assets The value of all of the assets owned by the business.
Liabilities Amounts owed to entities outside of the business (e.g., bank loan, supplier payments and overdrafts).
Current Liabilities Short-term liability (items or amounts to be paid within 12 months) e.g., sup-plier or bank overdraft.
Accounts Payable Amounts owed to suppliers for goods or services purchased on credit.
Current Debt The loan payments (part of a long-term loan) to be made this year.
Total Current Liabil-ities
The debt that a company has to pay back within one year.
Long-Term Liabilities Items or amounts to be paid after 12 months, such as bank loan.
Total Liabilities The loans (or debt contracts) that have to be paid back at some point in the future (in more than a year’s time).
Stockholders’ Equity Net worth of the business to the owner.

30
Common Stock (paid-in capital)
The value of what the owners “paid in” as a direct investment in the company (in a corporation, the sale of stock).
Retained Earnings The amount of income realized and retained since the inception of the entity less dividends paid out to shareholders.
Total Stockholders’ Equity
It is the owners’ claim against the assets of the business or the value of own-ing the business.
Total Liabilities and Stock-holders’ Equity
It is always equal. Total Assets as liabilities and stockholders’ equity account for where the money came from to acquire the assets.
Balance Sheet Limitations
The balance sheet has major limitations. First, the balance sheet does not reflect current value or fair market
value because accountants apply the historical cost principle in valuing and reporting assets and liabilities. Sec-
ond, the balance sheet omits many items that have financial value to the business. For example, the value of the
company’s human resources (including managerial skills) is often significant but is not reported. In addition, pro-
fessional judgment and estimates are often used in the preparation of balance sheets and can possibly impair
the usefulness of the statements.

31
Chapter 2 - Section 1 Review Questions
1. According to the SFAC (Statement of Financial Accounting Concepts) No. 1, on what are the objectives of
financial reporting for business enterprises based?
A. Generally accepted accounting principles
B. Reporting on management's stewardship
C. The need for conservatism
D. The needs of the users of the information
2. What is the primary purpose of the balance sheet?
A. To reflect the fair value of the firm’s assets at some moment in time
B. To reflect the status of the firm’s assets in case of forced liquidation
C. To reflect assets, liabilities, and equity
D. To reflect the firm’s potential for growth in stock values in the stock market
32
Statement of Cash Flows
A statement of cash flows is required as part of a full set of financial statements of all business entities (both
publicly held) and not-for-profit organizations. Proper presentation begins with understanding what qualifies as
cash and cash equivalents, and what does not. From there, classifying cash flows as operating, investing, or fi-
nancing can often be a challenge, especially for cash flows related to nonrecurring transactions. Moreover, the
Securities and Exchange Commission (SEC) staff continues to focus on the classification of cash flows as the
guidance in Accounting Standards Codification (ASC) 230 does not prescribe how companies should classify cash
flows from certain transactions and particularly those that may have aspects of more than one classification. As
a result, management must apply judgment in determining the proper classification. In some cases, this has re-
sulted in diversity in how companies classify cash flows from similar transactions and questions from the SEC
staff about the appropriateness of cash flow classification.
The following sections provide examples and considerations that will offer financial statement preparers and
other users insight into appropriate presentation of the statement of cash flows.
The Financial Accounting Standards Board (FASB) issued ASU 2016-15 to address eight cash flow classification
issues, including several on which the SEC staff frequently comments. The FASB also issued ASU 2016-18 to clari-
fy how entities should present restricted cash and restricted cash equivalents in the statement of cash flows.
The SEC staff has frequently commented on the issues addressed by both updates.
Cash and Cash Equivalents
Cash consists of currency and coin on hand, as well as deposits not restricted by the bank, that is, checking and
(generally) savings accounts. Although banks could restrict the withdrawal of savings account funds, they gener-
ally do not. Cash also includes negotiable items such as cashier's checks, personal checks, certified checks, and
money orders. In addition, it includes other accounts having demand deposit characteristics and allowing for
customer deposit or withdrawal at will without penalty, such as unrestricted certificates of deposit. However,
cash does not consist of items such as postage stamps (office supplies), post-dated checks (receivables), restrict-
ed certificates of deposit (short-term investments), and travel advances (prepaid expenses), which are some-
times misclassified as cash. GAAP defines cash equivalents as:
“Short-term, highly liquid investments that are both readily convertible to known amounts of cash and so near
their maturity that they present insignificant risk of changes in value because of changes in interest rates.”
Cash equivalents ordinarily include only investments with original maturities to the holder of 3 months or less.
Examples of cash equivalents are Treasury Bills, commercial paper, and money market funds.
The Securities and Exchange Commission Regulation S-X, Rule 5-02(1), provides that amounts held in bank ac-
counts that are unavailable for immediate withdrawal (e.g. compensating balances) should be considered as
cash for the purposes of preparing the statement of cash flows. Any restrictions on withdrawal should be dis-
closed.
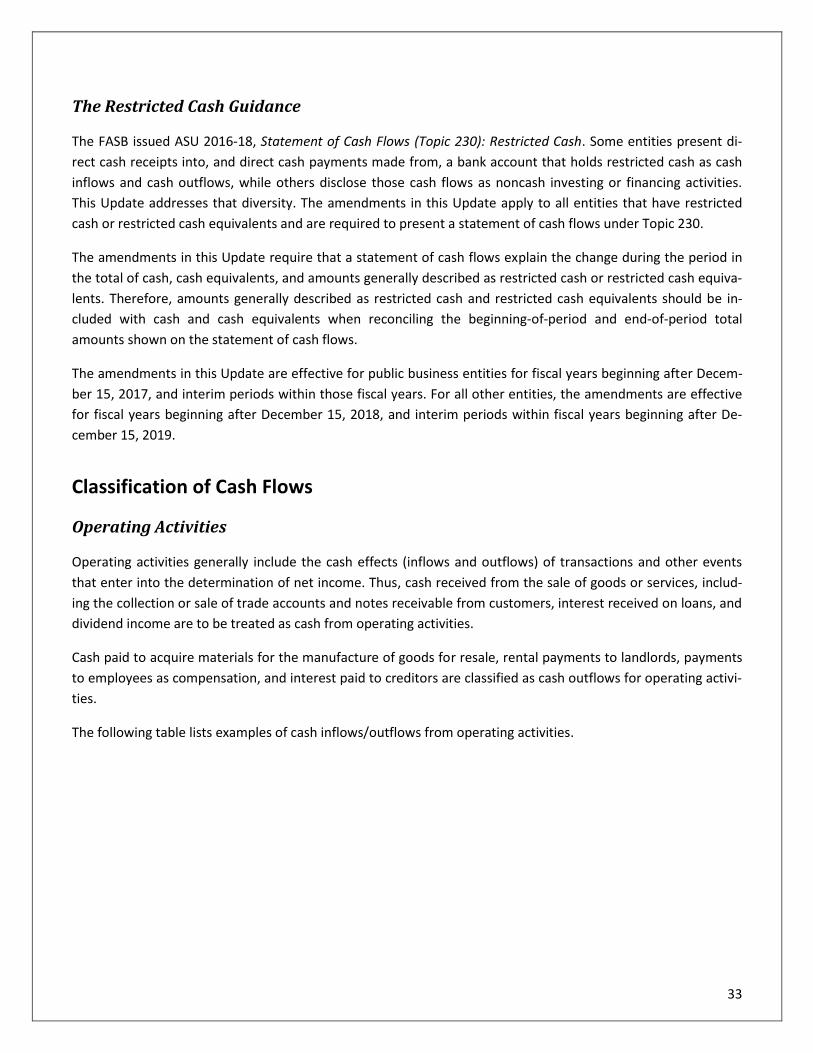
33
The Restricted Cash Guidance
The FASB issued ASU 2016-18, Statement of Cash Flows (Topic 230): Restricted Cash. Some entities present di-
rect cash receipts into, and direct cash payments made from, a bank account that holds restricted cash as cash
inflows and cash outflows, while others disclose those cash flows as noncash investing or financing activities.
This Update addresses that diversity. The amendments in this Update apply to all entities that have restricted
cash or restricted cash equivalents and are required to present a statement of cash flows under Topic 230.
The amendments in this Update require that a statement of cash flows explain the change during the period in
the total of cash, cash equivalents, and amounts generally described as restricted cash or restricted cash equiva-
lents. Therefore, amounts generally described as restricted cash and restricted cash equivalents should be in-
cluded with cash and cash equivalents when reconciling the beginning-of-period and end-of-period total
amounts shown on the statement of cash flows.
The amendments in this Update are effective for public business entities for fiscal years beginning after Decem-
ber 15, 2017, and interim periods within those fiscal years. For all other entities, the amendments are effective
for fiscal years beginning after December 15, 2018, and interim periods within fiscal years beginning after De-
cember 15, 2019.
Classification of Cash Flows
Operating Activities
Operating activities generally include the cash effects (inflows and outflows) of transactions and other events
that enter into the determination of net income. Thus, cash received from the sale of goods or services, includ-
ing the collection or sale of trade accounts and notes receivable from customers, interest received on loans, and
dividend income are to be treated as cash from operating activities.
Cash paid to acquire materials for the manufacture of goods for resale, rental payments to landlords, payments
to employees as compensation, and interest paid to creditors are classified as cash outflows for operating activi-
ties.
The following table lists examples of cash inflows/outflows from operating activities.

34
Operating Activities
Cash Inflows Cash Outflows
• Cash receipts from sales or servicing, such as
from customers, licensees, and lessees
• Interest and dividend receipts
• Proceeds received from an insurance policy
• Refunds from suppliers
• Sale of trading securities
• Award received from a lawsuit
• Other operating receipts
• Cash paid to buy materials and merchandise
purchases
• Cash paid for services
• Payment of general and administrative ex-
penses
• Employee salary payments
• Payments to suppliers
• Insurance payments
• Advertising and promotion payments
• Payment for lawsuit damages
• Cash refunds such as to customers for inferi-
or goods
• Interest payments
• Income tax payments
• Cash purchase of trading securities
• Payment of duties, fines, and penalties
• Charitable contribution payments
• Other operating cash payments
• Amortization of acquisition date fair value
adjustments under either the purchase or
acquisition methods
An analysis of the operating section of the statement of cash flows determines the adequacy of cash flow from
operating activities. For example, an operating cash outlay for refunds given to customers for deficient goods
indicates a quality problem with the merchandise, while payments of penalties, fines, and lawsuit damages re-
veal poor management practices that result in non-beneficial expenditures.
Investing Activities
Investing activities include making and collecting loans, purchasing and selling debt or equity instruments of
other reporting entities, and acquiring and disposing of property, plant, and equipment and other productive
assets used in the production of goods or services.
The following table lists examples of cash inflows/outflows from investing activities.

35
Investing Activities
Cash Inflows Cash Outflows
• Proceeds received from selling fixed assets
• Selling available-for-sale or held-to-maturity
securities in other companies
• Collecting on loans made to debtors, princi-
pal portion
• Insurance proceeds from property, plant and
equipment damaged or destroyed
• Acquiring fixed assets
• Buying available-for-sale or held-to-maturity
securities of other companies
• Granting loans to borrowers
• Cash purchases of businesses in a business
combination
Trading securities are considered operating activities.
An analysis of the investing section can identify investments in other companies. These investments may lead to
an attempt to assume control of another company for purposes of diversification. The analysis may also indicate
a change in future direction or a change in business philosophy. An increase in fixed assets indicates capital ex-
pansion and future growth. A contraction in business arising from the sale of fixed assets without adequate re-
placement is a negative sign.
Cash flows for investing activities should include only advance payments, the down payment, or other payments
at the date when fixed assets are bought, or shortly before or after. If there are principal payments on an in-
stallment loan at later dates, such payments are included in financing activities. Any noncash element of a trans-
action to buy a fixed asset, such as through debt incurrence, is disclosed in a supplementary schedule titled
“Noncash Investment and Financing Activities.”
Financing Activities
Financing activities generally include the cash effects (inflows and outflows) of transactions and other events
involving creditors and owners. In particular, financing activities include issuing or repurchasing a company's
own stock (common stock or preferred stock), paying cash dividends to stockholders, and issuing or paying back
short-term or long-term debt.
The following table lists examples of cash inflows/outflows from financing activities.

36
Financing Activities
Cash Inflows Cash Outflows
• Funds received from issuing the company's
own short-term or long-term debt (e.g.,
bonds payable, notes payable, or mortgage
payable)
• Funds received from selling the company's
own equity securities. (Note: This also in-
cludes the subsequent reissuance of treas-
ury stock.)
• Purchase of treasury stock
• Cash dividend payments. (Note: Dividends
declared but unpaid and stock dividends are
noncash transactions and are presented in a
supplementary schedule titled “Noncash In-
vesting and Financing Activities.”)
• Retiring or paying off the principal on short-
term or long-term debt. (This includes pay-
ments of principal on capital lease obliga-
tions.)
• Other principal payments to long-term credi-
tors
• Payment of debt issue costs
• Subsidiary dividends paid to noncontrolling
interest shareholders
An evaluation of the financing section reveals the company's ability to obtain financing in the money and capital
markets as well as its ability to meet obligations. The financial mixture of bonds, long-term loans from banks,
and equity instruments affects risk and the cost of financing. Debt financing carries greater risk because the
company must generate adequate funds to pay the interest costs and to retire the obligation at maturity; thus, a
very high percent of debt to equity is generally not advisable. The problem is acute if earnings and cash flow are
declining. On the other hand, reducing long-term debt is desirable because it points to lowered risk.
The ability to obtain financing through the issuance of common stock at attractive terms (high stock price) indi-
cates that the investing public is optimistic about the financial well-being of the business. The issuance of pre-
ferred stock may be a negative sign, since it may mean the company is having difficulty selling its common stock.
Perhaps investors view the company as very risky and will invest only in preferred stock since preferred stock
has a preference over common stock in the event of the company's liquidation. Evaluate the company's ability
to pay dividends. Stockholders who rely on a fixed income, such as a retired couple, may be unhappy when divi-
dends are cut or eliminated.
Noncash Investing and Financing Activities
Noncash transactions should not be incorporated in the statement of cash flows. They may be summarized in a
separate schedule at the bottom of the statement or appear in a separate supplementary schedule to the finan-
cials. In addition, although a transaction having cash and noncash components should be discussed, only the
cash aspect should be presented in the statement of cash flows. In other words, if a transaction is part cash and
part noncash, the cash part is reported in the cash flow statement while the noncash portion is disclosed in nar-
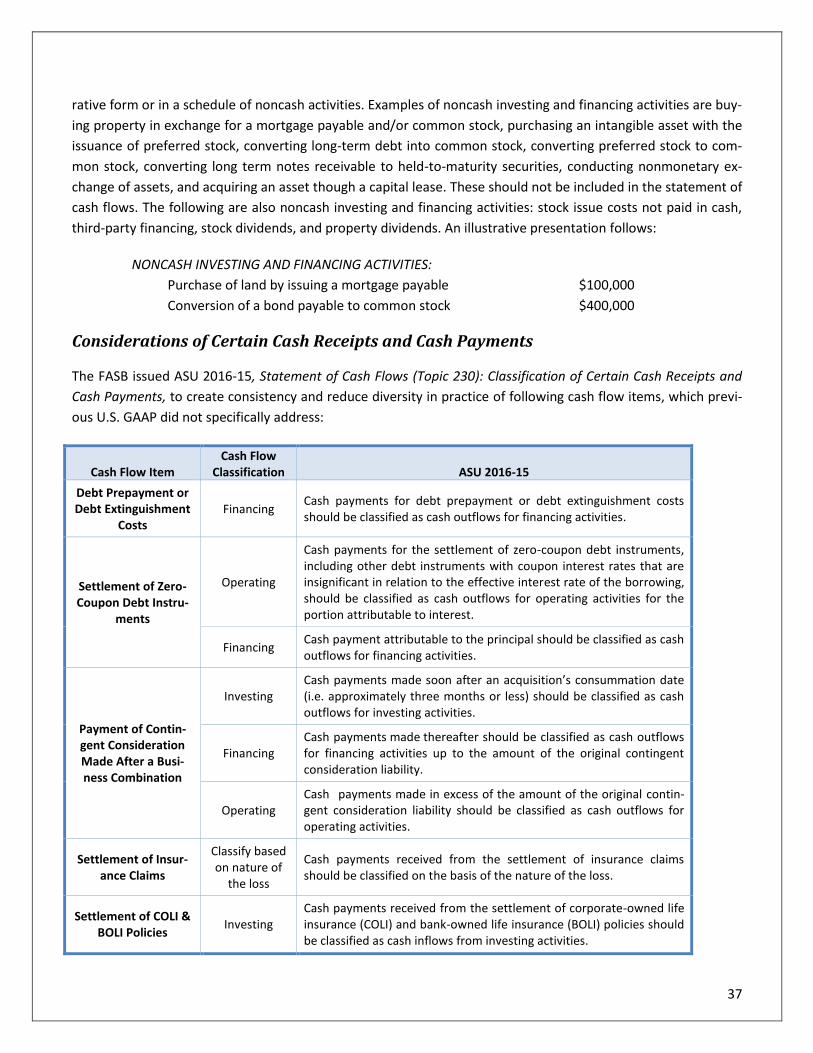
37
rative form or in a schedule of noncash activities. Examples of noncash investing and financing activities are buy-
ing property in exchange for a mortgage payable and/or common stock, purchasing an intangible asset with the
issuance of preferred stock, converting long-term debt into common stock, converting preferred stock to com-
mon stock, converting long term notes receivable to held-to-maturity securities, conducting nonmonetary ex-
change of assets, and acquiring an asset though a capital lease. These should not be included in the statement of
cash flows. The following are also noncash investing and financing activities: stock issue costs not paid in cash,
third-party financing, stock dividends, and property dividends. An illustrative presentation follows:
NONCASH INVESTING AND FINANCING ACTIVITIES:
Purchase of land by issuing a mortgage payable $100,000
Conversion of a bond payable to common stock $400,000
Considerations of Certain Cash Receipts and Cash Payments
The FASB issued ASU 2016-15, Statement of Cash Flows (Topic 230): Classification of Certain Cash Receipts and
Cash Payments, to create consistency and reduce diversity in practice of following cash flow items, which previ-
ous U.S. GAAP did not specifically address:
Cash Flow Item Cash Flow
Classification ASU 2016-15
Debt Prepayment or Debt Extinguishment
Costs Financing
Cash payments for debt prepayment or debt extinguishment costs should be classified as cash outflows for financing activities.
Settlement of Zero- Coupon Debt Instru-
ments
Operating
Cash payments for the settlement of zero-coupon debt instruments, including other debt instruments with coupon interest rates that are insignificant in relation to the effective interest rate of the borrowing, should be classified as cash outflows for operating activities for the portion attributable to interest.
Financing Cash payment attributable to the principal should be classified as cash outflows for financing activities.
Payment of Contin-gent Consideration Made After a Busi-ness Combination
Investing Cash payments made soon after an acquisition’s consummation date (i.e. approximately three months or less) should be classified as cash outflows for investing activities.
Financing Cash payments made thereafter should be classified as cash outflows for financing activities up to the amount of the original contingent consideration liability.
Operating Cash payments made in excess of the amount of the original contin-gent consideration liability should be classified as cash outflows for operating activities.
Settlement of Insur-ance Claims
Classify based on nature of
the loss
Cash payments received from the settlement of insurance claims should be classified on the basis of the nature of the loss.
Settlement of COLI & BOLI Policies
Investing Cash payments received from the settlement of corporate-owned life insurance (COLI) and bank-owned life insurance (BOLI) policies should be classified as cash inflows from investing activities.

38
Operating, Investing, or mix of both
Cash payments for premiums on COLI and BOLI policies may be classi-fied as cash outflows for investing, operating, or a combination of investing and operating activities.
Distributions from Equity Method Inves-
tees: Cumulative Earnings Approach
Operating Distributions received up to the amount of cumulative equity earnings would be considered a return on investment and classified in operat-ing activities.
Investing
Distributions as returns of investment (excess of cumulative distribu-tions, excluding prior distributions determined to be returns of in-vestment, over cumulative equity in earnings) are classified in invest-ing activities.
Distributions from Equity Method Inves-tees: Nature of Dis-tribution Approach
Operating Distributions as returns on investment (based on the nature of activity that generated the distributions) are classified in operating activities.
Investing Distributions as returns of investment (based on the nature of activity that generated the distributions) are classified in investing activities.
Beneficial Interests in Securitization Trans-
actions
Disclosed as Noncash
A transferor’s beneficial interest obtained in a securitization of finan-cial assets is disclosed as a noncash activity.
Investing Cash receipts from a transferor’s beneficial interests in securitized trade receivables is classified in investing activities.
Cash Receipts & Payments More Than
One Class of Cash Flows
Based on its Nature
When each source or use of cash is separately identifiable, entities should classify each based on its nature.
Application of the Predomi-nance Princi-
ple
When each source or use of cash is not separately identifiable, enti-ties should classify each based on its nature.
The amendments (ASU 2016-15) are effective for public business entities for fiscal years, and interim periods
within those fiscal years, beginning after December 15, 2017. For all other entities, the amendments in this Up-
date are effective for fiscal years beginning after December 15, 2018, and interim periods within fiscal years be-
ginning after December 15, 2019.
Accrual Basis of Accounting
Under U.S. GAAP, most companies use the accrual basis of accounting. This method requires that revenue be
recorded when earned and that expenses be recorded when incurred. Revenue may include credit sales that
have not yet been collected in cash and expenses incurred that may not have been paid in cash. Thus, under the
accrual basis of accounting, net income will generally not indicate the net cash flow from operating activities. To
arrive at net cash flow from operating activities, it is necessary to report revenues and expenses on a cash basis.
This is accomplished by eliminating those transactions that did not result in a corresponding increase or de-
crease in cash on hand.

39
Example 2-1
During 20X8, the Eastern Electric Supply Corporation earned $2,100,000 in credit sales, of which $100,000 re-
mained uncollected as of the end of the calendar year. Cash that was actually collected by the corporation in
20X8 can be calculated as follows:
Credit sales $2,100,000
Less: Credit sales uncollected at year end 100,000
Actual cash collected $2,000,000
A statement of cash flows focuses only on transactions involving the cash receipts and disbursements of a com-
pany. As previously stated, the statement of cash flows classifies cash receipts and cash payments into operat-
ing, investing, and financing activities.
Preparation of the Statement of Cash Flows
Cash flows related to operating activities may be determined and presented in one of two ways: the direct
method or the indirect method. The determination and presentation of investing and financing activities are
identical under the direct and indirect methods. The only difference between the direct method and the indirect
method is the presentation in the operating activities section of the statement of cash flows. Although the
presentation of operating cash flows differs between the two methods, both methods should theoretically result
in the same amount of net cash flows from operations.
We need the following financial information when preparing the cash flow statement:
1. Comparative Balance Sheets: These provide the required changes in assets, liabilities and equities from
the start of the period to the end of the period.
2. Current Income Statement: This is used to determine the amount of cash provided by the company’s
operations during the period.
3. Specific Transaction Data: The company must review additional information in order to determine how
it used cash or provided new cash during the period.
The three steps involved to create the statement of cash flows using the above data points are:
1. Determine the change in cash. Using the comparative balance sheets, the company calculates the dif-
ference between the beginning and the ending cash balances.
2. Determine the net cash flow derived from the operating activities. The company analyzes the current
year’s income statement as well as the comparative balance sheets and also transactional data from the
general ledger to derive necessary changes.
3. Determine the net cash flows from investing and financing activities. The company must review the
changes from the balance sheet accounts to calculate the effects on cash.

40
It is also important to identify all non-cash charges applied against revenue such as depreciation, and non-cash
income added to revenue such as profit from the sale of fixed assets. In comparison with two balance sheets
(the most recent vs. the prior period), the following rule with changes in asset, liabilities, and equity should be
applied:
Account Type Increase Decrease
Asset Use of Cash Source of Cash
Liability Source of Cash Use of Cash
Stockholders’ Equity Source of Cash Use of Cash
The general structure of the statement of cash flows (indirect method) is shown below:
Structure of the Statement of Cash Flows
Line Item Source
Cash Flows from Operating Activities
Net income (Loss) The income statement
Adjustment for non-cash items:
Depreciation/Amortization The income statement
Extraordinary gains/losses/write-offs The income statement
Changes in current assets and liabilities:
Accounts Receivable The balance sheet
Provision for losses on accounts re-ceivable
From the change in the allowance for doubtful accounts in the period
Accounts Payable The balance sheet
Inventory The balance sheet
Cash Flows from Investing Activities
Purchase of fixed assets The fixed asset accounts
Proceeds from sale of fixed assets The fixed asset accounts
Cash Flows from Financing Activities
Dividends Paid The retained earnings account
Sales of Common Stock The common stock and additional paid-in capital accounts
Cash from long-term debt The long-term debt account
Direct Method
The direct method shows that the amount of net cash received or used in operating activities during the year
equals the difference between the total amount of gross cash receipts and total gross cash payments applying to
operating activities. Examples of such items include:
• Cash collected from customers
• Interest and dividends received
• Cash paid to employees

41
• Cash paid to suppliers
• Interest paid
• Income taxes paid
The direct method converts each item on the income statement to a cash basis. For instance, assume that sales
are stated at $100,000 on an accrual basis. If accounts receivable increased by $5,000, cash collections from cus-
tomers would be $95,000, calculated as $100,000 - $5,000. The direct method also converts all remaining items
on the income statement to a cash basis. Three typical conversion formulas are:
1. Cash Received from Customers = Net sales + beginning accounts receivable − ending accounts receiva-
ble write-offs.
2. Cash Paid to Suppliers = Cost of sales + ending inventory + beginning accounts payable − beginning in-
ventory − ending accounts payable.
3. Cash Paid for Operating Expenses = Operating expenses + ending prepaid expenses + beginning accrued
expenses − beginning prepaid expenses - depreciation and amortization − ending accrued expenses
payable − bad debt expense.
Example 2-2
A company's cost of sales for the year 20X6 was $300,000. During the year, the inventory increased by $60,000
and accounts payable to suppliers decreased by $50,000. The amount paid to suppliers to be reported in the
statement of cash flows under the direct method is $410,000, computed as follows:
Cost of sales $300,000
Add: increase in inventory 60,000
Add: decrease in accounts payable 50,000
Cash paid to suppliers $410,000
If a company uses the direct method to present cash flow from operating activities, it must also provide, in a
separate schedule, the reconciliation of net income to net cash flow provided by operating activities. This recon-
ciliation represents the identical form and content of the indirect method. The reconciliation of net income to
net cash flows from operating activities, which removes the effects of both of the following:
• All deferrals of past operating cash receipts and payments, and all accruals of expected future operating
cash receipts and payments. For example, changes during the period in receivables and payables per-
taining to operating activities.
• All items included in net income that do not affect operating cash receipts and payments. For example,
all items for which cash effects are related to investing or financing activities (e.g., depreciation, amorti-
zation, and gains or losses on dispositions of long-lived assets).
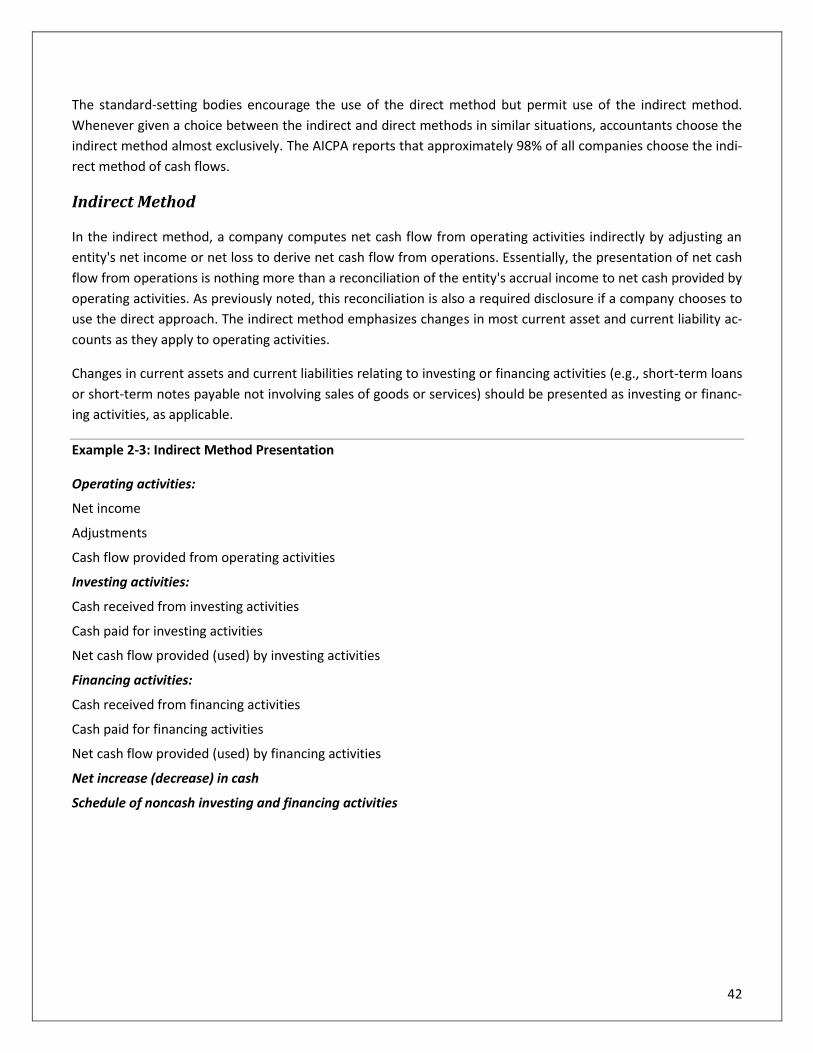
42
The standard-setting bodies encourage the use of the direct method but permit use of the indirect method.
Whenever given a choice between the indirect and direct methods in similar situations, accountants choose the
indirect method almost exclusively. The AICPA reports that approximately 98% of all companies choose the indi-
rect method of cash flows.
Indirect Method
In the indirect method, a company computes net cash flow from operating activities indirectly by adjusting an
entity's net income or net loss to derive net cash flow from operations. Essentially, the presentation of net cash
flow from operations is nothing more than a reconciliation of the entity's accrual income to net cash provided by
operating activities. As previously noted, this reconciliation is also a required disclosure if a company chooses to
use the direct approach. The indirect method emphasizes changes in most current asset and current liability ac-
counts as they apply to operating activities.
Changes in current assets and current liabilities relating to investing or financing activities (e.g., short-term loans
or short-term notes payable not involving sales of goods or services) should be presented as investing or financ-
ing activities, as applicable.
Example 2-3: Indirect Method Presentation
Operating activities:
Net income
Adjustments
Cash flow provided from operating activities
Investing activities:
Cash received from investing activities
Cash paid for investing activities
Net cash flow provided (used) by investing activities
Financing activities:
Cash received from financing activities
Cash paid for financing activities
Net cash flow provided (used) by financing activities
Net increase (decrease) in cash
Schedule of noncash investing and financing activities

43
Example 2-4: Preparation of the Statement of Cash Flows
Levine Company used the following data in the preparation of its 20X7 statement of cash flows:
January 1 December 31
Accounts receivable, net $11,100 $14,000
Prepaid rent expense 6,200 4,100
Accounts payable 9,700 11,200
Levine's net income is $75,000. In ascertaining the amount that Levine should include as net cash provided
by operating activities in the statement of cash flows, the following additions and subtractions must be
made when the indirect method is used:
Net income + decreases in current assets accounts (other than cash) - increases in current assets ac-
counts (other than cash) + increases in current liability accounts - decreases in current liability ac-
counts + noncash expenses (e.g., depreciation, bond discount amortization) - noncash revenues
(e.g., gain on sale of plant assets, bond premium amortization).
Computation
Net income $75,000
Add (subtract)
Increase in net accounts receivable
$14,000 − $11,100 (2,900)
Decrease in prepaid rent expense:
$6,200 − $4,100 2,100
Increase in accounts payable:
$11,200 − $9,700 1,500
Net cash provided by operating activities $75,700
Gross vs. Net Cash Flows
In the investing and financing sections of the statement, gross cash inflows should be shown separately from
gross cash outflows for similar items. Moreover, cash inflows and outflows ordinarily are not netted. They
should be reported separately at gross amounts. (Note: There are a few exceptions in which netting is permit-
ted, such as when the items involve fast turnover, are significant in amount, and have short maturities, such as
transactions involving long-term investments, loans, and debts having a maturity of three months or less.) For
example, in the investing section, the acquisition of a fixed asset would be a use of cash (say, $100,000), where-
as the sale of a fixed asset (say, $60,000) would be a source of cash. Separate presentation of both the cash in-
flow and cash outflow aids reader comprehension and realism of the financial statements. The netting of the
two (net cash outflow of $40,000) distorts what is really happening. In the financing section, the issuance of
long-term debt (say, $80,000) would be a source of cash, but paying back the debt principal (say, $50,000) would

44
be an application of cash. Both the cash inflows and cash outflows must be presented separately. A company is
not allowed to present the net effect as a net source of cash of $30,000.
Example 2-5
Carol Company reported net income of $150,000 for 20X2. The following changes occurred in several of
the company's balance sheet accounts:
Equipment $12,500 increase
Accumulated depreciation $20,000 increase
Note payable $15,000 increase
In addition, three pertinent activities took place:
1. Depreciation expense for the year was $26,000.
2. In December 20X2, Carol purchased equipment costing $25,000, with $10,000 down and the is-
suance of a 12% note payable of $15,000.
3. During 20X2, Carol sold equipment costing $12,500, with accumulated depreciation of $6,000
for a gain of $2,500.
What is the net cash used in investing activities that should be reported by Carol?
In general, the cash flows from investing activities of an enterprise include transactions involving long-
term assets and include the acquisition and disposal of investments and long-lived assets and the ex-
tension and collection of loans. Therefore, in Carol Company's 20X2 statement of cash flows, the net
cash used in investing activities should be computed in the following way:
Sale of equipment (cash inflow)
($12,500 − $6,000 + $2,500) $9,000
Acquisition of equipment (cash outflow) (10,000)
Net cash used in investing activities, 20X2 $(1,000)
In Carol's 20X2 statement of cash flows, net cash flow provided by operating activities would be computed
as follows:
Net income $150,000
Add (subtract):
Depreciation expense 26,000
Gain on sale of equipment (2,500)
Net cash provided by operating activities $173,500

45
IFRS Differences Affecting the Statement of Cash Flows
Both IFRS and U.S. GAAP require that the statement of cash flows should have three major sections—operating,
investing, and financing—along with changes in cash and cash equivalents. One area where there can be sub-
stantive differences between IFRS and U.S. GAAP relates to the classification of interest, dividends, and taxes.
The following table indicates the differences between the two approaches.
Item IFRS U.S. GAAP
Interest paid Operating or financing Operating
Dividends paid Operating or financing Financing
Interest and dividends received Operating or investing Operating
Taxes paid Operating—unless specific identification
with financing or investing
Operating
Notes to Financial Statements
Accounting numbers do not always tell the entire story. For a variety of reasons these three financial statements
reported in an annual report tend to be inadequate to fully convey the results of operations and the financial
position of the firm.
The annual report often contains this statement: “The accompanying footnotes are an integral part of the financial
statements." This is because the financial statements themselves are concise and condensed. Hence, any
explanatory information that cannot be readily abbreviated is provided for in greater detail in the footnotes.
Footnotes provide detailed information regarding financial statement figures, accounting policies, explanatory data
such as mergers and stock options, and furnish any additional necessary disclosure. Examples of footnote
disclosures, as required by U.S. GAAP, are accounting methods and estimates such as inventory pricing, pension
fund and profit-sharing arrangements, terms of characteristics of long-term debt, particulars of lease agreements,
contingencies, and tax matters.
The footnotes appear at the end of the financial statements and explain the figures in those statements. Footnote
information may be in both quantitative and qualitative terms. An example of quantitative information is the fair
market value of pension plan assets. An example of a qualitative disclosure is a lawsuit against the company. It is
essential that the reader carefully evaluate footnote information to derive an informed opinion about the
company's financial health and operating performance.

46
Chapter 2 - Section 2 Review Questions
3. How can a statement of cash flows help users of financial statements?
A. It helps them evaluate a firm’s liquidity, solvency, and financial flexibility.
B. It helps them evaluate a firm’s economic resources and obligations.
C. It helps them determine a firm’s components of income from operations.
D. It helps them determine whether insiders have sold or purchased the firm’s stock.
4. In a statement of cash flows, which of the following would increase reported cash flows from operating ac-
tivities?
A. Dividends income received from investments
B. Gain on sale of equipment
C. Gain on early retirement of bonds
D. Change from straight-line to accelerated depreciation
5. During the year, Beck Co. purchased equipment for cash of $47,000, and sold equipment with a $10,000 car-
rying value for a gain of $5,000. How should these transactions be reported in Beck's statement of cash
flows?
A. Cash outflow of $32,000
B. Cash outflow of $42,000
C. Cash inflow of $5,000 and cash outflow of $47,000
D. Cash inflow of $15,000 and cash outflow of $47,000
6. Ocean Company follows IFRS for its external financial reporting. Which of the following methods of report-
ing are acceptable under IFRS for the items shown?
A. Interest Received in Operating Activities, and Dividends Received in Investing Activities
B. Interest Received in Investing Activities, and Dividends Received in Financing Activities
C. Interest Received in Financing Activities, and Dividends Received in Investing Activities
D. Interest Received in Operating Activities, and Dividends Paid in Investing Activities
7. What is the purpose of information presented in notes to the financial statements?
A. To provide disclosures required by generally accepted accounting principles
B. To correct improper presentation in the financial statements
C. To provide recognition of amounts not included in the totals of the financial statements
D. To present management's responses to auditor comments
47
Chapter 3: Principles of Financial Reporting
Learning Objectives:
After completing this section, you will be able to:
• Identify the key concepts in lease accounting and revenue recognition
• Recognize when financial statement consolidation is appropriate
• Recognize the impact of fixed assets on financial statements
• Indicate different inventory costing methods including FIFO, LIFO, and weighted average approach
• Compute earnings per share in simple and complex capital structures
• Recognize the different types of accounting changes/errors and proper treatments
The Role of the CFO
Organizations report information based on the principles of financial accounting. Appropriate statement
presentation is key to achieving the objectives of financial reporting. Moreover, CFOs who have a proper level of
knowledge of financial accounting can utilize this information to make decisions based on the company’s
perceived financial health and outlook. Such decisions might include lending and borrowing money, granting
credit, and buying or selling ownership shares. The more in-depth the understanding is of those principles, the
more likely the CFOs will be able to use the available information to arrive at the best possible choices. Finally,
one of the most fundamental roles is to ensure compliance with financial reporting. In other words, it is not
enough for CFOs to just report the financial results; it is critical for CFOs to know how the organization arrived at
those results and to provide insights from those results.
This chapter provides CFOs with a rich understanding of the rules and nuances of financial accounting to help
them effectively execute their core financial reporting responsibilities. It explains areas such as revenue
recognition, and lease accounting, where external auditors will have a heightened focus. It also addresses areas
such as fixed assets and inventory, which are sometimes susceptible to error. It helps CFOs recognize when
financial statement consolidation is appropriate as well. Moreover, this chapter highlights key provisions for the
computation, presentation, and disclosure of earnings per share (EPS). Finally, the different types of accounting
changes and errors and their proper treatments are discussed.

48
Financial Accounting vs. Management Accounting
Financial accounting is mainly concerned with reporting the historical data to provide financial information to
outside parties, such as investors, creditors, and governments. To protect those outside parties from being
misled, financial accounting is governed by generally accepted accounting principles (GAAP). Financial
accounting encompasses the rules and procedures to convey financial information about an organization.
However, financial accounting does not address issues of an internal nature, such as decisions on whether to
buy or lease equipment or the level of production. Information to guide such internal decisions is generated
based on managerial accounting rules that are introduced in Part V Providing Strategic Finance Support and
Analysis.
Management accounting is primarily concerned with providing information to internal managers who are
charged with planning and controlling the operations of the firm. It is used to make a variety of management
decisions. As defined by the Institute of Management Accountants (IMA), management accounting is the pro-
cess of identification, measurement, accumulation, analysis, preparation, interpretation, and communication of
financial information, which is used by management to plan, evaluate, control, and make decisions within an
organization. It ensures the appropriate use of and accountability for an organization's resources. Due to its in-
ternal use within a company, management accounting is not subject to U.S. GAAP. As defined by FASB, U.S.
GAAP contains the conventions, rules, and procedures necessary to define accounting practice for external re-
porting at a particular time.
The differences between financial accounting and management accounting are summarized below:
Financial Accounting Management Accounting
1. External users of financial information 1. Internal users of financial information
2. Must comply with U.S. GAAP 2. Need not comply with U.S. GAAP
3. Must generate accurate and timely data 3. Emphasizes relevance and flexibility of data
4. Past orientation 4. Future orientation
5. Financial information 5. Non-financial (e.g., speed of delivery, customer
complaints) as well as financial information
6. Looks at the business as a whole 6. Focuses on parts as well as on the whole of a
business
7. Summary reports 7. Detailed reports by products, departments, or other
segments
8. Primarily stands by itself 8. Draws heavily from other disciplines such as finance,
economics, information systems, marketing,
operations/production management, and
quantitative methods

49
Cost Accounting vs. Management Accounting
The difference between cost accounting and management accounting is a subtle one. The Institute of Management
Accountants (IMA) defines cost accounting as “a systematic set of procedures for recording and reporting meas-
urements of the cost of manufacturing goods and performing services in the aggregate and in detail. It includes
methods for recognizing, classifying, allocating, aggregating and reporting such costs and comparing them with
standard costs.” The major function of cost accounting is cost accumulation for inventory valuation and income
determination. Management accounting, however, emphasizes the use of the financial and cost data for plan-
ning, control, decision making, and strategic management purposes. Management accounting involves partnering
in decision making and devising planning and performance management systems. It is the accounting used for the
planning, control, decision-making, and strategic management activities of an organization.
Key Financial Accounting Areas
Revenue Recognition
Revenue recognition is one of the most basic issues: when to recognize revenue, at what amount and the de-
gree of provision for future reversals. It represents the area at highest risk of material error on financial state-
ments and is one of the leading causes of restatements. Therefore, revenue recognition is an accounting topic
often scrutinized by investors and regulators because many corporate failures have originated from this issue.
Examples of common cut-off risks associated with revenue include:
• Goods are invoiced before or in the absence of actual shipment
• Purchase orders are recorded as completed sales
• Sales billed to customers before the transfer of goods or services
The new revenue guidance (ASC 606) outlines the principles that an organization must apply to report useful
information about the amount, timing, and uncertainty of revenue and cash flows arising from its contracts to
provide goods or services to customers. Organizations are required to recognize revenue at an amount that re-
flects the consideration to which the entity expects to be entitled in exchange for transferring goods or services
to a customer. The core principle is supported by the following five steps:
Identify the Contract
Identify the Performance Obligations
Determine Transaction
Price
Allocate Transaction
Price
Recognize Revenue
Step 1 Step 2 Step 3 Step 4 Step 5
The Revenue Recognition Model
How much revenue can be recognized? When can revenue be recognized?

50
Attributes of a Contract
Step 1 requires an entity to identify the contract with the customer. The contract is a central aspect of revenue
recognition. In order to apply the model, an entity must first identify the contract, or contracts, to provide
goods and services to customers. Contracts can be written, oral, or implied by an entity’s customary business
practices as long as they create enforceable rights and obligations between two or more parties. Specifically, a
contract only exists if all of the following conditions are present:
1. Approval and commitment of the parties
2. An agreement with enforceable rights
3. Identification of the payment terms
4. The presence of commercial substance
5. The probability of collectibility
Contracts entered into at or near the same time with the same customer are combined and treated as a single
contract when certain criteria are met.
If the criteria are not met, the contract does not exist for purposes of applying the revenue standard. Thus, any
consideration received from the customer is generally recognized as liability. An entity must continue to reas-
sess the criteria to determine whether they are subsequently met.
Essence of a Performance Obligation
Step 2 requires an entity to identify the performance obligation in the contract. A performance obligation is a
promise in a contract with a customer to transfer a good or service to the customer. An entity assesses the
goods or services promised in a contract and then identifies each promised good or service as a performance
obligation if either a:
• Good or service (or a bundle of goods or services) is distinct, or
• Series of distinct goods or services that are substantially the same and have the same pattern of transfer
to the customer
A good or service is distinct if both of the following criteria are met:
1. The customer can benefit from the good or service either on its own or together with other resources
that are readily available to the customer.
2. The promise to transfer the good or service is separately identifiable from other promises in the con-
tract.
A good or service that is not distinct should be combined with other promised goods or services until the entity
identifies a bundle of goods or services that is distinct.
Determination of the Transaction Price
Step 3 requires an entity to determine the transaction price for the contract. The transaction price in a contract
reflects the amount of consideration (for example, payment) to which an entity expects to be entitled in ex-

51
change for transferring promised goods or services to a customer. However, the transaction price excludes
amounts collected on behalf of third parties (such as sales tax). To determine the transaction price, an entity
should consider the following effects:
1. Variable consideration
2. Constraint on variable consideration
3. Significant financing components
4. Noncash consideration
5. Consideration payable to a customer
When the transaction price includes a variable amount, an entity should estimate an amount of variable consid-
eration by using either the expected value approach or the most likely amount approach, whichever is more
predictive of the amount. The method used should be applied consistently throughout the contract. To deter-
mine the transaction price, an entity should also adjust the promised amount of consideration for the effects of
the time value of money if the contract contains significant financing component.
Any noncash consideration received from a customer needs to be included when determining the transaction
price. Noncash consideration is measured at fair value. If the entity cannot reasonably estimate the fair value of
the noncash consideration, then it refers to the estimated selling price of the promised goods or services.
An entity may pay or expect to pay consideration to a customer or to other parties that purchase the entity’s
goods or services from the customer. This could be in the form of a discount or refund on goods or services pro-
vided by the seller. To determine the appropriate accounting treatment, an entity must first determine whether
the consideration paid or payable to a customer is a payment for a distinct good or service, a reduction of the
transaction price or a combination of both
Allocation of the Transaction Price
Step 4 requires an entity to allocate the transaction price (determined in steps 2 and 3) to the performance obli-
gations by using the following approaches:
1. Determining standalone selling price
2. Allocating the transaction price to the performance obligations on the basis of the standalone selling
price
3. Allocating a discount and variable consideration to one or more, but not all, of the performance obliga-
tions in the contract (if specified criteria are met)
4. Allocating changes in the transaction price to the performance obligations in the contract
The transaction price is allocated to each performance in an amount that depicts the amount of consideration to
which the entity expects to be entitled in exchange for satisfying each separate performance obligation. There-
fore, to allocate an appropriate amount of consideration to each performance obligation, an entity must first
determine the standalone selling price at contract inception of the distinct goods or services underlying each
performance obligation.

52
In general, an entity allocates the transaction price to each performance obligation in proportion to its
standalone selling price. However, if certain conditions are met, there are limited exceptions to this general allo-
cation requirement. For example, a discount or variable consideration must be allocated to one or more, but not
all, of the distinct goods or services or performance obligations in a contract when those conditions are met.
Changes in the transactions price after contract inception should be allocated to all performance obligations in
the contract on the same basis. Amounts allocated to a satisfied performance obligation should be recognized as
revenue, or as a reduction of revenue, in the period in which the transaction price changes. The entity must fol-
low the contract modification guidance in ASC 606, if a change in the transaction price resulting in a contract
modification.
Recognition of Revenue
Step 5 requires an entity to recognize revenue by considering the following key factors:
1. Transfer of control
2. Performance obligations satisfied over time or at a point in time
3. Measures of progress in satisfying performance obligations over time
Transfer of Control
Revenue is recognized when or as performance obligations are satisfied by transferring control of a promised
good or service to a customer. Control refers to the customer’s ability to direct the use of, and obtain substan-
tially all of the remaining benefits from, an asset. It also includes the ability to prevent other entities from di-
recting the use of, and obtaining the benefits from, an asset. Control either transfers over time or at a point in
time, which affects when revenue is recorded.
Satisfaction of Performance Obligation
An entity transfers control of a good or service over time and satisfies a performance obligation and recognizes
revenue over time if one of the following criteria is met:
• The customer simultaneously receives and consumes the benefits provided by the entity’s performance
as the entity performs.
• The entity’s performance creates or enhances an asset that the customer controls as the asset is created
or enhanced.
• The entity’s performance does not create an asset with an alternative use to the entity and the entity
has an enforceable right to payment for performance completed to date.
If none of the criteria for satisfying a performance obligation over time are met, a performance obligation is sat-
isfied at a point in time. The entity should consider the following indicators in evaluating the point at which con-
trol of an asset has been transferred to a customer:
1. The entity has a present right to payment for the asset.
2. The customer has legal title to the asset.

53
3. The entity has transferred physical possession of the asset.
4. The customer has the significant risks and rewards of ownership of the asset.
5. The customer has accepted the asset.
Measures of Progress
For each performance obligation satisfied over time, an entity should recognize revenue over time by measuring
the progress toward complete satisfaction of that performance obligation. Methods for measuring progress in-
clude:
• Output methods: Recognize revenue based on direct measurements of the value transferred to the cus-
tomer
• Input methods: Recognize revenue on the basis of the entity’s efforts or inputs to the satisfaction of a
performance obligation
Leases
Definition of a Lease
The new lease standard (ASC 842) defines a lease as a contract, or part of a contract, that conveys the right to
control the use of identified property, plant, or equipment (an identified asset) for a period of time in exchange
for consideration. A period of time may be described in terms of the amount of use of an identified asset. Con-
trol over the use of the identified asset means that the customer has the right to BOTH:
1. Obtain substantially all of the economic benefits from the use of the asset, and
2. Direct the use of the asset
Both criteria must be met to qualify for lease accounting. Significant judgments are required to determine
whether the customer has the right to direct the use of the asset.
The following flowchart is included in ASC 842’s implementation guidance and depicts the decision- making pro-
cess for determining whether an arrangement is or contains a lease.
Lessor:
Transfer the control of the use of an identified
asset
Lessee:
Give consideration for the use of an identified
asset
Lease
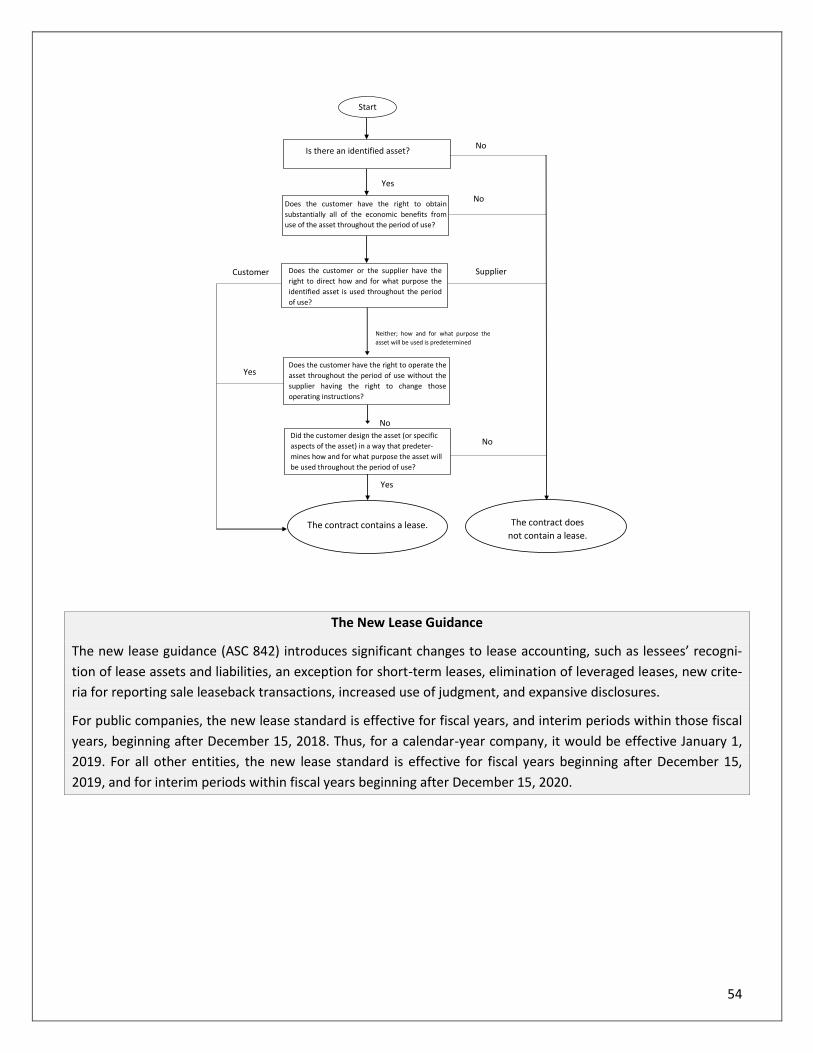
54
The New Lease Guidance
The new lease guidance (ASC 842) introduces significant changes to lease accounting, such as lessees’ recogni-
tion of lease assets and liabilities, an exception for short-term leases, elimination of leveraged leases, new crite-
ria for reporting sale leaseback transactions, increased use of judgment, and expansive disclosures.
For public companies, the new lease standard is effective for fiscal years, and interim periods within those fiscal
years, beginning after December 15, 2018. Thus, for a calendar-year company, it would be effective January 1,
2019. For all other entities, the new lease standard is effective for fiscal years beginning after December 15,
2019, and for interim periods within fiscal years beginning after December 15, 2020.
Start
Is there an identified asset? No
No
Yes
Yes Does the customer have the right to obtain
substantially all of the economic benefits from
use of the asset throughout the period of use? throughout the period of use?
Does the customer or the supplier have the
right to direct how and for what purpose the
identified asset is used throughout the period
of use?
Does the customer have the right to operate the asset
Does the customer have the right to operate the
asset throughout the period of use without the
supplier having the right to change those
operating instructions?
Did the customer design the asset (or specific aspects of the asset) in a way that predetermines how and for
Did the customer design the asset (or specific
aspects of the asset) in a way that predeter-
mines how and for what purpose the asset will
be used throughout the period of use? period of use?
No
Yes Supplier Customer
Neither; how and for what purpose the asset will be used
Neither; how and for what purpose the
asset will be used is predetermined
No
The contract contains a lease. The contract does not contain a
The contract does
not contain a lease.
Yes

55
Lease Classification
In general, lessees are required to classify leases as either finance lease or operating lease. Lessors classify leases
as one of three types of leases: sales-type, direct financing or operating lease.
ASC 842 does not change the existing lease classifications used by lessors. However, it does change how a lessor
determines the appropriate lease classification for each lease. The changes aim to primarily align with ASC 606,
as leasing is fundamentally a revenue-generating activity for lessors. For example, the lease classification analy-
sis is modified to focus on whether the lease contract transfers control of the underlying asset to the lessee;
control being one of the principles underlying ASC 606. In determining whether control has transferred to the
lessee, the lessor uses the same lease criteria used by a lessee, discussed below.
A lessee should classify a lease as a finance lease and a lessor should classify a lease as a sales-type lease when
the lease meets any of the following criteria at lease commencement:
1. The lease transfers ownership of the underlying asset to the lessee by the end of the lease term.
2. The lease grants the lessee an option to purchase the underlying asset that the lessee is reasonably cer-
tain to exercise. The FASB determined that “reasonably certain” is a high threshold, such as probability
exceeding 75-80%.
3. The lease term is for the major part of the remaining economic life of the underlying asset (usually 75%).
However, if the commencement date falls at or near the end of the economic life of the underlying as-
set, this criterion should not be used for purposes of classifying the lease.
4. The present value of the sum of the lease payments and any residual value guaranteed by the lessee
that is not already reflected in the lease payments. An organization may use a threshold of 90% or more
when determining what constitutes substantially all of the fair value of the underlying asset.
5. The underlying asset is of such a specialized nature that it is expected to have no alternative use to the
lessor at the end of the lease term.
When none of the criteria listed above are met:
• A lessee should classify the lease as an operating lease.
Lessees
•Finance
•Operating
Lessors
•Sales-type
•Direct financing
•Operating
Transfer of ownership test
Lessee purchase
option test Lease term test
Present value test
Alternative use test

56
• A lessor should classify the lease as either a direct financing lease or an operating lease. A lessor classi-
fies the lease as an operating lease unless both of the following criteria are met, in which case the lessor
should classify the lease as a direct financing lease:
1. The present value of the sum of the lease payments and any residual value guaranteed by the lessee
that is not already reflected in the lease payments and/or any other third party unrelated to the les-
sor equals or exceeds substantially (90%) all of the fair value of the underlying asset.
2. It is probable that the lessor will collect the lease payments plus any amount necessary to satisfy a
residual value guarantee.
Short-term Lease Exception for Lessees
A short-term lease refers to a lease that, at the commencement date, has a lease term of 12 months or less and
does not include an option to purchase the underlying asset. A lessee may elect NOT to apply the recognition
requirements of ASC 842 to short-term leases. This election should be made by class of underlying asset. If a les-
see chooses to elect this short-term lease exception, it needs to recognize the lease payments in net income on
a straight-line basis over the lease term. Variable lease payments are recorded in the period in which the obliga-
tion for the payment is incurred.
Lessee Accounting
Under ASC 842, both financing leases and operating leases create an asset (right-of-use) and a liability, initially
measured at the present value of the lease payments. For leases whose term is 12 months or less, however, les-
sees may make an accounting policy election by class of underlying asset not to recognize lease assets and lease
liabilities. If a lessee makes this election, it should recognize lease expense for such leases generally on a
straight-line basis over the lease term.
For finance leases, a lessee is required to:
1. Recognize a right-of-use asset and a lease liability, initially measured at the present value of the lease
payments, in the balance sheet.
2. Recognize interest on the lease liability separately from amortization of the right-of-use asset in the in-
come statement.
3. Classify repayments of the principal portion of the lease liability within financing activities and payments
of interest on the lease liability and variable lease payments within operating activities in the statement
of cash flows.
For operating leases, a lessee is required to:
1. Recognize a right-of-use asset and a lease liability, initially measured at the present value of the lease
payments, in the balance sheet.
2. Recognize a single lease cost, calculated so that the cost of the lease is allocated over the lease term on
a generally straight-line basis.

57
3. Classify all cash payments within operating activities in the statement of cash flows.
In summary, for finance leases, lessees recognize interest expense (from the lease liability) and amortization ex-
pense (from the right-of-use asset) separately in the income statement. In contrast, for operating leases, lessees
recognize a single lease expense figure in the income statement. The following table summarizes the accounting
by lessees for the different types of leases.
Financial Statement Impact Snapshot for Lessee
Lessee Balance Sheet Income Statement Cash Flow Statement
Finance Right-of-Use Asset
Lease Liability
Front Loaded:
• Amortization Expense
(right-of-use asset)
• Interest Expense (lease
liability)
Interest expense: Operating
activities
Principal payment: Financing
activities
Operating Right-of-Use Asset
Lease Liability Lease Expense
Lease expense: Operating
activities
Lessor Accounting
The lessor accounting is largely unchanged from ASC 840. For example, key concepts and definitions, such as
lease receivable, net investment, unguaranteed residual asset, lease payments, and discount rate for the lease,
are mostly consistent with ASC 840. The vast majority of operating leases remain classified as operating leases,
and lessors should continue to recognize lease income for those leases on a generally straight-line basis over the
lease term. Leveraged lease accounting has been eliminated, although grandfathered for existing arrangements.
The following table lists some of the key concepts underlying the lessor accounting model:
Key Concept ASC 842 Definition
Commence
date
The date on which a lessor makes an underlying asset available for use by a
lessee
Lease payment Undiscounted fixed (including in-substance fixed) payments + Optional
payments that are reasonably certain to be paid
Lease receiva-
ble
Present value of the lease payments + Present value of guaranteed portion
of estimated residual value
Lease term
The noncancellable period for which a lessee has the right to use an under-
lying asset:
+ Periods covered by an option to extend the lease if the lessee is reasona-
bly certain to exercise that option
+ Periods covered by an option to terminate the lease if the lessee is rea-
sonably certain not to exercise that option
+ Periods covered by an option to extend (or not terminate) the lease in
which exercise of the option is controlled by the lessor
Net investment Lease receivable + Unguaranteed residual asset

58
For lessors, all leases not classified as sales-type leases or direct financing leases are classified as operating leas-
es. At lease commencement, a lessor recognizes any selling profit and initial direct costs as follows:
Type of Lease Selling Profit Selling Loss Initial Direct Costs
Sales-Type
Lease
Recognize at lease
commencement
Recognize at lease
commencement
If the fair value of the underlying asset does
not equal its carrying amount:
• Expense at lease commencement
• Exclude from determination of the rate
implicit in the lease
If the fair value of the underlying asset equals
its carrying amount:
• Defer and include in the net investment
in the lease
• Include in determination of the rate im-
plicit in the lease
Direct Financ-
ing Lease
Defer as a reduction
of the net investment
in the lease
Recognize at lease
commencement
• Defer and include in the net investment
in the lease
• Include in determination of the rate im-
plicit in the lease
In summary, ASC 842 keeps existing lessor accounting largely intact. It maintains the current lease classifica-
tions; operating leases, direct-finance leases and sales-type leases, and generally how each lease type is ac-
counted for. The following table summarizes the accounting by lessors for the different types of leases.
Financial Statement Impact Snapshot for Lessor
Lessor Balance Sheet Income Statement Cash Flow Statement
Sales/Direct
Finance
• Lease Receivable
• Unguaranteed Resid-
ual
• Deferred Profit
Front Loaded:
• Interest Income on Re-
ceivable and Residual
• Profit
All lease cash flows:
Operating activities
Operating Underlying Asset Remains Lease Income
Consolidation
Combined Financial Statements vs. Consolidated Financial Statements
Combined financial statements present the financial status and operating results of legally separate entities,
related by common ownership, as if they were a single entity. Combined financial statements are prepared in a
similar manner as consolidated statements. In other words, intercompany transactions and profits are eliminat-
ed. The calculation of combined net income is similar to the calculation for consolidated net income. Thus, com-
bined net income should be recorded at the total of the net income reported by the combined entities and ad-

59
justed for any profits or losses from transactions between the combined entities. Examples of when combined
statements should be prepared are when one stockholder owns a controlling interest in several related operat-
ing companies (brother-sister corporation), companies that are under common management, and subsidiaries
that are not consolidated when control does not exist. Combined statements are more meaningful than sepa-
rate statements.
Consolidated financial statements present the financial position, operating results, and cash flows of the single
economic entity comprised of a parent and one or more subsidiaries or variable interest entities that they con-
trol. Consolidated financial statements are believed to be more useful to users of financial information than the
financial statements of individual companies that are related by ownership. Consolidated financial reporting is
required when one entity owns, directly or indirectly, more than 50% of the outstanding voting interests of an-
other entity. However, a majority-owned subsidiary is not consolidated if control does not rest with the majority
owner.
The major difference between combined and consolidated financial statements is that in the former, none of
the combining companies has an ownership interest in any of the other combining companies. The equity ac-
counts of the combining companies are added. The equity section of the combined balance sheet incorporates
the paid-in-capital accounts of the combining entities. However, there is only a single combined retained earn-
ings account. Combined statements are unlike consolidation, in which the equity accounts are eliminated in a
consolidation worksheet against the investment in subsidiaries held by the parent company.
Exceptions to Consolidation of Majority Owned Subsidiaries
The usual condition for consolidation is ownership of a controlling financial interest, which is generally evi-
denced by direct ownership of greater than 50% of the outstanding voting shares of another company. Howev-
er, over the years many companies excluded from consolidation certain “nonhomogeneous” subsidiary opera-
tions that were different in character than the parent. Consolidation is required even where the business activi-
ties of the parent and subsidiary significantly differ. However, the FASB in that statement did not address the
practice of not consolidating subsidiaries, where control is likely to be temporary, for instance, when a subsidi-
ary is in a legal reorganization under bankruptcy laws. Therefore, not consolidating subsidiaries where control is
considered to be temporary continues to be acceptable.
Additionally, if a subsidiary operates under foreign exchange restrictions that are so severe that they hamper
the ability of the parent to control the timing of subsidiary dividends, then consolidation is not appropriate. If
one of these exceptions to consolidations applies, the parent should account for its investment in its unconsoli-
dated subsidiary by the equity method.
Critical Consolidation Principle
A critical consolidation principle is that intercompany transactions between a parent and its consolidated subsid-
iaries must be eliminated in consolidation. The reason is that such transactions are not considered “arm’s
length” or subject to independent pricing because they take place within the same economic entity. The result is
that intercompany loans and borrowings, as well as dividends and intercompany sales, purchases, and unreal-
ized gains on inventory transfers between parent and subsidiary must be eliminated.

60
Intercompany eliminations include those for intercompany payables and receivables, advances, investments,
and profits. The existence of a noncontrolling (minority) interest in a subsidiary does not affect the amount of
intercompany profit to be eliminated. That is, the entire intercompany profit should be eliminated, not just the
portion related to the controlling interest. Intercompany sales and purchases require elimination because reve-
nue and expenses are not realized for consolidated purposes until the inventory is sold to outsiders. The elimi-
nation of intercompany profits will result in inventory being valued at cost on the consolidated balance sheet.
Intercompany profits in ending inventory are eliminated by crediting inventory and debiting cost of sales or re-
tained earnings (if books are closed). Further, cost of sales and beginning retained earnings must be adjusted for
intercompany profit in beginning inventory resulting from intercompany transactions in the prior year. Unless
intercompany profits in inventories are eliminated, consolidated net income and ending inventory will be mis-
stated.
Example 3-1
Intercompany Sale of Inventory
Page Company purchased inventory from its wholly owned subsidiary, Sage Company, during year ended
December 31, 20X3, as follows:
Selling Price Cost Gross Profit
Beginning inventory 400,000 320,000 80,000
Purchases 700,000 560,000 140,000
Ending inventory 300,000 240,000 60,000
Cost of goods sold 800,000 640,000 160,000
The worksheet entry to eliminate intercompany profits is as follows:
Dr. Retained earnings—Page 80,000
Dr. Intercompany sales—Page 700,000
Cr. Intercompany cost of goods sold—Page 560,000
Cr. Cost of goods sold—Page 160,000
Cr. Inventories—Sage 60,000
All intercompany receivables, payables, notes, and advances are eliminated for the purposes of consolidation.
An illustrative entry is:
Dr. Accounts (notes) payable xx
Cr. Accounts (notes) receivable xx
61
If the balance sheet includes discounted receivables from another affiliate, it must be eliminated by debiting
discounted receivables and crediting receivables. As to notes receivable, where the holder of an intercompany
note has discounted the instrument with an outsider, the contingent liability for notes receivable discounted is
considered a primary liability.
When an intercompany sale/purchase of a fixed asset occurs, such assets remain within the consolidated group.
Intercompany profits on the sale and/or acquisition of fixed assets between affiliates are eliminated in consoli-
dation so as to reflect the carrying value of the fixed assets at cost to the consolidated group. A similar adjust-
ment for intercompany profit is made for depreciable and non-depreciable long-lived assets. An adjustment
must also be made for any depreciation recorded on the intercompany profit so that depreciation is adjusted
based on cost of the asset to the consolidated entity. Illustrative entries follow:
In the year a fixed asset is sold at a gain, the worksheet elimination entry is:
Dr. Accumulated depreciation
Dr. Gain on sale
Cr. Fixed asset
Cr. Depreciation expense
In the years after sale, the elimination entry would be:
Dr. Retained earnings (beginning)
Dr. Accumulated depreciation
Cr. Fixed asset
Cr. Depreciation expense
This elimination is cumulative until the asset is fully depreciated.

62
Example 3-2
Intercompany Sale of Equipment
A parent company had equipment (original purchase price $60,000, accumulated depreciation of $30,000)
with a five-year remaining life. The parent sold the equipment to its subsidiary for $40,000. The parent's
journal entry for the sale was:
Dr. Cash 40,000
Dr. Accumulated depreciation 30,000
Cr. Equipment 60,000
Cr. Gain on sale of equipment 10,000
The subsidiary recorded its purchase as:
Dr. Equipment 40,000
Cr. Cash 40,000
The subsidiary will record depreciation expense each year at $8,000 ($40,000/5 years).
The gain on sale of $10,000 must be eliminated along with the difference in depreciation of $2,000
($8,000 - $6,000). The $6,000 in depreciation is based on a $30,000 carrying value.
The elimination entry is:
Dr. Gain on sale of equipment 10,000
Dr. Accumulated depreciation 2,000
Cr. Depreciation expense 2,000
Cr. Equipment 10,000
The depreciation adjustment will be required at each year-end over the life of the asset.
In subsequent years, the debit to gain on sale instead will be to retained earnings for an amount that is reduced
by the accumulated excess amortization.

63
Chapter 3 Section 1 Review Questions
1. Which of the following conditions is NOT required for a contract to exist?
A. Each party’s rights can be identified.
B. The payment terms can be identified.
C. The contract is approved in writing.
D. The collection of the consideration is probable.
2. Johnson Inc. (Lessee) obtains control of the leased equipment with a lease term and 75% of the remaining
economic life of the equipment. How does Johnson Inc. account for this agreement in accordance with ASC
842?
A. Finance lease
B. Operating lease
C. Leveraged lease
D. Sublease
3. Combined statements may be used to present the results of operations by which of the following entities?
A. In commonly controlled entities, but not in entities under common management
B. In entities under common management, but not in commonly controlled entities
C. In neither the entities under common management, nor commonly controlled entities
D. In both entities under common management and commonly controlled entities
4. Perez, Inc. owns 80% of Senior, Inc. During the year just ended, Perez sold goods with a 40% gross profit to
Senior. Senior sold all of these goods during the year. In its consolidated financial statements for the year,
how should the summation of Perez and Senior income statement items be adjusted?
A. Sales and cost of goods sold should be reduced by the intercompany sales.
B. Sales and cost of goods sold should be reduced by 80% of the intercompany sales.
C. Net income should be reduced by 80% of the gross profit on intercompany sales.
D. No adjustment is necessary.

64
Key Financial Accounting Areas
Fixed Assets
Property, plant, and equipment are often called ‘plant assets’ or ‘fixed assets’. They represent tangible, long-
lived assets such as land, buildings, machinery, and tools acquired for use in normal business operations (and
not primarily for sale) during a period of time greater than the normal operating cycle or one year, whichever is
longer. Accumulated depreciation is a contra asset account which represents the accumulation of charges result-
ing from allocating the cost of an asset over its useful life. The cost of the asset is decreased each year to reflect
the effect of use, wear and tear, and obsolescence. The book value of the asset is the excess of its cost over its
accumulated depreciation. The book value of an asset does not necessarily represent its fair market value of ap-
praisal value.
If a company fails to capitalize a fixed asset at the correct amount, this error will affect both the company’s in-
come statement and balance sheet. The purchase of assets affects the balance sheet by reducing the cash ac-
count and increasing the fixed assets account. In addition, a depreciation expense has a direct effect on the
profit on the income statement as the company’s taxable income is reduced by its depreciation expense.
Initial Recording
When bought, a fixed asset is recorded at its fair value or the fair value of the consideration given, whichever is
more clearly evident. The basis of accounting for a fixed asset is its cost, which includes expenditures necessary
to put it into location or initially use it. Therefore, cost includes all normal, reasonable, and necessary expendi-
tures to obtain the asset and get it ready for use, such as:
• Delivery
• Installation
• Testing, breaking in, and setup
• Assembling
• Trial runs
• Warehousing
• Sales taxes
• Insurance
Abnormal costs are not charged to the asset but rather expensed, such as for repairs of a fixed asset that was
damaged during shipment because of mishandling. If two or more assets are purchased at a lump-sum price,
cost is allocated to the assets based on their fair market values.
Self-constructed assets are recorded at the incremental or direct costs to build (material, labor, and variable
overhead) assuming idle capacity. Fixed overhead is excluded unless it increases because of the construction
effort. However, self-constructed assets should not be recorded at an amount in excess of the outside cost.

65
Example 3-3
Incremental costs to self-construct equipment are $80,000. The equipment could be bought from outside
for $76,000. The journal entry is:
Equipment 76,000
Loss 4,000
Cash 80,000
A donated fixed asset should be recorded at its fair value by debiting fixed assets and crediting contribution
revenue. The company that donates a nonmonetary asset recognizes an expense for the fair value of the donat-
ed asset. The difference between the book value and fair value of the donated asset represents a gain or loss.
Example 3-4
Harris Company donates land costing $50,000 with a fair value of $70,000. The journal entry is:
Contribution expense 70,000
Land 50,000
Gain on disposal of land 20,000
If a company pledges unconditionally to give an asset in the future, contribution expense and payable are ac-
crued. This includes a conditional promise that has satisfied all conditions and, in effect, is now unconditional.
However, if the pledge is conditional, an entry is not made until the asset is, in fact, transferred. If it is unclear
whether the promise is conditional or unconditional, the former is presumed.
Subsequent Measurement
Expenditures incurred that increase the capacity, life, or operating efficiency of a fixed asset are capitalized.
However, insignificant expenditures are usually expensed as incurred. Additions to an existing asset are deferred
and depreciated over the shorter of the life of the addition or the life of the building. Rearrangement and rein-
stallation costs should be deferred if future benefit exists. Otherwise, they should be expensed. If fixed assets
are obsolete, they should be written down to salvage value, recognizing a loss, and reclassified from property,
plant, and equipment to other assets.
Ordinary repairs such as a tune-up for a delivery truck are expensed, because they only benefit less than one
year. Extraordinary repairs are deferred to the fixed asset because they benefit more than one year. An example
is a new motor for a salesperson's automobile. Extraordinary repairs either increase the asset's life or make the
asset more useful. Capital expenditures enhance the quality or quantity of services to be obtained from the as-
set.

66
If a fixed asset is to be disposed of, it should not be depreciated. Further, it should be recorded at the lower of
its book value or net realizable value. Net realizable value equals fair value less costs to sell. Expected costs to
sell beyond one year should be discounted. Idle or obsolete fixed assets should be written down and reclassified
as other assets. The loss on the write-down is presented in the income statement.
The following table summarizes the accounting treatment for various costs incurred subsequent to the acquisi-
tion of capitalized assets.
The Accounting Treatment for Costs Incurred Subsequent to the Acquisition of Capitalized Assets
Type of Expenditure Normal Accounting Treatment
Additions Capitalize cost of addition to asset account.
Improvements & Replacements
• Carrying value known: Remove cost of and accumulated depreciation on old asset, recognizing any gain or loss. Capitalize cost of improve-ment/replacement.
• Carrying value unknown:
− If the asset's useful life is extended, debit accumulated depreciation for cost of improvement/replacement.
− If the quantity or quality of the asset's productivity is increased, capitalize cost of improvement/replacement to asset account.
Rearrangement & Reinstallation
• If original installation cost is known, account for cost of rearrange-ment/reinstallation as a replacement (carrying value known).
• If original installation cost is unknown and rearrangement/reinstallation cost is material in amount and benefits future periods, capitalize as an as-set.
• If original installation cost is unknown and rearrangement/reinstallation cost is not material or future benefit is questionable, expense the cost when incurred.
Repairs • Ordinary: Expense cost of repairs when incurred.
• Major: As appropriate, treat as an addition, improvement, or replacement.

67
Journal Entries
The following table lists typical fixed asset journal entries as a quick reference:
Fixed Assets xxx
Cash xxx
Purchase of fixed assets
Depreciation Expense xxx
Accumulated Depreciation xxx
Record depreciation
Cash xxx
Accumulated Depreciation xxx
Fixed Assets xxx
Gain on Disposal xxx
Gain on sale of asset
Cash xxx
Accumulated Depreciation xxx
Loss on Disposal xxx
Fixed Assets xxx
Loss on sale of asset
Accumulated Depreciation xxx
Fixed Asset xxx
To remove a fully depreciated asset
Disclosures
The following should be footnoted in connection with fixed assets:
• Fixed assets by major category. Category may be in terms of nature or function
• A description of depreciation method and estimates used
• Fixed assets subject to pledges, liens, or other commitments
• Fixed assets held to be disposed of and any anticipated losses. The reasons why such assets are to be
disposed of should be provided. Disclosure includes expected disposal dates, carrying amounts of such
assets, and business segments affected
• Contracts to buy new fixed assets
• Fixed assets that are fully depreciated but still in use
• Idle fixed assets
• Amount of capitalized interest
68
Inventory
Inventory Costing Methods
Inventories represent merchandise, work in process, and raw materials that a business normally uses in its man-
ufacturing and selling operations. Inventories are usually reported at cost or at the lower of cost or market val-
ue. Cost of inventory includes all costs incurred in bringing the inventory to its existing condition and location:
• Purchase price less discounts
• Transportation in
• Insurance in transit
• Taxes
• Storage
There are three basis approaches to valuing inventory:
1. First-in, First-out (FIFO): Under FIFO, inventory purchased or manufactured first is sold first. In other
words, the cost associated with the inventory that was purchased first is the cost expensed first. There-
fore, the cost of inventory reported on the balance sheet represents the cost of the inventory most re-
cently purchased. This results in inventory being valued close to current replacement cost. During peri-
ods of inflation, the use of FIFO will result in the lowest estimate of cost of goods sold among the three
approaches, and the highest net income.
2. Last-in, First-out (LIFO): Under LIFO, the most recently produced items are recorded as sold first. The in-
ventory is valued on the basis of the cost of materials bought earlier in the year. During periods of infla-
tion, the use of LIFO will result in the highest estimate of cost of goods sold among the three approach-
es, and the lowest net income. LIFO is only used in the U.S., governed by the generally accepted ac-
counting principles (GAAP). Since International Financial Reporting Standards (IFRS) prohibits the use of
LIFO, more companies returned to FIFO. FIFO and average cost are the only two acceptable cost flow as-
sumptions permitted under IFRS.
3. Weighted Average: Under the weighted average approach, both inventory and the cost of goods sold
are based upon the average cost of all units bought during the period by using the formula: Total cost of
items in inventory available for sale divided by total number of units available for sale. This method is
commonly used in manufacturing businesses where inventories are mixed together and cannot be dif-
ferentiated, such as chemicals. When inventory turns over rapidly, weighted average costs method will
more closely resemble FIFO than LIFO.
LIFO is generally the preferred inventory valuation method during times of rising costs because it places a lower
value on the remaining inventory and a higher value on the cost of goods sold to lower income and taxes. In
general, FIFO is preferred during periods of deflation or in industries where inventory can tend to lose its value
rapidly, such as high technology companies. Major impacts of FIFO and LIFO inventory costing methods on fi-
nancial statements in times of rising prices are shown here:
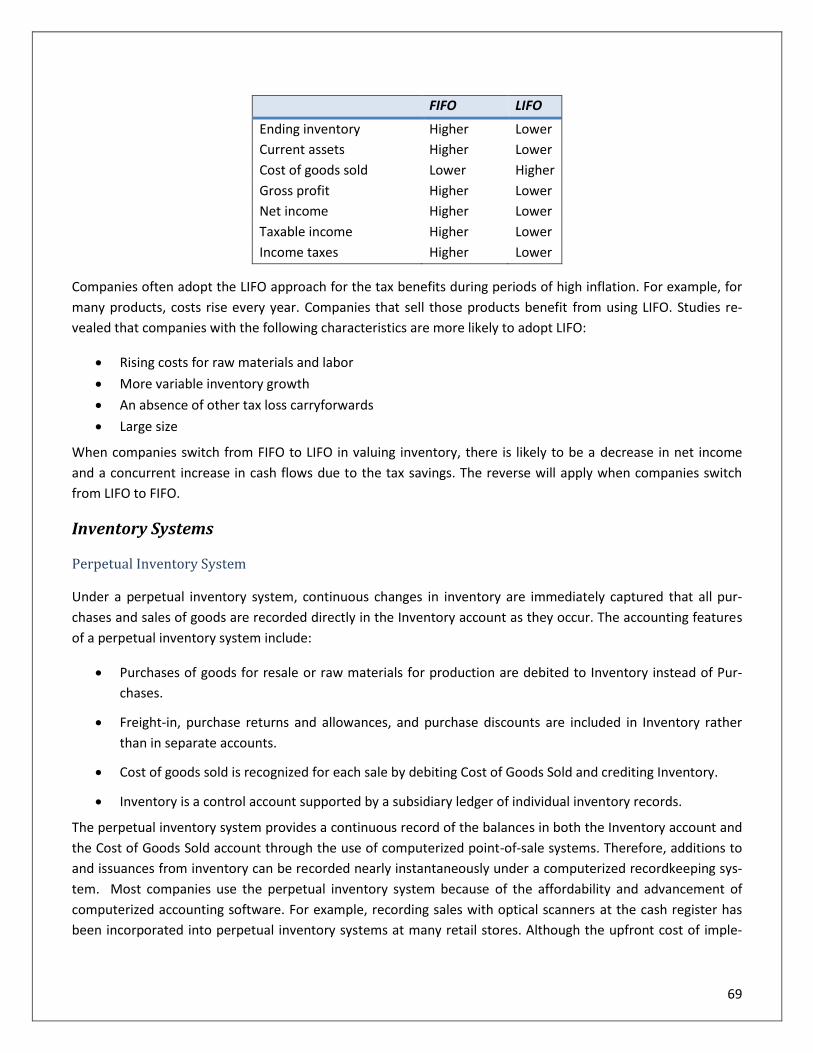
69
FIFO LIFO
Ending inventory Higher Lower
Current assets Higher Lower
Cost of goods sold Lower Higher
Gross profit Higher Lower
Net income Higher Lower
Taxable income Higher Lower
Income taxes Higher Lower
Companies often adopt the LIFO approach for the tax benefits during periods of high inflation. For example, for
many products, costs rise every year. Companies that sell those products benefit from using LIFO. Studies re-
vealed that companies with the following characteristics are more likely to adopt LIFO:
• Rising costs for raw materials and labor
• More variable inventory growth
• An absence of other tax loss carryforwards
• Large size
When companies switch from FIFO to LIFO in valuing inventory, there is likely to be a decrease in net income
and a concurrent increase in cash flows due to the tax savings. The reverse will apply when companies switch
from LIFO to FIFO.
Inventory Systems
Perpetual Inventory System
Under a perpetual inventory system, continuous changes in inventory are immediately captured that all pur-
chases and sales of goods are recorded directly in the Inventory account as they occur. The accounting features
of a perpetual inventory system include:
• Purchases of goods for resale or raw materials for production are debited to Inventory instead of Pur-
chases.
• Freight-in, purchase returns and allowances, and purchase discounts are included in Inventory rather
than in separate accounts.
• Cost of goods sold is recognized for each sale by debiting Cost of Goods Sold and crediting Inventory.
• Inventory is a control account supported by a subsidiary ledger of individual inventory records.
The perpetual inventory system provides a continuous record of the balances in both the Inventory account and
the Cost of Goods Sold account through the use of computerized point-of-sale systems. Therefore, additions to
and issuances from inventory can be recorded nearly instantaneously under a computerized recordkeeping sys-
tem. Most companies use the perpetual inventory system because of the affordability and advancement of
computerized accounting software. For example, recording sales with optical scanners at the cash register has
been incorporated into perpetual inventory systems at many retail stores. Although the upfront cost of imple-

70
mentation can be much higher than a periodic inventory system, the system will pay for itself in increased effi-
ciency.
Periodic Inventory System
Under a periodic inventory system, the quantity of inventory is updated on a periodic basis. It has different ac-
counting entries from the perpetual inventory system:
• All purchases of inventory during the accounting period are recorded by debits to a Purchases account.
• The Cost of the goods available for sale during the period = The total in the Purchases account at the
end of the accounting period + The cost of the Inventory on hand at the beginning of the period
• The Cost of Goods Sold = Ending inventory - The Cost of goods available for sale
• The cost of Goods Sold is a residual amount depending upon a physically-counted ending inventory.
Periodic inventory systems record the beginning balance and are updated at the end of each fiscal year as de-
termined by a physical inventory.
Regardless of the type of inventory system used, there is always risk of loss and error, such as waste, breakage,
theft, human errors (e.g., improper data entry, failure to prepare or record purchases), that may cause the in-
ventory records to differ from the actual inventory on hand. Companies must conduct periodic verification of
the inventory records by actual count, weight, or measurement. These counts should be compared to the inven-
tory records. If it is possible, the physical inventory should be conducted near the end of a company’s fiscal year
to ensure that correct inventory quantities are available in preparing annual accounting reports.
Perpetual vs. Periodic Inventory Journal Entries
The main differences between perpetual and periodic inventory systems include:
1. Inventory Account and Cost of Goods Sold Account: Both accounts are updated continuously in a perpetual
inventory system. In a periodic inventory system, they are updated only at the end of the period.
2. Purchase Account and Purchase Returns and Allowances Account: Both accounts are only used in the peri-
odic inventory system.
3. Sale Transaction: It is recorded through two journal entries in a perpetual inventory system. (See details in
the following table)
4. Closing Entries: They are only required in the periodic inventory system.
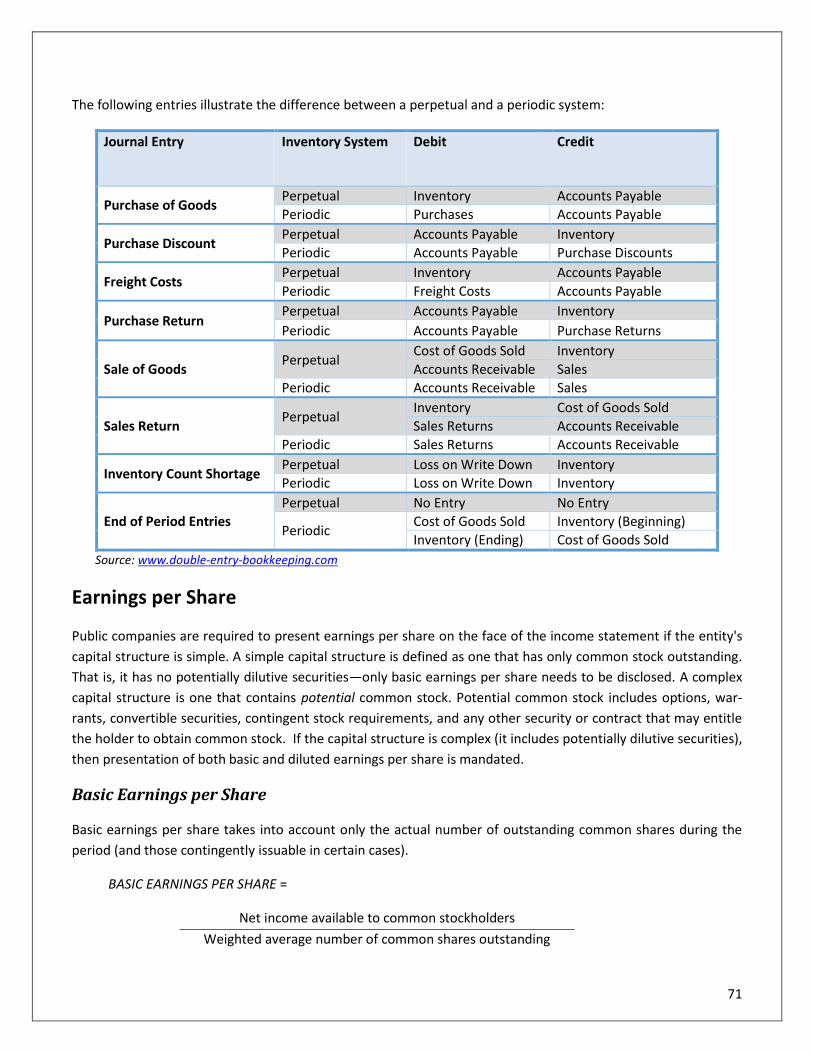
71
The following entries illustrate the difference between a perpetual and a periodic system:
Journal Entry
Inventory System Debit Credit
Purchase of Goods Perpetual Inventory Accounts Payable
Periodic Purchases Accounts Payable
Purchase Discount Perpetual Accounts Payable Inventory
Periodic Accounts Payable Purchase Discounts
Freight Costs Perpetual Inventory Accounts Payable
Periodic Freight Costs Accounts Payable
Purchase Return Perpetual Accounts Payable Inventory
Periodic Accounts Payable Purchase Returns
Sale of Goods Perpetual
Cost of Goods Sold Inventory
Accounts Receivable Sales
Periodic Accounts Receivable Sales
Sales Return Perpetual
Inventory Cost of Goods Sold
Sales Returns Accounts Receivable
Periodic Sales Returns Accounts Receivable
Inventory Count Shortage Perpetual Loss on Write Down Inventory
Periodic Loss on Write Down Inventory
End of Period Entries
Perpetual No Entry No Entry
Periodic Cost of Goods Sold Inventory (Beginning)
Inventory (Ending) Cost of Goods Sold
Source: www.double-entry-bookkeeping.com
Earnings per Share
Public companies are required to present earnings per share on the face of the income statement if the entity's
capital structure is simple. A simple capital structure is defined as one that has only common stock outstanding.
That is, it has no potentially dilutive securities—only basic earnings per share needs to be disclosed. A complex
capital structure is one that contains potential common stock. Potential common stock includes options, war-
rants, convertible securities, contingent stock requirements, and any other security or contract that may entitle
the holder to obtain common stock. If the capital structure is complex (it includes potentially dilutive securities),
then presentation of both basic and diluted earnings per share is mandated.
Basic Earnings per Share
Basic earnings per share takes into account only the actual number of outstanding common shares during the
period (and those contingently issuable in certain cases).
BASIC EARNINGS PER SHARE =
Net income available to common stockholders
Weighted average number of common shares outstanding

72
Net income available to common stockholders is net income less declared preferred stock dividends for the cur-
rent year. If the preferred stock is noncumulative, preferred stock dividends are subtracted only if they are de-
clared during the period. On the other hand, if the preferred stock is cumulative, the dividends are subtracted
even if they are not declared in the current year. The weighted-average number of common shares outstanding
is determined by multiplying the number of shares issued and outstanding for any time period by a fraction, the
numerator being the number of months the shares have been outstanding and the denominator being the num-
ber of months in the period (e.g. 12 months for annual reporting).
Example 3-5
On January 1, 20X3, 100,000 shares were issued. On October 1, 20X3, 10,000 of those shares were reacquired.
The weighted-average common shares outstanding equals 97,500 shares, computed as follows:
1/1/20X3-9/30/20X3 (100,000 × 9/12) 75,000
10/1/20X3-12/31/20X3 (90,000 × 3/12) 22,500
Weighted outstanding common shares 97,500
If a stock dividend or stock split has been issued for the period, it is presumed that such stock dividend or split
was issued at the beginning of the period. Thus, stock dividends or stock splits are weighted for the entire peri-
od, regardless of the fact that they were issued during the period. Further, when comparative financial state-
ments are prepared, the issuance of a stock dividend or stock split requires retroactive restatement of each pre-
vious year's earnings per share to give effect to the dividend or split for those prior years.
Example 3-6
The following occurred during the year regarding common stock:
Shares outstanding—1/1 30,000
2-for-1 stock split—4/1 30,000
Shares issued—8/1 5,000
The common shares to be used in the denominator of basic EPS is 62,083 shares, computed as follows:
1/1-3/31 30,000 × 3/12 × 2 15,000
4/1-8/1 60,000 × 4/12 20,000
8/1-12/31 65,000 × 5/12 27,083
Total 62,083
Example 3-7
The following information is presented for a company:

73
Preferred stock, $10 par, 6% cumulative, 30,000 shares issued and outstanding $300,000
Common stock, $5 par, 100,000 shares issued and outstanding 500,000
Net income 400,000
The company paid a cash dividend on preferred stock. The preferred dividend would therefore equal
$18,000 (6% × $300,000). Basic EPS equals $3.82, computed as follows:
EARNINGS AVAILABLE TO COMMON STOCKHOLDERS
Net income $400,000
Less: preferred dividends (18,000)
Earnings available to common stockholders $382,000
Basic EPS = $382,000/100,000 shares = $3.82
Diluted Earnings per Share
Diluted earnings per share includes the effect of common shares actually outstanding and the impact of convert-
ible securities, stock options, stock warrants, and their equivalents, if dilutive. Diluted earnings per share should
not assume the conversion, exercise, or contingent issuance of securities having an antidilutive effect (increasing
earnings per share or decreasing loss per share) because it violates conservatism.
DILUTED EARNINGS PER SHARE =
Net income available to common stockholders + net of tax interest
and/or dividend savings on convertible securities
Weighted-average number of common shares outstanding + effect
of convertible securities + net effect of stock options
In the case of convertible securities, the if-converted method must be used. Under this approach, it is assumed
that the dilutive convertible security is converted into common stock at the beginning of the period or date of
issue, if later. If conversion is assumed, the interest expense (net of tax) that would have been incurred on the
convertible bonds must be added back to net income in the numerator. Any dividend on convertible preferred
stock would also be added back (dividend savings) to net income in the numerator. The add-back of interest ex-
pense (net of tax) on convertible bonds and preferred dividends on convertible preferred stock results in an ad-
justed net income figure used to determine earnings per share. Correspondingly, the number of common shares
the convertible securities are convertible into (or their weighted-average effect if conversion to common stock
actually took place during the year) must also be added to the weighted-average outstanding common shares in
the denominator.
In the case of dilutive stock options, stock warrants, or their equivalent, the treasury stock method is used. Un-
der this approach, there is a presumption that the option or warrant was exercised at the beginning of the peri-
od, or date of issue if later. The assumed proceeds received from the exercise of the options or warrants are as-
sumed to be used to buy treasury stock at the average market price for the period. However, exercise is pre-
74
sumed to occur only if the average market price of the underlying shares during the period is greater than the
exercise price of the option or warrant. This presumption ensures that the assumed exercise of a stock option or
warrant will have a dilutive effect on the earnings-per-share computation. Correspondingly, the denominator of
diluted earnings-per-share increases by the number of shares assumed issued owing to the exercise of options
or warrants reduced by the assumed treasury shares purchased.
If options are granted as part of a stock-based compensation arrangement, the assumed proceeds from the ex-
ercise of the options under the treasury stock method include deferred compensation and the resulting tax ben-
efit that would be credited to paid-in-capital arising from the exercise of the options.
As a result of the if-converted method for convertible dilutive securities and the treasury stock method for stock
option plans and warrants, the denominator of diluted-earnings-per-share computation equals the weighted-
average outstanding common shares for the period plus the assumed issue of common shares arising from con-
vertible securities plus the assumed shares issued because of the exercise of stock options or stock warrants, or
their equivalent.
Example 3-8
One hundred shares are under a stock option plan at an exercise price of $10. The average market price of
stock during the period is $25. Exercise is presumed to occur because the average market price of the
stock for the period ($25) is greater than the exercise price ($10). The assumed issuance of common
shares is computed as 60, as follows:
Proceeds from assumed exercise of stock option plan: 100 shares × $10 = $1,000
Number of shares needed from assumed exercise of stock option plan: 100 shares
Less: Number of shares of treasury stock assumed acquired ($1000/$25) 40 shares
Additional shares that must be issued to satisfy stock option holders 60 shares
Alternatively, the computation may be done using the following formula:
Assumed issuance of additional common shares
under the Treasury Stock Method used to satis-
fy option holders =
Average market price of Stock-Exercise
Price/Average market price of the stock × Num-
ber of shares under the stock option plan
= $25 − $10/$25 × 100 shares
= $15/$25 × 100 shares
= 60 shares
Disclosures
Basic earnings per share and diluted earnings per share (if required) for income from continuing operations and
net income must be disclosed on the face of the income statement. In addition, the earnings-per-share effects
75
associated with the disposal of a business segment, must be presented either on the face of the income state-
ment or notes thereto.
A reconciliation is required of the numerators and denominators for basic and diluted earnings per share. Disclo-
sure is also mandated for the impact of preferred dividends in arriving at income available to common stock-
holders.
Other disclosures include:
• Information on the capital structure
• Assumptions made
• Number of shares converted
• Rights and privileges of securities, such as dividend and participation rights, call prices, and conversion
ratios
Accounting Changes and Error Corrections
Definition of Accounting Changes
A company’s financial statements sometimes report significantly different results from year to year. This may be
due to changes in economic circumstances, but it may also be due to changes in accounting. An accounting
change is generally the result of one of four scenarios: a change in accounting principle, a change in estimate, a
change in reporting entity, or a correction of an error. Distinguishing between each scenario can sometimes be
difficult, but the distinction is critical to applying the appropriate reporting framework. Accounting changes are
classified as follows:
Change in Accounting Principle A change from one U.S. GAAP to another U.S GAAP.
Change in Accounting Estimate A change that occurs as the result of new information or as ad-
ditional experience is acquired.
Change in Reporting Entity A change from reporting as one type of entity to another type
of entity.
Correction of an Error
Such errors include mathematical mistakes, mistakes in the ap-
plication of accounting principles, or oversight or misuse of
facts.
Reporting requirements for each type of change are discussed in the following sections;

76
Change in Accounting Principle
Consistent use of the same accounting principle from one period to another improves the ability of financial
statement users to analyze and understand comparative accounting data. A company should change an account-
ing principle only if either of the following situations applies:
• The change is required by a newly issued code update; or
• The entity can justify the use of an allowable alternative accounting principle on the basis that it is pref-
erable.
Changing from one acceptable accounting principle to another acceptable accounting principle is accounted
for as a change in accounting principle. However, this does NOT include:
1. The adoption of a new accounting principle because the entity has entered into transactions for the
first time that require specific accounting treatment.
2. The change from an inappropriate accounting principle to an acceptable accounting principle. The lat-
er would be classified as the correction of an error.
The types of changes that might be included in a change in accounting principle are:
• Adoption of a new accounting standard
• Change in the method of inventory costing
• Change to, or from, the cost method to the equity method
• Change to, or from, the completed contract to percentage-of-completion method
A change in accounting principle is generally applied retrospectively (by recasting prior periods), unless it is im-
practical to do so. The required steps are:
1. Changing the financial statements of all prior periods presented.
2. Disclosing in the year of the change, the effect on net income and earnings per share for all prior periods
presented.
3. Reporting an adjustment to the beginning retained earnings balance in the statement of retained earn-
ings in the earliest year presented.
If impracticable to determine the prior period effect:
1. Do not change prior years' income.
2. Use opening inventory in the year the method is adopted as the base-year inventory for all subsequent
LIFO computations.
3. Disclose the effect of the change on the current year, and the reasons for omitting the computation of
the cumulative effect and pro forma amounts for prior years.
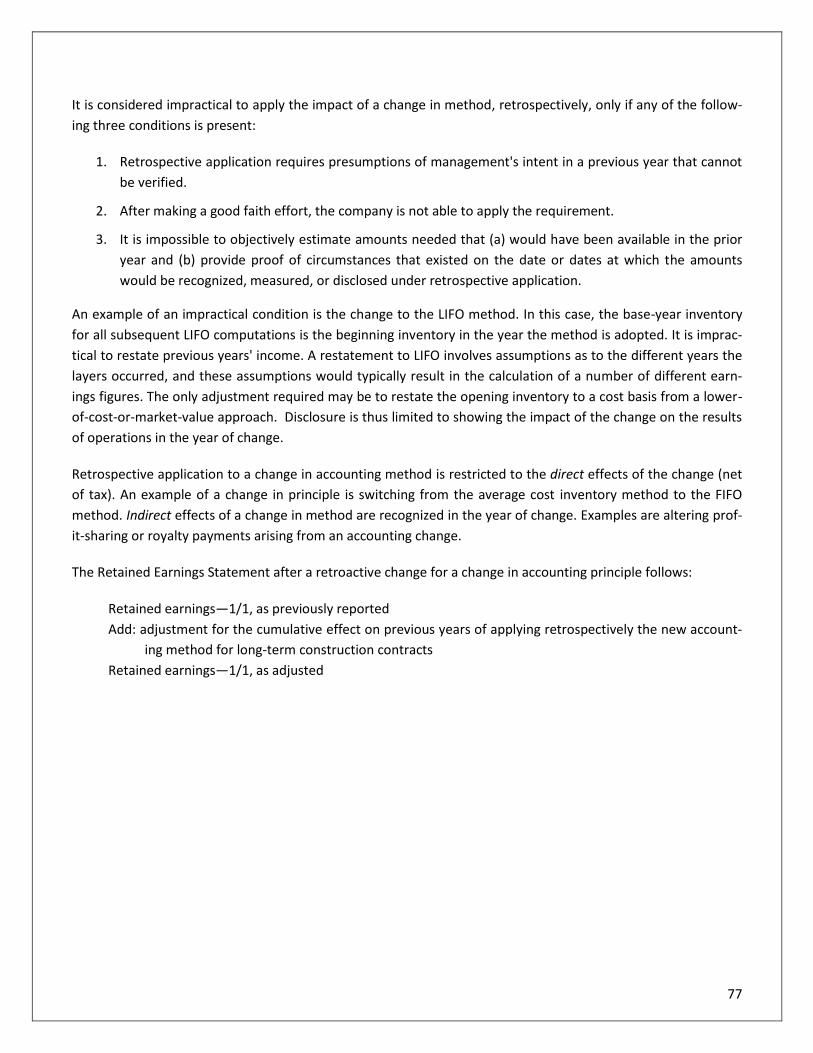
77
It is considered impractical to apply the impact of a change in method, retrospectively, only if any of the follow-
ing three conditions is present:
1. Retrospective application requires presumptions of management's intent in a previous year that cannot
be verified.
2. After making a good faith effort, the company is not able to apply the requirement.
3. It is impossible to objectively estimate amounts needed that (a) would have been available in the prior
year and (b) provide proof of circumstances that existed on the date or dates at which the amounts
would be recognized, measured, or disclosed under retrospective application.
An example of an impractical condition is the change to the LIFO method. In this case, the base-year inventory
for all subsequent LIFO computations is the beginning inventory in the year the method is adopted. It is imprac-
tical to restate previous years' income. A restatement to LIFO involves assumptions as to the different years the
layers occurred, and these assumptions would typically result in the calculation of a number of different earn-
ings figures. The only adjustment required may be to restate the opening inventory to a cost basis from a lower-
of-cost-or-market-value approach. Disclosure is thus limited to showing the impact of the change on the results
of operations in the year of change.
Retrospective application to a change in accounting method is restricted to the direct effects of the change (net
of tax). An example of a change in principle is switching from the average cost inventory method to the FIFO
method. Indirect effects of a change in method are recognized in the year of change. Examples are altering prof-
it-sharing or royalty payments arising from an accounting change.
The Retained Earnings Statement after a retroactive change for a change in accounting principle follows:
Retained earnings—1/1, as previously reported
Add: adjustment for the cumulative effect on previous years of applying retrospectively the new account-
ing method for long-term construction contracts
Retained earnings—1/1, as adjusted

78
Example 3-9
XYZ Construction Company has in previous years used the completed contract method for construction
contracts. In 20X7, the company switched to the percentage-of-completion method. The tax rate is 30%.
The following information is provided:
Before-Tax Income from
Year
Percentage of
Completion
Completed
Contract
Before 20X7 $300,000 $200,000
In 20X7 90,000 80,000
Total at beginning of 20X7 $390,000 $280,000
Total in 20X7 100,000 95,000
The basis for the journal entry to record the change in 20X7 is:
Difference Tax (30%) Net of Tax
Before 20X7 $100,000 $30,000 $70,000
In 20X7 10,000 3,000 7,000
Total at beginning of 20X7 $110,000 $33,000 $77,000
Total in 20X7 5,000 1,500 3,500
The journal entry to record the change in 20X7 is:
Construction in progress 110,000
Deferred tax liability 33,000
Retained earnings 77,000
Example 3-10
In 20X7, Smith Corporation decided to change from the FIFO method of inventory valuation to the
weighted-average method. Inventory balances under each of the methods were as follows:
FIFO
Weighted Aver-
age
January 1, 20X7 $171,000 $177,000
December 31, 20X7 179,000 183,000
Smith Corporation’s income tax rate is 40%.
In its 20X7 financial statements, what amount should Smith Corporation report as the cumulative effect of this
accounting change? The required computation is as follows:
Weighted-average method as of January 1, 20X7, the year in which
the change is adopted $177,000
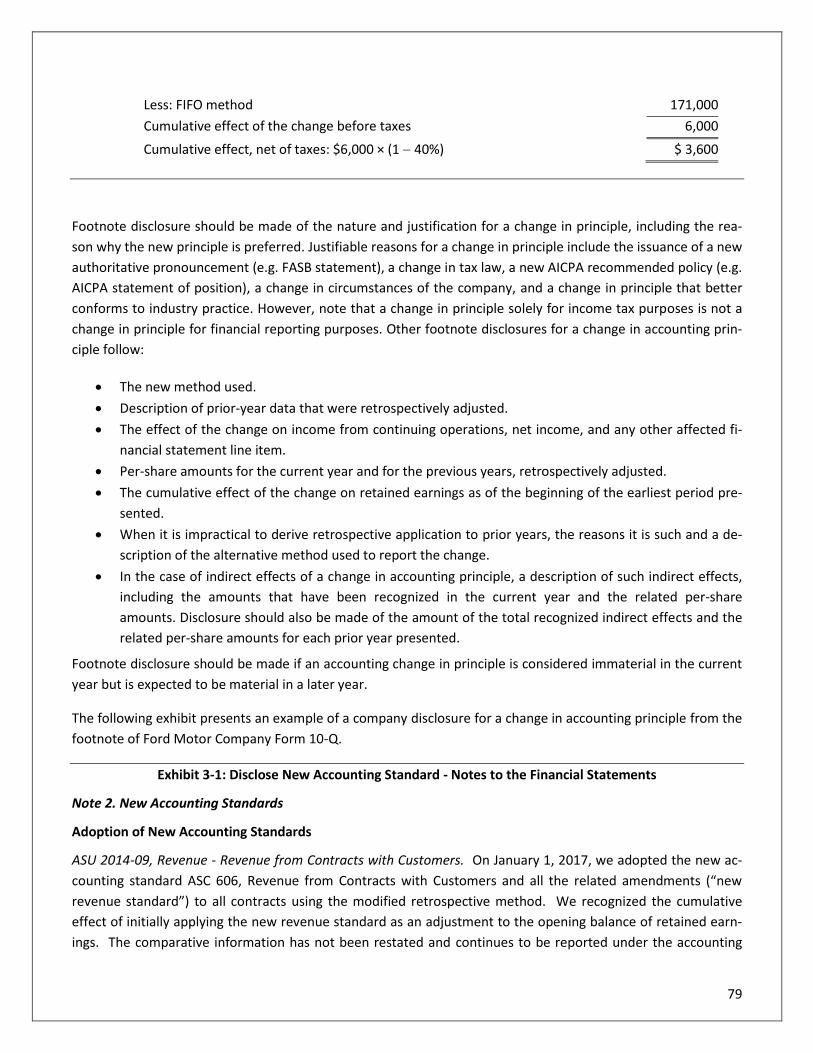
79
Less: FIFO method 171,000
Cumulative effect of the change before taxes 6,000
Cumulative effect, net of taxes: $6,000 × (1 − 40%) $ 3,600
Footnote disclosure should be made of the nature and justification for a change in principle, including the rea-
son why the new principle is preferred. Justifiable reasons for a change in principle include the issuance of a new
authoritative pronouncement (e.g. FASB statement), a change in tax law, a new AICPA recommended policy (e.g.
AICPA statement of position), a change in circumstances of the company, and a change in principle that better
conforms to industry practice. However, note that a change in principle solely for income tax purposes is not a
change in principle for financial reporting purposes. Other footnote disclosures for a change in accounting prin-
ciple follow:
• The new method used.
• Description of prior-year data that were retrospectively adjusted.
• The effect of the change on income from continuing operations, net income, and any other affected fi-
nancial statement line item.
• Per-share amounts for the current year and for the previous years, retrospectively adjusted.
• The cumulative effect of the change on retained earnings as of the beginning of the earliest period pre-
sented.
• When it is impractical to derive retrospective application to prior years, the reasons it is such and a de-
scription of the alternative method used to report the change.
• In the case of indirect effects of a change in accounting principle, a description of such indirect effects,
including the amounts that have been recognized in the current year and the related per-share
amounts. Disclosure should also be made of the amount of the total recognized indirect effects and the
related per-share amounts for each prior year presented.
Footnote disclosure should be made if an accounting change in principle is considered immaterial in the current
year but is expected to be material in a later year.
The following exhibit presents an example of a company disclosure for a change in accounting principle from the
footnote of Ford Motor Company Form 10-Q.
Exhibit 3-1: Disclose New Accounting Standard - Notes to the Financial Statements
Note 2. New Accounting Standards
Adoption of New Accounting Standards
ASU 2014-09, Revenue - Revenue from Contracts with Customers. On January 1, 2017, we adopted the new ac-
counting standard ASC 606, Revenue from Contracts with Customers and all the related amendments (“new
revenue standard”) to all contracts using the modified retrospective method. We recognized the cumulative
effect of initially applying the new revenue standard as an adjustment to the opening balance of retained earn-
ings. The comparative information has not been restated and continues to be reported under the accounting

80
standards in effect for those periods. We expect the impact of the adoption of the new standard to be immate-
rial to our net income on an ongoing basis.
A majority of our sales revenue continues to be recognized when products are shipped from our manufacturing
facilities. Under the new revenue standard, certain vehicle sales where revenue was previously deferred, such
as vehicles subject to a guaranteed resale value recognized as a lease and transactions in which a Ford-owned
entity delivered vehicles, we now recognize revenue when vehicles are shipped.
The new revenue standard also provided additional clarity that resulted in reclassifications to or from Revenue,
Cost of sales, and Financial Services other income/(loss), net.
In accordance with the new revenue standard requirements, the disclosure of the impact of adoption on our
consolidated income statement and balance sheet was as follows (in millions):
For the period ended March 31, 2017
Income Statement As Reported
Balances With-out Adoption
of ASC 606 Effect of Change Higher/(Lower)
Revenues Automotive $ 36,475 $ 36,142 $ 333
Financial Services 2,669 2,580 89
Costs and expenses Cost of sales 32,708 32,446 262
Interest expense on Automotive debt 279 262 17
Non-Financial Services other income/(loss), net 712 732 (20)
Financial Services other income/(loss), net 22 111 (89)
Provision for/(Benefit from) income taxes 649 642 7
Net income 1,594 1,567 27
March 31, 2017
Balance Sheet As Reported
Balances With-out Adoption
of ASC 606 Effect of Change Higher/(Lower)
Assets Trade and other receivables $ 10,685 $ 10,691 $ (6)
Other Assets, current 3,414 3,082 332
Net investment in operating leases 27,914 28,680 (766)
Deferred income taxes 10,055 10,075 (20)
Liabilities Payables 23,257 22,973 284
Other liabilities and deferred revenue, current 18,790 20,003 (1,213)
Automotive debt payable within one year 3,100
2,689 411
Other liabilities and deferred revenue, non-current 24,583 24,588 (5)
Deferred income taxes 749 749 -
Equity Retained earnings 16,992 16,929 63

81
Change in Accounting Estimate
Accounting estimates will change as a result from new events, new information, or as the company acquires
more experience. They occur because companies must make estimates of future conditions and events, without
complete certainty, and the changes in estimates require adjustments to the carrying amounts of assets and lia-
bilities. Examples of areas for which changes in accounting estimates often are needed include the following:
• Uncollectible receivables
• Useful lives of depreciable or intangible assets
• Residual values for depreciable assets
• Warranty obligations
• Quantities of mineral reserves to be depleted
• Actuarial assumptions for pensions or other postemployment benefits
• Number of periods benefited by deferred costs
A change in accounting estimate is always accounted for on a prospective basis (only over current and future
years.) by:
1. Reporting current and future financial statements on the new basis.
2. Presenting prior period financial statements as previously reported.
3. Making no adjustments to current period opening balances for the effects in prior periods.
Distinguishing between a change in an accounting principle and a change in an accounting estimate can be diffi-
cult. In some cases, there may be a change in an accounting estimate effected by change in accounting princi-
ple. For example, a change in depreciation, depletion, or amortization is a change in estimate effected by a
change in principle.
Footnote disclosure should be made of the nature and reasons for the change unless it involves changes in the
ordinary course of business (e.g. modifying a bad debt percentage). Disclosures are only required if the change
is material. The impact of the change in estimate on net income and per share earnings should be disclosed if
the change will affect future-year results.
The following exhibit presents an example of disclosure relating to change in estimates contained in the Boeing
Company’s annual report:
82
Exhibit 3-2: The Boeing Company − Revenue and Related Cost Recognition
Contract Accounting
Contract accounting is used for development and production activities predominantly by Defense, Space & Secu-
rity (BDS). The majority of business conducted by BDS is performed under contracts with the U.S. government
and other customers that extend over several years. Contract accounting involves a judgmental process of esti-
mating total sales and costs for each contract resulting in the development of estimated cost of sales percent-
ages. For each contract, the amount reported as cost of sales is determined by applying the estimated cost of
sales percentage to the amount of revenue recognized. When the current estimates of total sales and costs for a
contract indicate a loss, a provision for the entire loss on the contract is recognized. Changes in estimated reve-
nues, cost of sales and the related effect on operating income are recognized using a cumulative catch-up ad-
justment which recognizes in the current period the cumulative effect of the changes on current and prior peri-
ods based on a contract’s percent complete. In 2015, net unfavorable cumulative catch-up adjustments, includ-
ing reach-forward losses, across all contracts decreased Earnings from operations by $224 and diluted EPS by
$0.23. In 2014 and 2013 net favorable cumulative catch-up adjustments, including reach-forward losses, across
all contracts increased Earnings from operations by $100 and $242 and diluted EPS by $0.10 and $0.23. Signifi-
cant adjustments during the three years ended December 31, 2015 included reach-forward losses of $835 and
$425 on the USAF KC-46A Tanker contract recorded during 2015 and 2014.
Change in Reporting Entity
A change in reporting entity refers to preparing financial statements for an entity different from the one report-
ed in previous years. Examples of a change in reporting entity are:
• Presenting consolidated financial statements for the first time.
• Changing specific subsidiaries for which consolidated financial statements are presented.
• Changing companies included in combined financial statements.
• Change in the cost, equity, or consolidation method used for accounting for subsidiaries and invest-
ments.
A change in reporting entity requires:
1. Restating the financial statements of all prior periods presented. (No more than five years are restated.)
2. Disclosing in the year of change the effect on net income and earnings per share data for all prior peri-
ods presented.
The impact of the change in reporting entity on income from continuing operations, net income, and earnings
per share is presented for all years. A change in the legal structure of a business is not considered a change in
reporting entity. An example is a sole proprietorship becoming a corporation. Furthermore, the purchase or sale
of an investee is not a change in reporting entity.
A footnote is required on the nature of, and reason for, the change in reporting entity in the year it is made.

83
The following exhibit shows a note disclosing a change in reporting entity, from the annual report of Hewlett-
Packard Company.
Exhibit 3-3: Hewlett-Packard Company − Disclosure of Change in Reporting Entity
Note: Accounting and Reporting Changes (In Part)
Consolidation of Hewlett-Packard Finance Company. The company implemented a new accounting pronounce-
ment on consolidations. With the adoption of this new pronouncement, the company consolidated the accounts
of Hewlett-Packard Finance Company (HPFC), a wholly owned subsidiary previously accounted for under the eq-
uity method, with those of the company. The change resulted in an increase in consolidated assets and liabilities
but did not have a material effect on the company's financial position. Since HPFC was previously accounted for
under the equity method, the change did not affect net earnings. Prior years' consolidated financial information
has been restated to reflect this change for comparative purposes.
Correction of an Error
A financial statement error can impact the interpretation of the financial statements in the year of the error and
in all subsequent years when the error year is used for comparison. For financial reporting purposes, when an
error is detected, all financial statements presented for comparative purposes are corrected and restated. For
bookkeeping purposes, most errors that go undetected counterbalance over a 2-year period; and those errors
that impact income and that have not counterbalanced are corrected by making a direct adjustment to retained
earnings. Some of the types of errors may include:
• Change from an unacceptable accounting principle to an acceptable one.
• Mathematical errors.
• Changes in estimates that were not prepared in good faith.
• Failure to accrue or defer expenses or revenues at the end of a period.
• Misuse of facts.
• Misclassification of costs as expenses and vice versa
Error corrections are not considered accounting changes. They are treated for accounting purposes as prior-
period adjustments. They should be charged or credited net of tax to retained earnings and reported as an ad-
justment in the statement of shareholders' equity. It is not included in net income for the current period.
In ascertaining whether an error is material and therefore reportable, consideration should be given to the sig-
nificance of each correction on an individual basis and to the aggregate effect of all corrections. An error must
be corrected immediately when uncovered.
Restating the prior period financial statement requires:
1. Revising the carrying amounts of assets and liabilities for the cumulative effect of the error as of the be-
ginning of the first period presented.
2. Making an offsetting adjustment to the opening balance of retained earnings to reflect step 1.

84
3. Adjusting the financial statements for each individual prior period to reflect the correction and impact of
the error.
Prior-period adjustments adjust the beginning balance of retained earnings for the net of tax effect of the error
as follows:
Retained earnings—1/1 unadjusted
Prior-period adjustments (net of tax)
Retained earnings—1/1 adjusted
Add: net income
Less: dividends
Retained earnings—12/31
If comparative financial statements are presented, there should be a retroactive adjustment for the error as it
impacts previous years. The retroactive adjustment is presented via disclosure of the impact of the adjustment
on prior years' earnings and components of net income.
Footnote disclosure for error corrections in the year found include the nature and description of the error, fi-
nancial effect on income from continuing operations, net income, and related earnings per share amounts.
Example 3-11
Drake Company bought Travis Company on January 1, 20X5, recording patents of $80,000. Patents have
not been amortized. Amortization is over 20 years. The correcting entry on December 31, 20X7 is:
Amortization expense($80,000/20 years = $4,000 ×1 year for 20X7) 4,000
Retained earnings($4,000 ×2 years for 20X5 and 20X6) 8,000
Patents 12,000
Example 3-12
At the beginning of 20X4, a company purchased machinery for $500,000 with a salvage value of $50,000
and an expected life of 20 years. Straight-line depreciation was used. By mistake, the salvage value was
not subtracted in determining depreciation. The calculations on December 31, 20X7 are:
Depreciation taken (incorrect):
$500,000/20 years ×3 $75,000
Depreciation (correct):
($500,000 − $50,000)/20 years ×3 67,500
Difference $ 7,500
The correcting journal entries on December 31, 20X7 are:
Accumulated depreciation 7,500
Retained earnings 7,500
To correct for error.
85
Depreciation expense 22,500
Accumulated depreciation 22,500
To record depreciation for 20X7.
Example 3-13
On January 1, 20X6, a six-year advance of $120,000 was received. In error, revenue was recorded for the
entire amount. The error was found on December 31, 20X7 before the books were closed. The correcting
entry is:
Retained earnings ($120,000 − $20,000) 100,000
Revenue (for current year) 20,000
Deferred revenue ($20,000 × 4 years) 80,000
Example 3-14
If an enterprise changes from the recognition of vacation pay expense from the cash basis to the accrual
basis, how should the change be accounted for?
In general, a change from an accounting principle that is not generally accepted (accounting for vacation
pay expense on the cash basis) to one that is generally accepted (accounting for it on the accrual basis)
should be presented as a correction of an error. The following procedures should be followed in this cir-
cumstance:
• The correction should be accounted for as a prior-period adjustment (i.e., an adjustment as of the be-
ginning balance of retained earnings, net of taxes) for the earliest year presented.
• There should be a restatement of all comparative prior financial statements presented so that they now
reflect the accounting for vacation pay expense on the accrual basis instead of the cash basis.
• Footnote disclosure should be made in the financial statements regarding the prior-period adjustment
correcting the error, the restatement of the financial statements presented, and the effect of the correc-
tion on net income.

86
Chapter 3 - Section 2 Review Questions
5. With respect to the computation of earnings per share, which of the following would be most indicative of a
simple capital structure?
A. Common stock, preferred stock, and convertible debt outstanding
B. Common stock, convertible preferred stock, and debt outstanding
C. Common stock, preferred stock, and debt outstanding
D. Common stock, preferred stock, and stock options outstanding
6. Deck Co. had 120,000 shares of common stock outstanding at January 1, 20X5. On July 1, 20X5, it issued
40,000 additional shares of common stock. Outstanding all year were 10,000 shares of nonconvertible cu-
mulative preferred stock. What is the number of shares that Deck should use to calculate 20X5 basic earn-
ings per share (BEPS)?
A. 140,000
B. 150,000
C. 160,000
D. 170,000
7. What type of change is one where the periods affected by a deferred cost change because additional infor-
mation has been obtained?
A. A correction of an error.
B. An accounting principle change that should be reported by restating the financial statements of all prior
periods presented.
C. An accounting estimate change that should be reported in the period of change and future periods, if
the change affects both.
D. Not an accounting change.
8. Which of the following changes will result in a prospective change in the current year and years going for-
ward?
A. A change from the cash basis of accounting for vacation pay to the accrual basis.
B. A change from the straight-line method of depreciation for previously recorded assets to the double-
declining-balance method.
C. A change from the presentation of statements of individual companies to their inclusion in consolidated
statements.
D. A change from the completed-contract method of accounting for long-term construction-type contracts
to the percentage-of-completion method.

87
PART III:
ENSURING REGULATORY
COMPLIANCE

88
Chapter 4: Securities and Exchange Commission
Filings
Learning Objectives:
After completing this section, you will be able to:
• Identify the components of major corporate forms required by the SEC
• Identify the disclosure requirements for major segments of a business
• Cite the SEC requirements of cybersecurity risk and cyber incident disclosure
• Recognize the SEC periodic reporting review process
• Identify topics where the SEC staff may challenge the accounting treatment
The Role of the CFO
The Securities Exchange Act of 1934 contains ongoing disclosure requirements designed to keep investors in-
formed on a current basis of information concerning material changes in the financial condition or operations of
the company. The requirements include an obligation to file periodic reports on Form 10-K and Form 10-Q.
These periodic filings are reviewed in accordance with the Sarbanes-Oxley Act of 2002 (SOX). Under SOX Section
408, the SEC must review every public company once every three years. The probability that your company will
need to respond to an SEC comment letter is high. Understanding the reporting requirements and SEC disclosure
review process can help CFOs effectively respond to any potential SEC queries.
This chapter highlights the SEC’s financial reporting and cybersecurity disclosure requirements, along with the
SEC disclosure review scope, review procedures, and common findings. It also discusses how companies address
the SEC comment letter and highlights topics where the SEC staff may challenge the accounting treatment or
request an enhanced disclosure.

89
Periodic Reporting Requirements
Accelerated Filer vs. Non-Accelerated Filer Status
The Securities and Exchange Commission (SEC) is one of the regulatory watchdogs of the U.S. government, and it
was created in the 1930s to protect investors, maintain fair and efficient markets, and facilitate capital for-
mation. To fulfill this responsibility, the SEC has the authority to require publicly traded companies to file disclo-
sure documents, which are then made available to the investing public through EDGAR, the SEC’s online data-
base of public company filings.
All companies (including foreign entities) that publicly sell securities in the U.S. must be registered with the SEC
and comply with its filing requirements — some are submitted on a regular schedule, and others are filed on an
as-needed basis. Although there are hundreds of active form types, the filing requirements for any given com-
pany are determined by factors such as its business activities, financial status, and domicile. For example, the
determination made at the end of a company’s fiscal year as an Accelerated Filer or Non-Accelerated Filer status
directs the applicable deadline for Form 10-K and Form 10-Q as summarized in the following table:
Filer Category Form 10-K Form 10-Q
Large Accelerated Filers ($700 MM
or more) 60 days after fiscal year end
40 days after fiscal quarter
end
Accelerated Filers ($75 MM or
more and less than $700 MM) 75 days after fiscal year end
40 days after fiscal quarter
end
Non-Accelerated Filers (less than
$75MM) 90 days after fiscal year end
45 days after fiscal quarter
end
Source: www.sec.gov
Major Corporate Forms
Quarterly Report (Form 10-Q)
Publicly held companies issue quarterly reports (Form 10-Q) that provide updated information on sales and
earnings and describe any material changes that have occurred in the business or its operations. The SEC defines
materiality as a change in an account of 10 percent or more relative to the prior year. However, many CPA firms
use 5 percent as a materiality guideline. These quarterly reports may provide unaudited financial statements or
updates on operating highlights, changes in outstanding shares, compliance with debt restrictions, and pending
lawsuits. At a minimum, quarterly reports must provide data on sales, net income, taxes, nonrecurring revenue
and expenses, accounting changes, contingencies (e.g. tax disputes), additions or deletions of business seg-
ments, and material changes in financial position.

90
The company may provide financial figures for the quarter itself (e.g. the third quarter, from July 1 to September
30) or cumulatively from the beginning of the year (cumulative up to the third quarter, or January 1 to Septem-
ber 30). Prior-year data must be provided in a form that allows for comparisons.
The Sarbanes-Oxley Act of 2002 requires the company’s CEO and CFO to certify that the 10-Q is both accurate
and complete. These are called Section 302 and Section 906 certifications. Details are discussed in Chapter 5 -
The Sarbanes-Oxley Act.
Snapshot of Form 10-Q
• 10-Q is a quarterly cumulative financial statement for all publicly traded companies.
• Companies are required to provide a balance sheet, income statement, cash flow
statement, and a statement of stockholder’s equity.
• 10-Q disclosures include any major changes made such as a change from one ac-
counting method to another, or a discussion of a contingent liability.
• Companies are required to provide relevant financial data from the exact same filing
time during the past year (information readily comparable).
• There is no 10-Q filing at the end of the year as more comprehensive 10-K is due at
year end.
Annual Report (Form 10-K)
The 10-K offers a detailed picture of a company’s business, the risks it faces, and the operating and financial re-
sults for the fiscal year along with audited financial statements. Company management also discusses its per-
spective on the business results and what is driving them. It also includes the management’s discussion and
analysis, properties, legal proceedings, executive compensation information, controls and procedures and much
more. Some of the key sections of Form 10-K are discussed below.
Risk Factors
The “Risk Factors” section includes information about the most significant risks that apply to the company or to
its securities. Companies generally list the risk factors in order of their importance. This section focuses on the
risks themselves, not how the company addresses these risks. Examples of common risks reported by a company
can include:
• The state of the economy
• The reliance on reputation and the value of the brand
• The price and availability of materials/supplies
• Intense competition
• The ability to make prudent strategic acquisitions
• The regulatory environment
• The impact of any international conflicts in the U.S.

91
MD&A
The “Management's Discussion and Analysis (MD&A)” section contains standard financial statements and sum-
marized financial data for at least 5 years. If trends are relevant, MD&A should emphasize the summary. Favor-
able and unfavorable trends and significant events and uncertainties should be identified. The SEC examines it
with care to determine that management has disclosed material information affecting the company's future re-
sults. To accomplish this, the following items must be disclosed:
1. Liquidity
2. Capital resources
3. Results of operations
4. Critical accounting estimates
5. Positive and negative trends
6. Significant uncertainties
7. Events of an unusual or infrequent nature
8. Underlying causes of material changes in financial statement items
9. A narrative discussion of the material effects of inflation
The SEC provided examples of how an MD&A may discuss risks that the company faces:
• A consumer company might discuss ways in which it seeks to meet changing tastes.
• A manufacturing company that relies on natural resources may discuss how it assesses commodity risks
and conducts resource management programs.
• A financial institution may discuss ways that management monitors liquidity and assures adequate capi-
tal under various scenarios, such as a rise in interest rates or a ratings downgrade.
• A global company may discuss how it handles exchange rate risks.
• Companies may discuss how they handle competition building their brands, or how they manage in an
economic downturn.
• Companies also may discuss how they ensure compliance with laws and regulations, or how they are
addressing the impact of new or anticipated laws and regulations.
The MD&A not only discusses the results of operations but also provides forward-looking information, in the
form of management’s estimates concerning the future performance of the company. Prior to 1995, companies
were discouraged from providing forward-looking information because of the potential for lawsuits from inves-
tors who purchased stock based on management’s estimates of future performance and suffered a loss when
the predicted performance was not realized. To reduce the number of lawsuits related to forward-looking in-
formation, the Private Securities Litigation Reform Act (PSLRA) of 1995 was enacted.
The SEC does not require forecasts but encourages companies to issue projections of future economic perfor-
mance. To encourage the publication of such information in SEC filings, the "safe harbor" rule was established to
protect a company that prepares a forecast on a reasonable basis and in good faith. The SEC Financial Release
No. 72, Commission Guidance Regarding /Management’s Discussion and Analysis of Financial Condition and Re-
sults of Operations (FRR-72), reminds companies that MD&A rules require disclosure of critical accounting esti-
mates and assumptions when both of the following conditions are met:
92
1. The nature of the estimates or assumptions is material because of the levels of subjectivity and judg-
ment needed to account for matters that are highly uncertain and susceptible to change, and
2. The effect of the estimates and assumptions is material to the financial statements
The SEC Staff has noted that companies’ disclosures about critical accounting estimates often are too general
and need to provide a more robust analysis of what is in the significant accounting policies note to the financial
statements. In addition, the SEC Staff’s comments have frequently targeted repetitive discussions about critical
accounting estimates in MD&A. Details of the SEC comment letter are discussed in “The SEC Filing Review Pro-
cess - SEC Comment Letter” on pages 119-121.
EY suggests that companies may consider including in their MD&A a cross-reference to the footnote disclosure
about significant accounting policies. However, they should expand the MD&A disclosure to:
1. Address why the accounting estimate or assumption bears the risk of change, and
2. Analyze the following, if material:
• How the registrant arrived at the estimate/assumption
• How accurate the estimate/assumption has been in the past
• How much the estimate/assumption has changed in the past
• Whether the estimate/assumption is reasonably likely to change in the future
The following exhibit presents an example of a company disclosure of its MD&A − Critical Accounting Estimates
from General Electric Company Form 10-K.
Exhibit 4-1: General Electric Company − Management’s Discussion and Analysis
CRITICAL ACCOUNTING ESTIMATES
REVENUE RECOGNITION ON LONG-TERM PRODUCT SERVICES AGREEMENTS
Revenue recognition on long-term product services agreements requires estimates of profits over the multiple-
year terms of such agreements, considering factors such as the frequency and extent of future monitoring,
maintenance and overhaul events; the amount of personnel, spare parts and other resources required to per-
form the services; and future billing rate, cost changes and customers’ utilization of assets. We routinely review
estimates under product services agreements and regularly revise them to adjust for changes in outlook.
We also regularly assess customer credit risk inherent in the carrying amounts of receivables and contract costs
and estimated earnings, including the risk that contractual penalties may not be sufficient to offset our accumu-
lated investment in the event of customer termination. We gain insight into future utilization and cost trends, as
well as credit risk, through our knowledge of the installed base of equipment and the close interaction with our
customers that comes with supplying critical services and parts over extended periods. Revisions may affect a
product services agreement’s total estimated profitability resulting in an adjustment of earnings; such adjust-
ments increased earnings by $1.4 billion, $1.0 billion and $0.3 billion in 2015, 2014 and 2013, respectively. We
provide for probable losses when they become evident.
93
Controls and Procedures
The “Controls and Procedures” section includes information about the company’s disclosure of its controls and
procedures and its internal control over financial reporting. The following exhibit presents an example of a
company disclosure of its controls and procedures from Target Corporation’s Form 10-K.
Exhibit 4-2: Target Corporation − Controls and Procedures
Changes in Internal Control over Financial Reporting
We have continued to expand our implementation of enterprise resource planning software from SAP AG, in-
cluding the implementation in October 2014 of functionality of customer relationship management. There have
been no other changes in our internal control over financial reporting during the most recently completed fiscal
quarter that have materially affected, or are reasonably likely to materially affect, our internal control over fi-
nancial reporting.
The Sarbanes-Oxley Act of 2002 requires the company’s CEO and CFO to certify that the 10-K is both accurate
and complete. These are called Section 302 and Section 906 certifications. Details are discussed in Chapter 5 -
The Sarbanes-Oxley Act.
Segmental Reporting
Many U.S. companies operate in several different industries or in different geographic areas. When this occurs,
the difficulties related to financial statement analysis are compounded. Investors who must evaluate the relative
strengths and weaknesses of stock of a diversified company have a difficult task when analyzing such companies
which report only the aggregate of their operations. Thus, publicly held companies are required to report seg-
ment information/supplementary information provided in financial statements.
A segment must be reported if one or more of these conditions are satisfied:
1. Revenue is 10% or more of total revenue.
2. Operating income is 10% or more of the combined operating profit.
3. Identifiable assets are 10% or more of the total identifiable assets.
The factors to be taken into account when determining industry segments are:
• Nature of the market. Similarity exists in geographic markets serviced or types of customers,
• Nature of the product. Related products or services have similar purposes or end uses (e.g., similarity in
profit margins, risk, and growth),
• Nature of the production process. Homogeneity exists when there is interchangeable production of
sales facilities, labor force, equipment, or service groups.
Reportable segments are determined by:
1. Identifying specific products and services
2. Grouping those products and services by industry line into segments

94
3. Selecting material segments to the company as a whole
Information must be reported separately about an operating segment that reaches one of three quantitative
thresholds:
1. Its revenue (including sales to external customers and intersegment sales or transfers) is equal to at
least 10% of the combined revenue, internal and external, of all the enterprise's operating segments;
2. Its assets are equal to at least 10% of the combined assets of all operating segments; and
3. The absolute amount of its reported profit or loss is equal to at least 10% of the greater, in absolute
amount, of the combined reported profit of all operating segments that did not report a loss, or the
combined reported loss of all operating segments that did report a loss (profit or loss test).
A group of customers under common control must be regarded as a single customer in determining whether
10% or more of the revenue of an enterprise is derived from sales to any single customer. A parent company
and a subsidiary are under common control, and they should be regarded as a single customer.
The following information about geographic areas is reported if practicable:
• External revenues attributed to the home country
• External revenues attributed to all foreign countries
• Material external revenues attributed to an individual foreign country
• The basis for attributing revenues from external customers, and certain information about assets
• Useful segment information that may be disclosed includes sales, operating profit, total assets, fixed as-
sets, intangible assets, inventory, cost of sales, depreciation, and amortization.
Segment information that must be disclosed in financial statements includes an enterprise’s operations in dif-
ferent industries, foreign operations and export sales, and major customers. Detailed information must be dis-
closed relating to revenues; segment’s operating profit or loss, and identifiable assets along with additional in-
formation. Segment information is primarily a desegregation of the entity’s basic financial statements.
Publicly held companies must report (for each reportable segment of the entity) the following information:
• Revenues
• Operating profit or loss
• Identifiable assets
• Depreciation, depletion, and amortization expenses
• Capital expenditures
• Effects of accounting changes
• Equity in net income and net assets of equity method investees whose operations are vertically inte-
grated with the operations of the segment, as well as the geographic areas in which those vertically in-
tegrated equity method investees operate

95
The Failure of (or Late) Filing
Consequences of the Failure of Filing
In general, the failure by a company to file required periodic reports (e.g. Form 10-K) or a current report (Form
8-K) constitutes a violation of Section 13(a) or Section 15 of the Exchange Act and subjects the company to po-
tential liability including:
• The anti-fraud provisions
• Disclosure of material information or a material omission in connection with the purchase or sale of se-
curities
The SEC could initiate administrative proceedings against the late filer for revocation of its registration. Howev-
er, these proceedings are uncommon, and usually targeted at recurring and egregious violations.
Consequences of Late Filing
Companies could face severe consequences of late filings which may have an impact on an issuer’s ability to re-
main listed on the NYSE or the NASDAQ. In addition, they may affect a company’s ability to use a short-form reg-
istration statement on Form S-3 for both primary and secondary offerings and the company’s ability to maintain
Well Known Seasoned Issuer (WKSI) status. For example, if a company fails to file Form 10-Q on time or at all,
the company is no longer considered to have timely filed all of the Exchange Act reports. Form S-3 is one of the
required reports. If a company is not eligible to use a Form S-3 for a period of 12 months, the company would
have limited ability to conduct certain types of registered securities offerings.
Moreover, a company will lose its ability to file a Form S-8 until it files the late Form 10-K or Form 10-Q. Form S-8
is used when registering securities to be offered to employees pursuant to an employee benefit plan. The com-
pany will have restored its ability to use a Form S-8 once the periodic report is filed, even if it is late.
Company-specific consequences should also be considered. For example, a late filing could trigger an event of
default under the terms of debt instruments or violation of contractual covenants.
Can a Company Amend Its Periodic Reports?
A company may need to amend a filed periodic report to:
1. Provide restated financial statements and update any related disclosure resulting from a restatement of its
financial statements;
2. Provide information that was unknown at the time of the original filing;
3. Make correction of any omissions, errors, or misstatements; or
4. Revise the disclosed information based on SEC comments.
An amendment to Form 10-K can be used to correct material inaccuracies, misstatements or omissions subse-
quently discovered. The company cannot use later periodic reports such as Form 10-Q or Form 8-K filed after a
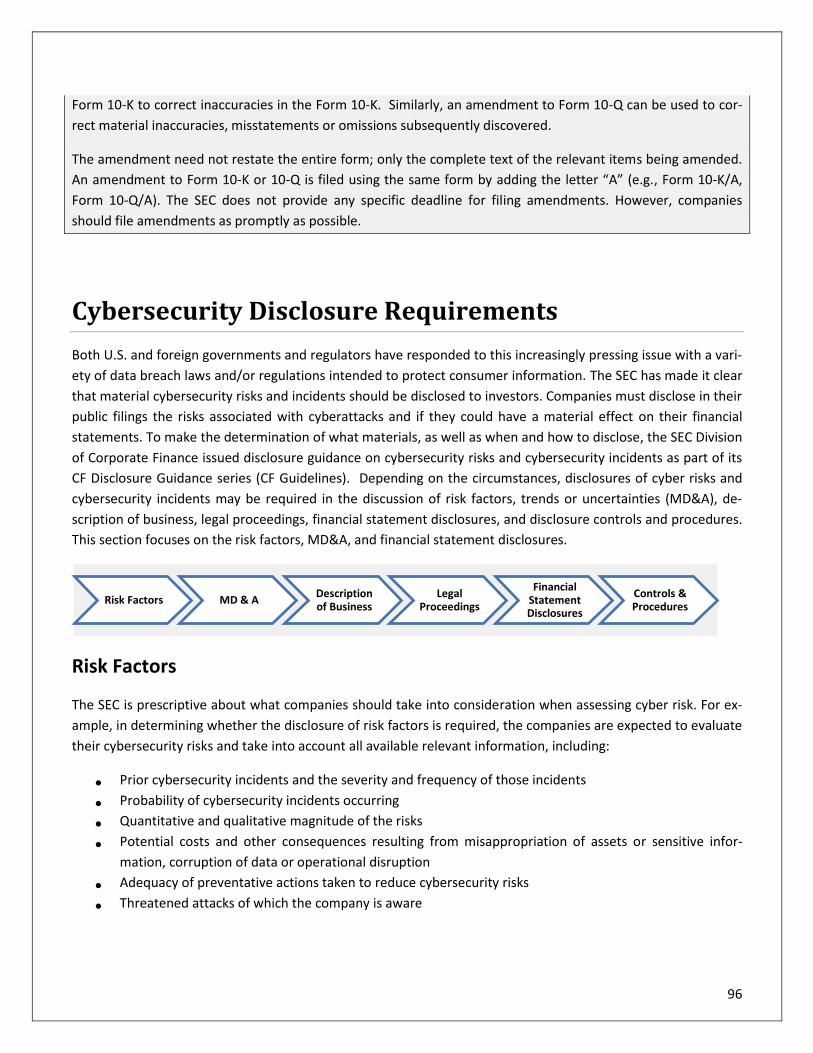
96
Form 10-K to correct inaccuracies in the Form 10-K. Similarly, an amendment to Form 10-Q can be used to cor-
rect material inaccuracies, misstatements or omissions subsequently discovered.
The amendment need not restate the entire form; only the complete text of the relevant items being amended.
An amendment to Form 10-K or 10-Q is filed using the same form by adding the letter “A” (e.g., Form 10-K/A,
Form 10-Q/A). The SEC does not provide any specific deadline for filing amendments. However, companies
should file amendments as promptly as possible.
Cybersecurity Disclosure Requirements
Both U.S. and foreign governments and regulators have responded to this increasingly pressing issue with a vari-
ety of data breach laws and/or regulations intended to protect consumer information. The SEC has made it clear
that material cybersecurity risks and incidents should be disclosed to investors. Companies must disclose in their
public filings the risks associated with cyberattacks and if they could have a material effect on their financial
statements. To make the determination of what materials, as well as when and how to disclose, the SEC Division
of Corporate Finance issued disclosure guidance on cybersecurity risks and cybersecurity incidents as part of its
CF Disclosure Guidance series (CF Guidelines). Depending on the circumstances, disclosures of cyber risks and
cybersecurity incidents may be required in the discussion of risk factors, trends or uncertainties (MD&A), de-
scription of business, legal proceedings, financial statement disclosures, and disclosure controls and procedures.
This section focuses on the risk factors, MD&A, and financial statement disclosures.
Risk Factors
The SEC is prescriptive about what companies should take into consideration when assessing cyber risk. For ex-
ample, in determining whether the disclosure of risk factors is required, the companies are expected to evaluate
their cybersecurity risks and take into account all available relevant information, including:
• Prior cybersecurity incidents and the severity and frequency of those incidents
• Probability of cybersecurity incidents occurring
• Quantitative and qualitative magnitude of the risks
• Potential costs and other consequences resulting from misappropriation of assets or sensitive infor-
mation, corruption of data or operational disruption
• Adequacy of preventative actions taken to reduce cybersecurity risks
• Threatened attacks of which the company is aware
Risk Factors MD & ADescription of Business
Legal Proceedings
Financial Statement Disclosures
Controls & Procedures

97
Cybersecurity risk disclosure must adequately describe the nature of the material risks and specify how each risk
affects the company consistent with the Regulation S-K Item 503(c). Companies should avoid generic risk factor
disclosure. Appropriate disclosure may include the following information:
1. Discussion of aspects of the company’s business or operations that give rise to material cybersecurity
risks and the potential costs and consequences
2. Description of outsourced functions with material risks and how those risks are addressed
3. Description of material cybersecurity incidents experienced in the aggregate or individually as well as
their costs and consequences
4. Risks related to cybersecurity incidents that may remain undetected for an extended period
5. Description of relevant insurance coverage
If a breach is deemed non-material by a company, the company may still receive a comment from the SEC asking
for an explanation of why it was not considered material. Examples of common SEC comments include:
• “Please include appropriate risk factor disclosure regarding the online nature of your business, with par-
ticular attention to the cyber-security issues and web server maintenance.”
• “Please expand your risk factor disclosure to describe the cybersecurity risks that you face or tell us why
you believe such disclosure is unnecessary.”
• “We note your disclosure regarding [a security breach]. In future filings please disclose in this section and
in the ‘Liquidity and Capital Resources’ section.”
Companies may consider the following best practices regarding risk factor disclosure such as:
• Disclosing any specific/material cybersecurity breaches that have occurred
• Explaining how the company has dealt with the breaches
• Listing the specific types of cybersecurity risks (e.g., viruses, intruders, operational disruption)
• Including cybersecurity risks under their own separate and stand-alone category heading
• Providing the specific reason(s) why cybersecurity risk could be material
• Including the potential consequences from a cybersecurity breach
• Indicate if the company has taken steps to handle cybersecurity breaches (e.g. insurance coverage)
It is important to know that the federal securities laws do NOT require disclosure that itself would compromise a
company’s cybersecurity. Instead, companies should provide sufficient information to allow investors to under-
stand the nature of the risks faced by the company, without exposing specific weaknesses.
Appendix A demonstrates the best practices by using FedEx Form 10-K.
MD&A
Companies should address cybersecurity risks and cybersecurity incidents in the MD&A section if the costs or
other consequences represent a material event, trend, or uncertainty that is reasonably likely to have a material
effect on the company’s operations, liquidity, or financial condition. For example, if material intellectual proper-
ty is stolen in a cyberattack, and the effects of the theft are reasonably likely to be material, the company should

98
describe the property that was stolen and the effect of the attack on its results of operations, liquidity, and fi-
nancial condition and whether the attack would cause reported financial information not to be indicative of fu-
ture operating results. If it is reasonably likely that that attack will lead to reduced revenues, an increase in cy-
bersecurity protection costs, including litigation. The company should discuss these possible outcomes, including
the amount and duration of the expected costs, if material.
The following exhibit presents an example of a company disclosure of its data breach representing a material
event from Target Corporation’s Form 10-K.
Exhibit 4-3: Disclose Data Breach Representing a Material Event - Management’s Discussion and Analysis
Other Performance Factors
Consolidated Selling, General and Administrative Expenses
In addition to segment selling, general and administrative expenses, we recorded certain other expenses. For
the three and six months ended August 1, 2015, these expenses included $11 million and $114 million, respec-
tively, of restructuring costs and $9 million and $12 million, respectively, of data breach- related costs. For the
three and six months ended August 2, 2014, these expenses included $111 million and $129 million, respective-
ly, of data breach-related costs (net of expected insurance proceeds), $16 million of impairments, and $13 mil-
lion of costs related to plans to convert existing co-branded REDcards to MasterCard co-branded chip-and-PIN
cards in 2015 to support the accelerated transition to chip-and-PIN-enabled REDcards.
Financial Statement Disclosures
Cybersecurity risks and cybersecurity incidents may have a broad impact on the financial statement, depending
on the nature and severity of the potential or actual incident. In general, financial statement disclosures in-
clude:
1. Costs incurred to prevent cybersecurity incidents
2. Costs incurred to mitigate damages from a cybersecurity incident
3. Losses from asserted and unasserted claims
4. Diminished future cash flows
5. Impairment of assets
This section summarizes the company’s obligations regarding cybersecurity incidents for financial statement dis-
closure.
Prior to a Cybersecurity Incident
Companies may incur substantial costs to prevent cybersecurity incidents. Accounting for the capitalization of
these costs is addressed by ASC 350-40, Internal-Use Software, to the extent that such costs are related to inter-
nal use software.

99
During and After a Cybersecurity Incident
Companies may seek to mitigate damages from a cybersecurity incident by providing customers with incentives
to maintain the business relationship. Companies should consider ASC 606-10, Revenue from Contracts with
Customers, to ensure appropriate recognition, measurement, and classification of these incentives.
Cybersecurity incidents may result in losses from asserted and un-asserted claims, including those related to
warranties, breach of contract, product recall and replacement, and indemnification of counterparty losses from
their remediation efforts. Companies should refer to ASC 450-20, Loss Contingencies, to determine when to
recognize a liability if those losses are probable and reasonably estimable.
Cybersecurity incidents may also diminish future cash flows, requiring consideration of impairment of certain
assets including goodwill, customer-related intangible assets, trademarks, patents, capitalized software or other
long-lived assets associated with hardware or software, and inventory. Companies may not immediately know
the impact of a cybersecurity incident and may be required to develop estimates to account for the various fi-
nancial implications. Examples of estimates that may be affected by cybersecurity incidents include:
• Estimates of warranty liability
• Allowances for product returns
• Capitalized software costs
• Inventory
• Litigation
• Deferred revenue
Appendix B presents an example of a financial statement disclosure related to a data breach from Target Corpo-
ration’s Form 10-K.
The SEC Disclosure Review Process
The Scope of Review
The Sarbanes-Oxley Act Section 408 Enhanced Review of Periodic Disclosures by Issuers requires the SEC to as-
sume some level of review of each reporting company at least once every three years. The SEC Division of Cor-
porate Finance (CF) selectively reviews public filings to monitor and enhance compliance with the applicable dis-
closure and accounting requirements. In addition, the SEC selectively reviews transactional filings, such as regis-
tration statements, when issuers engage in public offerings, business combination transactions, and proxy solici-
tations. Accordingly, the SEC may review a company more frequent than every three years if it files a registration
statement for an offering of securities, or if the SEC is monitoring compliance with a new or existing rule, or a
specific industry. For example, the SEC began reviewing the periodic reports of large financial institutions on an
ongoing basis following the 2008 financial crisis.

100
SOX Section 408 sets the following review criteria:
1. Issuers that have issued material restatements of financial results
2. Issuers that experience significant volatility in their stock price as compared to other issuers
3. Issuers with the largest market capitalization
4. Emerging companies with disparities in price to earnings ratios
5. Issuers whose operations significantly affect any material sector of the economy; and
6. Any other factors that the Commission may consider relevant
However, the SEC does not publicly disclose the criteria it uses in identifying companies and filing for review to
maintain the integrity of the selective review process. In FY 2015 and 2016, the CF conducted disclosure reviews
of over 5,000 companies each year both to monitor and to enhance compliance with disclosure and accounting
requirements. For example, fair value accounting is one of about 25 main topics targeted by the SEC in its disclo-
sure reviews, along with revenue recognition and impairments.
The extent of that review depends on many factors. The level of review may be:
• A full cover‐to‐cover review in which the SEC Staff will examine the entire filing for compliance with the
applicable requirements of the federal securities laws and regulations;
• A financial statement review in which the SEC Staff will examine the financial statements and related
disclosure, such as MD&A, for compliance with the applicable accounting standards and the disclosure
requirements of the federal securities laws and regulations; or
• A targeted issue review in which the SEC Staff will examine the filing for one or more specific items of
disclosure for compliance with the applicable accounting standards and the disclosure requirements of
the federal securities laws and regulations
CF focuses its review resources on disclosures that appear to be inconsistent with SEC rules or applicable ac-
counting standards, or that appear to be materially deficient in their explanation or clarity. It is important to
know that CF’s review is not a guarantee that company disclosures are complete and accurate, as responsibility
for complete and accurate disclosure lies with companies and others involved in the preparation of company
filings.

101
The Review Process
The following figure from a 2016 U.S. Government Accountability Office (GAO) report on supervisory internal
controls depicts CF’s disclosure review and comment letter process.
SEC Comment Letters
Every public company has its filings with the SEC reviewed at least once every three years. Each review includes
an Examiner and a Reviewer. The Examiner conducts an initial review of the disclosure and may propose com-
ments to issue to the company. Reviews are conducted by asking questions that a potential investor might ask.
The Reviewer approves all proposed comments. The SEC completes many disclosure reviews without issuing
comment letters. However, when the SEC considers that a company can improve or enhance its filing for com-
pliance with the disclosure requirements, it issues a comment letter. According to EY, the most frequent com-
ment areas (top 10 ranking) in 2017 include:
1. Non-GAAP financial measures
2. MD&A topics (e.g., results of operations, critical accounting policies and estimates, liquidity matters)
3. Fair value measurements
4. Segment reporting
5. Revenue recognition
6. Intangible assets and goodwill
7. Income taxes
8. State sponsors of terrorism
9. Acquisitions and business combinations
10. Executive compensation

102
The Non-GAAP financial measures continue to be a major focus area for the SEC Staff. According to the Compli-
ance and Disclosure Interpretations, a non-GAAP measure may be considered misleading if it:
• Is presented inconsistently in different fiscal periods or if similar gains and losses are treated differently
• Excludes recurring cash operating expenses from performance measures, or
• Tailors GAAP recognition and measurement principles, such as accelerating deferred revenue
The comment letter may request the company to provide:
• Specific information for clarification or to elicit better compliance with applicable requirements
• Additional information to support the company’s conclusions
• Additional disclosures about the facts and circumstances that support significant judgments
• Amendments to the disclosures
EY suggests that when disclosing non-GAAP financial measures, companies should consider the following areas
of frequent SEC staff comment:
1. The labeling of a non-GAAP financial measure should clearly describe the nature of any adjustments to a
standard measure and should not imply that it is an unadjusted measure. For example, a measure that
includes adjustments to the standard definition of EBITDA should not be labeled “EBITDA.”
2. Adjustments to non-GAAP measures that are labeled as nonrecurring should only comprise items that
are infrequent or unusual in nature, as required by Item 10(e)(1)(ii)(B) of Regulation S-K. If the adjusted
item has occurred within the past two years or is likely to recur within two years, it should not be char-
acterized as nonrecurring.
The range of possible comments is broad and depends on the issues that arise in a particular disclosure review.
Examples of SEC comments include:
Example 4-1: Inconsistent Presentation
We note that you disclose the non-GAAP measure “Adjusted earnings,” which excludes pension settlement
charges, merger and restructuring charges and abandonment and impairment charges. Considering you have
not provided any adjustments to exclude net gains on asset sales, please advise us how you have considered
Question 100.03 of the updated C&DI’s issued on 17 May 2016.
Example 4-2: Exclusion of Normal, Recurring Cash Operating Expenses
We note several items in the reconciliation of EBITDA to adjusted EBITDA removed recurring cash operating ex-
penses, such as professional fees and management fees and expenses. Considering these adjustments include
recurring cash operating expenses, tell us how your presentation complies with the May 17, 2016, updated
C&DI’s on Non-GAAP financial measures.

103
Example 4-3: Tailoring GAAP Recognition and Measurement Principles
We note that your adjusted EBITDA calculation adjusts for your “proportionate share from equity accounted
investments.” Your proportionate presentation may be inconsistent with Question 100.04 of the updated C&DI’s
issued on May 17, 2016. Please review this guidance when preparing future filings.
Example 4-4: Repetitive Disclosure about Critical Accounting Estimates in MD&A
The disclosure of critical accounting policies within MD&A appears to duplicate your accounting policy disclosure
in the notes to your financial statements. Please modify the MD&A disclosure to address the specific methods,
assumptions and estimates used in your critical accounting measurements. If you prefer to include this disclo-
sure elsewhere in your filing, such as an expanded disclosure in the notes to your financial statements, please
consider including a simple cross-reference within your MD&A to avoid repetition.
Source: EY, SEC Comments and Trends, 2017
Response to Comments
When a company receives a comment letter, it is generally expected to respond to each comment. If necessary,
the company will amend its filing. The comment and response process will continue until the SEC Staff and the
company resolve the comments. A company’s explanation or analysis of an issue will often resolve a comment.
The majority of reviews are closed after one or two comment letters, which indicates that a well-organized pro-
cess for responding to SEC comments can minimize the amount of back and forth with the SEC Staff. According
to EY, SEC Comments and Trends, when addressing the SEC comment letter, companies may consider the follow-
ing best practices:
• Responses to each comment should focus on the question(s) asked by the SEC Staff. The responses
should refer to authoritative literature wherever possible.
• Responses should address the company’s unique circumstances. Although companies may consider re-
sponse letters from other companies as a resource, companies should not just copy other companies’
responses to similar comments.
• Companies should file all response letters on EDGAR redacting any specific information for which they
are seeking confidential treatment.
• Companies should indicate specific revisions made as a result of the comment letters. If additional dis-
closure will be included in a future filing, it may be helpful for the company to provide the proposed lan-
guage in their response letter to avoid an additional comment once the disclosure is filed.
• Companies should seek the input of all appropriate internal personnel and professional advisers (e.g.,
legal counsel, independent auditors) so that they fully respond to the comment letter in a complete and
accurate manner.
An Accelerated Filer, a Large Accelerated Filer or a Well-Known Seasoned Issuer (WKSI) disclosure is required to
disclose the SEC comments (related to the review of Exchange Act reports) in its Form 10-K or Form 20-F that:
• The company believes are material

104
• Were issued more than 180 days before the end of the fiscal year covered by Form 10-K
• Remain unresolved as of the date of the filing of the Form 10-K or Form 20-F
To increase the transparency of the review process, when the SEC completes a disclosure review, it publicly re-
leases its comment letters and company responses to those letters on the SEC’s EDGAR system no earlier than
20 business days after the review’s completion. However, the SEC redacts any information subject to a compa-
ny’s Rule 83 confidentiality request without evaluating the substance of that request. However, when a request
is made for the information under the Freedom of Information Act, the SEC Staff would undertake any substan-
tive review of the confidential treatment request.

105
Chapter 4 Review Questions
1. Which of the following is TRUE for the content of the Management's Discussion and Analysis (MD&A) sec-
tion of an annual report?
A. It is mandated by pronouncements of the Financial Accounting Standards Board (FASB).
B. It is mandated by regulations of the Securities and Exchange Commission (SEC).
C. It is reviewed by independent auditors.
D. It is mandated by regulations of the Internal Revenue Service (IRS).
2. The Securities and Exchange Commission (SEC) continues to encourage management to provide forward-
looking information to users of financial statements. What does the safe harbor rule do?
A. It protects a company that may present an erroneous forecast as long as the forecast is prepared on a
reasonable basis and in good faith.
B. It allows injured users of the forecasted information to sue the company for damages but protects man-
agement from personal liability.
C. It delays disclosure of such forward-looking information until all major uncertainties have been resolved.
D. It bars competition from using the information to gain a competitive advantage.
3. For each of the following groups of customers, purchases amounted to 10% or more of the revenue of a
publicly held company. For which of these groups must the company disclose information about major cus-
tomers?
A. Federal governmental agencies, 6%; state governmental agencies, 4%
B. French governmental agencies, 6%; German governmental agencies, 4%
C. Parent company, 6%; subsidiary of parent company, 4%
D. Federal governmental agencies, 6%; foreign governmental agencies, 4%
4. Which of the following is TRUE about the SEC registrants’ obligations for disclosures of cybersecurity risks
and cyber incidents?
A. Registrants are required to address cyber incidents in their Form 10-K and Form 10-Q only if the costs
represent a material event that is certain to have a material effect on their financial condition.
B. Registrants are required to disclose the risk of cyber incidents in Regulation S-K if these issues make an
investment in the company risky.
C. Registrants are required to disclose a cybersecurity incident only if they immediately know the impact of
such incident.
D. Registrants only need to disclose cyber incident information when the material legal proceeding is set-
tled.

106
Chapter 5: The Sarbanes-Oxley Act
Learning Objectives:
After completing this section, you will be able to:
• Recognize the major features of the Sarbanes-Oxley (SOX) Act of 2002 Corporate Responsibility Law
• Identify factors in assessing the maturity level of a company’s internal control structure
• Recognize the alternative Sarbanes-Oxley compliance structures
The Role of the CFO
The role of the CFO has changed from primarily an accountant and controller to a “business partner” and “strat-
egist.” Many Fortune 1000 companies now view their financial operation as a “strategic business partner”, in-
volving the CFO in top-level decision-making as never before. Due to new pressures on CFOs in their emerging
role as strategic partners, the CFOs and finance teams can lose their objectivity and independence. This shift, at
times, might have prompted the CFOs to use aggressive accounting and reporting practices.
The Public Company Accounting Reform and Investor Protection Act of 2002, commonly called Sarbanes-Oxley,
was enacted in July 2002 largely in response to major corporation and accounting scandals involving several
prominent companies in the U.S., such as Enron. These scandals resulted in an unprecedented lack of confi-
dence in the financial markets and a loss of public trust in corporate accounting and reporting practices. The Act
has brought the most extensive reform that the U.S. financial markets have seen since the enactment of the Se-
curities Act of 1933 and the Securities Exchange Act of 1934. The Sarbanes-Oxley Act (SOX) of 2002 set new or
enhanced standards for all U.S. public company boards, management and public accounting firms. For example,
CEOs and CFOs:
• Must certify in every annual report that they have reviewed the report and that it does not contain un-
true statements or omissions of material facts
• Are responsible for establishing and maintaining internal controls to ensure they are notified of material
information
Not surprisingly, given that the Act has been in effect for over a decade (while being attentive to costs), a major-
ity of organizations with mature SOX compliance processes have improved their internal control over financial
reporting. Most highly effective CFOs are leveraging their SOX compliance efforts to drive continuous improve-

107
ment of their business processes. They emphasize the importance of controls and risk management in their re-
sponsibilities. This includes an ongoing attention to maintaining a strong controls environment and financial re-
porting process.
The post-Sarbanes-Oxley (SOX) and corruption era has forced compliance front and center. As a CFO in this era,
compliance has to be a top priority. CFOs cannot afford to de-emphasize it for growth or driving profitability; it
has to maintain an equal seat at the table.
This chapter covers the SEC periodic reporting requirements, cybersecurity disclosure obligations, and the SEC
review process. Topics surrounding the SOX Act include Section 404, and Sections 302 and 906 which are also
discussed. For example, it addresses the financial reporting responsibilities of CFOs, including the types of re-
ports that must be prepared, and insights into building an ongoing SOX compliance structures.
SOX Section 404 − Management Assessment of Internal
Controls
Evaluation of Control Deficiency
In the past, a company's internal controls were considered in the context of planning the audit but were not re-
quired to be reported publicly, except in response to the SEC's Form 8-K requirements when related to a change
in auditor. The SOX audit and reporting requirements have drastically changed the situation and have brought
the concept of internal control over financial reporting to the forefront for audit committees, management, au-
ditors, and users of financial statements. Companies may have control deficiencies in the design of a control or
in its operation:
• Design — A deficiency in design exists when a necessary control is missing or is not designed in a man-
ner that enables the control objective to be met.
• Operating Effectiveness — A deficiency in operating effectiveness exists when a properly designed con-
trol is not operating as intended or when the person performing the control lacks the authority or quali-
fications to do so effectively.
Deficiencies in internal control over financial reporting may be assessed as control deficiencies, significant defi-
ciencies, or material weaknesses.
Control Deficiency Exists when the design or operation of a control does not allow management or employees, in the normal course of performing their assigned functions, to prevent or detect misstatements on a timely basis.
Significant Deficiency A deficiency, or a combination of deficiencies, in internal control that is less severe than a material weakness, yet important enough to merit attention by

108
those charged with governance.
Material Weakness
A significant deficiency or combination of significant deficiencies that results in more than a remote likelihood that a material misstatement of the annual or interim financial statements will not be prevented or detected. Material weaknesses existing at the fiscal year-end assessment date will be reported publicly.
The SEC provided the following examples of control deficiencies that may be considered at least a significant
deficiency in internal control over financial reporting:
• Controls over the selection and application of accounting policies that are in conformity with U.S. GAAP
• Anti-fraud programs and controls
• Controls over significant routine and nonsystematic transactions
• Controls over the period-end financial reporting process
Management and the external auditor are required to report significant deficiencies to the audit committee. In
addition, management is required to report significant deficiencies to the external auditor.
Significant judgment goes into evaluating whether deficiencies in controls rise to the level of a material weak-
ness. Management and the auditor must consider the following factors when evaluating control deficiencies:
1. Likelihood of a misstatement — Including consideration of factors such as susceptibility to fraud; the
cause and frequency of exceptions in the operating effectiveness of the control; possibility of future
consequences; the nature of the affected accounts and disclosures; the subjectivity, complexity, or ex-
tent of judgment required to determine the amount involved; the interaction or relationship of the
control with other controls; and the interaction of deficiencies.
2. Related magnitude of a potential misstatement — Including the financial statement amounts or total
of transactions exposed to the deficiency and/or the volume of activity in the account: balance or class
of transactions exposed to the deficiency in the current period or expected in future periods.
Exhibit 5-1 illustrates these concepts:
Exhibit 5-1
Internal Control Deficiencies
Type Likelihood Magnitude
Control Deficiency Remote and/or Inconsequential
Significant Deficiency More than Remote and More than inconsequential (but less than materi-
al)
Material Weakness More than Remote and Material to financial statements
The SEC and Public Company Accounting Oversight Board (PCAOB) listed the following indicators of control defi-
ciencies that are regarded as indicators of material weaknesses in internal control:

109
1. Identification of fraud, whether or not material, on the part of senior management;
2. Restatement of previously issued financial statements to reflect the correction of a material misstate-
ment;
3. Identification of a material misstatement in financial statement in the current period in circumstances
that indicate the misstatement would not have been detected by the company’s internal control over fi-
nancial reporting;
4. Ineffective oversight of the company’s external financial reporting and internal control over financial re-
porting by the company’s audit committee;
5. The internal audit function or the risk assessment function is ineffective at a company needing such a
function to have effective monitoring and risk assessment;
6. Significant deficiencies that have been identified and remain unaddressed after some reasonable period
of time.
Appendix C lists examples of circumstances that may be deficiencies, significant deficiencies, or material weak-
nesses related to the design and operations of controls.
How Are Compensating Controls Considered?
The SEC defines compensating controls as follows:
“Controls that serve to accomplish the objective of another control that did not function properly, helping to re-
duce risk to an acceptable level. To have a mitigating effect, the compensating control should operate as a level
of precision that would prevent or detect a misstatement that was material.”
Management should evaluate the effect of compensating controls when evaluating whether a deficiency, or a
combination of deficiencies, is a material weakness. For this purpose, the compensating controls must be oper-
ating effectively. The SEC states that compensating controls are not considered when determining whether a
control deficiency exists. Control deficiency must be considered individually and in isolation of the performance
of other controls. Compensating controls are appropriately considered when evaluating whether a significant
deficiency or a material weakness exists.
Examples of Significant Deficiencies and Material Weaknesses
If a material weakness exists as of the assessment date, management is required to conclude that internal con-
trol over financial reporting is not effective and to disclose all material weaknesses that may have been identi-
fied. The SEC Chief Accountant has stated publicly that he expects management's report to disclose the nature
of any material weakness in sufficient detail to enable investors and other financial statement users to under-
stand the weakness and evaluate the circumstances underlying it. The SEC provided the following scenarios to
illustrate how to evaluate the significance of internal control deficiencies in various situations.

110
Scenario A − Significant Deficiency
The company uses a standard sales contract for most transactions. Individual sales transactions are not material
to the entity. Sales personnel are allowed to modify sales contract terms. The company's accounting function
reviews significant or unusual modifications to the sales contract terms but does not review changes in the
standard shipping terms. The changes in the standard shipping terms could require a delay in the timing of rev-
enue recognition. Management reviews gross margins on a monthly basis and investigates any significant or
unusual relationships. In addition, management reviews the reasonableness of inventory levels at the end of
each accounting period. The entity has experienced limited situations in which revenue has been inappropriate-
ly recorded in advance of shipment, but amounts have not been material.
Based only on these facts, the auditor should determine that this deficiency represents a significant deficiency
for the following reasons:
- The magnitude of a financial statement misstatement resulting from this deficiency would reasonably be ex-
pected to be more than inconsequential, but less than material, because individual sales transactions are not
material and the compensating detective controls operating monthly and at the end of each financial reporting
period should reduce the likelihood of a material misstatement going undetected.
- The risk of material misstatement is limited to revenue recognition errors related to shipping terms as op-
posed to broader sources of error in revenue recognition. However, the compensating detective controls are
only designed to detect material misstatements. The controls do not effectively address the detection of mis-
statements that are more than inconsequential but less than material, as evidenced by situations in which
transactions that were not material were improperly recorded. Therefore, there is a more than remote likeli-
hood that a misstatement that is more than inconsequential but less than material could occur.
Scenario B − Material Weakness
The company has a standard sales contract, but sales personnel frequently modify the terms of the contract.
Sales personnel frequently grant unauthorized and unrecorded sales discounts to customers without the
knowledge of the accounting department. These amounts are deducted by customers in paying their invoices
and are recorded as outstanding balances on the accounts receivable aging. Although these amounts are indi-
vidually insignificant, they are material in the aggregate and have occurred consistently over the past few years.
Based on only these facts, the auditor should determine that this deficiency represents a material weakness for
the following reasons:
- The magnitude of a financial statement misstatement resulting from this deficiency would reasonably be ex-
pected to be material, because the frequency of occurrence allows insignificant amounts to become material in
the aggregate.
- The likelihood of material misstatement of the financial statements resulting from this internal control defi-
ciency is more than remote (even assuming that the amounts were fully reserved for in the company's allow-
ance for uncollectible accounts) due to the likelihood of material misstatement of the gross accounts receivable
balance. Therefore, this internal control deficiency meets the definition of a material weakness.
111
Scenario C − Identification of Several Deficiencies
During its assessment of internal control over financial reporting, management identified the following deficien-
cies. Based on the context in which the deficiencies occur, management and the auditor agree that these defi-
ciencies individually represent significant deficiencies:
1. Inadequate segregation of duties over certain information system access controls.
2. Several instances of transactions that were not properly recorded in subsidiary ledgers; transactions were not
material, either individually or in the aggregate.
3. A lack of timely reconciliations of the account balances affected by the improperly recorded transactions.
Based only on these facts, the auditor should determine that the combination of these significant deficiencies
represents a material weakness for the following reasons:
- Individually, these deficiencies were evaluated as representing a more than remote likelihood that a mis-
statement that is more than inconsequential, but less than material, could occur. However, each of these signif-
icant deficiencies affects the same set of accounts.
- Taken together, these significant deficiencies represent a more than remote likelihood that a material mis-
statement could occur and not be prevented or detected. Therefore, in combination, these significant deficien-
cies represent a material weakness.
Management Internal Control Report
SOX 404 mandates that both management and the independent auditor publicly report any material weakness-
es in internal control over financial reporting that exist as of the fiscal year-end assessment date. These reports
must be included in the company's annual report filed with the SEC. Neither the SEC nor the PCAOB has issued a
standard or illustrative management report on internal control over financial reporting; thus, there may be dif-
ferences in the nature and extent of the information companies provide. Companies may want to consult with
legal counsel on these matters.
At a minimum, management's report on internal control over financial reporting should include the following
information:
• Statement of management's responsibility for establishing and maintaining adequate internal control
over financial reporting.
• Statement identifying the framework used by management to evaluate the effectiveness of internal
control over financial reporting.
• Management's assessment of the effectiveness of the company's internal control over financial report-
ing as of the end of the company's most recent fiscal year, including an explicit statement as to whether
that internal control is effective and disclosing any material weaknesses identified by management in
that control.

112
• Statement that the registered public accounting firm that audited the financial statements included in
the annual report has issued an attestation report on management's internal control assessment.
Management's report must indicate that internal control over financial reporting is either:
• Effective - Internal control over financial reporting is effective (i.e. no material weaknesses in internal
control over financial reporting existed as of the assessment date); or
• Ineffective - Internal control is not effective because one or more material weaknesses existed as of
management's assessment date.
Management is required to state whether or not the company's internal control over financial reporting is effec-
tive. A negative assurance statement, such as "nothing has come to management's attention to suggest internal
control is ineffective" is not acceptable.
The following exhibit presents an example of a management’s report on internal control over financial reporting
from Hertz Global Holdings Inc.’s Form 10-K.
Exhibit 5-2: Hertz Global Holdings, Inc. − Controls and Procedures
Management’s Report on Internal Control over Financial Reporting
Management is responsible for establishing and maintaining adequate internal control over financial reporting,
as such term is defined in Exchange Act Rule 13a-15(f) and 15d-15(f).
A material weakness is a deficiency, or a combination of deficiencies, in internal control over financial reporting,
such that there is a reasonable possibility that a material misstatement of our annual or interim financial state-
ments will not be prevented or detected on a timely basis. Because of its inherent limitations, internal control
over financial reporting may not prevent or detect misstatements. Also, projections of any evaluation of effec-
tiveness to future periods are subject to the risk that controls may become inadequate because of changes in
conditions, or that the degree of compliance with the policies or procedures may deteriorate.
Management, including our new Chief Executive Officer and our Chief Financial Officer, assessed the effective-
ness of our internal control over financial reporting as of December 31, 2014. In making this assessment, man-
agement used the criteria set forth by the Committee of Sponsoring Organizations of the Treadway Commission
(“COSO”) in Internal Control - Integrated Framework (2013). Based on this assessment, management has con-
cluded that we did not maintain effective internal control over financial reporting as of December 31, 2014 due
to the fact that there are material weaknesses in our internal control over financial reporting as discussed be-
low.
Management may not express a qualified conclusion, such as stating that internal control is effective except to
the extent certain problems have been identified. If management is unable to assess certain aspects of internal
control that are material to overall control effectiveness, management must conclude that internal control over
financial reporting is ineffective. Although management cannot issue a report with a scope limitation, under
specific conditions newly acquired businesses or certain other consolidated entities may be excluded from the
assessment.

113
What Public Companies Are NOT Required to Have an Internal Control over Financial Reporting Audit?
In general, large public companies that file annual reports with the SEC are required to include in their annual
report an opinion from the company’s financial statement auditor on the effectiveness of the company’s ICFR.
Several types of companies, however, are exempt from this requirement. These exempt companies include:
1. Investment companies. Mutual funds, and other types of investment companies, are essentially pools of
securities. Such funds do not themselves engage in any business activities.
2. Non-accelerated filers. Companies that file reports with the SEC, but have a public float (that is, securities
available for public trading) of less than $75 million are referred to as non-accelerated filers because they
are not subject to the same filing deadlines as larger (accelerated) filers.
3. Emerging growth companies. During the five years following its first registered public sale of common
stock, a company that has total annual revenue of less than $1 billion is an emerging growth company
(“EGC”). Such a company loses its EGC status if it becomes a “large accelerated filer” (generally this requires
an aggregate worldwide public float of at least $700 million) or if it issues more than $1 billion of noncon-
vertible debt in a three-year period.
Source: Center for Audit Quality, Guide to Internal Control Over Financial Reporting, 2013
Assessment of Process Maturity for Internal Control over Financial Report-
ing
Many factors need to be considered when assessing the completeness of coverage and current maturity level of
a company’s internal control structure for its financial reporting process. According to Protiviti, there are five
maturity levels that a company’s internal controls framework can be categorized into, each with unique charac-
teristics.
The following table lists details of each level to help CFOs evaluate the sufficiency of a company’s internal con-
trols in a given area with Section 404 implication.
Initial Repeatable Defined Managed Optimizing

114
Capability
Level Capability Description Capability Attributes Section 404 Implications
Initial
Ad Hoc/Chaotic
• Control is not a priority
• Unstable environment
leads to dependency on
heroics
• Reliance on individual
initiative
• “Just do it”
• Ad hoc disclosure activ-
ities
• Policies not articulated
• Few process activities
are defined
• Institutional capability
lacking
• Overemphasis on de-
tective controls
• Controls are not period-
ically evaluated for de-
ficiencies
• Success depends on
manual efforts and val-
idation by seasoned
managers
• Gaps result when key
people leave
Repeatable
Intuitive
• Process established and
repeating; reliance on
people continues
• Controls documentation
lacking
• Common control
framework
• Increased controls
awareness
• Basic policies and con-
trol processes estab-
lished
• Process activities are
repeating but not nec-
essarily documented
• Quality people assigned
to support control activ-
ities
• Some control gaps iden-
tified and fixed
• Communication is lack-
ing
• Limited monitoring con-
trols and activities
• Control structure still
not sustainable
Defined
Qualitative/Quantitative
• Policies, process and
standards defined and
institutionalized
• “Chain of certification”
• Internal control uni-
form across the entity’s
processes
• Transaction flows doc-
umented
• Risk of fraud, errors
and omissions sourced
• Control processes for
mitigating risk better
documented and inte-
grated
• All groups accountable
to use organization’s
control standards
• Remaining known gaps
closed
• Control reports not very
robust
• Assurance lacking that
all deviations from con-
trol standards detected

115
Managed
Quantitative
• Risks managed quantita-
tively enterprise-wide
• “Chain of accountability”
• Control process per-
formance standards es-
tablished and managed
• Rigorous estimation
methodologies and
analysis
• Process risks are man-
aged quantitatively and
aggregated at corpo-
rate level
• Process-based self-
assessment applied
• Controls effectiveness
continuously assessed
and validated
• Process owners report
to management
• Internal audit plans
aligned
• Entity-level analytics
and monitoring controls
emerging
• Primary effort directed
to high-risk areas
Optimizing
Continuous Improvement
• Continuously improving
controls enterprise-wide
• Best practices identi-
fied and shared
• World-class financial
reporting processes
• Organized efforts to
remove inefficiency
• External and internal
change monitored for
impact on control
structure
• Internal controls − Inte-
grated framework fully
implemented
• Entity-level analytics
fully operational
• Faster decisions on im-
proving controls
• Controls preventive and
systems-based
Source: Protiviti, Guide to the Sarbanes-Oxley Act: Internal Control Reporting Requirements, 2007
At the Initial State, there is a general lack of policies and formal processes since control is fragmented. There is
not much accountability at this state due to the absence of a clearly designated owner of a risk. The company
highly depends on its people. Thus, the company has difficulty replicating the procedures if any one of its key
people leaves. This stage is not sustainable because of the high potential for error and significant inefficiencies
with high costs.
At the Repeatable State, although the company’s capabilities are improved (e.g., basic policies and control, in-
creased controls awareness), accountability is an issue since reporting is not rigorous enough to hold people ac-
countable for results. However, the increased process discipline and established guidelines make the “repeti-
tion”. In general, this state is still considered high cost because of an over-reliance on people and lack of process
documentation.
At the Defined State, processes and transaction flows are documented, and the key controls are identified.
Known control gaps are closed. However, there is no assurance that all existing gaps are identified since process
owners are not self-assessing their processes against established management control standards. A disclosure
creation process is documented and implemented. Controls awareness and an increased focus on improving
efficiency are established.

116
At the Managed State, quantitative performance measures provide management with a basis for determining
whether mitigating controls are functioning as intended. For example, the operating effectiveness of control
activities is assessed on a quarterly basis. Process owners self-assess the controls and report the results to man-
agement. Internal audit plans are aligned with management expectations. The appropriate efficiencies are driv-
en into the processes.
At the Optimizing State, the entire company is focused on continuous improvements as organized efforts are
made to remove inefficiencies with formal cost/benefit analysis. Best practice are identified and shared across
the company. Continuing self-assessments result in continued improvements in the control structure. Process
owners apply technology to maintain the documentation of control policies, processes, and reports. The compa-
ny fully aligns its policies, processes, people, technology and knowledge to achieve fair and transparent report-
ing. This stage achieves the most ongoing efficiencies in the design and operation of the process.
Companies can use this process maturity continuum to identify the gaps based on the level of capability man-
agement desires to achieve. Then, management is able to decide where on the continuum the company needs
to be. For example, when the financial reporting process is at the Defined State, management needs to decide at
what state they want this process to be, and by when.
SOX Section 302 − Corporate Responsibility for Finan-
cial Reports
Section 302(a) requires a company's CEO and CFO to certify each quarterly and annual report. They are required
to certify that the financial statements and other financial information included in the report are fairly present-
ed in all material respects. The officers must also state that the report does not contain any untrue statement of
material fact or omit to state a material fact. In addition, the certifying officers must state that the company has
established and maintained "disclosure controls and procedures" sufficient to ensure that the financial and non-
financial information required to be disclosed in SEC reports is recorded, processed, summarized and reported
within the specified time periods.
Disclosure controls and procedures typically include, but are broader than, internal control over financial report-
ing. For instance, disclosure controls extend to controls over disclosure included in SEC annual and interim re-
ports outside the financial statements. They also encompass controls to monitor compliance with laws and regu-
lations, other than those that directly affect the financial statements.
After the company files its first annual report pursuant to Section 404, Section 302 requires the certifying offic-
ers to state that they are responsible for establishing and maintaining internal control over financial reporting,
and that such internal control is designed to provide reasonable assurance as to the reliability of financial re-
porting and the preparation of financial statements in accordance with U.S. GAAP. Furthermore, they must dis-
close any change in the company's internal control over financial reporting during the most recent quarter that
has materially affected, or is reasonably likely to materially affect, the company's internal control.

117
As part of the certification, the CEO and CFO must also indicate that they have disclosed to the auditors and au-
dit committee of the company, all significant deficiencies and material weaknesses in internal control and any
fraud that involves management or other employees who have a significant role in internal control.
SOX Section 906 − Corporate Responsibility for Finan-
cial Reports
Section 906 requires the CEO and the CFO to certify each periodic report that includes financial statements. The
certification, which is separate from the Section 302 certification, may state that the periodic report fully com-
plies with the requirements of the Securities Exchange Act of 1934 and that "information contained in the peri-
odic report fairly presents, in all material respects, the financial condition and results of operations of the issu-
er."
Section 906 provides for criminal penalties for an officer who provides the certification knowing it to be untrue,
with harsher penalties for willful violations. Section 906 certifications may be "furnished," versus filed, as an ex-
hibit to annual and quarterly SEC reports. As furnished information, the Section 906 certification is not subject to
the civil liability provisions of Section 18 of the Securities Exchange Act of 1934, and will not be incorporated by
reference into registration statements unless the company expressly specifies otherwise.
The following table summarizes the key provisions of Section 302, Section 404, and Section 906:
Key Requirement Implication
302 CEO and CFO certification of
periodic SEC filings
Quarterly and
Annual
Requires certification of the fairness of the financial
statements and the operating effectiveness of disclo-
sure controls and procedures
404 Management’s assessments
of internal controls with auditor
attestation
Annual
Requires annual assessment and reporting by both
management and the auditor on the effectiveness of
internal control over financing reporting
906 Financial reporting certifica-
tion and criminal penalties
Quarterly and
Annual
In all SEC reports that include financial statements, re-
quires the CEO and CFO to certify the fairness of the
financial statements and the report’s compliance with
the requirements of the Security Exchange Act
Appendix D is the list of questions that need to be answered in order to gauge a company's compliance with the
SOX Act.

118
Alternative Sarbanes-Oxley Compliance Structures
Certifying officers (e.g., CEO, CFO) need an organizational structure that facilitates ongoing compliance with Sec-
tions 302 and 404. Such a structure usually emphasizes the internal audit function, a group of risk control spe-
cialists, or both.
For example, when a company goes through many changes, its internal audit function may not be conducive to
assist the process owners in evaluating changes, documenting controls, or testing controls operation. In this
case, certifying officers may consider creating a risk control group function or risk control specialists. The risk
control group, an independent unit, does not perform processes and carry out controls. It usually reports to the
CFO or the CRO (chief risk officer).
When not much change is expected, internal audit function can be deployed to assist the process owners. How-
ever, if it is desired to create risk control specialists, such specialists may be a separate division within the inter-
nal audit function, reporting to CAE (chief audit executive), CFO, or risk management. Risk control specialists
play a key role in the ongoing compliance structure through their knowledge of risks, SOX requirements, and
business processes. Examples of duties of risk control specialists include:
• Ensuring consistent compliance enterprise-wide
• Assessing the risk at critical interface points between business functions
• Independent testing of controls
Protiviti, Guide to the Sarbanes-Oxley Act: Internal Control Reporting Requirements, suggests the following three
organizational structures that facilitate ongoing compliance with Sections 404 and 302:

119
Exhibit 5-3
Alternative Sarbanes-Oxley Compliance Structures
Traditional Internal Audit Independent Risk Control Group
Board
Certifying
Officers
Business
Unit Leaders
Process
Owners
Audit
Committee
Internal
Audit
Board
Certifying
Officers
Business
Unit Leaders
Process
Owners
Audit
Committee
Internal
Audit
Risk Control
Group
Report to:
- Risk management
- Compliance management
- CFO
- Internal Audit Director
Board
Certifying
Officers
Embedded Risk Control Special-
ists
Business
Unit Leaders
Process
Owners
Source: Protiviti, Guide to the Sarbanes-Oxley Act:
Internal Control Reporting Requirements
Audit
Committee
Internal
Audit
Business Unit Risk
Control Specialists

120
The following table lists the descriptions and advantages for each structure.
Structure Description Advantages
Traditional Internal
Audit
• Internal audit tests
• Internal audit consults on
control environment when-
ever possible
• Internal audit focused on finan-
cial reporting controls
• Least amount of internal
change from as historical per-
spective
Independent Risk
Control Group
• Risk control group:
- Coaches process owners
- Assists with remediation
- Tests controls
- May exist with or without
an IA function
• IA independently assesses
management’s compliance
process
• Consolidated team of risk spe-
cialist promotes consistency of
control structure
• Maximize appearance of IA ob-
jectivity to increase external
auditor reliance
Embedded Risk Con-
trol Specialist
• Risk control specialist:
- Are embedded within
business units
- Work directly with pro-
cess owners on control
environment
- Perform testing
• IA independently assesses
management’s compliance
process
• Process owners supported
close to the source
• Maximize appearance of IA ob-
jectivity
Source: Protiviti, Guide to the Sarbanes-Oxley Act: Internal Control Reporting Requirements
The choice of using internal audit and risk control specialists to assist process owners and perform testing is
based on the following factors:
1. The assigned role and responsibilities of process owners.
2. The capabilities of process owners.
3. The capacity and cost of deploying process owners.
4. The capabilities, capacity and cost of deploying an internal audit.

121
Chapter 5 Review Questions
1. A company’s process risks are managed quantitatively. In addition, a chain of accountability is established.
What is the process maturity level for the company’s internal control over financial reporting?
A. Defined
B. Optimizing
C. Repeatable
D. Managed
2. Which section of the Sarbanes-Oxley Act requires both the CEO and CFO to certify the fairness of a compa-
ny’s financial information?
A. Section 302
B. Section 906
C. Section 404
D. Section 101
3. A company realizes that the cost of deploying an internal audit is too high. In such a circumstance, which of
the following functions, independent of operations, should be created to ensure consistent SOX Section 404
compliance?
A. Financial Management
B. Risk Control Group
C. Project Steering Committee
D. Risk Management

122
PART IV:
ASSET AND
LIABILITY MANAGEMENT
123
Chapter 6: Working Capital and Cash Management
Learning Objectives
Upon completion of this chapter, you will be able to:
• Recognize the concept of working capital
• Identify ways to accelerate cash receipts and delay cash payments
• Recognize the impact of credit policy on the accounts receivables
The Role of the CFO
Effective management of working capital (current assets less current liabilities) improves financial returns and
minimizes the risk that the company will run short of cash. By optimally managing cash, receivables, inventory
and accounts payable, a CFO can maximize the rate of return and minimize the liquidity and business risk. The
amount invested in each current asset may change daily and should be monitored carefully to ensure that funds
are used in the most productive way possible. Large account balances may also indicate risk. For example, inven-
tory may not be salable and/or accounts receivable may not be collectible. On the other hand, maintaining inad-
equate current asset levels may be costly; business may be lost if the inventory is too low.
A company must maintain a level of working capital sufficient to pay bills as they come due. Failure to do so is
technical insolvency and can result in involuntary bankruptcy. Unfortunately, holding current assets for purposes
of paying bills is not profitable for a company because they usually offer a low return compared with longer-
term investments. There are numerous signs of potential distress caused by inadequate working capital includ-
ing:
• Declining or negative free cash flow
• Large contingent liabilities
• Unresolved near-term debt maturities
• Increase in accounts receivable aging
• Increase in outstanding accounts payable
Thus, the skillful management of working capital requires balancing a company’s desire for profit with its need
for adequate liquidity. Various techniques for optimizing cash, receivables, inventory, and accounts payable are
discussed in this chapter.

124
The Concept of Working Capital
Working capital is the excess of current assets over current liabilities. Working capital assets are in a constant
cycle of being converted into cash. Cash is used to acquire inventories which, when sold, become account re-
ceivables; receivables upon collection become cash; cash is used to pay current liabilities and expenses and to
acquire more inventories. The amount of working capital provides an indication of short-term liquidity and prof-
itability. Working capital items are those that are flowing through the business in a regular pattern and may be
diagrammed as follows.
If current assets are $6,500,000 and current liabilities are $4,000,000, net working capital equals $2,500,000.
Managing working capital by regulating the various types of current assets and current liabilities requires making
decisions on how assets should be financed (e.g., by short-term debt, long-term debt, or equity). Note: net
working capital increases when current assets are financed through noncurrent sources. The following example
illustrates how to calculate working capital.
Example 6-1
The following assets exist: $10,000 in cash, $30,000 in accounts receivable, $42,000 in inventory, $90,000 in ma-
chinery, $36,000 in long-term investments, and $4,000 in patents.
The working capital consists of the total current assets:
Cash $10,000
Accounts receivable 30,000
Inventory 42,000
Total working capital $82,000
PwC identifies four factors that impact a company’s working capital requirements and relative performance:
1. The type of business
2. The economic maturity of the region
Inventory
Accounts Payable
Cash
Accounts Receivable
125
3. The company size
4. Whether management cares about cash
Managing working capital is also evaluating the trade-off between return and risk. If funds are transferred from
fixed assets to current assets, liquidity risk is reduced, a greater ability to obtain short-term financing is en-
hanced, and the company has greater flexibility in adjusting current assets to meet changes in sales volume.
However, it also receives reduced return, because the yield on fixed assets exceeds that of current assets. Fi-
nancing with noncurrent debt carries less liquidity risk than financing with current debt because the former is
payable over a longer time period. However, long-term debt often has a higher cost than short-term debt be-
cause of its greater uncertainty.
Liquidity risk may be reduced by using the hedging approach to financing, in which assets are financed by liabili-
ties with similar maturity. When a company needs funds to purchase seasonal or cyclical inventory, it uses short-
term financing, which gives it the flexibility to meet its seasonal needs within its ability to repay the loan. On the
other hand, the company’s permanent assets should be financed with long-term debt. Because the assets last
longer, the financing can be spread over a longer time, helping to ensure the availability of adequate funds with
which to meet debt payments.
The less time it takes between purchase and delivery of goods, the less working capital needed. For example, if
the company can receive a raw material in two weeks, it can maintain a lower level of inventory than if two
months' lead time is required. You should purchase material early if significantly lower prices are available and if
the material's cost savings exceed inventory carrying costs.
Cash Management
The Significance of Cash Management
Sound cash management requires us to know how much cash is needed, how much cash we have, and where
that cash is. This knowledge is particularly crucial during inflationary periods. The goal of cash management is to
invest excess cash for a return and at the same time have adequate liquidity. A proper cash balance, neither ex-
cessive nor deficient, should exist. For example, companies with many bank accounts may be accumulating ex-
cessive balances and the accounts should be more closely monitored.
Proper cash forecasting is particularly crucial in a recession and is required to determine:
• The optimal time to incur and pay back debt
• The amount to transfer daily between accounts
A daily computerized listing of cash balances and transaction reporting can let a company know the up-to-date
cash balance so it can decide how best to use the funds. It should also assess the costs it is paying for banking
services, looking at each account's cost. When cash receipts and cash payments are highly synchronized and
predictable, the company may keep a smaller cash balance; if quick liquidity is needed, it can invest in marketa-

126
ble securities. Any additional cash should be invested in income producing securities with maturities structured
to provide the necessary liquidity.
What determines how much cash a company should hold? The key factors are cash management policies, cur-
rent liquidity position, liquidity risk preferences, maturity dates of debt, ability to borrow, forecasted short- and
long- term cash flow, and the probabilities of different cash flows under varying circumstances. A company does
not want an excessive cash balance because no return can be earned on it. At a minimum, a company should
hold in cash the greater, of:
1. Compensating balances (deposits held by a bank to compensate it for providing services), or
2. Precautionary balances (money held for emergency purposes) plus transaction balances (money to cov-
er checks outstanding).
It must also hold enough cash to meet its daily requirements. Compensating balances are either:
• An absolute minimum balance, or
• A minimum average balance that bank customers must keep at the bank.
Maintaining compensating balances will not accelerate a company's cash inflows because less cash will be avail-
able even though the amount of cash coming in remains unchanged. A number of factors go into the decision
on how much cash to hold, including:
• The company's liquid assets
• Business risk
• Debt levels and maturity dates
• Ability to borrow on short notice and on favorable terms
• Rate of return
• Economic conditions
• The possibility of unexpected problems, such as customer defaults
Techniques for Optimizing Cash
Acceleration of Cash Inflow
To improve cash inflow, a company should evaluate the causes of and take corrective action for delays in having
cash receipts deposited. It should ascertain the origin of cash receipts, how they are delivered, and how cash is
transferred from outlying accounts to the main corporate account. It should also investigate banking policy re-
garding availability of funds and the length of the time lag between when a check is received and when it is de-
posited. The types of delays in processing checks are:
• "Mail float," the time required for a check to move from debtor to creditor
• "Processing float," the time needed for the creditor to enter the payment
• "Deposit collection float," the time it takes for a check to clear

127
A company should try out all possible ways to accelerate cash receipts including the use of lockboxes, pre-
authorized debits (PADs), wire transfers, and depository transfer checks.
Lockbox. A lockbox represents a way to place the optimum collection point near customers. Banks make collec-
tions from these boxes several times a day and deposit the funds to the corporate account. They then prepare a
computer listing of payments received by account and a daily total, which is forwarded to the corporation. To
determine the effectiveness of using a lockbox, a company should determine:
• The average face value of checks received
• The cost of operations eliminated
• Reducible processing overhead
• The reduction in "mail float" days
Because per-item processing costs for lockboxes is typically significant, it makes the most sense to use one for
low-volume, high-dollar collections. However, businesses with high-volume, low-dollar receipts are using them
more and more as technological advances lower their per-item cost.
Wholesale lockboxes are used for checks received from other companies. As a rule, the average dollar cash re-
ceipts are large, and the number of cash receipts is small. Many wholesale lockboxes result in mail time reduc-
tions of no more than one business day and check-clearing time reductions of only a few tenths of one day. They
are therefore most useful for companies that have gross revenues of at least several million dollars and that re-
ceive large checks from distant customers.
Pre-Authorized Debits. Cash from customers may be collected faster if you obtain permission from customers to
have pre-authorized debits (PADs) automatically charged to the customers’ bank accounts for repetitive charges.
This is a common practice among insurance companies, which collect monthly premium payments via PADs.
These debits may take the form of paper pre-authorized checks (PACs) or paperless automatic clearing house
entries. PADs are cost-effective because they avoid the process of billing the customer, receiving and processing
the payment, and depositing the check. Using PADs for variable payments is less efficient because the amount of
the PAD must be changed each period and the customer generally must be advised by mail of the amount of the
debit. PADs are most effective when used for constant, relatively nominal periodic payments.
Wire Transfers. To accelerate cash flow, a business may transfer funds between banks by wire transfers through
computer terminal and telephone. Such transfers should be used only for significant dollar amounts because
wire transfer fees are assessed by both the originating and receiving banks. Wire transfers are best for intra-
organization transfers, such as transfers to and from investments, deposits to an account made the day checks
are expected to clear, and deposits made to any other account that requires immediate availability of funds.
They may also be used to fund other types of checking accounts, such as payroll accounts. In order to avoid un-
necessarily large balances in the account, a company may fund it on a staggered basis. However, to prevent an
overdraft, the company should make sure balances are maintained in another account at the same bank.
Depository Transfer Checks (DTCs). Paper or paperless depository checks may be used to transfer funds be-
tween the company's bank accounts. They do not require a signature, since the check is payable to the bank for
credit to the company's account. DTCs typically clear in one day. Manual DTCs are preprinted checks that include

128
all information except the amount and date; automated DTCs are printed as needed. It is usually best to use the
bank's printer since it is not cost-effective for the company to purchase a printer. Automatic check preparation is
advisable only for companies that must prepare a large number of transfer checks daily.
Example 6-2
C Corporation obtains average cash receipts of $200,000 per day. It usually takes five days from the time a
check is mailed until the funds are available for use. The amount tied up by the delay is:
5 days x $200,000 = $1,000,000
We can also calculate the return earned on the average cash balance.
Example 6-3
A company's weekly average cash balances are as follows:
Week Average Cash Balance
1 $12,000
2 17,000
3 10,000
4 15,000
Total $54,000
The weekly average cash balance is:
If the annual interest rate is approximately 6 percent, the monthly return earned on the average cash balance is:
If we are thinking of establishing a lockbox to accelerate cash inflow, we will need to determine the maximum
monthly charge we will incur for the service.
Example 6-4
We now have a lockbox arrangement in which Bank A handles $5 million a day in return for an $800,000 com-
pensating balance. We are thinking of canceling this arrangement and further dividing our western region by
entering into contracts with two other banks:
• Bank B will handle $3 million a day in collections with a compensating balance of $700,000
• Bank C will handle $2 million a day with a compensating balance of $600,000.
Collections will be half a day quicker than they are now. Our return rate is 12%.
$54,000 = $13,500
4
$13,500 x 0.06
= $67.5 12

129
Accelerated cash receipts
($5 million per day x 0.5 day) $2,500,000
Increased compensating balance 500,000
Improved cash flow $2,000,000
Rate of return x 0.12
Net annual savings $240,000
Delay of Cash Outlay
Delaying cash payments can help a company earn a greater return and have more cash available. A business
should evaluate the payees and determine to what extent it can reasonably stretch time limits without incurring
finance charges or impairing its credit rating. There are many ways to delay cash payments, including centraliz-
ing payables, having zero balance accounts, and paying by draft.
Centralize Payables. A company should centralize the company's payable operation - that is, make one center
responsible for making all payments so that debt may be paid at the most profitable time and so that the
amount of disbursement float in the system may be ascertained.
Zero Balance Account (ZBA). Cash payments may be delayed by maintaining zero balance accounts in one bank
in which we maintain zero balances for all of the company's disbursing units with funds being transferred in
from a master account as needed. The advantages of ZBAs are that they allow better control over cash pay-
ments and reduced excess cash balances in regional banks. Using ZBAs is an aggressive strategy that requires the
company to put funds into its payroll and payables checking accounts only when it expects checks to clear. How-
ever, watch out for overdrafts and service charges.
Drafts. Payment drafts are another strategy for delaying disbursements. With a draft, payment is made when
the draft is presented for collection to the bank, which in turn goes to the issuer for acceptance. When the draft
is approved, the company deposits the funds to the payee's account. Because of this delay, we can maintain a
lower checking balance. Banks usually impose a charge for drafts, and we must endure the inconveniences of
formally approving them before payment. Drafts can provide a measure of protection against fraud and theft
because they must be presented for inspection before payment.
Check Clearing. We can use probability analysis to determine the expected date for checks to clear. Probability
is defined as the degree of likelihood that something will happen and is expressed as a percentage from 0 to
100. For example, it is likely that not all payroll checks are cashed on the payroll date, so we can deposit some
funds later and earn a return until the last minute.
Delay Payments. A company can reduce the frequency of payments to employees (e.g., expense account reim-
bursements, payrolls). For example, it can institute a monthly payroll rather than weekly. In this way, it has the
use of the cash for a greater time period. It can also disburse commissions on sales when the receivables are
collected rather than when sales are made. Finally, it can utilize noncash compensation and remuneration
methods (e.g. distribute stock instead of bonuses).
130
Other ways exist to delay cash payments:
• Instead of making full payment on an invoice, make partial payments.
• Delay payment by requesting additional information about an invoice from the vendor before paying it.
• Use a charge account to lengthen the time between when buying goods and when paying for them.
Example 6-5
Every two weeks, a CFO makes out checks that average $600,000 and take three days to clear. How much mon-
ey can the company save annually if the CFO delays transfer of funds from an interest-bearing account that pays
0.00384% per day (annual rate of 1.4%) for those three days?
The interest for three days is: $600,000 x (.0000384 x 3) = $69.10
The number of two-week periods in a year is: 52 weeks / 2 weeks = 26
The savings per year is: $69.10 x 26 = $1,796.60
Short-Term Investments
The treasurer is usually responsible for the investment function of a company, especially in a large organization.
However, the CFO may engage in the short-term investment of excess cash depending on the organization struc-
ture, such as in a small firm where the scope of the CFO position is much larger.
As an alternative to holding large cash balances, many companies hold part of their liquid funds in short-term
marketable securities. These instruments earn interest and can be very easily converted to cash. For example,
the CFO can invest funds in the following ways:
• Time deposits, including savings accounts earning daily interest, long-term savings accounts, and certifi-
cates of deposit (short-term, negotiable time deposits with banks, issued at face value and providing for
interest at maturity).
• Money market funds, which are managed portfolios of short-term, high-grade debt instruments such as
Treasury Bills and commercial paper.
• Demand deposits that pay interest.
• Bankers' acceptances, which are short-term (up to six months), non-interest bearing notes up to $1 mil-
lion issued at a discount. Acceptances are mostly traded internationally and enjoy their preferred credit
status because of their "acceptance" (guarantee) for future payment by commercial banks. Bankers' ac-
ceptances are time drafts drawn on and accepted by a banking institution, which in effect substitutes its
credit for that of the importer or holder of merchandise.
• Commercial paper, which is a short-term, unsecured debt instrument issued by financially strong com-
panies.

131
• Short-term tax exempts issued by states and local government agencies in denominations up to $1 mil-
lion. The maturity typically ranges from 6 to 12 months. A good secondary market exists for resale. In-
terest is paid at maturity.
• Repurchase agreements issued by dealers in U.S. government securities.
• The maturity ranges from one day to three months. They come in typical amounts of $500,000 or more.
No secondary market exists. They are legal contracts between a borrower (security seller) and lender
(security buyer). The borrower will repurchase at the contract price plus an interest charge.
• Treasury Bills, which are backed by the U.S. government. Treasury Bills are issued for terms of 4, 13, 26,
and 52 weeks. They trade in minimum units of $100. Treasury Bills are issued at a discount, which
means that interest represents the difference between the price paid and the face value of the instru-
ment at the maturity date. Treasury Bills are exempt from state and local income tax. A Treasury Bill is
highly liquid and nearly risk-free, and it is often held as a substitute for cash.
Example 6-6
A $10,000, three-month Treasury Bill is purchased for $9,800. The return for three months is
Return = $10,000 − $9,800 = $200 = 2%
Investment $9, 800 $9, 800
On an annual basis, the return is: 2% x 12/3 = 8% (annual return)
Opportunity Cost of Foregoing a Cash Discount
Many companies establish credit terms that authorize cash discounts in exchange for early payment of the
amount purchased. If a company takes advantage of the cash discount, it will reduce the purchase cost. An op-
portunity cost is the net revenue you lose by rejecting an alternative action. A company should typically take
advantage of a discount offered by a creditor because of the high opportunity cost. If a company is short of
funds to pay the supplier early, it should borrow the money when the interest rate on the loan is below the an-
nual rate of the discount. For example, if the terms of sale are 2/10, net/30, a company has 30 days to pay the
bill but will get a 2% discount if the company pays in 10 days.
We can use the following formula to compute the opportunity cost percentage on an annual basis:
Opportunity cost = Discount percent
X 360
100 − Discount percent N
N = the number of days payment can be delayed by forgoing the cash discount. This equals
the number of days credit is outstanding less the discount period.
The numerator of the first term (discount percent) is the cost per dollar of credit, whereas the denominator (100
- discount percent) represents the money available by forgoing the cash discount. The second term represents
the number of times this cost is incurred in a year.

132
If a company elects not to pay within the discount period, it should hold on to the money as long as possible.
For example, if the terms are 2 / 10, net/60, the company should not pay for 60 days.
Example 6-7
The opportunity cost of not taking a discount when the terms are 3/15, net/60 is computed as follows:
Opportunity Cost = (3/(100−3)) x (360/(60−15)) = (3/97) x (360/45) = 24.7%
The following table presents possible credit terms and the associated opportunity cost of not paying within the
discount period.
Opportunity Cost of Not Taking a Discount
Credit Terms Opportunity Cost
1/10, net/45 10.3%
2/10, net/30 36.7%
3/30, net/90 18.6%
Example 6-8
XYZ Company purchases $500,000 of merchandise on credit terms of 2/10, net/30. The company does not pay
within 10 days and thus loses the discount.
Opportunity cost = (0.02 x $500,000) / (.98 x $500,000) x 360/20 = $10,000/$490,000 x 180 = 36.7%
Surely management would have been better off to take advantage of the discount by borrowing $490,000 at the
prime interest rate.
Accounts Receivable Management
“Sell on credit” is one way a business can attract customers and increase sales by allowing the customer to have
the goods before paying for it. Sales of goods without receiving cash result in accounts receivable. Accounts re-
ceivable refers to the outstanding invoices a company has or the money the company is owed from its custom-
ers. Receivables represent a line of credit extended by the company since the company is “loaning” the custom-
er the money to buy its product. A loan usually generates some value such as interest payment. However, an
account receivable “loan” generates value through increased sales, not an interest payment. This amount is de-
termined by the volume of sales and the average length of time between a sale and receipt of the full payment:
Accounts Receivable = Credit sales per day x Length of collection period
For example, if a business has credit sales of $4,000 per day and allows 30 days for payment, it has a total of
$4,000 x 30 or $12,000 invested in receivables. Based on this equation, the receivable position is changed with

133
the volume of sales or the length of the collection period. A company’s decisions regarding accounts receivable
must include whether to give credit, and, if so, the company must determine eligibility, amounts, and terms.
Companies lacking strategies often lose money without knowing it through poor enforcement of credit policies,
weak accounts receivable policies, weak or nonexistent dispute resolution management, and technology imped-
ing efficiency. When a company needs to borrow money to meet its obligations because customers are paying
late, it could incur losses on the interest costs. In general, carrying overdue accounts receivable has the follow-
ing cost:
• Administrative costs that include labor and direct expenses related to billing customers, following up
and collecting past due invoices, and processing payments. The use of the right technology can effective-
ly reduce the administrative costs.
• Financing costs, such as interest costs, are determined by the size of accounts receivable balance. They
can be reduced through an effective collection process.
• Risk costs are the risk that an invoice is not paid, which can be effectively reduced by implementing a
good review of credit applications from new customers and proactively monitoring customer payment
trends.
The average sales volume affects the size of the investment in accounts receivable. A larger quantity results in a
larger investment. However, holding sales volume constant, the size of that investment becomes directly at-
tributable to how long average receivables are outstanding. The calculation that defines this relationship fol-
lows:
(Annual credit sales) x (Days to collect/360) = Investment in accounts receivable
Example 6-9
A company has accounts receivable of $700,000. The average manufacturing cost is 40% of the sales price. The
before-tax profit margin is 10%. The carrying cost of inventory is 3% of the selling price. The sales commission is
8% of the sales. The investment in accounts receivable is:
$700, 000 x (0. 40 + 0.03 + 0.08) = $700, 000 x (0. 51) = $357, 000
Example 6-10
The company is considering liberalizing the credit policy to encourage more customers to purchase on credit.
Currently, 80% of the sales are made on credit, and there is a gross margin of 30%. Other relevant data are in-
cluded here:
Current Proposed
Sales $300,000 $450,000
Credit sales $240,000 $360,000
Collection expenses 4% of credit sales 5% of credit sales
Accounts receivable turnover 4.5 3

134
An analysis of the proposal yields the following results for average accounts receivable balance (credit
sales/accounts receivable turnover):
Expected average accounts receivable ($360,000/3) $120,000
Current average accounts receivable ($240,000/4.5) 53,333
Increase $66,667
For gross profit, the analysis yields the following results:
Expected increase in credit sales
($360,000 − $240,000) $120,000
Gross profit rate x 0.30
Increase $ 36,000
Collection expenses are calculated as follows:
Expected collection expenses (0.05 x $360, 000) $18,000
Current collection expenses (0.04 x $240, 000) 9,600
Increase $ 8,400
The company would benefit from a more liberal credit policy.
Inventory Management
The objective of inventory management decisions is to minimize the total variable inventory costs in order to
lead a more profitable operation. Thus, a company should try to minimize the lead time in acquisition, manufac-
turing, and distribution functions; that is, how long it takes to receive the merchandise from suppliers after an
order is placed. Depending upon lead times, a company may need to increase inventory or alter their purchas-
ing pattern. It should calculate the ratio of the value of outstanding orders to average daily purchases to indi-
cate the lead time for receiving orders from suppliers; this ratio indicates whether a company should increase
the inventory balance or change a company’s buying pattern.
A company must also consider the obsolescence and spoilage risk of inventory. For example, technological, per-
ishable, fashionable, flammable, and specialized goods usually have high salability risk, which should be taken
into account in computing desired inventory levels.
Inventory management involves a trade-off between the costs of keeping inventory and the benefits of holding
it. Different inventory items vary in profitability and the amount of space they take up, and higher inventory lev-
els result in increased costs for storage, casualty and theft insurance, spoilage, property taxes for larger facilities,
increased staffing, and interest on funds borrowed to finance inventory acquisition. On the other hand, an in-
crease in inventory lowers the possibility of lost sales from stockouts and the production slowdowns caused by
inadequate inventory. Additionally, large volume purchases result in greater purchase discounts.

135
Inventory levels are also affected by short-term interest rates. As short-term interest rates increase, the opti-
mum level of holding inventory is reduced. A company may have to decide whether it is more profitable to sell
inventory as is or to sell it after further processing. For example, assume inventory can be sold “as is” for
$40,000 or for $80,000 if it is put into further processing costing $20,000. The latter should be selected because
the additional processing yields a $60,000 profit, compared to $40,000 for the current sale. In short, determin-
ing ideal inventory levels is a balancing act and key to a healthy and growing business as demonstrated by the
following diagram.
Accounts Payable Management
Accounts Payable plays an increasingly important role within a company’s financial operations because its activi-
ties can impact not only working capital but also credit rating, the efficiency and cost of procurement and in-
voice processes, and relationships with suppliers. Thus, when it comes to working capital optimization, enhanc-
ing payables is one of the key strategies. As suppliers offer discounts for early payment, companies always need
to compare the value of the discount to the company’s borrowing costs. If the benefit of the discount exceeds
the cost of borrowing, the company should make the early payment. In addition, delaying payment can affect
the relationship with the supplier (e.g., delays in delivery, slow responses to questions) and lower the company’s
credit rating.
A company should maintain prompt payments in meeting the supplier terms while optimizing working capital
and reducing the costs in the accounts payable process. CFOs must understand the importance of adopting a
fully operational process that:
1. Supports the company’s cash management strategy and improves visibility of cash use;
2. Provides more control over cash flow and identifies cost reduction opportunities;
3. Increases complies with company procedures, contractual obligations, and regulatory requirements;
4. Establishes and maintains good relationship with suppliers and employees;
5. Monitors and maintains cash flow including regular review of debit balances;
6. Defines and monitors performance measures to enhance process efficiencies.
Accounts payable are a spontaneous (recurring) financing source, since they come from normal operations, and
are the least expensive form of financing inventory. Due to their ease in use, accounts payable are often the
largest source of short-term financing for many companies both large and small. Accounts payable have many
advantages:
Transportation Costs
Fulfillment Speed
Inventory Costs
Cost of Stockout
Expanded Capabilities
Profitability
Customer Satisfaction
Cost to Serve

136
1. They are readily available since suppliers want business.
2. Collateral is not required.
3. Interest is typically not demanded or, if so, the rate is minimal.
4. Trade creditors are frequently lenient if a company gets into financial trouble.
If a company has liquidity difficulties, it may be able to stretch (extend) accounts payable; however, this may
lower its credit rating and may eliminate any cash discount offered.
Example 6-11
A company purchases $500 worth of merchandise per day from suppliers. The terms of purchase are net/60,
and it pays on time. How much is the company’s accounts payable balance?
$500 per day x 60 days = $30,000

137
Chapter 6 Review Questions
1. What is a compensating balance?
A. It compensates a financial institution for services rendered by providing it with deposits of funds.
B. It is used to compensate for possible losses on a marketable securities portfolio.
C. It is a level of inventory held to compensate for variations in usage rate and lead time.
D. It is the amount of prepaid interest on a loan.
2. Using a 360-day year, what is the opportunity cost to a buyer of NOT accepting terms 3/10, net 45?
A. 55.67%
B. 31.81%
C. 22.27%
D. 101.73%
3. When a company analyzes credit applicants and increases the quality of the accounts rejected, what is the
company attempting to do?
A. Maximize sales
B. Increase bad-debt losses
C. Increase the average collection period
D. Maximize profits
4. Which one of the following financial instruments generally provides the largest source of short-term credit
for small firms?
A. Installment loans
B. Commercial paper
C. Accounts payable
D. Bankers' acceptances
138
PART V:
PROVIDING STRATEGIC
FINANCE SUPPORT AND
ANALYSIS
139
Chapter 7: The Financial Planning Process
Learning Objectives
After completing this section, you will be able to:
• Recognize how strategic planning and budgeting are linked together
• Identify the major steps in budget preparation
• Identify certain budget measurements
The Role of the CFO
Boards now have much higher expectations on the adequacy of long-term financial plans. Investors and other
stakeholders with a vested interest will also look for greater assurances over the financial viability of the busi-
ness’s strategy for delivering longer-term financial success and growth. To address these increased pressures,
successful CFOs not only help develop the organizational strategy as a member of the executive leadership team
-- he/she also funds and executes the strategy through proper financial planning processes.
Strategy is best defined as a course of action or a plan, including the specification of resources required, to
achieve a specific objective. It is the means by which the company uses its capital, financial, and human re-
sources to achieve its objectives. Thus, it shows the company’s future direction and rationale, and it looks at ex-
pected costs and return.
The budget is a tool that provides targets and direction. Budgets provide control over the immediate environ-
ment, help to master the financial aspects of the job and department, and solve problems before they occur.
Too often, the financial and budgeting process remain disconnected or detached from the realities of the busi-
ness. Budgeting, when used effectively, is a technique resulting in systematic, productive management. It forces
a company to establish goals, determine the resources necessary to achieve those goals, and anticipate future
difficulties in their achievement.
Most planning and budgetary activities require a great deal of time and effort from CFOs and their teams. Exam-
ples of these activities include:
• Reviewing the budget and securing approvals
• Collecting, consolidating, and reconciling data and information

140
• Developing targets and identifying business drivers in line with company strategy
• Analyzing information (including variance analysis)
• Gaining consensus among finance and operating managers
• Preparing reports for use in the budgeting approval process
Successful CFOs must take a starring role in planning and budgeting to gain traction as a strategic leader in the
organization. CFOs should always exercise sufficient control to ensure integrity behind the numbers that come
out of the budgets, and CFOs must also be familiar with the planning and budget process. Without a plan on
which to base future financial decisions, a CFO cannot make things happen in a logical fashion. In other words,
corporate- strategy and budgeting processes should be fully integrated to ensure that the allocation of re-
sources is a close collaboration between finance and strategy.
This chapter highlights the financial planning processes; explaining the elements of strategic planning and the
key components of budgeting.
Strategic Planning
The Concept of Strategic Planning
A plan is a predetermined action course linking short-term, intermediate-term, and long-term goals. The objec-
tive is to make the best use of the companies’ available resources over the long term. Planning has to consider
the organizational structure, taking into account authority and responsibility. Planning is determining what
should be done, how it should be done, and when it should be done. The plan should specify the nature of the
problems, reasons for them, constraints, contents, characteristics, category, alternative ways of accomplishing
objectives, and listing of information required. Planning objectives include quantity and quality of products and
services, as well as growth opportunities.
The strategic plan is the mission of the company and it looks at existing and prospective products and markets.
Strategic plans are designed to direct the company’s activities, priorities, and goals. It tries to position the com-
pany so as to accomplish opportunities. Strategic goals are for the long-term. They consider the internal and
external environment, strengths, and weaknesses.
The elements of a strategic plan are:
• The company’s overall objectives, such as market position, product leadership, and employee develop-
ment.
• The strategies necessary to achieve the objectives, such as engaging in a new promotion plan, enhancing
research, product and geographical diversification, and eliminating a division.
• The goals to be met under the strategy.
• The progress-to-date of accomplishing the goals. Examples of goals are sales, profitability, return on in-
vestment, and market price of stock.

141
In summary, strategy requires planning for the company as a whole, not just combining the separate plans of
the respective parts:
• There must be a common thread.
• It looks to the long-term.
• It is concerned with the few key decisions that determine the company’s success or failure.
• It provides overall direction. It indicates how the long-term goals will be achieved.
• It is a mission policy statement.
• Critical issues must be dealt with.
Short-Term Plans
Short-range plans are typically for one year (although some plans are for two years). The plans examine ex-
pected earnings, cash flow, and capital expenditures. Short-term plans may be for a period within one year,
such as a month or week. Short-term planning relies primarily on internal information and details tactical objec-
tives. It is structured, fixed, foreseeable, and continually determinable. The short-term profit plan is based on
the strategic plan. It is concerned with existing products and markets.
There should be a short-term profit plan by area of responsibility (product, service, territory, division, depart-
ment, project, function, and activity). Short-term plans are usually expressed on a departmental basis. They in-
clude the following plans: sales, manufacturing, marketing, management (administration), research, and con-
solidation (integration).
Short-term planning has more lower-level managers involved with providing inputs. The line manager is typical-
ly involved with short-term rather than long-term plans. In making the short-term plan, the line manager
should consider the company’s objectives and targets outlined in its long-term plan. The manager’s short-term
plan must satisfy the long-term objectives of the company.
Long-Term Plans
Long-term planning usually has a broad, strategic nature to accomplish objectives. A long-term plan is typically
5-10 years (or more) and looks at the future direction of the company. It also considers economic, political, and
industry conditions. Long-term plans are formulated by upper management. They deal with products, markets,
services, and operations. Long-range planning enhances sales, profitability, return on investment, and growth.
Long-range plans should be constantly revised as new information becomes available.
Long-range planning covers all major areas of the business including manufacturing, marketing, research, fi-
nance, engineering, law, accounting, and personnel. Planning for these areas should be coordinated into a com-
prehensive plan to attain corporate objectives.
A long-term plan is a combination of both the operating and developmental plans. The long-term plan should
specify what is needed, by whom, and when. Responsibility should be assigned to segments. Long-term goals
include market share, new markets, expansion, new distribution channels, cost reduction, capital maintenance,
and reduction of risk. The characteristics of sound long-term objectives include flexibility, motivation, measura-

142
bility, consistency and compatibility, adequateness, and flexibility. Long-range plans may be used for growth,
market share, product development, plant expansion, and financing.
Long-range plans are the details of accomplishing the strategic plans. Compared to strategic planning, long-
range planning focuses more on planning current operations of all units of the business. Long-range planning
includes evaluating alternatives, developing financial information, analyzing activities, allocating resources,
product planning, market analysis, planning manpower, analyzing finances, research and development plan-
ning, and production planning.
The time period for a long-term plan depends upon the time required for product development, product life cy-
cle, market development, and construction of capital facilities. There are alternatives available in long-term
plans. When there is greater uncertainty in the economic and business environment, long-range plans become
more important. However, it is more difficult to plan long-term than short-term because of the greater uncer-
tainties that exist. An illustrative long-term plan appears in the following exhibit.
Exhibit 7-1 Long-Term Plan
Items Specific Goals Objectives or Amounts
Contract Acquisitions • Customer
• Division
• Company
Sales
• Customer
• Division
• Company
• Total
Financial Goals • Profit Margin
• Return on Investment
Capital Expenditures • Assets
• Leases
Budgeting for Planning and Control
The Concept of Budgeting
A budget is defined as the formal expression of plans, goals, and objectives of management that covers all as-
pects of operations for a designated time period. It is a financial plan to control future operations and results by
establishing standards, and it facilitates comparison of actual and budgeted performance. Thus, it motivates
good performance by highlighting the work of effective management. Moreover, the nature of budgeting fosters
communication of goals to company sub-units and the coordination of their efforts. Budgeting activities must be
coordinated because they are interdependent.

143
A budget should be realistic (e.g., feasible in marketing and production capabilities) and consistent with compa-
ny policy. It should take into consideration what the department’s or company's mission is. For instance, does
the company want to hold the line against the competition or does it want to grow? Should the company take
an aggressive or a conservative approach in achieving these goals? The budget should be constantly evaluated
since external or internal conditions may warrant changes. A budget is only an estimate, and deviation from
that estimate should be expected. Thus, the budget must be adaptable to changing circumstances.
Effective budgeting requires the existence of the following:
• Predictive ability
• Clear channels of communication, authority, and responsibility
• Accounting-generated, accurate, reliable, and timely information
• Compatibility and understandability of information
• Support at all levels of the organization from upper, middle, and lower
A budget is a quantitative plan of action that aids in coordination and implementation. The budget communi-
cates objectives to all the departments within the company.
Budgetary Process
A sound budgetary process communicates organizational goals, allocates resources, provides feedback, and mo-
tivates employees. The budgetary process should be standardized by using budget manuals, budget forms, and
formal procedures. Software, Program Evaluation and Review Technique (PERT) and Gantt all facilitate the
budgeting process and preparation. The timetable for the budget must be kept. If the budget is a “rush job”,”
unrealistic targets may be set.
The budget process used by a company should suit its needs, be consistent with its organizational structure, and
take into account human resources. The budgetary process establishes goals and policies, formulates limits,
enumerates resource needs, examines specific requirements, provides flexibility, incorporates assumptions, and
considers constraints. The budgeting process should take into account a careful analysis of the current status of
the company. The process takes longer as the complexity of the operations increase. A budget is based on past
experience plus a change in light of the current environment. The six steps in the budgeting process are:
Setting objectivesAnalyzing available
resources
Negotiating to estimate budget
components
Coordinating and reviewing
components
Obtaining final approval
Distributing the approved budget

144
A budget committee should review budget estimates from each segment, make recommendations, revise budg-
eted figures as needed, and approve or disapprove of the budget. The committee should be available for advice
if a problem arises in gathering financial data. The committee can also reconcile diverse interests of budget pre-
parers and users.
A budget should be revised when it no longer acts as a useful planning and control device. Budgets should be
revised when major changes in processes or operations occur, or when there are significant changes in salary
rates. For example, additional competitors may enter the market with a product that sells at a lower price and is
a good substitute for the company’s product. This may make meeting the budgeted market share and sales un-
likely. If management recognizes that even with increased promotional expenditures, budgeted sales are not
realistic, all budgets affected should be revised. These revisions are preferable to using unattainable budgets.
Budgets that are repeatedly revised are more informative as a control measure. For a one-year budget, budget
estimates may be revised quarterly. Budget revisions should be more frequent in unstable businesses.
Managers are more motivated to achieve budgeted goals when they are involved in budget preparation. A
broad level of participation usually leads to greater support for the budget and the entity as a whole, as well as a
greater understanding of what is to be accomplished. Advantages of a participative budget include greater ac-
curacy of budget estimates. Managers with immediate operational responsibility for activities have a better un-
derstanding of what results can be achieved and at what costs. Also, mangers cannot blame unrealistic goals as
an excuse for not achieving budget expectations when they have helped to establish those goals. Despite the
involvement of lower-level managers, top management must still participate in the budget process to ensure
that the combined goals of the various departments are consistent with the profitability objectives of the com-
pany.
Forecasting vs. Budgeting
Forecasting is predicting the outcome of events. It is an essential starting point for budgeting. Budgeting is plan-
ning for a result and controlling activities to accomplish that result.
Types of Budgets
The budget is classified broadly into two categories:
1. Operating budget, reflecting the results of operating decisions. The operating budget consists of:
• Sales budget
• Production budget
• Direct materials budget
• Direct labor budget
• Factory overhead budget
• Selling and administrative expense budget
• Pro forma income statement
2. Financial budget, reflecting the financial decisions of the company:
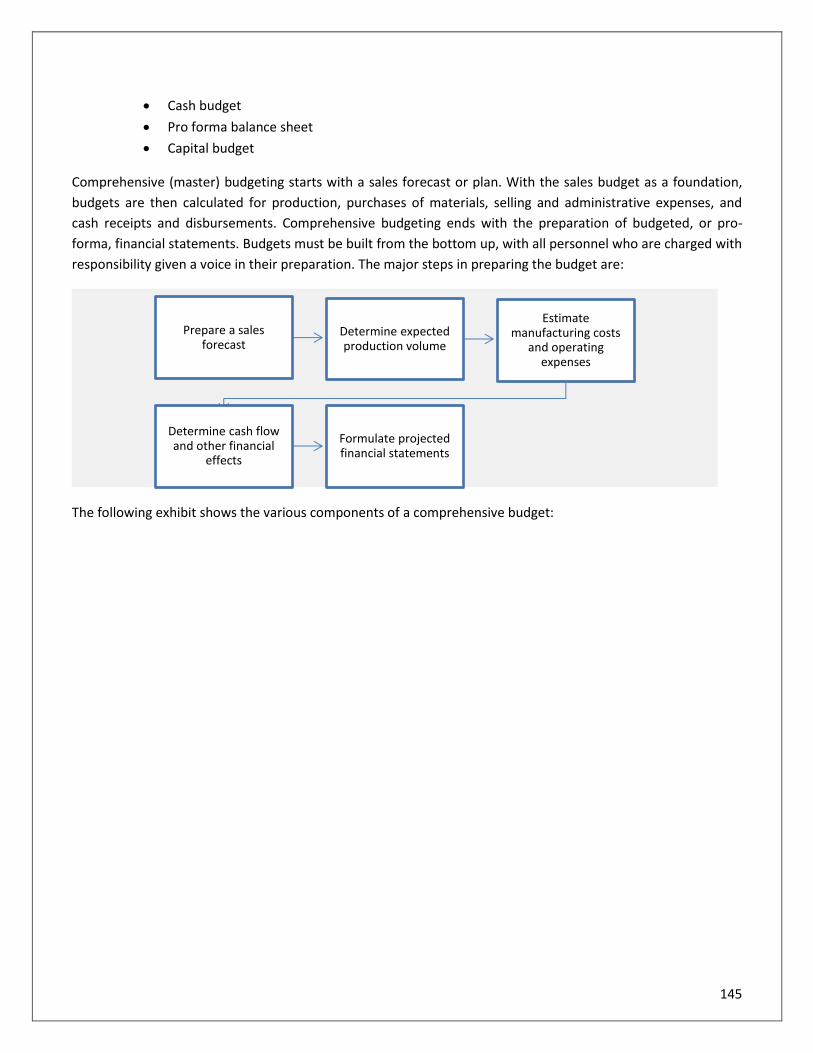
145
• Cash budget
• Pro forma balance sheet
• Capital budget
Comprehensive (master) budgeting starts with a sales forecast or plan. With the sales budget as a foundation,
budgets are then calculated for production, purchases of materials, selling and administrative expenses, and
cash receipts and disbursements. Comprehensive budgeting ends with the preparation of budgeted, or pro-
forma, financial statements. Budgets must be built from the bottom up, with all personnel who are charged with
responsibility given a voice in their preparation. The major steps in preparing the budget are:
The following exhibit shows the various components of a comprehensive budget:
Prepare a sales forecast
Determine expected production volume
Estimate manufacturing costs
and operating expenses
Determine cash flow and other financial
effects
Formulate projected financial statements

146
Exhibit 7-2
Comprehensive (Master) Budget
Highlights of these budgets are discussed below:
Sales Budget. It is the starting point in preparing the master budget, since estimated sales volume influences
nearly all other items appearing throughout the master budget. The sales budget should show total sales in
quantity and value. The expected total sales can be break-even or target income sales or projected sales. It may
be analyzed further by product, by territory, by customer and, of course, by seasonal pattern of expected sales.
Generally, the sales budget includes a computation of expected cash collections from credit sales, which will be
used later for cash budgeting.
Production Budget. After sales are budgeted, the production budget can be determined. The number of units
expected to be manufactured is:

147
The production budget should take into account the sales budget, plant capacity, whether stocks are to be in-
creased or decreased, and outside purchases. Good managers constantly evaluate whether production is on
schedule with proposed budgets and make adjustments accordingly. For example, if a computer on an assembly
line is down for an extended period of time, the manager knows that production and output will probably be
low for that time period.
Direct Material Budget. When the level of production has been computed, a direct material budget should be
constructed to show how much material will be required for production and how much material must be pur-
chased to meet this production requirement. It also tells the cost of direct materials to be purchased, which is
needed later for a cash budgeting purpose. The purchase will depend on both expected usage of materials and
inventory levels. The formula for computation of the purchase is:
Direct Labor Budget. The production requirements provide the starting point for the direct labor budget. To
compute direct labor requirements, expected production volume for each period is multiplied by the number of
direct labor hours to produce a single unit. The direct labor hours required to meet production needs are then
multiplied by the direct labor cost per hour to obtain budgeted total direct labor costs.
Factory Overhead Budget. It provides a schedule of manufacturing costs other than direct materials and direct
labor. This is the reason that manufacturing overhead is often classified as an indirect cost (including factory
rent, factory insurance, factory property taxes, and factory utilities). Examples of manufacturing overhead in-
clude:
• The depreciation on the factory equipment
• Rent on the factory building
• Utilities for the factory
• Factory maintenance
• Indirect factory supplies
• Property tax on the factory building
• Insurance on the factory and inventory
• Production employee compensation
• Quality control staff compensation
Using the contribution approach to budgeting requires the development of a predetermined overhead rate for
the variable portion of the factory overhead. In developing the cash budget, remember that depreciation is not
Budgeted Sales
Desired Ending
Inventory
Beginning Inventory
# of Units Expected
Usage
Desired Ending
Materila Inventory
Units
Beginning Inventory
Units
# of Units Purchased

148
a cash outlay; therefore, it must be deducted from the total factory overhead in computing cash disbursement
for factory overhead.
Manufacturing Overhead
Because manufacturing overhead is an indirect cost, accounting staff may face some challenges when assigning
or allocating overhead costs to each of the unit products. This is a difficult task because there may be no direct
relationship. For example, the property tax on the factory building is based on its assessed value and not on the
number of units produced. However, the property tax must be assigned to the units manufactured.
Desired Ending Inventory Budget. It provides information for the construction of budgeted financial statements.
Specifically, it will help compute the cost of goods sold on the budgeted income statement. It will also give the
dollar value of the ending materials and finished goods inventory that appears on the budgeted balance sheet.
Selling and Administrative Expense Budget. It lists the operating expenses incurred when selling the products
and managing the business. The following expenses are considered to fall within the selling and administrative
classification:
• Accounting and legal expenses
• Corporate expenses
• Facilities expenses
• Sales and marking expenses
The classification generally does not include the expenses incurred by the research and development depart-
ment. In addition, it does not include financing costs since those are not considered to be operating costs. Tight
control must be managed over these expenses since they increase the breakeven point of a business. In order to
complete the budgeted income statement in contribution format, the variable selling and administrative ex-
pense per unit must be computed.
Cash Budget. It is used to ascertain whether company operations and other activities will provide a sufficient
amount of cash to meet projected cash requirements. If not, management must find additional funding re-
sources. Therefore, it is a tool for cash planning and control and for formulating investment strategies. Because
the cash budget details the expected cash receipts and disbursements for a designated time period, it helps
avoid the problem of either having idle cash on hand or suffering a cash shortage. If a cash shortage is experi-
enced, the cash budget indicates:
• Whether the shortage is temporary or permanent and whether short-term or long-term borrowing is
needed?
• Is a line of credit necessary?
• Should capital expenditures be cut back?
If the cash position is very poor, the company may even go out of business because it cannot pay its bills. On the
other hand, if the cash position is excessive, the company may be missing opportunities to use its cash for the
greatest profit possibilities. Just as forecasts must be continuously evaluated for changing internal and external

149
circumstances, the cash budget must also be periodically updated for changing conditions. The cash budget is
usually comprised of four major sections:
The receipts section (the sources of cash) contains the beginning cash balance, as well as cash receipts from cash
sales, accounts receivable collections, and other sale of assets. Note that cash receipts are not necessarily the
same as revenue (e.g. credit sales). The disbursement section (the uses of cash) contains all planned cash ex-
penditures, which comes from the:
• Direct material budget
• Direct labor budget
• Manufacturing overhead budget
• Selling and administrative expense budget
Budgeted Income Statement. It contains all of the line items in a normal income statement, except that it is a
projection of what the income statement will look like during future budget periods (for control purposes the
budget can be divided into quarters or even months depending on need). It is compiled from a number of other
budgets, the accuracy of which may vary based on the realism of the input to the budget model. The budgeted
income statement is useful for testing whether the projected financial results of a company appear to be rea-
sonable. When used in combination with the budgeted balance sheet, it also reveals scenarios that are not fi-
nancially supportable, such as requiring large amounts of debt, which management can remedy by altering the
underlying budget assumptions. Lenders and potential investors often want to see a budgeted income state-
ment as part of the projected financial statements used in making lending and investment decisions. For this
reason, all the assumptions underlying a budgeted income statement must be reasonable and meet professional
accounting standards.
The Receipts Section gives the beginning cash balance, cash
collections from customers, and other receipts.
The Disbursements Section shows all
cash payments listed by purpose.
The Cash Surplus/Deficit Section simply
shows the difference between the cash
receipts section and the cash
disbursements section.
The Financing Section provides a detailed account of the borrowings and
repayments expected during the
budget period.

150
Budgeted Balance Sheet. Preparing the budgeted balance sheet is usually the last step in finalizing a master
budget plan. The budgeted balance sheet contains all of the line items in a normal balance sheet, except that it
is a projection of what the balance sheet will look like during future budget periods. It is compiled from a num-
ber of other budgets, the accuracy of which may vary based on the realism of the input to the budget model.
The budgeted balance sheet alerts us to unfavorable financial conditions that we might want to avoid by show-
ing the estimated financial position of the company. It also serves as a final check on the mathematical accuracy
of all the other schedules, helps us perform a variety of ratio calculations, and highlights future resources and
obligations. A budgeted balance sheet should be constructed for each period spanned by the budget model,
rather than just for the ending period, so that the we can determine whether the cash flows estimated to be
generated will be sufficient to provide adequate funding for the company throughout the budget period.
The budgeted balance sheet is prepared in the same format as a historical based balance sheet. The difference
on the budgeted balance sheet is the source of the data needed to prepare the statement. The data come from
all other budgets discussed earlier. The following table lists the typical balance sheet items, along with the
source of the information used to determine the respective amounts:
The Budgeted Balance Sheet Preparation Balance Sheet Items Basis of Budget
Cash Cash Budget
Accounts Receivable Sales Budget
Inventories • Production Budget
• Direct Material Budget
• Ending Inventory
Fixed Assets Cash Budget
Accumulated Depreciation Factory Overhead Budget
Accounts Payable Direct Material Budget
Salaries Payable Selling & Administrative Budget
Accrued Expenses Selling & Administrative Budget
Paid in Capital Cash Budget
Retained Earning Budgeted Income Statement
Types of Budget Reports
Long-term reports may be for the company as a whole or for specific areas. The benefit derived from reports
should justify their cost. Planning reports may be short-term, looking at the company as a whole, each division,
each department, and each responsibility center within the department. Short-term planning reports may be of
income, cash flow, net assets, and capital expenditures. The reports should be prepared regularly. Special stud-
ies may be performed of “problem” segments not performing well. The special studies may be of product or ser-
vice lines, activities or functions, geographic areas, salesperson performance, and warehousing.

151
Control reports concentrate on performance effectiveness and areas needing improvement. Budget to actual
figures are compared by product, service, territory, and manpower. Information reports assist in planning and
policy formulation. The reports show areas of growth or contraction. They may be in dollars, units, percentages,
or ratios. Trends are shown over time. An example of an informative ratio is selling expense to revenue. Infor-
mational reports study the trend in earnings, profit by product or service, profit by territory, and profit by cus-
tomer.
Reports for upper management are comprehensive summaries of overall corporate operations. Top manage-
ment generally prefers narrative reports. Reports are also prepared for special events of concern to top man-
agement. Adequate detail should be provided as needed. Middle-management reports include summarized in-
formation and detailed information on daily operations. A brief report should be presented at budget meetings.
Lower-level management reports typically deal with daily coordination and control operations. The reports usu-
ally emphasize production. Exception reports should be prepared indicating problems. Budget reports inform
managers of progress made in meeting budgets and what went wrong, if anything.
A critical area should be reported upon more frequently. The frequency of reporting is less as the level of re-
sponsibility becomes higher. Budget reports depend on the requirements of the situation and user. Budget re-
ports should contain the following data:
1. Trends over the years.
2. Comparison to industry norms.
3. Comparison of actual to budget with explanation and responsible party for variances. Follow-up proce-
dures are needed for control.
Budget reports may contain the following supplementary information depending upon need:
• Percent of capacity utilization
• Changes in marketing and distribution
• Change in selling price or average selling price
• Sales volume and units produced
• Distribution cost relative to sales
• Effect on sales of new product introduction, dropping products, and entering new product lines
• Change in the number of employees and man-hours.
Reports should get to the main points. Each report should begin with a summary followed by detailed infor-
mation and should be comprehendible to those using them. The emphasis should be on clarity rather than com-
plexity. Reports should be logically organized, relevant, and concise, and should be updated on a periodic basis.
Reports may contain schedules, explanations, graphs, and tables. They should contain recommendations and
highlight problem areas, and should be computerized.

152
Other Considerations
Budget Audit
A budget audit examines whether the budgeting process is operating effectively. It is an evaluation of the budg-
eting effort. The budget audit examines techniques, procedures, motivation, and budget effectiveness. Effective
budgeting should be dynamic.
A budget audit detects problems in the budgeting process. It should be conducted every two to three years by
an independent party that is not a part of the budget staff. The budget auditor should report to upper manage-
ment, who can take appropriate action, if necessary. An outside consultant should be independent, objective,
and should provide fresh ideas.
An audit plan assists the auditor in arriving at corrective action. The budget audit considers:
• Cost trends and controls
• Budget revisions
• How adequately costs were analyzed
• How costs were identified and classified
• Looseness or tightness of budget allowances
• Completeness of budget documentation, records, and schedules
• Degree of participation by managers and workers
• Quality of supportive data
• The degree of subjectivity involved
Departmental Budgeting
All department managers within a company must accurately determine their future costs and must plan activi-
ties to accomplish corporate objectives. Departmental supervisors must have a significant input into budgeting
costs and revenues since they are directly involved with the activity and have the best knowledge of it. Manag-
ers must examine whether their budgetary assumptions and estimates are reasonable. Budget targets should
match manager responsibilities. At the departmental level, the budget considers the expected work output and
translates it into estimated future costs.
Budgets are needed for each department. The sales department must forecast future sales volume of each
product or service as well as the selling price. It will probably budget revenue by sales territory and customer. It
will also budget costs such as wages, promotion and entertainment, and travel. The production department
must estimate future costs to produce the product or service and the cost per unit. The production manager
may have to budget work during the manufacturing activity so the workflow continues smoothly. The purchas-
ing department will budget units and dollar purchases. There may be a breakdown by supplier. There will be a
cost budget for salaries, supplies, rent, and so on. The stores department will budget its costs for holding inven-
tory. There may be a breakdown of products into categories. The finance department must estimate how much
money will be received and where it will be spent to determine cash adequacy.

153
Budget Revision
A budget should be regularly monitored. It should be revised to make it accurate during the period because of
error, feedback, new data, changing conditions (e.g., economic, political, corporate), or modification of the
company’s plan. Human error is more likely when the budget is large and complex. A change in conditions will
typically affect the sales forecast and resulting cost estimates. Revisions are more common in volatile industries.
The budget revision applies to the remainder of the accounting period.
A company may “roll a budget” which is continuous budgeting for an additional incremental period at the end of
the reporting period. The new period is added to the remaining periods to form the new budget. Continuous
budgets reinforce constant planning, consider past information, and take into account emerging conditions.
Here are some best practices that can transform budgeting into a value-added activity:
1. Budgeting and strategic planning are linked together. Planning should also link short-term, intermediate-
term, and long-term goals.
2. Incorporate budgeting procedures with strategic planning. For example, strategic assessments should
include a review of suppliers, competitive analysis, and evaluation of industry trends and other proce-
dures that might take place within the budgeting process.
3. The time spent collecting and gathering data should be minimized so that management may allocate
more time in analyzing information for strategic decision making.
4. Obtain agreement on budgets before preparing detail budgets.
5. Standardize and automate the collection and consolidation of budgets.
6. Budgeting is a continuous process that accepts changes quickly to allow alternative thinking.
7. Leverage the financial systems by establishing a data warehouse allowing for the use of financial report-
ing and budgeting.
8. The budgeting system has the capability to manage intercompany eliminations and foreign currency
conversions for multi-national companies.
Failing to budget because of the uncertainty of the future is a poor excuse for not budgeting. In fact, the less
stable the conditions, budgeting becomes critical and the process becomes even more challenging. Clearly, sta-
ble operating conditions allow greater reliance on past experience as a basis for budgeting. However, budgets
involve more than a company’s past results. Budgets also consider a company’s future plans and express ex-
pected activities.
Motivation and Flexibility
Budgets can be used to affect employee attitudes and performance. Budgets should be participative including
participation by those who are affected by them. Furthermore, lower level employees are on the operating line
every day so they are quite knowledgeable and their input is needed. Budgets can be used to motivate, because
participants will internalize the budget goals as their own since they participated in their development. Infor-
mation should be interchanged among budget participants. An imposed budget will have a negative effect upon
motivation.

154
A budget is a motivational and challenging tool if it is tight, but attainable. It has to be realistic. If the budget is
too tight, it will result in frustration because managers will give up and not try to achieve the unrealistic targets.
If it is too loose, complacency will arise and workers may “goof off.” Before a budget can be an effective motiva-
tional tool, it must be viewed as realistic by employees, so targets should be attainable.
The best way to set budget targets is with a probability of achievement, by most managers, 80-90% of the time.
Performance above the target level should be supplemented with incentives including bonuses, promotion, and
additional responsibility.
Budgets should be understandable and attainable. Flexibility and innovation is critical to allow for unexpected
contingencies. Flexibility is aided by variable budgets, supplemental budgets, authorized variances, and review
and revision. Budgets should be computerized to aid “what-if” analysis. Budgeting enhances flexibility through
the planning process because alternative courses of action are considered in advance rather than forcing less-
informed decisions to be made on the spot. As one factor changes, other factors within the budget will also
change. Internal factors are controllable by the company whereas external factors are usually uncontrollable.
Internal factors include risk and product innovation.
Budget Weaknesses
To effectively make the budgeting process into a value-added activity, we must first recognize the problems as-
sociated with budgeting. According to Controller Magazine, the following are the top ten problems with budget-
ing:
1. Takes too long to prepare.
2. Does not help us run our business.
3. Budgets are out-of-date by the time we get them.
4. Too much playing with the numbers.
5. Too many iterations / repetitive tasks within the process.
6. Budgets are cast in stone in a constantly changing business environment.
7. Too many people are involved in the budgeting process.
8. Unable to control budget allocations.
9. By the time budgets are complete, I don't recognize the numbers.
10. Budgets do not match the strategic goals and objectives of the organization.
In addition, the signs of budget weaknesses must be spotted so that corrective action may be taken as soon as
possible. Such signs include:
• Managerial goals are off target or unrealistic.
• There is management indecisiveness.
• The budget takes too long to prepare.
• Budget preparers are unfamiliar with the operations being budgeted and do not seek such information.
Budget preparers should visit the actual operations firsthand.
• Budget preparers do not keep current.
• The budget is prepared using different methods each year.

155
• There is a lack of raw information going into the budgeting process.
• There is a lack of communication between those involved in budgeting and operating personnel.
• The budget is formulated without input from those affected by it. This will likely result in budgeting er-
rors. Further, budget preparers do not go into the operations field.
• Managers do not know how their budget allowances have been assigned nor what the components of
their charges are. If managers do not understand the information, they will not properly perform their
functions.
• The budget document is excessively long, confusing, or filled with unnecessary information. There may
be inadequate narrative data to explain the numbers.
• Managers are ignoring their budgets because they appear unusable and unrealistic.
• Managers feel they are not getting anything out of the budget process. There are excessively frequent
changes in the budget.
• Significant unfavorable variances are not investigated and corrected. These variances may also not be
considered in deriving budgeted figures for next period. A large variance between actual and budgeted
figures, either positive or negative, that occurs repeatedly is an indicator of poor budgeting. Perhaps the
budgeted figures were unrealistic. Another problem is that after variances are identified, it is too late to
correct their causes. Variance reporting may be too infrequent.
• There is a mismatching of products or services.
156
Chapter 7 Review Questions
1. Which one of the following management considerations is usually addressed first in strategic planning?
A. Outsourcing
B. Overall objectives of the firm
C. Organizational structure
D. Recent annual budgets
2. What are the major objectives of any budget system?
A. To define responsibility centers, provide a framework for performance evaluation, and ensure goal con-
gruence communication and coordination among responsibility centers
B. To foster the planning of operations, facilitate the fixing of blame for missed budget predictions, and en-
sure goal congruence between superiors and subordinates
C. To foster the planning of operations, provide a framework for performance evaluation, and promote
communication and coordination among organization segments
D. To define responsibility centers, facilitate the fixing of blame for missed budget predictions, and ensure
goal congruence between superiors and subordinates
3. There are various budgets within the master budget cycle. One of these budgets is the production budget.
Which one of the following best describes the production budget?
A. It summarizes all discretionary costs.
B. It includes required direct labor hours.
C. It includes required material purchases.
D. It is calculated from the beginning and desired ending inventories, and the budgeted sales.
157
Chapter 8: Financial Forecasting Techniques
Learning Objectives:
After completing this section, you will be able to:
• Identify examples of the different costs found in a company, such as fixed and semi-variable costs
• Recognize different methods for estimating costs
• Recognize various contribution margin concepts
The Role of the CFO
Today's CFOs have a tremendous responsibility for forecasting. They are the ones that ensure that the cost ac-
counting systems produce accurate (not distorted) cost data for managerial uses for performance measurement
and for strategic decisions on pricing, product mix, process technology, and product design. They also need to
know how to analyze cost information for planning and control and make operational and tactical decisions.
The costs determine the selling price -- if a company’s costs exceed its selling price, it will incur a loss. All costs
applicable to a product or service must be considered when determining a selling price, including manufactur-
ing, selling, and other expenses. It should also account for expected inflationary price increases. For example, if
inflation is expected to be 3 percent next year, the selling price should similarly be increased by 3 percent. Cost
information also assists CFOs and their teams in determining the profitability of a particular product, territory, or
customer. Thus, obtaining and understanding cost information is essential to the success of a business. The first
part of this chapter covers three types of cost behavior; variable, fixed, and mixed.
Before a business can realize profit, CFOs need to understand the concept of breaking even. To break even on a
company's product lines and/or services, CFOs should be able to calculate the sales volume needed to cover
their costs and how to use this information to their advantage. CFOs need to be familiar with how the costs re-
act to changes in volume. Break-even analysis (cost-volume-profit analysis or CVP) allows CFOs to answer many
planning questions. The second part of this chapter focuses on the break-even analysis to assist CFOs in making
management decisions concerning the feasibility of introducing products or services.
158
Analysis of Cost Behavior and Cost Prediction
Not all costs behave in the same way. There are certain costs that vary in proportion to changes in volume or
activity, such as labor hours and machine hours. There are other costs that do not change even though volume
changes. An understanding of cost behavior is helpful to CFOs, budgeters, cost analysts, and managerial ac-
countants as follows:
1. Cost prediction
2. Break-even and contribution margin analysis
3. Appraisal of divisional performance
4. Flexible budgeting
5. Short-term choice decisions
6. Transfer pricing decisions
Costs by Behavior
Depending on how a cost will react or respond to changes in the level of activity, costs may be viewed as varia-
ble, fixed, or mixed (semi-variable). This classification is made within a specified range of activity, called the rele-
vant range. The relevant range is the volume zone within which the behavior of variable costs, fixed costs, and
selling prices can be predicted with reasonable accuracy.
Variable Costs
Variable costs vary in total with changes in volume or level of activity. Examples of variable costs include the
costs of direct materials, direct labor, and sales commissions. The following factory overhead items fall in the
variable cost category:
Variable Factory Overhead
Supplies Receiving Costs
Fuel and Power Overtime Premium
Spoilage and Defective Work
Fixed Costs
Fixed costs do not change regardless of the volume or level of activity. Examples include advertising expense,
salaries, and depreciation. The following factory overhead items fall in the fixed cost category:
Fixed Factory Overhead
Property Taxes Rent on Factory Building
Depreciation Indirect labor
Insurance Patent Amortization

159
Mixed (Semi-Variable) Costs
Mixed costs contain both a fixed element and a variable one. Salespersons' compensation including salary and
commission is an example. The following factory overhead items may be considered mixed costs:
Mixed Factory Overhead
Supervision Maintenance and Repairs
Inspection Workmen’s Compensation Insurance
Service Department Costs Employer's Payroll Taxes
Utilities Rental of Delivery Truck
Fringe Benefits Quality Costs
Cleanup Costs
Note that factory overhead, taken as a whole, would be a perfect example of mixed costs. Figure 8-1 displays
how each of these three types of costs varies with changes in volume.
Figure 8-1
Cost Behavior Patterns
For planning, control, and decision-making purposes, mixed costs need to be separated into their variable and
fixed components. Since the mixed costs contain both fixed and variable elements, the analysis takes the
following mathematical form, which is called a cost-volume formula (flexible budget formula or cost function):
y = a + bx
where y = the mixed cost to be broken up. x = any given measure of activity (cost driver) such as direct labor hours, machine
hours, or production volume. a = the fixed cost component. b = the variable rate per unit of x.
Management quite often uses the notion of relevant range in estimating cost behavior. The relevant range is the
range of activity over which the company expects a set of cost behaviors to be consistent (or linear). For exam-
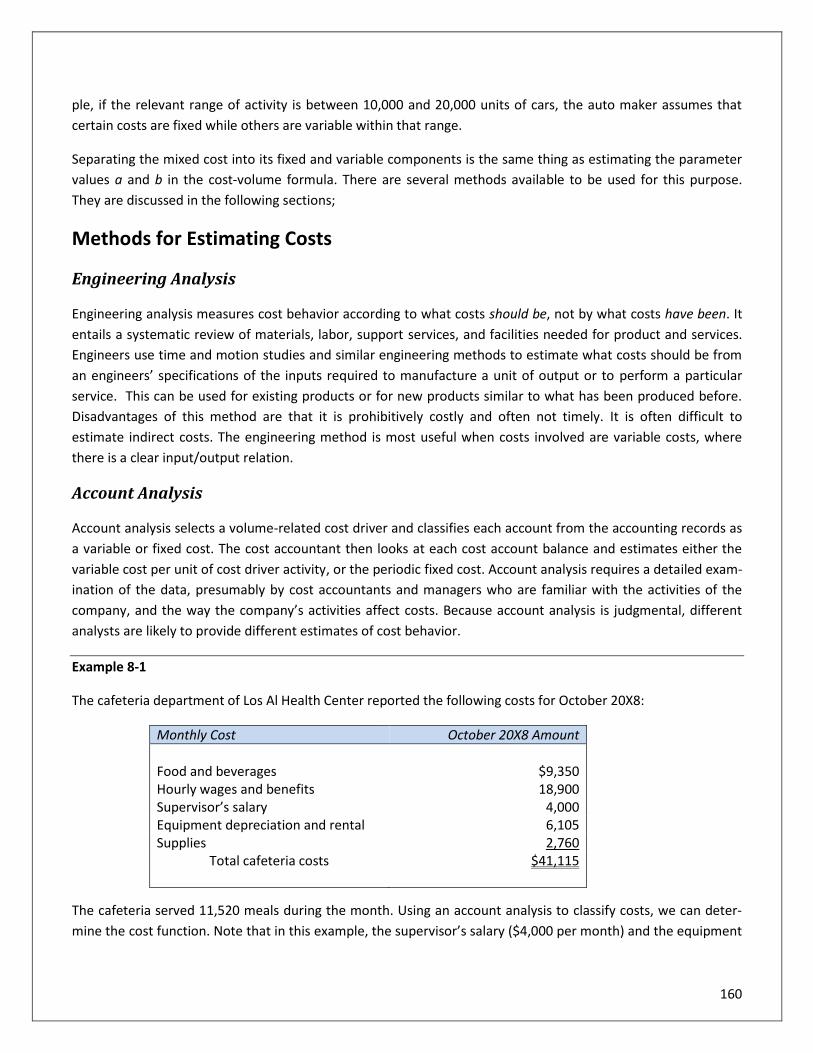
160
ple, if the relevant range of activity is between 10,000 and 20,000 units of cars, the auto maker assumes that
certain costs are fixed while others are variable within that range.
Separating the mixed cost into its fixed and variable components is the same thing as estimating the parameter
values a and b in the cost-volume formula. There are several methods available to be used for this purpose.
They are discussed in the following sections;
Methods for Estimating Costs
Engineering Analysis
Engineering analysis measures cost behavior according to what costs should be, not by what costs have been. It
entails a systematic review of materials, labor, support services, and facilities needed for product and services.
Engineers use time and motion studies and similar engineering methods to estimate what costs should be from
an engineers’ specifications of the inputs required to manufacture a unit of output or to perform a particular
service. This can be used for existing products or for new products similar to what has been produced before.
Disadvantages of this method are that it is prohibitively costly and often not timely. It is often difficult to
estimate indirect costs. The engineering method is most useful when costs involved are variable costs, where
there is a clear input/output relation.
Account Analysis
Account analysis selects a volume-related cost driver and classifies each account from the accounting records as
a variable or fixed cost. The cost accountant then looks at each cost account balance and estimates either the
variable cost per unit of cost driver activity, or the periodic fixed cost. Account analysis requires a detailed exam-
ination of the data, presumably by cost accountants and managers who are familiar with the activities of the
company, and the way the company’s activities affect costs. Because account analysis is judgmental, different
analysts are likely to provide different estimates of cost behavior.
Example 8-1
The cafeteria department of Los Al Health Center reported the following costs for October 20X8:
Monthly Cost October 20X8 Amount
Food and beverages $9,350 Hourly wages and benefits 18,900 Supervisor’s salary 4,000 Equipment depreciation and rental 6,105 Supplies 2,760
Total cafeteria costs $41,115
The cafeteria served 11,520 meals during the month. Using an account analysis to classify costs, we can deter-
mine the cost function. Note that in this example, the supervisor’s salary ($4,000 per month) and the equipment

161
depreciation and rental ($6,105 per month) are fixed, while the remainder ($31,010) varies with the cost drive
(i.e. the number of meals served). Dividing the variable costs by the number of meals served yields $2.692 and
the department’s cost-volume formula is: $10,105 (fixed) + $2.692 per meal.
The High-Low Method
The high-low method, as the name indicates, uses two extreme data points to determine the values of a (the
fixed cost portion) and b (the variable rate) in the equation y = a + bx. The extreme data points are the highest
representative x-y pair and the lowest representative x-y pair. The activity level x, rather than the mixed cost
item y, governs their selection.
The high-low method is explained, step by step, as follows:
Step 1: Select the highest pair and the lowest pair of data points, and Step 2: Compute the variable rate, b, using the formula:
Variable rate = Difference in cost y
Difference in activity x
Step 3: Compute the fixed cost portion as:
Fixed cost portion = Total mixed cost − Variable cost (or a = y – bx)
Example 8-2
Flexible Manufacturing Company decided to relate total factory overhead costs to direct labor hours (DLH) to
develop a cost-volume formula in the form of y = a + bx. Twelve monthly observations are collected. They are
listed in Table 8-1 and plotted as shown in Figure 2.
Table 8-1
Direct Labor Hours (x) Factory Overhead (y) Month (000 omitted) (000 omitted)
January 9 hours $15 February 19 20 March 11 14 April 14 16 May 23 25 June 12 20 July 12 20 August 22 23 September 7 14 October 13 22

162
November 15 18 December 17 18
Total 174 hours $225
The high-low points selected from the monthly observations are;
X Y
High 23 hours $25 (May) Low 7 14 (September) Difference 16 hours $11
Thus;
Variable rate b = Difference in Y
= $11
= $0.6875 per DLH Difference in X 16 hours
Figure 2
Scatter Diagram
The fixed cost portion is computed as:
High Low
Factory overhead (y) $25 $14 Variable expense ($0.6875 per DLH) (15.8125)* (4.8125)* 9.1875 9.1875
*$0.6875 x 23 hours = $15.8125; $0.6875 x 7 hours = $4.8125
163
Therefore, the cost-volume formula for factory overhead is:
$9.1875 fixed plus $0.6875 per DLH.
The high-low method is simple and easy to use. It has the disadvantage, however, of using two extreme data
points, which may not be representative of normal conditions. The method may yield unreliable estimates of a
and b in our formula. In such a case, it would be wise to drop them and choose two other points that are more
representative of normal situations. Be sure to check the scatter diagram for this possibility.
Regardless of choice of the method, whether the high-low method; or the least-squares method, for that
matter, the analyst must plot the observed data on a scatter diagram (also called a scattergraph or scatterplot).
The reason is that the relationship between y and x shows a linear pattern in order to justify the use of the linear
form y = a + bx.
For the high-low method, (1) it is easier to locate the highest and lowest pairs with a scatter diagram than on
the table, and (2) it allows the analyst to ensure that the two points chosen are not extreme outliners (i.e. they
must be representative of normal behavior).
Break-Even and Contribution Margin Analysis
Break-even analysis, a branch of cost-volume-profit analysis, determines the break-even sales. The break-even
point (the financial crossover point when revenues exactly match costs), does not show up in corporate earnings
reports, but managerial accountants find it an extremely useful measurement in a variety of ways.
The Concept of Cost-Volume-Profit Analysis
Cost-Volume-Profit (CVP) analysis relates to the way profit and costs change with a change in volume. CVP anal-
ysis examines the impact on earnings of changes in such factors as variable cost, fixed cost, selling price, volume,
and product mix. CVP information helps CFOs to predict the effect of any number of contemplated actions and
to make better planning decisions. More specifically, CVP analysis tries to answer the following questions:
1. What sales volume is required to break even? How long will it take to reach that sales volume?
2. What sales volume is necessary to earn a desired profit?
3. What profit can be expected on a given sales volume?
4. How would changes in selling price, variable costs, fixed costs, and output affect profits?
5. How would a change in the mix of products sold affect the break-even and target volume and profit
potential?
Contribution Margin (CM)
For accurate CVP analysis, a distinction must be made between costs as being either variable or fixed. Mixed
costs must be separated into their variable and fixed components.
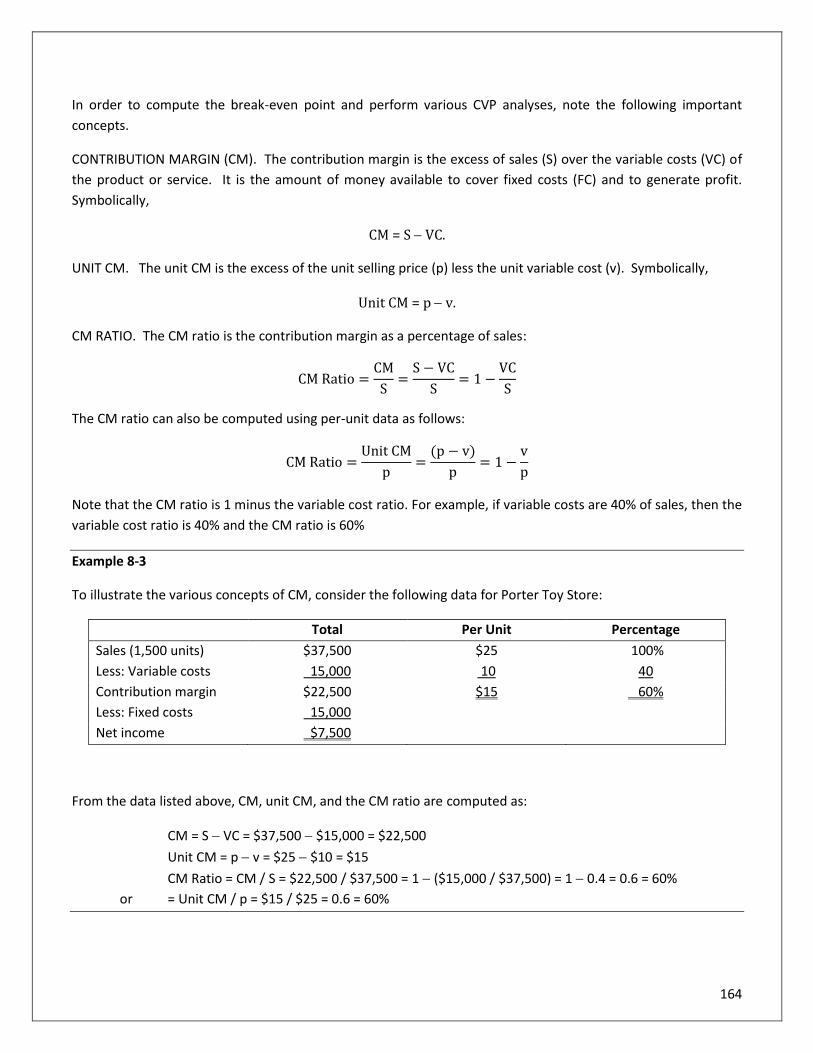
164
In order to compute the break-even point and perform various CVP analyses, note the following important
concepts.
CONTRIBUTION MARGIN (CM). The contribution margin is the excess of sales (S) over the variable costs (VC) of
the product or service. It is the amount of money available to cover fixed costs (FC) and to generate profit.
Symbolically,
CM = S − VC.
UNIT CM. The unit CM is the excess of the unit selling price (p) less the unit variable cost (v). Symbolically,
Unit CM = p − v.
CM RATIO. The CM ratio is the contribution margin as a percentage of sales:
CM Ratio =CM
S=
S − VC
S= 1 −
VC
S
The CM ratio can also be computed using per-unit data as follows:
CM Ratio =Unit CM
p=
(p − v)
p= 1 −
v
p
Note that the CM ratio is 1 minus the variable cost ratio. For example, if variable costs are 40% of sales, then the
variable cost ratio is 40% and the CM ratio is 60%
Example 8-3
To illustrate the various concepts of CM, consider the following data for Porter Toy Store:
Total Per Unit Percentage
Sales (1,500 units) $37,500 $25 100%
Less: Variable costs 15,000 10 40
Contribution margin $22,500 $15 60%
Less: Fixed costs 15,000
Net income $7,500
From the data listed above, CM, unit CM, and the CM ratio are computed as:
CM = S − VC = $37,500 − $15,000 = $22,500
Unit CM = p − v = $25 − $10 = $15
CM Ratio = CM / S = $22,500 / $37,500 = 1 − ($15,000 / $37,500) = 1 − 0.4 = 0.6 = 60%
or = Unit CM / p = $15 / $25 = 0.6 = 60%

165
Break-Even Analysis
A company’s objective of course is not just to break even, but to earn a profit. In deciding which products to
push, continue, or discontinue, the break-even point is not the only important factor. Economic conditions,
supply and demand, and the long-term impact on customer relations must also be considered. Break-even anal-
ysis can be extended to concentrate on a desired profit objective.
The break-even point depends on three factors:
1. The product’s selling price
2. The variable costs of production, selling, and administration
3. The fixed costs of production, selling, and administration
The break-even sales can be determined using the graphic, equation, and formula approaches. Using the graph-
ic approach (see Figure 8-3), revenue, total cost, and fixed cost are plotted on a vertical axis and volume is plot-
ted on a horizontal axis. The break-even point occurs at the intersection of the revenue line and the total cost
line. Figure 8-3 also depicts profit potentials over a wide range of activity. It shows how profits increase with
increases in volume.
Figure 8-3
The equation approach uses the following equation:
S = VC + FC
S – VC = FC
where S = sales, VC = variable cost, (S – VC) = contribution margin, and FC = fixed cost.
At the breakeven point, the contribution margin equals total fixed cost.

166
This approach allows you to solve for break-even sales or for other unknowns as well. An example is selling
price. If you want a desired before-tax profit, solve for P in the following equation:
S = VC + C + P
The guidelines for breaking even are:
• An increase in selling price lowers break-even sales.
• An increase in variable cost increases break-even sales.
• An increase in fixed cost increases break-even sales.
Example 8-4
A product has a fixed cost of $270,000 and a variable cost of 70% of sales. The point of break-even sales can be
calculated as follows:
S = VC + FC
1 S = .7S + $270,000
0.3S = $270,000
S = $900,000
If the selling price per unit is $100, break-even units are 9,000 ($900,000/$100). If desired profit is $40,000, the
sales needed to obtain that profit (P) can be calculated as follows:
S = VC + FC + P
1S = 0.7S + $270,000 + $40,000
0.3S = $310,000
S = $1,033,333
Example 8-5
If the selling price per unit is $30, the variable cost per unit is $20, and the fixed cost is $400,000, the break-even
units (U) can be calculated as follows:
S = VC + FC
$30U = $20U + $400,000
$10U = $400,000
U = 40,000
The break-even dollar amount is:
40,000 units x $30 = $1,200,000

167
Example 8-6
You sell 800,000 units of an item. The variable cost is $2.50 per unit. Fixed cost totals $750,000. The selling
price (SP) per unit should be $3.44 to break even:
S = VC + FC
800,000SP = ($2.50 x 800,000) + $750,000
800,000SP = $2,750,000
SP = $3.44
Example 8-7
Assume your selling price is $40, your sales volume is 20,000 units, your variable cost is $15 per unit, your
fixed cost is $120,000, your after-tax profit is $60,000, and your tax rate is 40%. To determine how much you
have available to spend on research (R), consider this equation:
S = VC + FC + P + R
($40 x 20,000) = ($15 x 20,000) + $120,000 + $ 100,000* + R
$280,000 = R
* After-tax profit: $ 60,000 = 0. 6 x before-tax profit
$60,000 / .6 = before-tax profit
$100,000 = before-tax profit
Margin of Safety
The margin of safety is a measure of difference between the actual sales and the break-even sales. It is the
amount by which sales revenue may drop before losses begin, and is expressed as a percentage of expected
sales:
Margin of Safety = (Expected Sales − Break-even Sales)
Expected Sales
The margin of safety is used as a measure of operating risk. The larger the ratio, the safer the situation since
there is less risk of reaching the break-even point.
Example 8-8
Assume Porter Toy Store projects sales of $35,000 with a break-even sales level of $25,000. The projected
margin of safety is:
($35,000 − $25,000) / $35,000 = 28.57%

168
This means that sales volume could drop by 28.57% before the company would incur a loss.
Sales Mix Analysis
Break-even and cost-volume-profit analysis requires some additional computations and assumptions when a
company produces and sells more than one product. In multi-product firms, sales mix is an important factor in
calculating an overall company break-even point.
Different selling prices and different variable costs result in different unit CM and CM ratios. As a result, the
break-even points and cost-volume-profit relationships vary with the relative proportions of the products sold,
called the sales mix.
In break-even and CVP analysis, it is necessary to predetermine the sales mix and then compute a weighted
average unit CM. It is also necessary to assume that the sales mix does not change for a specified period. The
break-even formula for the company as a whole is:
Break − even sales in units (or in dollars) =(Fixed Costs)
(Weighted Average Unit CM (or CM Ratio)
Example 8-9
Assume that Knibex, Inc. produces cutlery sets made out of high-quality wood and steel. The company makes a
deluxe cutlery set and a standard set that have the following unit CM data:
Deluxe Standard
Selling price $15 $10
Variable cost per unit 12 5
Unit CM $3 $5
Sales mix 60% 40%
(based on sales volume)
Fixed costs $76,000
The weighted average unit CM = ($3)(0.6) + ($5)(0.4) = $3.80. Therefore, the company's break-even point in
units is:
$76,000/$3.80 = 20,000 units
which is divided as follows:
Deluxe: 20,000 units x 60% = 12,000 units
Standard: 20,000 units x 40% = 8,000
20,000 units

169
Example 8-10
Assume that Dante, Inc. is a producer of recreational equipment. It expects to produce and sell three types of
sleeping bags; the Economy, the Regular, and the Backpacker. Information on the bags is given below:
Budgeted
Economy Regular Backpacker Total
Sales $30,000 $60,000 $10,000 $100,000
Sales mix 30% 60% 10% 100%
Less VC 24,000
(80%)
40,000
(66 2/3%)
5,000
(50%)
69,000
CM $6,000 $20,000 $5,000 $31,000
CM ratio 20% 33 1/3% 50% 31%
Fixed costs $18,600
Net income $12,400
The CM ratio for Dante, Inc. is $31,000/$100,000 = 31 percent.
Therefore, the break-even point in dollars is:
$18,600/0.31 = $60,000
which will be split in the mix ratio of 3:6:1 to give us the following break-even points for the individual products:
Economy: $60,000 x 30 % = $18,000
Regular: $60,000 x 60 % = 36,000
Backpacker: $60,000 x 10 % = 6,000
$60,000
One of the most important assumptions underlying CVP analysis in a multi-product firm is that the sales mix will
not change during the planning period. But if the sales mix changes, the break-even point will also change.
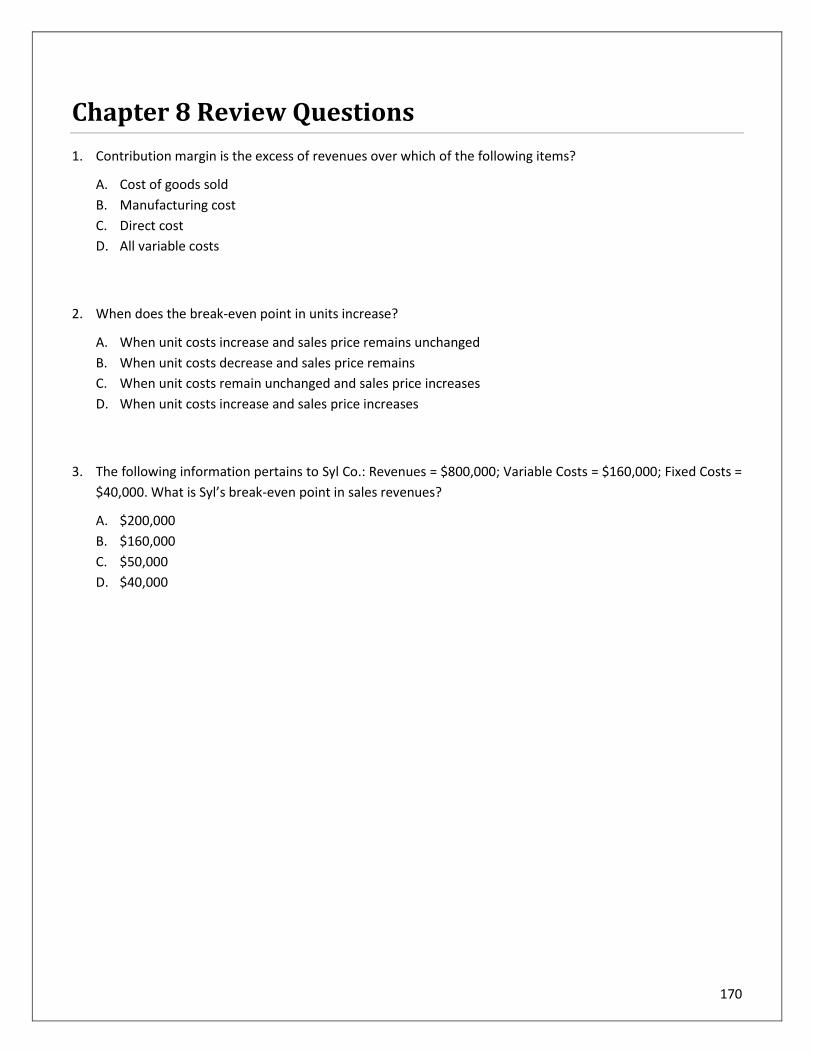
170
Chapter 8 Review Questions
1. Contribution margin is the excess of revenues over which of the following items?
A. Cost of goods sold
B. Manufacturing cost
C. Direct cost
D. All variable costs
2. When does the break-even point in units increase?
A. When unit costs increase and sales price remains unchanged
B. When unit costs decrease and sales price remains
C. When unit costs remain unchanged and sales price increases
D. When unit costs increase and sales price increases
3. The following information pertains to Syl Co.: Revenues = $800,000; Variable Costs = $160,000; Fixed Costs =
$40,000. What is Syl’s break-even point in sales revenues?
A. $200,000
B. $160,000
C. $50,000
D. $40,000

171
Chapter 9: Capital Investment Analysis
Learning Objectives
After completing this section, you will be able to:
• Recognize the uses of capital budgeting
• Identify different attributes and ratios used in capital budgeting decisions
The Role of the CFO
Capital budgeting is the process of making long-term investment decisions. The CFO plays an important role in
advising management on long-range decisions that will benefit the company for many years, such as investing in
new buildings and equipment. Long-term decisions have a great impact on the long-run success of a company.
Incorrect long-term decisions can threaten the survival of a company. To make long-term investment decisions
in accordance with a goal, CFOs need to know three key concepts of evaluating capital budgeting projects:
1. Estimating cash flows
2. Estimating the cost of capital (or required rate of return)
3. Applying a decision rule to determine if a project is "good" or "bad”
Capital expenditures do not occur as often as ordinary expenditures, such as payroll or inventory purchases, but
they involve substantial sums of funds that are committed for a long period. As a result, the methods by which
companies evaluate capital expenditure decisions should be more formal and detailed than would be necessary
for ordinary purchase decisions.
The capital expenditure budget lists capital assets to be purchased, sold, or discarded. Capital expenditures may
be made to replace obsolete machinery or to expand and improve, such as expenditures needed for new prod-
uct lines. CFOs should carefully evaluate alternative capital proposals. Further, retirement of capital assets
without adequate replacements may have negative long-term effects.
Knowledge of capital budgeting and selecting the most profitable project among long term alternatives is essen-
tial. This chapter introduces the general concepts behind capital budgeting. It discusses and illustrates six meth-
ods for selecting the best alternatives among capital projects. The risk-return trade-off method shown in this
chapter is one way to help CFOs come to grips with uncertainty.

172
The Concept of Capital Budgeting
The Definition of Capital Budgeting
There are many investment decisions that a company may make in order to grow. Examples of capital budgeting
applications are product line selection, keep-or-sell business segment decisions, lease or buy decisions, and de-
termination of which long-lived asset to invest in. Capital budgeting is the process of considering alternative
capital projects and selecting those alternatives that provide the most profitable return on available funds, with-
in the framework of company goals and objectives.
A capital project is any available option to purchase, build, lease, or renovate buildings, equipment, or other
long-range major items of property. The option selected usually involves large sums of money and brings about
a large increase in fixed costs for a number of years in the future. Once a company builds a plant or undertakes
some other capital expenditure, its future plans are less flexible. Factors to consider in determining capital ex-
penditures include:
• Rate of return
• Budget ceiling
• Probability of success
• Competition
• Tax rate
• Dollar amounts
• Time value of money
• Risk
• Liquidity
• Long-term business strategy
• Forecasting errors
Capital expenditures should be kept within authorized limits. If amounts are needed above those limits, special
approval by top management is required. A project not meeting expectations or that is no longer appropriate,
given current circumstances, may be cancelled. It is better to cancel a project if the cost/benefit relationship in-
dicates that the project is no longer viable. If a project is a succession of individual projects, a partial authoriza-
tion may be made.
Types of Long-Term Investment Decisions
There are typically two types of long-term investment decisions:
1. Decisions in terms of obtaining new facilities or expanding existing ones. Examples include:
• Investments in property, plant, and equipment as well as other types of assets
• Resource commitments in the form of new product development, market research, introduction of
information technology (IT), refunding of long-term debt, and so on

173
• Mergers and acquisitions in the form of buying another company to add a new product line
2. Decisions in terms of replacing existing facilities with new ones. Examples include replacing an old ma-
chine with a high-tech machine.
Features of Investment Projects
In general, long-term investments have three important features:
1. They typically involve a large amount of initial cash outlays which tend to have a long-term impact on
the company’s future profitability. Therefore, this initial cash outlay needs to be justified on a cost-
benefit basis.
2. There are expected recurring cash inflows (for example, increased revenues, savings in cash operating
expenses, etc.) over the life of the investment project. This frequently requires considering the time val-
ue of money. Depreciation expense is a consideration only to the extent that it affects the cash flows
for taxes. Otherwise, depreciation is excluded from the analysis because it is a noncash expense.
3. Income taxes could make a difference in the ‘accept or reject’ decision. Therefore, income tax factors
must be taken into account in every capital budgeting decision.
The Uses of Capital Budgeting
Whenever the company is faced with a decision of long-term investments, the following questions should be
asked:
• Should we replace certain equipment?
• Should we expand facilities by renting additional space, buying an existing building, or constructing a
new building?
• Should we invest in high-tech information technology?
• Should we launch on new product development?
• We’ve been thinking about adding a new product to our line. Should we?
Poor capital-budgeting decisions can be costly not only because of the large sums of money and relatively long
periods involved, but it can also create other problems as well, such as:
• The company may lose all or part of the funds originally invested in the project and not be able to realize
the expected benefits.
• Resources allocated to the project, such as finding suppliers and setting up a manufacturing site, are
wasted if the capital-budgeting decision must be revoked.
• The company's competitive position may be damaged because the company does not have the most ef-
ficient productive assets required to compete in the markets.
• Workers hired for the project are laid off due to the failures of the project, causing unemployment and
morale problems.

174
On the other hand, failure to invest enough funds in a good project can also be expensive. For example, at the
time of the original capital budgeting process in the 1960s, Ford failed to estimate the popularity of the Mustang
and was unable to expend more on the project due to a lack of available funds. Ford found itself short on pro-
duction capacity, which caused lost and postponed sales of the automobile.
Finally, the amount of funds available for investment will be limited because once a company makes a capital
investment decision, alternative investment opportunities are usually lost. The benefits or returns lost by reject-
ing the best alternative investment are the opportunity cost of a given project.
For all of these reasons, the following sections discuss the various capital budgeting methods including dis-
counted payback, payback, accounting rate of return, net present value, internal rate of return, and profitability
index. Consideration is also given to capital rationing.
Techniques for Evaluating Investment Proposals
Discount Rate
Several of the following topics will rely upon estimating the present value of either an annuity or a lump sum
received in the future. These are critical concepts that recognize the time value of money; that is, money re-
ceived at a later date is worth less than money received today due to inflation, interest rates and opportunity
costs. Future values must therefore be discounted. To help compute these discounts, we will use values based
on Table 9-1 and Table 9-2, found on the following pages. Of course, most people today would use a spread-
sheet or calculator to compute these values, but the exercises will help provide you with a basic understanding
of how the concepts are applied.
• Table 9-1 is used to determine the present value of an annuity. It discounts future annual payments,
such as loan payments, using the number of periods the payment is received and the interest rates (or
different costs of capital.)
• Table 9-2 is used to discount a lump-sum received at a future date, given different time periods and in-
terest rates (or different costs of capital.)
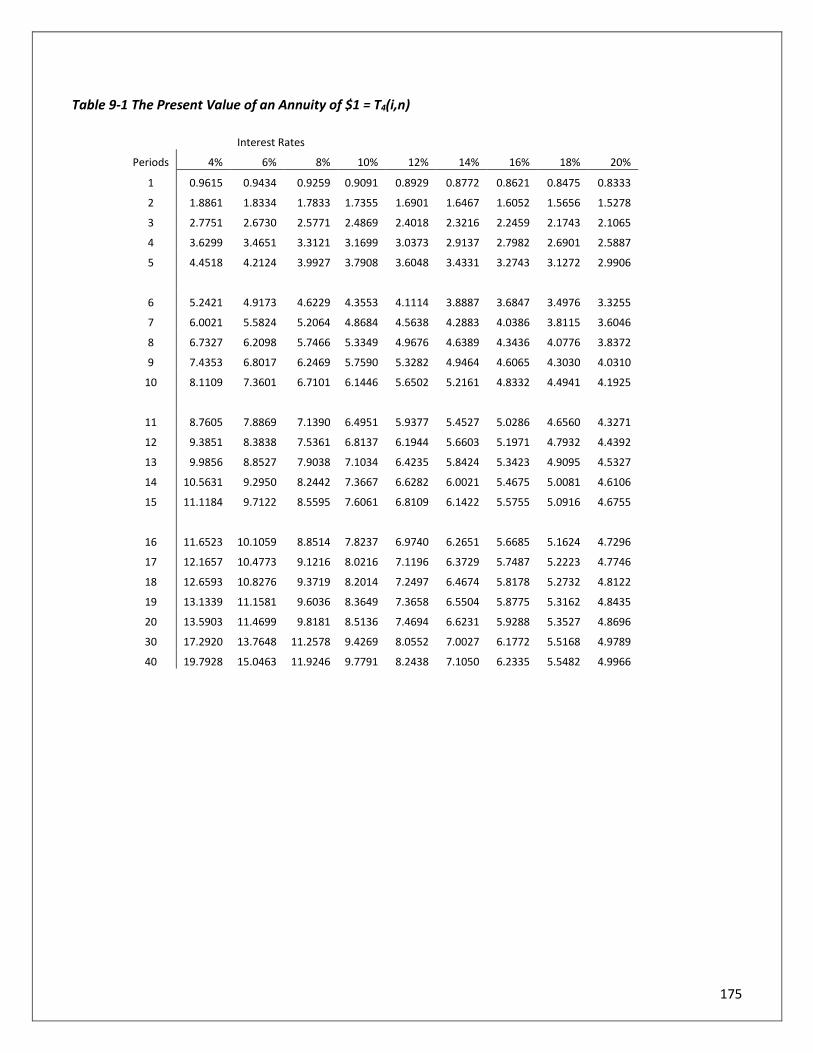
175
Table 9-1 The Present Value of an Annuity of $1 = T4(i,n)
Interest Rates
Periods 4% 6% 8% 10% 12% 14% 16% 18% 20%
1 0.9615 0.9434 0.9259 0.9091 0.8929 0.8772 0.8621 0.8475 0.8333
2 1.8861 1.8334 1.7833 1.7355 1.6901 1.6467 1.6052 1.5656 1.5278
3 2.7751 2.6730 2.5771 2.4869 2.4018 2.3216 2.2459 2.1743 2.1065
4 3.6299 3.4651 3.3121 3.1699 3.0373 2.9137 2.7982 2.6901 2.5887
5 4.4518 4.2124 3.9927 3.7908 3.6048 3.4331 3.2743 3.1272 2.9906
6 5.2421 4.9173 4.6229 4.3553 4.1114 3.8887 3.6847 3.4976 3.3255
7 6.0021 5.5824 5.2064 4.8684 4.5638 4.2883 4.0386 3.8115 3.6046
8 6.7327 6.2098 5.7466 5.3349 4.9676 4.6389 4.3436 4.0776 3.8372
9 7.4353 6.8017 6.2469 5.7590 5.3282 4.9464 4.6065 4.3030 4.0310
10 8.1109 7.3601 6.7101 6.1446 5.6502 5.2161 4.8332 4.4941 4.1925
11 8.7605 7.8869 7.1390 6.4951 5.9377 5.4527 5.0286 4.6560 4.3271
12 9.3851 8.3838 7.5361 6.8137 6.1944 5.6603 5.1971 4.7932 4.4392
13 9.9856 8.8527 7.9038 7.1034 6.4235 5.8424 5.3423 4.9095 4.5327
14 10.5631 9.2950 8.2442 7.3667 6.6282 6.0021 5.4675 5.0081 4.6106
15 11.1184 9.7122 8.5595 7.6061 6.8109 6.1422 5.5755 5.0916 4.6755
16 11.6523 10.1059 8.8514 7.8237 6.9740 6.2651 5.6685 5.1624 4.7296
17 12.1657 10.4773 9.1216 8.0216 7.1196 6.3729 5.7487 5.2223 4.7746
18 12.6593 10.8276 9.3719 8.2014 7.2497 6.4674 5.8178 5.2732 4.8122
19 13.1339 11.1581 9.6036 8.3649 7.3658 6.5504 5.8775 5.3162 4.8435
20 13.5903 11.4699 9.8181 8.5136 7.4694 6.6231 5.9288 5.3527 4.8696
30 17.2920 13.7648 11.2578 9.4269 8.0552 7.0027 6.1772 5.5168 4.9789
40 19.7928 15.0463 11.9246 9.7791 8.2438 7.1050 6.2335 5.5482 4.9966

176
Table 9-2 The Present Value of $1 = T3 (i,n)
Interest Rates
Periods 4% 6% 8% 10% 12% 14% 16% 18% 20%
1 0.9615 0.9434 0.9259 0.9091 0.8929 0.8772 0.8621 0.8475 0.8333
2 0.9246 0.8900 0.8573 0.8264 0.7972 0.7695 0.7432 0.7182 0.6944
3 0.8890 0.8396 0.7938 0.7513 0.7118 0.6750 0.6407 0.6086 0.5787
4 0.8548 0.7921 0.7350 0.6830 0.6355 0.5921 0.5523 0.5158 0.4823
5 0.8219 0.7473 0.6806 0.6209 0.5674 0.5194 0.4761 0.4371 0.4019
6 0.7903 0.7050 0.6302 0.5645 0.5066 0.4556 0.4104 0.3704 0.3349
7 0.7599 0.6651 0.5835 0.5132 0.4523 0.3996 0.3538 0.3139 0.2791
8 0.7307 0.6274 0.5403 0.4665 0.4039 0.3506 0.3050 0.2660 0.2326
9 0.7026 0.5919 0.5002 0.4241 0.3606 0.3075 0.2630 0.2255 0.1938
10 0.6756 0.5584 0.4632 0.3855 0.3220 0.2697 0.2267 0.1911 0.1615
11 0.6496 0.5268 0.4289 0.3505 0.2875 0.2366 0.1954 0.1619 0.1346
12 0.6246 0.4970 0.3971 0.3186 0.2567 0.2076 0.1685 0.1372 0.1122
13 0.6006 0.4688 0.3677 0.2897 0.2292 0.1821 0.1452 0.1163 0.0935
14 0.5775 0.4423 0.3405 0.2633 0.2046 0.1597 0.1252 0.0985 0.0779
15 0.5553 0.4173 0.3152 0.2394 0.1827 0.1401 0.1079 0.0835 0.0649
16 0.5339 0.3936 0.2919 0.2176 0.1631 0.1229 0.0930 0.0708 0.0541
17 0.5134 0.3714 0.2703 0.1978 0.1456 0.1078 0.0802 0.0600 0.0451
18 0.4936 0.3503 0.2502 0.1799 0.1300 0.0946 0.0691 0.0508 0.0376
19 0.4746 0.3305 0.2317 0.1635 0.1161 0.0829 0.0596 0.0431 0.0313
20 0.4564 0.3118 0.2145 0.1486 0.1037 0.0728 0.0514 0.0365 0.0261
30 0.3083 0.1741 0.0994 0.0573 0.0334 0.0196 0.0116 0.0070 0.0042
40 0.2083 0.0972 0.0460 0.0221 0.0107 0.0053 0.0026 0.0013 0.0007

177
Payback Period
The payback period measures the length of time required to recover the amount of initial investment. When
the annual cash flows are constant and of equal amounts, the payback period can be calculated by dividing the
initial investment by the cash inflows through increased revenues or cost savings. When using payback period
analysis to evaluate investment proposals, management may choose one of these rules to decide on project se-
lection:
1. Select the investments with the shortest payback periods.
2. Select only those investments that have a payback period of less than a specified number of years.
Both decision rules focus on the rapid return on invested capital. If capital can be recovered rapidly, a company
can invest it in other projects, thereby generating more cash inflows or profits. The formula for the payback pe-
riod is:
Payback Period = Initial Investment
Annual Net Cash Inflows
Example 9-1
Consider the following data:
Cost of investment $18,000
Annual after-tax cash savings $3,000
Then, the payback period is formulated as follows:
Payback Period = Initial Investment
= $18,000
= 6 Years Annual Net Cash Inflows $3,000
DECISION RULE: Choose the project with the shorter payback period. The rationale behind this choice is: The
shorter the payback period, the less risky the project, and the greater the liquidity. When periodic cash flows are
not equal, then calculation of the payback period is more complex.
Example 9-2
Consider the two projects of whose after-tax cash inflows are not even. Assume each project costs $1,000.
Cash Inflow
Year A($) B($)
1 100 500
2 200 400
3 300 300
4 400 100
5 500
6 600

178
When cash inflows are not even, the payback period has to be found by trial and error. The payback period of
project A is ($1,000= $100 + $200 + $300 + $400) 4 years. The payback period of project B is $1,000 = $500 +
$400 + $100):
2 years + $100/$300 = 2-1/3 years
Project B is the project of choice in this case, since it has the shorter payback period.
The advantages of using the payback period method of evaluating an investment project are that:
1. It is simple to compute and easy to understand.
2. It handles investment risk effectively.
The shortcomings of this method are that:
• It does not recognize the time value of money.
• It ignores the impact of cash inflow received after the payback period; essentially, cash flows after the
payback period determine profitability of an investment.
Discounted Payback Period
The company can take into account the time value of money by using the discounted payback period. The pay-
back period will be longer using the discounted method since money is worth less over time.
Discounted payback is computed by adding the present value of each year's cash inflows until they equal the
initial investment. The formula for the discounted payback is:
Discounted Payback = Initial Investment
Discounted Annual Cash Inflows
Example 9-3
A company invests $40,000 and expects the following cash inflows. The discounted payback period is calculated as
follows:
Accumulated
Year Cash inflows T1 factor Present value present value
1 $15,000 .9091 $13,637 $13,637
2 20,000 .8264 16,528 30,165
3 28,000 .7513 21,036 51,201
Thus, it takes 2 years to get $30,165 plus an additional .47 years [($40,000-$30,165)/21,036], for a total of 2.47
years.

179
Accounting Rate of Return
Accounting rate of return (ARR) measures profitability from the conventional accounting standpoint by relating
the required investment or sometimes the average investment to the future annual net income. The average
investment is the (Beginning balance + Ending balance)/2. If the ending balance is zero (as we assume), the av-
erage investment equals the original cash investment divided by 2. Under the ARR method, management would
choose the project with the higher rate of return.
The formula for the ARR is:
ARR = Net Income
Average Amount of Investment
Notice that this calculation uses annual income rather than net cash inflow.
The advantages of this method are that it is easily understandable, simple to compute, and recognizes the prof-
itability factor. However, it has several limitations:
• The length of time over which the return is earned is not considered.
• The rate allows a sunk cost, depreciation, to enter into the calculation. Since depreciation can be calcu-
lated in so many different ways, the rate of return can be manipulated by simply changing the method
of depreciation used for the project.
• The timing of cash flows is not considered. Thus, the time value of money is ignored.
Example 9-4
Consider the following investment:
Initial investment $6,500
Estimated life 20 years
Cash inflows per year $1,000
Depreciation per year (using straight line method) $325
The accounting rate of return for this project is:
ARR = Net Income
= $1,000 − $325
= 10.4%
Average Amount of Investment $6,500
If average investment (usually assumed to be one-half of the original investment) is used, then:
ARR = $1,000 − $325
= 20.8%
$3,250

180
Net Present Value
Net present value (NPV) takes into account the time value of money in the analysis. NPV is the excess of the pre-
sent value (PV) of cash inflows generated by the project over the amount of the initial investment (I):
NPV = PV − I
The present value of future cash flows is computed using the so-called cost of capital (or minimum required rate
of return) as the discount rate. In the case of an annuity, the present value would be:
PV = A . T4 (i, n) A is the amount of the annuity. The value of T4 is found in Table 9-1.
If NPV is positive, management should consider accepting the project. Otherwise reject it.
In many projects, the only cash outflow is the initial investment, and since it occurs immediately, the initial in-
vestment does not need to be discounted. Therefore, in such projects, a company may compute the net present
value of the proposed project as the present value of the annual net cash inflows minus the initial investment.
Other types of projects require that additional investments, such as a major repair, be made at later dates in the
life of the project. In those cases, the company must discount the cash outflows to their present value before
comparing them to the present value of the net cash inflows.
The advantages of the NPV method are that it obviously recognizes the time value of money and it is easy to
compute whether the cash flows form an annuity or vary from period to period. A major issue in acknowledging
the time value of money in the net present value method is determining an appropriate discount rate to use in
computing the present value of cash flows. Management requires some minimum rate of return on its invest-
ments. This rate should be the company's cost of capital, but that rate is difficult to determine. Therefore, under
the net present value method, management often selects a target rate that it believes to be at or above the
company's cost of capital, and then uses that rate as a basis for present value calculations.
Example 9-5
Consider the following investment:
Initial investment $12,950
Estimated life 10 years
Annual cash inflows $3,000
Cost of capital (minimum required rate of return) 12%
Present value of the cash inflows is:
PV = A . T4 (i, n)
= $3,000 . T4 (12%,10 years)
= $3,000 (5.650) $16,950
Initial investment (I) 12,950
Net present value (NPV = PV - I) $ 4,000

181
Since the NPV of the investment is positive, the investment should be accepted.
Internal Rate of Return
Internal rate of return (IRR) is defined as the rate of interest that equates I with the PV of future cash inflows. In
other words, at IRR:
I = PV
or NPV = 0
If the IRR equals or exceeds the cost of capital or target rate of return, a company should consider the invest-
ment further. If the proposal's IRR is less than the minimum rate, the company should reject the proposal.
The advantage of using the IRR method is that it does consider the time value of money and, therefore, is more
exact and realistic than the ARR method. The shortcomings of this method are that:
• It is time-consuming to compute, especially when the cash inflows are not even, although most business
calculators have a program to calculate IRR.
• It fails to recognize the varying sizes of investment in competing projects.
When cash inflows are not even, IRR is computed by the trial and error method, which is not discussed here.
Most financial calculators have a key for IRR calculations.
Example 9-6
Assume the same data given in Example 9-5, and set the following equality (I=PV):
$12,950 = $3,000 . T4(i,10 years)
T4(i,10 years) = $12,950/$3,000 = 4.317
which stands somewhere between 18% and 20% in the 10-year line of Table 9-1. The interpolation follows:
PV of an Annuity of $1 Factor T4(i,10 years)
18% 4.494 4.495
IRR 4.317
20% 4.192
Difference 0.1777 0.302
Therefore,
IRR = 18% + (0.177/0.302) (20% − 18%)
= 18% + 0.586(2%) = 18% + 1.17% = 19.17%
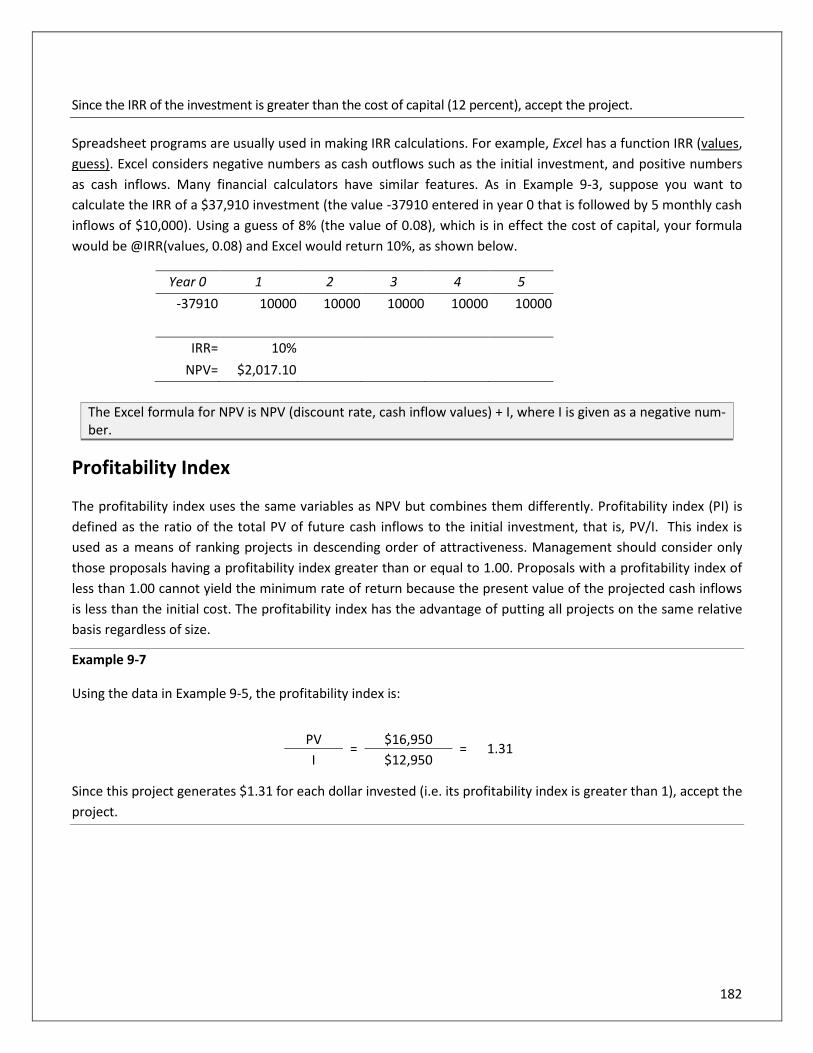
182
Since the IRR of the investment is greater than the cost of capital (12 percent), accept the project.
Spreadsheet programs are usually used in making IRR calculations. For example, Excel has a function IRR (values,
guess). Excel considers negative numbers as cash outflows such as the initial investment, and positive numbers
as cash inflows. Many financial calculators have similar features. As in Example 9-3, suppose you want to
calculate the IRR of a $37,910 investment (the value -37910 entered in year 0 that is followed by 5 monthly cash
inflows of $10,000). Using a guess of 8% (the value of 0.08), which is in effect the cost of capital, your formula
would be @IRR(values, 0.08) and Excel would return 10%, as shown below.
Year 0 1 2 3 4 5
-37910 10000 10000 10000 10000 10000
IRR= 10%
NPV= $2,017.10
The Excel formula for NPV is NPV (discount rate, cash inflow values) + I, where I is given as a negative num-ber.
Profitability Index
The profitability index uses the same variables as NPV but combines them differently. Profitability index (PI) is
defined as the ratio of the total PV of future cash inflows to the initial investment, that is, PV/I. This index is
used as a means of ranking projects in descending order of attractiveness. Management should consider only
those proposals having a profitability index greater than or equal to 1.00. Proposals with a profitability index of
less than 1.00 cannot yield the minimum rate of return because the present value of the projected cash inflows
is less than the initial cost. The profitability index has the advantage of putting all projects on the same relative
basis regardless of size.
Example 9-7
Using the data in Example 9-5, the profitability index is:
PV =
$16,950 = 1.31
I $12,950
Since this project generates $1.31 for each dollar invested (i.e. its profitability index is greater than 1), accept the
project.

183
Capital Rationing
Selecting the Best Mix of Projects with a Limited Budget
Many firms specify a limit on the overall budget for capital spending. Capital rationing is concerned with the
problem of selecting the mix of acceptable projects that provides the highest overall NPV. The profitability index is
used widely in ranking projects competing for limited funds.
Example 9-8
A company with a fixed budget of $250,000 needs to select a mix of acceptable projects from the following:
Projects I($) PV($) NPV($) Profitability Index Ranking
A 70,000 112,000 42,000 1.6 1
B 100,000 145,000 45,000 1.45 2
C 110,000 126,500 16,500 1.15 5
D 60,000 79,000 19,000 1.32 3
E 40,000 38,000 -2,000 0.95 6
F 80,000 95,000 15,000 1.19 4
The ranking resulting from the profitability index shows that the company should select projects A, B, and D.
I PV
A $70,000 $112,000
B 100,000 145,000
D 60,000 79,000
230,000 $336,000
Therefore,
NPV = $336,000 − $230,000 = $106,000
Handling Mutually Exclusive Investments
A project is said to be mutually exclusive if the acceptance of one project automatically excludes the acceptance
of one or more other projects (for example, two alternative uses of a single plot of land). In the case where one
must choose between mutually exclusive investments, the NPV and IRR methods may result in contradictory
indications. The conditions under which contradictory rankings can occur are:
• Projects that have different life expectancies.
• Projects that have different sizes of investment.
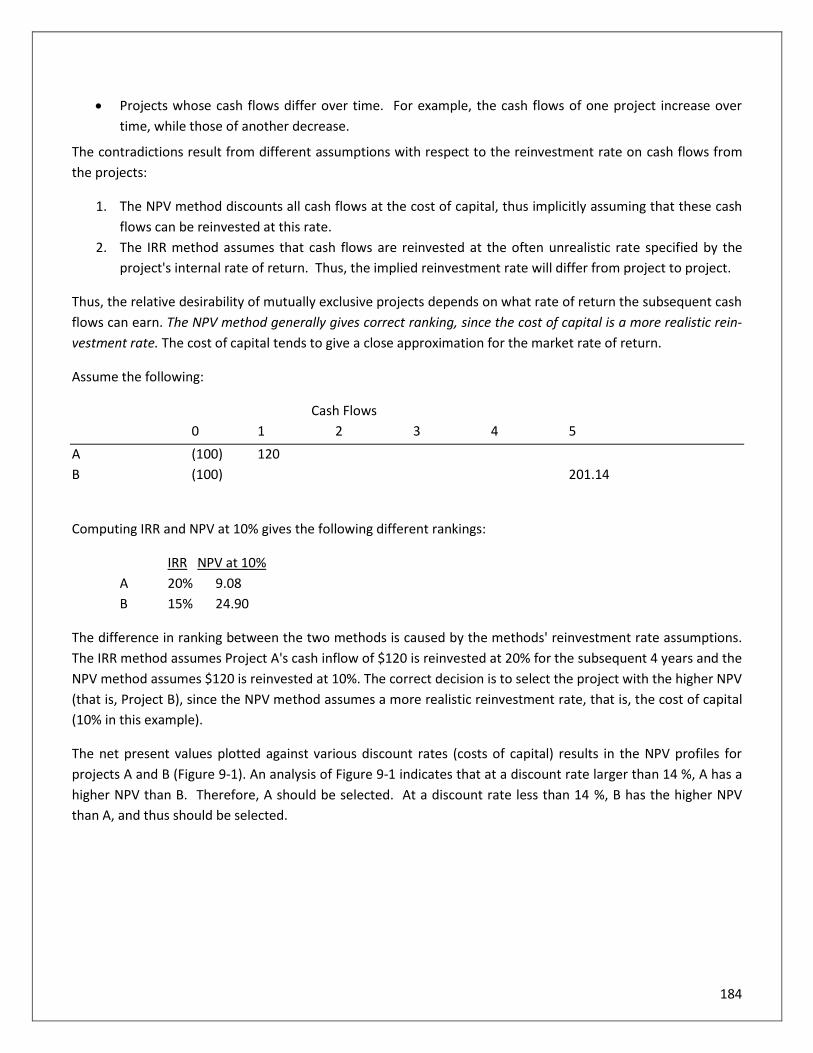
184
• Projects whose cash flows differ over time. For example, the cash flows of one project increase over
time, while those of another decrease.
The contradictions result from different assumptions with respect to the reinvestment rate on cash flows from
the projects:
1. The NPV method discounts all cash flows at the cost of capital, thus implicitly assuming that these cash
flows can be reinvested at this rate.
2. The IRR method assumes that cash flows are reinvested at the often unrealistic rate specified by the
project's internal rate of return. Thus, the implied reinvestment rate will differ from project to project.
Thus, the relative desirability of mutually exclusive projects depends on what rate of return the subsequent cash
flows can earn. The NPV method generally gives correct ranking, since the cost of capital is a more realistic rein-
vestment rate. The cost of capital tends to give a close approximation for the market rate of return.
Assume the following:
Cash Flows
0 1 2 3 4 5
A (100) 120
B (100) 201.14
Computing IRR and NPV at 10% gives the following different rankings:
IRR NPV at 10%
A 20% 9.08
B 15% 24.90
The difference in ranking between the two methods is caused by the methods' reinvestment rate assumptions.
The IRR method assumes Project A's cash inflow of $120 is reinvested at 20% for the subsequent 4 years and the
NPV method assumes $120 is reinvested at 10%. The correct decision is to select the project with the higher NPV
(that is, Project B), since the NPV method assumes a more realistic reinvestment rate, that is, the cost of capital
(10% in this example).
The net present values plotted against various discount rates (costs of capital) results in the NPV profiles for
projects A and B (Figure 9-1). An analysis of Figure 9-1 indicates that at a discount rate larger than 14 %, A has a
higher NPV than B. Therefore, A should be selected. At a discount rate less than 14 %, B has the higher NPV
than A, and thus should be selected.

185
Figure 9-1
The NPV Graph
The correct decision is to select the project with the higher NPV, since the NPV method assumes a more realistic
reinvestment rate, that is, the cost of capital.
Income Taxes and Investment Decisions
Income taxes make a difference in many capital budgeting decisions. In other words, the project that is attractive on
a before-tax basis may have to be rejected on an after-tax basis. Income taxes typically affect both the amount and
the timing of cash flows. Since net income, not cash inflows, is subject to tax, after-tax cash inflows are not usually
the same as after-tax net income.
Let us define:
S = Sales
E = Cash operating expenses
d = Depreciation
t = Tax rate
Then,
Before-tax cash inflows (or before-tax cash savings) = S − E
Net income = S − E − d By definition,
After-tax cash inflows = Before-tax cash inflows - Taxes
= (S − E) − (S − E − d) (t) Rearranging gives the short-cut formula:
After-tax cash inflows = (S − E) (1 − t) + (d)(t)

186
As can be seen, the deductibility of depreciation from sales in arriving at net income subject to taxes reduces income
tax payments and thus serves as a tax shield.
Tax shield = Tax savings on depreciation = (d)(t)
Example 9-9
Assume:
S = $12,000
E = $10,000
d = $500 per year using the straight-line method
t = 21%
Then,
After-tax cash inflow = ($12,000 − $10,000) (1 − 0.21) + ($500)(0.21)
= ($2,000)(.79) + ($500)(0.21)
= $1,580 + $105 = $1,685
Note that a tax shield = tax savings on depreciation = (d)(t)
= ($500)(.21) = $105
Since the tax shield is dt, the higher the depreciation deduction, the higher the tax savings on depreciation will
be. Therefore, an accelerated depreciation method (such as double-declining balance) produces higher tax sav-
ings than the straight-line method. Accelerated methods produce higher present values for the tax savings that
may make a given investment more attractive.
Example 9-10
The Shalimar Company estimates that it can save $2,500 a year in cash operating costs for the next ten years if it
buys a special-purpose machine at a cost of $10,000. No salvage value is expected. Assume that the income tax rate
is 30%, and the after-tax cost of capital (minimum required rate of return) is 10%. After-tax cash savings can be
calculated as follows:
Note that depreciation by straight-line is $10,000/10 = $1,000 per year. Before-tax cash savings = (S − E) = $2,500.
Thus,
After-tax cash savings = (S − E) (1 − t) + (d)(t)
= $2,500(1 − 0.3) + $1,000(0.3)
= $1,750 + $300 = $2,050
To see if this machine should be purchased, the net present value can be calculated.
PV = $2,050 T4(10%, 10 years) = $2,050 (6.145) = $12,597.25
Thus, NPV = PV − I = $12,597.25 − $10,000 = $2,597.25
Since NPV is positive, the machine should be purchased.

187
Chapter 9 Review Questions
1. Which one of the following is the best characteristic concerning a capital expenditure budget?
A. Plan to ensure that there are sufficient funds available for the operating needs of the company.
B. Exercise that sets the long-range goals of the company including the consideration of external influences
caused by others in the market.
C. Plan that results in the cash requirements during the operation cycle.
D. Plan that assesses the long-term needs of the company for plant and equipment purchases.
2. Smith Corp. is considering the purchase of a new machine for $78,000. The machine would generate an an-
nual cash flow of $23,214 for five years. At the end of five years, the machine would have no salvage value.
What is the payback period in years for the machine approximated to two decimal points?
A. 3.36
B. 9.48
C. 3.00
D. 4.00
3. Which of the following statements is true if an investment project has a profitability index of 1.15?
A. The project’s internal rate of return is 15%.
B. The project’s cost of capital is greater than its internal rate of return.
C. The project’s internal rate of return exceeds its net present value.
D. The net present value of the project is positive.
4. How do the net present value (NPV) and internal rate of return (IRR) differ?
A. NPV assumes reinvestment of project cash flows at the cost of capital, whereas IRR assumes reinvest-
ment of project cash flows at the internal rate of return.
B. NPV and IRR make different ‘accept or reject’ decisions for independent projects.
C. IRR can be used to rank mutually exclusive investment projects, but NPV cannot.
D. NPV is expressed as a percentage, while IRR is expressed as a dollar amount.
188
Chapter 10: Financial Statement Analysis
Learning Objectives:
After completing this section, you will be able to:
• Distinguish among trend analysis, vertical analysis, and horizontal analysis
• Identify the limitations of ratio analysis
• Recognize a comprehensive set of financial ratios
The Role of the CFO
Using ratios, a CFO can measure the relative health or sickness of a business. They provide a convenient and
useful way of expressing a relationship between certain accounts or items in a company's financial statement.
They offer a profile of a company’s economic characteristics and competitive strategies. A CFO can use ratio
analysis to identify trends, strengths and weaknesses. In particular, financial ratios help the CFO pinpoint issues.
For example:
• A current ratio of less than one indicates that the company has more liabilities than assets,
• A very high current ratio shows excessive cash that could be invested,
• An unexpected drop in the current ratio may signal check fraud,
• A high inventory turnover shows that the company is successful in converting its inventory into sales,
• An unusual increase in inventory turnover may indicate kickback or inventory theft,
• A decreasing fixed asset turnover may indicate the inefficient use of assets.
• A low return on assets compared to the industry may indicate that the competitors have found a way to
operate more efficiently.
In addition, a company could receive better rates from lenders by understanding the financial ratios that lenders
are basing their decisions on, and then improving these ratios.
This chapter discusses the various financial statement analysis tools that CFOs will use in evaluating the compa-
ny’s present and future financial condition. These tools include horizontal, vertical, and ratio analysis, which give
relative measures of the performance and financial condition of the company. Specifically, it addresses the most
common ratios divided up into six main categories including liquidity, activity, leverage, profitability, market

189
test, and cash flow. Although extremely valuable as analytical tools, financial ratios also have limitations, which
are noted in this chapter.
Techniques of Financial Analysis
Accounting can be thought of as the scorecard for business operations. It translates raw data into a set of objec-
tive numbers integrated into financial statements that provide information about the firm’s profits, perfor-
mance, problems and future prospects. Financial analysis is the study of the relationships among these financial
numbers; it helps users to identify the major strengths and weaknesses of a company.
Comparative Financial Statements
Trend Analysis
Trend analysis indicates in which direction a company is headed. Trend percentages are computed by taking a
base year and assigning its figures as a value of 100. Figures generated in subsequent years are expressed as
percentages of base-year numbers.
Example 10-1
The Hotspot Appliance Corporation showed the following figures for a five-year period:
20X7 20X6 20X5 20X4 20X3
Net Sales $ 910 $ 875 $ 830 $ 760 $ 775
Cost of goods sold 573 510 483 441 460
Gross profit $ 337 $ 365 $ 347 $ 319 $ 315
A schedule showing trend percentages is as follows:
20X7 20X6 20X5 20X4 20X3
Net Sales 117 113 107 98 100
Cost of goods sold 125 111 105 96 100
Gross profit 107 116 110 101 100
With 20X3 taken as the base year, its numbers are divided into those from subsequent years to yield compara-
tive percentages. For example, net sales in 20X3 ($775,000) is divided into 20X7’s net-sales figure ($910,000).
Net sales shows an upward trend after a downturn in 20X4. Cost of goods sold shows a sharp increase between
20X6 and 20X7 after a small drop in costs between 20X3 and 20X4. There appears to be a substantial drop in
gross profit between 20X6 and 20X7 which is attributable to the increased cost of goods sold.

190
Trend percentages show horizontally the degree of increase or decrease, but they do not indicate the reason for
the changes. They do serve to indicate unfavorable developments that will require further investigation and
analysis. A significant change may have been caused by a change in the application of an accounting principle or
by controllable internal conditions, such as a decrease in operating efficiency.
Horizontal Analysis
Horizontal analysis improves a CFO’s ability to use dollar amounts when evaluating financial statements. It is
more useful to know that sales have increased 25% than to know that sales increased by $50,000. Horizontal
analysis requires that you: (1) compute the change in dollars from the earlier base year, and (2) divide the dollar
amount of the change by the base period amount.
Example 10-2
The comparative income statement of the Ogel Supply Corporation as of December 31, 20X7, appears as fol-
lows:
20X7 20X6
Net Sales $ 990,000 $ 884,000
Cost of goods sold 574,000 503,000
Gross profit $ 416,000 $ 381,000
Operating expenses:
Selling expenses $ 130,000 $ 117,500
General expenses 122,500 120,500
Total operating expenses $ 252,500 $ 238,000
Income from operations 163,000 143,000
Interest expense 24,000 26,000
Income before income tax-
es
$ 139,500 $ 117,000
Income tax expense 36,360 28,030
Net income $ 103,140 $ 88,970
A detailed horizontal analysis statement follows.
Increase
(Decrease)
20X7 20X6 Amount Percent
Net Sales $ 990,000 $ 884,000 106,000 12.0
Cost of goods sold 574,000 503,000 71,000 14.1
Gross profit 416,000 381,000 35,000 9.2
Operating expenses:
Selling expenses 130,000 117,500 12,500 10.6
General expenses 122,500 120,500 2,000 1.7
Total operating expenses 252,500 238,000 14,500 6.1

191
Income from operation 163,500 143,000 20,500 14.3
Interest expense 24,000 26,000 (2,000) (7.7)
Income before income taxes 139,500 117,000 22,500 19.2
Income tax expense 36,360 28,030 8,330 29.7
Net income $ 103,140 $ 88,970 $ 14,170 15.9
Example 10-3
The comparative balance sheet of the Ogel Supply Corporation as of December 31, 20X7, appears as follows:
20X7 20X6
ASSETS
Current Assets:
Cash $ 60,000 $ 30,000
Account receivable, net 113,000 79,000
Inventories 107,100 106,900
Prepaid expenses 5,700 6,100
Total current assets $ 285,800 $ 222,000
Property, plant, and equipment, net 660,000 665,000
Total assets $ 945,800 $ 887,000
LIABILITIES
Current liabilities:
Notes payable 40,000 $ 33,000
Accounts payable 100,600 57,500
Total current liabilities 140,600 $ 90,500
Long-term debt 400,000 410,000
Total liabilities $ 540,600 $ 500,500
STOCKHOLDERS’ EQUITY
Common stock, no-par $ 200,000 $200,000
Retaining earnings 205,200 186,500
Total stockholders’ equity $ 405,200 $386,500
Total liabilities and stockholders’ equity $ 945,800 $ 887,000

192
A detailed horizontal analysis statement is given below.
20X7 20X6 Amount Percent
ASSETS
Current Assets:
Cash $ 60,000 $ 30,000 $ 30,000 100.0
Account receivable, net 113,000 79,000 34,000 43.0
Inventories 107,100 106,900 200 0.0
Prepaid expenses 5,700 6,100 (400) (7.0)
Total current assets $ 285,800 $ 222,000 $ 63,800 28.7
Property, plant, and equipment, net 660,000 665,000 (5,000) (0.1)
Total assets $ 945,800 $ 887,000 $ 58,80 6.6
LIABILITIES
Current liabilities:
Notes payable 40,000 $ 33,000 $ 7,000 21.2
Accounts payable 100,600 57,500 43,100 75.0
Total current liabilities 140,600 $ 90,500 $ 50,100 55.4
Long-term debt 400,000 410,000 (10,000) (2.4)
Total liabilities $ 540,600 $ 500,500 40,100 8.1
STOCKHOLDERS’ EQUITY
Common stock, no-par $ 200,000 $200,000 - 0.0
Retaining earnings 205,200 186,500 18,700 10.0
Total stockholders’ equity $ 405,200 $386,500 $ 18,700 5.0
Total liabilities and stockholders’ equity $ 945,800 $ 887,000 $ 58,800 6.6
Vertical Analysis
Vertical analysis shows the percentage relationship of each item on the financial statement to a total figure rep-
resenting 100%. Each income statement account is compared to net sales. For example, if net sales is $100,000
and net income after taxes is $8,000, then the company’s net income is $8,000 divided by $100,000, or 8% of
the net sales figure.
Vertical analysis also reveals the internal structure of the business. This means that if total assets are $750,000
and cash shows a year-end balance of $75,000, then cash represents 10% of the total assets of the business at
year-end. Vertical analysis shows the mix of assets that generate the income as well as the sources of capital
provided by either current or noncurrent liabilities, or by the sale of preferred and common stock.
A company’s vertical percentages should be compared to those of its competitors or to industry averages to de-
termine the company’s relative position in the marketplace. Like horizontal analysis, vertical analysis is not the
end of the process. The CFO must be prepared to examine problem areas indicated by horizontal and vertical
analysis.

193
Example 10-4
Using the comparative income statement of the Ogel Supply Corporation at December 31, 20X7 given in Exam-
ple 10-3, a detailed vertical analysis statement is shown below.
20X7 20X6
Amount Percent Amount Percent
Net Sales $ 990,000 100.0 $ 884,000 100.0
Cost of goods sold 574,000 58.0 503,000 57.0
Gross profit 416,000 42.0 381,000 43.0
Operating expenses:
Selling expenses 130,000 13.1 117,500 13.3
General expenses 122,500 12.4 120,500 13.6
Total operating expenses 252,500 25.5 238,000 26.9
Income from operation 163,500 16.5 143,000 16.1
Interest expense 24,000 2.4 26,000 2.9
Income before income taxes 139,500 14.1 117,000 13.2
Income tax expense 36,360 3.7 28,030 3.2
Net income $ 103,140 10.4 $ 88,970 10.0
Example 10-5
Using the comparative balance sheet of the Ogel Supply Corporation at December 31, 20X7, a detailed vertical
analysis statement is given below.
20X7 Percent 20X6 Percent
ASSETS
Current Assets:
Cash $ 60,000 6.3 $ 30,000 3.6
Account receivable, net 113,000 11.9 79,000 8.9
Inventories 107,100 11.3 106,900 12.1
Prepaid expenses 5,700 0.6 6,100 .7
Total current assets $ 285,800 30.1 $ 222,000 25.3
Property, plant, and equipment, net 660,000 69.9 665,000 74.9
Total assets $ 945,800 100.0 $ 887,000 100.0
LIABILITIES
Current liabilities:
Notes payable 40,000 4.2 $ 33,000 3.7
Accounts payable 100,600 10.6 57,500 6.5
Total current liabilities 140,600 14.8 $ 90,500 10.2
Long-term debt 400,000 42.3 410,000 46.2

194
Total liabilities $ 540,600 57.1 $ 500,500 56.4
STOCKHOLDERS’ EQUITY
Common stock, no-par $ 200,000 21.1 $200,000 22.6
Retaining earnings 205,200 21.7 186,500 21.0
Total stockholders’ equity $ 405,200 42.8 $386,500 43.6
Total liabilities and stockholders’ equity $ 945,800 100.0 $ 887,000 100.0
After completing the statement analysis, the CFO will consult with management to discuss problem areas, possi-
ble solutions, and the company’s prospects for the future.
Common-Size Statements
Statements omitting dollar amounts and showing only percentages are referred to as common-size statements
because each item in the statement has a common basis for comparison, for example, total assets, net sales.
Data for common-size statements is computed in a manner similar to that described for vertical analysis
computations. Changes in proportions are emphasized in common-size statements which make efficiencies and
inefficiencies easier to identify than in comparative statements. For example, notice from the following exhibit
that 58 cents of every dollar of sales was needed to cover the cost of goods sold in 20X5, as compared to only 57
cents in the prior year. Exhibit 10-1 below, illustrates a common-size statement:
Exhibit 10-1
Common Size Statements
20X5 20X4
Percent Percent
Net Sales 100.0 100.0
Cost of goods sold 58.0 57.0
Gross profit 42.0 43.0
Operating expenses:
Selling expenses 13.1 13.3
General expenses 12.4 13.6
Total operating expenses 25.5 26.9
Income from operation 16.5 16.1
Interest expense 2.4 2.9
Income before income taxes 14.1 13.2
Income tax expense 3.7 3.2
Net income 10.4 10.0
When analyzing the balance sheet, common-size statements are useful in examining the sources and structure
of capital of the enterprise, that is, the relationship concerning the distribution of assets among current assets,

195
investments, property, plant and equipment, intangible assets, and other assets. Common-size income state-
ments provide information concerning what proportion of sales dollar is absorbed by the cost of goods sold and
various expenses. On a comparative, common-size statement, the comparisons demonstrate the changing or
stable relationships within groups of assets, liabilities, revenues, expenses, and other financial statement cate-
gories. Care must be exercised when such comparisons are made since the percentage change can result from a
change in the absolute amount of the item or a change in the total of the group of which it is a part, or both.
Common-size statements are useful in comparing companies because such statements are based on 100 percent
and present a relative comparison instead of absolute amounts. Such inter-company comparisons can help the
analysts identify variations in structure or distributions among groups and subgroups.
Ratio Analysis
A ratio is an expression of a mathematical relationship between one quantity and another. The ratio of 400 to
200 is 2:1. If a ratio is to have any utility, the element which constitutes the ratio must express a meaningful re-
lationship. For example, there is a relationship between accounts receivable and sales, between net income and
total assets, and between current assets and current liabilities. Ratios to be discussed in Chapter 10 - Evaluation
of Financial Outcomes are summarized in the following table:
Summary of Financial Ratios
Category Purpose Examples
Liquidity Used to assess a company’s ability to meet its financial obligations in the short term
Net working capital, current ratio, quick ratio, cash ratio cash burn rate
Activity Used to assess the efficiency with which a company uses its assets
Accounts receivable turnover, inventory turnover, operating cycle, cash conversion cycle, total asset turnover
Leverage Provides data about the long-term sol-vency of a company
Debt ratio, debt to equity, equity to debt-assets, times interest earned, cash coverage, free cash flow
Profitability Used to examine how successful a com-pany is in using its operating processes and resources to earn income
Gross profit margin, profit margin on sales, return on total assets, return on stockholders’ equity
Market Test Helps measure market strength Earnings per share, price-earnings ratio, price-sales ratio, market value added, dividend yields, dividend payout
Cash Flow Used to measure cash adequacy and cash flow return
Cash flow coverage (or adequacy) ratios, cash flow performance measures
Ratio analysis can disclose relationships which reveal conditions and trends that often cannot be noted by in-
spection of the individual components of the ratio. Typical ratios are fractions usually expressed in percent or
times. Ratios are generally not significant of themselves but become useful and meaningful when they are com-
pared with:
1. Previous ratios of the company
2. Predetermined standard

196
3. Ratios of other companies in the same industry, or
4. Ratios of the industry within which the company operates. When used in this manner, ratios serve as
benchmarks against which the company can evaluate itself. Ratios are not the end in themselves but
help provide answers to questions concerning specific issues and insights into the operations of a busi-
ness enterprise. Details of benchmarks are discussed in Chapter 16 - Benchmarking.
To obtain worthwhile conclusions from financial ratios, the CFO has to make the following two comparisons.
Industry Comparison. The CFO should compare the company’s ratios to those of competing companies in the
industry or with industry standards. This comparison will allow the CFO to answer the question "how does a
business fare in the industry?" as the CFO compares the company's ratios to those of competing companies in
the industry or with industry standards (averages). Industry norms can be obtained from financial services such
as Value Line, Dun & Bradstreet, Philadelphia-based Risk Management Association (RMA), and Standard and
Poor's. Numerous online services such as Yahoo Finance and MSN Money, to name a few, also provide these
data. For example, RMA has been compiling statistical data on financial statements for more than 75 years. The
RMA Annual Statement Studies provide statistical data from more than 150,000 actual companies on many key
financial ratios, such as gross margin, operating margins and return on equity and assets. The CFO may consider
using the Statement Studies to put real authority into the “industry average” numbers that the company is beat-
ing.
Trend analysis. To see how the business is doing over time, you will compare a given ratio for one company
over several years to see the direction of financial health or operational performance.
Mathematical Cautions
Care is taken in projecting the effect on a ratio of a change in the numerator or denominator of a ratio. For ex-
ample,
1. If a ratio is less than 1.00 (numerator is smaller than the denominator), equal increases in both quanti-
ties in the ratio would cause the ratio to increase. For example, 3/4 = 0.75 and (3+1)/(4+1) = 4/5 = 0.80.
Similarly, equal decreases in both the numerator and denominator would cause the ratio to decrease.
2. If the value of a ratio is greater than 1.00, equal increases in both quantities in the ratio would cause the
ratio to decrease. For example, 4/3 = 1.33 and (4+1)/(3+1) = 5/4 = 1.25. Equal decreases in both the nu-
merator and denominator would cause the ratio to increase.
3. If the value of a ratio is exactly 1.00, equal changes in the numerator and denominator will have no ef-
fect on the ratio, which remains at 1.00.
Industry Comparison
Trend Analysis
Meaningful Financial
Comparisons

197
4. If the numerator increases (decreases) with no change in the denominator, the ratio would increase (de-
crease).
5. If the denominator increases (decreases) with no change in the numerator, the ratio would decrease (in-
crease).
6. If the numerator and denominator change but in unequal amounts, the ratio will increase, decrease, or
remain unchanged depending upon the direction and the amount of the change.
Limitations of Ratio Analysis
While ratio analysis is an effective tool for assessing a business's financial condition, you must also recognize the
following limitations:
1. Ratios reflect past conditions, transactions, events, and circumstances.
2. Ratios reflect book values, not real economic values or price-level effects.
3. Many large businesses are involved with multiple lines of business, making it difficult to identify the in-
dustry to which a specific company belongs. A comparison of its ratios with other corporations may thus
be meaningless.
4. Accounting and operating practices differ among companies, which can distort the ratios and make
comparisons meaningless. For example, the use of different inventory-valuation methods would affect
inventory and asset-turnover ratios.
5. Ratio analysis may be affected by seasonal factors. For example, inventory and receivables may vary
widely, and the year-end balances may not reflect the averages for the period or the balances at the end
of various interim periods.
6. Industry averages published by financial advisory services are only approximations. Therefore the com-
pany may have to look at the ratios of its major competitors, if they are available.
7. Financial statements are based on historical costs and do not consider inflation.
8. Management may hedge or exaggerate its financial figures. Hence, certain ratios will not be accurate
indicators.
9. Inter-company comparisons are difficult when companies are diversified or have different risk character-
istics.
10. A ratio does not describe the quality of its components. For example, the current ratio may be high but
the inventory may consist of obsolete merchandise.
11. Ratios are static and do not take future trends into account.
12. Companies using different fiscal years, and different sources of information impair the comparability of
financial statement amounts and the ratios derived from them. Consequently, financial statements must
be adjusted to permit intercompany comparisons

198
In spite of the difficulties associated with the formation and interpretation of ratios, ratio analysis is an im-
portant technique for financial statement analysis because it can identify significant fundamental and structural
relationships and trends.
The Operating Cycle of a Business
The operating cycle is the time needed to turn cash into inventory, inventory into receivables, and receivables
back into cash. The operating cycle of a business is illustrated in the following exhibit.
Exhibit 10-2
Operating Cycle of a Business
For a retailer, it is the time from purchase of inventory to collection of payment. Thus, the operating cycle of a
retailer is equal to the sum of the number of days’ sales in inventory and the number of days’ sales in receiva-
bles. The days’ sales in inventory equals 365 (or another period chosen by the analyst) divided by the inventory
turnover (The days’ sales in receivables that equals 365 (or other number) divided by the accounts receivable
turnover).
A company with a short operating cycle typically requires only a small amount of working capital, reflected in
relatively low current and quick ratios. A company with a long operating cycle typically requires a larger cushion
of current assets and higher current and quick ratios, unless the firm’s suppliers extend their credit terms. For
instance, in 20X6, the operating cycle is: 84.1 days + 347.6 days = 431.7 days. In the previous year, the operating
cycle was 317.5 days. An unfavorable direction is indicated because additional funds are tied up in noncash assets.
Cash is being collected more slowly.
Cash
Purchase
Inventory
Sales
Accounts Receivable
Collection of
Receivables

199
The operating cycles vary for different business. For example, manufacturing companies should also consider
the time that money is tied up by production when calculating the length of the cash cycle. The following table
summarizes various operating cycles:
Business Operating Method Operating Cycle
Service Cash only Immediate
On credit Cash -> AR -> Cash
Merchandising Cash only Cash -> Inventory -> Cash
On credit Cash -> Inventory -> AR -> Cash
Manufacturing Cash
Cash -> Materials Inventory ->
Work in Process Inventory -> Fin-
ished Goods Inventory -> AR ->
Cash
Noncash working capital consists of current assets and liabilities, other than cash. One way to view noncash
working capital efficiency is to view operations as a cycle from initial purchase of inventory to the final collection
upon sale. The cycle begins with a purchase of inventory on account followed by the account payment, after
which, the item is sold and the account collected. These three balances can be translated into days of sales and
is used to measure how well a company efficiently manages noncash working capital. This measure is termed
the cash conversion cycle or cash cycle. This is the number of days that pass before we collect the cash from a
sale, measured from when we actually pay for the inventory. The cash conversion cycle is:
Cash conversion cycle = Operating cycle – Accounts payable period
For example, in 20X5 for the company, the cash conversion cycle = 195.45 days – 48.1 days = 147.35 days. Thus,
on average, there is a 148-day delay between the time the company pays for merchandise and the time it col-
lects on the sale. In 20X4 the ratio was 155.1 days (203.8 days – 48.7 days). This is a favorable sign since a re-
duced cycle implies that less money is being tied up in inventories and receivables.
The operating cycle or cash conversion cycle is of interest to financial management because it reveals how long
cash is tied up in inventory and receivables. A shorter operating cycle is desired because the freed cash can be
invested to add to the returns.

200
Chapter 10 - Section 1 Review Questions
1. Which of the following financial statement analyses is most useful in determining whether the various ex-
penses of a given company are higher or lower than industry averages?
A. Horizontal analysis
B. Vertical analysis
C. Activity ratio
D. Trend analysis
2. Which of the following is the worst limitation of ratio analysis affecting comparability from one interim peri-
od to the next within a firm?
A. Management has an incentive to window dress financial statements to improve results.
B. In a seasonal business, inventory and receivables may vary widely with year-end balances not reflecting
the averages for the period.
C. Comparability is impaired if different firms use different accounting policies.
D. Generalizations about which ratios are strong indicators of a firm's financial position may change from
industry to industry and from firm to firm.
3. Lincoln Corporation computed the following items from its financial records for the current year: Current
ratio = 2 to 1; Average age of inventory = 54 days; Average collection period = 24 days; Average payable pe-
riod = 36 days. What was the number of days in Lincoln's cash conversion cycle for the current year?
A. 54
B. 90
C. 78
D. 42
4. A growing enterprise is assessing current working capital requirements. An average of 58 days is required to
convert raw materials into finished goods and to sell them. Then, an average of 32 days is required to collect
on receivables. If the average time the enterprise takes to pay for its raw materials is 15 days after they are
received, what is the total cash conversion cycle?
A. 11 days
B. 41 days
C. 75 days
D. 90 days

201
Evaluation of Financial Outcomes
Liquidity Ratios: Analyzing Short-Term Cash Needs
Liquidity is the ability of a company to satisfy demands for cash as they arise in the near-term (such as payment
of current liabilities). Therefore, these ratios measure short-term solvency; the ability of the company to meet
its debt obligations as they come due. Short-term and long-term financing strategies both have their ad-
vantages.
The advantage of some short-term debt is that it usually does not require interest payments. For example, ac-
counts payable may not require payment of interest as long as they are paid within the first 30 days. Short-term
debt has its disadvantages that payment is required within at least one year, and often sooner. Interest rates on
short-term debt are usually higher than on long-term debt. An increase in the proportion of short-term debt is
risky because it must be renewed, therefore, renegotiated more frequently.
The advantages of long-term debt are that payment may be made over an extended period of time. Risk can be
somewhat reduced through the use of a contractual agreement that is lacking with short-term debt. The disad-
vantages of long-term debt are that interest payments must be made at specified times and the amounts owing
may be secured by collateral.
Current Ratio
The current ratio is a valuable indicator of a company’s ability to meet its current obligations as they become
due, or its liquidity. The ratio is computed by using the following formula:
Current Assets
Current Liabilities
Example 10-6
The Ogel Supply Corporation showed the following current assets and current liabilities for the years ended De-
cember 31, 20X7, and December 31, 20X6:
20X7 20X6
ASSETS
Current Assets:
Cash $ 60,000 $ 30,000
Account receivable, net 113,000 79,000
Inventories 107,100 106,900
Prepaid expenses 5,700 6,100
Total current assets $ 285,800 $ 222,000
LIABILITIES
Current liabilities:

202
Notes payable 40,000 $ 33,000
Accounts payable 100,600 57,500
Total current liabilities 140,600 $ 90,500
20X7 20X6
Total current assets $285,800 $222,000
Total current liabilities $140,600 = 2.0 $90,500 = 2.5
The change from 2.5 to 2.0 indicates that Ogel has a diminished ability to pay its current liabilities as they ma-
ture. However, a current ratio of 2.0 to 1 is still considered a “secure” indicator of a company’s ability to meet
its current obligations incurred in operating the business.
Acid-Test or Quick Ratio
A more rigid test of liquidity is provided by the acid-test ratio; also called the quick ratio. Unlike the current ra-
tio, the acid-test or quick ratio places emphasis on the relative convertibility of the current assets into cash. The
ratio places greater emphasis on receivables than on inventory, since the inventory may not be readily converti-
ble into cash. This method also assumes that prepaid expenses have minimal resale value. To calculate this ra-
tio, current assets are separated into quick current assets and non-quick current assets. The ratio is computed
by using the following formula:
Cash + Short−Term Investments + Accounts Receivable, Net
Current Liabilities
Example 10-7
In Example 10-6, the acid-test or quick ratio for 20X7 and 20X6 is calculated as follows:
20X7 20X6 Total Acid-Test Assets $173,000 $109,000
Total Current Liabilities $140,600 =1.2 $90,500 =1.2
The ratios are unchanged. This shows that, despite a significant increase in both the acid-test or quick assets
and current liabilities, Ogel still maintains the same ability to meet its current obligations as they mature.
Activity Ratios: Analyzing the Efficient Use of Assets
Activity ratios measure a company’s ability to convert balance sheet accounts into cash or sales. In other words,
they measure the relative efficiency of a company based on its use of its assets, leverage or other such balance
sheet items, and are important in determining whether a company’s management is doing a good enough job of

203
generating revenues and cash from its resources. Because most companies invest heavily in accounts receivable
or inventory, these accounts are used in the denominator of the most popular activity ratios.
Accounts-Receivable Ratios
Accounts-receivable ratios are composed of the accounts receivable turnover and the collection period, which is
the number of days the receivables are held.
Accounts-Receivable Turnover
The accounts-receivable turnover is the number of times accounts receivable are collected during the year. The
turnover equals net credit sales (if not available, then total sales) divided by the average accounts receivable.
Average accounts receivable is usually determined by adding the beginning accounts receivable to the ending
accounts receivable and dividing by two. However, average accounts receivable may be arrived at with greater
accuracy on a quarterly or monthly basis, particularly for a seasonal business. Unfortunately, this information is
typically known only to management. Using data for the shortest time period will provide the most reliable ra-
tio.
The higher the accounts-receivable turnover, the more successfully the business collects cash. However, an ex-
cessively high ratio may signal an excessively stringent credit policy, with management not taking advantage of
the potential profit by selling to customers with greater risk. Note that here, too, before changing its credit poli-
cy, management has to consider the profit potential versus the inherent risk in selling to more marginal custom-
ers. For example, bad debt losses will increase when credit policies are liberalized to include riskier customers.
The formula for determining the accounts-receivable turnover is expressed as follows:
Net Credit Sales
Average Net Accounts Receivable
When a balance sheet amount is related to an income statement amount in computing a ratio, the balance sheet
amount should be converted to an average for the year. The reason is that the income statement amounts
represent activity over a period. Thus, the balance sheet figure should be adjusted to reflect assets available for use
throughout the period.
Example 10-8
The Ogel Supply Corporation showed the following accounts-receivable totals for the years ended December 31,
20X7, and December 31, 20X6:
20X7 20X6
Current Assets: Accounts Receivable, Net $113,000 $79,000
Assume sales of $990,000 for 20X7. Calculating the accounts-receivable turnover for 20X7 yields:
Average accounts receivable = ($113,000+$79,000) / 2 = $96,000

204
Sales =
$990,000 = 10.3
Average Accounts Receivable $96,000
Days-Sales-in-Receivables
The days-sales-in-receivables ratio determines how many days’ sales remain in accounts receivable. It is also
called the receivables collection period. The determination is a two-step process. First, divide the net sales by
365 days to determine the sales amount for an average day. Then divide this figure into the average net ac-
counts receivable.
Example 10-9
The days-sales-in-receivables for the Ogel Supply Corporation is computed as follows:
Step one:
Net Sales =
$990,000 = $2,712
365 Days 365
Step two:
Average Net Accounts Receivable =
$96,000 = 35.4 Days
One Day's Sale $2,712
Inventory Ratios
A company with excess inventory is tying up funds that could be invested elsewhere for a return. Inventory
turnover is a measure of the number of times a company sells its average level of inventory during the year. A
high turnover indicates an ability to sell the inventory, while a low number indicates an inability. A low invento-
ry turnover may lead to inventory obsolescence and high storage and insurance costs. The formula for deter-
mining inventory turnover is:
Cost of Goods Sold
Average Inventory
Example 10-10
The Ogel Supply Corporation showed the following inventory amounts for the years ended December 31, 20X7,
and December 31, 20X6:
20X7 20X6
Current Assets: Inventories $107,100 $106,900
If cost of goods sold is $574,000 for 20X7, the inventory turnover for 20X7 is calculated as follows.
Average inventories = ($107,100 + $106,900) / 2 = $107,000

205
Cost of Goods Sold =
$574,000 = 5.4
Average Inventory $107,000
Leverage Ratios: Measuring the Ability to Pay Long-Term Debt
A company with a large amount of debt runs a greater risk of insolvency than one with a large amount of pre-
ferred or common stock outstanding. The reason is that payment of interest is mandatory, while the payment of
dividends is discretionary with the corporation’s board of directors. Individuals and banks that purchase the
long-term notes and bonds issued by an enterprise take a special interest in a business’s ability to repay its debt
plus interest. Two key methods used to measure a company’s ability to pay its legal obligations (solvency) as
they become due are the debt ratio and the times-interest-earned ratio.
Debt Ratio
The debt ratio indicates how much of the company’s assets were obtained by the issuance of debt. If the ratio is
1, it means that all of the firm’s assets were financed by the issuance of debt. If the ratio is 0.6, it means that
60% of the company’s assets were financed by debt. The formula for the debt ratio is:
Total Liabilities
Total Assets
Example 10-11
20X7 20X6
ASSETS
Current Assets:
Cash $ 60,000 $ 30,000
Account receivable, net 113,000 79,000
Inventories 107,100 106,900
Prepaid expenses 5,700 6,100
Total current assets $ 285,800 $ 222,000
Property, plant, and equipment, net 660,000 665,000
Total assets $ 945,800 $ 887,000
LIABILITIES
Current liabilities:
Notes payable 40,000 $ 33,000
Accounts payable 100,600 57,500
Total current liabilities 140,600 $ 90,500
Long-term debt 400,000 410,000
Total liabilities $ 540,600 $ 500,500
STOCKHOLDERS’ EQUITY
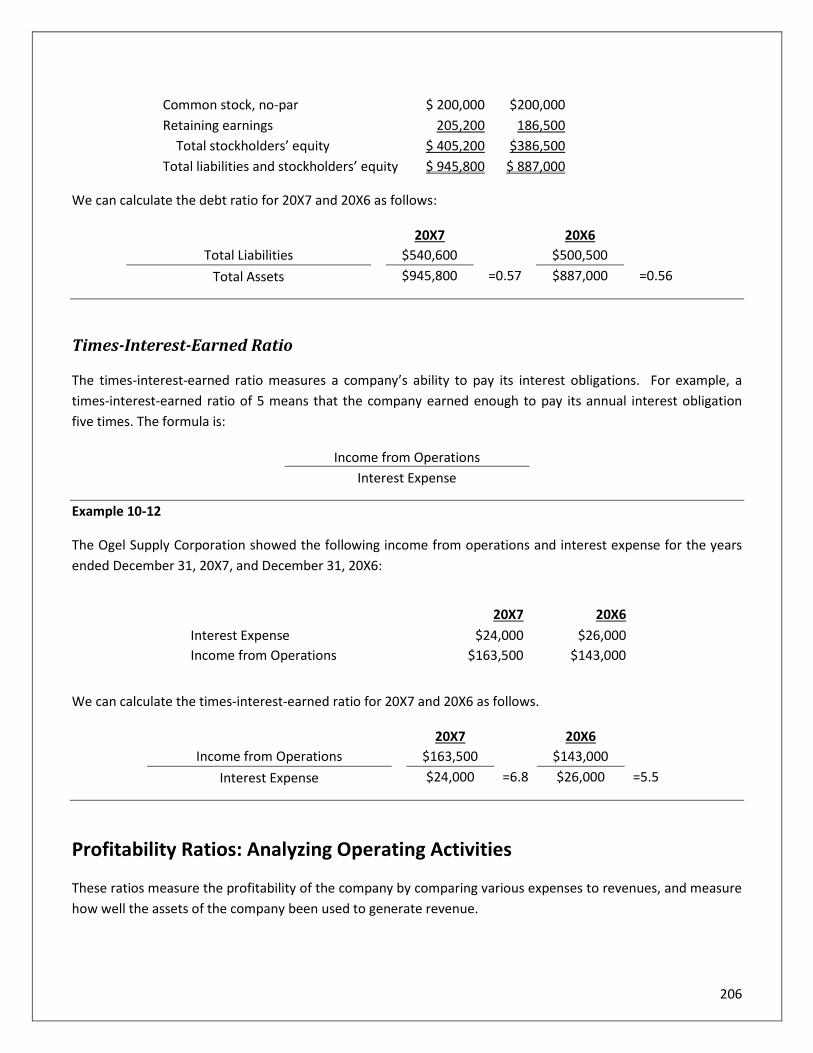
206
Common stock, no-par $ 200,000 $200,000
Retaining earnings 205,200 186,500
Total stockholders’ equity $ 405,200 $386,500
Total liabilities and stockholders’ equity $ 945,800 $ 887,000
We can calculate the debt ratio for 20X7 and 20X6 as follows:
20X7 20X6 Total Liabilities $540,600 $500,500
Total Assets $945,800 =0.57 $887,000 =0.56
Times-Interest-Earned Ratio
The times-interest-earned ratio measures a company’s ability to pay its interest obligations. For example, a
times-interest-earned ratio of 5 means that the company earned enough to pay its annual interest obligation
five times. The formula is:
Income from Operations
Interest Expense
Example 10-12
The Ogel Supply Corporation showed the following income from operations and interest expense for the years
ended December 31, 20X7, and December 31, 20X6:
20X7 20X6
Interest Expense $24,000 $26,000
Income from Operations $163,500 $143,000
We can calculate the times-interest-earned ratio for 20X7 and 20X6 as follows.
20X7 20X6 Income from Operations $163,500 $143,000
Interest Expense $24,000 =6.8 $26,000 =5.5
Profitability Ratios: Analyzing Operating Activities
These ratios measure the profitability of the company by comparing various expenses to revenues, and measure
how well the assets of the company been used to generate revenue.

207
Profit Margin on Sales
Profit margin on sales indicates the dollar amount of net income the company receives from each dollar of sales.
This ratio reflects the ability of the company to control costs and expenses in relation to sales. The formula for
computing the profit margin on sales is as follows:
Net Income
Net Sales
20X5 ratio = 000,530,1$
500,95$= 6.2%
20X4 ratio = 000,450,1$
000,81$= 5.6%
The profit margin on sales increased significantly from 20X4 to 20X5. The reasons for this change relate primarily
to factors related to revenue and expenses reported on the income statement.
The profit margin indicates the success of management in generating earnings from its operations. The higher
the profit margin on each sales dollar generated, the better the company is doing financially. Profit may also be
increased by controlling expenses. A high profit margin is desirable because it indicates that the company is
earning a good return on its cost of merchandise sold and operating expenses.
Example 10-13
The Ogel Supply Corporation showed the following net income and net sales figures for the years ended Decem-
ber 31, 20X7, and December 31, 20X6:
20X7 20X6
Net Sales $990,000 $884,000
Net Income $103,140 $88,970
The rate of return on net sales for 20X7 and 20X6 is:
20X7 20X6 Net Income $103,140 $88,970
Net Sales $990,000 =10.4% $884,000 =10.1%
Rate of Return on Total Assets
The rate of return measures the ability of the company to earn a profit on its total assets. The calculation of the
sales to total assets ratio helps to answer this question by establishing the number of sales dollars earned for
each dollar invested in assets. In making the calculation, interest expense must be added back to the net in-
come, since both creditors and investors have financed the company’s operations. The ratio is calculated as:

208
Net Income + Interest Expense
Average Total Assets
Average total assets = [total assets (beginning) + total assets (ending)] / 2
Example 10-14
The Ogel Supply Corporation showed the following net income and net sales figures for the years ended Decem-
ber 31, 20X7, and December 31, 20X6:
20X7 20X6
Net Income $103,140 $88,970
Interest Expense $24,000 $26,000
Total Assets $945,800 $887,000
Calculate the rate of return on total assets for 20X7.
Average Total Assets = $103,140 + $24,000
= $127,140
= 13.9% (945,800 + 887,000) / 2
$916,400
Return on Investment- DuPont Formula
The General Concept of Return on Investment (ROI)
The ability to measure performance is essential in developing incentives and controlling operations toward the
achievement of organizational goals. Perhaps the most widely used single measure of profitability of an organi-
zation is the rate of return on investment (ROI). The ability to measure managerial performance is essential in
controlling operations toward the achievement of organizational goals. As companies grow or their activities
become more complex, they attempt to decentralize decision making as much as possible. They do this by re-
structuring the firm into several divisions and treating each as an independent business. The managers of these
sub-units or segments are then evaluated on the basis of the effectiveness with which they use the assets en-
trusted to them.
Perhaps the most widely used single measure of success of an organization and its subunits is the ROI. ROI re-
lates net income to invested capital (total assets). ROI provides a standard for evaluating how efficiently man-
agement employs the average dollar invested in a firm's assets, whether that dollar came from owners or credi-
tors. Furthermore, a better ROI can also translate directly into a higher return on the stockholders' equity. ROI is
calculated as:
ROI = (Net Profit after Taxes) / (Total Assets)
Example 10-15
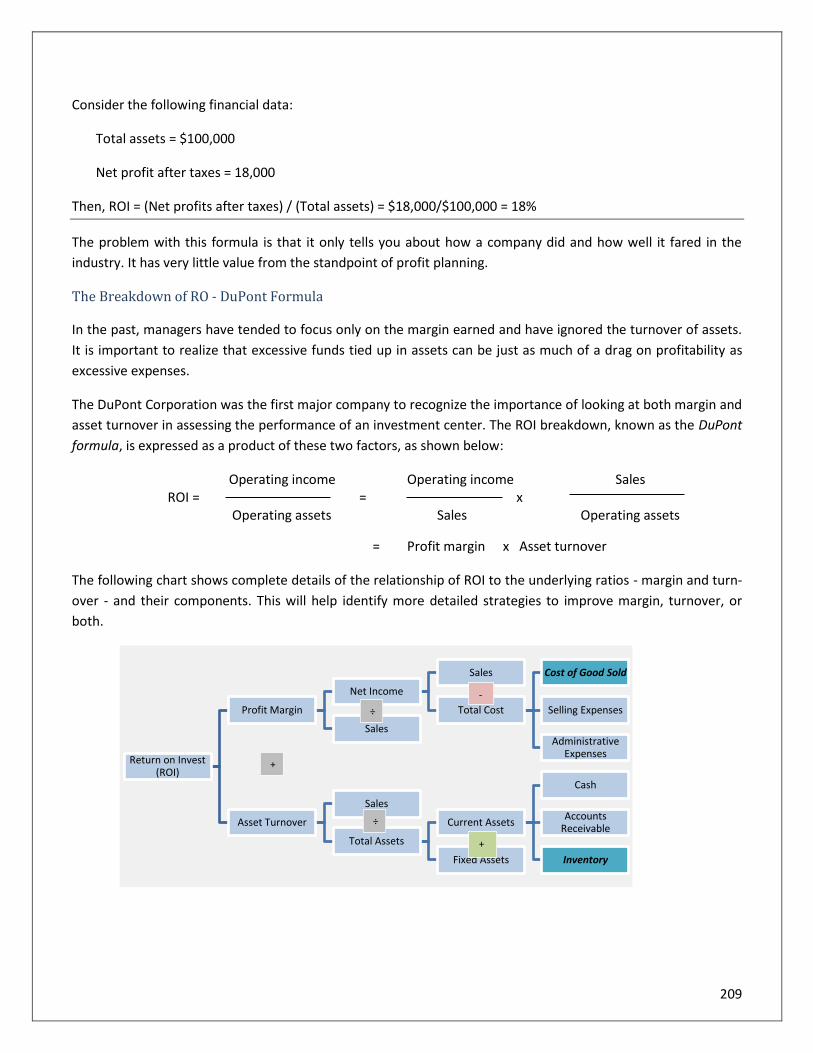
209
Consider the following financial data:
Total assets = $100,000
Net profit after taxes = 18,000
Then, ROI = (Net profits after taxes) / (Total assets) = $18,000/$100,000 = 18%
The problem with this formula is that it only tells you about how a company did and how well it fared in the
industry. It has very little value from the standpoint of profit planning.
The Breakdown of RO - DuPont Formula
In the past, managers have tended to focus only on the margin earned and have ignored the turnover of assets.
It is important to realize that excessive funds tied up in assets can be just as much of a drag on profitability as
excessive expenses.
The DuPont Corporation was the first major company to recognize the importance of looking at both margin and
asset turnover in assessing the performance of an investment center. The ROI breakdown, known as the DuPont
formula, is expressed as a product of these two factors, as shown below:
Operating income Operating income Sales ROI = = x Operating assets Sales Operating assets
= Profit margin x Asset turnover
The following chart shows complete details of the relationship of ROI to the underlying ratios - margin and turn-
over - and their components. This will help identify more detailed strategies to improve margin, turnover, or
both.
Return on Invest (ROI)
Profit Margin
Net Income
Sales
Total Cost
Cost of Good Sold
Selling Expenses
Administrative Expenses
Sales
Asset Turnover
Sales
Total Assets
Current Assets
Cash
Accounts Receivable
InventoryFixed Assets
÷
÷
-
+
+

210
As illustrated in the DuPont chart above, inventory has a double impact on a company’s ROI. For example, inven-
tory is included on the balance sheet that affects the asset turnover. In addition, the inventory costs are part of
the cost of sales, indicating that stock has a direct impact on the net profit margin.
The DuPont formula combines the income statement and balance sheet into this otherwise static measure of
performance. Profit margin is a measure of profitability or operating efficiency. It is the percentage of profit
earned on sales. This percentage shows how many cents attach to each dollar of sales. On the other hand, asset
turnover measures how well a company manages its assets. It is the number of times by which the investment in
assets turns over each year to generate sales.
The breakdown of ROI is based on the thesis that the profitability of a firm is directly related to management's
ability to manage assets efficiently and to control expenses effectively.
Example 10-16
Assume the same data as in Example 10-15. Also assume sales of $200,000.
Operating income $18,000 Then, ROI = = = 18% Operating assets $100,000
Alternatively,
Operating income $18,000 Margin = = = 9% Sales $200,000
Sales $200,000 Turnover = = = 2 times Operating assets $100,000
Therefore,
ROI = Margin x Turnover = 9% x 2 times
The breakdown provides a lot of insights to managers on how to improve profitability of the investment center.
Specifically, it has several advantages over the original formula for profit planning. They are:
1. Focusing on the breakdown of ROI provides the basis for integrating many of the management concerns
that influence a company’s overall performance. This will help managers gain an advantage in the
competitive environment.
2. The importance of turnover, as a key to overall return on investment, is emphasized in the breakdown.
In fact, turnover is just as important as profit margin in enhancing overall return.
3. The importance of sales is explicitly recognized, which is not there in the original formula.

211
4. The breakdown stresses the possibility of trading one off for the other in an attempt to improve the
overall performance of a company. The margin and turnover complement each other. In other words, a
low turnover can be made up for by a high margin; and vice versa.
Example 10-17
The breakdown of ROI into its two components shows that a number of combinations of margin and turnover
can yield the same rate of return, as shown below:
The turnover-margin relationship and its resulting ROI are depicted in Figure 10-1 . As the chart below shows,
the margin and turnover factors complement each other. A weak margin can be complemented by a strong
turnover, and vice versa. It also shows how important turnover is as a key to profit making. In effect, these two
factors are equally important in overall profit performance.
Margin x Turnover = ROI
(1) 9% x 2 times = 18%
(2) 6 x 3 = 18
(3) 3 x 6 = 18
(4) 2 x 9 = 18
Figure 10-1
The Margin-Turnover Relationship

212
Figure 10-1 can also be looked at as showing six companies that performed equally well (in terms of ROI), but
with varying income statements and balance sheets. There is no ROI that is satisfactory for all companies. Suc-
cessful operation must point toward the optimum combination of profits, sales, and capital employed. The com-
bination will necessarily vary depending upon the nature of the business and the characteristics of the product.
An industry with products tailor-made to customers' specifications will have different margins and turnover rati-
os, compared with industries that mass produce highly competitive consumer goods. For example, the combina-
tion (4) may describe a supermarket operation that inherently works with low margin and high turnover, while
the combination (1) may be a jewelry store that typically has a low turnover and high margin.
ROI and Profit Planning
The breakdown of ROI into margin and turnover gives managers insight into planning for profit improvement by
revealing where weaknesses exist: margin or turnover, or both. Various actions can be taken to enhance ROI.
Generally, they can:
1. Improve margin.
2. Improve turnover.
3. Improve both.
Alternative 1 demonstrates a popular way of improving performance. Margins may be increased by reducing
expenses, raising selling prices, or increasing sales faster than expenses. Some of the ways to reduce expenses
are:
• Use less costly inputs of materials.
• Automate processes as much as possible to increase labor productivity.
• Bring the discretionary fixed costs under scrutiny, with various programs either curtailed or eliminated.
Discretionary fixed costs arise from annual budgeting decisions by management. Examples include ad-
vertising, research and development, and management development programs. The cost-benefit analy-
sis is called for in order to justify the budgeted amount of each discretionary program.
A company with pricing power can raise selling prices and retain profitability without losing business. Pricing
power is the ability to raise prices even in poor economic times when unit sales volume may be flat and capacity
may not be fully utilized. It is also the ability to pass on cost increases to consumers without attracting domestic
and import competition, political opposition, regulation, new entrants, or threats of product substitution. The
company with pricing power must have a unique economic position. Companies that offer unique, high-quality
goods and services (where the service is more important than the cost) have this economic position.
Alternative 2 may be achieved by increasing sales while holding the investment in assets relatively constant, or
by reducing assets. Some of the strategies to reduce assets are:
• Dispose of obsolete and redundant inventory. The computer has been extremely helpful in this regard,
making perpetual inventory methods more feasible for inventory control.
• Devise various methods of speeding up the collection of receivables and evaluate credit terms and poli-
cies.

213
• See if there are unused fixed assets.
• Use the converted assets obtained from the use of the previous methods to repay outstanding debts or
repurchase outstanding issues of stock. The company may release them elsewhere to get more profit,
which will improve margin as well as turnover.
Alternative 3 may be achieved by increasing sales or by any combinations of Alternatives 1 and 2.
Example 10-18
Assume that management sets a 20% ROI as a profit target. It is currently making an 18% return on its
investment.
Operating income Operating income Sales ROI = = x Operating assets Sales Operating assets
Present situation:
18,000 200,000 18% = x 200,000 100,000
The following are illustrative of the strategies which might be used (each strategy is independent of the other).
Alternative 1:
Increase the margin while holding turnover constant. Pursuing this strategy would involve leaving selling prices
as they are and making every effort to increase efficiency in order to reduce expenses. By doing so, expenses
might be reduced by $2,000 without affecting sales and investment to yield a 20% target ROI, as follows:
20,000 200,000 20% = x 200,000 100,000
Alternative 2:
Increase turnover by reducing investment in assets while holding net profit and sales constant. Working capital
might be reduced or some land might be sold, reducing the investment in assets by $10,000 without affecting
sales and net income to yield the 20% target ROI as follows:
18,000 200,000 20% = x 200,000 90,000

214
Alternative 3:
Increase both margin and turnover by disposing of obsolete and redundant inventories or through an active
advertising campaign. For example, trimming down $5,000 worth of investment in inventories would also
reduce the inventory holding charge by $1,000. This strategy would increase ROI to 20%.
19,000 200,000 20% = x 200,000 95,000
Excessive investment in assets is just as much of a drag on profitability as excessive expenses. In this case,
cutting unnecessary inventories also helps cut down expenses of carrying those inventories, so that both margin
and turnover are both improved at the same time. In practice, Alternative 3 is much more common than
Alternatives 1 or 2.
Rate of Return on Stockholders’ Equity
Return on stockholders’ equity (ROE) indicates management’s success or failure at maximizing the return to
stockholders based on their investment in the company. This ratio emphasizes the income yield in relationship
to the amount invested. Financial leverage can be estimated by subtracting return on total assets from return on
shareholders’ equity. If the return on shareholders’ equity is greater than the return on total assets, financial
leverage is positive to the extent of the difference. If there is no debt, the two ratios would be the same. Return
on stockholders’ equity is computed as follows:
Return on equity = Net income
Average stockholder's equity
20X5 ratio =$95,500
$651,600 = 0.1465 = 14.65%
20X4 ratio =$81,00
$611,200 = 0.1325 = 13.25%
Unusual items are usually excluded from net income in the numerator because such items are nonrecurring. Re-
turn on stockholders’ equity is sometimes computed using the market value of the outstanding stock of the
company instead of average stockholders’ equity.
The rate of return on common stock shows the relationship between net income and the common stockholders’
investment in the company. To compute this rate, preferred dividends must be subtracted from net income.
This leaves net income available to the common shareholders. The formula for computing the rate of return on
common stock is:
Net Income − Preferred Dividends
Average Common Stockholders' Equity

215
Example 10-19
The Ogel Supply Corporation showed the following net income for 20X7, and total stockholders’ equity for the
years ended December 31, 20X7, and December 31, 20X6:
20X7 20X6
Net Income $103,140 $88,970
Preferred Stock Dividends $0 $0
Total Stockholders' Equity $405,200 $386,500
Calculate the rate of return on total common stockholders' equity for 20X7.
Average common stockholders' equity = ($405,200 + $386,500) / 2 = $395,850
Net Income − Preferred Stock Dividends =
$103,140 − $0 = 26.1%
Average Common Stockholders' Equity $395,850
The return on the common stockholders’ equity is 26.1%, which is 12.2% higher than the return on assets, which
is 13.9%. The company is borrowing at a lower rate to earn a higher rate. The practice is called trading on equi-
ty, or leverage, and is directly related to the debt ratio. If a company is profitable and is effectively using lever-
age, common stockholders will benefit. However, should revenues drop, the interest on debt must still be paid.
Thus, in times of operating losses, excessive debt can hurt profitability.
Market Ratios: Analyzing Financial Returns to Investors
Investors purchase stock to earn a return on their investment. This return consists of both gains from the sale of
appreciated stock and from dividends. Two ratios used to analyze the value of a stock include the price-earnings
ratio and the book value per share of stock.
Price-Earnings Ratio
The price-earnings ratio equals the market price per share divided by the earnings per share. A high price-
earnings ratio is generally favorable because it indicates that the investing public looks at the company in a posi-
tive light. It represents an indication of investors' expectations concerning a firm's growth potential However,
too high a price-earnings ratio could mean a poor investment because the stock may be overvalued, while a low
price-earnings ratio stock could be a good investment if it’s a case of the stock being undervalued. The formula
is:
Market Price Per Share
Earnings Per Share of Common Stock

216
Example 10-20
For the years 20X7 and 20X6 the market price per share of common stock for Ogel Corporation was as follows:
20X7 20X6
Market Price Per Share $130 $95
Using the earnings per share of $10.31 for 20X7 (from Example 17) and $8.90 for 20X6, we can calculate the
price/earnings ratio for each year as follows:
20X7 20X6 Market Price Per Share $130 $95
Earnings Per Share of Common Stock $10.31 = 12.6 $8.90 =10.7
The increase in the price-earnings multiple indicates that the stock market had a higher opinion of the business
in 20X7, possibly due to the company’s increased profitability.
Book Value per Share
The book value per share equals the net assets available to common stockholders divided by the shares out-
standing. Net asset equals stockholders’ equity minus preferred stock. The comparison of book value per share
to market price per share provides a clue as to how investors regard the firm. The formula for calculating book
value per share is as follows:
Total Stockholders' Equity − Preferred Equity
Number of Shares of Common Stock Outstanding
Book value of the net assets of a company may have little or no significant relationship to their market value. It
was once used as a proxy for a company’s intrinsic value. With the new economy, book value is a less relevant
measure for a company’s fair value for investors. For example, many new economy companies have assets that
do not register significantly on their balance sheet, such as intellectual property, employees, strong brand, and
market share. Book value may differ significantly from current market price per share as illustrated below:
Company Book Value Market Value
(April 2018) (In Billions) (In Billions)
Microsoft (MSFT) $78 $742
IBM (IBM) 18 137
Wal-Mart Stores (WMT) 78 258
Apple (AAPL) 138 902
General Electric (GE) 64 118
Source: Yahoo Finance (finance.yahoo.com)

217
Example 10-21
For the years 20X7 and 20X6 the stockholders’ equity of Ogel Corporation was as follows:
20X7 20X6
Total Stockholders' Equity $405,200 $386,500
If there are 10,000 shares of common stock outstanding at December 31 of each year, book value per share for
each year is:
20X7 20X6 Total Stockholders' Equity $405,200 $386,500
Common Shares Outstanding 10,000 = $40.52 10,000 = $38.65
Dividend Ratio
Dividend ratios help you determine the current income from an investment. Two relevant ratios are:
Dividend yield = dividends per share
market price per share
Dividend payout = dividends per share
earnings per share
A dividend is a distribution of cash, other assets, liabilities, or a company’s own stock to stockholders in propor-
tion to the number of shares owned. The distribution is usually generated from earnings of the corporation. The
board of directors of a corporation is responsible for determining the dividend policy including the amount, tim-
ing, and type of dividends to be declared. The types of dividends are classified as follows:
1. Dividends that decrease total stockholders’ equity:
• Cash dividends
• Property dividends
• Script dividends
2. Dividends that do not affect total stockholders’ equity:
• Stock dividends
• “Dividends” not affecting any stockholders’ equity account (stock splits in the form of a divi-
dend)

218
Cash Flow Coverage (Adequacy) Ratios
As we have noted, a firm’s operating activities must, in the long run, be able to generate enough cash to meet
the firm’s needs, as there are always limits to the amount of funds that can be generated through debt and eq-
uity offerings. Several ratios have been developed to help users assess the amount of cash generated from op-
erating activities. The three most common ratios include:
1. Cash debt coverage ratio
2. Cash dividend coverage ratio
3. Cash interest coverage ratio
These ratios are based on cash provided generated from operating activities, and they provide a way to measure
adequacy or liquidity. Because the ratios that follow are aimed at determining the adequacy of cash, cash inter-
est payments, cash tax payments, and dividends paid are used rather than their accrual-basis counterparts—
interest expense, tax expense, and dividends declared. If the activities of a company are stable, there will not be
much difference between the cash-basis and the accrual-basis figures for these items. However, to the extent
that a company has growing or shrinking cash flows, figures may either lag or lead accrual-basis figures. None-
theless, to be consistent, both the numerator and denominator of the ratios are based on the cash flow figure,
where appropriate.
Exhibit 10-3 is a summary of the financial data of Beta Manufacturing Company. All data except for common
shares outstanding are in thousands.
Exhibit 10-3
Summary of Financial Data
Beta Manufacturing Company
20x4 20x5
Cash flows from operating activities $117,500 $134,000
Cash interest payments 34,000 34,000
Cash tax payments 44,000 41,500
Cash dividends paid to shareholders 35,500 36,700
Cash dividend on preferred stock 700 700
Operating income 140,000 159,000
Net income 81,000 95,500
Average total assets 1,263,200 1,293,600
Average total debt 652,000 642,000
Average stockholders’ equity 611,200 651,600
Common stock—shares outstanding 29,000,000 30,000,000

219
Cash Debt Coverage Ratio
The cash debt coverage ratio is calculated by dividing cash flows from operating activities by average total debt
(current liabilities plus long-term debt). This ratio measures a firm’s ability to repay both its short- and long-term
debt. In a sense, this ratio is an indicator of the financial risk of a firm. If the ratio is high, the firm faces less risk
by generating cash flows to repay its debt. The cash debt coverage ratio for Beta Manufacturing is computed as
follows:
Cash debt coverage ratio = Cash flows from operating activities
Average total debt
20X4 20X5
$117,500 $134,000
652,000 642,000
= 0.180 0.209
Although cash coverage is improving, it is not a particularly high ratio.
A higher ratio indicates liquidity and solvency, and that the company is generating cash sufficient to meet its
near-term and long-term needs. A general rule of thumb is that a ratio below .2 is considered cause for addi-
tional investigation.
Cash Dividend Coverage Ratio
The cash dividend coverage ratio is calculated by dividing cash flows from operating activities by total dividends
paid and measures the firm’s ability to pay dividends at the current level or to potentially increase dividends in
the future. The cash dividend coverage ratio for Beta Manufacturing is calculated as:
Cash dividend coverage ratio = Cash flows from operating activities
Average dividends paid
20X4 20X5
$117,500 $134,000
35,500 36,700
= 3.01 3.66
This ratio indicates that Beta Manufacturing is generating almost four times the amount of cash needed to cover
its current dividends in 20X5. It reflects an improvement.

220
Cash Interest Coverage Ratio
The cash interest coverage ratio is calculated by adding cash flows from operating activities to interest and taxes
paid in cash, then dividing this total by cash interest payments. It is a measure of a firm’s ability to meet its cur-
rent interest payments. This ratio is similar to the times interest earned ratio, except that it is based on cash
flows from operating activities rather than net income. For Beta, this cash interest coverage ratio is computed as
follows:
Cash interest coverage ratio= = Cash flows from operating activities + Interest paid + Taxes paid
Cash interest payments
20X4 20X5
($117,500 + $34,000 + $44,000) ($134,000 + $34,000 + $41,500)
$34,000 $34,000
= 5.75 = 6.18
This ratio indicates that Beta is generating cash flows before interest and taxes that are more than six times the
amount of its interest payments in 20X5. This ratio, together with the cash dividend coverage ratio, indicates
that Beta is generating more than enough cash flows from its operating activities to cover its annual interest and
dividend payments.

221
Chapter 10 - Section 2 Review Questions
5. Windham Company has current assets of $400,000 and current liabilities of $500,000. Which of the follow-
ing would increase Windham Company's current ratio?
A. The purchase of $100,000 of inventory on account
B. The payment of $100,000 of accounts payable
C. The collection of $100,000 of accounts receivable
D. Refinancing a $100,000 long-term loan with short-term debt
6. When a balance sheet amount is related to an income statement amount in computing a ratio, which of the
following is TRUE?
A. The income statement amount should be converted to an average for the year.
B. The balance sheet amount should be converted to an average for the year.
C. Both amounts should be converted to market value.
D. Comparisons with industry ratios are not meaningful.
7. The accounts receivable turnover ratio will normally decrease as a result of which of the following?
A. The write-off of an uncollectible account (assume the use of the allowance for doubtful accounts meth-
od).
B. A significant sales volume decrease near the end of the accounting period.
C. An increase in cash sales in proportion to credit sales.
D. A change in credit policy to lengthen the period for cash discounts.
8. The following ratios relate to a company’s financial situation compared with that of its industry: The compa-
ny has a ROI = 7.9% and a ROE = 15.2%. The industry has a ROI = 9.2% and a ROE = 12.9%. What conclusion
could a financial analyst draw from these ratios?
A. The company's product has a high market share, leading to higher profitability.
B. The company uses more debt than the average company in the industry.
C. The company's profits are increasing over time.
D. The company's shares have a higher market value to carrying amount than the rest of the industry.
9. If a company is profitable and effectively using leverage, which of the following ratios is likely to be the larg-
est?
A. Return on total assets
B. Return on operating assets
C. Return on equity
D. Return on total shareholders' equity

222
PART VI:
OPTIMIZING PROFITABILITY
AND MITIGATING RISKS

223
Chapter 11: Risk Management Strategy
Learning Objectives:
After completing this section, you will be able to:
• Recognize the risk management principles such as the key concepts and processes
• Identify the components of enterprise risk management
• Recognize the critical differences in roles and responsibilities of the Three Lines of Defense model
The Role of the CFO
In the aftermath of the global financial crisis, security breaches, and natural disasters, many companies have
called for greater emphasis on risk management activities. This was once a concern primarily of senior execu-
tives in the financial service sector; it has now become a top management priority in nearly every industry.
Many businesses have increased the amount of time and resources devoted to risk management.
Although many large companies have risk officers to identify, assess, and respond to ongoing and emerging risks
to the business, CFOs play a lead role in orchestrating these efforts as stewards of a company’s financial health.
Many key elements of risk management are natural extensions of activities CFOs already perform. For example,
CFOs support the company’s risk management philosophy, promote compliance with its risk appetite, and man-
age risks within their responsibility consistent with risk tolerances. CFOs can help strategically balance risk and
return and therefore create significant value for their companies and shareholders by taking the following steps:
1. Establishing a strong link between risk management and business-planning processes
2. Using risk analytics to inform investment and strategic decisions
3. Leading an enterprise-wide discussion of risk preference focusing on choices that most likely deliver
economic profit for the company
Although companies have made progress in strengthening their risk management practices, many of them still
consider risk management as primarily a regulatory issue or they only focus on individual components of risk
management process. Examples of common deficiencies include:
• The risks identified are often heavily biased toward current operations and rarely include risks affecting
plans related to future growth (e.g. how to meet profitability target in an uncertain economy?)

224
• The approach usually misses critical external factors which people consider as “beyond their control”
(e.g., important regulatory change or supplier performance)
• The process is characterized by complex financial models and elaborate, formal risk management sys-
tems; in isolation from the day-to-day activities of the broader organization
To help CFOs avoid common pitfalls and ensure the ongoing success of risk management initiatives, this chapter
discusses the fundamentals that should govern the art of risk management. It is designed to improve the risk
management skills of CFOs enabling them to establish robust risk management strategies that support their
businesses for growth while remaining cost competitive.
Case Study: First Solar − Coping with Unprecedented Challenges
First Solar, a maker of photovoltaic panels for solar energy applications, has built its business model on the prin-
ciple of minimizing financial risk from its launch in 1999. At a time when many companies in the photovoltaic
industry were focusing on high-cost technologies for making moderately efficient but very low-cost solar cells.
As its founders believe, the company would be able to scale more cheaply (therefore more quickly) than its
competitors by specializing in technologies that had relatively low capital expenditure per watt of manufacturing
capacity. Thus, the company is able to fund the bulk of its growth through its own cash flow. Moreover, the
company decided to focus exclusively on sustainable markets with economic fundamentals that supported de-
mand for solar cells over the long term to avoid overreliance on the government subsidies for purchasing solar
cells.
Both decisions were critical when the 2008 global financial crisis transformed the company’s business environ-
ment. The dramatic decline in the availability of credit made it more difficult for companies in the industry to
raise financing. However, this situation did not affect First Solar since it had been funding its new investment
largely from its own cash flow. In addition, the global recession indicated that governments were cutting back on
their subsidies to the green-energy section. This change damaged the company’s competitors that were over
reliant on markets dominated by subsidies. First Solar was able to adapt to the new environment because it had
built risk management into its business model. It has closely monitored emerging technological and political
trends to adjust its model accordingly.
Source: The Boston Consulting Group, The Art of Risk Management, 2017
Enterprise Risk Management Principles
All organizations face uncertainty, and the challenge for management is to determine how much uncertainty to
accept as it strives to grow stakeholder value. Risk management enables management to effectively deal with
uncertainty and associated risk and opportunity, enhancing the capacity to build value. Thus, risk management is
more than just compliance/regulatory issues; it should also be considered a value-creating activity that is essen-
tial to the strategic debate inside the organization.
In summary, risk management is an essential element of the strategic management of any organization and
should be embedded in the ongoing activities of the business. Two widely referenced frameworks include the

225
US-based Committee of Sponsoring Organizations (COSO) ‘ERM – Integrated Framework’; and guidance devel-
oped by the UK-based Airmic and The Institute of Risk Management (IRM) – ‘A structured approach to ERM and
the requirements of ISO 31000’.
Key Concepts of Risk Management
Vision, Goals, and Objectives
The first step to defining risk management goals and objectives is to develop the organization’s shared vision.
The shared vision should be built based on an understanding of the key business units and risks. This vision pro-
vides includes the role of risk management in the organization and the capabilities desired to manage its key
risks. Risk management capabilities consist of:
1. The specific capabilities that relate to managing priority risks. To determine the specific capabilities
around managing priority risks, an organization needs to:
The evaluation of the current state of risk management capabilities is discussed in Chapter 11 - Applica-
tion and Implementation of Enterprise Risk Management.
2. The Enterprise Risk Management (ERM) infrastructure. Examples of ERM infrastructure elements in-
clude:
• Risk management policy
• Common risk language
• Enterprise-wide risk assessment process
• Fraud risk committee
• Integration of risk responses within business plans and strategic setting
• Risk reporting
According to COSO, the greater the gaps in the current state and the desired future state of the organization’s
risk management capabilities, the greater the need for the ERM infrastructure to facilitate the advancement of
risk management capabilities over time. A business plan is needed to ensure that solutions required to close sig-
nificant gaps and deliver management’s desired outcome are implemented and monitored. In other words, the
risk management vision is an action plan to drive the organization to identify, design and develop the risk man-
agement capabilities needed to close significant gaps and make management’s selected risk responses happen.
The following is an example of an overall risk management vision statement of an international company with
more than 60 operating units.
Select the priority risksDetermine the current
state of risk management capability
Assess the desired future state

226
“Business Risk Management is a continuous process, and an element of Corporate Governance. It pro-
motes efficient and effective assessment of risk increases risk awareness and improves the management
of risk throughout the Group. This includes anticipating and avoiding threats and losses as well as identi-
fying and realizing opportunities.”
Overall risk management goals and objectives must be defined once the shared vision is articulated. The goals
and objectives should be consistent with and supportive of the organization’s business objectives and strategies.
Therefore, the organization’s business model provides an important context for risk management. For example:
1. It helps management identify unique risks inherent in the company’s business.
2. It targets the markets and region in which the company does business.
3. It specifies the products and services it provides to those markets, and the channels it uses to access
those markets.
4. It is built on different elements such as on the processes of converting materials and labor into products
and services, on the employees hired, trained, and retained, on the suppliers partnered with, and on the
landers and shareholders supplying with capital.
Examples of common risk management objectives include:
• Build and improve capabilities to respond effectively to low probability, critical, catastrophic risks.
• Achieve cost savings through better management of internal resources.
• Allocate capital more effectively.
Appendix E provides an example of a statement of risk management vision, mission, goals and objectives.
Event vs. Risk
Risk can be defined as the possibility that an event will occur and adversely affect the achievement of objectives.
Events can have either a positive or a negative impact. An event with a positive impact represents an opportuni-
ty. An event with a negative impact on achieving an objective represents a risk. In other words, events affect the
company’s objectives and create the condition for a risk only if it has negative impact. For example, the failure of
a supplier to provide materials for production is an event. The risk of not meeting production deadlines causes
late deliveries to customers.
Uncertainty is not knowing what will happen in the future. The greater the uncertainty, the greater the risk. An
organization must understand the sources of uncertainty, because risk is about knowledge. When management
lacks knowledge, there is greater uncertainty.
Risk Appetite vs. Risk Tolerance
Risk appetite, the amount of risk that an organization is willing to accept, relates primarily to the business model
(on a broad level). It reflects the company’s risk management philosophy influencing its culture and operating
style. Most companies consider risk appetite qualitatively (e.g., high, medium, low), while others take a quanti-

227
tative approach, balancing goals for growth, return and risk. When a company has a higher risk appetite, it may
be willing to allocate a large portion of its capital to high-risk areas. However, a company with a low-risk appe-
tite usually limits its short-term risk of large losses of capital by investing only in stable markets. In short, risk
appetite is strategic. Thus, a good understanding of an organization’s business objectives, strategy and opera-
tions is very helpful when calculating the risks it chooses to accept or avoid.
Risk tolerance is defined as the acceptable variation relative to the achievement of an objective using the met-
rics in place to measure performance against that objective. Therefore, risk tolerances are used to ensure that
performance variability is reduced to an acceptable level. They usually address questions like “How much varia-
bility are we willing to accept as we pursue a given business objective?”
Risk Appetite Risk Tolerance
• Strategic
• Linking to Business Model
• Tactical
• Linking to Business Objectives
Inconsistency with the Desired Risk Appetite
There may be incongruities in the business model when it fails to balance the creation of enterprise value with
the risk appetite considered acceptable by the board. For example, the CEO may be overdosing on risk beyond
an acceptable level within the growth strategy. The business model must be consistent with the organization’s
desired risk appetite. Then the organization can align its market, product, processes, people, technology, and
locations of operation with the model.
Risk Assessment vs. Risk Management
Risk assessment is the process of identifying, sourcing and evaluating (e.g. likelihood and potential impact) indi-
vidual risks and the interrelationships between risks. It supports management in analyzing the impact of poten-
tial future events on the achievement of business objectives. The risk assessment process is discussed in Chapter
11 - The Risk Assessment Process.
Risk management, on the other hand, encompasses risk assessment as well as the activities associated with
managing risk, such as policies, processes, reporting, and systems.
Risk Reporting
Risk reporting is a critical because it drives transparency about risk and risk management throughout the organi-
zation to enable risk assessment, execution of risk responses and control activities as well as monitoring of per-
formance. Risk management information can be summarized in various ways; for the organization as a whole, by
business unit, by risk unit, by region and by product group. The ultimate goal is to allow decision makers to eval-
uate risk management performance monthly, weekly, daily or in real-time (if possible).
Protiviti lists the following examples of risk management reports:

228
• A summary of the organization’s risks, broken down by business unit, location, or product group
• A summary of the existing gaps in the capabilities for managing the priority risks
• A summary of the top and worst performance investments with explanations
• Value-at-risk reports to assess the sensitivity of existing portfolio positions to market rate changes be-
yond specified limits, and consider the exposure of earnings or cash flow to severe losses
• Summary of scenario analyses assessing the impact of changes in other key variable beyond manage-
ment’s control (e.g., weather, inflation, supplier performance levels)
• Operational risk reports listing exceptions that have occurred vs. policies/established limits, including
significant breakdowns, accidents, incidents, errors, losses
• Studies or targeted analyses to evaluate questions about specific events or anticipated concerns that
could adversely affect the organization
• Summary of significant findings of internal audit or reviews conducted by other independent parties
(e.g. regulators)
• Summary of the status of improvement initiatives
Enterprise Risk Management vs. Traditional Risk Management Approaches
While ERM is a relatively new discipline, application techniques have been evolving over the last decade. The
Committee of Sponsoring Organizations of the Treadway Commission (COSO) defines ERM as:
“A process, effected by an entity’s board of directors, management and other personnel, enterprise-wide at stra-
tegic level, designed to identify potential events that may affect the entity, and manage risks to remain within its
risk appetite, to provide reasonable assurance regarding the achievement of entity objectives.”
The Characteristics of
ERM
A process, ongoing and
flowing through an
entityEffected by people at
every level of a company
Linked to the strategy,
mission and vision of the
companyGeared to the achievement of enterprise-
wide objectives
Able to provide
reasonable assurance to management and board of
directors
Managed within the risk appetite at all
levels

229
Based on the definition, the scope of ERM is broader than traditional risk management approaches. Traditional
risk management approaches are focused on protecting the tangible assets reported on a company’s balance
sheet as well as the related contractual rights and obligations. ERM emphasizes the enhancement of business
strategy, and its scope is much broader than protecting physical and financial assets. The application of ERM is
focused on enhancing and protecting the combination of tangible and intangible assets encompassing the com-
pany’s business model. Potential future events can affect the value of tangible physical and financial assets as
well as the value of key intangible assets (e.g., innovative processes, unique brands, differentiating strategies).
ERM elevates risk management to a strategic level by expending its application to all sources of value by focus-
ing on the entire asset portfolio, not just the physical and financial areas.
The following exhibit illustrates the five categories of assets representing sources of value, and examples are
noted within each category. These asset categories include sources of value underlying a company’s strategy.
ERM transforms risk management from a discipline of avoiding and hedging bets to a skill for enhancing and
protecting value, freeing management to pursue new opportunities for growth and returns.
Exhibit 11-1
Categories of Assets
Source: Protiviti, Guide to Enterprise Risk Management, 2006
Organizational Assets
•Reputation
•Innovation
•Systems
•Process
•Leadership
•Strategy
•Knowledge
•Values
Physical Assets
•Land
•Building
•Equipment
•Inventory
Financial Assets
•Cash
•Receivables
•Investments
•Equity
•Prepaids and other
Customer Assets
•Customers
•Channels
•Affiliates
Employee/Supplier Assets
•Employees
•Suppliers
•Partners

230
The risk assessment process can lead to more comprehensive risk responses as management identifies potential
future events that could affect each asset category. The following table lists potential future events that may be
considered during a risk assessment.
Exhibit 11-2
Potential Future Events for Considerations
Organizational Assets
• Inadequate information for decision-making
• Financial restatement
• False executive certifications
• Business interruption
• Erosion of intellectual property
• Brand erosion
• Reputation loss
• Late to market
• Security breach
• Lack of leadership
• Unclear or obsolete strategies
• Lack of resiliency
• Lack of institutional learning
• Ineffective/inefficient processes
• Irresponsible business behavior
• Illegal acts
• Poor knowledge sharing
• Obsolete systems
Physical Assets
• Unauthorized use
• Inefficient use
• Catastrophic loss
• Unacceptable costs
Financial Assets
• Poor economic performance
• Lack of economic sources of debt or equity capital
• Unacceptable losses
• Unexpected losses
• Insufficient liquidity
• Inefficient use
Customer Assets
• Pervasive quality failures
• Significant losses of key customers or channels
• Inefficient channels
• Loss of markets or market opportunities
• Ineffective alliances
Employee/Supplier
Assets
• Talent shortage
• Work stoppages
• Loss of morale
• Poor supplier performance

231
• Excessive costs & lead times
• Poor quality
• Ineffective partnerships
Source: Protiviti, Guide to Enterprise Risk Management, 2006
Moreover, uncertainty about the future creates risk and ERM extends the focus of risk management to all signif-
icant sources of company value. Management is able to identify the potential of the company’s business model
by understanding the external and internal variables contributing to uncertainty in a business, and monitoring
trends in those variables over time. The greater the dispersion of possible future events, the higher the compa-
ny’s level of exposure to uncertain returns. An ERM infrastructure facilitates a company’s ability to:
1. Identify the significance of its exposures to change and future events
2. Assess the likelihood of those changes, and future events occurring
3. Manage the business implications should any combination of those possible future changes and events
occur
The following exhibit provides examples of observable events to illustrate this point.
Exhibit 11-3
Exposures and Variables for Considerations
Asset Category Examples of Exposures
Some Illustrative Variables For Evaluating Uncer-
tainty
Organizational
Assets
Brand image Change in ability to deliver on brand promise
Differentiating strategy
• Change in quality, time and cost performance
relative to competitors
• Change in customer expectations and wants
Innovative processes New technological innovations that obsolete exist-
ing process capabilities
Physical Assets
Physical facilities
Catastrophic occurrence probability of:
• Maximum possible loss
• Maximum foreseeable loss
• Normal loss
Production throughout • Defects occurrence probability
• Changes in backlog
Financial Assets
Net monetary assets Change in interest, exchange and inflation rates
Business plan cash flow Change in interest, exchange and inflation rates
Total accounts receivable Customer default probability
Commodity holdings Changes in oil, metals, power and other prices
Equity holdings Changes in stock prices
Customer Assets
Customer base Change in service quality index
Revenue streams • Change in competitor pricing
• Returns occurrence probability
Employee/Supplier
Assets Employee group
• Change in change readiness index
• Health and safety incidents occurrence prob-

232
ability
Strategic suppliers
• Change in just-in-time performance ratings
• Change in quality ratings
• Change in raw materials prices
Source: Protiviti, Guide to Enterprise Risk Management, 2006
In summary, an organization’s ERM enhances the risk management capabilities by providing better and broader
knowledge and information about the enterprise’s key variables (or risks) and its capabilities around managing
the effects of changes in those variables.
Components of Enterprise Risk Management
According to COSO, ERM consists of eight interrelated components. These are derived from the way manage-
ment runs an organization and are integrated into the management process. These components are:
Internal Environment. The internal environment encompasses the tone of an organization and sets the basis for
how risk is viewed and addressed, including risk management philosophy and risk appetite, integrity and ethical
values, and the environment in which they operate. It basically encompasses the “tone at the tope” of the or-
ganization that influences the organization’s governance process and the risk and control consciousness of its
people.
Objective-setting. Objectives must exist before management can identify potential events affecting their
achievement. ERM ensures that management has a process in place to set objectives, and that the chosen ob-
jectives support and align with the organization’s mission and are consistent with its risk appetite. Therefore,
objective-setting is a precondition to event identification, risk assessment and risk response. Details are dis-
cussed in Chapter 17.
Event Identification. Internal and external events affecting achievement of an organization’s objectives must be
identified, distinguishing between risks and opportunities. Opportunities are channeled back to management’s
strategy or objective-setting processes.
Risk Assessment. Risks are analyzed, considering likelihood and impact, as a basis for determining how they
should be managed. Risks are assessed on an inherent and a residual basis.
Risk Response. Management selects risk responses, acceptance or tolerance of a risk; avoidance or termination
of a risk; risk transfer or sharing via insurance, developing a set of actions to align risks with the organization’s
risk tolerances and risk appetite.
Control Activities. Policies and procedures are established and implemented to help ensure that risk responses
are effectively carried out.
Information and Communication. Relevant information is identified, captured, and communicated in a form and
timeframe that enables people to carry out their responsibilities. Effective communication also occurs in a
broader sense, flowing down, across, and up the organization.
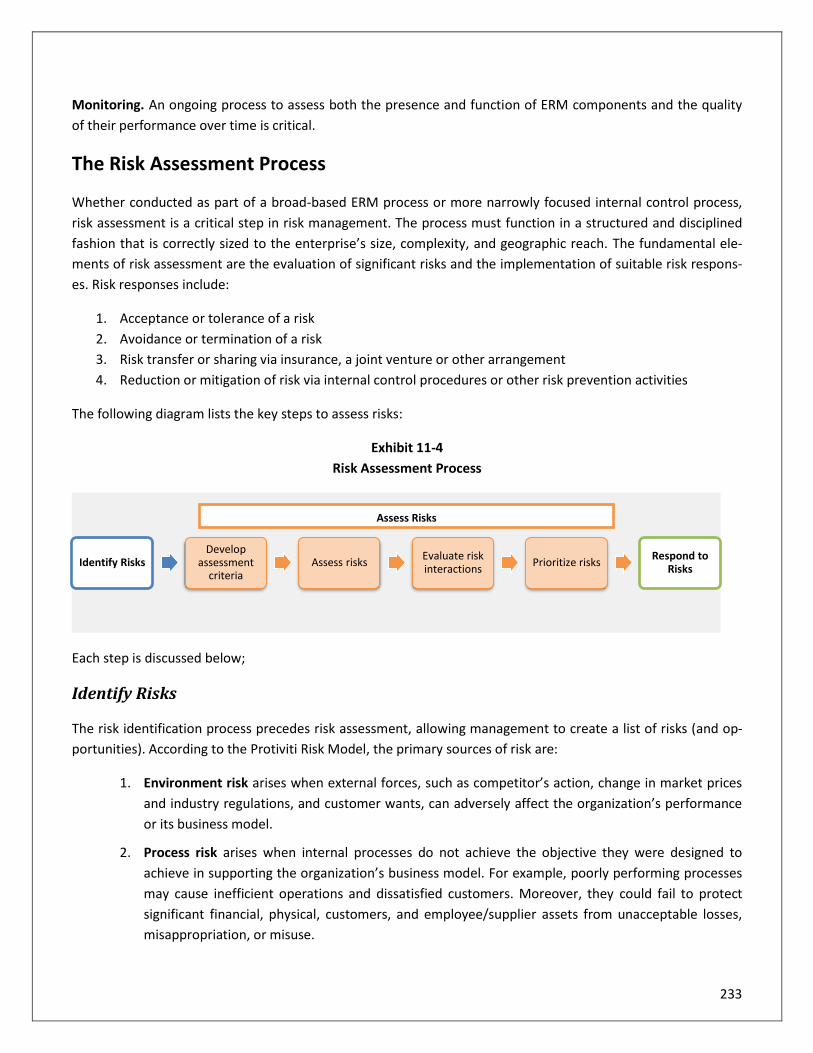
233
Monitoring. An ongoing process to assess both the presence and function of ERM components and the quality
of their performance over time is critical.
The Risk Assessment Process
Whether conducted as part of a broad-based ERM process or more narrowly focused internal control process,
risk assessment is a critical step in risk management. The process must function in a structured and disciplined
fashion that is correctly sized to the enterprise’s size, complexity, and geographic reach. The fundamental ele-
ments of risk assessment are the evaluation of significant risks and the implementation of suitable risk respons-
es. Risk responses include:
1. Acceptance or tolerance of a risk
2. Avoidance or termination of a risk
3. Risk transfer or sharing via insurance, a joint venture or other arrangement
4. Reduction or mitigation of risk via internal control procedures or other risk prevention activities
The following diagram lists the key steps to assess risks:
Exhibit 11-4
Risk Assessment Process
Each step is discussed below;
Identify Risks
The risk identification process precedes risk assessment, allowing management to create a list of risks (and op-
portunities). According to the Protiviti Risk Model, the primary sources of risk are:
1. Environment risk arises when external forces, such as competitor’s action, change in market prices
and industry regulations, and customer wants, can adversely affect the organization’s performance
or its business model.
2. Process risk arises when internal processes do not achieve the objective they were designed to
achieve in supporting the organization’s business model. For example, poorly performing processes
may cause inefficient operations and dissatisfied customers. Moreover, they could fail to protect
significant financial, physical, customers, and employee/supplier assets from unacceptable losses,
misappropriation, or misuse.
Identify RisksDevelop
assessment criteria
Assess risksEvaluate risk interactions
Prioritize risksRespond to
Risks
Assess Risks

234
3. Information for decision-making risk arises when information used to support business decisions is
inaccurate, out of date, incomplete, or late to the decision-making process.
These three types of risk provide a broad foundation on which more specific categories of risk can be identified.
Management can also use this foundation to build a common risk language that enables people with diverse
backgrounds and experience to communicate more effectively. In other words, a common language is a tool for
facilitating ongoing dialogue among the managers and employees about risk. Essential elements of a common
language include:
• Clarifying terminology that helps the organization with identification of risks, providing an ongoing
basis for discussion and analysis
• A process classification scheme that separates the business into its operating, management, and
support components that facilitate the sourcing of risk
• Effective frameworks that simplify communication about risk management, enable fact-based eval-
uations of processes
The following exhibit lists examples of risk language:
Exhibit 11-5
Examples of Risk Language
Environment
Risk
Uncertainties affecting the
viability of the business
model
• Competitor
• Customer Wants
• Technological Innovation
• Shareholder Expectations
• Capital Availability
• Sovereign/Political
• Legal
• Regulatory
• Industry
• Financial Markets
Process Risk
Uncertainties affecting the
execution of the business
model
Governance
• Organizational Culture
• Ethical Behavior
• Board Effectiveness
• Succession Planning
Financial
• Interest Rate
• Currency
• Equity
• Financial Instrument
• Cash Flow
• Opportunity Cost
• Settlement

235
• Collateral
Operations
• Customer Satisfaction
• Knowledge Capital
• Product Development
• Cycle Time
• Sourcing
• Channel Effectiveness
• Product/Service Failure
• Business Interruption
Information for
Decision-
Making Risk
Uncertainties over the rele-
vance and reliability of in-
formation
Strategic
• Business Portfolio
• Investment Valuation
• Organization Structure
• Measurement
• Resource Allocation
• Planning
Public Report-
ing
• Financial Reporting Evaluation
• Internal Control Evaluation
• Executive Certification
• Taxation
• Pension Fund
• Regulatory Reporting
Operational
• Budget and Planning
• Product/Service Pricing
• Contract Commitment
• Accounting Information
Source: Protiviti, Guide to Enterprise Risk Management, 2006
Assess Risks
An effective risk identification process produces a key business risk universe or register that is linked to the
business objectives and value drivers. To formulate effective risk responses, management must assess (priori-
tize) critical risks or the value proposition for implementing ERM can only be generic. Identifying the organiza-
tion’s priority risks enables senior management and the board to be able to better focus on key risks. This priori-
tization is accomplished by risk mapping. Risk mapping is defined as:
• A common tool used by companies to prioritize the risks associated with their business activities.
• A way of representing the resulting qualitative and quantitative evaluations of the probability of risk
occurrence and the impact on the organization in the event that a particular risk is experienced.
Commonly used factors of the assessment criteria include:

236
Likelihood. Likelihood indicates the possibility that a given event will occur. Likelihood can be expressed using
qualitative terms (e.g., almost certain, likely, possible, unlikely, rare), as a frequency, or as a probability percent-
age. When using numerical values, whether a percentage or frequency, the relevant time period should be spec-
ified such as an annual frequency or the more relative probability over the life of the asset. The higher the
probability of occurrence, the greater the likelihood. The following table illustrates the likelihood scale:
The Likelihood of the Risk Event Occurring
Rating Frequency Probability
5 Frequently Occurs several times per
year
Almost
certain
>90-100% chance of occur-
rence over life of asset or pro-
ject
4 Likely Once per year Likely >50-90% chance of occurrence
over life of asset or project
3 Possible Over a five-year period Possible >25-50% chance of occurrence
over life of asset or project
2 Unlikely Occurs over a five to ten
year period Unlikely
>10-25% chance of occurrence
over life of asset or project
1 Rare Once in 100 years Rare 0-10% chance of occurrence
over life of asset or project
Impact. As potential future events are identified, they are plotted on a grid or map according to their impact on
the achievement of business objectives and the likelihood of their occurrence. Impact (or consequence) refers
to the extent to which a risk event might affect the organization. Impact assessment criteria may include strate-
gic, financial, reputational, regulatory, safety, security, environmental, employee, customer, supplier, and opera-
tional impacts. The greater the significance of the impact, the more severe the risk. The following table illus-
trates loss or damage impact scale:
Rating
The Loss or Damage Impact of the Risk Event Occurring
(in terms of the objectives of the organization)
5 Catastrophic Most objectives may not be achieved, or several se-
verely affected
4 Major Most objectives threatened, or one severely affected
3 Moderate Some objectives affected, considerable effort to rectify
2 Minor Easily remedied, with some effort the objectives can be
achieved
1 Negligible Very small impact, rectified by normal processes
An example of a risk map is provided below. This matrix will not be the same for every organization.

237
Catastrophic
Major
Moderate
Minor
Negligible
Rare
Low
Medium
High
Extreme
Unlikely Possible Likely Frequently
Business Objectives Risk Language
Over the next three years:
• Grow the top line by 70%
• Improve customer satisfac-
tion by 20%
1. Catastrophic loss
2. Channel effectiveness
3. Customer wants
4. Commodity price
5. Financial market
6. Reputation
7. Legal/regulatory
8. Political
Key questions for management to ask include:
• What could happen? List risks, incidents or accidents that might happen by systematically working
through each competition, activity or stage of the event to identify what might happen at each stage.
• How and why it can happen? List the possible causes and scenarios or description of the risk, incident or
accident.
• What constitutes a material risk to our company?
• How much risk are we willing to accept?
• What is the likelihood of them happening?
• What will be the consequences if they do happen?
Management also needs to recognize the importance of managing risk interactions since risk do not exist in iso-
lation. For example, a seemingly insignificant risk may cause great damage when it interacts with other events
1
2 3
4
5
6 7
8

238
and conditions. An easy way to consider risk interactions is to group related risks into a broad risk area (e.g.
grouping risk related to sourcing, sale channels) and assign ownership for the risk area. The following exhibit is
an example of a risk interaction map:
Exhibit 11-6
Example of Risk Interaction Map
Risk Sup
ply
Ch
ain
Dis
rup
tio
n
Cu
sto
me
r P
refe
ren
ce
Shif
t
Co
pp
er
Pri
ce
In-
cre
ase
>2
5%
Wo
rk
Sto
pp
age
>1
We
ek
Eco
no
mic
Do
wn
turn
Sup
plie
r
Co
nso
lidat
ion
Supply Chain Disruption X X X X
Customer Preference Shift X
Copper Price Increase >25% X X X
Work Stoppage >1 Week X X X
Economic Downturn X X X X
Supplier Consolidation X X X X
Source: Deloitte & Touche LLP, Risk Assessment in Practice, 2012
Responding to Risks
Management should design overall risk responses for the identified risks based on the significance of the risk
and defined risk tolerance. There are four fundamental choices:
1. Acceptance - No action is taken to respond to the risk based on the insignificance of the risk.
2. Avoidance - Action is taken to stop the operational process or the part of the operational process
causing the risk.
3. Reduction - Action is taken to reduce the likelihood or magnitude of the risk.
4. Sharing - Action is taken to transfer or share risks across the entity or with external parties, such as
insuring against losses. Other examples include lease agreements, waivers, disclaimers, tickets, and
warning signs.
When risk response actions do not operate within the defined risk tolerances, management should revise risk
responses or reconsider defined risk tolerances through periodic risk assessments. Examples of actions for each
response include:
Acceptance Avoidance Reduction Sharing
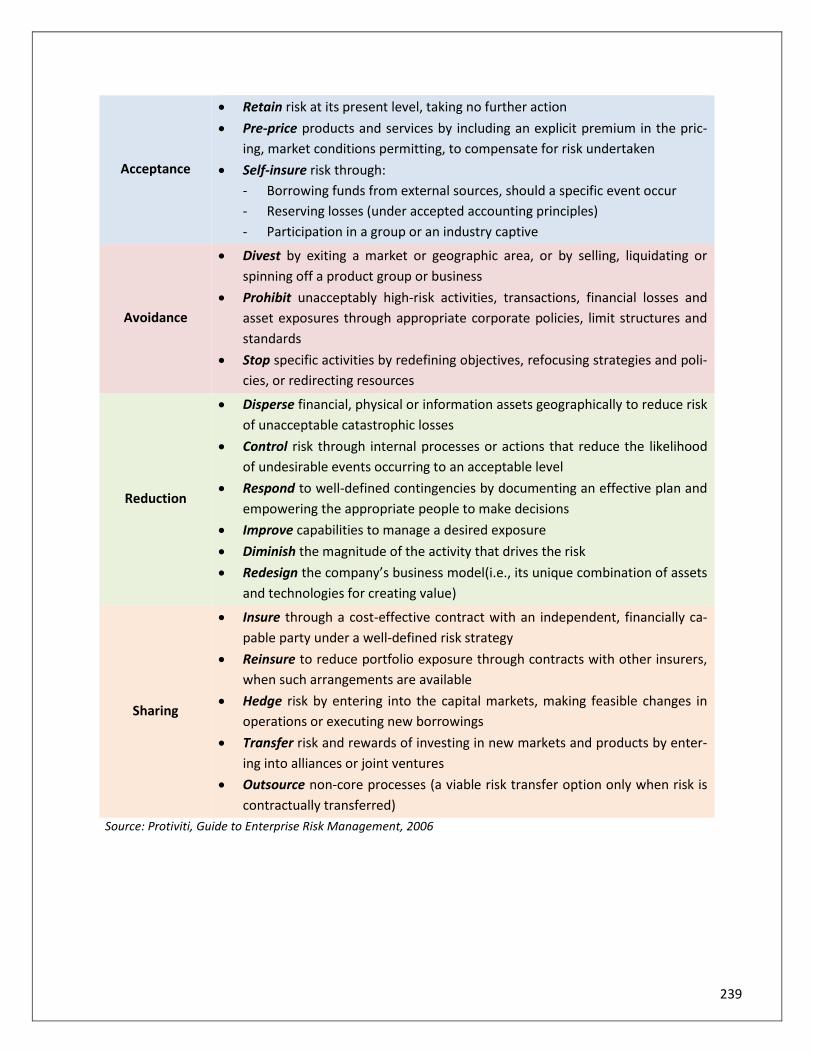
239
Acceptance
• Retain risk at its present level, taking no further action
• Pre-price products and services by including an explicit premium in the pric-
ing, market conditions permitting, to compensate for risk undertaken
• Self-insure risk through:
- Borrowing funds from external sources, should a specific event occur
- Reserving losses (under accepted accounting principles)
- Participation in a group or an industry captive
Avoidance
• Divest by exiting a market or geographic area, or by selling, liquidating or
spinning off a product group or business
• Prohibit unacceptably high-risk activities, transactions, financial losses and
asset exposures through appropriate corporate policies, limit structures and
standards
• Stop specific activities by redefining objectives, refocusing strategies and poli-
cies, or redirecting resources
Reduction
• Disperse financial, physical or information assets geographically to reduce risk
of unacceptable catastrophic losses
• Control risk through internal processes or actions that reduce the likelihood
of undesirable events occurring to an acceptable level
• Respond to well-defined contingencies by documenting an effective plan and
empowering the appropriate people to make decisions
• Improve capabilities to manage a desired exposure
• Diminish the magnitude of the activity that drives the risk
• Redesign the company’s business model(i.e., its unique combination of assets
and technologies for creating value)
Sharing
• Insure through a cost-effective contract with an independent, financially ca-
pable party under a well-defined risk strategy
• Reinsure to reduce portfolio exposure through contracts with other insurers,
when such arrangements are available
• Hedge risk by entering into the capital markets, making feasible changes in
operations or executing new borrowings
• Transfer risk and rewards of investing in new markets and products by enter-
ing into alliances or joint ventures
• Outsource non-core processes (a viable risk transfer option only when risk is
contractually transferred)
Source: Protiviti, Guide to Enterprise Risk Management, 2006

240
Protiviti suggests management to consider the following examples of factors when evaluating alternative risk
responses:
• Management’s objectives and strategies. Risk responses must be aligned with the specific business
objectives and strategies they support.
• Risk and reward trade-offs. These trade-offs should always be considered with any choice with re-
spect to managing risk.
• Risk management capabilities. Risk responses are only as effective as the organization’s capabilities
to manage them. If the capabilities to manage are not in place, management needs to build them on
a timely basis for execution within management’s plan. For example, an event, such as an increase
in the cost of raw material, can occur over the short term, affecting the organization immediately.
Although the organization may have little ability to address the exposure over the short-term, it can
realistically expect to manage the effects over the long-term. Any mismatch between the duration
of exposure and the length of time that management needs to execute a risk response presents a
potential risk to the organization. Therefore, these mismatches should be taken into account.
• Residual risk. It is rare that risk responses eliminate risk as there will always be some residual risk in
any risk response. In general, any mismatch between the coverage provided by the risk response
and the exposure itself will create new or continued risk. COSO recognizes this concern by suggest-
ing that the extent of this risk should be evaluated.
Other Considerations
Application and Implementation of Enterprise Risk Management
ERM is not a “one-size-fits-all” solution. Therefore, it needs to be tailored to the unique circumstances of the
organizations. Thus, organizations should apply the following list of factors to consider their unique circum-
stances when deciding the nature of the ERM solution:
• Regulation: Regulation requirements by industry and countries
• Industry Sector: Different rules, strategies, and priorities
• Location: Geographic and national differences having impact on compliance and control systems
• Size: Affecting levels of sophistication and formality of control systems
• Organization Structure: Collaboration between business units, shared service centers, and outsourc-
ing
• Ownership: The level of accountability, degree of owner intervention, and impact of change in own-
ership
• Management and Control Techniques: The type of technique used affecting activities
• Information Technology: Levels of system maturity
• Skills of People: Guiding the effectiveness of activities
These drivers shape how the ERM framework is applied.

241
According to COSO, implementation of ERM requires that management take the following steps:
1. Identify and understand the organization’s priority risks, to provide a context.
2. Use the COSO framework to define the current state of the organization’s risk management capabili-
ties.
3. Use the COSO framework to define the desired future state of the organization’s risk management
capabilities.
4. Analyze and articulate the size of the gap between steps 2 and 3, and the nature of the improve-
ments needed to close the gap, which is a function of:
• The organization’s existing capabilities and experience, and
• Management’s desire to improve and outperform
5. Based on the analysis in step 4, develop a business case for addressing the gap to provide the eco-
nomic justification for the overall effort to implement the ERM infrastructure improvements.
6. Organize a plan that advances the desired ERM infrastructure capabilities and addresses change is-
sues associated with executing the plan.
7. Provide the oversight and facilitation necessary to ensure effective integration and coordination of
the overall effort.
Creating a dynamic risk management is as much an art as it is a science. Management may also consider the fol-
lowing principles that govern the art of risk management:
• Risk management is more than a policy or process; it is a culture.
• Risk management is in alignment with company’s overall strategy and integrated into all of the
company’s routine management processes.
• Vision, mission, goals, and business objectives have been shared with everyone involved in the pro-
cess.
• Management understands the uncertainties inherent in its strategies for achieving business objec-
tives and performance goals.
• The complexity of metrics or mathematical models for estimating risks is balanced with the compa-
ny’s business model, availability of data, level of experience, and mandatory legal requirements.
• Primary sources of risk have been identified and classified.
• The risk outcomes and their likelihood or probability of occurring have been properly estimated.
• Risk responses and the related control activities and information and communication processes are
operating effectively.
• Effective processes are in place to continuously identify risk, measure its impact, and evaluate risk
management capabilities.

242
Relevance to Sarbanes-Oxley Compliance
Although the Sarbanes-Oxley Act (SOX) of 2002 does not require companies to adopt ERM, implementation of
ERM facilitates compliance with applicable SOX requirements. For example, it assists certifying officers with the
discharge of their Section 302 quarterly certification and Section 404 annual assessment responsibilities. Moreo-
ver, since both the SEC and PCAOB promoted a risk-based approach to evaluating internal control over financial
reporting in accordance with Section 404, ERM can provide benefits from a SOX compliance perspective. Specifi-
cally, ERM enables companies to maintain their disclosure process through a process-based chain of accounta-
bility involving unit managers and process owners in communicating issues requiring action and possible disclo-
sure. ERM also provides executives and directors with more confidence that internal control structure is sustain-
able. ERM focuses on business risk and internal controls with an objective to preserve and create enterprise val-
ue. The emphasis is on strategy. Thus, a company not only supports SOX compliance but also brings to light new
risks as they emerge by managing risks strategically across the enterprise.
Limitations
While ERM management provides important benefits, limitations do exist. Limitations result from:
• The realities that human judgment in decision making can be faulty.
• Decisions on responding to risk and establishing controls need to consider the relative costs and bene-
fits.
• Breakdowns can occur because of human failures such as simple errors or mistakes, controls can be cir-
cumvented by collusion of two or more people.
• Management has the ability to override enterprise risk management decisions.
These limitations preclude a board and management from having absolute assurance as to achievement of the
organization’s objectives.
The Three Lines of Defense Model
Clear responsibilities must be defined so that each group of risk and control professionals understands the
boundaries of their responsibilities and how their positions fit into the company’s overall risk and control struc-
ture. Although risk management frameworks can effectively identify the types of risks that modern businesses
must control, these frameworks are largely silent about how specific duties should be assigned and coordinated
within the company.
The Three Lines of Defense model addresses how specific duties related to risk management and control could
be assigned and communicated within an organization, regardless of its size or complexity. CFOs should have a
good understanding of the key differences in roles and responsibilities and how they should be optimally as-
signed to ensure the ongoing success of risk management initiatives. Even in companies where a formal risk
management framework does not exist, the Three Lines of Defense model can enhance clarity regarding risks
and controls and help improve the effectiveness of risk management systems.

243
In the Three Lines of Defense model, management control is the first line of defense in risk management, the
various risk control and compliance oversight functions established by management are the second line of de-
fense, and independent assurance is the third. Governing bodies and senior management are considered among
the three “lines”. However, risk management cannot be completed without first considering the vital roles of
both the governing bodies and senior management, as they are the primary stakeholders served by the “lines”.
They are also the parties best positioned to help ensure that the Three Lines of Defense model is reflected in the
organization’s risk management and control processes. Each of these three “lines” play a distinct role within the
organization’s wider governance framework as demonstrated below:
Exhibit 11-7
The Three Lines of Defense Model in Effective Risk Management and Control
Source: IIA, The Three Lines of Defense Model Adapted from ECIIA/FERMA Guidance on the 8th EU Company Law Directive, article
41
To have an effective Three Lines of Defense model, a company needs to implement a framework consisting of
the following key elements:
• A sound risk culture that promotes sound risk-taking and ensures that emerging risks and excessive risk-
taking activities are assessed.
• A clear definition and communication of risk appetite by the board or executive management.
• Adequate resources are allocated to risk management activities.
• Risk management should be embedded in the operational, day-to-day business decisions.
• A standardized enterprise-wide risk assessment process is in place.
• A robust governance risk and compliance system to support risk identification, assessment, issue track-
ing, monitoring, assurance and reporting.
Governing Body/Board/Audit Committee
Senior Management
1st Line of Defense: Own and Manage
- Management Controls
- Internal Control Measures
2nd Line of Defense: Monitor
- Financial Control
- Security
- Risk Managment
- Quality
- Inspecation
-Compliance
3rd Line of Defense: Provide Independent Assurance
Internal Audit
External A
ud
it
Regu
lator

244
• Responsibility for coordinating and reporting all risk, control and assurance activities assigned to one
person or function.
The First Line of Defense
The business and process owners (operational management) serve as the first line of defense because controls
are designed into systems and processes under their guidance. Thus, as the first line of defense, operational
managers own and manage risks. They are also responsible for implementing corrective actions to address pro-
cess and control deficiencies.
The Second Line of Defense
The second line of defense consists of risk, control, and compliance oversight functions responsible for ensuring
that first line processes and controls exist and are operating effectively. The specific functions vary by organiza-
tion and industry, but typical functions in this second line of defense include:
1. A risk management function (and/or committee) that facilitates and monitors the implementation of ef-
fective risk management practices by operational management.
2. A compliance function to monitor various specific risks such as noncompliance with applicable laws and
regulations.
Although each second line function has some degree of independence from activities constituting the first line of
defense, they are by nature, still management functions. For example, second line functions may directly devel-
op, implement, and/or modify internal control and risk processes of the organization. The responsibilities of in-
dividuals within the second line of defense vary widely, but typically include:
• Identifying known and emerging issues
• Providing risk management framework
• Supporting management policies
• Alerting operational management to emerging issues
• Defining activities to monitor
• Providing guidance related to risk management and control processes
The Third Line of Defense
As the third line of defense, the internal audit provides independent assurance to senior management and the
board over both the first and second lines’ efforts consistent with the expectations of the board of directors and
senior management. To protect its objectivity and organizational independence, the third line of defense is usu-
ally not permitted to perform management functions. Thus, the third line is an assurance, and not a manage-
ment function, that has a primary reporting line to the board. According to the Institute of Internal Auditors
(IIA), the scope of this assurance, which is reported to senior management and to the governing body, usually
covers:

245
1. A broad range of objectives, including the efficiency and effectiveness of operations; safeguarding of as-
sets; reliability and integrity of reporting processes; and compliance with laws, regulations, policies, pro-
cedures, and contracts.
2. All elements of the risk management and internal control framework, which includes: internal control
environment; all elements of an organization’s risk management framework (e.g., risk identification, risk
assessment, and response); information and communication; and monitoring.
3. The overall entity, divisions, subsidiaries, operating units, and functions including business processes,
such as sales, production, marketing, safety, customer functions, and operations as well as supporting
functions (e.g., revenue and expenditure accounting, human resources, purchasing, payroll, budgeting,
infrastructure and asset management, inventory, and information technology).
The IIA identifies examples of core internal audit roles including:
• Giving assurance on the risk assessment processes
• Giving assurance that risks are correctly evaluated
• Evaluating the risk management processes
• Evaluating the reporting of key risks
• Reviewing the management of key risks
• Facilitating the identification and evaluating of risks
• Coaching management in responding to risks
The IIA also indicates that internal audit should NOT undertake the following role:
• Setting the risk appetite
• Authorizing and dictating the implementation of risk management processes
• Assuming the role of management in providing assurance on risks and risk management performance
• Making decisions on risk responses
• Implementing risk responses on management’s behalf
• Accepting accountability for risk management
An example is shown below to demonstrate how the three lines of defense activities are performed.
Risk Contributing Factors
Lines of Defense
Owner Activity
Significant or
material weak-
nesses resulting
from inade-
quate internal
• Inadequate management
process and support for
evaluation of internal
controls
• Lack of effective docu-
1 CFO
• Developing and operating
internal controls
• Control self-assessment
• Quarterly disclosure meet-
ing

246
financial con-
trols
mentation and tracking
process for SOX 404
compliance including sys-
tems
• Enterprise-level controls
do not provide sufficient
focus or support to ena-
ble consistent and accu-
rate tax accounting and
disclosure
2 Group Internal
Controls
• Supporting development of
internal control framework
and processes
• Maintaining process and
control documentation
• Ongoing monitoring of pro-
cesses
3 Internal Audit Quarterly spot testing controls
Source: EY, Maximizing value from your lines of defense, 2013
Other Considerations
Functions within each of the lines of defense vary from company to company and some functions may be split
across lines. For example, some parts of a compliance function may be involved in designing controls for the first
line of defense, while other parts are monitoring controls as the second line of defense; this is often seen in the
financial services sector. As long as accountabilities are mapped for individual risks, this creates clarity for the
role, regardless of the function. Although risk management usually is strongest when there are three separate
lines of defense, there are exceptions in small organizations where certain lines of defense may be combined.
For example, when internal audit is requested to establish the organization’s risk management, internal audit
should communicate clearly to the governing body and senior management the impact of the combination.
Appendix F discusses recommended practices with examples of leveraging COSO across the Three Line of De-
fense model.
Fraud Risk Assessment
It is important to understand the difference between enterprise-wide risk assessments and fraud risk assess-
ment. Both approaches contain similarities; however, the objectives, outcomes, and benefits to an organization
differ.
Enterprise-wide Risk Assessment Fraud Risk Assessment
Focus on assessing, managing, and
monitoring risks related to the
achievement of an organization’s
objectives.
Focus on identifying and address-
ing an organization’s vulnerabili-
ties to internal and external fraud.
A fraud risk assessment is a critical component of an organization’s larger ERM program because it:

247
• Serves as a tool that assists management and internal auditors in systematically identifying where and
how fraud may occur and who may be in a position to commit fraud;
• Reviews potential exposures which represents an essential step in alleviating the board’s and senior
management’s concerns about fraud risks and their ability to meet organizational goals, and
• Concentrates on fraud schemes and scenarios to determine the presence of internal controls and
whether or not the controls can be circumvented.
The Managing the Business Risk of Fraud: A Practical Guide sponsored by IIA, American Institute of Certified
Public Accountants (AICPA), and Association of Certified Fraud Examiners (ACFE), provides leading practices for
developing a fraud risk management program. The guide defines five principles for effective fraud risk man-
agement:
Principle 1. As part of an organization’s governance structure, a fraud risk management program should be in
place, including a written policy or policies to convey the expectations of senior management regarding manag-
ing fraud risk.
Principle 2. Fraud risk exposure should be assessed periodically by the organization to identify specific schemes
and events that the organization needs to mitigate.
Principle 3. Prevention techniques to avoid potential fraud risk events should be established, where feasible, to
mitigate possible impacts on the organization.
Principle 4. Detection techniques should be established to uncover fraud events when preventive measures fail,
or unmitigated risks are realized.
Principle 5. A reporting process should be in place to solicit input on fraud, and a coordinated approach to inves-
tigation and corrective action should be used to help ensure potential fraud is addressed appropriately and in a
timely manner.
248
Chapter 11 Review Questions
1. Which of the following components drives transparency about risk management and enables monitoring of
performance?
A. Risk reporting
B. Event identification
C. Objective setting
D. Control activities
2. A major change in customer wants can result in a rapid erosion of market share. Management chooses NOT
to assume such risk. Which of the following actions reflects such a choice?
A. Reducing production variability by diversifying, integrating, and applying new technology
B. Outsourcing non-core processes to contractually transfer the risk
C. Repricing products by including an explicit premium in the pricing to compensate for the risk
D. Exiting the market area by selling, liquidating, or spinning off the product group
3. According to the Three Lines of Defense model, which of the following positions usually acts as the first line
of defense in assessing financial risk?
A. Chief Executive Audit
B. Chief Operating Officer
C. Chief Information Security Officer
D. Chief Finance Officer

249
Chapter 12: Derivative Instruments and
Hedge Accounting
Learning Objectives:
After completing this section, you will be able to:
• Recognize the risks associated with derivatives
• Identify the accounting requirements for different derivatives
The Role of the CFO
Uncertainty about the future fair value of assets and liabilities or about future cash flows exposes companies to
risk. CFOs usually manage such risk through the use of derivatives. Hedge accounting is a useful financial report-
ing accommodation for companies that experience financial statement volatility today as a result of using deriv-
atives. The consequence of not applying hedge accounting properly can be significant, resulting in financial re-
statements. However, when applied appropriately, hedge accounting can result in a better alignment of a com-
pany’s financial reporting and economic realities.
ASC 815, the most complex guidance ever published by the FASB, governs the accounting for derivatives and
certain non-derivative instruments used as hedges. It requires all derivatives to be recorded on the balance
sheet at fair value and establishes special (or hedge) accounting for three different types of hedges: fair value
hedges; cash flow hedges; and, hedges of net investments in foreign operations. Though the accounting treat-
ment and criteria for each of the three types of hedges is unique, ASC 815 has proven to be a challenging stand-
ard to understand and apply for many companies, despite the relative simplicity of its fundamental corner-
stones.
This chapter is intended to serve as an effective quick reference tool, to assist CFOs in accounting for derivatives
in accordance with ASC 815. It addresses the basic accounting rules related to derivative financial instruments
(derivatives) and outlines the principles of hedge accounting.
250
Derivatives and Hedge
The Characteristics of Derivative Instruments
In the regular course of a business environment, companies are exposed to market risks. These risks give rise to
income volatility. Companies often take some action to hedge against such exposures by using derivative finan-
cial instruments. A primary purpose of using derivative financial instruments is to hedge (avoid) risk, such as risk
of changes in market price of interest rates, currency exchange rates, and fluctuations in commodity prices. De-
rivatives are contracts that may hedge the company from adverse movement in the underlying base. The lower
initial investment makes a derivative an inexpensive method to reduce risk, and derivatives can also be used to
speculate.
According to ASC 815-20, Derivatives and Hedging, a derivative is a financial instrument or other contract that has all three of the following characteristics:
1. The contract has one or more underlyings, and it has one or more notional amounts or payment provisions,
or both;
• An underlying may be a specified interest rate, equity price, commodity price, foreign exchange
rate, index of prices or rates, or other variable.
• An underlying may be a price or rate of an asset or liability but it is not the actual asset of liability it-
self. A notional amount is a number of currency units, shares, bushels, pounds, or other units speci-
fied. The notional amount is the quantity that determines the size of the change caused by the
movement of the underlying.
• Settlement of a derivative is based on the interaction of the notional amount and the underlying.
They determine the amount of the settlement, or in some cases, whether a settlement will actually
occur.
2. The contract requires either no initial net investment or an immaterial net investment. That is, the parties
do not have to invest in or own the notional amount at the inception of the contract
3. It requires or permits net settlement, meaning there is a payment between the parties.
Derivatives are not without their own risks. If used for speculation (incurring risk), they can be extremely risky. If
leveraged, minor adverse price or interest rate changes can result in huge gains or losses. The leverage can sig-
nificantly multiply returns or losses.
Other risks besides leverage exist, such as:
• Credit risk: The risk of accounting loss from a financial instrument because of the possibility that a
loss may occur from the failure of another party to perform according to the terms of a contract.
• Market risk: The risk that arises from the possibility that future changes in market prices may make
a financial instrument less valuable or more onerous.

251
• Operational (business) risk: The risk of internal operational errors (such as failure to accurately re-
flect counterparty obligations) or poor internal controls.
• Legal risk: A judge may rule the contract illegal or invalid.
• Valuation risk: The risk that an unrealized profit or loss from a transaction is misstated.
• Liquidity risk: Inability to sell a financial instrument quickly because of an illiquid market.
• Correlation risk: Risk that the value of a hedge (e.g., in derivatives, conventional securities) will not
react in the same manner as the item being hedged.
• Systemic risk: A problem with a particular instrument that may disrupt the entire market.
• Settlement risk: Risk of not receiving timely payment on a contract.
Derivatives can either be on the balance sheet or off the balance sheet (recorded as a commitment). They in-
clude:
• Options
• Forward contracts
• Futures
• Option contracts
• Fixed-rate loan commitments
• Interest rate caps and floors
• Interest rate collars
• Forward interest rate agreements
• Swaps
• Instruments with similar characteristics
A call option is the right to buy a common share at a set price for a specified time period. If the underlying
share has a lower market value, the call option is less, not more, valuable. The lower the exercise price, the
more valuable the call option. The exercise price is the price at which the call holder has the right to purchase
the underlying share. Details are discussed further in Chapter 13 - Types of Investments.
A put option allows the purchaser to benefit from a decrease in the price of the underlying. The gain is the ex-
cess of the exercise price over the market price. The purchaser pays a premium for the opportunity to benefit
from the depreciation in the underlying.
A forward contract is an executory contract in which the parties involved agree to the terms of a purchase and a
sale of a stated amount of a commodity, foreign currency, or financial instrument, but delivery or settlement is
at a stated future date. Accordingly, a forward contract involves a commitment today to purchase a product on
a specific future date, at a price that is determined today.
Futures contracts are usually standardized and exchange-traded. They are therefore less risky than forward con-
tracts. Furthermore, unlike forward contracts, futures contracts rarely result in actual delivery. The parties cus-
tomarily make a net settlement in cash on the expiration date. Details are discussed further in Chapter 13 -

252
Types of Investments. An interest-rate swap is an exchange of one party’s interest payments based on a fixed
rate for another party’s interest payments based on a variable (floating) rate. The risks inherent in an interest
rate swap include both credit risk and market risk. Market risk includes the risk that changes in interest rates
will make the swap agreement less valuable or more onerous.
Concepts of Hedge Accounting
Uncertainty about the future fair value of assets and liabilities or about future cash flows exposes companies to
risk. One way to manage the risk associated with fair value and cash flow fluctuations is through the use of de-
rivatives or hedging. Hedging is defined as:
“A defensive strategy designed to protect an entity against the risk of adverse price or interest-rate
movements on certain of its assets, liabilities, or anticipated transactions. A hedge is used to avoid or re-
duce risks by creating a relationship by which losses on certain positions are expected to be counterbal-
anced in whole or in part by gains on separate positions in another market.”
Hedging involves using derivatives or other instruments to reduce risk by offsetting any future changes in the
value of an asset or liability that could happen. Hedge accounting is a tool of accounting where entries for the
ownership of a security and the opposing hedge are matched and treated as one. Hedge accounting attempts to
reduce the volatility created by the repeated adjustment of a financial instrument's value, known as marking to
market. This reduced volatility combines the instrument and the hedge as one entry, which offsets the opposing
movements. For example, when accounting for complex financial instruments, such as derivatives, the value is
adjusted by marking to market; this creates large swings in the profit and loss account. Hedge accounting treats
the reciprocal hedge and the derivative as one entry so that the large swings balance out. Hedge accounting rep-
resents a number of provisions within ASC 815 that allow companies to match the changes in fair value of their
hedge contracts to the changes in fair value of the item being hedged.
Hedge accounting rules enable companies to either:
1. Defer the income/loss impact of a hedge contract to a future period, or
2. Bring forward the income/loss impact of a hedged item to an earlier period.
For instance, if you enter a forward contract to hedge a debtor that will arise in six months’ time, you can defer
the P&L impact of that hedge contract with a hedge reserve in equity until the debtor is recognized in the gen-
eral ledger. Hedge accounting will only be permitted in the accounts if each hedge contract is documented as
follows:
• Risk management objective
• Risk management strategy
• Type of hedge relationship
• Nature of hedged item
• Nature of hedging instrument
• How effectiveness will be assessed
253
Principles of Hedge Accounting
Hedge Criteria
To qualify for hedge accounting, the hedging relationship at inception of the hedge, and on an ongoing basis,
should be expected to be highly effective in achieving either of the following:
1. Offsetting changes in fair value attributable to the hedged risk during the period that the hedge is desig-
nated (if a fair value hedge), or
2. Offsetting cash flows attributable to the hedged risk during the term of the hedge (if a cash flow hedge).
The hedging instrument (such as an at-the-money option contract) provides only a one-sided offset of the
hedged risk if either of the following conditions is met:
1. The increases (or decreases) in the fair value of the hedging instrument are expected to be highly effec-
tive in offsetting the decreases (or increases) in the fair value of the hedged item (if a fair value hedge),
or
2. The cash inflows (outflows) from the hedging instrument are expected to be highly effective in offsetting
the corresponding change in the cash outflows or inflows of the hedged transaction (if a cash flow
hedge).
In order to receive the benefit of hedge accounting, there must be a highly effective relationship between the
item to be hedged and the hedging instrument. This effective relationship must exist both at the initiation of the
hedge, and throughout the life of the hedge. In a fair value hedge, any changes in the fair value of the derivative
must be ‘highly effective’ in offsetting changes in the value of the hedged item. Similarly, a cash flow hedge
shows a highly effective relationship. The relationship must be evaluated quarterly and whenever financial
statements for the company are issued.
The company must indicate how hedge effectiveness is defined and measured, and then stay within the criteria.
It must also be able to measure the ineffective part of the hedge. Statistical methods, including regression analy-
sis, are a means of assessing initial and ongoing effectiveness. For a hedging relationship to qualify as “highly
effective,” the change in fair value or cash flows of the hedge must fall between 80% and 125% of the opposite
change in fair value or cash flows of the exposure that is hedged.
If a transaction no longer meets the “highly effective” test, hedge accounting is to be terminated.
Three types of qualified hedges are fair value hedges, cash flow hedges, and foreign currency hedges. In each of
these three hedges, a hedge effectiveness test must be met in order to qualify for hedge accounting. Details
about qualified hedges are discussed in the following sections;
254
Types of Hedges
Fair Value Hedges
A fair-value hedge attempts to reduce the exposure to changes in the fair value of a recognized asset or liability
caused by outside risks, or of an unrecognized firm commitment. Such a hedge will help minimize the risk asso-
ciated with fixed cash flows. Whether or not a company is locked into a fixed price, cost, rate, or index (absent
the hedge), distinguishes a fair value hedge from a cash flow hedge. This distinction between fair value hedges
vs. cash flow hedge is important because the accounting for each type of hedge is different.
Some common examples of fair value hedges could be using futures contracts to hedge a firm commitment to
buy or sell inventory, using interest rate swaps to convert from variable to fixed rate, or using future contracts to
hedge the fair value of inventory.
For example, assume that a refinery is concerned that crude prices may fall while it is committed under a pur-
chase contract to buy barrels of crude oil in the future at a fixed price. To reduce their risk, the company could
sell a crude oil futures contract. If oil prices decrease, the company will pay an above market price under its pur-
chase contract. However, the company would realize a gain in the value of its futures contract, effectively
providing the refinery with an amount equal to the difference of the lower price. If crude prices rise, any loss on
the futures contract will result in the refinery paying an effective cost over and above the fixed purchase con-
tract price. The overall risk has been reduced for the refinery.
If a hedge qualifies as reducing the risk of changes in value of an on-balance sheet asset or liability or an unrec-
ognized firm commitment, both the hedge and the underlying risk exposure are marked to market through the
income statement. In the case of a qualifying hedge, the gain or loss on the hedging derivative instrument will
offset the impact of the valuation of the exposure that is being hedged. For a nonqualifying hedge, any “break-
age” between the valuation of the hedge and the underlying risk exposure will flow through earnings.
Gains and losses on a qualifying fair value hedge should be accounted for as follows:
1. The gain or loss on the hedging instrument is currently recognized in earnings.
2. The gain or loss (that is, the change in fair value) on the hedged item attributable to the hedged risk
should adjust the carrying amount of the hedged item and be currently recognized in earnings.
In a perfectly effective hedge, gains and losses arising from changes in fair value of a derivative are offset by
losses or gains on the hedged item attributable to the risk being hedged. With an ineffective hedge, earnings of
the period of change are affected only by the net gain or loss attributable to the ineffective portion of the
hedge.
The following example illustrates the ASC 815 accounting for interest rate swaps used to hedge the fair value of
fixed-rate debt.

255
Example 12-1
On June 1, 20X7, ABC Corporation enters into an agreement with its bank to borrow $10 million over 3 years at a
fixed interest rate of 7%, with no prepayment permitted. ABC wishes to convert this debt to a floating rate so as
to not run the risk of paying an above-market interest rate, if the general level of the interest rate declines.
An interest rate swap is structured that will require ABC's counterparty to pay it a fixed rate of interest (assumed
to be 7%) equal to what ABC owes its bank. In return, ABC will pay its counterparty a floating market rate of in-
terest based on a six-month LIBOR. This effectively converts ABC's fixed-rate debt to floating-rate debt. The expi-
ration of the swap matches the maturity of the borrowing, and the periodic payments under the swap are made
with the same frequency as payments required under the borrowing agreement.
The changes in fair value of the fixed-rate debt and the interest rate swap are assumed to move in equal and
opposite directions. When interest rates rise, the fair value of the fixed-rate debt increases (ABC is receiving
cheaper funding than the market level of interest rates) while the fair value of the interest rate swap decreases
(ABC is paying a market interest rate—LIBOR—that is higher than when the swap was originally contracted).
The following value of the swap and the debt is assumed:
Value of Swap
Value of Debt
June 30, 20X7 +$200,000 $10,200,000 December 31, 20X7 -$100,000 $9,900,000
The calculation of the periodic six-month settlements on the interest rate swap, assuming LIBOR rates are in effect as indicated, is:
Date Pay Six- Month LIBOR
Receive Fixed Rate
Notional Amount
Net Set-tlement
June 20X7 6% 7% $10 million $ 50,000 July 20X7—December 20X7 7¼% 7% $10 million $ (12,500)
Accounting Entries
June 30, 20X7:
Dr. Interest expense $350,000 Cr. Accrued interest payable $350,000 To accrue six months contractual interest due on outstanding debt. Dr. Funds borrowed $200,000 Cr. Gain on valuation of debt $200,000 To record gain in the value of fixed-rate debt in a rising interest rate environment. Dr. Loss on swap hedge $200,000 Cr. Swap hedge (balance sheet liability) $200,000 To record loss in value of the qualifying swap hedge contract that is marked to market. Dr. Cash $50,000

256
Cr. Interest expense $50,000 To record six-month settlement of the swap as a reduction of interest expense.
December 31, 20X7:
Dr. Interest expense $350,000 Cr. Accrued interest payable $350,000 To record contractual interest due. Dr. Loss on valuation of debt $300,000 Cr. Funds borrowed $300,000 To record the cumulative loss in the value of the fixed-rate debt in a falling interest rate environment. Dr. Swap hedge (balance sheet asset) $300,000 Cr. Gain on swap hedge $300,000 To record gain in value of swap hedge contract that is marked to market. December 31, 20X7: Dr. Interest expense $12,500 Cr. Cash $12,500 To record cash payment on semi-annual settlement of the swap as an adjustment to (i.e. increase in) interest expense.
Cash Flow Hedges
Companies are often interested in protecting (hedging) the value of future cash flows that they will either re-
ceive or pay. The nature of cash flows that require protection is one where there is variability/uncertainty of
what those future flows will be. In some instances, transactions that are hedged relate to contractual future
cash flows, whereas in other instances they may relate to forecasted transactions. A cash flow hedge is a hedge
of an exposure to variability in the cash flows of a recognized asset or liability or a forecasted transaction. Fore-
casted transactions are eligible for cash flow hedge accounting, while firm commitments are generally only eligi-
ble for fair value hedge accounting.
The accounting treatment of gains and losses arising from changes in fair value of a derivative designated as a
cash flow hedge varies for the effective and ineffective portions:
• The effective portion is initially reported as other comprehensive income. It is reclassified into earnings
when the forecasted transaction affects earnings.
• The ineffective portion of the hedge is recognized in current earnings.
The changes accumulated in other comprehensive income are reclassified to earnings in the period(s) the
hedged transaction affected earnings. For example, accumulated amounts related to a forecasted purchase of
equipment are reclassified as the equipment is depreciated.
Examples of transactions that may be eligible for cash flow hedge treatment include:
• A hedge of future cash interest outflows associated with floating rate debt.
• A hedge of a forecasted future purchase of a commodity to protect against rising prices.
• A hedge to protect against rising rates for prime-based mortgages.

257
• A hedge to lock in the future cost of borrowing for the company.
• A hedge to anticipate future re-pricings of certificates of deposit.
Example 12-2
XYZ Corporation has issued $100 million of six-month fixed-interest-rate commercial paper that is rolled over at
each expiration date. Rising interest rates will increase its cost of funds when the commercial paper comes up
for repricing and this is an exposure XYZ wishes to minimize.
Because XYZ is attempting to take action to protect its future cash interest outflows, in this example there is a
cash flow hedge. To hedge its interest rate risk, XYZ sells 100 Treasury Bill futures contracts (sold in contract
units of $1 million). Management has determined that this strategy meets the hedge effectiveness test, and
thereby qualifies for hedge accounting treatment under ASC-815.
The following changes in interest rates and their impact on future cash flows are assumed:
• Six-month commercial paper is issued January 1, 20X7 at 6% interest, due June 30.
• At June 30, 20X7, interest rates increase to 6.5%, resulting in an additional cost of funds of. 5% or
$250,000 for the second half of the year.
• The future contract is terminated at June 30 and has a gain of $240,000.
For simplicity purposes, this example does not deal with any initial or variation margin that would be required
on the futures contract.
The following financial accounting entries reflect this transaction:
January 1, 20X7
Dr. Cash $100,000,000 Cr. Commercial paper outstanding $100,000,000 To record issuance of commercial paper.
June 30, 20X7
Dr. Interest expense $3,000,000 Cr. Accrued interest payable $3,000,000 To record contractual interest due for six months. Dr. Cash $240,000 Cr. Other comprehensive income $240,000 To record gain on the settlement of the futures contract. The entire futures contract is assumed to be an effective hedge.
July 31, 20X7
Dr. Interest expense $541,667 Cr. Accrued interest payable $541,667 To record one month of interest after the rollover of the commercial paper to 6.5%. Dr. Other comprehensive income $40,000 Cr. Interest income $40,000 To reclassify one month of hedge gain as a reduction of interest expense on the rolled over commercial paper debt.

258
The result of the cash flow hedge is that interest expense beginning at the rollover date of the commercial paper
has been reduced from what it otherwise would have been if the hedge had not been put in place. In the exam-
ple, the effective interest rate after the rollover comes to 6.02% (6.5% - .48% hedge gain).
Foreign Currency Hedges
If the hedged item is denominated in a foreign currency, an entity may designate any of the following types of
hedges of foreign currency exposure:
1. A fair value hedge of an unrecognized firm commitment or a recognized asset or liability (including an
available-for-sale security)
2. A cash flow hedge of any of the following:
• A forecasted transaction
• An unrecognized firm commitment
• The forecasted functional-currency-equivalent cash flows associated with a recognized asset or lia-
bility
• A forecasted intra-entity transaction
3. A hedge of a net investment in a foreign operation
Gains and losses arising from changes in fair value of a derivative classified as either a fair value or a foreign cur-
rency fair value hedge are included in the determination of earnings in the period in which the change in fair
value occurs. They are offset by losses or gains on the hedged item attributable to the risk being hedged. Thus,
earnings of the period of change are affected only by the net gain or loss attributable to the ineffective portion
of the hedge.
The hedge of the foreign currency exposure of a forecasted transaction is designated as a cash flow hedge. The
effective portion of gains and losses associated with changes in fair value of a derivative instrument designated
and qualifying as a cash flow hedging instrument is reported as a component of other comprehensive income.
Appendix G presents an example of financial statement disclosures related to derivative financial Instruments
and hedging activities from General Electric’s 2015 Annual Report.

259
Chapter 12 Review Questions
1. When is a call option on a common share more valuable?
A. When there is a lower market value of the underlying share
B. When there is a lower exercise price on the option
C. When there is a lower time to maturity on the option
D. When there is a lower variability of market price on the underlying share
2. Herbert Corporation was a party to the following transactions during November and December 20X7. Which
of these transactions most likely resulted in an investment in a derivative subject to the accounting pre-
scribed by ASC 815-20, Derivatives and Hedging?
A. Purchased 1,000 shares of common stock of a public corporation based on the assumption that the
stock would increase in value.
B. Purchased a term life insurance policy on the company's chief executive officer to protect the company
from the effects of an untimely demise of this officer.
C. Agreed to cosign the note of its 100%-owned subsidiary to protect the lender from the possibility that
the subsidiary might default on the loan.
D. Based on its forecasted need to purchase 300,000 bushels of wheat in 3 months, entered into a 3-month
forward contract to purchase 300,000 bushels of wheat to protect itself from changes in wheat prices
during the period

260
Chapter 13: Corporate Investments
Learning Objectives:
After completing this section, you will be able to:
• Recognize different types of investments
• Identify the types of risks reported by Beta in its use in designing a portfolio
• Apply the Capital Asset Pricing Model (CAPM) to calculate portfolio return and portfolio risk
The Role of the CFO
The outcome of any financial or investment decision is not known with certainty. In fact, the decisions of the
CFO are never made under conditions of certainty. Each decision presents certain risks and return characteris-
tics. Hence, all major decisions must be viewed in terms of expected return, expected risk, and their combined
impact on the market value of your company. Also, an understanding of the trade-off between the return you
are expecting from the decision, and the degree of risk you must assume to earn it, is perhaps the most im-
portant key to successful financial and investment decisions.
CFOs will need, more than ever, to ensure appropriate policies in relation to corporate investment and share-
holder return. Risk and return are two major factors CFOs should consider in making financial and investment
decisions. In other words, a risk-return analysis is required to achieve a proper mix of securities in the portfolio.
CFOs must compare the expected risks and returns of each investment. Always remember that the higher the
return, the higher the risk. Beta can help CFOs estimate the expected return and risk of a security. In addition,
the types of financial assets to invest in must be known, along with their respective advantages and disad-
vantages.
Access to capital markets has become a greater priority for CFOs. In a more volatile environment, and a more
uncertain investment climate, ensuring the right balance of business funding will provide CFOs with increasingly
significant challenges. Balancing risk and reward effectively will help CFOs avoid poor investment decisions. Alt-
hough there are rarely clear answers to such investment decisions, several techniques can be used to help en-
sure that CFOs make the best decisions with the information they have. This chapter addresses some common
measures associated with return and risk, and different types of risk are also emphasized.

261
Risk vs. Return
Types of Risk
Risk is the variability of possible returns applicable to an investment. Greater return is required to compensate
for higher risk. Risk can be measured by the standard deviation, which is a measure of the dispersion of the
probability distribution of possible returns. The higher the standard deviation means the wider the distribution,
and thus the investment risk is greater. It is important to recognize that there are different types of risk. These
risks affect various investment alternatives, such as stocks, bonds, or real estate, differently. All investments are
subject to risk.
1. Business risk. Business risk is the relative dispersion or variability in the firm's expected earnings. The
nature of the firm's operations causes its business risk. This type of risk is affected by the firm's cost
structure, product demand characteristics, and intra industry competitive position.
2. Liquidity risk. It represents the possibility that an asset may not be sold on short notice for its market value.
If an investment must be sold at a high discount, then it is said to have a substantial amount of liquidity risk.
3. Default risk. It is the risk that the issuing company is unable to make interest payments or principal
repayments on debt. For example, there is a great amount of default risk inherent in the bonds of a
company experiencing financial difficulty.
4. Market risk. Prices of all stocks are correlated to some degree with broad swings in the stock market.
Market risk refers to changes in the price of a stock that result from changes in the stock market as a whole,
regardless of the fundamental change in a firm's earning power. For example, the prices of many stocks are
affected by trends such as bull or bear markets.
5. Interest rate risk. It refers to the fluctuations in the value of an asset as the interest rates and conditions of
the money and capital markets change. Interest rate risk relates to fixed income securities such as bonds
and real estate. For example, if interest rates rise (fall), bond prices fall (rise).
6. Purchasing power risk. This risk relates to the possibility that you will receive a lesser amount of purchasing
power than was originally invested. Bonds are most affected by this risk since the issuer will be paying back
in cheaper dollars during an inflationary period.

262
Return on Investment
Holding Period Return
Return from an investment comes from current income and appreciation in market value. The expected return
rate on a security is the weighted average of possible returns, weights being probabilities. The holding period
return is the total return you earn from holding an investment for a specified period of time, and equals:
Current income + Capital gain (or Loss)
Holding Period Return (HPR) = -----------------------------------------------
Purchase price
Example 13-1
You invest $100 in a security, sell it for $107, and earn a cash dividend of $13. The HPR is:
$13 + $7 $20
--------- = --- = 20%
$100 $100
Example 13-2
Consider the investment in stocks A and B over a one year period of ownership:
Stock A B
Purchase price (beginning of year) $100 $100 Cash dividend received (during the year) $13 $18 Sales price (end of year) $107 $97
The current income amounts from the investment in stocks A and B over the one-year period are $13 and $18,
respectively. For stock A, a capital gain of $7 ($107 sales price - $100 purchase price) is realized over the period.
In the case of stock B, a $3 capital loss ($97 sales price - $100 purchase price) results.
Combining the capital gain return (or loss) with the current income, the total return on each investment is
summarized below:
Stock Return A B Cash dividend $13 $18 Capital gain (loss) 7 (3) Total return $20 $15
Thus, the return on investments A and B are:
HPR (stock A) = %20100$
20$
100$
7$13$
100$
)100$107($13$==
+=
−+

263
HPR (stock B) = %15100$
15$
100$
3$18$
100$
)100$97($18$==
−=
−+
Expected Rate of Return
A CFO is primarily concerned with predicting future returns from an investment in a security. No one can state
precisely what these future returns will be. At best he/she can only predict the most likely expected outcome.
This outcome is the expected rate of return. Of course, historical (actual) rates of return could provide a useful
basis for formulating these future expectations. Probabilities may be used to evaluate the expected return. The
expected rate of return (r ), is the weighted average of possible returns from a given investment, weights being
probabilities. Mathematically,
r = ir ip
where ri is the ith possible return and pi is the probability of the ith return.
Example 13-3
Consider the possible rates of return, depending upon the states of the economy, recession, normal, and
prosperity that you might earn next year on a $50,000 investment in stock A, or on a $50,000 investment in
stock B:
Stock A
State of economy Return (r ) Probability (p ) Recession -5% .2 Normal 20 .6 Prosperity 40 .2
Stock B State of economy Return (r) Probability (p) Recession 10% .2 Normal 15 .6 Prosperity 20 .2
The expected rates of return can be calculated as follows: For stock A,
r = (-5%)(.2) + (20%)(.6) + (40%)(.2) = 19% For stock B,
r = (10%)(.2) + (15%)(.6) + (20%)(.2) = 15%

264
Types of Investments
Highlights of the different types of investments are discussed below:
Common stock is the equity investment representing ownership of a company. The margin requirement is 50
percent for common stock. Advantages of owning common stock are voting rights, appreciation in stock price,
receipt of dividends, and a better hedge against inflation than fixed-income obligations. Disadvantages of
common stock ownership are a decline in stock price in bearish markets, lack of sizable dividends, and higher
risk than debt securities and preferred stock, since you are the last to be paid in corporate liquidation.
Preferred stock is a hybrid of common stock and bonds. It is an equity investment (with no voting rights), but it
has many characteristics of a bond issue. The amount of dividend is typically fixed.
There is an 80 percent dividend exclusion for dividends received on stock. Preferred stock is riskier than bonds,
and as such has a higher return. Preferred stockholders take precedence over common stockholders in the re-
ceipt of dividends and in the event of liquidation. There is no maturity date, but preferred stock is often convert-
ible into common stock. Preferred stock may be callable at the company’s option, and it generally provides only
dividend income rather than significant appreciation in price.
Annual stated dividend income
Preferred dividend yield = Preferred stock price
A bond represents a long-term obligation to pay by a corporation or government. Bonds are typically in $1,000
denominations. You can buy or sell a bond before maturity at a price other than face value. Investment in bonds
can provide you with both interest income and capital gains. Interest rates and bond prices move in opposite
directions. A decrease in interest rate will result in an increase in bond price. The various types of bonds a
company may issue are as follows:
• Debentures. Debentures are unsecured (no collateral) debt. Although no assets are mortgaged as security
for the bonds, debentures are secured by the full faith and credit of the issuing firm. Debentures are a
general obligation of the borrower and rank equally with convertible bonds. Only companies with the best
credit ratings can issue debentures because only the company's credit rating and reputation secure the
bonds.
• Subordinated debentures. The claims of the holders of these bonds are subordinated to those of senior
creditors. Debt with a prior claim over the subordinated debentures is set forth in the bond indenture.
Typically, in liquidation, subordinated debentures come after short-term debt.
• Mortgage bonds. These are bonds secured by real assets. The first mortgage claim must be met before a
distribution is made to a second mortgage claim. There may be several mortgages for the same property
(e.g. building).
• Collateral trust bonds. The collateral for these bonds is your company's security investments in other
companies (bonds or stocks), which are given to a trustee for safekeeping.

265
• Convertible bonds. These may be converted to stock at a later date, based on a specified conversion ratio.
The conversion ratio equals the par value of the convertible security divided by the conversion price.
Convertible bonds are typically issued in the form of subordinated debentures. Convertible bonds are more
marketable and are typically issued at a lower interest rate than regular bonds because they offer the
conversion right to common stock. Of course, if bonds are converted to stock, debt repayment is not
involved. A convertible bond is a quasi-equity security because its market value is tied to the value of the
shares of stock into which the bond can be converted.
• Income bonds. These bonds pay interest only if there is a profit. However, because it accumulates
regardless of earnings, the interest, if bypassed, must be paid in a later year when adequate earnings exist.
• Guaranteed bonds. These are debt issued by one party with payment guaranteed by another.
• Serial bonds. A portion of these bonds comes due each year. At the time serial bonds are issued, a
schedule shows the yields, interest rates, and prices for each maturity. The interest rate on the shorter
maturities is lower than the interest rate on the longer maturities because less uncertainty exists regarding
the future.
• Deep discount bonds. These bonds have very low interest rates and thus are issued at substantial
discounts. The return to the holder comes primarily from appreciation in price rather than from interest
payments.
• Zero coupon bonds. These bonds do not provide interest. The return to the holder is in the form of
appreciation in price.
• Variable-rate bonds. The interest rates on the bonds are adjusted periodically to changes in money market
conditions. These bonds are popular when there is uncertainty about future interest rates and inflation.
• Junk bonds. These bonds are high risk and therefore high-yield securities that are normally issued when the
debt ratio is very high. Thus, the bondholders have as much risk as the holders of equity securities. Such
bonds are not highly rated by credit evaluation companies. Junk bonds have become accepted because of
the tax deductibility of the interest paid.
• Inflation-linked bonds. These bonds have coupons (and the principal amount as well) that are adjusted
according to the rate of inflation. The U.S. Treasury Inflation Protection Securities (TIPS) is an example.
The following table summarizes the characteristics and lists priority claims associated with bonds:
Bond Type Characteristics Priority of Lender’s Claim
Debentures
Available only to financially strong
companies. Convertible bonds are typ-
ically debentures.
General creditor
Subordinated debentures Comes after senior debt holders General Creditor
Mortgage bonds Collateral is real property or buildings.
Paid from the proceeds from the sale of
mortgaged assets. If any deficiency exists,
general creditor status applies.

266
Collateral trust bonds
Secured by stock and (or) bonds owned
by the issuer. Collateral value is usually
30% more than bond value.
Paid from the proceeds of stock and (or)
bond that is collateralized. If there is a de-
ficiency, general creditor, general creditor,
status applies.
Income bonds
Interest is only paid if there is net in-
come. Often issued when a company is
in reorganization because of financial
problems.
General creditor.
Deep-discount (and zero
coupon) bonds
Issued at very low or no (zero) coupon
rates. Issued at prices significantly be-
low face value. Usually callable at par
value.
Unsecured or secured status may apply
depending on the features of the issue.
Variable-rate-bonds
Coupon rate changes within limits
based on changes in money or capital
market rates. Appropriate when un-
certainty exists regarding inflation and
future interest rates. Because of the
automatic adjustment to changing
market conditions, the bonds sell near
face value.
Unsecured or secured status may apply
depending on the features of the issue.
You will need to determine whether or not your company should issue long-term debt. The advantages and dis-
advantage of issuing long-term debt are summarized in the following table.
Issuing Long-Term Debt
Advantages Disadvantages
• Interest is tax-deductible, while dividends are not.
• Bondholders do not participate in superior earn-
ings of your firm.
• The debt is repaid in cheaper dollars during infla-
tion.
• There is no dilution of company control.
• Financing flexibility can be achieved by including a
call provision in the bond indenture. A call provi-
sion allows your company to pay the debt before
the expiration date of the bond.
• It may safeguard your company's future financial
stability (e.g. in times of tight money markets when
short-term loans are not available.)
• Interest charges must be met regardless of
your company's earnings.
• Debt must be repaid at maturity.
• Higher debt implies greater financial risk,
which may increase the cost of financing.
• Indenture provisions may place stringent re-
strictions on your company.
• Over-commitments may arise because of
forecasting errors.

267
Convertible securities may be converted into common stock at a later date. Two examples of these securities
are convertible bonds and convertible preferred stock. These securities provide fixed income in the form of in-
terest (convertible bonds) or dividends (convertible preferred stock). You also benefit from the appreciation val-
ue of the common stock.
A warrant permits you to purchase a given number of shares at a specified price during a given time period.
Warrants are typically good for several years. They are often given as sweeteners for a bond issue to lower the
cost of debt. Warrants are not frequently issued and are not available for all securities. There are no dividend
payments or voting rights. A warrant permits you to take part indirectly in price appreciation of common stock
and to derive a capital gain. When the price per common share rises, you may either sell the warrant (because it
also increases in value) or exercise it to obtain stock. Trading in warrants is speculative because of the possibility
of variability in return, but the potential for high return exists.
Example 13-4
A warrant in ABC Company stock permits you to buy one share at $10. If the stock rises in price prior to the expi-
ration date, the warrant increases in value. If the stock drops below $10, the warrant loses value. The warrant’s
exercise price is typically constant over its life. But the price of some warrants may increase as the expiration
date becomes closer. Exercise price is adjusted for stock splits and stock dividends.
Selling price — Purchase price
Years
Return on a warrant = -------------------------------------
Average investment
An option allows for the purchase of a security (or property) at a certain price during a specified time period. An
option is neither debt nor equity. It is an opportunity to take advantage of an expected change in the price of a
security. The option holder has no guaranteed return. The option may not be attractive to exercise, since the
market price of the underlying common stock has not risen, for example, or the option time period may elapse.
If this occurs, you will lose your investment. Thus, options involve considerable risk.
A call is an option to buy, whereas a put is an option to sell a security at a specified price by a given date. Calls
and puts can be bought in round lots, typically 100 shares. They are usually written for widely held and actively
traded stock. Calls and puts are an alternative investment to common stock. They provide leverage opportunity
and are speculative. You do not have to exercise a call or put to earn a return. You can trade them in the sec-
ondary market for their value at the time.
By purchasing a call option, you have the opportunity to make a substantial gain from a small investment, but
you risk losing your entire investment if the stock price does not increase. Calls are in bearer form, with a life of
one to nine months. Calls have no voting rights, ownership interest, or dividend income. However, option con-
tracts are adjusted for stock splits and stock dividends. The value of a call rises as the underlying common stock
increases in market price.
Value of call = (Market price of stock − Exercise price of call) x 100
268
Example 13-5
The market price of a stock is $60, with an exercise price of $53.
Value of call = ($60 − $53) x 100 = $700
A future contract is a contract to buy or sell a specified amount of an item for a certain price by a given date.
The seller of a futures contract agrees to deliver the item to the buyer of the contract, who agrees to buy the
item. In the contract are specified the amount, valuation, method, quality, expiration date, manner of delivery,
and exchange to be traded in.
Commodity contracts are assurances by a seller to deliver a commodity (e.g. wheat). Financial contracts are
seller agreements to deliver a financial instrument (e.g. Treasury Bill) or a given amount of foreign currency.
Futures are high-risk investments partly because they depend on international economic conditions and the
volatile nature of prices.
A “long position” is buying a contract in the hope that the price will increase. A “short position” is selling a
contract with the expectation that the price will decline. The position may be terminated by reversing the
transaction. For example, the long buyer may subsequently become a short seller of the same amount of the
commodity or financial instrument. Practically all futures are offset prior to delivery.
A futures contract can be traded in the futures market. Trading is accomplished through specialized brokers, and
some commodity firms deal only in futures. Fees depend on the contract amount and the price of the item.
Commercial paper is a short-term unsecured obligation with a maturity ranging from two to 270 days, issued by
companies to investors with temporarily idle cash. Commercial paper can be issued only if the company has a
very high credit rating; therefore, the interest rate is less than that of a bank loan, typically one-half percent be-
low the prime interest rate. Commercial paper is sold at a discount (below face value), with the interest immedi-
ately deducted from the face of the note by the creditor; however, the company pays the full face-value. Com-
mercial paper may be issued through a dealer or directly placed with an institutional investor (a dealer is a com-
pany that buys securities and then sells them out of its own inventory, while an institutional investor is an entity
that buys large volumes of securities, such as banks and insurance companies).
The benefits of commercial paper are that no security is required, the interest rate is typically less than that re-
quired by banks or finance companies, and the commercial paper dealer often offers financial advice. The draw-
backs are that commercial paper can be issued only by large, financially sound companies and that commercial
paper dealings are impersonal. Commercial paper is usually backed by a bank letter of credit. Listed below is an
example that determines whether the amount of commercial paper issued by a company is excessive.

269
Example 13-6
A company's balance sheet appears below:
ASSETS Current assets $540,000 Fixed assets 800,000 Total assets $1,340,000
LIABILITIES AND STOCKHOLDERS' EQUITY Current liabilities- Notes payable to banks $100,000 Commercial paper 650,000 Total current liabilities $750,000 Long-term liabilities 260,000 Total liabilities $1,010,000 Stockholders' equity 330,000 Total liabilities and stockholders’ equity $1,340,000
The amount of commercial paper issued by the company is a high percentage of both its current liabilities,
86.7% ($650,000/ $750,000), and its total liabilities, 64.4% ($650,000/$1,010,000). Because bank loans are min-
imal, the company may want to do more bank borrowing and less commercial paper financing. In the event of a
money market squeeze, the company may find it advantageous to have a working relationship with a lending
bank.
The Capital Asset Pricing Model (CAPM)
Many investors hold more than one financial asset. A portion of a security's risk (called unsystematic risk) can
be controlled through diversification. This type of risk is unique to a given security. Business, liquidity, and de-
fault risks, which were discussed earlier, fall into this category. Non-diversifiable risk, more commonly referred
to as systematic risk, results from forces outside of the firm's control and are therefore not unique to the given
security. Purchasing power, interest rate, and market risks fall into this category. This type of risk is measured
by beta.

270
Beta (b) measures a security's volatility relative to an average security. A particular stock's beta is useful in
predicting how much the security will go up or down, provided that you know which way the market will go. It
does help to figure out risk and expected return.
Most of the unsystematic risk affecting a security can be diversified away in an efficiently constructed portfolio.
Therefore, this type of risk does not need to be compensated with a higher level of return. The only relevant risk
is systematic risk or beta risk for which the investor can expect to receive compensation. You, as an investor, are
compensated for taking this type of risk which cannot be controlled.
Under the Capital Asset Pricing Model (CAPM), in general, there is a relationship between a stock's expected (or
required) return, and its beta. The following formula is helpful in determining a stock's expected return.
The CAPM model involves the following steps:
1. Estimate the risk-free rate, rf, generally taken to be the United States Treasury Bill rate.
2. Estimate the stock's beta coefficient, b, which is an index of systematic (or non-diversifiable market)
risk.
3. Estimate the rate of return on the market portfolio, rm, such as the Standard & Poor's 500 Stock
Composite Index or Dow Jones 30 Industrials.
4. Estimate the required rate of return on the firm's stock, using the CAPM equation:
rj = rf + b(rm − rf)
In other words,
Expected return = risk-free rate + beta x (market risk premium)
The market risk premium (rm − rf) equals the expected market return (rm) minus the risk-free rate (rf). The
market risk premium is the additional return above that which you could earn on, a T-bill for example, to
compensate for assuming a given level of risk (as measured by beta).
Thus, the formula shows that the required (expected) return on a given security is equal to the return required
for securities that have no risk plus a risk premium required by the investor for assuming a given level of risk.
The key idea behind the formula is that the relevant measure of risk is the risk of the individual security, or its
beta. The higher the beta for a security, the greater the return expected (or demanded) by the investor.
Diversifiable Risk (Unsystematic Risk)
•Business risk
•Liquidity risk
•Default risk
Non-Diversifiable Risk (Systematic Risk)
•Purchasing power risk
•Interest rate risk
•Market risks
Measured by
Beta

271
Example 13-7
Assuming that rf is 7%, b is 1.5, and rm is 13%, then:
ke = rf + b(rm − rf) = 7% + 1.5(13% − 7%) = 16%.
This 16% cost of common stock can be viewed as consisting of a 7% risk-free rate plus a 9% risk premium, which
reflects that the firm's stock price is 1.5 times more volatile than the market portfolio to the factors affecting
non-diversifiable, or systematic, risk.
Beta (b) measures a security's volatility relative to an average security. Putting it another way, it is a measure of
a security's return over time to that of the overall market. For example, if your company's beta is 2.0, it means
that if the stock market goes up 10%, your company's common stock goes up 20%; if the market goes down
10%, your company's stock price goes down 20%. To read beta values:
Beta Meaning
0 The security’s return is independent of the market. An
example is a risk-free security (e.g. T-Bill).
0.5 The security is half as volatile as the market.
1.0 The security is as volatile or risky as the market (i.e.
average risk). This is the beta value of the market
portfolio (e.g. Standard & Poor’s 500).
2.0 The security is twice as volatile or risky, as the market.

272
Chapter 13 Review Questions
1. What are debentures?
A. Income bonds that require interest payments only when earnings permit
B. Subordinated debt and rank behind convertible bonds
C. Bonds secured by the full faith and credit of the issuing firm
D. Mortgage bonds secured by a lien on specific assets of the firm.
2. How do preferred and common stock differ?
A. Failure to pay dividends on common stock will not force the firm into bankruptcy while failure to pay
dividends on preferred stock will force the firm into bankruptcy.
B. Preferred stock has a higher priority than common stock with regard to earnings and assets in the event
of bankruptcy.
C. Common stock dividends are a fixed amount while preferred stock dividends are not.
D. Preferred stock dividends are deductible as an expense for tax purposes while common stock dividends
are not.
3. What is a measure that describes the risk of an investment project relative to other investments in general?
A. Coefficient of variation
B. Beta coefficient
C. Standard deviation
D. Expected return
4. What is the difference between the required rate of return on a given risky investment and that on a riskless
investment with the same expected return?
A. Risk premium
B. Coefficient of variation
C. Standard deviation
D. Beta coefficient

273
Chapter 14: International Finance
Learning Objectives:
After completing this section, you will be able to:
• Recognize some special features of a multinational corporation (MNC)
• Identify strategies for neutralizing foreign exchange exposure and methods of reducing operating exposure
The Role of the CFO
Many companies are multinational corporations (MNCs) that have significant foreign operations and derive a
high percentage of their sales from overseas. Despite the increase in international corporate business activity in
nearly every industry - according to the International Monetary Fund (IMF), 55% of global GDP growth will come
from emerging markets by 2019. The current era of faster and broader globalization presents new questions and
challenges for CFOs.
As companies become increasingly global, the CFO will need to expand on their geographic diversity and
knowledge. Thus, CFOs of MNCs should understand the complexities of international finance to make sound fi-
nancial and investment decisions. International finance involves consideration of managing working capital, fi-
nancing the business, control of foreign exchange and political risks, and foreign direct investments. Most im-
portantly, the CFO has to consider the value of the U.S. dollar relative to the value of the currency of the foreign
country in which business activities are being conducted. Currency exchange rates may materially affect receiv-
ables and payables, and imports and exports of the U.S. company in its multinational operations. The effect is
more pronounced with increasing activities abroad.
This chapter presents the most current information, offers important directives, and explains the technical pro-
cedures involved in the aforementioned dynamic business disciplines. The information applies to large, medium,
or small multinational companies to support a CFO in making intelligent decisions in all areas of international
finance to meet the current and future needs of global market.

274
Essentials for Multinational Corporations
The Features of MNCs
MNCs are characterized by:
1. A firm with foreign production facilities
2. Foreign joint ventures
3. Acquisition of controlling interest in a foreign company
There are significant differences between international and domestic financial management. They include:
• Multiple-currency problem. Sales revenues may be collected in one currency, assets denominated in
another, and profits measured in a third.
• Various legal, institutional, and economic constraints. There are variations in such things as tax laws, labor
practices, balance of payment policies, and government controls with respect to the types and sizes of
investments, types and amount of capital raised, and repatriation of profits. Repatriation is the conversion
of funds held in a foreign country into another currency and remittance of these funds to another
nation.
• Internal control problem. When the parent office of a MNC and its affiliates are widely located, internal
organizational difficulties arise.
A survey made of CFOs of MNCs lists the financial goals of MNCs in the following order of importance:
1. Maximize growth in corporate earnings, whether total earnings, earnings before interest and taxes (EBIT),
or earnings per share (EPS)
2. Maximize return on equity
3. Guarantee that funds are always available when needed
Appendix H provides an example of a checklist designed to be used by a company’s senior management (e.g.
CFO) as the first step in planning its expansion into foreign markets.
The Types of Foreign Operations
If the company's sales force has minimal experience in export sales, it is advisable to use foreign brokers when
specialized knowledge of foreign markets is needed. When sufficient volume exists, the company may establish a
foreign branch sales office including salespeople and technical service staff. As the operation matures, production
facilities may be established in the foreign market. However, some foreign countries require licensing before
foreign sales and production can take place. In this case, a foreign licensee sells and produces the product. A
problem with this is that confidential information and knowledge are passed on to the licensees who can then
become a competitor upon expiration of the agreement.

275
A joint venture with a foreign company is another way to proceed internationally and share the risk. Some foreign
governments require this to be the path to follow to operate in their countries. The foreign company may have local
goodwill to help assure success. A drawback is less control over activities and a conflict of interest.
In evaluating the impact that foreign operations have on the entity's financial health, the CFO should consider the
extent of intercountry transactions, foreign restrictions and laws, tax structure of the foreign country, and the eco-
nomic and political stability of the country. If a subsidiary is operating in a high-tax country with a double-tax agree-
ment, dividend payments are not subject to further U.S. taxes. One way to transfer income from high tax areas to
low tax areas is to levy royalties or management fees on the subsidiaries.
Types of International Risks
Currency Risk
Currency risk exists when the contract is written in terms of the foreign currency or denominated in foreign cur-
rency. Also, when you invest in a foreign market, the return on the foreign investment in terms of the U.S. dollar
depends not only on the return on the foreign market in terms of local currency but also on the change in the ex-
change rate between the local currency and U.S. dollar. The idea of exchange risk in trade contracts is illustrated in
the following situations.
Case I. An American automobile distributor agrees to buy a car from the manufacturer in Detroit. The
distributor agrees to pay $25,000 upon delivery of the car, which is expected to be 30 days from today. The car
is delivered on the thirtieth day and the distributor pays $25,000. Notice that, from the day this contract was
written until the day the car was delivered, the buyer knew the exact dollar amount of his liability. There was, in
other words, no uncertainty about the value of the contract.
Case II. An American automobile distributor enters into a contract with a British supplier to buy a car
from the United Kingdom for 8,000 pounds. The amount is payable on the delivery of the car, 30 days from to-
day. For example, the range of spot rates that we believe can occur on the date the contract is consummated is
$1.50 to $1.60. On the thirtieth day, the American importer will pay an amount in the range of 8,000 x $1.50 =
$12,000 to 8,000 x 1.60 = $12,800 for the car. As of today, the American firm is uncertain regarding its future
dollar outflow, 30 days hence. That is, the dollar value of the contract is uncertain.
These two cases help illustrate the idea of foreign exchange risk in international trade contracts. In the case of
the domestic trade contract, given as Case I, the exact dollar amount of the future dollar payment is known to-
day with certainty. In the case of the international trade contract, given in Case II, where the contract is written
in the foreign currency, the exact dollar amount of the contract is not known. The variability of the exchange
rate induces variability in the future cash flow. This is the risk of exchange rate changes, exchange risk, or cur-
rency risk.

276
Note that exchange risk is not limited to the two-party trade contracts; it exists also in foreign direct or portfolio
investments. The next section explains how a change in the dollar affects the return on a foreign investment.
The Impact on Foreign Investments
When you invest in a foreign market, the return on the foreign investment in terms of the U.S. dollar depends not
only on the return on the foreign market in terms of local currency, but also on the change in the exchange rate
between the local currency and the U.S. dollar. Since the exchange rates among major currencies have been volatile
in recent years, exchange rate uncertainty has often been mentioned as one of the potential barriers to
international investment.
For example, a strong dollar, meaning that foreign currency buys less dollars, would push down foreign returns of
the U.S. investor. The following example illustrates how a change in the dollar affects the return on a foreign
investment.
Example 14-1
You purchased the bonds of a Japanese firm paying 12% interest. You will earn that rate, assuming interest is paid, in
yens. What if you are paid in dollars? As Exhibit 14-1 shows, you must then convert yens to dollars before the
payout has any value to you. Suppose that the dollar appreciated 10% against the yen during the year after
purchase. (A currency appreciates when acquiring one of its units requires more units of a foreign currency). In this
example, 1 yen required 0.01 dollars, and later, 1 yen required only 0.0091 dollars; at the new exchange rate it
would take 1.099 (0.01/0.0091) yens to acquire 0.01 dollars. Thus, the dollar has appreciated while the yen has
depreciated. Now, your return realized in dollars is only 10.92%. The adverse movement in the foreign exchange
rate--the dollar's appreciation--reduced your actual yield.
Exhibit 14-1
Exchange Risk and Foreign Investment Yield
Exchange Rate:
No. of Dollars
Transaction Yen per 1 Yen Dollars
On 1/1/20x1
Purchased one Japanese bond
with a 12% coupon rate 500 $0.01* $5.00
On 12/31/20x1
Expected interest received 60 0.01 0.60
Expected yield 12% 12%
On 12/31/20x1
Actual interest received 60 0.0091** 0.546
Realized yield 12% 10.92%***
*For illustrative purposes assume that the direct quote is $0.01 per yen.
**$0.01/(1 + .1) = $0.01/1.1 = $0.0091

277
***$0.546/$5.00 = .1092 = 10.92%
Note, however, that currency swings work both ways. A weak dollar would boost foreign returns of U.S. investors.
Exhibit 14-2 is a quick reference to judge how currency swings affect foreign returns.
Exhibit 14-2
Currency Changes vs. Foreign Returns in U.S. Dollars
Change in Foreign Currency against the Dollar
Foreign Return 20% 10% 0% -10% -20%
20% 44% 32 20 8 -4
10 32 21 10 -1 -12
0 20 10 0 -10 -20
-10 8 -1 -10 -19 -28
-20 -4 -12 -20 -28 -36
Key Questions to Ask that Help to Identify Currency Risk (Foreign Exchange Risk)
A systematic approach to identifying an MNC's exposure to foreign exchange risk is to ask a series of questions
regarding the net effects on profits of changes in foreign currency revenues and costs. The questions are:
1. Where is the MNC selling? (Domestic vs. foreign sales share)
2. Who are the firm's major competitors? (Domestic vs. foreign)
3. Where is the firm producing? (Domestic vs. foreign)
4. Where are the firm's inputs coming from? (Domestic vs. foreign)
5. How sensitive is quantity demanded to price? (Elastic vs. inelastic)
6. How are the firm's inputs or outputs priced? (Priced in a domestic market or a global market; the currency of
denomination)
Political and Credit Risk
When a nation’s perception of its own self-interest changes, its commercial, regulatory, and tax laws, along with
its system of government can change. If such changes occur, investors and businesses can suffer unexpected
losses. The legal doctrine of sovereign immunity prevents recovery, in the courts of one country, of losses that
were incurred as a result of political action in another country. Political risk, sometimes called sovereign or
country risk, refers to the uncertainties surrounding the possibility of losses that might result from changes in a
sovereign country’s commercial laws, regulations, or taxes.
International credit risk is similar to political risk in that it refers to uncertainties and potential business losses
that result from differences in commercial law among nations. However, political and credit risk are different.

278
Whereas political risk refers to uncertainties about potential changes in a nation’s commercial laws, credit risk
refers to uncertainties about the nature of the existing commercial laws. For example, suppose an American
company ships their products to a Latin American retailer and specifies payment is due in 90 days. How does the
exporter evaluate the creditworthiness of the importer, and what recourse is there in the event of payment de-
fault?
Appendix I shows an example of risks associated with an international market, faced by Walgreens.
Foreign Exchange Rate Determination
Direct vs. Indirect Quotation
The simplest definition of an exchange rate is that it is a ratio of exchange between currencies. If you have 100
British pounds and the bank will exchange them for 180 U.S. dollars, then
(180 dollars)(100 pounds) = (1.80 dollar/pound)
The exchange rate is quoted as 1.80 dollars per pound. Viewed in this way, the exchange rate is simply the
amount of currency that you pay, divided by the amount of foreign currency that you receive.
An exchange rate is the ratio of one unit of currency to another. An exchange rate is established between the
different currencies. The conversion rate between currencies depends on the demand/supply relationship.
Outside the interbank market, dealers in foreign exchange generally use the direct method of quoting foreign
exchange. A direct quote is when the price is in units of foreign currency needed to buy one unit of home cur-
rency. For example, the direct quote for Japanese yen is $0.0122 per yen if the foreign country is the U.S.
Direct quote =1
𝐼𝑛𝑑𝑖𝑟𝑒𝑐𝑡 𝑞𝑢𝑜𝑡𝑒 =
1
81.795 𝑦𝑒𝑛 = $0.0122 per yen
Indirect and direct quotations are reciprocals.
Indirect quote = 1
𝐷𝑖𝑟𝑒𝑐𝑡 𝑞𝑢𝑜𝑡𝑒 =
1
$0.0122 = 81.795 yen
Spot vs. Forward Exchange Rates
Spot transactions refer to the immediate exchange of two currencies between two parties. Forward transactions
refer to contracts that commit the two parties to exchange specified amounts of two currencies at a specified
time in the future. The spot exchange rate is the ratio of exchange in a spot transaction, while the forward ex-
change rate is the ratio of exchange in a forward transaction. For reasons that will be analyzed later, spot rates
can exceed or be below forward rates for the same currencies.
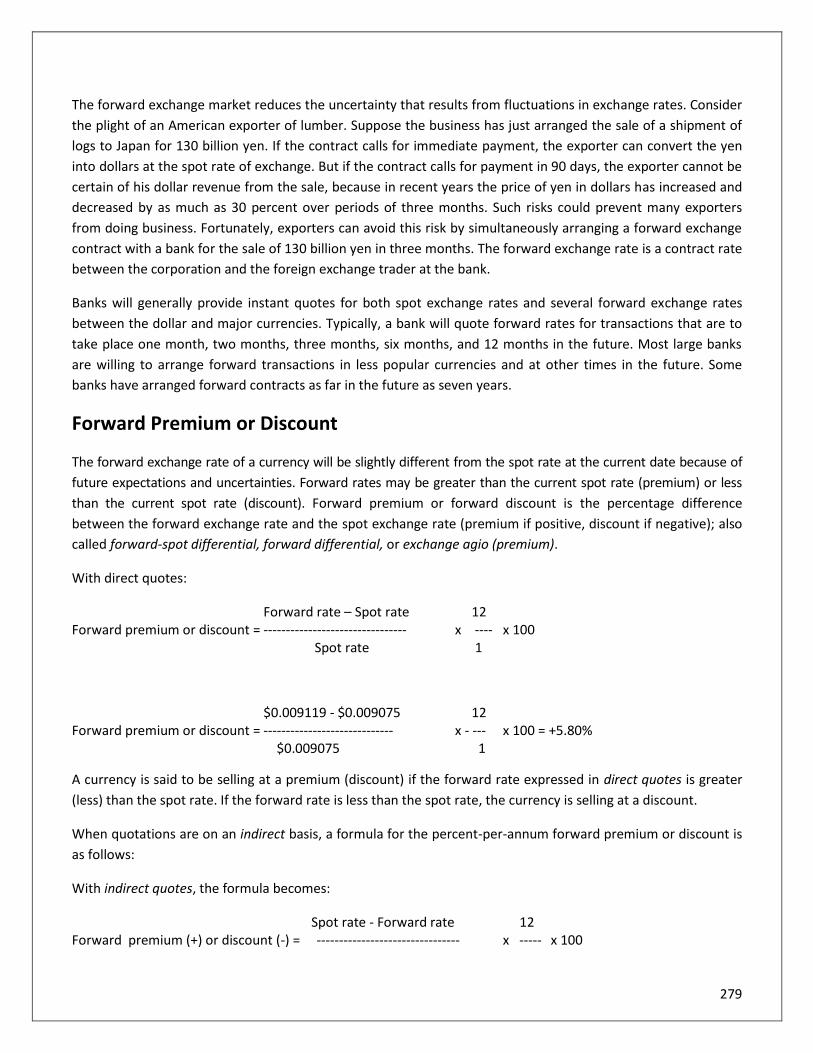
279
The forward exchange market reduces the uncertainty that results from fluctuations in exchange rates. Consider
the plight of an American exporter of lumber. Suppose the business has just arranged the sale of a shipment of
logs to Japan for 130 billion yen. If the contract calls for immediate payment, the exporter can convert the yen
into dollars at the spot rate of exchange. But if the contract calls for payment in 90 days, the exporter cannot be
certain of his dollar revenue from the sale, because in recent years the price of yen in dollars has increased and
decreased by as much as 30 percent over periods of three months. Such risks could prevent many exporters
from doing business. Fortunately, exporters can avoid this risk by simultaneously arranging a forward exchange
contract with a bank for the sale of 130 billion yen in three months. The forward exchange rate is a contract rate
between the corporation and the foreign exchange trader at the bank.
Banks will generally provide instant quotes for both spot exchange rates and several forward exchange rates
between the dollar and major currencies. Typically, a bank will quote forward rates for transactions that are to
take place one month, two months, three months, six months, and 12 months in the future. Most large banks
are willing to arrange forward transactions in less popular currencies and at other times in the future. Some
banks have arranged forward contracts as far in the future as seven years.
Forward Premium or Discount
The forward exchange rate of a currency will be slightly different from the spot rate at the current date because of
future expectations and uncertainties. Forward rates may be greater than the current spot rate (premium) or less
than the current spot rate (discount). Forward premium or forward discount is the percentage difference
between the forward exchange rate and the spot exchange rate (premium if positive, discount if negative); also
called forward-spot differential, forward differential, or exchange agio (premium).
With direct quotes:
Forward rate – Spot rate 12 Forward premium or discount = -------------------------------- x ---- x 100 Spot rate 1
$0.009119 - $0.009075 12 Forward premium or discount = ----------------------------- x - --- x 100 = +5.80% $0.009075 1
A currency is said to be selling at a premium (discount) if the forward rate expressed in direct quotes is greater
(less) than the spot rate. If the forward rate is less than the spot rate, the currency is selling at a discount.
When quotations are on an indirect basis, a formula for the percent-per-annum forward premium or discount is
as follows:
With indirect quotes, the formula becomes:
Spot rate - Forward rate 12 Forward premium (+) or discount (-) = -------------------------------- x ----- x 100
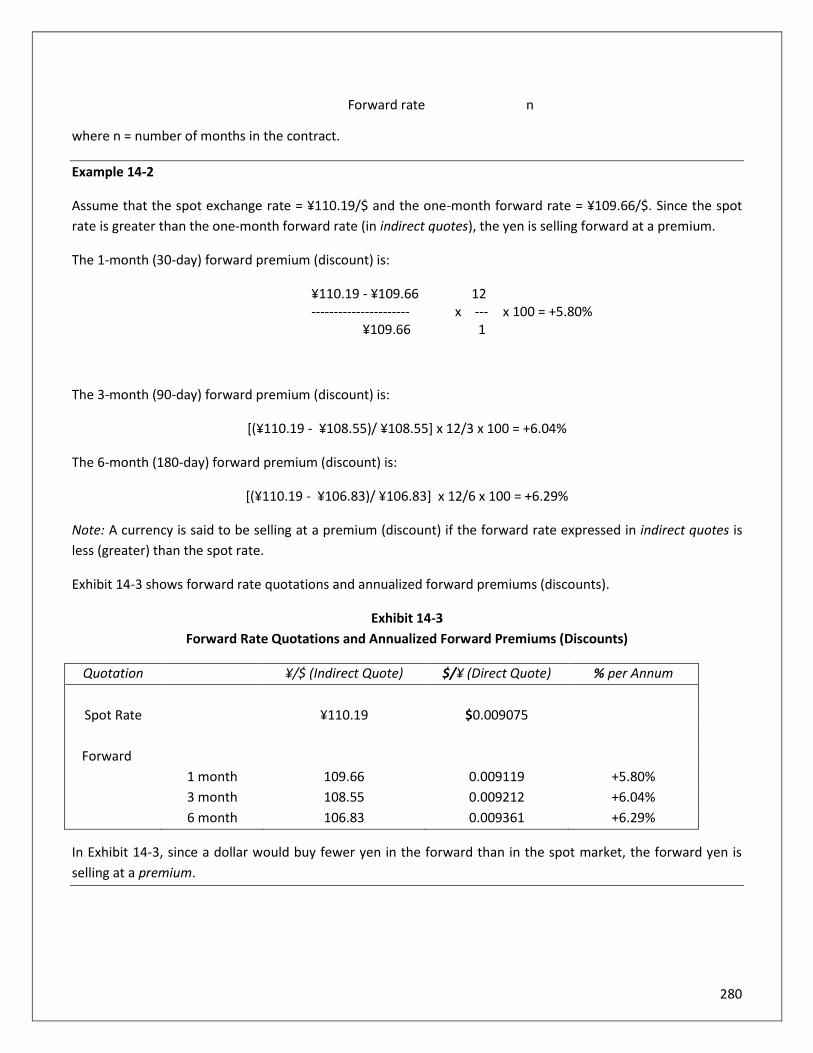
280
Forward rate n
where n = number of months in the contract.
Example 14-2
Assume that the spot exchange rate = ¥110.19/$ and the one-month forward rate = ¥109.66/$. Since the spot
rate is greater than the one-month forward rate (in indirect quotes), the yen is selling forward at a premium.
The 1-month (30-day) forward premium (discount) is:
¥110.19 - ¥109.66 12 ---------------------- x --- x 100 = +5.80%
¥109.66 1
The 3-month (90-day) forward premium (discount) is:
[(¥110.19 - ¥108.55)/ ¥108.55] x 12/3 x 100 = +6.04%
The 6-month (180-day) forward premium (discount) is:
[(¥110.19 - ¥106.83)/ ¥106.83] x 12/6 x 100 = +6.29%
Note: A currency is said to be selling at a premium (discount) if the forward rate expressed in indirect quotes is
less (greater) than the spot rate.
Exhibit 14-3 shows forward rate quotations and annualized forward premiums (discounts).
Exhibit 14-3
Forward Rate Quotations and Annualized Forward Premiums (Discounts)
Quotation ¥/$ (Indirect Quote) $/¥ (Direct Quote) % per Annum
Spot Rate ¥110.19 $0.009075
Forward
1 month 109.66 0.009119 +5.80%
3 month 108.55 0.009212 +6.04%
6 month 106.83 0.009361 +6.29%
In Exhibit 14-3, since a dollar would buy fewer yen in the forward than in the spot market, the forward yen is
selling at a premium.

281
Cross Rates
Cross rate is the exchange rate between two currencies derived by dividing each currency's exchange rate with a
third currency. For example, if dollars per pound is $1.8395/£ and yens per dollar is ¥109.96/$ (see Exhibit 14-4),
the cross rate between Japanese yen and British pounds is ¥202.27, as shown below:
Cross rate between yen and pound = 𝐷𝑜𝑙𝑙𝑎𝑟𝑠
𝑃𝑜𝑢𝑛𝑑 𝑥
𝑌𝑒𝑛
𝐷𝑜𝑙𝑙𝑎𝑟 =
𝑌𝑒𝑛
𝑃𝑜𝑢𝑛𝑑
= $/£ x ¥/$ = ¥/£
= 1.8395 dollars per pound x 109.96 yens per dollar
= 202.27 yens per pound
Because most currencies are quoted against the dollar, it may be necessary to work out the cross rates for cur-
rencies other than the dollar. The cross rate is needed to consummate financial transactions between two coun-
tries.
Exhibit 14-4
Sample Key Currency Cross Rates (as of September x, 20X8)
British Euro Japan U.S.
British --- 0.6787 0,0049 0.5436
Euro 1.4733 --- 0.0072 0.8011
Japan 202.27 137.30 --- 109.96
U.S. 1.8395 1.2482 0.00909 ---
.
Financial Strategies
In countries where currency values are likely to drop, CFOs of the subsidiaries should:
1. Avoid paying advances on purchase orders unless the seller pays interest on the advances sufficient to cover
the loss of purchasing power.
2. Not have excess idle cash. Excess cash can be used to buy inventory or other real assets.
3. Buy materials and supplies on credit in the country in which the foreign subsidiary is operating, extending the
final payment date as long as possible.
4. Avoid giving excessive trade credit. If accounts receivable balances are outstanding for an extended time pe-
riod, interest should be charged to absorb the loss in purchasing power.
5. Borrow local currency funds when the interest rate charged does not exceed U.S. rates after taking into ac-
count expected devaluation in the foreign country.
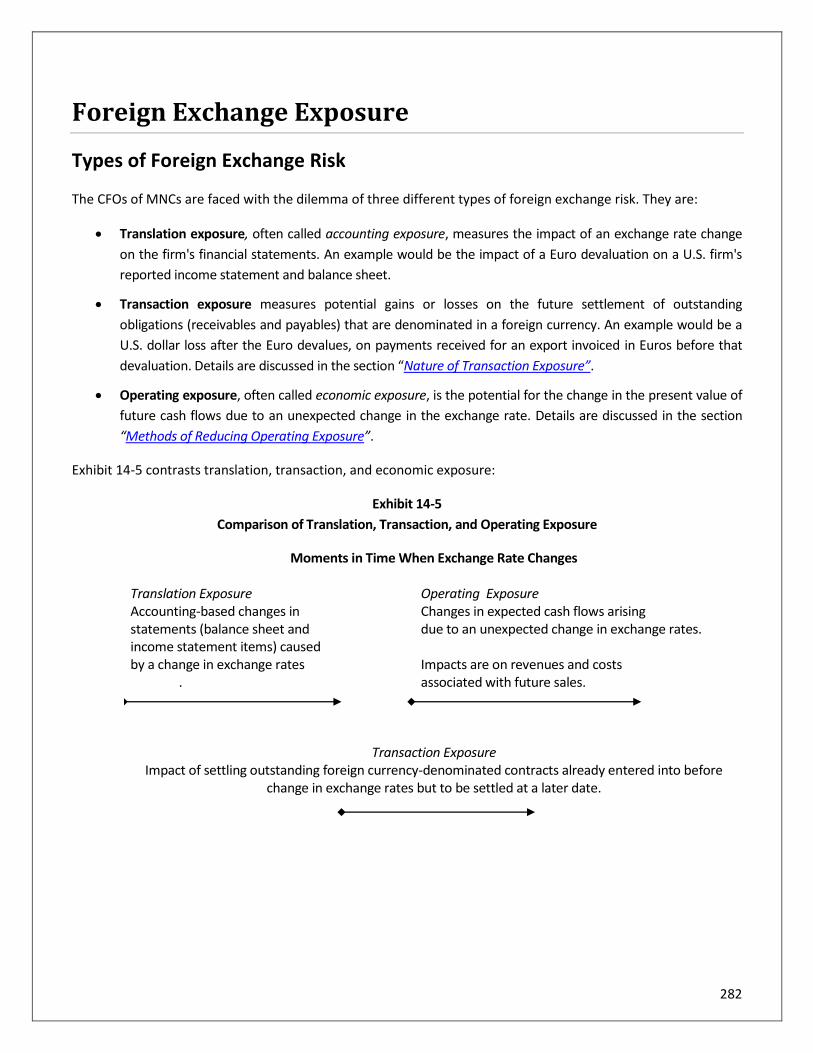
282
Foreign Exchange Exposure
Types of Foreign Exchange Risk
The CFOs of MNCs are faced with the dilemma of three different types of foreign exchange risk. They are:
• Translation exposure, often called accounting exposure, measures the impact of an exchange rate change
on the firm's financial statements. An example would be the impact of a Euro devaluation on a U.S. firm's
reported income statement and balance sheet.
• Transaction exposure measures potential gains or losses on the future settlement of outstanding
obligations (receivables and payables) that are denominated in a foreign currency. An example would be a
U.S. dollar loss after the Euro devalues, on payments received for an export invoiced in Euros before that
devaluation. Details are discussed in the section “Nature of Transaction Exposure”.
• Operating exposure, often called economic exposure, is the potential for the change in the present value of
future cash flows due to an unexpected change in the exchange rate. Details are discussed in the section
“Methods of Reducing Operating Exposure”.
Exhibit 14-5 contrasts translation, transaction, and economic exposure:
Exhibit 14-5
Comparison of Translation, Transaction, and Operating Exposure
Moments in Time When Exchange Rate Changes
Translation Exposure Operating Exposure Accounting-based changes in Changes in expected cash flows arising statements (balance sheet and due to an unexpected change in exchange rates. income statement items) caused by a change in exchange rates Impacts are on revenues and costs . associated with future sales.
Transaction Exposure Impact of settling outstanding foreign currency-denominated contracts already entered into before
change in exchange rates but to be settled at a later date.

283
Ways to Neutralize Foreign Exchange Risk
Foreign exchange risk can be neutralized or hedged by a change in the asset and liability position in the foreign
currency. Here are some ways to control exchange risk:
Entering a Money-Market Hedge
In this example, the exposed position in a foreign currency is offset by borrowing or lending in the money market.
Example 14-3
XYZ, an American importer enters into a contract with a British supplier to buy merchandise for 4,000 pounds. The
amount is payable on the delivery of the goods, 30 days from today. The company knows the exact amount of its
pound liability in 30 days. However, it does not know the payable in dollars. Assume that the 30-day money-market
rates for both lending and borrowing in the U.S. and U.K. are .5% and 1%, respectively. Assume further that today's
foreign exchange rate is $1.50 per pound.
In a money-market hedge, XYZ can take the following steps:
Step 1: Buy a one-month U.K. money market security, worth 4,000/(1+.005)=3,980 pounds. This investment
will compound to exactly 4,000 pounds in one month.
Step 2: Exchange dollars on today's spot (cash) market to obtain the 3,980 pounds. The dollar amount
needed today is 3,980 pounds x $1.7350 per pound =$6,905.30.
Step 3: If XYZ does not have this amount, it can borrow it from the U.S. money market at the going rate of
1%. In 30 days XYZ will need to repay $6,905.30 x (1+.1) = $7,595.83.
XYZ does not need to wait for the future exchange rate to be available. On today's date, the future dollar amount of
the contract is known with certainty. The British supplier will receive 4,000 pounds, and the cost of XYZ to make the
payment is $7,595.83.
Hedging by Purchasing Forward Exchange Contracts
Hedging is the process of using offsetting commitments to minimize or avoid the impact of adverse price move-
ments. A forward exchange contract is a commitment to buy or sell, at a specified future date, one currency for
a specified amount of another currency (at a specified exchange rate). This can be a hedge against changes in
exchange rates during a period of contract or exposure to risk from such changes. More specifically:
1. Buy foreign exchange forward contracts to cover payables denominated in a foreign currency, and
2. Sell foreign exchange forward contracts to cover receivables denominated in a foreign currency. This
way, any gain or loss on the foreign receivables or payables due to changes in exchange rates is offset by
the gain or loss on the forward exchange contract.
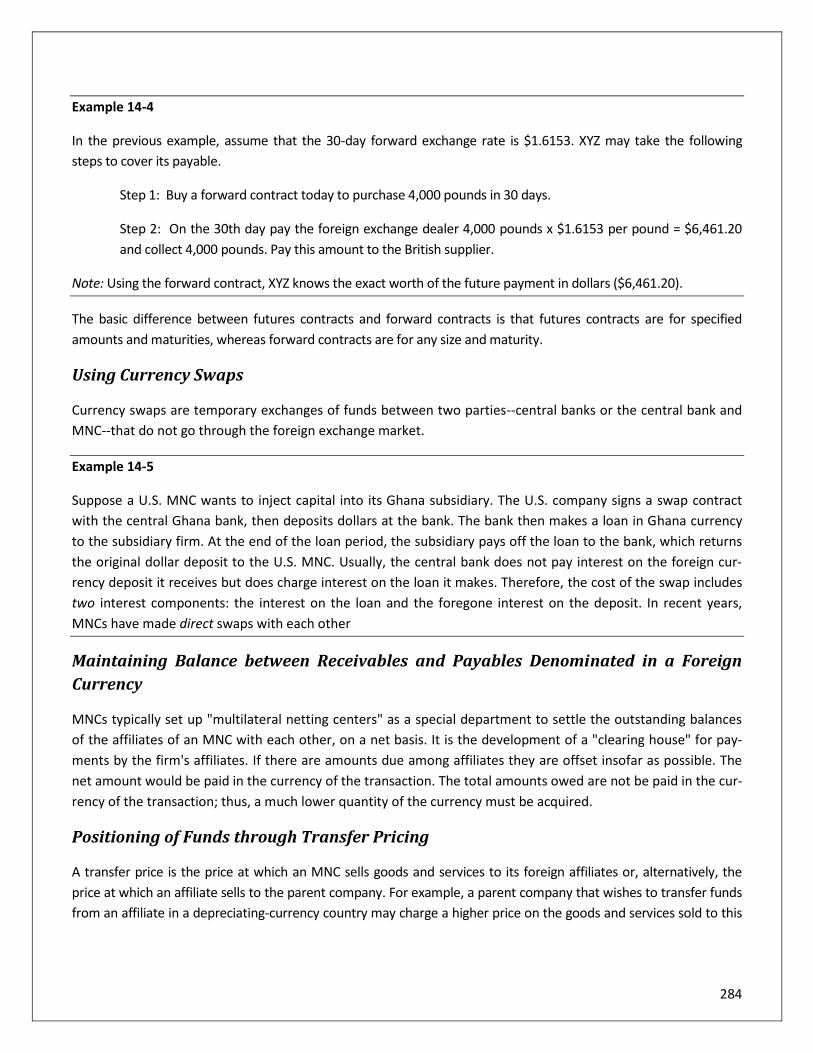
284
Example 14-4
In the previous example, assume that the 30-day forward exchange rate is $1.6153. XYZ may take the following
steps to cover its payable.
Step 1: Buy a forward contract today to purchase 4,000 pounds in 30 days.
Step 2: On the 30th day pay the foreign exchange dealer 4,000 pounds x $1.6153 per pound = $6,461.20
and collect 4,000 pounds. Pay this amount to the British supplier.
Note: Using the forward contract, XYZ knows the exact worth of the future payment in dollars ($6,461.20).
The basic difference between futures contracts and forward contracts is that futures contracts are for specified
amounts and maturities, whereas forward contracts are for any size and maturity.
Using Currency Swaps
Currency swaps are temporary exchanges of funds between two parties--central banks or the central bank and
MNC--that do not go through the foreign exchange market.
Example 14-5
Suppose a U.S. MNC wants to inject capital into its Ghana subsidiary. The U.S. company signs a swap contract
with the central Ghana bank, then deposits dollars at the bank. The bank then makes a loan in Ghana currency
to the subsidiary firm. At the end of the loan period, the subsidiary pays off the loan to the bank, which returns
the original dollar deposit to the U.S. MNC. Usually, the central bank does not pay interest on the foreign cur-
rency deposit it receives but does charge interest on the loan it makes. Therefore, the cost of the swap includes
two interest components: the interest on the loan and the foregone interest on the deposit. In recent years,
MNCs have made direct swaps with each other
Maintaining Balance between Receivables and Payables Denominated in a Foreign
Currency
MNCs typically set up "multilateral netting centers" as a special department to settle the outstanding balances
of the affiliates of an MNC with each other, on a net basis. It is the development of a "clearing house" for pay-
ments by the firm's affiliates. If there are amounts due among affiliates they are offset insofar as possible. The
net amount would be paid in the currency of the transaction. The total amounts owed are not be paid in the cur-
rency of the transaction; thus, a much lower quantity of the currency must be acquired.
Positioning of Funds through Transfer Pricing
A transfer price is the price at which an MNC sells goods and services to its foreign affiliates or, alternatively, the
price at which an affiliate sells to the parent company. For example, a parent company that wishes to transfer funds
from an affiliate in a depreciating-currency country may charge a higher price on the goods and services sold to this

285
affiliate by the parent company or by affiliates from strong-currency countries. Transfer pricing affects not only the
transfer of funds from one entity to another but also the income taxes paid by both entities.
Nature of Transaction Exposure
For an American business, transaction exposure refers to variability in the dollar value of a known future foreign
currency cash flow that results from variability in the future value of the dollar. In the case of a business in an-
other country, it would refer to variability in the value of cash flows in terms of that country's currency.
For example, suppose an American company has sold a shipload of scrap iron to Japan for $150 million yen, but
the Japanese company does not have to pay until the scrap iron arrives in about 30 days. The American compa-
ny cannot convert the yen into dollars for 30 days and does not know what the value of the yen will be until
then. It can forecast the rate, but the forecast is almost certainly not going to be accurate. The range of possible
dollar values for the 150 million yen is the measure of the company's transaction exposure.
Transferring Exposure
The simplest method of avoiding transaction exposure is to transfer it to another company. The American scrap
iron exporter could quote the sales price of scrap iron for sale in Japan in dollars. Then, the Japanese importer
would face the transaction exposure resulting from uncertainty about the exchange rate. Another simple means
of transferring the risk is to price the scrap iron in yen but demand immediate payment, in which case the cur-
rent spot rate will determine the dollar value of the export.
The problem with transferring exposure is that the company avoids its difficulties only by imposing them on its
customers or its suppliers. In the case of a small or inexperienced company, transferring risk to a large and so-
phisticated business may be appropriate. In other cases, the practice is likely to result in lost sales or hidden
costs.
Net Transaction Exposure
Larger companies that do a continuing and sizable amount of foreign currency transactions may find that much
of their exposure to unexpected exchange rate changes nets out over many different transactions. A receivable
of 150 million yen owed to an American company in 30 days is much less risky if the American company must
pay a different Japanese supplier 100 million yen in 25 days. The risk is reduced even if the business has only
receipts in yen on a continuing basis; some of the time the value of the yen will increase unexpectedly, resulting
in an unexpected gain, while at other times the yen will decrease, resulting in an unexpected loss.
Transaction exposure is further reduced when payments and receipts are in many different currencies. The val-
ues of different foreign currencies are never perfectly correlated. An unexpected increase in the value of the
pound may improve the profit margin on receipts from Britain, while an unexpected decrease in the value of the
euro may reduce profits on a receipt from France. Although there will always be some remaining net transaction
exposure, it may be small enough that the company is best off avoiding the costs of eliminating it completely.

286
Methods of Reducing Operating Exposure
The nature of operating exposure is much more complex than that of either transaction or translation exposure.
Many different factors contribute to a company's sensitivity to exchange rates. It is more difficult to measure
operating exposure accurately, so analysts must settle for estimates. When you are uncertain about the cause
and magnitude of a company's exposure, hedging strategies are much more problematic. An inappropriate
hedge can increase a company's operating exposure. Hence, strategies for hedging operating exposure are nei-
ther precise nor always effective. The objective of operating exposure management is therefore to anticipate
and influence the effect of unexpected changes in exchange rates on a firm’s future cash flows. The primary
method by which a firm may protect itself against operating exposure impacts is diversification of operations.
Matching Cash Flows
In an efficient market, changes in a company's market value reflect changes in the risk-adjusted present value of
the company's expected future cash flows to its owners. Hence, for an American business, reducing operating
exposure is tantamount to reducing variability in the dollar value of the business's expected future cash flows.
Recognition of this leads to strategies for matching the sensitivities of cash inflows and outflows to various cur-
rency changes.
For example, suppose an American company has a subsidiary that will generate revenues in Mexican pesos. The
sensitivity to the peso exchange rate of the dollar value of the subsidiary's net cash flow to its American owners
can be reduced by incurring as many of the subsidiary's expenses in pesos as possible. Where feasible, the sub-
sidiary should purchase supplies and obtain financing in Mexico. In this way, variability in the dollar value of the
net cash flow is reduced regardless of the magnitude of the cash flows.
Global Diversification
Another approach to hedging operating exposure is global diversification, which entails expanding the compa-
ny's markets and production facilities worldwide. If the real exchange rate falls in a particular country, then the
company can increase production in that location and boost exports to countries where the real exchange rate
has risen or is unchanged. As real exchange rates around the world change, the business is in a position to pur-
sue market and production opportunities as they arise.
For example, suppose the value of the euro increases relative to the dollar faster than differences in German
and American inflation rates would suggest with respect to purchasing power parity. A multinational corporation
with production and marketing facilities in both countries would reduce production in Germany and increase
production in America. Excess American production would be exported to Germany for sale in euros. The euro
revenues would be converted to more dollars at the higher exchange rate.
A well-diversified MNC constantly encounters such opportunities for increased profits as a result of random fluc-
tuations in real exchange rates. This serves to lower average costs and raise average revenues over the long run,
giving such companies a distinct competitive advantage.

287
Financing Strategies
Companies can also reduce operating exposure by matching assets and liabilities with respect to both currencies
and maturities (They should take care to match in terms of market values of assets and liabilities rather than
book value.) They can use natural hedges by matching currency cash flows or currency swaps.
For example, an American company with a German subsidiary should attempt to finance the subsidiary with eu-
ro-denominated liabilities. These liabilities should have maturities similar to the lifetime of the subsidiary's as-
sets. Hence, when the value of the euro decreases the dollar value of the subsidiary's assets, it will decrease the
dollar value of the subsidiary's liabilities by a similar amount.

288
Chapter 14 Review Questions
1. What is the risk of loss because of fluctuations in the relative value of foreign currencies called?
A. Expropriation risk
B. Multinational beta
C. Exchange rate risk
D. Undiversifiable risk
2. In foreign currency markets, when will the U.S. dollar sell at a premium?
A. If the forward exchange rate in terms of foreign currency units per dollar is lower than the spot rate
B. If the forward exchange rate in terms of foreign currency units per dollar is higher than the spot rate
C. If speculators expect the dollar to depreciate
D. If the foreign nominal interest rate is lower than the U.S. nominal interest rate
3. What does a forward contract involve?
A. A commitment today to purchase a product on a specific future date at a price to be determined some-
time in the future.
B. A commitment today to purchase a product some time during the current day at its present price.
C. A commitment today to purchase a product on a specific future date at a price determined today.
D. A commitment today to purchase a product only when its price increases above its current exercise
price.

289
PART VII:
ACHIEVING OPERATIONAL EXCELLENCE

290
Chapter 15: Information Technology
Learning Objectives
After completing this section, you will be able to:
• Recognize the benefits for the use of emerging technologies
• Identify the features of modern and high-performance accounting systems
The Role of the CFO
Existing accounting systems may not always be capable of supporting new regulations and business require-
ments. When a company grows in size or complexity, it will reach a point where manual processes affect the
productivity and accuracy. As a result, outdated information systems often frustrate people and processes, and
struggle to manage the growing range of financial and operating data and to produce timely and accuracy re-
ports. Although an accounting system is not something a company changes or replaces often, upgrades to a
modern IT infrastructure are necessary to meet the needs of today’s business.
To succeed, CFOs must embrace new technologies to reduce costs, improve operational efficiency and strength-
en system-driven processes, shifting staff focus from transitional work to value-added activities. CFOs can gain
new influence by strategic thinking -- innovation, creative problem solving, and a focus on anticipating and shap-
ing the future. Leading CFOs are no longer focused on processing historical data; instead they leverage leading
analytics to make key decisions. To help in this area, many top companies use accounting transformation
through the use of emerging technologies such as process automation, analytical software, cloud computing,
and ERP standardization.
This chapter discusses the advancement of accounting information systems. It also explores the growth of data
analytics, blockchain, automation process, and the cloud. Smart CFOs can engage with these new technologies
to work with business partners and manage enterprise performance.

291
Accounting Information Systems
Credit and Collection Management
Most accounting and enterprise resource planning (ERP) applications include accounts receivable modules, but
they usually provide only minimal tools to support collections and dispute management processes. Small to mid-
size accounting systems only support aging reports (e.g. listing of unpaid invoices), and they are unlikely to sup-
port the credit and collections processes. Credit & Collections Management (CCM), an integrated business appli-
cation, expands a company’s accounts receivable and accounting system to facilitate credit management, billing
and invoicing, remittance processing, dispute management, and collection processes. CCM systems vary de-
pending on the needs of a company, but they generally support the following key functions:
• Credit Facilitation such as credit ranking, application processing, reference verification, and credit limit
decisions
• Collections Management such as workflow automation, prioritized collection activities, integration of
accounts receivable data, and payment plan calculations
• Reporting and Analysis such as cash forecasting, query capabilities, and exception reporting
Managing outstanding accounts receivable has been one of the challenges faced by companies in many different
industries. The Credit Research Foundation report indicates that most delinquent companies delay or deny pay-
ment due to compliance or administrative problems, such as incorrect invoices or receiving the invoice too late
to process payment on established credit terms. Paystream Advisors revealed that companies in different indus-
tries can benefit from an integrated CCM application to extend existing accounts receivable functionality and
processes. For example, companies that implement a CCM application realize:
• 10 to 20% reductions in daily sales outstanding (DSO)
• 25% reductions in past due receivables
• 15% to 25% reductions in bad-debt reserves
• Return on Investment (ROI) in as little as 2 months and usually in no more than 6-9 months
To develop an effective credit and collections process, a company should ensure that the application chosen has
the following features:
• Allows the credit department to use credit scores from external credit bureaus and customize credit
scoring formulate
• Provides accurate and timely information such as customer’s payment history
• Analyzes customer payment history such as average days to pay and average outstanding receivables
• Automates customer invoice and payment information
• Notifies the collection representatives when invoices are overdue and provide customer account as-
signment
• Includes templates integrated with accounts receivable information for creating mail-merge documents

292
• Allows users to fully document and report on activities such as invoice disputes, email correspondence,
and phone conversations
• Includes built-in dashboards that provide insight into credit and collections data
• Provides a central repository for all documents, notes, and payment schedules
Procure-to-Pay
Procure-to-Pay (P2P) systems enable the integration of the Purchasing department and Accounts Payable de-
partment, linking the procurement and accounts payable systems processes; from the request for the product to
the issuance of the purchase order, receipt of the goods, and payment of the invoice. P2P uses technology to
streamline and automate the following key components:
P2P processes involve all stages of a company’s transactions and are vital to overall organization efficiency.
Therefore, P2P automation has significant impacts across the enterprise, such as enhancing compliance re-
quirements and centralizing and standardizing core processes. The impacts are discussed in the following sec-
tions;
Segregation of Duties. Segregation of duties is one of the key components for Sarbanes-Oxley (SOX) Act compli-
ance. This control is built into an automatic system. For example, a requisition is processed in accordance with
the workflow established in the system by the level of authority, types of transactions, and department. The
individual who initiates the requisition cannot be the approver and payer. Approval workflows are set up to re-
quire authorization prior to transaction processing. System access rights can be assigned based on job function
with an appropriate segregation of duties between:
Accurate Financial Statements. An effective accounts payable process starts with the creation of an accurate
purchase order. The company needs to educate and communicate the relevance, importance and impact of cre-
ating accurate and detailed purchase orders. The purchase order function enables the companies to optimize
the benefits of their automated accounts payable process. For example, an accurate purchase order enables
matching invoices to be submitted for processing and payment so that fewer resources are allocated to the re-
search and follow-up on discrepancies. The following diagram demonstrates the automated three-way match-
ing process:
Select Vendor
Create Requisition
Approve Requisition
Generate Purchase
Order
Receive Goods/ Services
Verify and Process Invoice
Issue Payment
Maintenance of Master File
DataPurchasing Authorization
Invoice Processing
Payment Processing
Reconciliation

293
An automated process also increases visibility with invoices available and accessible within 24 hours allowing for
accurate and timely accruals.
Continuous Monitoring. The analytics platform can monitor the compliance with the controls from requisition-
ing to payment, as well as segregation of duties, and access to sensitive data. This feature is critical in today’s
business environment. For example, when companies have high attrition and/or turnover rates leading to fre-
quent changes of roles and responsibilities, access control and segregation of duties violation can potentially go
undetected for weeks or months without continuous monitoring. Moreover, senior management often requires
risk-based monitoring oversight to ensure that the program is healthy and effective. The following table lists ex-
amples of analytics used to identify potential P2P fraud, errors, abuse, and policy non-compliance.
Fraud Data Analysis Tests for Key Business Process Areas
Process Examples of Common Data Analysis Tests
Procure-to-Pay
(P2P)
• PO with blank/zero amount
• Split POs (multiple under approval threshold)
• Duplicate invoices (same #, same amount on same date, same vendor with same amount)
• Invoice amount paid > goods received
• Invoice with no matching receiving report
• Multiple invoices for same PO and date
• Patterns of sequential invoices from a vendor
• Non-approved vendors
• Suspect purchases of consumer items
• Employee and vendor with same name, address, phone number, and bank account number
• Vendor address is a mail drop
• Payment without invoice
• Vendor master changes for brief periods
Source: ACL, Automating Fraud Detection: The Essential Guide, 2014
In an automatic system, exceptions such as nonmatching invoices are flagged immediately. For example, the
system generates an email to vendors, or has the ability to pursue discrepancy resolution. The exception is then
routed to the appropriate person designated to deal with exceptions. Moreover, an audit trail is available for
Purchase Order
•Vendor/Supplier Code
•Purchase Order No.
•Quantity
•Unit of Measure
•Part Number
•Price
•Payment Terms
Packing Slip
•Vendor/Supplier Code
•Purchase Order No.
•Quantity
•Unit of Measure
•Part Number
Invoice
•Vendor/Supplier Code
•Purchase Order No.
•Quantity
•Unit of Measure
•Part Number
•Price
•Payment Terms

294
review, investigation, and follow-up. Audit trails contain information regarding any additions, deletions or modi-
fications to the system, and provide evidence concerning transactions, such as the date and time of the transac-
tion, who processed it, and at which terminal, for example. An effective audit trail allows data to be retrieved
and certified.
Centralizing and Standardizing Core Processes. One of the typical issues that companies face in today’s global
marketplace is inconsistent processes. This usually results from variation in procure-to-pay processes from one
facility or location to another, creating a significant obstacle to the workflow. For example, when each facility
has differing approval limits, or has no approval limits at all, implementing workflow for requisition approval re-
quires significant efforts because:
• Each facility’s approval limit is established and maintained separately, or
• The company must define and deploy system-wide standards.
Implementation of standardized P2P processes is critical, especially when global reach, mergers, and acquisition
have brought approaches, disparate systems, and cultures together. According to a recent study, with a central-
ized structure, the cost and time taken to process an invoice is reduced significantly. There are also many ad-
vantages of a centralized approach to the invoice process, such as shorter cycle time, elimination of hand-offs,
fewer fragmented systems and the ability to have a more holistic view of the accounts payable function.
Fixed Asset System
Many accounting software packages are available to automate and streamline the fixed asset process. An effec-
tive fixed asset system should help management to achieve the following objectives:
1. Maintain a complete and accurate fixed asset accounting and management system to track the value,
condition, the remaining lives (of the assets) , and the maintenance and repair schedules of those as-
sets.
2. Enable an up-to-date asset condition analysis to form a prioritized preventive maintenance schedule to
determine the amount and sources of funding available for any project.
3. Develop more accurate capital and operating budgets.
The following are features and key considerations of deploying an effective fixed asset system:

295
Features Key Consideration
System Function
• Integration with the Accounting System (e.g., general ledger, inventory)
• Ability to facilitate exporting and importing files
• Capability of splitting an asset into sub-assets, and calculate deprecations by
sub-assets
• Providing projections on future depreciation
• E-mail functionality for exchange of reports and other information
• Security features including access rights for various user groups with flexible
user rights. (Read, Write, Change/Delete)
Queries and Re-
ports
• A wide range of standard reports to meet the entity’s needs (e.g., by category,
classes, and groups) such as:
− Acquisition Report
− Depreciation Expense Report
− Disposal Report
− Transfer Report
− Net Book Value Report
− Period-Close Summary
− Annual Activity Report
• Ability to customize standard reports
• Reports containing sufficient details in accordance with users’ needs
• Allowing for queries and ad-hoc reports
• Providing reports related to critical dates such as maintenance, warranty and
insurance
In summary, to deploy the right software, management should be aware of the following factors:
• For a small company: Find an affordable fixed asset system designed for the needs of small business to
optimize the fixed asset management and maintain reasonable return on investment.
• For a midsized to large company: Ensure that the software integrates with other modules (e.g., general
ledger, payables, purchase order, and inventory management) to provide additional functionality to the
current system.
• For a company expecting to purchase more assets: Ensure that the software has the ability to meet the
growth and the needs of an expanding database.
In general, the software package should be easily customized to meet the company’s needs. In addition, a
fixed asset software package should at least provide the ability to:
1. Manage complex depreciation methods and conventions
2. Maintain accurate physical inventory
3. Integrate with other modules (e.g., general ledger, payables, and purchase order)
4. Automatically handle disposal of both full and partial assets
5. Provide comprehensive application data security

296
6. Maintain sufficient audit trail to track all data changes
Inventory Optimization Software
The inventory module should automatically track inventory as purchases or sales are made and maintain the
cost and price data for each inventory item. In an integrated system, the inventory main file, which stores the
product's number, is checked when a sales invoice is created in the accounts receivable module. If sufficient in-
ventory is on hand, the amount of the sale is reduced from the balance. Likewise, when inventory is purchased
the inventory quantity is automatically increased. The module should help improve inventory management by
alerting the user when to reorder, identifying slow moving items, and analyzing performance by item and cate-
gory.
Inventory optimization software has been around for about a decade. Many highly effective companies have
adopted this type of software solution, inventory optimization, to manage inventory challenges. Inventory opti-
mization software analyzes the inventory issues historically to determine the optimal inventory levels, from raw
materials to finished goods and distribution channels, and ensures that not only will individual nodes or chan-
nels be optimized, but network inventory levels will also be enhanced. The probabilistic modeling is applied to
most of these solutions. Instead of relying on single number forecasts for supply and demand, inventory optimi-
zation software considers various factors such as history, supplier performance and seasonality of products to
determine the probability of different lead times and demand patterns. An inventory software package should
at a minimum provide the ability to:
• Capture and process customer orders and produce data for inventory control and accounts receivable
• Process data reflecting changes in inventory
• Provide shipping and reorder information
The Aberdeen Group’s benchmark revealed that Best-in-Class companies are more likely to use technology in
managing the following key inventory management events:
1. Inventory replenishment
2. Demand analysis
3. Inventory optimization
4. Global inventory visibility
5. Inventory segmentation
6. Event management
7. Responsive execution
In general, the software package should be tailored to meet the company’s needs.

297
The following table lists potential inventory software requirements that growing businesses often need:
Inventory Software Key Requirements
• Easy to use; requiring minimal start-up time and training
• Functionalities including Receiving, Shipping, and Counting
• Optional accounting costing methods. (e.g., LIFO, FIFO, Average Costing)
• Tools for purchasing, receiving, stocking, picking, packing, and shipping
• Tools for users to define exception conditions with related alert thresholds
• Barcodes to increase speed and accuracy
• Ability to print barcode labels for items
• Ability to track and report inventory in multiple locations, warehouses, and storefronts
• Reordering parameters with the consideration of usage, lead time, criticality and other factors
• Ability to determine efficient safety stocks for each item with the consideration of demand pre-
dictability, delivery processing times, and delivery accuracy
• Automatic forecasting for each inventory item with the ability to change with seasonal variations
and trends in demand
• Automatic inventory counting process allowing for periodic and cycle counts
• Ability to issue inventory to work orders or tasks
• Insightful reports enabling better decision making
• Connectivity to accounting system and other software modules (e.g. manufacturing job costing)
• Multi-currency features available allowing for receiving and converting payments into any curren-
cy
• Comprehensive application data security
• Sufficient audit trail to track all data changes
Modern Close Software
A well-designed and technology-enabled close is critical in any financial application. The faster the finance or-
ganization can close the books and deliver timely insights to key decision makers with an accurate snapshot of
company performance, the more value-added strategies it can contribute to the company, enabling executives
and boards to make prudent business decisions. In addition, a robust and holistic closing process anchored in
best practices and technologies frees up accounting resources for more value-added activities. Although the
techniques used will vary depending on the organization's size and culture, companies with the fastest reporting
usually have a better integrated IT structure of the following features:
• Automating upload and validating data upon entry
• Integration between the ERP system and other systems
• Integration between the general ledger and sub-ledgers
• Automatic reconciliations and adjustments
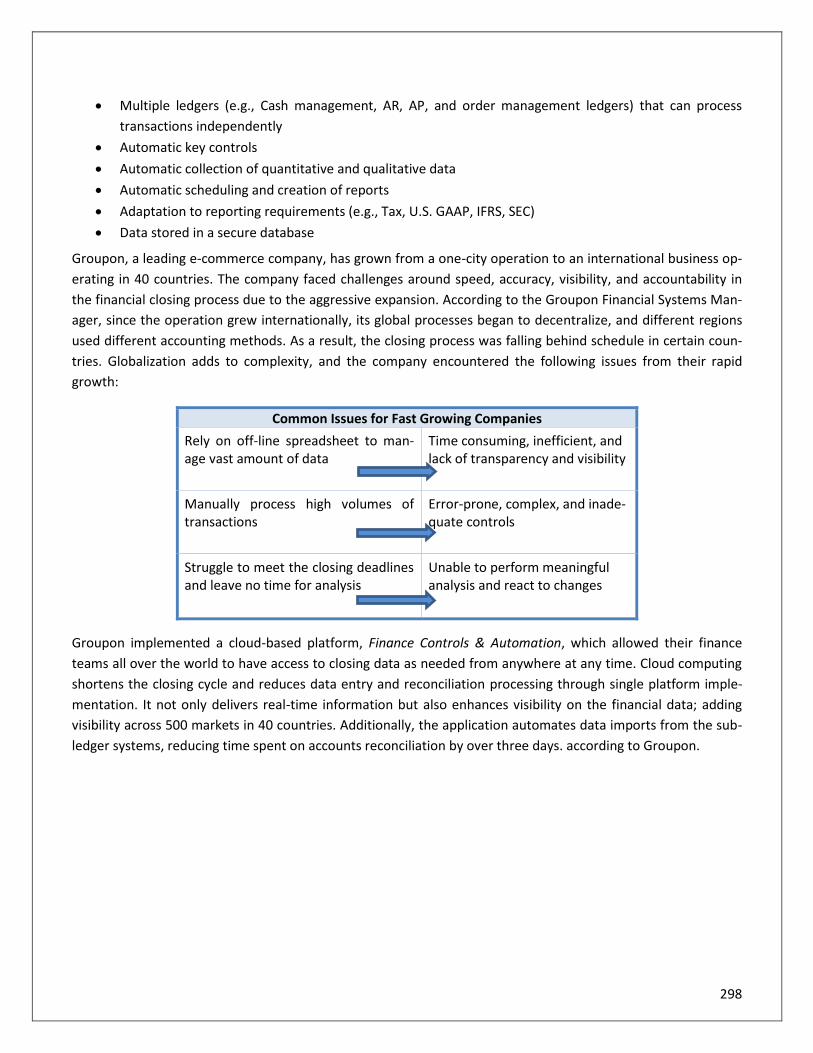
298
• Multiple ledgers (e.g., Cash management, AR, AP, and order management ledgers) that can process
transactions independently
• Automatic key controls
• Automatic collection of quantitative and qualitative data
• Automatic scheduling and creation of reports
• Adaptation to reporting requirements (e.g., Tax, U.S. GAAP, IFRS, SEC)
• Data stored in a secure database
Groupon, a leading e-commerce company, has grown from a one-city operation to an international business op-
erating in 40 countries. The company faced challenges around speed, accuracy, visibility, and accountability in
the financial closing process due to the aggressive expansion. According to the Groupon Financial Systems Man-
ager, since the operation grew internationally, its global processes began to decentralize, and different regions
used different accounting methods. As a result, the closing process was falling behind schedule in certain coun-
tries. Globalization adds to complexity, and the company encountered the following issues from their rapid
growth:
Common Issues for Fast Growing Companies
Rely on off-line spreadsheet to man-age vast amount of data
Time consuming, inefficient, and lack of transparency and visibility
Manually process high volumes of transactions
Error-prone, complex, and inade-quate controls
Struggle to meet the closing deadlines and leave no time for analysis
Unable to perform meaningful analysis and react to changes
Groupon implemented a cloud-based platform, Finance Controls & Automation, which allowed their finance
teams all over the world to have access to closing data as needed from anywhere at any time. Cloud computing
shortens the closing cycle and reduces data entry and reconciliation processing through single platform imple-
mentation. It not only delivers real-time information but also enhances visibility on the financial data; adding
visibility across 500 markets in 40 countries. Additionally, the application automates data imports from the sub-
ledger systems, reducing time spent on accounts reconciliation by over three days. according to Groupon.

299
The following table lists the common features of modern retail accounting close and automation software:
Common Features of Modern Accounting Close & Automation Software
Automatically Match All Types of Transac-tions
• Eliminate manual matching high-volume transactions.
• Create reconciliation items and correcting journal entries to un-matched transactions.
Confirm Key Account Balances Daily
• Ability to verify across different channels, store locations, currencies, and transaction types.
• Enable continual validation of account balances and transactional de-tails.
• Embed controls and auditability.
Centralize & Automate End-to-End Journals Management
• Centralize journal entry management.
• Automate creation, approval, and review of journals.
Standardize & Stream-line Bank & Inventory Reconciliations
• Automate and standardize the entire reconciliation process.
• Compare general ledger, bank, and inventory data, in search of anomalies.
• Investigate discrepancies, attach supporting documentation, and take required actions.
• Standardize, control, and streamline bank, cash, credit card, and in-ventory reconciliations.
Connect & Integrate with Existing Systems
Enable data imports from bank files, POS systems, credit card statements, and other systems.
Source: BlackLine, Modern Retail Accounting, 2017
E-Budgeting
Because many companies remain locked in a spreadsheet world, their current technologies are not agile enough
or sufficiently adaptable to changing business models and events to support an effective budgeting process.
While research shows that two-thirds of U.S. companies still rely on Microsoft Excel for their budgeting process,
some companies are evolving to a more technologically advanced approach. As more and more companies op-
erate globally, the Internet is playing an ever-greater role in the budgeting process. E-budgeting is an increasing-
ly popular Internet- or Intranet-based budgeting tool that can streamlined and will speed up an organization's
budgeting process.
The ‘e’ in e-budgeting stands for both electronic and enterprise-wide: employees throughout an organization, at
all levels and around the globe, can submit and retrieve budget information electronically via the Internet.
Budgeting software is utilized and made available on the Web (in a cloud computing environment), so that
budget information electronically submitted from any location is in a consistent companywide format. Managers
in organizations using e-budgeting have found that it greatly streamlines the entire budgeting process. In the
past, these organizations have compiled their master budgets on hundreds of spreadsheets, which had to be
collected and integrated by the corporate controller's office. One result of this cumbersome approach was that a
disproportionate amount of time was spent compiling and verifying data from multiple sources.

300
With e-budgeting, both the submission of budget information and its compilation are accomplished electronical-
ly by the Web-based budgeting software. Thus, e-budgeting is just one more area where the Internet has trans-
formed how the workplace operates in the era of e-business. The new budgeting and planning (B&P) software
represents a giant step forward for accountants. Finance managers can use these robust, Web-enabled pro-
grams to scan a wide range of data, radically speed up the planning process, and identify managers who have
failed to submit budgets. More often known as active financial planning software, this software includes applica-
tions and a new level of functionality that combines budgeting, forecasting analytics, business intelligence, and
collaboration.
Leveraging Technology
Advanced Data Analytics
‘Big data’ is a term that references how extremely large data sets may be analyzed computationally to reveal
patterns, trends, and associations, especially relating to human behavior and interactions.
Big data is creating new ways to gather and analyze the high volume, variety, and velocity of data. Finance
adopters of big data are gathering insights that go beyond the traditional financial statement analyses, and they
are gaining notice from their executive management teams. These technologies enable trends and patterns to
be analyzed for future action rather than historical explanations. Many world-class finance organizations have
already developed a sophisticated data architecture to make data analysis effective. Examples include:
• Analysis of financial, operational, competitive, regional, and economic data sets to identify new ways to
generate revenue.
• Predictive analytics techniques assess risk associated with long-term investment prospects in new mar-
kets and products. Instead of asking what happened, predictive technologies can ask what will happen.
• Accessing real-time data to improve fraud detection and forensic accounting by identifying risky cus-
tomers and suppliers, as well as fraudulent transactions.
To recognize the full benefits, the finance teams need to understand both the opportunities and the challenges
before implementing big data. Below are some of the challenges that CFOs should be aware of:
• Understanding the platform required to handle the volume and the variety of big data (e.g., photos, au-
dio, video, 3D models, and location data)
• Determining how to stream information in real-time to meet the need for speed, while dealing with the
sheer volume of data and the level of detail needed
• Ensuring the validity of data while dealing with the volume of information from disparate data sources
• Sorting, cleaning up, and analyzing data to display meaningful results

301
• Keeping the vast volume of data secure (e.g., user authentication, user access privilege)
• The requirements for a sophisticated and complex hardware infrastructure
• The high implementation costs, such as acquiring new hardware, using cloud providers, hiring additional
staff, training, maintenance and expansion
Implementing big data is a significant undertaking that an organization should fully plan, evaluate, and investi-
gate before initiating. An organization should consider the following actions prior to a big data investment:
1. Gaining support from the executive team by demonstrating the improved and competitive analytics en-
abled by big data
2. Enhancing the existing information technology infrastructure and data management processes to sup-
port the complexity of a big data architecture
3. Involving key business partners in the process, such as information technology, marketing, sales, and
product development
4. Understanding analytics that business users require and what analysis must be performed
5. Identifying the internal and external reporting requirements
6. Allocating the appropriate effort to data standardization and definitions
7. Ensuring that staff have the quantitative skills for big data and can see beyond the traditional statistical
methods
The possibilities and capabilities from the emergence of big data are nearly endless; it creates opportunities in
evaluating data assets, decision-making, and risk management. Finance teams can go beyond traditional finan-
cial statements, including the ability to perform competitive benchmarking, to gain important insights into sales
and forecasting, and to gain a complete view of the factors impacting customers.
Blockchain Technology
Modern financial accounting is based on the double-entry system. It is a method of recording business transac-
tions to meet the objectives of management and establish the accuracy of recorded data. Double-entry account-
ing means that each transaction is recorded in at least two accounts where the total debits always equal the to-
tal credits. It allows companies to maintain records reflecting what they own and they owe, and have earned
and spent for a given period of time. The use of a system of checks and balances also helps identify whether or
not errors have been made in recording transactions. To validate transactions, companies have staff enter and
send invoices with approval processes, and hire independent auditors to verify the financial information.
Blockchain technology, a profound change in existing accounting processes, was initially a means to create a
global cryptocurrency (Bitcoin). It dramatically shifts the way we send, receive, track, manage, and store transac-
tions. Instead of maintaining separate records based on receipts and invoices, companies can create a digital
ledger of transactions among a network of trusted participants in a secure, automated, transparent, and audita-
ble manner. The blockchain functions as a constantly growing distributed network where companies can record
their transactions directly into a joint register. For example, when transactions transfer an ownership of funds, a

302
new block is created and linked to all the previous blocks in the chain to update all users’ balances on the net-
work. The blocks are visible to all parties involved in the transactions, working as a global and public ledger.
A blockchain offers a secure and decentralized ledger of all transactions across a network. It uses cryptography
and digital signatures to prove identity, authenticity and enforce read/write access rights. Cryptography is a
technique that prevents third-parties or the public from reading private messages, ensuring data confidentiality,
data integrity, and authentication.
This new distributed ledger is described as “triple-entry accounting” because it enhances the double- entry sys-
tem. All accounting entries involving outside parties are cryptographically sealed by a third entry. This may in-
clude purchases of supplies and inventory, sales, expenses and tax payments. The bookkeeping entries of both
parties are corresponding, consistent, and matched. For example, if Company A records a debit to account for
cash received from a sale, Company B records a credit for cash spent in the same transaction. The blockchain,
acting as third party, cryptographically seals (validates) the transaction and issues a receipt. As a result, every
transaction is recorded in three places and has a corresponding entry verified by the blockchain.
Since a blockchain facilitates secure online transactions and enhances the double-entry system, it allows partici-
pants to validate transactions in an inexpensive manner, and the time necessary to conduct an audit will decline
considerably. All transactions can be logged, viewed, and monitored on an internal blockchain. It also allows the
regulators and auditors to inspect a company’s books in real-time.
The blockchain algorithm enables the collaborative creation of a digital ecosystem, with capabilities going be-
yond traditional ledgers. This evolving technology has been explored recently in more areas, such as stock trad-
ing, contracts, and intellectual property. The “big four” accounting firms are developing the audit skills needed
to review/audit blockchain technology as clients start switching portions of their business to a blockchain-based
infrastructure. For example, Deloitte has completed the project of scrutinizing permissioned blockchain proto-
cols and applications with professional auditing standards. KPMG and Microsoft have both partnered up to cre-
ate blockchain solutions by providing services built around distributed ledgers.
Robotic Process Automation
Process automation is nothing new since organizations have always looked for ways to cut costs and improve
the speed and quality of financial information provided. Robotic Process Automation (RPA), a format to auto-
mate manual processes, reduces labor required repeatable and rule-based tasks by the use of computer coded
software programs. With the increasing availability and advancement of robotic solutions, companies are driv-
ing the process improvement in accounts payable even further.
RPA provides significant improvements in accuracy and cycle time and increases productivity in high-volume
tasks. It can also serve as an alternative to further outsourcing and offshoring of accounting operations. For ex-
ample, RPA enables a company to reclaim certain accounting activities from an off-shore location and re-deploy
them on-shore. In addition, the overhead and fixed costs required to employ a full-time employee are reduced
when replaced by robots. According to Deloitte’s, Automate this: The business leader’s guide to robotic and in-
telligent automation, organizations applying RPA solutions benefit beyond cost reduction;
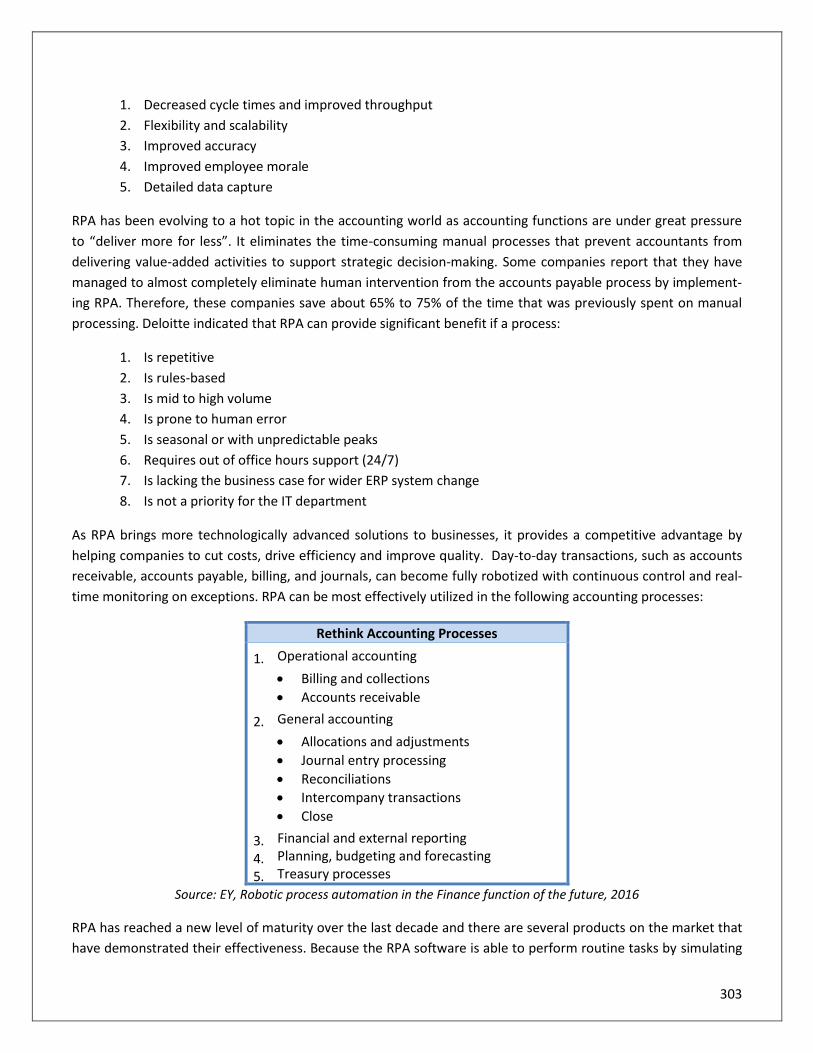
303
1. Decreased cycle times and improved throughput
2. Flexibility and scalability
3. Improved accuracy
4. Improved employee morale
5. Detailed data capture
RPA has been evolving to a hot topic in the accounting world as accounting functions are under great pressure
to “deliver more for less”. It eliminates the time-consuming manual processes that prevent accountants from
delivering value-added activities to support strategic decision-making. Some companies report that they have
managed to almost completely eliminate human intervention from the accounts payable process by implement-
ing RPA. Therefore, these companies save about 65% to 75% of the time that was previously spent on manual
processing. Deloitte indicated that RPA can provide significant benefit if a process:
1. Is repetitive
2. Is rules-based
3. Is mid to high volume
4. Is prone to human error
5. Is seasonal or with unpredictable peaks
6. Requires out of office hours support (24/7)
7. Is lacking the business case for wider ERP system change
8. Is not a priority for the IT department
As RPA brings more technologically advanced solutions to businesses, it provides a competitive advantage by
helping companies to cut costs, drive efficiency and improve quality. Day-to-day transactions, such as accounts
receivable, accounts payable, billing, and journals, can become fully robotized with continuous control and real-
time monitoring on exceptions. RPA can be most effectively utilized in the following accounting processes:
Rethink Accounting Processes
1. Operational accounting
• Billing and collections
• Accounts receivable
2. General accounting
• Allocations and adjustments
• Journal entry processing
• Reconciliations
• Intercompany transactions
• Close
3. Financial and external reporting
4. Planning, budgeting and forecasting
5. Treasury processes
Source: EY, Robotic process automation in the Finance function of the future, 2016
RPA has reached a new level of maturity over the last decade and there are several products on the market that
have demonstrated their effectiveness. Because the RPA software is able to perform routine tasks by simulating

304
the way that humans interact with applications through a user interface, the implementation does not require
the fundamental process redesign usually linked to IT transformation. As RPA solutions require a shorter imple-
mentation time and carry lower risk than a large IT transformation, the investment costs are relatively insignifi-
cant compared to major IT platform updates.
Although RPA significantly reduces labor requirements across all routine accounting transactions, without care-
ful planning, all existing inefficiencies, duplications, and inconsistencies in the process could be repeated RPA.
Automation of these tasks with RPA can sometimes cause bottlenecks, limiting the benefits of implementation.
It is important to assess the existing accounting processes and identify the ideal candidate processes. Appendix J
lists the key steps to developing an automation strategy.
Cloud Computing
Cloud computing is a rapidly growing new area of the technology industry. The easiest way to envision cloud
computing is to think of it as doing all of your computing and business on the Internet, thus eliminating the need
for any in-house technology infrastructure or staff. All of the servers and software you need are ‘rented’ from
service providers, allowing you to focus on running the business instead of running a hardware center. Amazon,
for instance, a company most people think of strictly as a retailer, actually has an expanding business that focus-
es on providing computer resources for other companies. Instead of spending large amounts on processing
power, new startups can quickly sign up with Amazon and allocate computing resources around the world. Simi-
lar services are provided by Google, Microsoft, IBM, and countless others, employing cutting edge technology at
extremely competitive prices.
When embracing web-based inventory software, a small business must first develop a technology plan. This plan
should be based on a thorough review of the company’s existing computing resources and should focus on what
the business plans to do with technology. The plan should state the goals clearly, prioritize them, and tie them
to a budget and a timetable. The company must complete this prioritizing process before making any purchase
decisions. Once the company completes the technology plan, the second step is to match software products to
the company’s goals and objectives. The business should be flexible with the technologies and should consider
all available products on the market. At this point, the company can either handle the process with its own staff
or use consultants to expedite the process.
According to the NIST, cloud computing has the following characteristics:
Essential Characteristics
On-demand self-service
A consumer can unilaterally provision computing capabilities, such as server time and network storage, as needed automatically, without requiring human interaction with each service’s provider.
Broad network access
Capabilities are available over the network and accessed through standard mecha-nisms that promote use by heterogeneous thin or thick client platforms (e.g., mobile phones, tablets, laptops, and workstations).
Resource pooling
• The provider’s computing resources are pooled to serve multiple consumers us-
ing a multi-tenant model, with different physical and virtual resources dynami-
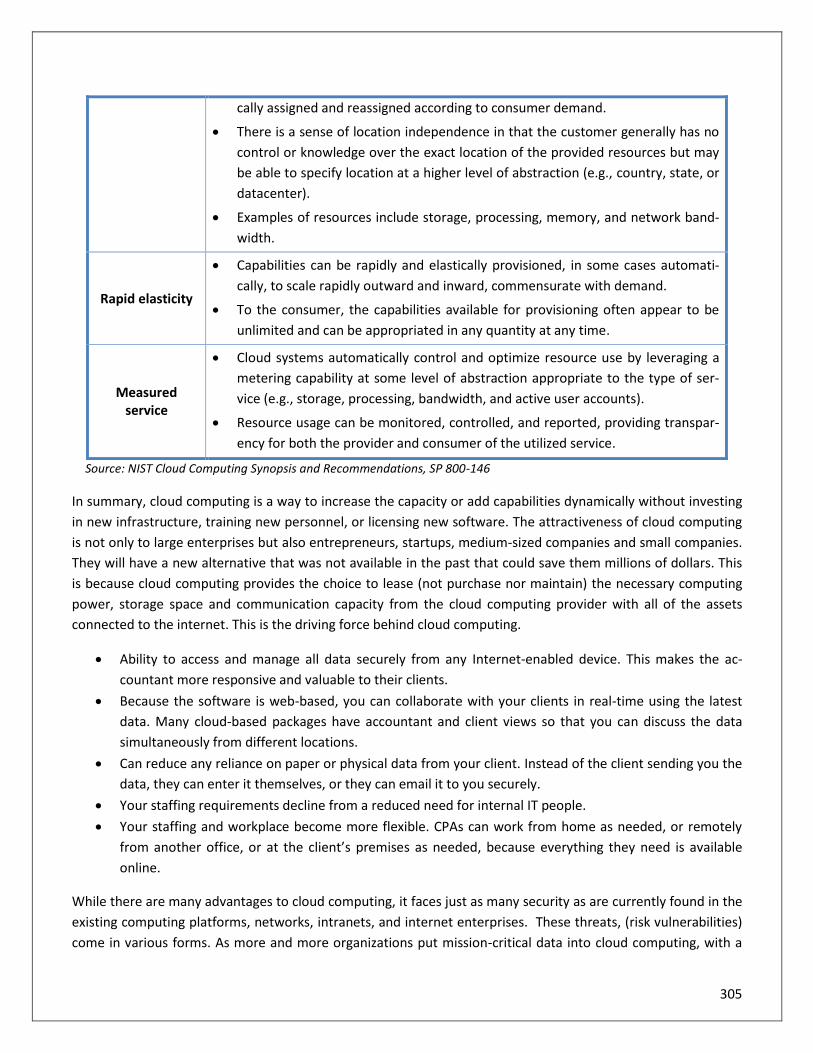
305
cally assigned and reassigned according to consumer demand.
• There is a sense of location independence in that the customer generally has no
control or knowledge over the exact location of the provided resources but may
be able to specify location at a higher level of abstraction (e.g., country, state, or
datacenter).
• Examples of resources include storage, processing, memory, and network band-
width.
Rapid elasticity
• Capabilities can be rapidly and elastically provisioned, in some cases automati-
cally, to scale rapidly outward and inward, commensurate with demand.
• To the consumer, the capabilities available for provisioning often appear to be
unlimited and can be appropriated in any quantity at any time.
Measured service
• Cloud systems automatically control and optimize resource use by leveraging a
metering capability at some level of abstraction appropriate to the type of ser-
vice (e.g., storage, processing, bandwidth, and active user accounts).
• Resource usage can be monitored, controlled, and reported, providing transpar-
ency for both the provider and consumer of the utilized service.
Source: NIST Cloud Computing Synopsis and Recommendations, SP 800-146
In summary, cloud computing is a way to increase the capacity or add capabilities dynamically without investing
in new infrastructure, training new personnel, or licensing new software. The attractiveness of cloud computing
is not only to large enterprises but also entrepreneurs, startups, medium-sized companies and small companies.
They will have a new alternative that was not available in the past that could save them millions of dollars. This
is because cloud computing provides the choice to lease (not purchase nor maintain) the necessary computing
power, storage space and communication capacity from the cloud computing provider with all of the assets
connected to the internet. This is the driving force behind cloud computing.
• Ability to access and manage all data securely from any Internet-enabled device. This makes the ac-
countant more responsive and valuable to their clients.
• Because the software is web-based, you can collaborate with your clients in real-time using the latest
data. Many cloud-based packages have accountant and client views so that you can discuss the data
simultaneously from different locations.
• Can reduce any reliance on paper or physical data from your client. Instead of the client sending you the
data, they can enter it themselves, or they can email it to you securely.
• Your staffing requirements decline from a reduced need for internal IT people.
• Your staffing and workplace become more flexible. CPAs can work from home as needed, or remotely
from another office, or at the client’s premises as needed, because everything they need is available
online.
While there are many advantages to cloud computing, it faces just as many security as are currently found in the
existing computing platforms, networks, intranets, and internet enterprises. These threats, (risk vulnerabilities)
come in various forms. As more and more organizations put mission-critical data into cloud computing, with a
306
loss of control the threats and attacks will increase. Cloud computing is in need of serious improvement, espe-
cially in terms of security. Moreover, most cloud vendors currently either do not have a privacy policy or have
non-transparent policies. According to the Cloud Security Alliance, here are the top five threats:
1. Data breaches
2. Weak identify, credential and access management
3. Insecure interfaces and application programming interfaces (APIs)
4. System and application vulnerability
5. Account hijacking
It is important to know that moving to cloud-based computing does not release organizations of their accounta-
bility to protect their corporate and customer data. Instead it changes the operating models and forces organi-
zations to address how they will share the responsibility with their providers and manage the risk. According to
the National Institute of Standards and Technology (NIST), policy and procedure-related technical security con-
trols are typically a consumer’s responsibility. Providers will likely offer input as to the feasibility and cost of en-
forcing these policies and procedures, especially if the provider has the responsibility to implement them. Oper-
ational class security controls, such as awareness and training, contingency planning, and incident response, are
usually the responsibility of a consumer. The provider plays a supporting role to help the consumer by offering
necessary documentation and evidence to meet these requirements.
Things to Consider Before Moving to Cloud-Based Services
Changing a work environment style is a large commitment, with long-lasting implications, and many different
options need to be considered before taking the plunge into cloud-based services:
Bandwidth. Does your office, home, or mobile environment provide enough bandwidth so that you can quickly
access everything online? Remember that as you move online, your reliance on high-speed connections are crit-
ical. The fear of not being able to access records instantly is one of the reasons that has slowed down the ac-
ceptance of cloud-based services in the accounting world. CPAs are worried that during critical work periods,
their internet access may be interrupted. However, with each year, this issue becomes less and less of a prob-
lem as internet providers become faster and more reliable, and alternative methods of accessing the Internet
develop.
Multiple access technologies. Think of sitting at your office and all of a sudden your electricity is cut off due to
power equipment maintenance down the street. What will you do? You may have a backup battery for your
desktop, or your laptop, but will you have Internet access? It makes sense to have redundant technologies to
access your vital cloud-based software. In this case, perhaps you could use your mobile phone as a wireless ac-
cess point, having your laptop connect via Wi-Fi to your smart phone and reaching the Internet via the mobile
phone data connection. Or perhaps there is a local coffee house or library where you could easily connect.
Data migration and access. Once you lock in with a service provider, how does this affect future compatibility
and data access? Are there easy ways to convert from one provider to another? Can the data be saved in a
standard database or other format? This problem is not very different from an in-house computer setup using

307
standalone software, but it presents itself as more of a problem if you become unhappy with a new service pro-
vider. It is always a good idea to think through data migration issues.
Security and uptime. Always test a new system thoroughly before making the change. Most vendors will pro-
vide at least 30-days free to evaluate their system. Use the time to implement the system and run test cases.
Make sure that the service provider has been tested by a third-party monitor, like McAfee Secure.

308
Chapter 15 Review Questions
1. What is the most typical sequence of the procure-to-pay (P2P) process?
A. Requisition Request -> Vendor Selection -> PO Issuance -> Goods Received -> Invoice Matched
B. Vendor Selection -> Requisition Request -> PO Issuance -> Invoice Matched -> Goods Received
C. Requisition Request -> PO Issuance -> Vendor Selection -> Goods Received -> Invoice Matched
D. Vendor Selection-> Requisition Request -> PO Issuance -> Goods Received -> Invoice Matched
2. Which of the following IT infrastructures is best at supporting a fast-growing company for a timely and accu-
rate closing?
A. Multiple systems are implemented throughout the business.
B. Consolidation is done primarily in a ledger with some Excel reporting.
C. Many elements of financial consolidation are automated.
D. Sub-ledger data is interfaced with GL, with some manual reconciliation.
3. How does robotic process automation (RPA) transform the accounts payable operations?
A. It allows the business to use shared applications on an as-needed basis.
B. It increases transparency to all transactions through a distributed ledger.
C. It reduces labor required across all routine (rules-based) transactions.
D. It creates new ways to analyze information of varying types, size, and volume.
309
Chapter 16: Performance Management
Learning Objectives
After completing this section, you will be able to:
• Recognize how companies use the Corporate Balanced Scorecard to evaluate performance
• Identify the most commonly used performance measures for the finance department
The Role of the CFO
CFOs are responsible for having a finger on the pulse of the organization and supplying important insights to the
whole business. The use of the right measurements can help CFOs do this effectively. To choose the right meas-
urements, CFOs need to understand the organization’s goals, various techniques to evaluate it’s performance,
and key activities associated with the processes. These measurements provide a basis for improving accountabil-
ity over operations and evaluating the success of an organization towards the achievement of its goals. They
help management in understanding current levels of performance and in identifying improvements that serve as
useful instruments for developing future targets.
The most common methodology used in structuring the performance management is the “Balanced Scorecard”.
The most challenging aspect in performance measurement is to identify the right key performance indicators for
the business(es). This chapter explores the anatomy of balanced scorecard, to assist CFOs in creating an action
plan to move them from an organization of reporting to an organization that drives business performance with
key performance indicators. It also discusses some common performance measures used by accounting profes-
sionals.
Balanced Scorecard
The Concept of Balanced Scorecard
The traditional approach to monitoring organizational performance has focused on financial measurements and
outcomes. Increasingly, companies have realized that such measures alone are not sufficient. As a result, many

310
companies have developed more comprehensive scoring systems, such as a balanced scorecard. A balanced
scorecard is a set of performance measures (financial or non-financial), constructed for the dimensions of per-
formance: financial, customer, internal process, and learning and growth.
Having financial measures is critical even if they are backward looking. After all, they have a great effect on the
evaluation of the company by shareholders and creditors. Customer measures examine the company's success
in meeting customer expectations. For example, a criterion that requires all customer inquiries to be answered
within 7 days of receipt permits an accurate measurement of performance. Internal process measures examine
the company's success in improving critical business processes. And learning and growth measures examine the
company's success in improving its ability to adapt, innovate, and grow. The customer inquiries, internal pro-
cesses, and learning and growth measures are generally thought to be predictive of future success (i.e. they are
not backward looking).
A variety of potential measures for each dimension of a balanced scorecard are indicated in Figure 16-1. After
reviewing these measures, note how "balance" is achieved:
• Performance is assessed across a balanced set of dimensions (financial, customer, internal processes,
and innovation).
• Quantitative measures (e.g. number of defects) are balanced with qualitative measures (e.g. ratings of
customer satisfaction).
• There is a balance of backward-looking measures (e.g. financial measures like growth in sales) and for-
ward-looking measures (e.g. number of new patents as an innovation measure).
Vision & Strategy
Financial To succeed
financially, how do we appear to shareholders?
CustomerTo achieve our vision,
how do we meet customer
expectations?
Internal Business Processes To satisfy
shareholders and customers, what
business processes must we excel at?
Learning & Growth To achieve our vision how will we sustain our ability to change
and improve?

311
Figure 16-1
Balanced Scorecard
Perspective Measures
Financial
Return on assets
Sales growth
Cash flow from operations
Reduction of administrative expense
Investment center performance such as ROI and residual income
Customer
Number of warranty claims
Customer satisfaction
Customer royalty
Customer retention
New customer acquisition
Market share
On-time delivery
Time to fill orders
Internal Processes
Productivity
Manufacturing cycle time
Throughput
Manufacturing cycle efficiency (MCE)
Defect rate
Lead time
Number of suppliers
Material turnover
Percent of practical capacity
Learning and Growth
Amount spent on employee training
Employee satisfaction
Employee retention
Employee empowerment
Number of new products
New product sales as a percent of total sales
Number of patents
Product innovation
Information systems capabilities
Each perspective is discussed in the following sections;
The Four Dimensions of Performance
Financial Perspective
The primary goal of every profit-making enterprise is to show a profit. Profit allows the enterprise to provide a
return on investment (ROI) to investors, to repay creditors, and to adequately compensate management and
employees. Critical success factors under this perspective include sales, costs, measures of profit such as operat-

312
ing income and segment margin, and measures of investment center performance such as ROI and residual in-
come. However, under the balanced scorecard approach, financial performance is seen in the larger context of
the company's overall goals and objectives relating to its customers and suppliers, internal processes, and em-
ployees.
Customer Perspective
Many successful businesses have found that focusing on customers and meeting or exceeding their needs is
more important in the long run than simply focusing on financial measures of performance. After all, it is the
customer who ultimately incurs the costs of producing products and contributes to a company's profits. Consid-
ering the customer perspective is therefore key to attaining the financial goals of a company. Critical success
factors under this perspective are likely to include improving the quality of products and services, reducing de-
livery time, and increasing customer satisfaction.
Measures of performance appropriate under this perspective include the number of warranty claims and re-
turned products (for quality), customer response time and the percentage of on-time deliveries (for reducing
delivery time), and customer complaints and repeat business (for customer satisfaction). A second dimension of
the customer perspective focuses on the critical success factors of increasing market share and penetrating new
markets. Focusing on the customer perspective can result in impressive financial returns. For example, at Ford, a
1-percentage-point increase in customer loyalty results in significant increases in sales and profits.
Internal Business Perspective
Internal process measures examine the company's success in improving critical business processes. And learning
and growth measures examine the company's success in improving its ability to adapt, innovate, and grow. The
customer, internal processes, and learning and growth measures are generally thought to be predictive of future
success (i.e. they are not backward looking). The internal process measures are linked to the financial perspec-
tive through their emphasis on improving the efficiency of manufacturing processes, and to the customer per-
spective through focus on improving processes and products to better meet customer needs. Every company
will approach this perspective differently, because the processes that add value to products and services are
likely to differ by company.
Learning-and-Growth Perspective
The learning-and-growth perspective links the critical success factors in the other perspectives and ensures an
environment that supports and allows the objectives of the other three perspectives to be achieved. If learning
improves, internal business processes will improve, leading to increased customer value and satisfaction and,
ultimately, to better financial performance. Critical success factors center on three areas. The first is the efficient
and, effective, use of employees (employee empowerment). Measures include improving employee morale, in-
creasing skill development, increasing employee satisfaction, reducing employee turnover, and increasing the
participation of employees in the decision-making process. The second critical success factor is increasing infor-
mation systems capabilities through improving the availability and timeliness of information. The third critical
success factor involves measures of product innovation, such as increasing the number of new products, new
patents, and so on. Figure 16-2 presents examples of balanced scorecard measures by industry.

313
Figure 16-2
Examples of Balanced Scorecard Measures by Industry
Industry
Financial Dimension
Customer Dimension
Internal Business Process Dimension
Learning and Growth Dimension
Airlines Return on assets Frequent flier program participation rates
Percentage of on-time takeoffs and arrivals
Labor contract length
Consumer retail banks
Ratio of assets to debt
Number of new accounts opened
Number of new branches
Hours of employee training completed
Accounting, consulting, and law firms
Profit margin Client retention rate Percentage of projects completed on time
Certification and education levels of professionals
Computer manufacturers
Sales growth from new products
Number of corporate customers
Number of product defects
Percentage of factory employees who completed quality control training
Supermarkets Inventory turnover
Customer satisfaction
Product spoilage rates
Employee turnover rates
The balanced scorecard measures have been successfully adapted for use by many sectors, including not-for-
profit and public sector organizations. The widespread adoption of the balanced scorecard is due to its flexibility,
and many companies have implemented their own variations to suit their strategic purposes. For example, the
Tesco ‘Steering Wheel’ includes five perspectives, capturing their commitment to the community in addition to
their financial, customer, operations, and people aspects. When implemented properly, the balanced scorecard
can be used to align measures, actions, and rewards to create a proper focus on the execution of strategic initia-
tives and achievement of strategic objectives, rather than a sole focus on the annual budget.
In order to effectively judge the performance of a manager, an organization should rely on a combination of the
most important measures to that organization which should cover multiple dimensions.
An effective balanced scorecard structure is derived from a series of actionable numeric measures called key
performance indicators. Details about how to choose the right key performance indicators are discussed in the
following section.

314
Key Performance Indicators
The Development of Performance Measures
Key performance indicators, also known as KPIs, are a fantastic way to help businesses, and especially CFOs,
show value beyond traditional reports. A KPI is a measure used to reflect organizational success or progress in
relation to a specified goal. The purpose of KPIs is to monitor progress towards accomplishing the strategic ob-
jectives that are typically communicated in a strategy map. KPIs are typically included in a reporting scorecard or
dashboard that enables top management, the board or other stakeholders to focus on the metrics deemed most
critical to the success of an organization. Thus, good KPIs help management navigate between processes and
show whether an organization is achieving its goals. Key performance indicators have the following features:
• Linked to business strategy and goals
• Understandable, measurable, realistic, and meaningful
• Provides a common language for communication
• Provides an objective way to determine if strategy is working
• Informs management and employees about the efficiency of the department
• Ensures that the focus of employees is aligned with the goals of the organization
Steps involved in developing KPIs include:
1. Define the business processes.
2. Identify requirements for each process.
3. Clarify the roles and responsibilities of each process owner.
4. Establish goals/objectives and strategies.
5. Develop strategies (measurable and easy to communicate).
6. Select the appropriate measures (quantitative/qualitative).
7. Set the targeted results.
8. Select the appropriate automation tool.
9. Collect and analyze performance.
10. Investigate variance.
The KPI selection depends on what is important to each department. For example, the KPIs that are meaningful
to finance will differ from the KPIs assigned to marketing. To monitor the performance of the finance depart-
ment, CFOs should ensure that the KPIs provide the following key information:
• The reliability of the information and the effectiveness of the internal control systems,
• The time taken to report the financial data and deliver management information, and
• The insights provided by the data generated.
Once the KPIs are selected, they should be tracked in a real-time reporting tool. The KPI dashboard collects, or-
ganizes, and visualizes the key performance metrics, which enables organizations to access, develop, monitor,

315
and analyze data from KPIs in real-time. As a result, accounting leaders are able to make goal-oriented decisions.
In addition, a timely KPI dashboard helps to instantly identify problem areas and resolve them.
Performance Measures that Every CFO Should Know
Well-designed KPIs can provide a means for management and the board to monitor the core activities of the
business, rather than simply measures of financial success. Integration of financial and non-financial KPIs can
contribute to a greater focus on long-term success rather than short-term financial performance. CFOs may con-
sider selecting suitable KPIs from the following commonly used measures based on departmental strategies and
goals.
Accounts Receivable
• Days to set up a new account
• Days sales outstanding
• Late statement rate
• Billing error rate
• The collection costs as a percentage of receivables
• Delinquent accounts per collection employee
• The amount of receivables turned over to a collection agency
• The cases that have been forwarded to litigation
Inventory
• Inventory accuracy rate (e.g. physical inventory/accounting data of stocks)
• Average inventory levels
• Inventory turnover
• Days inventory outstanding
• Order fill rate (e.g. the number of orders filled/total number of orders)
• Stock-to-sales ratios
• Stock coverage (number of days the company can operate with current inventory level)
• Backorder rate (number of orders delayed/total number of orders placed)
• Cost of backorders
• Measures of stock out
• Measures of overstock
• Inventory shrinkage
• On-time supplier delivery rate
• Undamaged supplier shipment rate
• Return rates (number of returns by customers/total demand)
• Cancellation rate (number of order cancelled/total demand)
• Capacity utilization

316
Accounts Payable
Operational Efficiency
• Invoice cycle time (from receipt to payment)
• Cost per invoice
• Percentage of invoices received on paper, email, and e-Invoice
• Percentage of invoices paid within the agreed timelines
• Percentage of invoice paid early
• Number of invoices processed per accounts payable employee
• Number of expense reports processed in a week/month
• Time taken to resolve an error/discrepancy
Payment Process
• Percentage of payments with PO and Non-PO
• Discounts for early payments
• Discounts lost due to late payments
• Number of emergency payments
• Number of electronic payments
• Days payable outstanding
• Purchase order payment per accounts payable employee
• Non purchase order payment per accounts payable employee
• Percentage of expense report check
Control and Compliance
• Vendor invoice error rate
• Vendor payment error rate
• Expense report error rate
• Number of duplicate vendors
• Number of duplicate payments
• Percentage of invoice accuracy
• Percentage of vendor checks reissued
Period-Closing
• Number of days required to close the books
• Number of days required to create finalized financial reports
• Percentage of general ledger accounts reconciled
• Percentage of accounts required reconciled
• Number of adjusting entries
• Staff work hours
General Measures
• Finance headcount ratio

317
• Finance report error rate
• Percentage of automated reporting from accounting system
• Percentage of policies and procedures up-to-date
• Number of days to complete forecast
• Number of days to complete budget
• Finance expense as a percentage of total revenue
• Systems per process
• Reports produced per finance employee
• Time taken to respond to inquires
• Percentage of input errors detected
• Errors reported by external partners (e.g., vendor, customer, auditors)
• Percentage of audit finding resolved by deadline
• Percentage of audit recommendation implemented
• Percentage of KPIs achieved
• Internal complaints received
• Internal customer satisfaction with accounting services
• Percentage of professional development plans completed
• Percentage of performance goals achieved
• Employee retention rate
• Number of website visits
Benchmarking
Benchmarks are goals to aim for. Benchmarking is the process of comparing an organization's products, services
or processes against those considered to be the best in a particular industry or market segment. For example, an
accounting department benchmark survey enables objective comparison of the finance function with external
peers and helps best practice gap analysis. Benchmarking typically involves the following steps:
1. Identify those practices needing improvement.
2. Identify an organization that is the world leader in performing the process.
3. Interview the managers of the organization and analyze the data obtained.
Benchmarking procedures should include:
• Identifying a particular product, service, procedure, or function that could be improved,
• Creating a benchmarking team,
• Targeting a particular organization or group of organizations having characteristics that would be most
suitable for analysis,
• Evaluating practices, procedures, and functions within a given market that are the most productive, and
then adapting and implementing those that would be most useful to the target organization.
Benchmark(s) may be financial or non-financial. For example, the labor rate of a competitor, the cost per pound
of a product at the company’s most efficient plant, or the cost of a training program is considered a financial
benchmark. While the percentage of orders delivered on time at the company’s plant is an example of a non-

318
financial benchmark. Examples of non-financial measures are defect rates, number of patents, and number of
customer complaints.
The following table illustrates benchmark data for a finance department:
Comparison of Performance Metrics: Average vs. World-class Companies
Performance Metric Average World-Class
Cost as % of revenue 1.4% 0.97%
Processing locations >3 1
Systems per process 2-3 1
Budget cycle 95 days 60 days
Closing cycle 5-8 days <4 days
Source: The Hackett Group
Note: The performance metric and benchmark data are changed from time to time due to rapid growth in tech-
nologies and new business landscape.

319
Chapter 16 Review Questions
1. Which of the following measures would be most useful to a CFO in evaluating a company’s financial perfor-
mance?
A. Return on assets
B. Manufacturing cycle time
C. Productivity
D. System Efficiency
2. Which of the following key performance indicators (KPI) is used to evaluate the performance of accounts
payable?
A. Rate of internal job hires
B. Product performance
C. Profit margin on sales
D. Vendor payment error rate
3. What is an example of a non-financial benchmark?
A. The labor rate of comparably skilled employees at a major competitor’s plant
B. The percentage of customer orders delivered on time at the company’s most efficient plant
C. The average actual cost per pound of a specific product at the company’s most efficient plant
D. A $50,000 limit on the cost of employee training programs at each of the company’s most efficient plant

320
Chapter 17: Modern Finance Organizations
Learning Objectives
After completing this section, you will be able to:
• Recognize the characteristics of an evolving finance organization
• Identify the elements of internal control systems
• Recognize the limitations of internal controls
The Role of the CFO
Organizations are in a state of continuous change, and CFOs need understanding and experience beyond the
basic finance function to identify areas for growth and operational excellence across all business domains. CFOs
do much more than crunch numbers. The enlargement of their role requires financial and business insights that
go beyond spreadsheets and quarterly results. Many CFOs are successfully responding to these challenges, and
in the process, are making themselves strategic business partners in their organizations. The first part of this
chapter focuses on the practices that today’s best-in-class CFOs follow.
CFOs are responsible for not only managing the company’s general accounting functions, but also controlling
company assets and ensuring the reliability of financial reporting. Much of the internal control structure flows
through the accounting and finance areas of the organization under the leadership of the CFO. Thus, one of the
key functions that the CFO performs is to ensure that an effective system of controls is in place so that reasona-
ble confidence exists for the effectiveness and efficiency of operations, reliability of financial reporting, and
compliance with applicable laws and regulations. Such a system is ultimately a key component in the develop-
ment of a successful finance organization. The second part of this chapter shares insights into building an effec-
tive internal control framework.
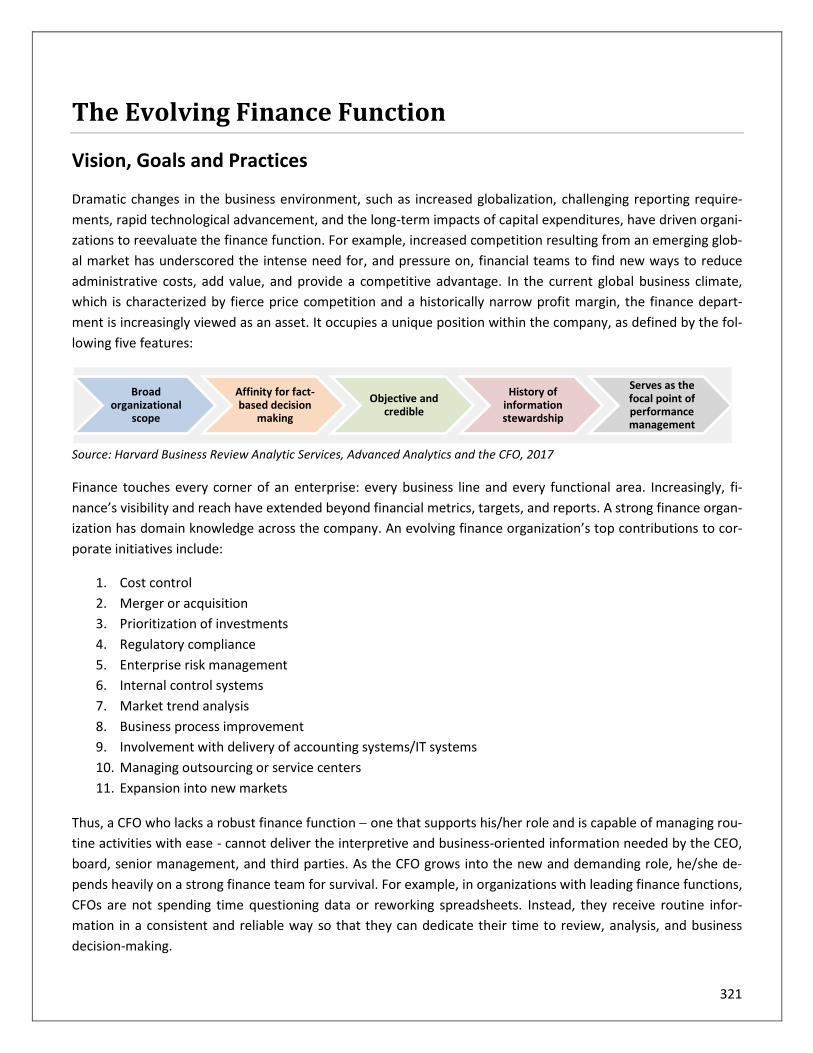
321
The Evolving Finance Function
Vision, Goals and Practices
Dramatic changes in the business environment, such as increased globalization, challenging reporting require-
ments, rapid technological advancement, and the long-term impacts of capital expenditures, have driven organi-
zations to reevaluate the finance function. For example, increased competition resulting from an emerging glob-
al market has underscored the intense need for, and pressure on, financial teams to find new ways to reduce
administrative costs, add value, and provide a competitive advantage. In the current global business climate,
which is characterized by fierce price competition and a historically narrow profit margin, the finance depart-
ment is increasingly viewed as an asset. It occupies a unique position within the company, as defined by the fol-
lowing five features:
Source: Harvard Business Review Analytic Services, Advanced Analytics and the CFO, 2017
Finance touches every corner of an enterprise: every business line and every functional area. Increasingly, fi-
nance’s visibility and reach have extended beyond financial metrics, targets, and reports. A strong finance organ-
ization has domain knowledge across the company. An evolving finance organization’s top contributions to cor-
porate initiatives include:
1. Cost control
2. Merger or acquisition
3. Prioritization of investments
4. Regulatory compliance
5. Enterprise risk management
6. Internal control systems
7. Market trend analysis
8. Business process improvement
9. Involvement with delivery of accounting systems/IT systems
10. Managing outsourcing or service centers
11. Expansion into new markets
Thus, a CFO who lacks a robust finance function − one that supports his/her role and is capable of managing rou-
tine activities with ease - cannot deliver the interpretive and business-oriented information needed by the CEO,
board, senior management, and third parties. As the CFO grows into the new and demanding role, he/she de-
pends heavily on a strong finance team for survival. For example, in organizations with leading finance functions,
CFOs are not spending time questioning data or reworking spreadsheets. Instead, they receive routine infor-
mation in a consistent and reliable way so that they can dedicate their time to review, analysis, and business
decision-making.
Broad organizational
scope
Affinity for fact-based decision
making
Objective and credible
History of information stewardship
Serves as the focal point of performance management

322
World-class finance teams provide timely and insightful intelligence by taking a systematic approach that aligns
the organization, process, people and technology. Although the techniques used vary depending on the organi-
zation's size and culture, the goals, practices, and success factors outlined below are instrumental in the organi-
zation achieving its vision based on the GAO’s executive guide.
Vision: To be a Value-Creating, Customer-Focused Partner in Business Results
Success Factors
• Leadership
• Culture
• Organization
• Customer
• Technology
• Process People
Goals Make finance function an entity-wide priority
Redefine the role of finance
Build a team that delivers results
Provide meaningful information to deci-sion- makers
Practices
− Build a foundation of control and ac-countability
− Provide clear and strong leadership
− Use training to change the culture and engage line managers
− Assess the finance team’s current role in meeting mission objectives
− Maximize the effi-ciency of daily ac-counting activities
− Organize finance to add value
− Develop systems that support the partner-ship between finance and operations
− Re-engineer processes in conjunction with new technology
− Translate financial data into meaningful information
− Develop a finance team with the right skills and compe-tencies
− Build a finance team that attracts and retains talent
GAO/AIMD-00-134
Although the transformation strategies depend on size, cultures, goals, objectives, and industries, some of the
most common ones are listed below:
Financial Goal Objectives
Efficient transaction processing
• Cost efficiency and productivity through increased automation and integrated transaction systems
• Self-service enablement for customers, vendors, employees, via the internet
• Customer service and efficiency through shared service organizations
• Outsourcing of non-critical, back-office processes
Improved reporting & decision support
• Reduced cycle times for key reporting requirements
• Consistent and streamlined underlying data sources, such as global chart of ac-counts, thin general ledger, data warehouses, as “one source of the truth”
• Standardized reporting formats, definitions, common finance language
• Planning and forecasting processes linked to enterprise-level strategies and tar-gets
Simplified business model
• Rationalized legal entity and reporting structures
• Streamlined reporting environment and requirements
• Standardized policies, procedures and processes
• Centralized business models (reduced redundancy and leveraging economies of scale)
• Integrated acquisitions
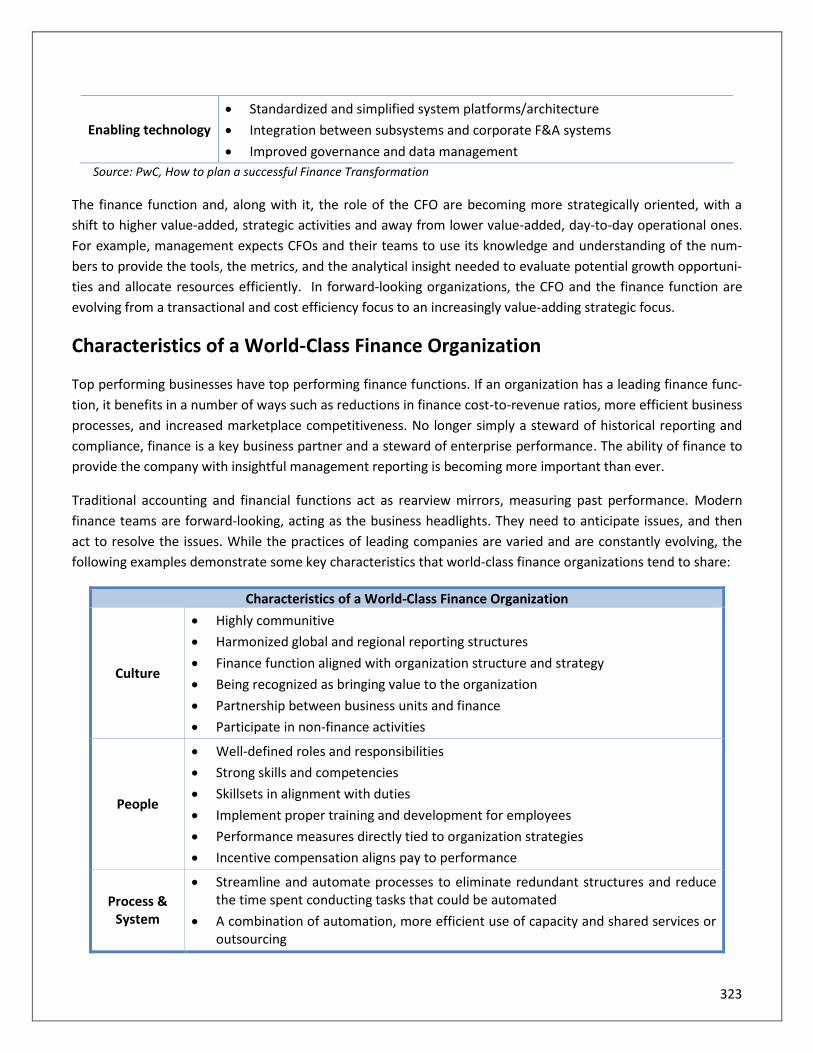
323
Enabling technology
• Standardized and simplified system platforms/architecture
• Integration between subsystems and corporate F&A systems
• Improved governance and data management
Source: PwC, How to plan a successful Finance Transformation
The finance function and, along with it, the role of the CFO are becoming more strategically oriented, with a
shift to higher value-added, strategic activities and away from lower value-added, day-to-day operational ones.
For example, management expects CFOs and their teams to use its knowledge and understanding of the num-
bers to provide the tools, the metrics, and the analytical insight needed to evaluate potential growth opportuni-
ties and allocate resources efficiently. In forward-looking organizations, the CFO and the finance function are
evolving from a transactional and cost efficiency focus to an increasingly value-adding strategic focus.
Characteristics of a World-Class Finance Organization
Top performing businesses have top performing finance functions. If an organization has a leading finance func-
tion, it benefits in a number of ways such as reductions in finance cost-to-revenue ratios, more efficient business
processes, and increased marketplace competitiveness. No longer simply a steward of historical reporting and
compliance, finance is a key business partner and a steward of enterprise performance. The ability of finance to
provide the company with insightful management reporting is becoming more important than ever.
Traditional accounting and financial functions act as rearview mirrors, measuring past performance. Modern
finance teams are forward-looking, acting as the business headlights. They need to anticipate issues, and then
act to resolve the issues. While the practices of leading companies are varied and are constantly evolving, the
following examples demonstrate some key characteristics that world-class finance organizations tend to share:
Characteristics of a World-Class Finance Organization
Culture
• Highly communitive
• Harmonized global and regional reporting structures
• Finance function aligned with organization structure and strategy
• Being recognized as bringing value to the organization
• Partnership between business units and finance
• Participate in non-finance activities
People
• Well-defined roles and responsibilities
• Strong skills and competencies
• Skillsets in alignment with duties
• Implement proper training and development for employees
• Performance measures directly tied to organization strategies
• Incentive compensation aligns pay to performance
Process & System
• Streamline and automate processes to eliminate redundant structures and reduce the time spent conducting tasks that could be automated
• A combination of automation, more efficient use of capacity and shared services or outsourcing

324
• Focus on planning & decision making (vs. transactional processing)
• Apply risk-based authorization
• Scorecards linked with strategic goals and objectives
• Visibility of operational and financial performance
• Deploy cost-effective technological solutions
• Fully integrated systems (e.g. single ERP system)
• Embedded application controls
Building Effective Internal Control Systems
The post-Sarbanes-Oxley Act and corruption era, together with the increasing demands for disclosure, analysis,
and documentation from external regulators and stakeholders, have increased the need for CFOs to perform
compliance and internal control activities. Internal controls are the procedures and methods used to support
companies in achieving their performance and profitability targets and preventing the loss of resources/assets.
They are also used to ensure financial reporting is accurate and reliable and that the company is compliant with
regulations and laws. In other words, internal controls help the company achieve its goals while limiting the in-
ternal and external risks and threats CFOs are likely to encounter. This section highlights the internal control
principles such as key components of internal control systems, some limitations of controls, and types of con-
trols.
Elements of Internal Control Systems
Each element of an internal control system is discussed below:
Internal Control Systems
Control Environ-
ment
Risk Assessment
Control Activities
Information &
Communi-cation
Monitoring

325
Control Environment
The control environment is sometimes referred to as the “tone at the top” of the organization, meaning the in-
tegrity, ethical values, and competence of the entity’s people such as:
• Management’s philosophy and operating style
• The way management assigns authority and responsibility and organizes and develops its people
• The attention and direction provided by the board of directors
The control environment is the foundation for all other components of internal control, providing discipline and
structure, and influencing the control consciousness of all its employees.
The CEO has ultimate responsibility and “ownership” of the internal control system. The individual in this role
sets the tone at the top that affects the integrity, ethics and other factors that create the positive control envi-
ronment needed for the internal control system to thrive. If the CEO does not demonstrate strong support for
internal controls, the organization as a whole will be unlikely to practice good internal controls.
CFOs are responsible for supervising the preparation of accounting records, producing financial reports and
demonstrating compliance with applicable laws and regulations. Because of their vital responsibilities, CFOs
should be knowledgeable about both control procedures and the integrated internal control framework as a
whole. CFOs need to work closely with the CEO to foster a positive control environment. Examples of principles
that help CFOs establish and maintain an environment that sets a positive attitude toward internal control in-
clude:
1. Establishing an organizational structure, assigning responsibility, and delegating authority to achieve the
organization’s objectives
2. Demonstrating a commitment to recruit, develop, and retain competent individuals
3. Evaluating performance and holding individuals accountable for their internal control responsibilities
Risk Assessment
The design of internal controls to fit an organization’s needs begins with a risk assessment process. Risk assess-
ment is the identification and analysis of relevant risks that threaten the achievement of an organization’s objec-
tives and goals. Risk assessment should begin at the top of the organization and reach down in an organized
fashion to the department level and to particular activities and processes within each department.
This component should address the risks, both internal and external, that must be assessed. Before conducting a
risk assessment, objectives must be set and linked at different levels. Details of risk assessment process are dis-
cussed in Chapter 11 - The Risk Assessment Process.

326
Control Activities
Control activities are the policies and procedures designed by management to help ensure that the organiza-
tion’s objectives and goals are not negatively impacted by internal or external risks. They occur throughout the
organization at all levels, in all functions. Control activities may be classified into the following categories:
• Performance reviews, including comparisons of actual performance with budgets, forecasts, and prior-
period results.
• Information processing. Controls relating to information processing are generally designed to verify ac-
curacy, completeness, and authorization of transactions. Specifically, controls may be classified as gen-
eral controls or application controls. The former might include controls over data center operations, sys-
tems software acquisition and maintenance, and access security; the latter apply to the processing of
individual applications and are designed to ensure that transactions that are recorded are valid, author-
ized, and complete.
• Physical controls, which involve adequate safeguards over the access to assets and records, include au-
thorization for access to computer programs and files and periodic counting and comparison with
amounts shown on control records.
• Segregation of duties, which is designed to reduce the opportunities to allow any person to be in a posi-
tion both to perpetrate and to conceal errors or irregularities (fraud) in the normal course of his or her
duties, involves assigning different people the responsibilities of authorizing transactions, recording
transactions, and maintaining custody of assets.
Information and Communication
Information systems within an organization are components that address the need to identify, capture, and
communicate information to the right people to enable them to carry out their responsibilities, and are key to
this element of internal control. The information system generally consists of the methods and records estab-
lished to record, process, summarize, and report entity transactions and to maintain accountability of related
assets, liabilities, and equity. Internal information, as well as external events, activities, and conditions, must be
communicated to enable management to make informed business decisions and for external reporting purpos-
es. Communication also involves an understanding of the individual roles and responsibilities pertaining to in-
ternal control.
Monitoring
Monitoring is management’s process of assessing the quality of internal control performance over time. Accord-
ingly, management must assess the design and operation of controls on a timely basis and take the necessary
corrective actions. In other words, monitoring determines whether or not policies and procedures designed and
implemented by management are being conducted effectively by employees. Monitoring also helps ensure that
significant control deficiencies are identified and rectified in a timely manner. Examples of monitoring controls
include internal audits, management reviews, audit committee activities, disclosure committee activities, and
self-assessment reviews. In summary, monitoring activities should address the following issues:
327
• Are controls in place and operating effectively?
• Is the system working as designed?
• Are exceptions and problems identified and resolved promptly?
• Are the controls periodically reviewed?
Limitations of Internal Controls
Internal controls provide reasonable but not absolute assurance about the organization’s achievement of its
goals and objectives due to the limitations inherent in all internal control systems. Some of the most common
limitations are human error, collusion and management override, and cost-benefit relationships.
Human judgment in decision making can be faulty and breakdowns in internal control can occur because of hu-
man error; for example, there may be an error in the design of, or in the change to, a control. Equally, the opera-
tion of a control may not be effective, such as when an exception report is not effectively used because the indi-
vidual responsible for reviewing the information does not understand its purpose or fails to take appropriate
action.
Additionally, controls can be circumvented by the collusion of two or more people or inappropriate manage-
ment override of internal control. For example, management may enter into undisclosed agreements with cus-
tomers that modify the terms and conditions of the company’s standard sales contracts, which may result in im-
proper revenue recognition.
Finally, the design of the internal control system is a function of the resources available, meaning that there
must be a cost-benefit analysis in the design of the system. Considerations of cost-benefit analysis are discussed
in the section “Cost-Benefit Relationships”.
Types of Internal Controls
Preventive Controls
While detecting errors and frauds once they occur is essential to all industries, it is obviously best to prevent it
before it happens. Preventive controls are designed to prevent the occurrence of failures, inefficiencies, errors,
and weaknesses. For that reason, preventative controls are proactive controls operating during the course of an
activity or during the execution of an employees' duties. Preventive controls should be focused on areas where
the likelihood and/or impact of errors and fraud are highest. Although preventive controls cannot ensure that
errors and fraud will not be committed, they serve as the first line of defense to minimize the risk of a control
breach. For example, if effective preventive controls are in place and well-known to potential fraud perpetra-
tors, they will serve as strong deterrents to discourage those who may be tempted to commit fraud. Fear of get-
ting caught is always a strong deterrent. Examples of controls to prevent irregularities include:
1. Implementing procedures and controls (e.g., anti-fraud strategy, standards of conduct)
2. Providing fraud-awareness trainings
3. Implementing policies that provide for the appropriate segregation of duties
4. Leaving space on the checks since a check is more difficult to tamper with if it has more characters
328
5. Securing the check stock in a locked area with restricted access
6. Implementing assets access control
7. Conducting employee background checks
8. Implementing automated controls such as transaction limits, system edit checks, data matching (eligibil-
ity verification)
9. Conducting predictive analysis
Detective Controls
The risk of fraud can never be eliminated entirely. There are always people who are motivated to commit fraud,
and an opportunity can arise for overriding a control or collusion with others. Detective controls are designed to
detect and correct failures, inefficiencies, errors, and weaknesses. They operate after an event has occurred or
an output has been produced. However, they should reduce the risk of undesirable consequences as they ena-
ble remedial action to be taken. Therefore, detective controls should be adaptable, flexible, and continuously
changing to address the various changes in risks. Sometimes it is more effective to detect and address certain
types of fraud after it occurs rather than trying to prevent it before it occurs.
Detective controls are most effective for areas where the likelihood of fraud is low but potential impact is se-
vere. Such controls can also help assess the effectiveness of preventive controls. Examples of detective controls
include:
1. Surprise audits in high fraud risk and/or high errors areas
2. Reconciliation of accounting transactions with supporting documentation at random intervals
3. Ad hoc audits and analyses
4. Perform bank reconciliations
5. Document reviews
6. Inspect goods received
7. Continuous monitoring of critical data and related trends to identify unusual variance
8. Data analysis and ratio analysis to identify any abnormal trends or patterns
9. Automated system flags (e.g., disbursement over a certain dollar amount, excessive number of purchase transactions to a single vendor)
The following graphic encompasses control activities to prevent, detect, and respond to errors, irregularities,
and fraud risks. These control activities are interdependent and mutually reinforcing. For example, a surprise
inventory count as a detective activity also serve as a deterrent because they create the perception of controls
and the possibility of punishment which discourages fraudulent behavior. Response efforts can inform preven-
tive activities. For instance, the results of investigations can also be used to enhance applicant screenings and
fraud indicators.
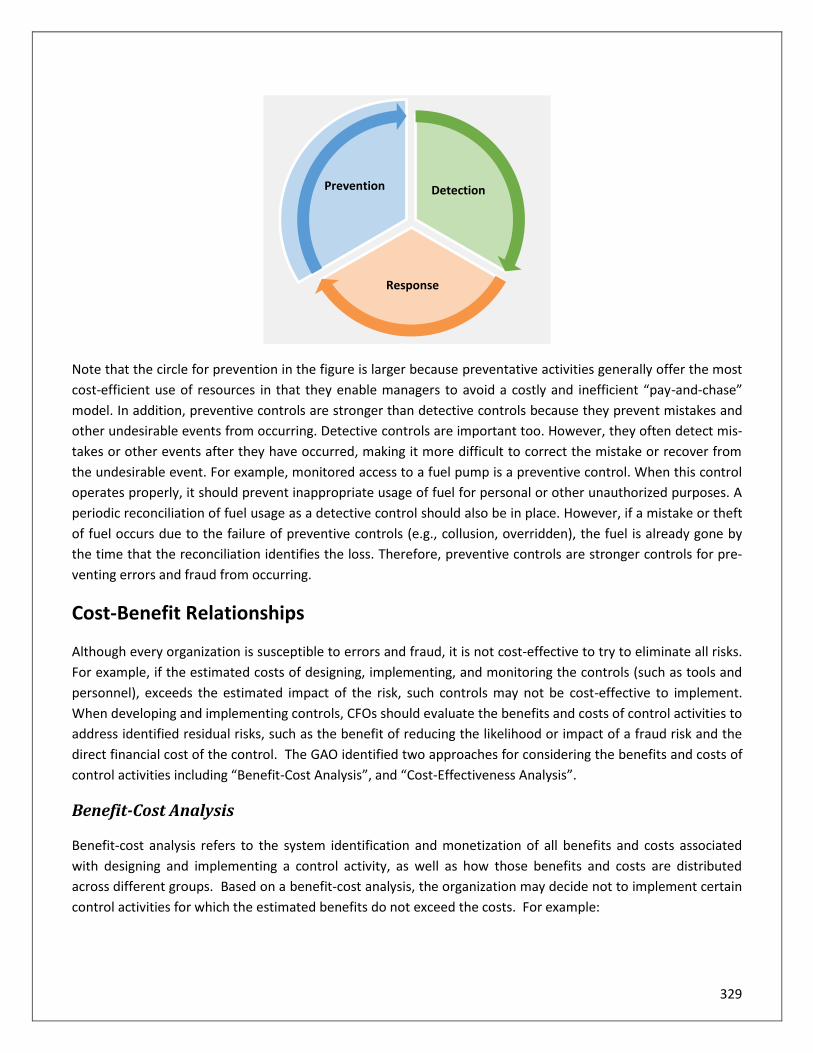
329
Note that the circle for prevention in the figure is larger because preventative activities generally offer the most
cost-efficient use of resources in that they enable managers to avoid a costly and inefficient “pay-and-chase”
model. In addition, preventive controls are stronger than detective controls because they prevent mistakes and
other undesirable events from occurring. Detective controls are important too. However, they often detect mis-
takes or other events after they have occurred, making it more difficult to correct the mistake or recover from
the undesirable event. For example, monitored access to a fuel pump is a preventive control. When this control
operates properly, it should prevent inappropriate usage of fuel for personal or other unauthorized purposes. A
periodic reconciliation of fuel usage as a detective control should also be in place. However, if a mistake or theft
of fuel occurs due to the failure of preventive controls (e.g., collusion, overridden), the fuel is already gone by
the time that the reconciliation identifies the loss. Therefore, preventive controls are stronger controls for pre-
venting errors and fraud from occurring.
Cost-Benefit Relationships
Although every organization is susceptible to errors and fraud, it is not cost-effective to try to eliminate all risks.
For example, if the estimated costs of designing, implementing, and monitoring the controls (such as tools and
personnel), exceeds the estimated impact of the risk, such controls may not be cost-effective to implement.
When developing and implementing controls, CFOs should evaluate the benefits and costs of control activities to
address identified residual risks, such as the benefit of reducing the likelihood or impact of a fraud risk and the
direct financial cost of the control. The GAO identified two approaches for considering the benefits and costs of
control activities including “Benefit-Cost Analysis”, and “Cost-Effectiveness Analysis”.
Benefit-Cost Analysis
Benefit-cost analysis refers to the system identification and monetization of all benefits and costs associated
with designing and implementing a control activity, as well as how those benefits and costs are distributed
across different groups. Based on a benefit-cost analysis, the organization may decide not to implement certain
control activities for which the estimated benefits do not exceed the costs. For example:
Detection
Response
Prevention

330
• A property and casualty insurance company may set threshold limits on the total of losses paid, plus those reserved on large policies to identify that fraud may be occurring, instead of relying solely on the identification of a fraudulent individual claim.
• Managers may decide not to conduct payment-recapture audits to recover improper payments if it is likely that the costs incurred to identify and recover the overpayments will be greater than the expected recoveries.
Cost-Effectiveness Analysis
While benefit-cost analysis can help an organization determine whether benefits of a control activity exceed its
costs, they may face challenges in monetizing certain benefits and costs. For example, in addition to direct fi-
nancial benefits and costs to the company, controls may result in additional benefits, such as the value of de-
terred fraud. In these circumstances, a cost-effectiveness analysis, a methodology for determining the cost to
achieve a particular objective, expressed in nonmonetary terms, can be applied. The organization may consider
a cost-effectiveness analysis when the benefits from competing alternatives are the same. Such analysis enables
managers to assess alternatives without having to calculate the monetary value of the benefits of each option.
331
Chapter 17 Review Questions
1. Which of the following elements of internal control addresses the way management assigns authority and
responsibility?
A. Monitoring
B. Control environment
C. Risk assessment
D. Control activities
2. Proper segregation of functional responsibilities to achieve effective internal control calls for the separation
of certain functions. Which of the following functions should be separated?
A. Authorization, execution, and payment
B. Authorization, recording, and custody
C. Custody, execution, and reporting
D. Authorization, payment, and recording
3. Which of the following controls is considered the most proactive way to reduce the risk of theft or misuse of
inventory?
A. Inventory is counted at least once a year.
B. Access to the inventory area is restricted and controlled.
C. Inventory records are reconciled to a physical inventory count.
D. Received goods are recorded in the inventory system as soon as possible.

332
Appendix A: Best Practices of Disclosing
Material Cybersecurity Breach Source: FedEx 2017 Annual Report
Risk Factors
TNT Express experienced a significant cyber-attack in the first quarter of fiscal 2018 and we are not yet able to
determine the full extent of its impact, including the impact on our results of operations and financial condi-
tion, and it is likely that the financial impact will be material.
On June 28, 2017, we announced that the worldwide operations of TNT Express were significantly affected by
the cyber-attack known as Petya, which involved the spread of an information technology virus that infiltrated
TNT Express systems and encrypted its data. While TNT Express operations have been restored and most TNT
services are currently available, as of the date of this filing, we cannot estimate when TNT Express services will
be fully restored. In addition, we cannot estimate how long it will take to restore the systems that were impact-
ed and it is reasonably possible that TNT Express will be unable to fully restore all of the affected systems and
recover all of the critical business data that was encrypted.
Given the recent timing and magnitude of the attack, in addition to our initial focus on restoring TNT Express
operations and customer service functions, we are still evaluating the financial impact of the attack, but it is like-
ly that it will be material. The following consequences or potential consequences of the cyber-attack could have
a material adverse impact on our results of operations and financial condition:
− loss of revenue resulting from the operational disruption immediately following the cyber-attack;
− loss of revenue or increased bad-debt expense due to the inability to invoice properly;
− loss of revenue due to permanent customer loss;
− remediation costs to restore systems;
− increased operational costs due to contingency plans that remain in place;
− investments in enhanced systems in order to prevent future attacks;
− cost of incentives offered to customers to restore confidence and maintain business relationships;
− reputational damage resulting in the failure to retain or attract customers;
− costs associated with potential litigation or governmental investigations;
− costs associated with any data breach or data loss to third parties that is discovered; > costs associated with the potential loss of critical business data;
− longer and more costly integration (due to increased expenses and capital spending requirements) of TNT Express and FedEx Express; and
− other consequences of which we are not currently aware but will discover through the remediation process.
In addition to financial consequences, the cyber-attack may materially impact our disclosure controls and proce-dures and internal control over financial reporting in future periods.

333
Appendix B: Financial Statement Disclosure −
Data Breach Source: Target Corporation 2015 Quarterly Report
Notes to Consolidated Financial Statements (unaudited)
Data Breach
In the fourth quarter of 2013, we experienced a data breach in which an intruder stole certain payment card and
other guest information from our network (the Data Breach). Based on our investigation, we believe that the
intruder installed malware on our point-of-sale system in our U.S. stores and stole payment card data from up to
approximately 40 million credit and debit card accounts of guests who shopped at our U.S. stores between No-
vember 27 and December 17, 2013. In addition, the intruder stole certain guest information, including names,
mailing addresses, phone numbers or email addresses, for up to 70 million individuals.
Data Breach Related Accruals
Each of the four major payment card networks has made a written claim against us regarding the Data Breach,
either directly or through our acquiring banks. In August 2015, we entered into a settlement agreement with
Visa under which we will pay up to $67 million to eligible Visa card issuers worldwide that issued cards that Visa
claimed to have been affected by the Data Breach. Our previously recorded accrual for estimated probable loss-
es related to Visa is consistent with the settlement. We expect to dispute the remaining unsettled claims regard-
ing the Data Breach that have been or may be made against us by the payment card networks. With respect to
the three major payment card networks other than Visa, we think it is probable that our disputes would lead to
settlement negotiations. We believe such negotiations would effect a combined settlement of the payment card
networks' counterfeit fraud loss allegations and their non-ordinary course operating expense allegations.
In addition, more than 100 actions were filed in courts in many states on behalf of guests, payment card issuing
banks, and shareholders, seeking damages or other related relief allegedly arising out of the Data Breach. The
federal court actions (the MDL Actions) have been consolidated in the U.S. District Court for the District of Min-
nesota (MDL Court) pursuant to the rules governing multidistrict litigation and one remaining state court action
has been stayed. In March 2015, Target entered into a Settlement Agreement that, upon approval of the MDL
Court, will resolve and dismiss the claims asserted in the MDL Actions on behalf of a class of guests whose in-
formation was compromised in the Data Breach. Pursuant to the Settlement Agreement, Target has agreed to
pay $10 million to class member guests, certain administrative costs associated with the settlement, and attor-
neys’ fees and expenses to class counsel as the Court may award. The claims asserted by payment card issuing
banks and shareholders in the MDL Actions remain pending. One action was filed in Canada relating to the Data
Breach. That action was dismissed, but is being appealed. State and federal agencies, including State Attorneys
General, and the Federal Trade Commission are investigating events related to the Data Breach, including how it
occurred, its consequences and our responses. The SEC's Enforcement Division concluded its investigation dur-
ing the second quarter of 2015 and does not intend to recommend an enforcement action against us.

334
Our accrual for estimated probable losses for what we believe to be the vast majority of actual and potential
Data Breach related claims is based on the expectation of reaching negotiated settlements, and not on any de-
termination that it is probable we would be found liable for the losses we have accrued were these claims to be
litigated. Given the varying stages of claims and related proceedings, and the inherent uncertainty surrounding
them, our estimates involve significant judgment and are based on currently available information, historical
precedents and an assessment of the validity of certain claims. Our estimates may change as new information
becomes available, and although we do not believe it is probable, it is reasonably possible that we may incur a
material loss in excess of the amount accrued. We are not able to estimate the amount of such reasonably pos-
sible excess loss exposure at this time because many of the matters are in the early stages, alleged damages
have not been specified, and there are significant factual and legal issues to be resolved.
Expenses Incurred and Amounts Accrued
We recorded $9 million and $12 million of pretax Data Breach-related expenses during the three and six months
ended August 1, 2015, respectively, primarily for legal and other professional services. We recorded $148 million
and $175 million of pretax Data Breach-related expenses during the three and six months ended August 2, 2014,
respectively, partially offset by expected insurance recoveries of $38 million and $46 million, respectively. Along
with legal and other professional services, these expenses included an increase to the accrual for estimated
probable losses for what we believe to be the vast majority of actual and potential breach-related claims, includ-
ing claims by the payment card networks. These expenses were included in our Consolidated Statements of Op-
erations as SG&A, but were not part of our segment results.
Since the Data Breach, we have incurred $264 million of cumulative expenses, partially offset by expected insur-
ance recoveries of $90 million, for net cumulative expenses of $174 million.
Insurance Coverage
To limit our exposure to losses relating to Data Breach and other claims, we maintained $100 million of network-
security insurance coverage during the period that the Data Breach occurred, above a $10 million deductible and
with a $50 million sublimit for settlements with the payment card networks. This coverage, and certain other
customary business-insurance coverage, has reduced our exposure related to the Data Breach. We will pursue
recoveries to the maximum extent available under the policies. Since the Data Breach, we have received $35
million from our network-security insurance carriers of the $90 million accrued.
Data Breach Balance Sheet Rollforward Insurance
(millions) Liabilities Receivable
Balance at February 1, 2014 61$ 44$
Expenses incurred/insurance receivable recorded (a) 175 46
Payments made/received (54) (20)
Balance at August 2, 2014 182$ 70$
Balance at January 31, 2015 171$ 60$
Expenses incurred/insurance receivable recorded (a) 12 -
Payments made/received (15) (5)
Balance at August 2, 2015 168$ 55$
(a) Includes expenditures and accruals for Data Breach-related costs and expected insurance
recoveries as discussed below.

335
Appendix C: Examples of Circumstances that
May be Deficiencies, Significant Deficiencies,
or Material Weaknesses Source: AICPA, AU-C §265 Examples of Circumstances That May Be Deficiencies, Significant Deficiencies, or Material Weak-
nesses
Deficiencies in the Design of Controls
The following are examples of circumstances that may be deficiencies, significant deficiencies, or material weak-
nesses related to the design of controls.
• Inadequate design of internal control over the preparation of the financial statements being audited.
• Inadequate design of internal control over a significant account or process.
• Inadequate documentation of the components of internal control.
• Insufficient control consciousness within the organization, for example, the tone at the top and the control
environment.
• Evidence of ineffective aspects of the control environment, such as indications that significant transactions
in which management is financially interested are not being appropriately scrutinized by those charged with
governance.
• Evidence of an ineffective entity risk assessment process, such as management’s failure to identify a risk of
material misstatement that the auditor would expect the entity’s risk assessment process to have identified.
• Evidence of an ineffective response to identified significant risks (for example, absence of controls over such
a risk).
• Absent or inadequate segregation of duties within a significant account or process.
• Absent or inadequate controls over the safeguarding of assets (this applies to controls that the auditor de-
termines would be necessary for effective Inadequate design of information technology (IT) general and ap-
plication controls that prevent the information system from providing complete and accurate information
consistent with financial reporting objectives and current needs.
• Employees or management who lack the qualifications and training to fulfill their assigned functions. For
example, in an entity that prepares financial statements in accordance with generally accepted accounting
principles, the person responsible for the accounting and reporting function lacks the skills and knowledge
to apply generally accepted accounting principles in recording the entity’s financial transactions or preparing
its financial statements.

336
• Inadequate design of monitoring controls used to assess the design and operating effectiveness of the enti-
ty’s internal control over time.
• The absence of an internal process to report deficiencies in internal control to management on a timely ba-
sis.
• Absence of a risk assessment process within the entity when such a process would ordinary be expected to
have been established.
Failures in the Operation of Internal Control
The following are examples of circumstances that may be deficiencies, significant deficiencies, or material weak-
nesses related to the operations of controls:
• Failure in the operation of effectively designed controls over a significant account or process, for example,
the failure of a control such as dual authorization for significant disbursements within the purchasing pro-
cess.
• Failure of the information and communication component of internal control to provide complete and accu-
rate output because of deficiencies in timeliness, completeness, or accuracy. For example, the failure to ob-
tain timely and accurate consolidating information from remote locations, that is needed to prepare the fi-
nancial statements.
• Failure of controls designed to safeguard assets from loss, damage, or misappropriation. This circumstance
may need careful consideration before it is evaluated as a significant deficiency or material weakness. For
example, assume that a company uses security devices to safeguard its inventory (preventive controls) and
also performs periodic physical inventory counts (detective control) timely in relation to its financial report-
ing. Although the physical inventory count does not safeguard the inventory from theft or loss, it prevents a
material misstatement of the financial statements if performed effectively and timely. Therefore, given that
the definitions of material weakness and significant deficiency relate to likelihood of misstatement of the fi-
nancial statements, the failure of a preventive control such as inventory tags will not result in a significant
deficiency or material weakness if the detective control (physical inventory) prevents a misstatement of the
financial statements. Material weaknesses relating to controls over the safeguarding of assets would only
exist if the company does not have effective controls (considering both safeguarding and other controls) to
prevent or detect a material misstatement of the financial statements.
• Failure to perform reconciliations of significant accounts. For example, accounts receivable subsidiary ledg-
ers are not reconciled to the general ledger account in a timely or accurate manner.
• Undue bias or lack of objectivity by those responsible for accounting decisions, for example, consistent un-
derstatement of expenses or overstatement of allowances at the direction of management.
• Management override of controls.
• Failure of an application control caused by a deficiency in the design or operation of an IT general control.

337
Appendix D: A List of Questions Management
Needs to Answer for Sarbanes-Oxley Compli-
ance 1. How are off-balance-sheet transactions and commitments tracked and reported?
2. Are payments to the external auditing firm monitored through the transactional flags on purchase orders,
check requests, or other means within the system?
3. Are rolling forecasts deployed throughout the business (business unit, product line, functional levels)?
4. How many tools are used in the forecasting process? The budgeting process?
5. Do the reporting systems trace back to the general ledgers?
6. Is cash flow from operations and U.S. GAAP cash flow automatically calculated?
7. Are key measures (drivers of financial results) delivered to the operational manager's desktops daily, weekly,
and monthly?
8. Are tax reporting systems integrated with the company's consolidation system?
9. Are consolidation and reporting activities performed on spreadsheets?
10. Do transactional reporting systems have agent-based alerts?
11. How are manual entries identified and approved?
12. How much time is spent compiling data and the financial statements versus analyzing the data?
13. How many top-level adjustments are made in the consolidation process?
14. Are reporting activities performed on spreadsheets?
15. How often is control documentation updated for new changes to the internal controls (transactional and
financial statements)?
16. Are controls in place to ensure that any off-balance-sheet items are properly approved?
17. Do reporting systems flag reserves and other estimated accounts?
18. Have the systems been updated to identify new responsibilities under the Sarbanes-Oxley Act?
19. Are earnings forecasts tied to predictive models?
20. Do you forecast your business on cash flow drivers?
21. Are variances between the forecasted and actual results reviewed and their causes identified?
22. How long is the process to develop forecasts? Budgets?
23. Is there a significant difference between financial statements depending on timing, function, or system?
24. Are standard charts of accounts used across the company?
25. How long does it take the company to get the results of operations?

338
Appendix E: Example of a Statement of Risk
Management Vision, Mission, Goals and Ob-
jectives Source: Protiviti, Guide to Enterprise Risk Management, 2006
Vision
Contribute to the creation, optimization and protection of enterprise value by managing our business risks as we
create value in the marketplace.
Mission
Create a comprehensive approach to anticipate, identify, prioritize, manage and monitor the portfolio of busi-
ness risks impacting our organization. Put in place the policies, common processes, competencies, accountabili-
ties, reporting and enabling technology to execute the approach successfully.
Goals and Objectives
1. Design and execute a global business risk management process integrated with our strategic management
process:
• Integrate business risk management with our strategy formulation and business planning processes
• Articulate our strategies so that they are understood throughout our organization
• Establish KPIs designed to drive behaviors consistent with our strategy
• Reward effective articulation and management of key risks
2. Ensure that process ownership questions are addressed with clarity so that roles, responsibilities and au-
thorities are properly understood.
3. Design and execute a global process to monitor and reassess the top quartile risk profile and identify gaps in
the management of those risks, based upon changes in business objectives and in the external and internal
operating environment.
4. Define risk management strategies and clear accountabilities and action steps for building and executing risk
management capabilities and improving them continuously.
5. Continuously monitor the information provided to decision-makers in order to assist them as they manage
key risks and protect the interests of shareholders.

339
Appendix F: Three Lines of Defense - Recom-
mended Practices by COSO Source: IIA, Leveraging COSO across the Three Lines of Defense, 2015 (Research Commissioned by COSO)
Key Observations:
• Risk and control processes should be structured in accordance with the Three Lines of Defense model.
• Each group within the three lines of defense should have clearly defined roles and responsibilities that are
supported by appropriate policies, procedures, and reporting mechanisms.
• Information should be shared and activities coordinated among each of the lines of defense to improve effi-
ciency and avoid duplication of effort while ensuring all significant risks are addressed appropriately.
• Risk and control functions operating at the different lines should appropriately share knowledge and infor-
mation to assist all functions in better accomplishing their roles in an efficient manner.
• Lines of defense should not be combined or coordinated in a manner that compromises their effectiveness.
• In situations where functions at different lines are combined, the governing body should be advised of the
structure and its impact. For organizations that have not established an internal audit activity, management
and/or the governing body should be required to explain and disclose to their stakeholders that they have
considered how adequate assurance on the effectiveness of the organization’s governance, risk manage-
ment, and control structure will be obtained.
Examples of Leveraging COSO across the Three Line of Defense Model:
The COSO publication, Internal Control – Integrated Framework defines five components of internal control and
17 principles representing the fundamental concepts associated with these components. The following table
provides examples of how responsibility for Principle 7 may be allocated among the three lines of defense:

340
Principle 7. The organization identifies risks to the achievement of its objectives across the entity and analyzes
risks as a basis for determining how the risks should be managed.
1st Line of
Defense
(Risk Own-
ers/ Manag-
ers)
• Identifies and controls risks related to achievement of objectives.
• Defines the organization’s risk appetite and tolerances, establishes risk management systems,
and establishes accountabilities for controlling specific risks under the board’s oversight.
2nd Line of
Defense
(Risk, Con-
trol, and
Compliance)
1. An enterprise risk management function may be delegated significant responsibilities regard-
ing risks and controls. Typical tasks might include:
• Establishing a common risk language or glossary.
• Describing the organization’s risk appetite and tolerances.
• Identifying and describing risks in a “risk inventory.”
• Implementing a risk-ranking methodology to prioritize risks within and across functions.
• Establishing a risk committee and or chief risk officer to coordinate certain activities of other
risk management functions.
• Establishing ownership for particular risks and responses.
• Developing action plans to ensure the risks are appropriately managed.
• Developing consolidated reporting for various stakeholders.
• Monitoring the results of actions taken to mitigate risk.
• Ensuring efficient risk coverage by internal auditors, consulting teams, and other evaluating
entities.
• Developing a risk management framework that enables participation by third parties and re-
mote employees.
2. Specific groups such as security and compliance functions may assist management in identify-
ing risks related to their area of expertise, taking into account the risk appetite levels set by
management for the different activities or parts of the organization.
3rd Line of
Defense
(Internal Au-
diting)
• Takes into account organization’s risk framework to perform an organization wide risk-based
audit plan.
• May facilitate certain enterprise risk management activities as long as independence and ob-
jectivity are not impaired.
• Considerations to developing an internal audit plan may include:
− Identification and assessment of inherent and residual risks.
− Mitigating controls, contingency plans, and monitoring activities linked to specific risks.
− Accuracy and completeness of risk registers.
− Adequacy of documentation regarding management’s risk and control activities.
Other
• The board establishes the overall strategy of the organization and its objectives including un-
derstanding the risks associated with the strategy.
• The board provides oversight and holds management accountable for identifying and manag-
ing risks to the achievement of objectives.
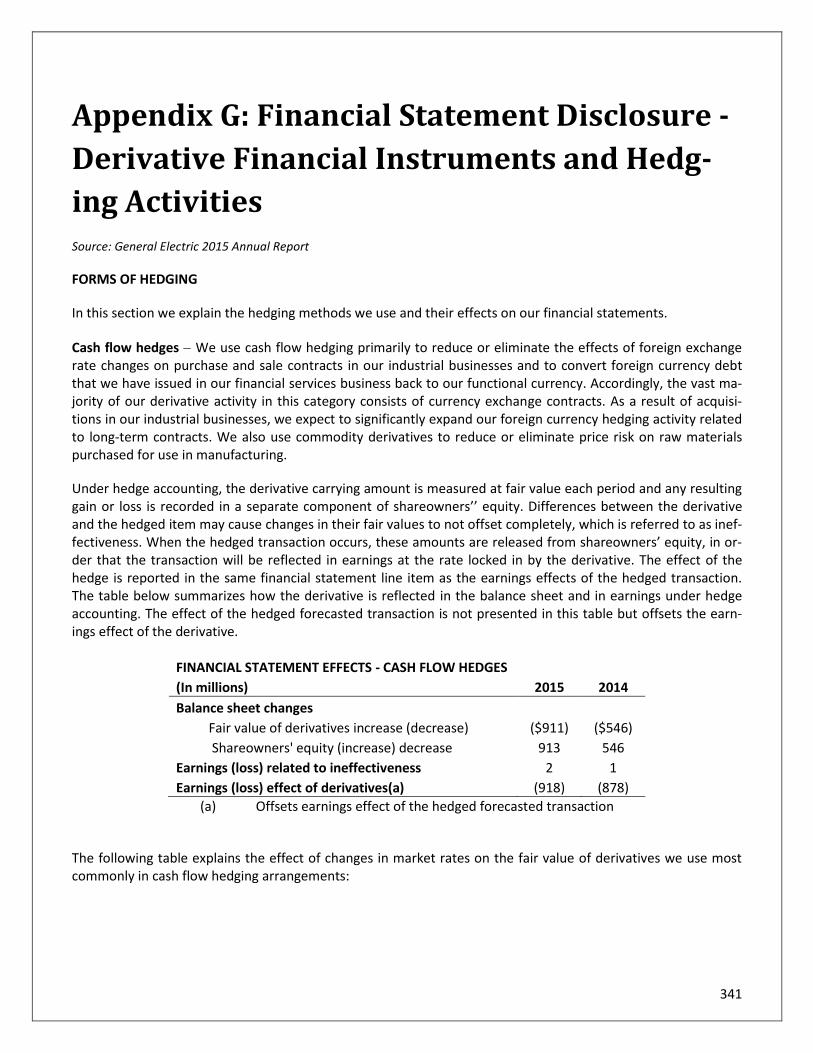
341
Appendix G: Financial Statement Disclosure -
Derivative Financial Instruments and Hedg-
ing Activities Source: General Electric 2015 Annual Report
FORMS OF HEDGING
In this section we explain the hedging methods we use and their effects on our financial statements.
Cash flow hedges − We use cash flow hedging primarily to reduce or eliminate the effects of foreign exchange rate changes on purchase and sale contracts in our industrial businesses and to convert foreign currency debt that we have issued in our financial services business back to our functional currency. Accordingly, the vast ma-jority of our derivative activity in this category consists of currency exchange contracts. As a result of acquisi-tions in our industrial businesses, we expect to significantly expand our foreign currency hedging activity related to long-term contracts. We also use commodity derivatives to reduce or eliminate price risk on raw materials purchased for use in manufacturing.
Under hedge accounting, the derivative carrying amount is measured at fair value each period and any resulting gain or loss is recorded in a separate component of shareowners’’ equity. Differences between the derivative and the hedged item may cause changes in their fair values to not offset completely, which is referred to as inef-fectiveness. When the hedged transaction occurs, these amounts are released from shareowners’ equity, in or-der that the transaction will be reflected in earnings at the rate locked in by the derivative. The effect of the hedge is reported in the same financial statement line item as the earnings effects of the hedged transaction. The table below summarizes how the derivative is reflected in the balance sheet and in earnings under hedge accounting. The effect of the hedged forecasted transaction is not presented in this table but offsets the earn-ings effect of the derivative.
FINANCIAL STATEMENT EFFECTS - CASH FLOW HEDGES (In millions) 2015 2014
Balance sheet changes Fair value of derivatives increase (decrease) ($911) ($546)
Shareowners' equity (increase) decrease 913 546
Earnings (loss) related to ineffectiveness 2 1
Earnings (loss) effect of derivatives(a) (918) (878)
(a) Offsets earnings effect of the hedged forecasted transaction
The following table explains the effect of changes in market rates on the fair value of derivatives we use most commonly in cash flow hedging arrangements:

342
Interest rate forwards/swaps Interest rate increases Interest rate decreases
Pay fixed rate/receive floating rate Fair value increases Fair value decreases
Currency forwards/swaps U.S. dollar strengthens U.S. dollar weakens
Pay U.S. dollars/receive foreign currency Fair value decreases Fair value increases
Commodity derivatives Price increases Price decreases
Receive commodity/ pay fixed price Fair value increases Fair value decreases
Fair value hedges − These derivatives are used to hedge the effects of interest rate and currency exchange rate changes on debt that we have issued. We have issued mostly fixed rate debt that is used to fund both fixed and floating rate assets. In instances where fixed rate debt is funding floating rate assets, we have an exposure to changes in interest rates. We enter into interest rate swaps that receive a fixed rate and pay a floating rate of interest to align with that portion of our debt which funds floating rate assets. These swaps typically match the maturity of the associated debt being hedged. Under hedge accounting, the derivative is measured at fair value and the carrying amount of the hedged debt is adjusted for the change in value related to the exposure being hedged, with both adjustments offset to earnings as interest expense. For example, the earnings effect of an increase in the fair value of the derivative will be largely offset by the earnings effect of an increase in the carrying amount of the hedged debt. Differences be-tween the terms of the derivative and the hedged debt may cause changes in their fair values to not offset com-pletely, which is referred to as ineffectiveness. The table below summarizes how the derivative and the hedged debt are reflected in the balance sheet and in earnings under hedge accounting. The effect on interest expense of changing from the fixed rate on the debt to the floating rate on the swap is not shown in this table.
FINANCIAL STATEMENT EFFECTS - FAIR VALUE HEDGES
(In millions) 2015 2014
Balance sheet changes
Fair value of derivatives increase (decrease) ($151) $3,863
Adjustment to carrying amount of hedged debt (increase) decrease 75 (3,939)
Earnings (loss) related to hedge ineffectiveness (75) (76)
The effect of changes in market interest rates on the fair value of derivatives we use most commonly in fair val-ue hedging arrangements is presented below.
Interest rate forwards/swaps Interest rate increases Interest rate decreases
Pay fixed rate/receive floating rate Fair value decreases Fair value increases
Net investment hedges − We invest in foreign operations that conduct their financial services activities in cur-rencies other than the US dollar. We hedge the currency risk associated with those investments primarily using short-term currency exchange contracts under which we receive US dollars and pay foreign currency and non-derivatives instruments such as debt denominated in a foreign currency.

343
Under hedge accounting, the portion of the fair value change of the derivative or debt instrument that relates to changes in spot currency exchange rates is offset in a separate component of shareowners’ equity. For example, an increase in the fair value of the derivative related to changes in spot exchange rates will be offset by a corre-sponding increase in the currency translation component of shareowners’ equity. The portion of the fair value change of the derivative related to differences between spot and forward rates, which primarily relates to the interest component, is recorded in earnings each period as interest expense. As a result of this hedging strategy, the investments in foreign operations of our financial services business are largely unaffected by changes in cur-rency exchange rates. The amounts recorded in shareowners’ equity only affect earnings if the hedged invest-ment is sold, substantially liquidated, or control is lost.
FINANCIAL STATEMENT EFFECTS - NET INVESTMENT HEDGES
(In millions) 2015 2014
Balance sheet changes
Fair value of derivatives increase (decrease) $4,871 $5,192
Fair value of non-derivatives (increase) decrease (849) -
Earnings (loss) related to spot-forward differences (109) (549)
Earnings (loss) related to reclassification upon sale or liquidation(a) 4,547 88
(a) Included $4,549 million gain and $88 million gain recorded in discontinued operations in 2015 and 2014, re-spectively. The effect of changes in currency exchange rates on the fair value of derivatives we use in net investment hedg-ing arrangements is presented below.
Currency forwards/swaps U.S. dollar strengthens U.S. dollar weakens
Receive U.S. dollars/pay foreign currency Fair value increases Fair value decreases
NOTIONAL AMOUNT OF DERIVATIVES The notional amount of a derivative is the number of units of the underlying (for example, the notional principal amount of the debt in an interest rate swap). The notional amount is used to compute interest or other pay-ment streams to be made under the contract and is a measure of our level of activity. We generally disclose de-rivative notional amounts on a gross basis. A substantial majority of the outstanding notional amount of $245 billion at December 31, 2015 is related to managing interest rate and currency risk between financial assets and liabilities in our financial services business. The remaining derivative notional primarily relates to hedges of an-ticipated sales and purchases in foreign currency, commodity purchases and contractual terms in contracts that are considered embedded derivatives. The table below provides additional information about how derivatives are reflected in our financial statements. Derivative assets and liabilities are recorded at fair value exclusive of interest earned or owed on interest rate derivatives, which is presented separately on our balance sheet. Cash collateral and securities held as collateral represent assets that have been provided by our derivative counterparties as security for amounts they owe us (derivatives that are in an asset position).

344
CARRYING AMOUNTS RELATED TO DERIVATIVES
December 31 (In millions) 2015 2014
Derivative assets $7,391 $9,911
Derivative liabilities (5,681) (4,851)
Accrued interest 1,014 1,419
Cash collateral & credit valuation adjustment (1,141) (3,233)
Net Derivatives 1,583 3,246
Securities held as collateral (1,277) (3,114)
Net carrying amount $306 $132
EFFECTS OF DERIVATIVES ON EARNINGS All derivatives are marked to fair value on our balance sheet, whether they are designated in a hedging relation-ship for accounting purposes or are used as economic hedges. As discussed in the previous sections, each type of hedge affects the financial statements differently. In fair value and economic hedges, both the hedged item and the hedging derivative largely offset in earnings each period. In cash flow and net investment hedges, the effective portion of the hedging derivative is offset in separate components of shareowners’ equity and ineffec-tiveness is recognized in earnings. The table below summarizes these offsets and the net effect on earnings.
(In millions) Effect on hedging instrument Effect on underlying Effect on earnings
2015
Cash flow hedges ($911) $913 $2
Fair value hedges (151) 75 (75) Net investment hedges (a) 4,022 (4,131) (109)
Economic hedges (b) (2,720) 2,543 (177)
Total ($359)
2014
Cash flow hedges $546 $546 $1
Fair value hedges 3,863 (3,939) (76) Net investment hedges (a) 5,192 (5,741) (549)
Economic hedges (b) (2,198) 2,083 (116)
Total ($740)
(a) Both derivatives and non-derivatives hedging instruments are included. (b) Net effect is substantially offset by the change in fair value of the hedged item that will affect earn-ings in future periods.

345
Appendix H: International Business Planning
Checklist Source: Thomas B. McVey, For Development of Overall International Business Plan, 2009
The following checklist is designed to be used by a company’s senior management as the first step in planning its
expansion into foreign markets. It includes strategic questions to be addressed by the company in planning its
international development. For example, whether the company is at the right stage of its corporate develop-
ment to enter overseas markets, optimum business model, country selection, sequence and timing, localization
and other strategic issues. Once the company’s management has completed the Planning Checklist, the infor-
mation collected can serve as the basis for the company’s International Business Plan and the roadmap for its
international development strategy.
1. Should Company Establish Business in Foreign Markets? – Is the Company at the right stage of
its corporate development to enter international markets?
a.
Traditional Test – Has the Company saturated the do-
mestic market in its home country? If yes, then this is an
appropriate time to begin operations in foreign coun-
tries.
b.
Modern Test – Where are the best business opportuni-
ties for the Company in the world right now? If there
are better opportunities in targeted foreign markets
than in Company’s home market, it is appropriate to skip
over portions of the domestic market to pursue foreign
opportunities. (However, Company must design the
scope and details of its international development to
match its capital, personnel and management expertise.)
c.
Competition – Are the Company’s competitors active in
international markets? If so, should the Company be
pursuing such markets to remain competitive?
d.
Growth Analysis – How will the Company meet its reve-
nue growth projections over the next 5 years (especially
public companies)? Is there sufficient potential for new
business in the Company’s home market to meet this
requirement or will the Company need to look to foreign
markets?
e.
Resources – Does the Company have sufficient resources
to pursue business in international markets at the pre-
sent time? (Resources include capital, personnel and

346
management expertise.) If not, will the Company be
able to acquire these in order to properly execute its
international business plan?
f.
Have impediments that the Company previously identi-
fied in foreign markets been reduced in recent years?
Examples include political risk, restrictions on currency
repatriation, lack of infrastructure, unreliable legal sys-
tem, etc. in targeted foreign countries.
g.
What type of international activities will be performed?
• Sale of products
• Performance of services for foreign customers
• Establishment of Company-owned facility
abroad for sales, logistics/distribution, manufac-
turing, research and development, other pur-
poses
• Sourcing of raw materials, components, mer-
chandise from foreign suppliers
• “Offshoring” - operating a company business
process in a foreign location (e.g. call center)
• Outsourcing, subcontracting to foreign firm
• Integrated global business operation
h.
Estimate size of the worldwide market for Company’s
products. How does this compare to the size of the
market in Company’s home country?
2. Business Model – What business model will the Company use in its international develop-
ment?
No Direct Presence In Foreign Country (Export of Products and Services From Company’s Home
Country)
a. Sales Through Independent Sales Representatives,
Agents
b.
Sales Through Independent Distributors
• Distributors
• Channel Partners
• Value Added Resellers (VAR’s)
c. Consumer to Consumer Direct Marketing (Tupperware,
Amway, etc.)
d. Sales Through Local Retail Store Chains
e. Contractual Joint Venture:
• Foreign partner has passive, minority interest

347
• Foreign partner shares management responsibil-
ities with U.S. Company
• Foreign partner has primary management role
f.
Franchising, Licensing:
• Franchising through Master Regional Developers
• Franchising – direct to franchisees
• Licensing
g.
Direct Sales from Outside the Country
• Online Internet sales
• Telephone sales
• Direct mail
• Other
h. “Piggyback” sales through multinational companies –
(Walmart, etc.)
i. “Piggyback” sales through electronic gateways – (Ama-
zon, e-Bay, etc.)
Direct Presence In Foreign Country (Establishing Office, Manufacturing or Other Facility In For-
eign Country)
a. Marketing facility – Company-owned retail stores,
wholesale facility
b. Distribution, logistics, warehouse facility
c. Offices for the performance of services (technical, finan-
cial, professional services)
d. Regional support facility to support independent mar-
keting by agents, distributors, etc.
e. Manufacturing facility
f. Integrated facilities – manufacturing and sales opera-
tions
g.
“Entity” joint venture (formation of business entity,
shares are issued both to the Company and a foreign
partner)
h. Real estate ownership and/or development
i. Acquisition of operating company
j. Private equity – investment in majority or minority in-
terest in a private company
k. Public equity – investment in the securities of a publicly-
traded company
3. Which Countries – Which foreign countries present the best opportunity for the Company?
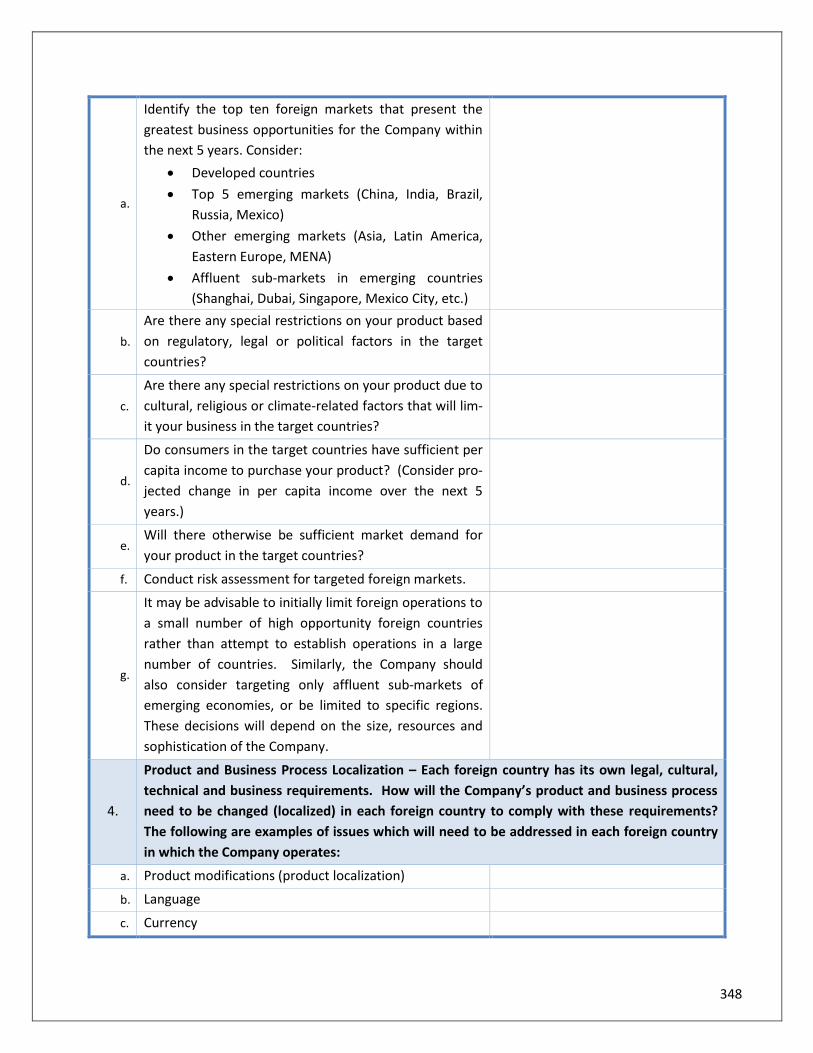
348
a.
Identify the top ten foreign markets that present the
greatest business opportunities for the Company within
the next 5 years. Consider:
• Developed countries
• Top 5 emerging markets (China, India, Brazil,
Russia, Mexico)
• Other emerging markets (Asia, Latin America,
Eastern Europe, MENA)
• Affluent sub-markets in emerging countries
(Shanghai, Dubai, Singapore, Mexico City, etc.)
b.
Are there any special restrictions on your product based
on regulatory, legal or political factors in the target
countries?
c.
Are there any special restrictions on your product due to
cultural, religious or climate-related factors that will lim-
it your business in the target countries?
d.
Do consumers in the target countries have sufficient per
capita income to purchase your product? (Consider pro-
jected change in per capita income over the next 5
years.)
e. Will there otherwise be sufficient market demand for
your product in the target countries?
f. Conduct risk assessment for targeted foreign markets.
g.
It may be advisable to initially limit foreign operations to
a small number of high opportunity foreign countries
rather than attempt to establish operations in a large
number of countries. Similarly, the Company should
also consider targeting only affluent sub-markets of
emerging economies, or be limited to specific regions.
These decisions will depend on the size, resources and
sophistication of the Company.
4.
Product and Business Process Localization – Each foreign country has its own legal, cultural,
technical and business requirements. How will the Company’s product and business process
need to be changed (localized) in each foreign country to comply with these requirements?
The following are examples of issues which will need to be addressed in each foreign country
in which the Company operates:
a. Product modifications (product localization)
b. Language
c. Currency

349
d. Local technical standards
e. Packaging, labeling
f. Legal compliance
g. Website localization
h. Marketing plan
i. Payment processing (credit cards, check, cash)
j. Customer support
k. Logistics and warehousing
l. Advertising
5. Core Company Standards – Regardless of changes made in the localization process in each
country, the Company should maintain the core elements of its culture in every country in
which it operates. What are the core elements of the Company’s business and culture that it
wants to maintain in every country?
a. Highest level of quality? Reputation as a “premium”
brand?
b. Lowest price?
c. Highest level of customer value?
d. Highest level of profitability?
e. Best company to work for?
f. Other
6. Sequence of Entering Targeted Foreign Markets – Options to consider:
a.
Traditional Methodology – Expand first to countries ad-
jacent to Company’s home country, and then gradually
expand outward from there.
b.
New Methodology – Start first in the countries that pre-
sent the greatest business opportunities for the Compa-
ny, even if these are in other regions in the world. Con-
tinue to other countries based on priority of business
opportunity rather than proximity to home country.
c.
Do not start operations in all targeted foreign markets at
same time; open in a phased sequence over time. Tim-
ing should be determined by the size, resources and so-
phistication of the Company.
d.
Identify which foreign countries the Company will oper-
ate in each year over the next 5 years, and the estimated
date of commencement of operations in each.
7. Tax and Entity Planning – Structure the Company’s business entities to protect the parent
company from legal liability, achieve tax efficiency, and streamline treasury function.

350
a.
Tax planning goals: (i) reduce tax liability in individual
countries: (ii) avoid double taxation in multiple coun-
tries; and (iii) reduce Company’s overall worldwide tax
rate.
b.
Tax planning factors to consider:
• Selection of entities in low-tax jurisdictions
whenever possible
• Maximize use of foreign tax credits
• Use of tax treaties and regional holding compa-
nies to avoid double taxation
• Capture of flow – through losses in start-up
stages
• Special strategies for IP development and licens-
ing
• Tax-efficient internal debt when parent Compa-
ny is providing capital to foreign subsidiary
• Optimize E&P and E&P deficit utilization
• Optimize NOL utilization/valuation • Facilitate
basis planning
• Transfer pricing strategies
• VAT tax planning
• Tax efficient acquisitions and dispositions
c.
Foreign Entity Selection - type of legal presence in for-
eign countries: (i) subsidiary; (ii) branch; and (iii) repre-
sentative office.
d.
Commercial law goals in entity planning: (i) limit parent
from legal liability in target country; (ii) project a “local
company” image in target country; (iii) local entity may
be required to comply with local regulatory, legal re-
quirements.
e.
It is often desirable to operate through a subsidiary in
each foreign country to protect the parent Company
from legal liability – use of a “branch” will not achieve
this and will often expose other assets of the parent
Company. In selecting type of entity, be sure to select
type that has limited liability of shareholders.
f.
In certain countries, local law requires that entities
formed under local law have at least one shareholder
that is a citizen of that country. This may be undesirable
for many companies, so care must be used in selecting

351
the proper type and jurisdiction of entity.
g.
Local entities can often be characterized as “flow-
through” or “blocker” entities for tax purposes. Select
the type of entity that presents the optimum tax results
for the Company.
8. Protection of Intellectual Property
a.
Intellectual property: patents, trademarks, copyrights,
trade secrets, trade dress, domain names, technology,
proprietary processes.
b.
Does the Company have valuable intellectual property?
Company should register or otherwise legally protect its
intellectual property in every foreign country in which it
operates.
c.
Trademarks – it is advisable to register trademarks and
domain names as the first step in establishing operations
in a foreign country – prior to communicating with par-
ties or releasing public information that the Company is
establishing operations there (in order to avoid pirates
registering the Company’s trademarks in their own
name). The Company should consider registering
trademarks both in the local country language and the
Company’s home country language.
d.
It is recommended to develop strategies to protect the
Company’s intellectual property on a global basis at the
outset of international development process. Specific
strategy will depend on the resources of the Company.
Major companies often will initially register key intellec-
tual property in all foreign countries in the world. Com-
panies with limited resources often will register in the
top ten jurisdictions (U.S., EU, China, Japan, Brazil, etc.),
and then register in the remaining countries at a later
date. In addition, Companies with limited resources will
often only register the most important IP at the com-
mencement of their international development, and
then register remaining IP assets when they start actual
operations in an individual country.
e.
Certain countries pose a particularly high risk of intellec-
tual property infringement due to weak intellectual
property laws or lax enforcement mechanisms. The
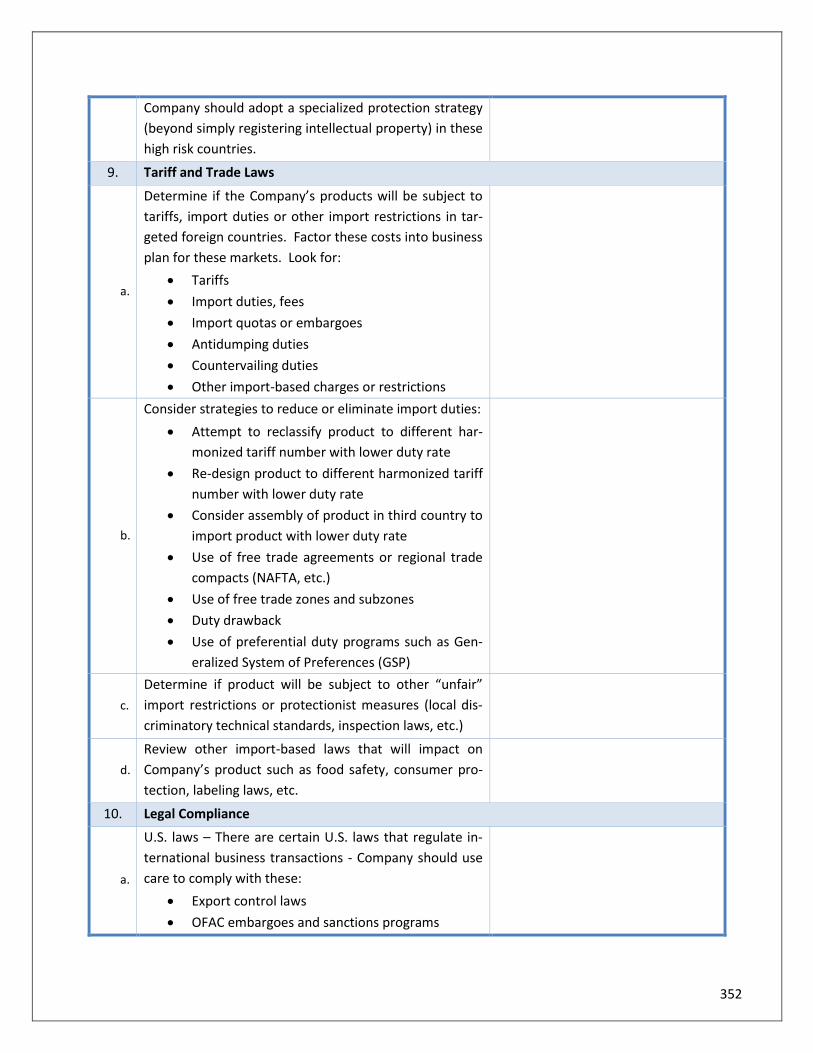
352
Company should adopt a specialized protection strategy
(beyond simply registering intellectual property) in these
high risk countries.
9. Tariff and Trade Laws
a.
Determine if the Company’s products will be subject to
tariffs, import duties or other import restrictions in tar-
geted foreign countries. Factor these costs into business
plan for these markets. Look for:
• Tariffs
• Import duties, fees
• Import quotas or embargoes
• Antidumping duties
• Countervailing duties
• Other import-based charges or restrictions
b.
Consider strategies to reduce or eliminate import duties:
• Attempt to reclassify product to different har-
monized tariff number with lower duty rate
• Re-design product to different harmonized tariff
number with lower duty rate
• Consider assembly of product in third country to
import product with lower duty rate
• Use of free trade agreements or regional trade
compacts (NAFTA, etc.)
• Use of free trade zones and subzones
• Duty drawback
• Use of preferential duty programs such as Gen-
eralized System of Preferences (GSP)
c.
Determine if product will be subject to other “unfair”
import restrictions or protectionist measures (local dis-
criminatory technical standards, inspection laws, etc.)
d.
Review other import-based laws that will impact on
Company’s product such as food safety, consumer pro-
tection, labeling laws, etc.
10. Legal Compliance
a.
U.S. laws – There are certain U.S. laws that regulate in-
ternational business transactions - Company should use
care to comply with these:
• Export control laws
• OFAC embargoes and sanctions programs

353
• Prohibition on dealing with Specially Designated
Nationals
• Foreign Corrupt Practices Act
• Anti-boycott laws
• Patriot Act, anti-terrorist and anti-money laun-
dering laws
• Customs and import laws
• Adoption of International Compliance Program
b. Foreign laws – Company should comply with all laws in
each foreign country in which it is operating.
11. Advanced Globalization Strategies
a. Can the Company develop a “global” product that does
not have to be localized in each foreign market?
b.
Can the Company develop unified media themes and
advertising messaging that do not have to be localized in
each foreign country?
c.
Can the Company take advantage of technologies such
as automated translation tools, automated foreign ex-
change conversion web applications, website personali-
zation tools to reduce localization efforts?
d.
Can the Company take advantage of worldwide media
channels such as satellite television, Internet televi-
sion/media programming to promote its product and/or
for other parts of its business process (payments, elec-
tronic delivery of content, etc)?
e.
Can the Company take advantage of worldwide business
resources such as payment systems (Visa), delivery (Fed
Ex) to streamline its international operations?
f. Can the Company design its product around globally ac-
cepted technical standards?
g.
Sales through other worldwide electronic platforms –
Internet, wireless networks, digital satellite television,
for marketing, translation processing/sales or content
delivery?
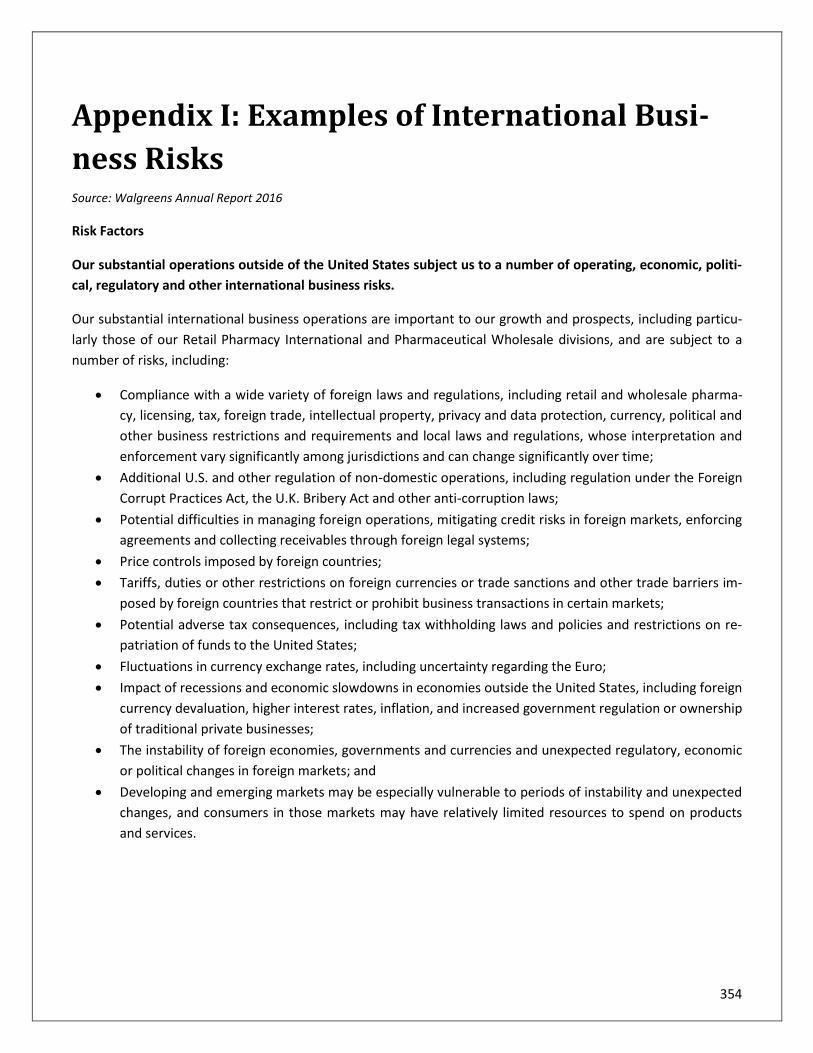
354
Appendix I: Examples of International Busi-
ness Risks Source: Walgreens Annual Report 2016
Risk Factors
Our substantial operations outside of the United States subject us to a number of operating, economic, politi-
cal, regulatory and other international business risks.
Our substantial international business operations are important to our growth and prospects, including particu-
larly those of our Retail Pharmacy International and Pharmaceutical Wholesale divisions, and are subject to a
number of risks, including:
• Compliance with a wide variety of foreign laws and regulations, including retail and wholesale pharma-
cy, licensing, tax, foreign trade, intellectual property, privacy and data protection, currency, political and
other business restrictions and requirements and local laws and regulations, whose interpretation and
enforcement vary significantly among jurisdictions and can change significantly over time;
• Additional U.S. and other regulation of non-domestic operations, including regulation under the Foreign
Corrupt Practices Act, the U.K. Bribery Act and other anti-corruption laws;
• Potential difficulties in managing foreign operations, mitigating credit risks in foreign markets, enforcing
agreements and collecting receivables through foreign legal systems;
• Price controls imposed by foreign countries;
• Tariffs, duties or other restrictions on foreign currencies or trade sanctions and other trade barriers im-
posed by foreign countries that restrict or prohibit business transactions in certain markets;
• Potential adverse tax consequences, including tax withholding laws and policies and restrictions on re-
patriation of funds to the United States;
• Fluctuations in currency exchange rates, including uncertainty regarding the Euro;
• Impact of recessions and economic slowdowns in economies outside the United States, including foreign
currency devaluation, higher interest rates, inflation, and increased government regulation or ownership
of traditional private businesses;
• The instability of foreign economies, governments and currencies and unexpected regulatory, economic
or political changes in foreign markets; and
• Developing and emerging markets may be especially vulnerable to periods of instability and unexpected
changes, and consumers in those markets may have relatively limited resources to spend on products
and services.

355
Appendix J: Developing an Automation
Strategy According to Deloitte, Automate this: The business leader’s guide to robotic and intelligent automation, the fol-
lowing are typically five steps to developing an automation strategy:
1. What?
Assess for automation opportunities:
• Identify opportunity areas. For example, good candidate processes are those that:
1. Require manual interaction with a computer interface,
2. Are largely rules-based,
3. Consume a significant amount of time, and
4. Perform at frequent intervals.
• Select processes that are suitable to pilot such as low-risk areas with potential for significant reduction
in effort.
• Recognize the impacts of proceeding with the pilot.
2. Why?
Build the business case:
• Estimate the benefits of automation,
• Develop strategy for re-deploying existing resources, and
• Identify the metrics to evaluate the value of automation.
3. How?
Determine the optimal operating model:
• Identify the operating model that fits the organization’s need ,
• Build a team to support the deployment and carry out responsibilities (e.g., assessing, mapping, and pri-
oritizing new processes for automation).
4. Who?
Identify the automation partners:
• Consider sourcing options; direct, direct with support, or outsource,
• Select the RPA vendor who is able to cater the business needs the most,
• Determine the pricing model that best supports the business objectives.
5. When?
Plan the automation roadmap:
• Determine the length of the pilot program and stages after the pilot,
• Confirm that impacted stakeholders clearly understand the what, why, and how of automation,
• Identify commonly encountered obstacles and incorporate remediation activities into the plan.

356
Solutions to Review Questions
Chapter 1 Review Questions
1. What is the involvement of the CFO with the risk management process?
A. Incorrect. The internal audit activity provides senior management and the board with independent and ob-
jective assurance on governance, risk management, and controls. Therefore, providing independent evalua-
tions of preventative and detective measures is one of the Internal Audit’s main responsibilities.
B. Correct. Given the rapid pace of change in the business environment, tax, legal and regulatory land-
scapes, CFOs need to identify risks, and review and revalidate the risk management framework continual-
ly. Therefore, developing full understanding of changes in business profile and models would help CFOs
identify risks early and respond to them more effectively.
C. Incorrect. A Chief Executive Officer (CEO) is the highest-ranking executive in a company. Their primary re-
sponsibilities include making major corporate decisions and managing the overall operations and resources
of a company. Defining the principles of operation and implementing the company’s long- and short-term
plans are the examples of a CEO’s responsibilities.
D. Incorrect. In general, the Chief Information Security Officer (CISO) develops and implements an information
security program, which includes procedures and policies designed to protect enterprise communications,
systems and assets from both internal and external threats. Thus, setting security policies and procedures is
considered as one of the CISO’s primary duties.
2. CFOs are usually concerned with which of the following tasks?
A. Incorrect. The preparation of tax returns is a typical responsibility of the controller.
B. Incorrect. Developing a chart of accounts is a function of the controller.
C. Incorrect. The accounting system helps to safeguard assets.
D. Correct. The CFO and the Controller are two primary types of financial leadership within an organiza-
tion. The CFO and the Controller play very important, yet different roles within growing companies. In
general, the CFO is a strategist, a key member of the senior management team. The CFO, being the fi-
nance leader of an organization, and overseeing accounting, finance, payroll and tax departments, has
primary fiduciary and financial responsibility for the company. Thus, the CFO rather than Controller is
concerned with investor relations.

357
3. The treasury function is usually NOT concerned with which of the following activities?
A. Correct. Treasurers are usually concerned with investing cash and near-cash assets, the provision of
capital, investor relations, insurance, etc. Controllers, on the other hand, are responsible for the re-
porting and accounting activities of an organization, including financial reporting.
B. Incorrect. Short-term financing lies within the normal range of a treasurer's functions.
C. Incorrect. The treasurer has custody of assets.
D. Incorrect. Credit operations are often within the treasurer's purview.
Chapter 2 Section 1 Review Questions
1. According to the SFAC (Statement of Financial Accounting Concepts) No. 1, on what are the objectives of
financial reporting for business-based enterprises?
A. Incorrect. U.S. GAAP governs how to account for items in the financial statements.
B. Incorrect. Financial reporting provides information that is helpful in evaluating management's steward-
ship but does not directly provide information about that performance.
C. Incorrect. Conservatism is a qualitative characteristic.
D. Correct. SFAC No. 1 states that one objective of financial reporting is to provide information that is
useful to present and potential investors, creditors, and other users in making rational investment,
credit and similar decisions.
2. What is the primary purpose of the balance sheet?
A. Incorrect. Assets are included but are not limited to fair value.
B. Incorrect. Financial statements reflect the going concern assumption. Hence, they usually do not report
forced liquidation values.
C. Correct. The balance sheet presents three major financial accounting elements: assets, liabilities, and
equity. Assets are probable future economic benefits resulting from past transactions or events. Lia-
bilities are probable future sacrifices of economic benefits arising from present obligations as a result
of past transactions or events. Equity is the residual interest in the assets after deduction of liabilities.
D. Incorrect. The future value of a company’s stock is more dependent upon future operations and inves-
tors’ expectations than on the data found in the balance sheet.

358
Chapter 2 Section 2 Review Questions
3. How can a statement of cash flows help users of financial statements?
A. Correct. The statement of cash flows shows the sources and uses of cash, which is a basis for cash flow
analysis for managers. The statement aids in answering vital questions like "where was money ob-
tained?" and "where was money put and for what purpose?" If studied with information in the other
financial statements, the statement of cash flows should help users to assess the entity’s ability to
generate positive future net cash flows (liquidity), its ability to meet obligations (solvency) and pay
dividends, the need for external financing, the reasons for differences between income and cash re-
ceipt sand payments, and the cash and noncash aspects of the investing and financing activities.
B. Incorrect. The statement of cash flows deals with only one resource-cash.
C. Incorrect. The income statement shows the components of income from operations.
D. Incorrect. The identity of stock buyers and sellers is not disclosed.
4. In a statement of cash flows, which of the following would increase reported cash flows from operating ac-
tivities?
A. Correct. Operating activities are connected to the manufacture and sale of goods or the rendering of
services. Cash inflows from operating activities include (1) cash sales or collections on receivable aris-
ing from the initial sale of merchandise or rendering of service and (2) cash receipts from debt securi-
ties (e.g., interest income) or equity securities (e.g., dividend income) of other entities.
B. Incorrect. The sale of equipment is an investing activity.
C. Incorrect. An early retirement of bonds is a financing activity.
D. Incorrect. A change in accounting principle is a noncash event.
5. During the year, Beck Co. purchased equipment for cash of $47,000, and sold equipment with a $10,000 car-
rying value for a gain of $5,000. How should these transactions be reported in Beck's statement of cash
flows?
A. Incorrect. Cash inflows and outflows ordinarily are not netted.
B. Incorrect. An outflow of $42,000 assumes netting and a $5,000 inflow.
C. Incorrect. The cash inflow was $15,000. Beck received the $10,000 carrying value and a $5,000 gain.
D. Correct. Investing activities include making and collecting loans and acquiring and disposing of debt or
equity instruments and property, plant, and equipment and other productive assets, that is, assets
held for or used in the production of goods or services (other than the materials held in inventory).
Thus, the cash effects of purchases and sales of equipment should be reported in the investing cash

359
flows section of the statement of cash flows. Moreover, cash inflows and outflows ordinarily are not
netted. They should be reported separately at gross amounts. Accordingly, Beck should report a cash
inflow of $15,000 ($10,000 carrying value + $5,000 gain) for the sale of equipment and a $47,000 out-
flow for the purchase. In adjusting accrual-based net income to net operating cash flow, the $5,000
gain on the sale of equipment should be subtracted to prevent double counting.
6. Ocean Company follows IFRS for its external financial reporting. Which of the following methods of report-
ing are acceptable under IFRS for the items shown?
A. Correct. Ocean Company is permitted to classify these as such under IFRS, whereas under U.S. GAAP,
both would need to be under the operating activities.
B. Incorrect. Dividends received cannot be reported under financing activities under IFRS.
C. Incorrect. Interest received cannot be classified under financing activities to conform to IFRS.
D. Incorrect. Dividends paid would be under operating or financing activities.
7. What is the purpose of information presented in notes to the financial statements?
A. Correct. Notes are an integral part of the basic financial statements. Notes provide information es-
sential to understanding the financial statements, including disclosures required by U.S. GAAP.
B. Incorrect. Notes may not be used to rectify an improper presentation.
C. Incorrect. Disclosure in notes is not a substitute for recognition in financial statements for items that
meet recognition criteria.
D. Incorrect. Management's responses to auditor comments are not an appropriate subject of financial re-
porting.
Chapter 3 Section 1 Review Questions
1. Which of the following conditions is NOT required for a contract to exist?
A. Incorrect. An entity must be able to identify each party’s rights regarding the goods and services prom-
ised in the contract to assess its obligations under the contract. Revenue cannot be recognized related
to a contract (written or oral) where the rights of each party cannot be identified.
B. Incorrect. The payment terms for goods or services must be known before a contract can exist. This is
because without that understanding, an entity cannot determine the transaction price.
C. Correct. Contracts can be written, oral, or implied by an entity’s customary business practices as long
as they create enforceable rights and obligations between two or more parties. Therefore, the written
approval is not required for a contract to exist.
360
D. Incorrect. An entity only applies the revenue guidance to contracts when it is “probable” that the entity
will collect the consideration it is entitled to in exchange for the goods or services it transfers to the cus-
tomer.
2. Johnson Inc. (Lessee) obtains control of the leased equipment with a lease term, and 75% of the remaining
economic life of the equipment. How does Johnson Inc. account for this agreement in accordance with ASC
842?
A. Correct. For lessees, a lease is a finance lease if the lessee effectively obtains control of the underlying
asset, by meeting any of the five criteria required by ASC 842. For example, the lease term is for a ma-
jor part (generally 75%) of the remaining economic life of the underlying asset.
B. Incorrect. Operating lease occurs when a lessor transfers the use of an asset to a lessee for a period of
time but does not effectively transfer control of the underlying asset.
C. Incorrect. Leveraged lease occurs when a lessor (equity participant) finances a minimal amount of the
purchase but has total equity ownership. A leveraged lease must satisfy all of these three conditions: 1)
there are three participants: lessee, lessor, and long-term creditor. The creditor provides nonrecourse
financing, with the lessor having substantial leverage (usually 60% or more of the lessor's cost of the
property) 2) the lessor's net receivable (investment) decreases in the early years of lease and then in-
creases in later years, and 3) the lease meets the test for being a direct financing lease.
D. Incorrect. Sublease refers to an underlying asset that is re-leased by the original lessee (or intermediate
lessor) to a third party, and the lease (or head lease) between the original lessor and lessee remains in
effect.
3. Combined statements may be used to present the results of operations by which of the following entities?
A. Incorrect. Common management justifies the use of combined financial statements.
B. Incorrect. Common control justifies the use of combined statements.
C. Incorrect. Either common management or common control is justification for the use of combined
statements.
D. Correct. Combined (as distinguished from consolidated) statements of commonly controlled entities
may be more meaningful than separate statements. For example, combined statements may be used
(1) to combine the statements of several entities with related operations when one individual owns a
controlling financial interest in them, or (2) to combine the statements of entities under common
management.
4. Perez, Inc. owns 80% of Senior, Inc. During the year just ended, Perez sold goods with a 40% gross profit to
Senior. Senior sold all of these goods during the year. In its consolidated financial statements for the year,
how should the summation of Perez and Senior income statement items be adjusted?

361
A. Correct. Given that all of the goods were sold, no adjustment is necessary for intercompany profit in
ending inventory. Accordingly, the parent company cost should be included in consolidated cost of
goods sold, and the price received by the subsidiary should be included in consolidated sales. The re-
quired adjustment is to eliminate the sale recorded by the parent company and the cost of goods sold
recorded by the subsidiary.
B. Incorrect. The elimination is made without regard to the noncontrolling interest.
C. Incorrect. No profit should be eliminated. All of the goods sold to Senior have been resold.
D. Incorrect. Sales and cost of sales should be reduced.
Chapter 3 Section 2 Review Questions
5. With respect to the computation of earnings per share, which of the following would be most indicative of a
simple capital structure?
A. Incorrect. A simple capital structure does not include convertible securities.
B. Incorrect. Convertible securities are a part of a complex capital structure.
C. Correct. A simple capital structure is defined as one that has only common stock outstanding. A com-
plex capital structure is one that contains potential common stock. Potential common stock includes
options, warrants, convertible securities, contingent stock requirements, and any other security or
contract that may entitle the holder to obtain common stock.
D. Incorrect. Stock options are potential common stock.
6. Deck Co. had 120,000 shares of common stock outstanding at January 1, 20X5. On July 1, 20X5, it issued
40,000 additional shares of common stock. Outstanding all year were 10,000 shares of nonconvertible cu-
mulative preferred stock. What is the number of shares that Deck should use to calculate 20X5 basic earn-
ings per share (BEPS)?
A. Correct. Basic earnings per share (BEPS) is used to measure earnings performance based on common
stock outstanding during the period. BEPS equals income available to common shareholders divided
by the weighted-average number of common shares outstanding. The weighted-average number of
common shares outstanding relates the portion of the period that the shares were outstanding to the
total time in the period. Consequently, the number of shares used to calculate BEPS is 140,000
{120,000 shares outstanding throughout the period + [40,000 shares x (6 months ÷ 12 months)]}.
B. Incorrect. 150,000 includes the preferred shares.
C. Incorrect. 160,000 includes the unweighted number of additional shares.
D. Incorrect. 170,000 includes the preferred shares and does not weight the additional common shares.

362
7. What type of change is one where the periods affected by a deferred cost change because additional infor-
mation has been obtained?
A. Incorrect. An accounting change based on new information is a change in estimate.
B. Incorrect. A change in accounting estimate should be accounted for on a prospective basis.
C. Correct. Accounting estimates change as new events occur, as more experience is acquired, or as addi-
tional information is obtained. A change in accounting estimate is accounted for on a prospective ba-
sis. Thus, a change in the periods benefitted by a deferred cost because of additional information is an
accounting change that should be reported in the period of change, as well as in future periods if the
change affects them.
D. Incorrect. An accounting change is defined as a change in a principle, an estimate, or the reporting enti-
ty. This change is a change in estimate.
8. Which of the following changes will result in a prospective change in the current year and years going for-
ward?
A. Incorrect. A change from an accounting principle that is not generally accepted to one that is accepted,
such as from the cash basis to the accrual basis for vacation pay, is a correction of an error that should
be treated as a prior-period adjustment.
B. Correct. With certain exceptions, a change from one generally accepted method of accounting to an-
other, such as a change in depreciation methods, should be reported as a cumulative effect type
change in accounting principle. The cumulative effect on prior periods' earnings should be reported
separately, net of tax, as a component of net income after income from continuing operations, and
discontinued operations.
C. Incorrect. A change to consolidated statements is a change in the reporting entity (a special change in
accounting principle) and therefore requires restatement of prior-period statements.
D. Incorrect. A change in the method of accounting for long-term construction-type contracts is a special
change in accounting principle that is reported as a restatement of prior-period statements.
Chapter 4 Review Questions
1. Which of the following is TRUE for the content of the Management's Discussion and Analysis (MD&A) sec-
tion of an annual report?
A. Incorrect. The MD&A is mandated by the SEC.
363
B. Correct. The content of the MD&A section is required by regulations of the SEC. The MD&A contains
standard financial statements and summarized financial data for at least 5 years. Other matters must
be included in annual reports to shareholders and in Form 10-K filed with the SEC.
C. Incorrect. Auditors are expected to read (not review or audit) the contents of the MD&A to be certain it
contains no material inconsistencies with the financial statements.
D. Incorrect. The IRS is the taxing authority and does not mandate the MD&A.
2. The Securities and Exchange Commission continues to encourage management to provide forward- looking
information to users of financial statements. What does the safe harbor rule do?
A. Correct. The SEC does not require forecasts but encourages companies to issue projections of future
economic performance. To encourage the publication of such information in SEC filings, the safe har-
bor rule was established to protect a company that prepares a forecast on a reasonable basis and in
good faith.
B. Incorrect. Both the company and management are protected if the forecast is made in good faith.
C. Incorrect. The objective is to encourage forecasts, not to delay them.
D. Incorrect. Anyone may use the forecast information.
3. For each of the following groups of customers, purchases amounted to 10% or more of the revenue of a
publicly held company. For which of these groups must the company disclose information about major cus-
tomers?
A. Incorrect. Federal and state governmental agencies are considered separate customers, not under
common control. Therefore, the company is not obligated to disclose any information about these
agencies.
B. Incorrect. Foreign governments are distinct and separate and, if they fall under the 10% rule, do not
need to be reported.
C. Correct. A group of customers under common control must be regarded as a single customer in de-
termining whether 10% or more of the revenue of an enterprise is derived from sales to any single
customer. A parent company and a subsidiary are under common control, and they should be regard-
ed as a single customer. Major customer disclosure is required when the parent company has 6% rev-
enue and the subsidiary of the parent has 4% revenue because the total combined revenue is 10% (6%
+ 4%).
D. Incorrect. The accounting standard does not lump all government agencies together, whether they are
U.S. or foreign agencies. Because these two distinct groups do not have over 10% of sales, they do not
need to be disclosed as major customers.

364
4. Which of the following is TRUE about the SEC registrants’ obligations for disclosures of cybersecurity risks
and cyber incidents?
A. Incorrect. Registrants should address cybersecurity risks and cybersecurity incidents in the MD&A sec-
tion of their Form 10-K and Form 10-Q if the costs or other consequences represent a material event,
trend, or uncertainty that is reasonably likely to have a material effect on the registrant’s operations, li-
quidity, or financial condition.
B. Correct. Registrants are required to disclose the risk of cyber incidents in Regulation S-K if these issues
make an investment in the company risky.
C. Incorrect. Registrants may not immediately know the impact of a cybersecurity incident and may be re-
quired to develop estimates to account for the various financial implications. Examples of estimates that
may be affected by cybersecurity incidents include estimates of warranty liability, allowances for prod-
uct returns, capitalized software costs, inventory, litigation, and deferred revenue.
D. Incorrect. A registrant may need to disclose information regarding any litigation in Item 103 of Regula-
tion S-K if a pending material legal proceeding, to which the registrant or any of its subsidiaries is a par-
ty, involves a cybersecurity incident.
Chapter 5 Review Questions
1. A company’s process risks are managed quantitatively. In addition, a chain of accountability is established.
What is the process maturity level for the company’s internal control over financial reporting?
A. Incorrect. The characteristics of a defined process include policies, process and standards defined, and a
“chain of certification” instead of a chain of accountability.
B. Incorrect. The characteristics of an optimizing process include best practices that are identified and
shared, world-class financial reporting processes, and organized efforts to remove inefficiency.
C. Incorrect. At the repeatable level, basic policies and control processes are established. Process activities
are repeating but not necessarily documented. A chain of accountability is not necessarily formalized.
D. Correct. At the managed level, a company’s process risks are managed quantitatively and aggregated
at corporate level. In addition, process-based self-assessment is applied to enforce a chain of account-
ability.
2. Which section of the Sarbanes-Oxley Act requires both the CEO and CFO to certify the fairness of a compa-
ny’s financial information?
A. Correct. Section 302 requires the chief executive officer (CEO) arid the chief financial officer (CFO) to
certify (to the SEC) both the fairness of the financial information in each quarterly and annual report,
and their responsibility for maintaining adequate disclosure controls and procedures.

365
B. Incorrect. In addition to the Section 302 requirement, Section 906 requires the compliance of the report
with the requirements of the Securities Exchange Act of 1934. Section 906 provides criminal penalties
for knowing or willful failure to comply.
C. Incorrect. Section 404 requires management of a public company and the company's independent audi-
tor to issue new reports at the end of every fiscal year: (1) management's report on its assessment of
the effectiveness of the company's internal control over financial reporting, and (2) independent audi-
tor's report on internal control over financial reporting.
D. Incorrect. Section 101 deals with board membership.
3. A company realizes that the cost of deploying an internal audit is too high. In such a circumstance, which of
the following functions, independent of operations, should be created to ensure consistent SOX Section 404
compliance?
A. Incorrect. Financial management has the responsibility to adopt sound accounting policies and to estab-
lish and maintain internal controls that will record, process, summarize, and report transactions, events,
and conditions consistent with the assertions in the financial statements. Therefore, it is not independ-
ent of operations.
B. Correct. A risk control group does not execute processes and controls. It is usually independent of op-
erations, reporting to the CFO, or the CRO. It plays a vital role in assuring ongoing compliance with
Section 404 through its knowledge of risk, SOX requirements and business processes.
C. Incorrect. A project steering committee is frequently used for guiding and monitoring IT projects within
a large company as part of project governance. The functions of the committee may include planning,
providing assistance and guidance, monitoring the progress, controlling the project scope and resolving
conflicts.
D. Incorrect. Risk management is the identification, evaluation, and prioritization of risks followed by coor-
dinated and economical application of resources to minimize, monitor, and control the probability or
impact of unfortunate events or to maximize the realization of opportunities.
Chapter 6 Review Questions
1. What is a compensating balance?
A. Correct. Banks sometimes require a borrower to keep a certain percentage of the face amount of a
loan in a noninterest-bearing checking account. This requirement raises the effective rate of interest
paid by the borrower. Cash in some bank accounts may not be available for investment. For example,
when a bank lends you money, it may require you to retain funds on hand as collateral. This deposit
is referred to as a compensating balance, which in effect represents restricted cash.
366
B. Incorrect. In financial accounting, a valuation allowance is used to reflect losses on marketable securi-
ties.
C. Incorrect. Safety stock is held for such purposes.
D. Incorrect. Interest deducted in advance is discount interest.
2. Using a 360-day year, what is the opportunity cost to a buyer of NOT accepting terms 3/10, net 45?
A. Incorrect. 55.67% is based on terms of 3/10, net 30.
B. Correct. Payments should be made within discount periods if the return is more than the firm's cost of
capital. With terms of 3/10, net 45, the buyer is earning a 3% savings for paying on the tenth day, or
35 days earlier than would otherwise be required. For example, on a $1,000 invoice, the payment
would be only $970. The $30 savings is comparable to interest earned on a $970 loan to the vendor
(the payment is not due for another 35 days). The interest rate on this hypothetical loan is 3.09278%
($30/$970). That return is for a 35-day period. Annualizing the return requires determining the num-
ber of 35-day periods in a year. Multiplying the return for 35 days times the periods in a year results in
an annual rate of return of about 31.81% [3.09278% x (360 days/35 days)].
C. Incorrect. 22.27% is based on an earning period of 50 days.
D. Incorrect. 101.73% is based on a discount of 9%.
3. When a company analyzes credit applicants and increases the quality of the accounts rejected, what is the
company attempting to do?
A. Incorrect. Tightening credit will reduce sales.
B. Incorrect. Tightening credit will reduce bad-debt losses.
C. Incorrect. Most likely, higher quality accounts will mean a shorter average collection period.
D. Correct. Increasing the quality of the accounts rejected means that fewer sales will be made. The
company is therefore not trying to maximize its sales or increase its bad-debt losses. The objective is
to reduce bad-debt losses and thereby maximize profits.
4. Which one of the following financial instruments generally provides the largest source of short-term credit
for small firms?
A. Incorrect. Installment loans are usually a longer-term source of financing and are more difficult to ac-
quire than short-term sources of financing.
B. Incorrect. Commercial paper is normally used only by large companies with a high credit rating.

367
C. Correct. Accounts payable refers to balances owed to suppliers. It is a spontaneous (recurring) financ-
ing source, since it comes from normal operations, and is the least expensive form of financing inven-
tory. Because of its ease in use, trade credit is the largest source of short-term financing for many
firms both large and small.
D. Incorrect. Bankers' acceptances are drafts drawn on bank deposits; the acceptance is a guarantee of
payment at maturity. It is a popular source of short-term financing, albeit not the largest source.
Chapter 7 Review Questions
1. Which one of the following management considerations is usually addressed first in strategic planning?
A. Incorrect. Outsourcing is an operating decision of a more short-term nature.
B. Correct. Strategic planning is the process of setting overall organizational objectives and drafting stra-
tegic plans. It is a process of long-term planning. Setting ultimate objectives for the firm is a necessary
prelude to developing strategies for achieving those objectives. Plans and budgets are then needed to
implement those strategies.
C. Incorrect. Organizational structure, although important in strategic planning, is based upon the firm's
overall objectives.
D. Incorrect. Recent annual budgets are a basis for short-term planning.
2. What are the major objectives of any budget system?
A. Incorrect. Budgets follow the creation of responsibility centers; they measure performance; and they
only promote goal congruence among responsibility centers.
B. Incorrect. A budget system is designed to foster the planning and control of operations and to promote
goal congruence between superiors and subordinates.
C. Correct. A budget is a financial plan to control future operations and results. Budgeting facilitates con-
trol and communication and also provides motivation to employees. The process of budgeting forces a
company to establish goals, determine the resources necessary to achieve those goals, and anticipate
future difficulties in their achievement. A budget is also a control tool because it establishes standards
and facilitates comparison of actual and budgeted performance. Thus, it motivates good performance
by highlighting the work of effective managers. Moreover, the nature of budgeting fosters the com-
munication of goals to company subunits and coordination of their efforts. Budgeting activities must
be coordinated because they are interdependent.
D. Incorrect. Budgets follow the creation of responsibility centers, measure performance, make corrective
actions, and promote goal congruence among managers.

368
3. There are various budgets within the master budget cycle. One of these budgets is the production budget.
Which one of the following best describes the production budget?
A. Incorrect. A production budget is usually prepared in terms of units of output rather than costs.
B. Incorrect. The direct labor budget is prepared after the production budget.
C. Incorrect. The materials purchased budget is prepared after the production budget.
D. Correct. A production budget is based on sales forecasts, in units, with adjustments for beginning and
ending inventories. It is used to plan when items will be produced. After the production budget has
been completed, it is used to prepare materials purchased, direct labor, and factory overhead budg-
ets.
Chapter 8 Review Questions
1. Contribution margin is the excess of revenues over which of the following items?
A. Incorrect. Revenues minus cost of goods sold is gross profit (margin).
B. Incorrect. Variable costs coming from manufacturing are also part of the calculation. However, the fixed
costs of manufacturing are not.
C. Incorrect. A direct cost is a cost that can be associated with a single cost object and includes both varia-
ble and fixed costs.
D. Correct. Contribution margin is the excess of revenues over all variable costs (including both manufac-
turing and nonmanufacturing variable costs) that vary with an output-related cost driver. The contri-
bution margin equals the amount of margin that contributes toward covering the fixed costs and
providing a net income.
2. When does the break-even point in units increase?
A. Correct. The break-even point in units is calculated by dividing the fixed costs by the unit contribution
margin. If the selling price is constant and unit costs increases, the unit CM will decline, resulting in an
increase of the break-even point.
B. Incorrect. A decrease in costs will lower the break-even point. The contribution margin per unit will in-
crease.
C. Incorrect. Increase in the selling price will also increase the CM per unit, resulting in a lower break-even
point.
D. Incorrect. The magnitude of the increases in costs and in sales price must be known to determine their
overall effect on the unit CM.

369
3. The following information pertains to Syl Co.: Revenues = $800,000; Variable Costs = $160,000; Fixed Costs =
$40,000. What is Syl’s breakeven point in sales revenues?
A. Incorrect. $200,000 is the sum of FC and VC at the $800,000 sales level.
B. Incorrect. $160,000 is VC at the $800,000 revenue level.
C. Correct. The break-even sales are the fixed costs (FC) divided by the contribution margin ratio (CM ra-
tio). Variable costs (VC) equal 20% of sales ($160,000 / $800,000). Hence, the contribution margin ra-
tio is 80%, and the break-even point in dollars is $50,000 ($40,000 FC / 80%).
D. Incorrect. $40,000 is the Fixed Cost, which is divided by the CM in the break-even equation.
Chapter 9 Review Questions
1. Which one of the following is the best characteristic concerning a capital expenditure budget?
A. Incorrect. Capital budgeting involves long-term investment needs, not immediate operating needs.
B. Incorrect. Strategic planning establishes long-term goals in the context of relevant factors in the firm’s
environment.
C. Incorrect. Cash budgeting determines operating cash flows. Capital budgeting evaluates the rate of re-
turn on specific investment alternatives.
D. Correct. Capital budgeting is the process of planning expenditures for long-lived assets. The capital
expenditure budget involves choosing among investment proposal using a ranking procedure. Evalua-
tions are based on various measures involving rate of return on investments.
2. Smith Corp. is considering the purchase of a new machine for $78,000. The machine would generate an an-
nual cash flow of $23,214 for five years. At the end of five years, the machine would have no salvage value.
What is the payback period in years for the machine approximated to two decimal points?
A. Correct. The payback period measures the length of time required to recover the amount of initial in-
vestment. When the annual cash flows are constant and of equal amounts, then the payback period
can be calculated by dividing the initial investment by the cash inflows through increased revenues or
cost savings. The payback period in years for the machine equals 3.36 ($78,000/$23,214).
B. Incorrect. The annual cash flow is $23,214 which gives the payback period in 3.36 years. To have a 9.48
year payback period, the machine would only need to generate an annual cash flow of $8,227.85
($78,000/$8,227.85 = 9.48).

370
C. Incorrect. The annual cash flow is $23,214 which gives the payback period in 3.36 years. To have a 3.00
year payback period, the machine would need to generate an annual cash flow of $26,000
($78,000/$26,000 = 3).
D. Incorrect. The annual cash flow is $23,214 which gives the payback period in 3.36 years. To have a 4.00
year payback period, the machine would only need to generate an annual cash flow of $19,500
($78,000/$19,500 = 4).
3. Which of the following statements is true if an investment project has a profitability index of 1.15?
A. Incorrect. The IRR is the discount rate at which the NPV is $0, which is also the rate at which the profita-
bility index is 1.0. The IRR cannot be determined solely from the index.
B. Incorrect. If the index is 1.15 and the discount rate is the cost of capital, the NPV is positive, and the IRR
must be higher than the cost of capital.
C. Incorrect. The IRR is a discount rate, whereas the NPV is an amount.
D. Correct. The profitability index is the ratio of the present value of future net cash inflows to the initial
net cash investment. It is a variation of the NPV method that facilitates comparison of different-sized
investments. A profitability index greater than 1.0 indicates a profitable investment or one that has a
positive net present value.
4. How do the net present value (NPV) and internal rate of return (IRR) differ?
A. Correct. NPV assumes that cash inflows from the investment project can be reinvested at the cost of
capital, whereas IRR assumes that cash inflows from each project can be reinvested at the IRR for that
particular project. This underlying assumption is considered to be a weakness of the IRR technique.
The cost of capital is the appropriate reinvestment rate because it represents the opportunity cost for
a project at a given level of risk. The problem with the IRR method is that it assumes a higher discount
rate even through a project may not have a greater level of risk.
B. Incorrect. NPV and IRR make consistent accept/reject decisions for independent projects. When NPV is
positive, IRR exceeds the cost of capital and the project is acceptable.
C. Incorrect. The NPV method can be used to rank mutually exclusive projects, whereas IRR cannot. The re-
investment rate assumption causes IRR to make faulty project rankings under some circumstances.
D. Incorrect. IRR is expressed as a percentage and NPV in dollar terms.
Chapter 10 Section 1 Review Questions
1. Which of the following financial statement analyses is most useful in determining whether the various ex-
penses of a given company are higher or lower than industry averages?

371
A. Incorrect. A horizontal analysis indicates the proportionate change over a period of time and is useful in
the trend analysis of an individual entity.
B. Correct. Vertical analysis is the expression of each item on a financial statement in a given period in
relation to a base figure. On the income statement, each item is stated as a percentage of sales. Thus,
the percentages for the company in question can be compared with the industry average.
C. Incorrect. Activity ratio analysis includes the preparation of turnover ratios such as those for receivables,
inventory, and total assets.
D. Incorrect. A trend analysis indicates changes in an individual entity over a period of time.
2. Which of the following is the worst limitation of ratio analysis affecting comparability from one interim peri-
od to the next within a firm?
A. Incorrect. Management has less incentive to window dress on interim statements and for internal pur-
poses.
B. Correct. Ratio analysis may be affected by seasonal factors. For example, inventory and receivables
may vary widely, and the year-end balances may not reflect the averages for the period or the balanc-
es at the end of various interim periods.
C. Incorrect. Comparability limitations resulting from different firms using different accounting policies are
a concern when making industry comparisons; it would not be a problem for intra- firm comparisons.
D. Incorrect. Intra-firm comparability is not affected by questions about whether alternative industries
have different ratios, which are strong indicators of financial health.
3. Lincoln Corporation computed the following items from its financial records for the current year: Current
ratio = 2 to 1; Average age of inventory = 54 days; Average collection period = 24 days; Average payable pe-
riod = 36 days. What was the number of days in Lincoln's cash conversion cycle for the current year?
A. Incorrect. 54 is simply the number of days' sales in receivables.
B. Incorrect. 90 is the sum of the number of days' sales in inventory and the number of days' purchases in
payables.
C. Incorrect. The operating cycle is the time needed to turn cash into inventory, inventory into receivables,
and receivables back into cash. It is equal to the sum of the number of days' sales in inventory and the
number of days' sales in receivables. The number of Lincoln's days' sales in inventory is given as 54 days.
The number of days' sales in receivables is given as 24. Therefore, the number of days in the operating
cycle is 78 (54 + 24).
D. Correct. 42 is the cash conversion cycle. This is the sum of the number of days' sales in inventory and
the number of days' sales in receivables minus the number of days' purchases in payables, for exam-
ple, 42 = (54 + 24 – 36).

372
4. A growing enterprise is assessing current working capital requirements. An average of 58 days is required to
convert raw materials into finished goods and to sell them. Then, an average of 32 days is required to collect
on receivables. If the average time the enterprise takes to pay for its raw materials is 15 days after they are
received, what is the total cash conversion cycle?
A. Incorrect. 11 days results from subtracting the receivables collection period.
B. Incorrect. 41 days results from subtracting the receivables collection period and adding the payables de-
ferral period.
C. Correct. The cash conversion cycle is the length of time between paying for purchases and receiving
cash from the sale of finished goods. It equals the inventory conversion period, plus the receivables
collection period, minus the accounts payable period, or 75 days (58 days + 32 days - 15 days).
D. Incorrect. 90 days omits the accounts payable period.
Chapter 10 Section 2 Review Questions
5. Windham Company has current assets of $400,000 and current liabilities of $500,000. Which of the follow-
ing would increase Windham Company's current ratio?
A. Correct. Current ratio = (current assets)/(current liabilities). An equal increase in both the numerator
and denominator of a current ratio less than 1.0 causes the ratio to increase. Windham Company's
current ratio is .8 ($400,000/$500,000). The purchase of $100,000 of inventory on account would in-
crease the current assets to $500,000 and the current liabilities to $600,000, resulting in a new current
ratio of .833.
B. Incorrect. Although the numerator and denominator decrease by the same number, this transaction de-
creases the current ratio to ($300,000/$400,000) = .75.
C. Incorrect. The current ratio would be unchanged.
D. Incorrect. This transaction decreases the current ratio because the denominator increases while the
numerator stays the same: ($400,000/$600,000) = .67.
6. When a balance sheet amount is related to an income statement amount in computing a ratio, which of the
following is TRUE?
A. Incorrect. The income statement amount is a single figure for an entire year; there is nothing to average.
B. Correct. In ratios such as inventory turnover, asset turnover, receivables turnover, and return on as-
sets, the balance sheet figure should be an average for the period. The reason is that the income
statement amounts represent activity over a period. Thus, the balance sheet figure should be adjust-
ed to reflect assets available for use throughout the period.
373
C. Incorrect. Traditional financial statements and the ratios computed from the data they present are
mostly stated in historical cost terms.
D. Incorrect. Comparison is the purpose of ratio usage. All ratios are meaningless unless compared to
something else, such as an industry average.
7. The accounts receivable turnover ratio will normally decrease as a result of which of the following?
A. Incorrect. Write-offs do not reduce net receivables (gross receivables - the allowance) and will not affect
the receivables balance (and therefore the turnover ratio) if an allowance system is used.
B. Incorrect. A decline in sales near the end of the period signifies fewer credit sales and receivables, and
the effect of reducing the numerator and denominator by equal amounts is to increase the ratio if the
fraction is greater than 1.0.
C. Incorrect. An increase in cash sales with no diminution of credit sales will not affect receivables.
D. Correct. Accounts receivable turnover = (net credit sales) / (average accounts receivable). Hence, it
will decrease if a company lengthens the credit period or the discount period because the denomina-
tor will increase as receivables are held for longer times.
8. The following ratios relate to a company’s financial situation compared with that of its industry: The compa-
ny has a ROI = 7.9% and a ROE = 15.2%. The industry has a ROI = 9.2% and a ROE = 12.9%. What conclusion
could a financial analyst validly draw from these ratios?
A. Incorrect. The question gave no information about market share.
B. Correct. The use of financial leverage has a multiplier effect on the return on assets. The extended
DuPont formula illustrates this point by showing that the return on equity equals the ROI times the
leverage factory, also called the equity multiplier (total assets/common equity). Thus, greater use of
debt increases the equity multiplier and the return on equity. In this example, the equity multiplier is
1.92 (15.2% ROE/7.9% ROI), and the industry average is 1.40 (12.9% ROE/9.2% ROI). The higher equity
multiplier indicates that the company uses more debt than the industry average.
C. Incorrect. This comparison is with an industry average, not over time.
D. Incorrect. Share valuation is a response to many factors. The higher-than-average return on equity does
not mean that the company has a more favorable market-to-carrying-amount ratio.
9. If a company is profitable and is effectively using leverage, which one of the following ratios is likely to be
the largest?
A. Incorrect. Return on equity will be higher than the return on assets if the firm is profitable and using lev-
erage effectively.

374
B. Incorrect. Return on operating assets will be lower than the return on common equity if the firm is prof-
itable and using leverage effectively.
C. Correct. The purpose of leverage is to use creditor capital to earn income for shareholders. If the re-
turn on the resources provided by creditors or preferred shareholders exceeds the cost (interest or
fixed dividends), leverage is being used effectively, and the return to common equity will be higher
than the other measures. The reason is that common equity provides a smaller proportion of the in-
vestment than in an unleveraged company.
D. Incorrect. Return on total shareholder's equity will be lower than the return on common equity if the
firm is using other people’s money (OPM) profitably.
Chapter 11 Review Questions
1. Which of the following components drives transparency about risk management and enables monitoring of
performance?
A. Correct. Reporting a critical component of the risk management framework as it drives transparency
about risk and risk management throughout the organization to enable risk assessment, execution of
risk responses and control activities as well as monitoring of performance.
B. Incorrect. Internal and external events affecting achievement of an entity’s objectives must be identi-
fied, distinguishing between risks and opportunities. However, this process does not drive transparency
about risk management or enable monitoring of performance.
C. Incorrect. Objectives must exist before management can identify potential events affecting their
achievement. However, this step does not drive transparency about risk management or enable moni-
toring of performance.
D. Incorrect. Control activities are policies and procedures that are established and implemented to help
ensure the risk responses are effectively carried out.
2. A major change in customer wants can result in a rapid erosion of the market share. Management chooses
NOT to assume such risk. Which of the following actions reflects such a choice?
A. Incorrect. By not assuming the risk, management chooses to avoid it. Reducing production variability by
diversifying, integrating, and applying new technology is a strategy to reduce the risk instead of avoiding
it.
B. Incorrect. Outsourcing non-core processes to contractually transfer the risk is a way to shift the risk to
an independent counterparty. However, management chooses to avoid the risk not to share the risk
with a third party.
C. Incorrect. Repricing products by including an explicit premium in the pricing indicates that management
accepts the risk instead of avoiding it.
D. Correct. When management chooses NOT to assume the risk (chooses to avoid it), management elim-
inates the risk by preventing exposure to future possible events from occurring. In this case, action is

375
taken to stop the operational process or the part of the operational process causing the risk. For ex-
ample, the company may exit the market area by selling, liquidating, or spinning off the product
group.
3. According to the Three Lines of Defense model, which of the following positions usually acts as the first line
of defense in assessing finical risk?
A. Incorrect. As the third line of defense, the internal audit activity provides senior management and the
board with independent and objective assurance on governance, risk management, and controls.
B. Incorrect. The Chief Operating Officer (COO), primarily responsible for the daily operation of the compa-
ny, provides the leadership, management and vision necessary to ensure that the organization achieves
and surpasses sales, profitability, cash flows, and business goals and objectives. The COO is considered
the first line of defense in assessing operational risk instead of financial risk.
C. Incorrect. The Chief Information Security Officer (CISO) develops and implements an information securi-
ty program, which includes procedures and policies designed to protect enterprise communications, sys-
tems and assets from both internal and external threats. The CISO is considered the first line of defense
in assessing cybersecurity risk instead of financial risk.
D. Correct. A Chief Finance Officer (CFO), the financial leader of an organization, overseeing accounting,
finance, payroll and tax departments, has primary fiduciary and financial responsibility for the entity.
As the first line of defense, the CFO owns and manages financial risks.
Chapter 12 Review Questions
1. When is a call option on a common share more valuable?
A. Incorrect. A call option is the right to buy a common share at a set price for a specified time period. If
the underlying share has a lower market value, the call option is less, not more, valuable.
B. Correct. The lower the exercise price, the more valuable the call option. The exercise price is the price
at which the call holder has the right to purchase the underlying share.
C. Incorrect. A call option is less, not more, valuable given that it has less time to maturity. When the op-
tion has less time to maturity, the chance that the share price will rise is smaller.
D. Incorrect. A call option is less, not more, valuable if the price of the underlying share is less variable.
Less variability means a lower probability of a price increase.
2. Herbert Corporation was a party to the following transactions during November and December 20X7. Which
of these transactions most likely resulted in an investment in a derivative subject to the accounting pre-
scribed by ASC 815-20, Derivatives and Hedging?

376
A. Incorrect. It involves a net investment equal to the fair value of the stock.
B. Incorrect. It is based on an identifiable investment, not a derivative.
C. Incorrect. It is based on an identifiable event, not an underlying.
D. Correct. ASC 815 defines a derivative as a financial instrument or other contract that (1) has (a) one or
more underlyings and (b) one or more notional amounts or payment provisions, or both; (2) requires
either no initial net investment or an immaterial net investment; and (3) requires or permits net set-
tlement. An underlying may be a specified interest rate, security price, commodity price, foreign ex-
change rate, index of prices or rates, or other variable. A notional amount is a number of currency
units, shares, bushels, pounds, or other units specified. Settlement of a derivative is based on the in-
teraction of the notional amount and the underlying. The purchase of the forward contract as a hedge
of a forecasted need to purchase wheat meets the criteria prescribed by ASC 815.
Chapter 13 Review Questions
1. What are debentures?
A. Incorrect. Unlike, debentures must pay interest regardless of earnings levels.
B. Incorrect. Debentures are not subordinated except to the extent of assets mortgaged against other
bond issues. Debentures are a general obligation of the borrower and rank equally with convertible
bonds.
C. Correct. Debentures are unsecured bonds. Although no assets are mortgaged as security for the
bonds, debentures are secured by the full faith and credit of the issuing firm. Debentures are a gen-
eral obligation of the borrower. Only companies with the best credit ratings can issue debentures be-
cause only the company's credit rating and reputation secure the bonds.
D. Incorrect. Debentures are not secured by mortgages on specific assets.
2. How do preferred and common stock differ?
A. Incorrect. Failure to pay dividends will not force the firm into bankruptcy, whether the dividends are for
common or preferred stock. Only failure to pay interest will force the firm into bankruptcy.
B. Correct. In the event of bankruptcy, the claims of preferred shareholders must be satisfied before
common shareholders receive anything. The interests of common shareholders are secondary to
those of all other claimants.
C. Incorrect. Preferred dividends are fixed, providing greater security of yield than common stocks.
D. Incorrect. The tax code designates that neither common stock dividends nor preferred stock dividends
are tax deductible.
377
3. What is a measure that describes the risk of an investment project relative to other investments in general?
A. Incorrect. The coefficient of variation compares risk with expected return (standard deviation ÷ ex-
pected return).
B. Correct. The required rate of return on equity capital in the Capital Asset Pricing Model (CAPM) is the
risk-free rate, plus the product of the market risk premium times the beta coefficient. The market risk
premium is the amount above the risk-free rate that will induce investment in the market. The beta
coefficient of an individual share is the correlation between the volatility (price variation) of the stock
market and that of the price of the individual share. For example, if an individual share goes up 15%
and the market only 10%, beta is 1.5.
C. Incorrect. Standard deviation measures dispersion (risk) of asset returns.
D. Incorrect. Expected return does not describe risk, but instead provides anticipated returns after assign-
ing probabilities.
4. What is the difference between the required rate of return on a given risky investment and that on a riskless
investment with the same expected return?
A. Correct. The capital asset pricing model (CAPM) states: rj = rf + b(rm – rf). In other words, the ex-
pected return = risk-free rate + beta x (market risk premium), where rj = the expected (or required) re-
turn on security j; rf = the risk-free rate on a security such as a T-bill; rm = the expected return on the
market portfolio (such as Standard and Poor's 500 Stock Composite Index or Dow Jones 30 Industri-
als); and b = beta, an index of systematic (non-diversifiable, noncontrollable) risk. The market risk
premium is the amount above the risk-free rate that will induce investment in the market. The beta
coefficient of an individual stock is the correlation between the price volatility of the stock market and
that of the price of the individual stock.
B. Incorrect. The coefficient of variation is the standard deviation of an investment’s returns divided by the
average return.
C. Incorrect. The standard deviation is a measure of the variability of an investment’s returns.
D. Incorrect. The beta coefficient measures the sensitivity of the investment’s returns to market volatility.
Chapter 14 Review Questions
1. What is the risk of loss because of fluctuations in the relative value of foreign currencies called?
A. Incorrect. Expropriation risk is the risk that the sovereign country in which the assets backing an invest-
ment are located will seize the assets without adequate compensation.

378
B. Incorrect. The beta value in the capital asset pricing model (CAPM) for a multinational firm is the sys-
tematic risk of a given multinational firm relative to that of the market as a whole.
C. Correct. Frequently, multinational companies (MNCs) are subject to currency risk (exchange rate risk)
and therefore are faced with a decision regarding forecasting foreign exchange rates. When amounts
to be paid or received are denominated in a foreign currency, exchange rate fluctuations may result in
exchange gains or losses. For example, if a U.S. firm has a receivable fixed in terms of units of a for-
eign currency, a decline in the value of that currency relative to the U.S. dollar results in a foreign ex-
change loss.
D. Incorrect. The beta value in the CAPM for a multinational firm is the systematic risk of a given multina-
tional firm relative to that of the market as a whole. It is an undiversifiable risk.
2. In foreign currency markets, when will the U.S. dollar sell at a premium?
A. Incorrect. If the forward exchange rate in terms of foreign currency units per dollar is lower than the
spot rate, the U.S. dollar is selling at a discount.
B. Correct. If the forward rate in terms of foreign currency units per dollar is greater than the spot rate,
the dollar is selling at a premium and the foreign currency at a discount. Speculators expect the dollar
to appreciate.
C. Incorrect. Speculators expect the dollar to appreciate if it is selling at a premium.
D. Incorrect. When the foreign nominal interest rate is lower than the domestic nominal rate, the forward
foreign currency sells at a premium.
3. What does a forward contract involve?
A. Incorrect. The price of a future contract is determined on the day of commitment, not some time in the
future.
B. Incorrect. Performance is deferred in a future contract, and the price of the product is not necessarily its
present price. The price can be any price determined on the day of commitment.
C. Correct. A forward contract is an executory contract in which the parties involved agree to the terms
of a purchase and a sale, but performance is deferred. Accordingly, a forward contract involves a
commitment today to purchase a product on a specific future date, at a price determined today.
D. Incorrect. A forward contract is a firm commitment to purchase a product. It is not based on a contin-
gency. Also, a forward contract does not involve an exercise price (exercise price is in an option con-
tract).

379
Chapter 15 Review Questions
1. What is the most typical sequence of the procure-to-pay (P2P) process?
A. Incorrect. A list of approved vendors is maintained in the Procure-to-Pay (P2P) system. Thus, the vendor
is usually identified from the approved list prior to the request for the product.
B. Incorrect. Invoices from vendors are matched with purchase orders and receiving reports (three-way
match). Therefore, the invoice matching process should occur after the goods are received.
C. Incorrect. The vendor selection should occur before the request for the product and issuance of the pur-
chase order. This sequence ensures that only legitimate and approved vendors are being used.
D. Correct. P2P systems enable the integration of the Purchasing department and Accounts Payable de-
partment linking the procurement and accounts payable systems processes; from the vendor selec-
tion, request for the product to the issuance of the purchase order, receipt of the goods, to the match
and payment of the invoice.
2. Which of the following IT infrastructures is best at supporting a fast-growing company for a timely and accu-
rate closing?
A. Incorrect. For a fast-growing company, it is often challenging to obtain accurate and timely information
from subsidiaries because information submitted by subsidiaries is generated from multiple general
ledger systems. Big companies with multiple subsidiaries should consider implementing a fully integrat-
ed system allowing all accounting systems to feed directly into the general ledger. In other words, the
company needs to have one version of an ERP system operating in a central location instead of having
multiple systems throughout the business.
B. Incorrect. Although Excel is a very useful tool to accountants, it is not an automated process; there is a
lack of automation and control. It cannot support collaboration workflows, especially for a fast-growing
company. A technology-enabled close is capable of automating consolidation and eliminating entries for
legal, statutory and management books. Moreover, workflow application is in place to integrate man-
agement review in both the internal and external reporting process.
C. Correct. Mundane and repetitive tasks, such as report running, calculating depreciation, allocation,
and purchase order processing, can be automated to reduce the closing cycle time. Many leading
companies have already invested in automation of many elements of financial consolidation such as
journal entries, consolidation of entries, intercompany matching and elimination, currency conver-
sion, and equity elimination.
D. Incorrect. One of the common challenges faced by companies is that accountants spend lots of time
reconciling accounts and resolving discrepancies. Although sub-ledger data is interfaced with GL, the
systems are not fully integrated as they require manual intervention and manual reconciliation to test
data integrity and accuracy.

380
3. How does robotic process automation (RPA) transform the accounts payable operations?
A. Incorrect. Cloud computing allows businesses to use shared IT infrastructure and applications on an as-
need basis transferring the responsibility from management ownership to an external provider.
B. Incorrect. A blockchain offers a secure and decentralized ledger of all transactions distributed and cryp-
tographically sealed, across a network. It functions as a constantly growing distributed network that
companies can use to record their transactions directly into a joint register.
C. Correct. Robotic Process Automation (RPA), a format to automate manual processes, reduces labor
required repeatable and rule-based tasks by using computer coded software programs.
D. Incorrect. Big data is creating new ways to gather and analyze the new volume, variety, and velocity of
data. It represents new opportunities to enable analytics-based decision-making that adds value to the
accounting function’s performance management.
Chapter 16 Review Questions
1. Which of the following measures would be most useful to a CFO in evaluating a company’s financial perfor-
mance?
A. Correct. The rate of return measures the ability of the company to earn a profit on its total assets.
Therefore, a CFO is able to assess a company’s financial performance based on this measure.
B. Incorrect. Manufacturing cycle time is a measure related to the internal process not financial perfor-
mance. It measures the amount of time it takes to produce a defect-free unit of product from the time
raw material is received until the product is ready to deliver to customers.
C. Incorrect. Productivity is a measure of the relationship between outputs and inputs. It does not help a
CFO evaluate a company’s financial performance.
D. Incorrect. System efficiency, an IT service performance KPI, compares a server’s allocated resources to
its available resources at an optimum load. It shows if the server is wasting resources or is oversub-
scribed. Thus, it does not provide information helpful to a CFO in evaluating a company’s financial per-
formance.
2. Which of the following key performance indicators (KPI) is used to evaluate the performance of accounts
payable?
A. Incorrect. Rate of internal job hires, a human resource performance KPI, shows the effectiveness of or-
ganizational talent development.
B. Incorrect. Product performance KPI ranks products based on revenue performance to inform the sales
team which products are selling well.

381
C. Incorrect. Profit margin on sales indicates the dollar amount of net income the company receives from
each dollar of sales. This ratio reflects the ability of the company to control costs and expenses in rela-
tion to sales.
D. Correct. Vendor payment error rate, an accounting performance KPI, is a percentage of outgoing pay-
ments that were not completed due to a processing error.
3. What is an example of a non-financial benchmark?
A. Incorrect. The labor rate of a competitor is a financial benchmark.
B. Correct. Benchmarking is a continuous evaluation of the practices of the best organization in their
class and the adaptation of processes to reflect the best of these practices. It entails analysis and
measurement of key outputs against those of the best organizations. This procedure also involves
identifying the underlying key actions and causes that contribute to the performance difference. The
percentage of orders delivered on time at the company’s most efficient plant is an example of a non-
financial benchmark.
C. Incorrect. The cost per pound of a product at the company’s most efficient plant should be a financial
standard.
D. Incorrect. The cost of a training program is a benchmark from a financial perspective.
Chapter 17 Review Questions
1. Which of the following elements of internal control addresses the way management assigns authority and
responsibility?
A. Incorrect. Monitoring assesses the quality of internal control over time.
B. Correct. The control environment sets the tone of the organization, influencing the control conscious-
ness of all its employees. Factors that influence an organization’s control environment include: man‐
agement’s philosophy and operating style; the way in which management assigns authority and re-
sponsibility; the way management organizes and develops employees; and the attention and direction
provided by the governing board.
C. Incorrect. Risk assessment is the identification and analysis of relevant risks.
D. Incorrect. Control activities are the policies and procedures that help ensure that management direc-
tives are carried out. They include performance reviews, information processing, physical controls, and
segregation of duties.

382
2. Proper segregation of functional responsibilities to achieve effective internal control calls for the separation
of certain functions. Which of the following functions should be separated?
A. Incorrect. Payment is a form of execution (operational responsibility).
B. Correct. One person should not be responsible for all phases of a transaction, i.e., for authorization of
transactions, recording of transactions, and custodianship of the related assets. These duties should
be performed by separate individuals to reduce the opportunities to allow any person to be in a posi-
tion both to perpetrate and conceal errors or fraud in the normal course of his/her duties.
C. Incorrect. Custody of assets and execution of related transactions are often not segregated.
D. Incorrect. Payments must be recorded when made. These two functions are not separable.
3. Which of the following controls is considered the most proactive way to reduce the risk of theft or misuse of
inventory?
A. Incorrect. Detective controls are designed to detect and correct failures, inefficiencies, errors, and
weaknesses. They operate after an event has occurred or an output has been produced. Although annu-
al inventory count helps management to identify discrepancies between the book and actual inventory
on-hand, such control does not prevent the occurrence of theft or misuse of inventory. Therefore, it is
not considered the most proactive way to reduce the risk comparing to the preventive control.
B. Correct. Preventive controls are designed to prevent the occurrence of failures, inefficiencies, errors,
and weaknesses. For that reason, preventative controls are proactive controls operating during the
course of an activity or during the execution of employees' duties. Assets access control prevents
losses and reduce the risk of theft or misuse of inventory.
C. Incorrect. Reconciliation between the physical count and inventory records allows management to iden-
tify discrepancies. Such control is designed to detect (not prevent errors. It operates after an event, such
as a theft or misuse of inventory, has occurred. Therefore, it is not considered the most proactive way to
reduce the risk comparing to the preventive control.
D. Incorrect. Timely recording the receipt in the system does not prevent the occurrence of theft or misuse
of inventory. It is the process of confirming that a company received what it ordered, placing the item(s)
in the warehouse, and recording the receipt in the system.
383
Glossary Accelerated Depreciation Method: A depreciation method that allows the owner of the asset to take greater
amounts of depreciation during the early years of its life, thereby deferring some of the taxes until later years.
Accounting Exposure: Variability in the firm’s reported values for net income and net worth results from chang-
es in exchange rates.
Accounting Rate of Return: A capital-budgeting criterion that relates the returns generated by the project, as
measured by average accounting profits after tax, to the average dollar size of the investment required; also
called simple rate of return or unadjusted rate of return.
Accounts Receivable Turnover: Annual credit sales divided by average accounts receivable.
Acid Test Ratio: (Currents assets - inventories)/current liabilities. This ratio is a more stringent measure of liquid-
ity than the current ratio in that it subtracts inventories (the least liquid current asset) from current assets; also
called quick ratio.
Annual Report: An audited document issued annually by all publicly listed corporations to their shareholders in
accordance with SEC regulation. It contains information on financial results and overall performance of the pre-
vious fiscal year and comments on future outlook.
Asset Turnover: Sales divided by assets. A measure of the efficiency of asset management.
Benchmarking: Searching for new and better procedures by comparing your own procedures to that of the very
best.
Book Value : The depreciated value of a company's assets (original cost less accumulated depreciation) less the
outstanding liabilities.
Break-even point: Level of sales revenue that equals the total of the variable and fixed costs for a given volume
of output at a particular capacity use rate.
Break-even analysis: A branch of cost-volume-profit (CVP) analysis that determines the break-even sales, which
is the level of sales where total costs equal total revenue. At the break-even point, there is no profit or loss.
Capital Budgeting: Process of making long-term planning and capital expenditure decisions.
Capital Rationing : The placing of a limit by the firm on the dollar size of the capital budget.
Capital Structure: Composition of common stock, preferred stock, retained earnings, and long-term debt
maintained by the business entity in financing its assets.
Cash Flow Statement: A statement showing from what sources cash has come into the business and on what
the cash has been spent. Cash flow is broken down into operating, investing, and financing activities.
384
Contract: An agreement between two or more parties that creates enforceable rights and obligations.
Contribution Margin (CM): The difference between sales and the variable costs of the product or service, also
called marginal income. It is the amount of money available to cover fixed costs and generate profits.
Corporate Governance: The system of checks and balances designed to ensure that corporate managers are
just as vigilant on behalf of long-term shareholder value as they would be if it was their own money at risk. It is
also the process whereby shareholders—the actual owners of any publicly traded firm—assert their ownership
rights, through an elected board of directors and the CEO and other officers and managers they appoint and
oversee.
Cost of Capital: The rate that must be earned in order to satisfy the required rate of return of the firm's inves-
tors; also called minimum required rate of return. It may also be defined as the rate of return on investments at
which the price of the firm's common stock will remain unchanged. The cost of capital is based on the oppor-
tunity cost of funds as determined in the capital markets.
Cost-Volume Formula: A cost function in the form of y = a + bx. For example, the cost-volume formula for
factory overhead is y=$200 + $10x where y=estimated factory overhead and x=direct labor hours, which means
that the factory overhead is estimated to be $200 fixed, plus $10 per hour of direct labor. Cost analysts use the
formula for cost prediction and flexible budgeting purposes.
Cost-Volume-Profit (CVP) analysis: An analysis that deals with how profits and costs change with a change in
volume. It looks at the effects on profits of changes in such factors as variables costs, fixed costs, selling prices,
volume, and mix of products sold.
Cross Rate: The effective exchange rate between two currencies can be obtained by exchanging each currency for a third currency.
Currency Swap: An exchange of currencies between two firms is reversed at a specific rate and time in the fu-ture.
Current Ratio : Current assets divided by current liabilities.
Current Yield: A bond's coupon payment divided by its price.
Debt-to-Equity ratio: Total interest-bearing debt divided by owners' equity. It is a measure of financial leverage.
Devaluation: A reduction in the value of one currency compares to another currency. When the dollar depreci-
ates, it can be exchanged for fewer units of foreign currency.
Earnings per share (EPS): Earnings after tax divided by the total number of shares outstanding.
Economic Order Quantity (EOQ): Amount that should be ordered to minimize the total ordering and carrying
costs.
Financial Leverage: A portion of a firm's assets financed with debt instead of equity.

385
Flexible Budget: A budget based on cost-volume relationships and developed for the actual level of activity. It is
an extremely useful tool for comparing the actual cost incurred to the cost allowable for the activity level
achieved.
Forward Contract: A contract purchases a specified amount of currency at specified price at a specified time in the future.
Futures Contract: A standardized and guaranteed forward contract. The contracts are standardized with respect to price, quantity, and maturity. The standardization and guarantee makes it possible to trade futures contracts prior to maturity.
Initial Direct Costs: Incremental costs of a lease that would not have been incurred if the lease had not been
obtained.
Internal Rate Of Return (IRR): Rate earned on a proposal. It is the rate of interest that equates the initial
investment with the present value of future cash inflows.
Inventory turnover: The number of times inventory is sold during the year. It equals cost of goods sold divided
by the average dollar balance. Average inventory equals the beginning and ending balances divided by two.
Just-In-Time (JIT): A demand-pull system where demand for customer output (not plans for using input
resources) triggers production. Production activities are "pulled", not "pushed," into action.
Lead Time: Time between the placing of an order and its receipt in the inventory system.
Lease: A contract, or part of a contract, that conveys the right to control the use of identified property, plant, or
equipment (an identified asset) for a period of time in exchange for consideration.
Lease Liability: A lessee’s obligation to make the lease payments arising from a lease, measured on a discounted
basis.
Lease Receivable: A lessor’s right to receive lease payments arising from a sales-type lease or a direct financing
lease plus any amount that a lessor expects to derive from the underlying asset following the end of the lease
term to the extent that it is guaranteed by the lessee or any other third party unrelated to the lessor, measured
on a discounted basis.
Lease Term: The noncancellable period for which a lessee has the right to use an underlying asset, together with
all of the following:
1. Periods covered by an option to extend the lease if the lessee is reasonably certain to exercise that op-
tion, and
2. Periods covered by an option to terminate the lease if the lessee is reasonably certain not to exercise
that option.
Periods covered by an option to extend (or not to terminate) the lease in which exercise of the option is con-
trolled by the lessor.

386
Mutually Exclusive Projects: A set of projects that perform essentially the same task, so that acceptance of one
will necessarily mean rejection of the others.
Net Present Value (NPV): A capital-budgeting concept defined as the present value of the project's annual net
cash flows after tax less the project's initial outlay.
Operating Cycle: The average time period between buying inventory and receiving cash proceeds from its
eventual sale. It is determined by adding the number of days inventory is held and the collection period for
accounts receivable.
Opportunity Cost: The revenue forfeited by rejecting an alternative use of time or facilities.
Payback Period: Length of time required to recover the amount of an initial investment.
Performance Obligation: A promise in a contract with a customer to transfer to the customer either:
1. A good or service (or a bundle of goods or services) that is distinct, or
2. A series of distinct goods or services that are substantially the same and that have the same pattern of
transfer to the customer.
Portfolio: A group of securities held in order to reduce risk by diversification.
Public Company Accounting Oversight Board (PCAOB): (www.pcaobus.com) Established in 2002 as a result of
the Sarbanes-Oxley Act, a private sector, non-profit corporation was set up to oversee the audits of public
companies and ensure that accountancy firms should no longer derive non-audit revenue streams, such as
consultancy, from their audit clients.
Quick Ratio: Quick assets divided by current liabilities, also called an acid test. It is a measure of liquidity.
Rate of Return on Investment (ROI): 1. For the company as a whole, net income after taxes divided by invested
capital. 2. For the segment of an organization, net operating income divided by operating assets. 3. For capital
budgeting purposes, also called simple, accounting, or unadjusted rate of return, expected future net income
divided by initial (or average) investment.
Residual Value Guarantee: A guarantee made to a lessor that the value of an underlying asset returned to the
lessor at the end of a lease will be at least a specified amount.
Return on equity (ROE): Earnings after tax (EAT) divided by owners' equity. A measure of the firm's profitability
to shareholders.
Right-of-Use Asset: An asset that represents a lessee’s right to use an underlying asset for the lease term.
Risk: (1) A term used to describe a situation in which a firm makes an investment that requires a known cash
outlay without knowing the exact future cash flow the decision will generate. (2) The chance of losing money. (3)
The possible variation associated with the expected return measured by the standard deviation or coefficient of
variation.
387
Risk-Return Trade-Off: A comparison of the expected return from an investment with the risk associated with
it. The higher the risk undertaken, the more ample the return. Conversely, the lower the risk, the more modest
the return.
Sales Mix: The relative proportions of the product sold.
Sarbanes-Oxley (SOX) Act: Wide-ranging U.S. corporate reform legislation, coauthored by the Democrat in
charge of the Senate Banking Committee, Paul Sarbanes, and Republican Congressman Michael Oxley. The Act,
which became law in July 2002, lays down stringent procedures regarding the accuracy and reliability of corpo-
rate disclosures, places restrictions on auditors providing non-audit services and obliges top executives to verify
their accounts personally. Section 409 is especially tough and requires that companies must disclose information
on material changes in the financial condition or operations of the issuer on a rapid and current basis.
Segmental Reporting: The presentation of financial information, such as profitability, by a major business seg-
ment, including the product, major customer, division, department, and responsibility centers within the de-
partment.
Short-Term Lease: A lease that, at the commencement date, has a lease term of 12 months or less and does not
include an option to purchase the underlying asset that the lessee is reasonably certain to exercise.
Standalone Price: The price at which a customer would purchase a component of a contract separately.
Stock Dividend: A distribution of shares of up to 25 percent of the number of shares currently
Stock Split: A stock dividend exceeding 25 percent of the number of shares currently outstanding.
Time Value of Money: The value of money at different time periods. As a rule, one dollar today is worth more
than one dollar tomorrow. The time value of money is a critical consideration in financial decisions.
Times Interest Earned Ratio: Earnings before interest and taxes (EBIT)/interest expense. A ratio that
measures the firm's ability to meet its interest payments from its annual operating earnings.
Transaction Price: The amount of consideration to which an entity expects to be entitled in exchange for trans-
ferring promised goods or services to a customer, excluding amounts collected on behalf of third parties.
Variable Lease Payments: Payments made by a lessee to a lessor for the right to use an underlying asset that
vary because of changes in facts or circumstances occurring after the commencement date, other than the pas-
sage of time.
Working Capital: A concept traditionally defined as a firm's investment in current assets. Net working capital
refers to the difference between current assets and current liabilities.
388
Index
A
Account analysis, 160
Accounting exposure, 383
Acid Test, 383
Asset Turnover, 383
B
Balanced Scorecard, 309, 310
Barcode, 297
Benchmarking, 383
Blockchain, 302
Book Value, 383
Break-even, 164, 167, 168, 169
Break-even analysis, 383
Break-even point, 383
C
Capital Asset Pricing Model, 269
Capital Budgeting, 383
Capital Rationing, 383
Capital Structure, 383
Cash conversion cycle, 199
Cash debt coverage ratio, 219
Cash flow, 135
cash flow statement, 383
Cash interest coverage ratio, 220
Commercial paper, 268
Common stock, 191, 192, 194, 206
Common-size statements, 194
Contribution Margin, 384
Corporate Governance, 2, 384
Cost of Capital, 384
Cost of goods sold, 68, 69
Cost-Volume Formula, 384
Cost-Volume-Profit, 384
Current Ratio, 384
D
Depreciation, 179, 185, 383
Detective controls, 328
Devaluation, 384
Direct Financing Lease, 56, 58
Du Pont formula, 209, 210
E
Engineering analysis, 160
F
FIFO, 68
Finance Lease, 55, 56
Financial Statement Disclosures, 98
Financial statements, 21
Flexible Budget, 385
H
Hedge, 252
Hedging, 283
High-low method, 161
I
Income statement, 21
Inventory turnover, 385
L
Lease Receivable, 57
Liabilities, 28
LIBOR, 255
LIFO, 68, 69
N
Net Cash Flows, 43
Net present value, 180
Net Present Value, 386
Notional Amount, 255
O
Operating cycle, 198

389
Operating exposure, 282
Operating Lease, 55, 56
Opportunity cost, 131
Opportunity Cost, 386
P
Payback Period, 386
Performance obligation, 50
Periodic inventory, 70
Perpetual inventory, 69, 70
Political risk, 277
Present value, 180
Preventive controls, 327
Q
Quick ratio, 386
R
Regulation S-K, 97
Retrospective Application, 77
Return on equity, 386
Return on shareholders’ equity, 214
Revenue, 23
Risk-return, 387
ROI, 209, 386
S
Sales mix, 168, 169
Sarbanes-Oxley, 121, 337
Sarbanes-Oxley Act, 292
SEC, 116, 117, 364
Segregation of duties, 292, 293
Self-constructed assets, 64
SFAC No. 1, 20
Swap, 255, 256
T
The third line of defense, 244
Three-way match, 292
Transaction exposure, 282, 285
Transaction price, 50
Translation exposure, 282
W
Weighted average, 68
Working capital, 135, 199, 213