Embed Size (px)
DESCRIPTION
Portland State University CH 227 Laboratory Manual
Citation preview

1
Chemistry 227, 228 and 229
General Chemistry Labs
2015-2016 Academic Year
Lab Coordinators:
Dr. Eric Sheagley
Dr. Dean Atkinson

2
Table of Contents General Chemistry Laboratory ....................................................................................................... 3
Grading Criteria .............................................................................................................................. 4 Laboratory Safety Rules and Procedures ........................................................................................ 5 Keeping a Lab Notebook ................................................................................................................ 9 Report Guidelines ......................................................................................................................... 14 General Chemistry Lab Report Checklist ..................................................................................... 19
CH227 LABS ................................................................................................................................. 21 Lab: Scientific Measurements: Precision and Accuracy .............................................................. 21 Pre-Lab: Who has the same solid that I have? ............................................................................. 26 Pre-Lab: How much sugar is in a can of coke? ........................................................................... 33 Pre-Lab: A Cycle of Copper Reactions ....................................................................................... 43
Pre-lab: Which Alkali Metal Carbonate? ..................................................................................... 50
Pre-lab: Using Conductivity to Find an Equivalence Point ......................................................... 57
Prelab: Atomic Emission Spectra ................................................................................................ 65 Pre-Lab: Determining the Concentration of a Solution: Beer’s Law ........................................ 72 CH228 LABS ................................................................................................................................. 84 Pre-Lab: Enthalpy of Neutralization of Phosphoric Acid ............................................................ 84
Pre-Lab: Hess’s Law .................................................................................................................... 91 Deriving the Gas Laws Using Computer Simulations .................................................................. 97
Pre-Lab: Decomposition of Hydrogen Peroxide........................................................................ 102 Pre-Lab: Vapor Pressure and Heat of Vaporization .................................................................. 108 Pre-Lab: Using Freezing-Point Depression to Find Molecular Weight..................................... 116
Pre-Lab: The Rate and Order of a Chemical Reaction .............................................................. 123 Pre-Lab: Chemical Equilibrium: Finding a Constant, Kc .......................................................... 130
Le Chatelier’s Principle in a Cobalt Complex ............................................................................ 138 CH229 LABS ............................................................................................................................... 142
Pre-lab: Acid Rain....................................................................................................................... 142 Pre-lab: Acid Ionization Constant, Ka ......................................................................................... 149 Pre-lab: Titration of a Diprotic Acid: Identifying an Unknown ................................................. 158
Pre-lab: Buffers ........................................................................................................................... 167 Pre-lab: Determination of the Ksp of Calcium Hydroxide .......................................................... 173
Pre-lab: Thermodynamics of the Solubility of Potassium Nitrate .............................................. 180 Pre-lab: Redox Titration: Analysis of a Commercial Bleach ..................................................... 186 Pre-lab: Synthesis of Acetaminophen ......................................................................................... 191
Pre-lab: Electrochemistry: Galvanic Cells and the Nernst Equation .......................................... 199

3
General Chemistry Laboratory SYLLABUS – 2015-2016
Prelab Exercises: Prelab instructions are included in the lab packet. You should answer
any questions presented and prepare for the weeks lab before your lab meeting. Pre-
labs are due at the beginning of the lab period .
Materials: You will need chemical splash safety goggles. These are available from the
chemistry stockroom (Room 280 SRTC) or at the campus bookstore. You will need a bound
carbonless copy notebook (not loose paper) for recording data. You are responsible for all
laboratory equipment checked out to you. If you break glassware, you will pay the replacement
cost of the glassware.
Dress for lab: You must wear shoes that cover your entire foot, including the heel. They
should fit up near your ankle; leather is preferred but any non -porous material is okay.
Short shorts and short skirts are not allowed . Your clothing must cover your torso and
legs down to your knees. You will also be required to wear a provided lab coat while
working in the lab.
Grading: The laboratory is graded on a Pass/ No Pass basis. An average of 75% of all
points available in the lab is required to pass.
Late Work: Laboratory reports are due at the beginning of the lab period following
completion of the experiment. Lab reports should be typed . Late reports will be docked
5 points per day late.
Attendance: Attendance in this lab is mandatory.
YOU MUST ATTEND ALL SCHEDULED LABORATORY MEETINGS. If you are not
able to attend lab you must notify your laboratory instructor as soon as possible.
Students are responsible for complet ing the lab report for the missed lab. Data can be
obtained from a lab partner or the lab TA. The made up work should be clearly labeled
and indicate the origin of the data reported . Reports are due the class meeting following
the syllabus deadline. In addit ion to complet ing the make-up lab you must make up the
missed lab t ime. The make-up laboratory will not be the same lab you missed but will
be a unique activity that will take place during week 10 of the quarter, during the
regularly scheduled lab period . FAILURE TO DO BOTH WILL RESULT IN A NO PASS
GRADE. If you miss two or more labs your grade will be a NO PASS.
NOTE: If you are more than 15 minutes late to lab you will be marked late. Two late
arrivals during the term will be counted as a missed lab. In addition, late students may
be assigned to lab clean up duties at the conclusion of the lab period . If you are
chronically late you will be given a NO PASS at the lab coordinators d iscretion.
Plagiarism: Experiments will be done in groups sharing the computer for data analysis
and acquisition. You may compare data with other groups, but the content of your lab
reports MUST be written individually . It will be considered an act of plagiarism if you

4
borrow tables or graphs from another student (learning how to properly create a table
or graph is an important skill, learn how to do it on your own!). You cannot paraphrase
the internet, your book or any other source without the proper reference. Additionally,
it will be considered an act of plagiarism if you borrow data without prior approval
from your TA. There are additional resources online to help you avoid plagiarism .
Please be sure to check http://www.lib.pdx.edu/instruction/survivalguide/writeandcitemain.htm
or http://web.pdx.edu/~b5mg/plagweb.html, and feel free to discuss the issue with your TA or
the lab coordinator. Depending on the severity of the offense(s), you will receive, at a minimum,
a zero score for the report. Additionally, a report may be made to the Office of Student Affairs.
Grading Criteria Unless otherwise noted in the course schedule, every lab report is worth 120 points, including the prelab, notebook and technique. Each lab report will be graded according to the following point distribution:
Prelab: 20 points
Abstract: 10 points
Introduction: 10 points
Data: 10 points
Results: 15 points
Discussion: 15 points
In addition to the above points each lab meeting will have an additional 40 points assigned on the following basis:
Notebook: 20 points These points are awarded by the TA based upon the quality of your lab notebook. Your TA will be looking to see that you are including a title, a statement of purpose, the procedures, data tables and that all data is present.
Lab technique: 20 points The basis for assigning these points includes (but is not limited to) general lab technique and methods, safety, general mannerism in lab and cleanliness.
Both of these criteria will be evaluated by your TA during each lab meeting. At the end of each lab you must check out with your TA so that he or she can assess your lab notebook and verify that you have cleaned your work area.
Grading: Your grade will be assigned based on the percentage of total points scored in
the class approximating the following scale (Note: this scale is subject to change
based on class performance):
More than one absence will result in a grade of F for the class.
Do not copy your partners, friends, old lab reports. That is plagiarism!
Grade A B C D F
Score ≥ 90% ≥ 80% ≥ 70% ≥ 55% < 55%

5
Laboratory Safety Rules and Procedures
Safety Rules
The guidelines below are established for your and your classmates’ personal
safety. Failure to adhere to the guidelines below will result in a loss of Lab
Technique points.
• Personal Protective Equipment (PPE) is used to protect you from serious injuries or illnesses
resulting from contact with chemical hazards in the laboratory. Spills and other accidents can
occur when least expected. For this reason it is necessary to wear proper PPE. The PPE for
student labs consist of goggles, gloves and clothing. Proper PPE is required for all students or
they will be asked to leave the lab
•Goggles – Goggles must be worn whenever any experimental work is being done in the
laboratory to protect the eyes against splashes. Only indirect-vented goggles are
allowed in the student labs and should be worn at all times when any chemical is being
used in the lab. These are for sale in the bookstore and stockroom. You should not wear
contact lenses in a chemical laboratory. Chemical vapors may become trapped behind the
lenses and cause eye damage. Some chemicals may dissolve “soft” contact lenses. The
most important aspect of having the goggles fit comfortably is the proper
adjustment of the strap length. Adjust the strap length so that the goggles fit
comfortably securely and are not too tight. If you find that your goggles tend to fog,
you can pick-up anti-fog tissue from the stockroom.
• Gloves – Gloves should be worn to protect the hands from chemicals. Gloves are
provided through your student fees and are located in the student labs. For health and
safety reasons it is important to always remove at least one glove when leaving the
student laboratory, this prevents things such as door handles from getting contaminated.
• Clothing – Dress appropriately for laboratory work. You must wear shoes that cover
your entire foot, including the heel. They should fit up near your ankle; leather is
preferred but any non-porous material is okay. Your clothing must cover your torso and
legs down to your knees. In addition, you are required to wear a department provided lab
coat while working in the lab.
• Eating, drinking and smoking are prohibited in the laboratory at ALL times. Wash your hands
after finishing lab work and refrain from quick trips to the hall to drink or eat during lab. If you
take a break, be certain to remove gloves and wash hands before ingesting food or drink.
• Never work alone in the laboratory or in the absence of the instructor.
• Headphones may not be worn in lab.
6
Safety Procedures
• Know location of safety equipment; fire extinguisher, fire blanket, first aid kit, safety
shower, eyewash fountain and all exits.
• In case of fire or accident, call the instructor at once.
• Small fires may be extinguished by wet towels.
• If a person’s clothing catches fire, roll the person in the fire blanket to extinguish the
flames.
• In case of a chemical spill on the body or clothing, stand under the safety shower and
flood the affected area with water. Remove clothing to minimize contamination with the
chemical.
• If evacuation of the lab is necessary, leave through any door that is safe, or not
obstructed; doors that lead to other labs may be the best choice. Leave the building by the
nearest exit and meet your TA on the field next to Hoffmann Hall. This would also be the
meeting place in the event of an earthquake or other emergency. It is good to know the
nearest exits of your lab on the first day of class.
• Spilled chemicals must be cleaned up immediately. If the material is corrosive or
flammable, ask the instructor for assistance. If acids or bases are spilled on the floor or
bench, neutralize with sodium bicarbonate, then dilute with water. Most other chemicals
can be sponged off with water.
• Avoid contact with blood or bodily fluids. Notify the instructor or stockroom personnel if
ANY blood is spilled in the lab so that proper clean up and disposal procedures may be
followed.
• If a mercury thermometer is broken, do not attempt to clean up yourself. Notify students
around you, so that mercury is not spread, then notify your lab instructor or stockroom
personnel. The stockroom is equipped for proper clean up and disposal of mercury.
Laboratory Procedures and Protocol
General Etiquette:
• Leave all equipment and work areas as you would wish to find them.
• Keep your lab bench area neat and free of spilled chemicals. Your book bag, coat, etc.,
should be kept in the designated area at the entrance to the lab, not at your bench.
• All chemical waste must be disposed of in proper containers. Proper disposal of chemicals
is important for student safety and proper disposal. Putting chemicals into the wrong

7
containers can lead to injury from unexpected chemical reactions. Mixing waste can also
make it more difficult or expensive for PSU to dispose of them. Only chemicals should go
into waste jars. Waste jars for each experiment will be provided in the lab. They will be
labeled specifying which contents should be placed inside. It is important that you replace
the lids to the waste containers. When done with the waste jar, make sure it is placed in a
secondary container. Do not put anything down the sink unless you are explicitly told to
dispose of it this way. Your instructor will provide specific disposal guidelines when
needed. Following these guidelines assists us in lowering the environmental impact of the
labs.
There are several locations for very specific waste.
i. Chemical waste – these containers are ONLY for chemical waste generated
in the lab. They are each specifically labeled for each lab and waste type.
READ THE LABELS.
ii. Contaminated paper waste – this is ONLY for paper towels used for
clean-up of chemical spills.
iii. Broken glass – this is ONLY for broken glassware.
iv. Gloves – this is ONLY for used gloves.
v. Normal trash – this is for all other trash that is not chemically
contaminated, glass, or gloves.
• Clean your bench and equipment Clean all your glassware- dirty glassware is harder to
clean later. Wash with water and detergent scrubbing with a brush as necessary. Rinse well
with water. Do not dry glassware with compressed air, as it is frequently oily. The water
and gas should be turned off and your equipment drawer locked.
• Clean the common areas before you leave the lab. Point deductions for the entire class
will be imposed if the instructor or stockroom is not satisfied.
• Return any special equipment to its proper location or the stockroom.
Handling Chemicals:
Obtaining reagents:
• Read the label CAREFULLY. The Chemicals are organized by experiment in secondary
containment bins. Make sure the chemical name and concentration match what is required
by the experiment!
• Do not take the reagents to your bench.
• We recommend always picking up bottles by the label. If all students do this, then any
unnoticed spills when pouring will not cause possible problems for the next user.
Remember to wear gloves while working with reagents.
• Do not put stoppers or lids from reagents down on the lab bench. They may become
contaminated. Be sure that the lids or stoppers are replaced.

8
• Do not place your own pipet, dropper, or spatulas into the reagent jar. Pour a small amount
into a beaker and measure from that. Please pour on the conservative side to minimize
waste and cost of labs. You can always go back for more.
• Do not put any excess reagent back in the reagent jar. Treat it as waste and dispose of it
properly.
• When weighing chemicals on the balances, never weigh directly onto the weighing pan.
Weigh into a weighing boat or beaker. Any spills on the balances MUST be cleaned up
immediately. If you are unclear how to clean a spill, notify your instructor. The balances
you are using are precision pieces of equipment and costs up to $4000.
• All chemicals should be treated as potentially hazardous and toxic. Never taste a chemical
or solution. When smelling a chemical, gently fan the vapors toward your nose.
• Any chemicals that come in contact with your skin should be immediately washed with soap
and copious amounts of water.
Laboratory Procedures
• Never pipet any liquid directly by mouth! Use a rubber bulb to draw liquid into the pipet.
• Never weigh hot chemicals or equipment.
• When heating a test tube, always use a test tube holder and be certain never to point the
open end of the test tube toward yourself or another person.
• Handling glass tubing or thermometers: to insert glass tubing into a rubber stopper,
lubricate the glass tubing with a drop of glycerin, hold the tubing in your hand close to the
hole, and keep all glass pieces wrapped in a towel while applying gentle pressure with a
twisting motion.
• To prepare a dilute acid solution from concentrated acid, acid should be added slowly to
water with continuous stirring. This process is strongly exothermic, and adding water to
acid may result in a dangerous, explosive spattering.
• Use the fume hood for all procedures that involve poisonous or objectionable gases or
vapors.
• Never use an open flame and flammable liquids at the same time.
9
Keeping a Lab Notebook In keeping a lab notebook, there are certain principles that should be followed. These boil down
to being clear and complete in your entries in your lab notebook. There are also certain
conventions for lab notebooks that are universally followed. High on this list are the following:
Use a notebook with pre-numbered pages
Record entries in ink
Keep entries reasonably neat and organized
Never tear pages out of your lab notebook (other than the carbonless copy pages)
What Kind of Notebook Should I Use?
For this class you must use a notebook with carbonless copy pages.
General Guidelines
• Write your name on outside front of notebook
• Use black ink, fine-tipped ball-point pen (this will photocopy clearly)
• At the front of the notebook, leave a few pages for a Table of Contents
• Each lab should have a brief introduction and description of procedure
• Generally use only the right hand page for most text
• Use facing left page for working graphs, manual calculation, and working notes
• Prepare data tables in advance - with columns for calculated results and notes
• Working graphs done in lab notebook to monitor progress
Usage and Structure
The overriding principle for a lab notebook is to record in it all the pertinent information about
your lab work. This boils down to clear descriptions of what you did and what you observed as a
result. It is a working tool, and a reference for other researchers who might want to read your
notebook and reproduce your work. (This applies to notebooks in learning laboratories: Your lab
instructor may want to look at what you did in order to understand your results. This is often the
case. So, it needs to be clear.)
The word “clear” here is crucial. In order to be clear, data must be recorded in well-thought-out
tables, clearly labeled. Descriptions of procedures must be clear and concise; to the point.
You should record all your work in your lab notebook. That is the proper place for all lab
planning and observations. Nothing should be recorded on odd scraps of paper, etc.

10
Structure for your Lab Notebooks:
For each lab in this class you should have the following sections in your lab notebook:
Title
Purpose
Procedure and Observations
It is also often helpful to include a Result section
Note: When preparing your notebook for lab only write on the right hand page.
Title:
With your lab notebook laid open, on the right hand page write down the title of the
experiment, and the date. In general, you will use the right-hand page for all your writing. The
left-hand page is reserved for recording scratch work. Don’t use this space until you need to. One
example of how to use the left-hand page: if your work requires simple calculations using your
measurements, use the left-hand page to do the calculations. If unexpected results occur later,
sometimes you can look back at your scratch work and discover the error. (“Oh, I subtracted
wrong! We put in 10.5 grams of copper sulfate, not 9.5 like we thought!”) Better to discover the
error after the fact than never to discover it at all.
Purpose:
Below the title, write the purpose of the experiment in one or two sentences. This section serves
to remind you and notify the reader what the experiment is about. In general, your purpose will
be what you are attempting to find or solve for, such as the molar mass of an unknown sample.
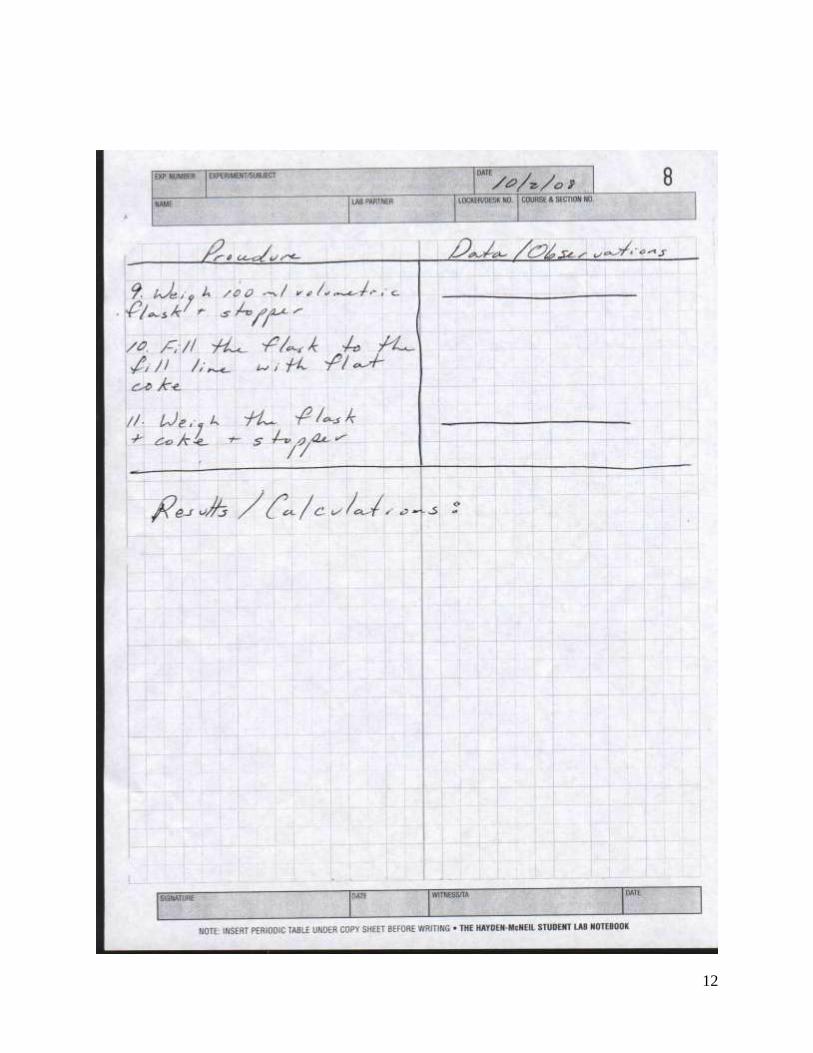
Procedure and Observations: This next section will be labeled Procedure and Observations. As the name suggests, write
down what you actually do and what you observe. Your procedures should be of sufficient detail
that you, the student, can independently perform the lab activity without looking at the lab
manual. This section is where you should have pre-prepared tables for data collection. Set up
this section by dividing the page into a right and left column. In the left hand column write
your procedure and in the right column next to the procedure, record observations and
data or measurements.
Results and Discussion: You might want to include a final section that is labeled Results and Discussion. In this section,
you would describe what results you got, what conclusions you have reached, ideas for
continuing work, etc. This should be done before leaving the lab. It will be these ideas that you
present in your lab reports.

11
An example of a prepared notebook follows.
12

13
Writing Style in the Lab Notebook
For certain entries in your lab notebook, such as the Introduction before each experiment, you
should strive to write as logically and clearly as possible. It is also a good idea to write in the
third person passive voice, to get into the habit, and so that in many cases you can copy entries
from your lab notebook into your reports without the need for major revisions/rewrite.
However, this is a working document. It is not expected that you write perfect prose in your
notebook – it is a first draft. Just do the best you can.
Also, as a working document, with many entries being written while an experiment is in progress
(your observations) it is understood that many entries will be brief – but still record crucial
observations.
Example
Notebook entry:
“Added 10 mL of 1M HCl – solution turned red instantly; pcpt.↓ a few secs later→ clr soln.”
When written into a lab report or journal article, this would be expanded a bit and made
grammatically correct.
“10 mL of 1.0 M HCl were added to the clear reaction mixture. This immediately resulted in a
crimson solution, and a red precipitate formed a few seconds later, leaving a clear solution.”
Adapted courtesy of Keith James and Jonathan Frankel.
14
Report Guidelines
At the end of every experiment in this manual, you will find instructions on what type of report
will be required. Some experiments require only a worksheet, which can be found on D2L. Other
experiments will require a formal report. The reports are due by the beginning of class the week
following completion of the experiment. Below is a description of what should be included in
each section. The sections are presented here in the order they should appear in your lab report.
It is expected that you will complete each experiment and do the necessary calculations and
analysis during the scheduled lab period each week. You may discuss the calculations and
analysis with your lab mates or TA; however, your written lab report should be your own
individual work!! The lab report sections should be complete but CONCISE. For most
experiments this term, your report should be 2-3 pages long.
Writing Style You will write your reports using a formal scientific writing style. A lab report must be written in
the third person, passive voice. It must also be in the past tense. It should not contain personal
pronouns such as, “I”, “we” or “he” neither should it contain proper names of persons. This
includes referencing your TA, groups of students, your lab drawer, your lab group, or the class as
a whole.
Good: “50 mL of 1.0 M HCl were poured into a 125 mL Erlenmeyer flask”
Bad: “I poured 50 mL of hydrochloric acid into a flask.”
Also bad: “Lab groups poured 50 mL of hydrochloric acid into a flask” This is not the correct
form of 3rd
person.
Also bad: “Joe Shmoe poured 50 mL of hydrochloric acid into a flask.” This is not the correct
form of 3rd
person. It includes Joe’s name.
Also bad: “We are going to put 50 mL of acid into the flask.” Uses future tense; also, “we”.
After you write your report, there is one more thing to do before you print it and hand it in:
Proofread it! Read it out loud. If is doesn’t sound right, it isn’t. Fix it. Then do it again until it
is right. You will enjoy writing reports more if you take pride in what you hand in.
Abstract: This is a condensed version of your lab report. It is a stand-alone document. Abstracts are, in
fact, often published separately from the articles they describe. A library search of the literature
generally involves reading abstracts. This is done with the aim to identify articles that need to be
read in full, and eliminate many others whose abstract makes it clear that they are not relevant to
the study at hand. So, the abstract needs to be brief, but complete. For your work, this section
should usually be between two and three sentences long.
15
There are three questions that should be answered in any good abstract
1. What did you do?
2. How did you do it?
3. What did you find?
Even though it sequentially appears first, you should consider writing this part of the lab report
after you have finished the remaining sections. Doing so will better help you identify the major
results and allow you to include the appropriate percent errors when possible.
To answer the first question, you should look back to your purpose in your lab notebook. If your
purpose was to determine the molar mass of an unknown solid compound, then the first question
would be answered by stating that the molar mass of an unknown compound was experimentally
determined.
For the second and third questions, you want to be brief, stating the type of methods used, such
as gravimetric analysis, rather than trying to explain the procedure. Remember to keep this
section brief. Be sure to include the units for your numerical results.
Introduction: Here, you want to address WHY you did this experiment. Your introduction begins with a
statement of the purpose of the experiment. You should use your purpose statement as a
guideline for the rest of the introduction. Your Abstract answers the question, What did you do?
In the introduction, your purpose statement is what you will do. For example, The purpose of this
experiment was to determine the color of the sky. You will find that as you write the report that
you will be repeating yourself a bit.
The rest of your Introduction section should flow from the purpose. How can this purpose be
achieved? Provide any relevant background to put the experiment in context. This is where you
will talk about the key concepts of the experiment. Which laws are being used to help you fulfill
the purpose? What are those laws? Why are they important to this experiment? As a general rule,
if you use a law in the lab’s procedure to determine something, you should talk about it in the
introduction.
Be sure to include any mathematical equations that are new to this experiment when appropriate.
These equations should be on their own line, but part of the paragraph itself as they come up.
Chemical equations should be handled the same way.
Your Introduction will often include some explanation of the theory behind the experiment.
Don’t just write the equations, provide information as to why they are relevant. Your
introduction should follow a logical pattern from your statement of purpose to your data section
without relying on a statement of the procedure. You will write your procedure in your lab
notebook, there is no need to rewrite it here.

16
Data: This section is where your experimental data belong. In this section you would also include
observations and descriptions of other pertinent events, when appropriate. This section is not
where the calculations, interpretation and discussion of your results belong. (In published
papers, a data section is usually not included, but, this is a class so this section will be included.)
Tables
Whenever possible, data should be presented in the clearest format possible, usually in the
form of a table. When you present your data in a table it is necessary to take the following
into account.
Number tables sequentially as they appear (Table 1, Table 2….).
Be sure to refer the reader to view the tables in the text.
Construct a descriptive table caption and place it above the table.
Tables should include descriptive column headings, including units.
Tables should not be divided across page boundaries
For a simple example, see Table 1.
Table 1: Mass and volume measurements when a portion of an unknown solid
was dissolved to make 10.0 mL of aqueous solution.
Trial Mass of unknown Sample (g) Mass of solution (g)
1 3.021 12.042
2 2.964 11.980
3 3.128 12.356
Graphs
When a table does not provide a clear picture of the data, a graphical presentation of data is
necessary. Do not present the exact same information as both a table and a graph. Pick the
format that best displays the data and stick to that. Please prepare graphs using the following
guidelines.
Number figures sequentially as they appear (Figure 1, Figure 2….).
In your writing, be sure to cite the figures in the text.
Insert a caption below the graph that briefly explains what the graph is presenting.
Each axis should be clearly labeled, including units.
Figures should not be divided across page boundaries
Remove gridlines, titles and equations from the graph. If this information is pertinent, it
should be included in the caption.
If the slope or intercept is necessary for other parts of the experiment, then place the
values in the caption with proper units.
For a simple example, see Figure 1.

17
Figure 1. A calibration curve for the absorbance at 470 nm of aqueous Allura Red solutions as a function of
the concentration. A best fit line was rendered resulting in a slope of 5.86 mM-1
.
Results: The results section is where you should report all of your results. Anything that you are
calculating, including your significant results, should be stated here. This section will usually
contain either tables or figures, and should always display the significant result of the
experiment. The Introduction states the purpose. The Data section shows the collected data. The
Results section gives the final results.
You do not need to write out your calculations here. Any calculations that you do should be
attached at the end of the report.
Discussion: In this section, you will discuss interpretations of the experimental results. This is where you
get to present your thinking process. You will want to draw everything together in this section.
Your introduction provided the purpose and followed a logical pathway to measuring Data. Your
Discussion section should bring everything from the results section to your final result along a
similar pathway. For any labs that have questions to answer, this is also where the answers get
written up.
The discussion is one of the most important parts of the lab report! It is your chance to
show WHAT YOUR RESULTS ARE and that you UNDERSTAND what you did in the
lab. This DOES NOT mean to include detailed procedures or that you need to re-explain your
calculations in words. It DOES mean that a general description of the experiment can be useful
in explaining your results and putting them in context.
In this section you should also discuss error analysis. For your error analysis you should be able
to look at whether your results were greater than or less than (in magnitude) the expected results.
You should be able to identify plausible sources of error from that. Try to see what could explain
away the direction of your error. If you measure too much heat, for example, it would not be
plausible that the primary error source was loss of heat to the atmosphere.
It is possible that nothing actually went wrong. If this is the case, you will need to dig deeper to
explain away any error. This happens when your percent error is very small. Try to investigate
what might have caused your results to vary. If something did go wrong, like your lab partner
0
0.2
0.4
0.6
0.8
0 0.02 0.04 0.06 0.08 0.1 0.12 Ab
sorb
ance
at
47
0 n
m
Concentration (mM)

18
forgot to write down the exact molarity of your reagent, then that should go here, too, along with
an explanation of how you attempted to correct for the error. Just keep it in third person passive
voice
When answering any additional questions that are posed at the end of the lab, make sure that you
approach the question from the context of the lab. There are many possible methods that might
be used to solve a particular problem or determine a particular characteristic of a chemical. Each
experiment is designed to show you how a specific problem can be solved using some set of
theories and laws. Use that information to answer additional questions.
Adapted courtesy of Keith James and Jonathan Frankel.

19
General Chemistry Lab Report Checklist General
_____ Have you listed your name, partner's name, a descriptive lab title and date?
_____ Did you use spellchecker?
_____ Is your report written in passive third person voice (you did not use the words I,
we, they, etc.)
_____ Is proper tense is maintained within sections?
_____ Have you correctly written your chemical formula and names correctly?
_____ Were correct subscripts, superscripts, and symbols are used?
_____ Did you separate the numbers from their units (0.25 mL was added…. not 0.25mL
was added)?
_____ Did you check significant figures?
_____ Do your numbers include leading zeros (0.25 mL was added…. not .25 mL was
added)?
_____ Did you make sure that you did not start a sentence with a number?
_____ All subjects and verbs are in agreement?
_____ Did you make sure that there are no run-on sentences or fragments?
Abstract The abstract is a condensed summary of the report's findings. Abstracts are often written last.
They should be clear, concise, and self-contained and, in the context of this lab, approximately
three sentences long.
_____What did you do? (Identify the rationale behind the investigation)?
_____How did you do it (summarize the procedure, without using specific steps)?
_____Present the important findings numerically including error statistics?
Introduction The introduction will provide the reader information on what you are doing why you did it and
critical background information necessary in understanding the methods and results of your
experiment.
_____Did you include a statement of purpose? _____Is there sufficient background so that the reader can understand what you did? _____Are necessary equations, chemical or mathematical, included?
Data This section should give only the data and observations from the lab, without results
_____Are your data tables properly formatted?
_____Are your figures and tables numbered sequentially and referred to in the text. Table
captions above and figure captions below. Tables and figures are not broken over
multiple pages
_____Are the axes on your graphs formatted properly with labels?
_____Are all graphs and tables accompanied by a written description relating the same
information to the reader?

20
Results: This section is for any significant results that you calculated. The results here should reflect what
you stated in your purpose. Your readers must easily find your results in order to evaluate and
interpret them. You should have a paragraph here that clearly states your results in addition to
the tables or figures.
_____Units? Significant Figures?
_____Is a straight forward presentation of the results of your experiment included in
either a table or in text?
_____Can your key results be understood by a reader without reliance on figures and
tables?
Discussion: In this section, you will discuss interpretations of the experimental results. It will be necessary to
describe your results, cite tables or figures. You should bring everything together in this section
following a logical progression similar to the introduction. You will need to present plausible
sources of error, with an explanation as to how that source caused your results to differ from the
accepted or expected values.
_____Can your key results and discussion be understood by a reader without reliance on
figures and tables?
_____Are key results highlighted and carefully explained?
_____Did you make logical deductions based on the results (usually questions are given
in the lab manual to help this)?
_____Have you referenced any figures, tables or key results?
_____Have you discussed sources of error or ambiguities in the data?
_____Did you confirm all relationships that were stated in purpose or abstract?
_____Do your conclusions clearly contribute to the understanding of the overall
problem?
_____Are all of your calculations attached at the end?

21
CH227 LABS
Lab: Scientific Measurements: Precision and Accuracy
Background
Accuracy is a measure of how close a measurement is to the correct value. For example, the
accepted density of zinc is 7.14 g/mL. One student may experimentally determine it to be 7.27
g/mL and another may determine it to be 7.20 g/mL. Because the value 7.20 g/mL is closer to the
accepted value, it is considered to be a more accurate measurement. You will find that in some
cases there is no accepted value to compare a result to. In those cases, accuracy cannot be
measured.
Precision is a measure of the reproducibility of a measurement, how close a set of measurements
are to one another. If, in a series of trials, you measured the density of zinc to be 7.26 g/mL,
7.28 g/mL and 7.25 g/mL, your values are quite close to each other. This suggests that your
precision is good.
Precision also deals with how small of a change can accurately be measured. For instance, think
about measuring your weight on a bathroom scale as compared to a roadside scale, a scale the
measures the weight of large trucks. On a bathroom scale your mass might read 155.6 pounds
but on the roadside scale, your mass may be given as 140 pounds. The bathroom scale has the
ability to measure relatively small masses to the nearest 0.1 pounds, while the roadside scale has
the ability to measure large masses to the nearest 20 pounds. Measurements made of relatively
small masses will be more precise with the bathroom scale; reproducibly, you will be able to
measure a mass to the nearest 0.1 pounds. The limited precision of the roadside scale would
create a level of uncertainty in measuring small masses. This uncertainty will restrict the
conclusions that can be made from the measurement so a roadside scale would not be the
instrument of choice for measuring a person’s weight. Scientists represent this precision in the
equipment by putting writing “± error” after the measurement. For example, the first scale’s
measurement would be written as 155.6 ± 0.1 lb. This shows that there is an uncertainty in the
last digit of the measurement. The roadside scale measurement would be written as 140 ± 20 lb.
In this class, we will use significant figures to indicate the level of precision with which a
measurement has been made instead of writing the error using the “± error “notation.
The greater the level of precision, the greater the number of digits in that measurement that are
significant (Signficant Figures). For instance, 155.6 lb has four significant figures, meaning
that all of the digits in the value are known with a relatively high degree of certainty. The value
140 lb, on the other hand, has only 2 significant figures, the one and the four. Because of the
scale used above, we can only have a relatively high degree of certainty of the value to the tens
place. The more significant figures that are reported the more precise our measurement. Just be
sure not to report more significant digits than the instrument used for measuring will allow.
The manipulation of measurements with a know precision (number of significant figures) is
included in your text book. In general, when making a measurement, it is customary to include
all the known values of a measurement plus one digit that is estimated. Assuming that the
bathroom scale is not digital, suppose that when weighing yourself in the example above, the
needle points somewhere between 155 and 156 pounds. You know your weight greater than 155
pounds but less than 156 pounds. To arrive at the 155.6 pounds reported above, you had to

22
estimate the 0.6 pounds (the estimated value in the measurement). In general, estimate the value
to one decimal place more than the level of graduation. In the example above, the graduation is
every 1 lb. Therefore, the measurement is reported to the 0.1 lb
Every measurement you make in this lab must include the proper number of significant figures.
To determine this, one only needs to look at the graduations on the instrument used to make a
measurement. You will be limited to ±1/10 of the smallest known graduation.
Procedures
You will be graded on the number of digits used, the presence of units on your measurements,
and explanations. Use a pen to record all measurements!!!
1) Measurements using a graduated cylinder.
Your TA will have a large graduated cylinder filled with some amount of a liquid on
display. Without consulting anyone in your class and without sharing your value,
determine the volume of the liquid and record the value here__________
Before continuing, report your value to your TA. Your TA will lead a quick discussion
about your results before allowing you to continue.
When measuring volume using a graduated cylinder, one always records the
volume as the level at the TOP / BOTTOM of the meniscus. Circle the best
response.
Take out a 25-ml graduated cylinder. Check to see whether your graduated cylinder is
calibrated to every 1 mL or every 0.5 mL.
The 25-mL cylinder is calibrated to every ______ mL.
Since the graduations are every 0.5 mL it is difficult to report your measured
volume beyond one decimal place. Use the following info to estimate the the
measured value:
23
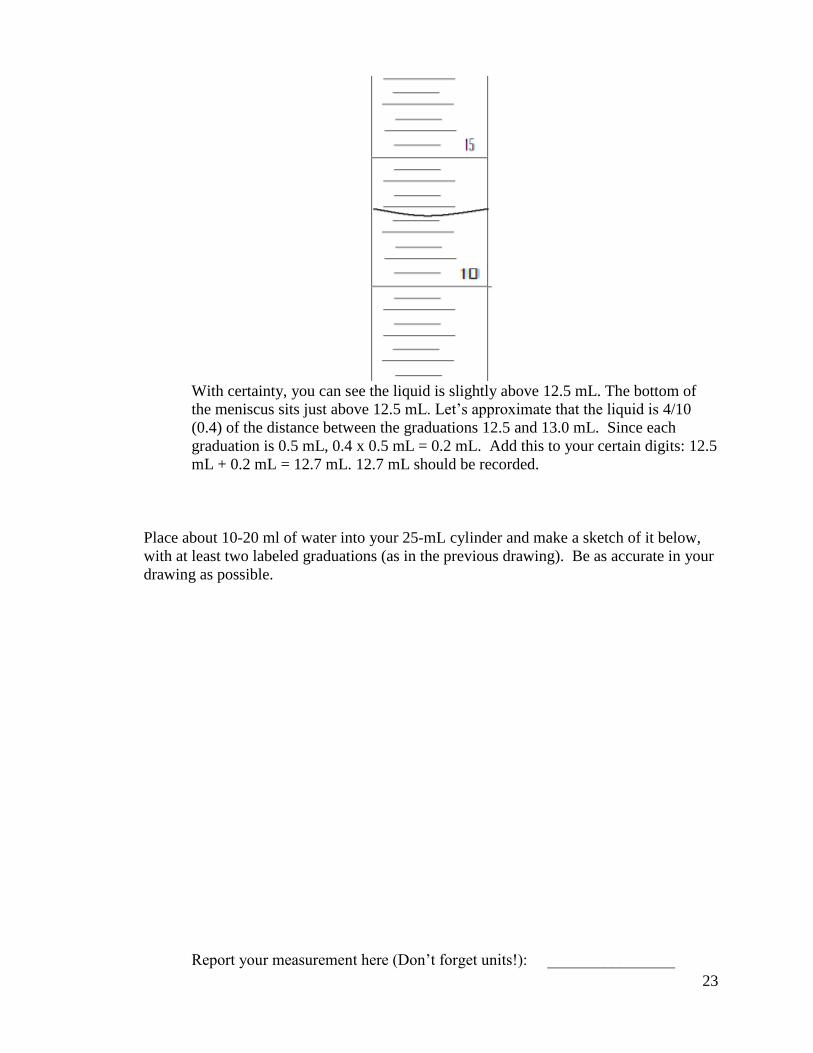
With certainty, you can see the liquid is slightly above 12.5 mL. The bottom of
the meniscus sits just above 12.5 mL. Let’s approximate that the liquid is 4/10
(0.4) of the distance between the graduations 12.5 and 13.0 mL. Since each
graduation is 0.5 mL, 0.4 x 0.5 mL = 0.2 mL. Add this to your certain digits: 12.5
mL + 0.2 mL = 12.7 mL. 12.7 mL should be recorded.
Place about 10-20 ml of water into your 25-mL cylinder and make a sketch of it below,
with at least two labeled graduations (as in the previous drawing). Be as accurate in your
drawing as possible.
Report your measurement here (Don’t forget units!): ________________

24
2) Measuring lengths
Now find a small plastic ruler and measure your pencil. Always use the smallest
graduations on your instrument when taking a measurement
Length (cm) = ______________________
Length (mm) = ______________________
Obtain a meter stick and record the length in meters (if the meter stick is graduated to the
mm, be sure to add the appropriate number of digits in your response).
Length (m) = ______________________
Does your measurement have a different precision when you use a meter stick? Explain.
3) Measuring mass
Obtain something with mass. Use the balance to measure the mass of the weight. With a
digital balance, always record every digit the balance displays. Record your units.
Mass _________________
Based on your observations, how many decimal places does this balance report?
Is there a difference in reporting 120.1 g versus 120.10 g? Explain how the
meaning of the measurement changes.
4) Comparison of a beaker and a graduated cylinder
Take out a 100 or 150 -ml beaker and examine its graduations. Complete the following
statements:
The beaker is graduated every _____ mL.
The measurement should be recorded to every ______ mL.
Add approximately 25 ml of water to your beaker, using the graduations on the beaker.
Measure the volume of this water using the beaker and record it below.
_______________ mL (using a beaker)
25
How many significant figures can you report based on the graduations? ________ sig
figs (circle the digit above that was estimated).
Now take the contents of your beaker (the 25 mL of water) and pour it into your 100 or
150 -ml graduated cylinder. Thinking about what you learned earlier (looking at the
graduations), record a measurement for the volume of water.
_______________ mL(using a 100 or 150 -ml graduated cylinder)
Which is more precise, the volume measurement using the beaker or the graduated cylinder?
Given a choice, which glassware would you use to measure volumes more precisely? Explain.
Suppose a 10-mL graduated cylinder has an uncertainty of about ± 0.01 mL. If it is filled with
water to the mark (10-mL), the volume should be reported as (include the necessary decimal
places):
_______________ mL
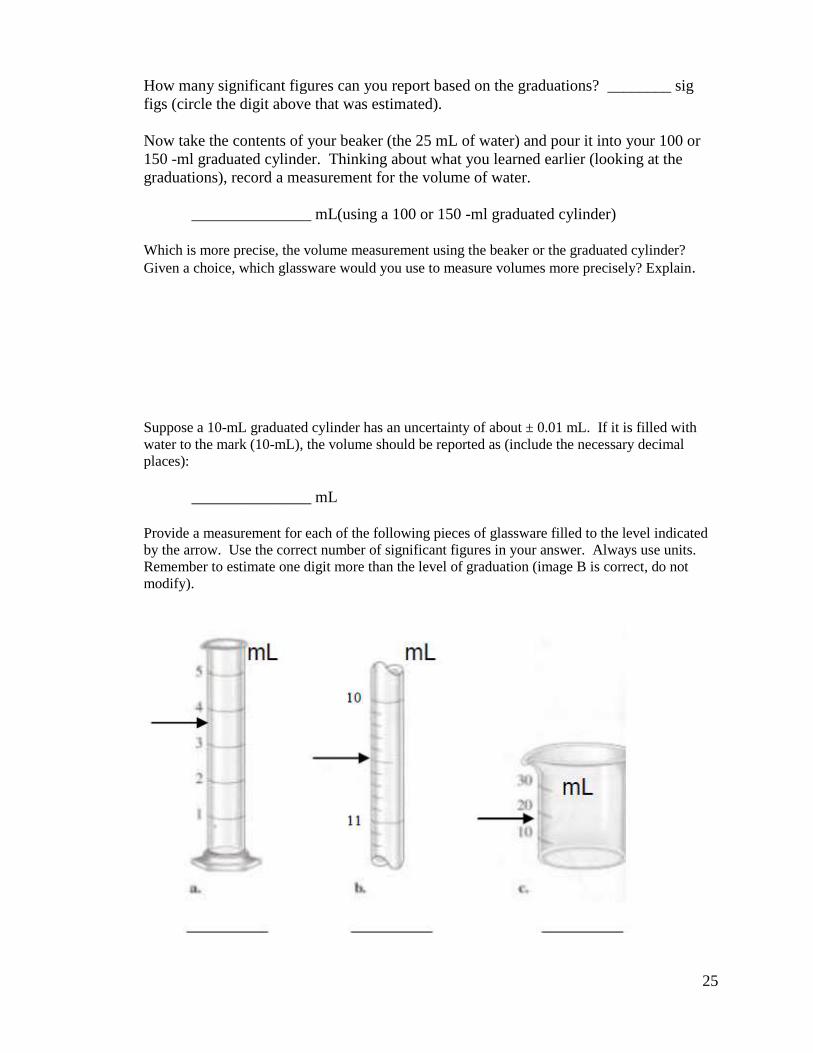
Provide a measurement for each of the following pieces of glassware filled to the level indicated
by the arrow. Use the correct number of significant figures in your answer. Always use units.
Remember to estimate one digit more than the level of graduation (image B is correct, do not
modify).

26
Pre-Lab: Who has the same solid that I have?
Part A
Answer the following questions in your lab notebook (be sure to show work for
any calculations):
1. Some of the chemicals you will use this year are hazardous. One way of determining the risk
of using chemicals is to read the Material Safety Data Sheet (MSDS). These documents
provide a wealth of information regarding the safety risks of each compound. Do a web search
with the key words “MSDS and Lead Nitrate”. Read through the MSDS and determine the
steps that need to be taken in case of accidental skin exposure (your most common risk in the
lab).
2. Look up the MSDS for both Hydrochloric Acid and Sodium Hydroxide. What steps need to be
taken if there is skin exposure? Note particularly the danger of getting NaOH in your eyes and
be sure to wear goggles at all times in the lab!
3. In this lab, there are many possible unknown compounds, including ammonium iodide,
sodium acetate, silver nitrate, calcium carbonate, lithium carbonate, aluminum chloride, and
potassium iodide. Pick one of the listed compounds and read the MSDS on it. Additionally,
search the internet for two interesting factoids regarding the chemical compound you choose.
Part B
Prepare your lab notebook for the experiment. This includes stating the purpose of
the experiment and summarizing the procedure in a bulleted-list format (be sure to
include space for observations).
At the start of your lab, remove the copies of the pages where you
completed the above work from your lab notebook and turn them into
your TA.

27
"Who has the same solid that I have?"
Science is generally a cooperative collaborative affair; most discoveries are not made by just one
person. It is important for scientists to be able to communicate their data and be prepared to share
data or samples. In this experiment you will be trying to determine who else in your lab section
has the same unknown compound as you. This will be done while learning some basic
techniques that are used for the analysis of chemical compounds.
You will see as you progress throughout the year in chemistry that compounds can be classified
in many different ways (ionic or molecular, acidic or basic, metals or nonmetals...). Think about
how you might classify water on the basis of easily observable properties. We know that water is
clear, colorless, freezes at 0°C, boils at 100°C, dissolves most salts, has a density of 1 g/mL and
is composed entirely of hydrogen and oxygen atoms in a definite ratio (this list could go on and
on). To enable classification, it is important to be able to accurately determine, describe, and
compare the chemical and physical properties of compounds.
You will be given a sample of an inorganic solid and will determine your sample’s properties,
such as: the solid’s relative solubility, its relative melting point, the electrical conductivity of the
substance and its aqueous solution, the acidity/basicity of the compound’s aqueous solution, its
appearance in a flame, and its reactivity. Your goal is to identify other students in class who have
the same compound that you have.
Comparisons of different samples may be made by doing side-by-side analysis using the same
techniques. Guided by your TA, your lab section will determine a method for sharing (reporting)
your observations. You should identify the people in your lab section that had the same
substance and then run some confirmatory tests to verify that the solids are the same.
This is a list of some of the physical and chemical properties that you will investigate during this
lab exercise:
1) Melting points: A substance’s melting point temperature will depend on the bonding type or
intramolecular forces in the sample. Some compounds have melting points greater than 200°C,
while others have lower melting points. Upon further heating, some compounds may decompose
into simpler compounds or burn.
2) Conductivity of aqueous solutions: When dissolved in water, some compounds dissociate into ions. These
dissolved ions move through the solution and thus conduct electricity.
3) Crystalline or amorphic: As a result of the types of bonds in the compound, some substances
form very regularly shaped crystals. Others are less able to form regular patterns so their solids
are less geometric. Crystalline compounds are hard and brittle because the ions are locked tightly
into place by their electronic interactions. As a result, it’s difficult to move these ions apart, and when they do
move apart, the whole crystal typically breaks.
4) Flame test: Some atoms emit characteristic visible colors when excited by an energy source,
like a flame. This colored light is a characteristic signature of the element, which is a
consequence of the electronic structure of the element. These emitted colors can be used to

28
identify the elemental composition of a substance. For instance, potassium produces a violet
color while lithium will emit a vibrant red.
5) Acidic, basic or neutral aqueous solutions: Some substances will make a solution acidic or
basic when they dissociate into ions when dissolved in water. Some ions have the ability to act as
acids in solution while others act as bases. When a substance is dissolved in water, these
properties can easily be tested using pH paper.
6) Reactivities: Each compound has a characteristic reactivity that may or may not be easily
elucidated. By mixing an aqueous solution of the unknown with an aqueous solution containing
another compound, reactivity patterns may become visible. Reactions are usually visualized by
looking for the formation of a solid, gas or change in color.
This lab is based upon the journal article "Who Has the Same Substance that I Have?": A Blueprint for
Collaborative Learning Activities, Brian P. Coppola, Richard G. Lawton, Journal of Chemical
Education 1995 72 (12), 1120 and “Identification of Ionic and Molecular Compounds”,
http://tinyurl.com/3jf6oq6, n.p. n.d. Web. 24 Aug. 2011

29
Equipment Information Each bin should contain:
Chemical Safety Information Same Solid
Chemical Hazards
Lead nitrate toxic, oxidizer, corrosive, health and environmental hazard
Hydrochloric acid corrosive
Sodium hydroxide corrosive
Ammonium iodide Toxic
Sodium acetate none
Lead acetate health and environmental hazard
Calcium carbonate none
Sucrose none
Lithium carbonate toxic
1 – plastic well plate
30
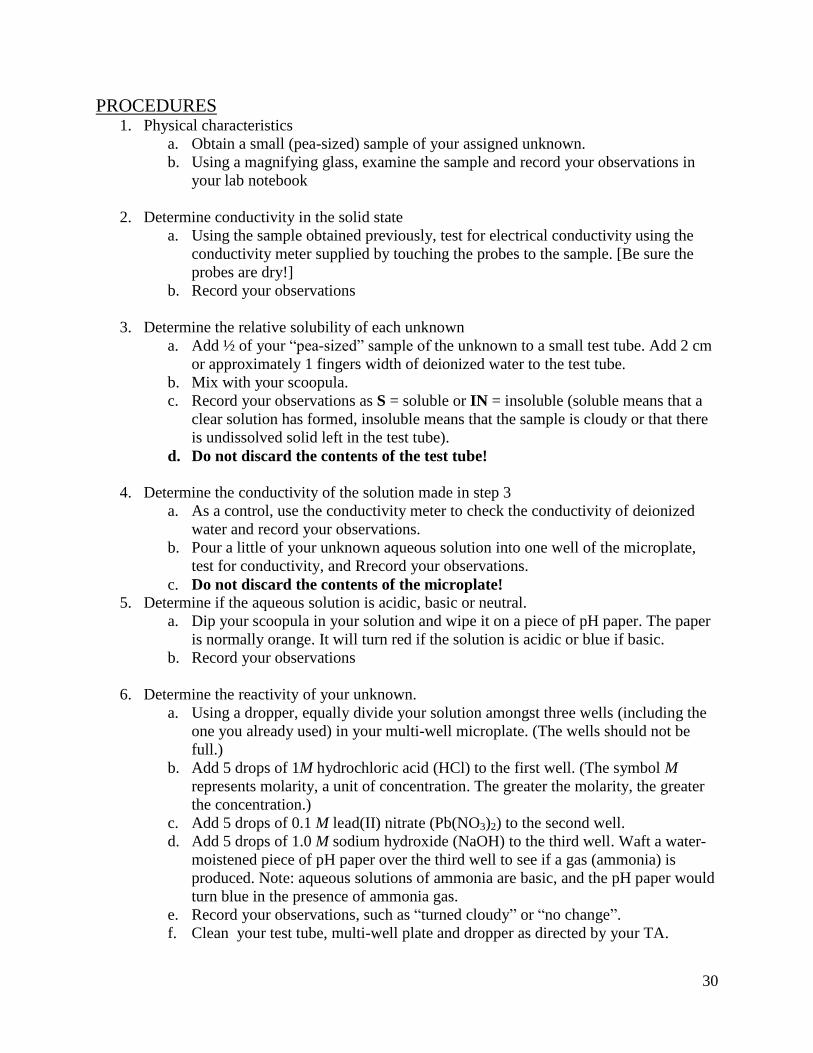
PROCEDURES 1. Physical characteristics
a. Obtain a small (pea-sized) sample of your assigned unknown.
b. Using a magnifying glass, examine the sample and record your observations in
your lab notebook
2. Determine conductivity in the solid state
a. Using the sample obtained previously, test for electrical conductivity using the
conductivity meter supplied by touching the probes to the sample. [Be sure the
probes are dry!]
b. Record your observations
3. Determine the relative solubility of each unknown
a. Add ½ of your “pea-sized” sample of the unknown to a small test tube. Add 2 cm
or approximately 1 fingers width of deionized water to the test tube.
b. Mix with your scoopula.
c. Record your observations as S = soluble or IN = insoluble (soluble means that a
clear solution has formed, insoluble means that the sample is cloudy or that there
is undissolved solid left in the test tube).
d. Do not discard the contents of the test tube!
4. Determine the conductivity of the solution made in step 3
a. As a control, use the conductivity meter to check the conductivity of deionized
water and record your observations.
b. Pour a little of your unknown aqueous solution into one well of the microplate,
test for conductivity, and Rrecord your observations.
c. Do not discard the contents of the microplate! 5. Determine if the aqueous solution is acidic, basic or neutral.
a. Dip your scoopula in your solution and wipe it on a piece of pH paper. The paper
is normally orange. It will turn red if the solution is acidic or blue if basic.
b. Record your observations
6. Determine the reactivity of your unknown.
a. Using a dropper, equally divide your solution amongst three wells (including the
one you already used) in your multi-well microplate. (The wells should not be
full.)
b. Add 5 drops of 1M hydrochloric acid (HCl) to the first well. (The symbol M
represents molarity, a unit of concentration. The greater the molarity, the greater
the concentration.)
c. Add 5 drops of 0.1 M lead(II) nitrate (Pb(NO3)2) to the second well.
d. Add 5 drops of 1.0 M sodium hydroxide (NaOH) to the third well. Waft a water-
moistened piece of pH paper over the third well to see if a gas (ammonia) is
produced. Note: aqueous solutions of ammonia are basic, and the pH paper would
turn blue in the presence of ammonia gas.
e. Record your observations, such as “turned cloudy” or “no change”.
f. Clean your test tube, multi-well plate and dropper as directed by your TA.
31
7. Flame test (done in the fume hood)
a. Soak a toothpick in water for 1 minute.
b. Touch the wet toothpick into the previously unused half of your unknown solid to
pick up a small quantity of the solid. Place the portion of the toothpick with the
solid on it in the hot part of the flame. Observe the color of the flame. Note: some
substances will not show a positive flame test (no color change).
c. Record your results.
8. Determine the relative melting point for each unknown compound (done in the fume
hood)
a. Carefully light the gas burner (unless it is still burning from the flame tests)
b. Using a scoopula, obtain a small portion (1/2 of the amount remaining from step
1) of your unknown solid.
c. Carefully heat the sample on the edge of the scoopula 1 inch from the very top of
the flame (not the hottest part of the flame).
d. Monitor the time required to melt. (Any substance that will melt under normal lab
conditions will do so quickly - don’t heat any substance longer than 20 seconds!)
e. Record your observations, based upon whether or not the substance melted and
how long it took (remember, heat no longer than 20 s).
f. Clean the scoopula as directed by your TA.
9. Record your data as indicated by your TA and identify all people in the lab section
having the same substance, based on your collective observations.
10. Run some confirmatory tests to verify that you have the same compound as the other
groups. Choose two tests that makes your unknown unique from the other substances and
do a side-by-side comparison to verify your conclusion.
11. Clean up. All remaining solutions and solids must be placed in the properly labeled
waste jar. Your lab area should be wiped clean and all glassware and equipment should
be placed in your lab drawer.
DATA Guided by your TA, you will construct a table to report your results and observations.
For the TA The most important practical aspect of setting up this experiment is to ensure that the identification is based on the
experimental data that are collected by the students.
Please discuss contamination and how to avoid contaminating the stock solutions and unknowns. Possible unknowns
include: ammonium iodide, sodium acetate, silver nitrate, calcium carbonate, sugar, lithium carbonate, aluminum
chloride, citric acid, potassium iodide, some of which are hazardous chemicals.

32
Who has the same solid that I have? Lab Report:
Your report for this lab should include the following sections:
Abstract:
Your first-draft abstract for this lab should be written as part of a post-lab
discussion led by your TA. You will refine this later on your own.
Introduction:
Describe what you did (tested and compared several unknown compounds) and
provide a bit of insight as to what techniques were used.
Explain why you did this experiment (to match the properties of your unknown
with other unknown substances).
Data:
Include the complete set of class data. Pay attention to the directions above about
formatting tables. Be sure to include your unknown and the data from the
confirmatory test.
Results:
Write a paragraph explaining the results of this experiment
Write a sentence or two (or a table) summarizing the matching and non-
matching characteristics to indicate which other solid matched your
groups unknown (specifically list which results were similar and which
results were different).
Summarize the results obtained for your unknown and the matching
unknown(s) in the confirmatory tests.
Be sure to indicate which unknown number you tested and the matching
unknown number(s)
Discussion:
Write a paragraph that discusses the following points:
Discuss how you matched your unknown sample with the other(s) in your
lab section. Indicate how your results for your solid caused you to identify
its match. How did your solid’s properties differ from the others?
Describe how/why you chose the confirmatory tests and the corresponding
results.
Provide some error analysis. For instance, what sort of weaknesses do you
see in the procedures or the way the data were reported that may have
caused some ambiguity?
Same Solid Lab Report:
Submit your report on time and to your TA in the dropbox
on D2L.
33
Pre-Lab: How much sugar is in a can of coke?
Part A
Answer the following questions in your lab notebook (be sure to show work for
any calculations):
1. A solution has a mass of 109.5 g and a volume of 100.0 ml, what is the density of the
solution?
2. An object has a density of 0.25 g/ml would you expect this object to float on water?
3. How many milliliters are in a 12 ounce can of soda?
4. What is the purpose of constructing a calibration curve? (If you’re not sure, you might want to
watch the “weblet” online presentation for this lab before you answer.)
Part B
Prepare your notebook for the lab. This includes stating the purpose of the
experiment, summarizing the procedure in a bulleted-list format (be sure to include
space for observations) and preparing any tables necessary for data collection.
At the start of your lab, remove the copies of the pages where you
completed the above work from your lab notebook and turn them into
your TA.
34
How Much Sugar is in a Can of Coke?
GOALS: 1. Determine the amount of sugar (in grams) in a can of coke
2. Learn how to make solutions quantitatively
3. Learn how to make and use a calibration curve
INTRODUCTION: If you were to measure out identical volumes of Coke and diet Coke, you would find that
the two liquids have different masses. This difference in the mass of the two liquids is best
discussed by looking at the mass per unit volume (or density) of the two liquids.
Density = Mass Volume V
MD
Density is a convenient quantity because it is independent of the volume used (scientists describe
properties like this as intensive). Intensive properties like density are independent of the amount
of substance and thus the density of two different solutions can be compared without needing to
have the same volume of the two solutions. .
When comparing Coke and diet Coke, it is found that Coke is more dense than its sugar
free relative. To understand why, a molecular view of the two substances is useful. The main
difference between the two “solutions” is the presence of the dissolved sugar in Coke that is
absent in diet Coke. The sugar makes Coke more dense than diet Coke. To a first approximation,
Coke can be represented as a solution of sugar dissolved in water. As the amount of sugar
dissolved in a given volume of water increases, so does the density of the resulting solution. This
makes it possible to determine the mass of sugar in Coke by comparing it to solutions with
known concentrations of sugar.
The relationship between the amount of dissolved sugar and the density of sugar water
solutions will be determined using a calibration curve. Calibration curves are constructed using
known quantities, called standards. Calibration curves allow you to determine the content of an
unknown by comparing it to observations made on the standards with known values of the
property being measured. In this case, you will prepare standard solutions of known volume with
a known amount of dissolved sugar. After obtaining the mass of these standards using an
instrument called a balance and calculating the density of each solution, you will prepare a graph
of density vs. mass of dissolved sugar . You will then determine the mathematical relationship
between the two quantities. Once the relationship between density and sugar content is
determined, you will use this relationship to determine the amount of sugar in Coke.
SCIENTIFIC GRAPHS: This experiment will also serve to introduce you to scientific graphing. Here, we will
introduce what must be included in any scientific graph. Whenever you are asked to produce a
graph from laboratory data (either by hand or using a computer program) all of the following
criteria must be met:
1. All graphs should have a title (except when included in a report or other scientific
writing, in which case you substitute a figure caption below the figure for the title)
2. Both axes must be labeled with a name and units
3. The graphed data must take up the full space of the graph
35
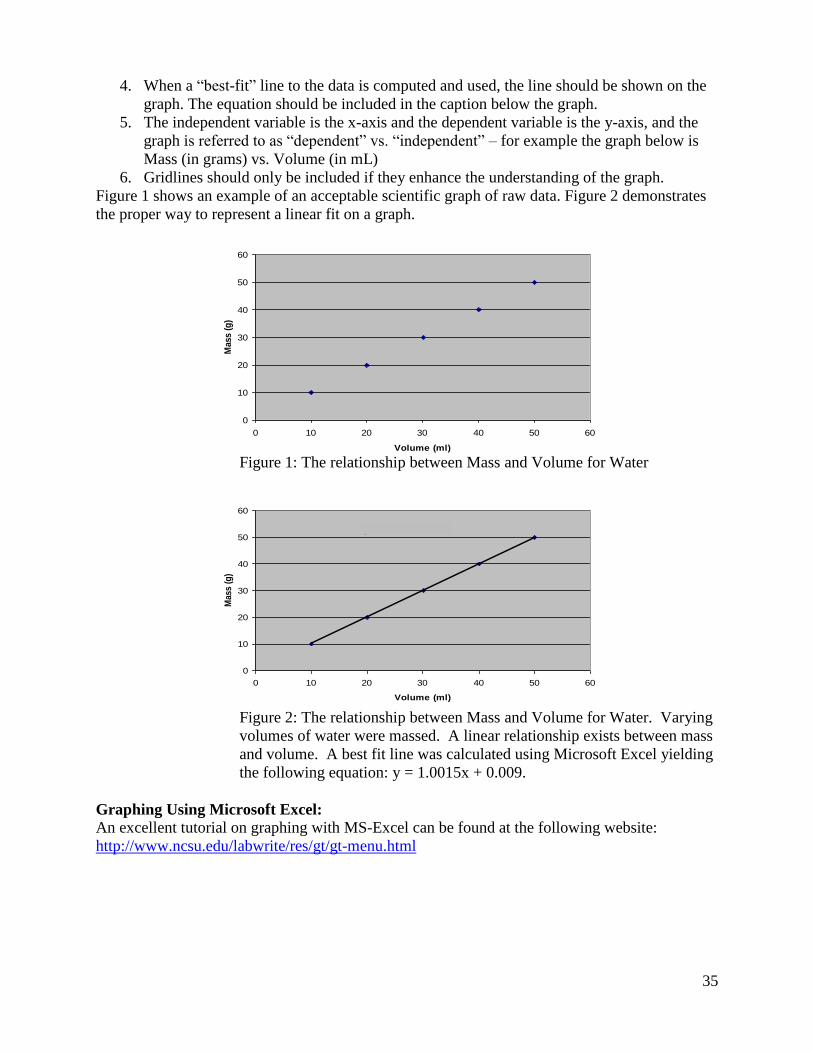
4. When a “best-fit” line to the data is computed and used, the line should be shown on the
graph. The equation should be included in the caption below the graph.
5. The independent variable is the x-axis and the dependent variable is the y-axis, and the
graph is referred to as “dependent” vs. “independent” – for example the graph below is
Mass (in grams) vs. Volume (in mL)
6. Gridlines should only be included if they enhance the understanding of the graph.
Figure 1 shows an example of an acceptable scientific graph of raw data. Figure 2 demonstrates
the proper way to represent a linear fit on a graph.
Figure 1: The relationship between Mass and Volume for Water
Figure 2: The relationship between Mass and Volume for Water. Varying
volumes of water were massed. A linear relationship exists between mass
and volume. A best fit line was calculated using Microsoft Excel yielding
the following equation: y = 1.0015x + 0.009.
Graphing Using Microsoft Excel:
An excellent tutorial on graphing with MS-Excel can be found at the following website:
http://www.ncsu.edu/labwrite/res/gt/gt-menu.html
The Relationship Between Mass and Volume for Water
0
10
20
30
40
50
60
0 10 20 30 40 50 60
Volume (ml)
Mass (
g)
The Relationship Between Mass and Volume for Water
y = 1.0015x + 0.009
0
10
20
30
40
50
60
0 10 20 30 40 50 60
Volume (ml)
Mas
s (g
)

36
This is a list of the basic steps necessary to graph data and do a linear regression (the generation
of a “best-fit” line) using Excel:
Basic Graphing:
1. With the program open, enter the data to be graphed in the cells. Enter x data in one
column followed by y data in an adjacent column.
2. Click and drag the mouse to highlight all the data to be graphed.
3. Click on the chart wizard icon
4. Choose XY (Scatter) for the chart type and the unconnected points icon for the Chart
sub-type
5. Click next. A preview of your chart will appear. If it appears correctly, click next.
6. Enter a chart title and the axis labels and click finish
7. With the chart selected you can also access the title and axis labels by selecting ‘Chart’
then ‘chart options’ from the drop down menu
Adding a Linear Trendline to a Graph:
1. With the graph selected, select ‘Chart’ then ‘add trendline’ from the drop down menu.
2. Select ‘linear’ as your regression type
3. Select the ‘options’ tab in the popup window
4. Select the ‘display equation on chart’ button and click ok

37
Equipment Information Each bin should contain:
Notes:
a. There are 2 waste streams for this lab. Use the correct one for each stage of
your experiment
b. Parafilm is reusable.
c. Use the 50mL volumetric flask for the final coke measurement, not the
100mL flask from your drawer.
Chemical Safety Information Sugar In Coke
Chemical Hazards
Sugar none
Coke none
1 - 50mL volumetric flask

38
PROCEDURE: Calibration Curve:
You will make one sample without sugar and five sugar water solutions to start. Each
solution should have a different amount of dissolved sugar covering a range from about 1 – 8 g
of sugar per 50 mL of solution volume. To make the solutions in a quantitative manner, they
must be prepared in volumetric flasks. Volumetric flasks are designed to accurately contain a
specific volume. Volumetric flasks are marked with a fill line. When filled to the marked line,
the flask accurately holds the stated volume (these devices are called TC for “to contain”). When
putting the last bit of solvent into volumetric flasks, it is best to bring the fluid to the line
carefully by using a wash bottle or eyedropper to assure that the flask is not overfilled (causing
you to have to start over).
For the sample without sugar:
1. Weigh the empty flask and record the mass.
2. Add water carefully to the fill line.
3. Weigh the flask containing the solution and record the mass. (The difference between this
mass and the first one is the mass of the solution – the volume is 50 ml, if you carefully
followed these instructions.)
To accurately know the mass of sugar used in each of your five standard solutions, follow these
steps:
1. Weigh the empty flask and record the mass.
2. Weigh out the desired mass of sugar in a weigh boat. (This mass does not need to be
recorded.)
3. Add the sugar to the flask. Weigh the flask containing the sugar and record the mass.
(The difference between the two masses is the mass of sugar.)
4. Add water to the flask until it is approximately half way to the fill line. Swirl the flask to
dissolve the sugar. Do not shake the flask.
5. Once the sugar has completely dissolved, add water carefully to the fill line. Put the
stopper in the flask or cover the top of the flask with Parafilm and invert it ten times to
ensure that the solution is thoroughly mixed. (The bubble should run all the way down
the neck of the flask to the stopper each time you invert the flask.)
6. Weigh the flask containing the solution and record the mass. (The difference between this
mass and the first one is the mass of the solution – the volume is 50 ml, if you carefully
followed these instructions.)
As noted above, the mass of sugar used for each solution is found by subtracting the mass of
the empty stoppered flask from the mass of the stoppered flask containing sugar. The mass of the
solution is found by subtracting the mass of the empty stoppered flask from the mass of the
stoppered flask containing the solution.
Below is an example of an acceptable table to present the data from this experiment. In this
experiment, a table is supplied for you. In later experiments, you will be expected to produce
your own data tables for your notebook and the Results section of your lab reports. Be sure that
you add an appropriate caption to the table. See the report guidelines section of the manual for a
discussion on this.

39
Mass of
Empty
Flask +
Stopper
(g)
Mass of
Flask +
Stopper
With
sugar (g)
Mass of
Flask +
Stopper
With
solution (g)
Mass of
Sugar
(g)
Mass of
Solution
(g)
Density
of
Solution
(g/ml)
Dissolved
sugar per
mL
solution
(g/ml)
Pure H2O ------ ------ 0.0
Flask 1
Flask 2
Flask 3
Flask 4
Flask 5
Using the data in the above table, construct a graph of density of solution (y) vs.
dissolved mass of sugar per mL of solution (x) and fit the data to a linear relationship as
described above. Report the equation for the line on the graph. Graphs must be prepared using
the computer. Your TA will assist you with this, if needed. This graph represents the relationship
between the density of the sugar water solution (something that can be measured) and the
amount of dissolved sugar in the solution (something that cannot be measured directly, but could
be controlled in making the standards).
Determine the amount of sugar in a can of Coke:
Weigh and record the mass of a dry, clean 50 mL volumetric flask before carefully filling
the flask to the fill line with the flat Coke provided. Weigh and record the mass of the flask
containing Coke. Determine the density of the Coke. Put the used Coke in the provided waste jar.
RESULTS: When a linear relationship exists between two quantities (density and amount of sugar) it
is only necessary to measure one of the quantities (density) and know the relationship (found
from your calibration curve) before the other quantity (amount of sugar) can be determined. By
finding the density of coke (y-axis) and drawing a line to your calibration curve, then drawing a
vertical line down to the x-axis (mass of sugar per mL solution) you can graphically determine
the amount of sugar dissolved in each mL of Coke. Alternatively, you can invert the relationship
given by the calibration line equation to solve for “x” from the observed density (“y”). Both
methods should give the same result for mass of sugar per mL of Coke.
In order to find the mass of sugar in one can of Coke, you will need to consider the
volume of a can of Coke (12 ounces). One liter contains 33.8 fluid ounces. Calculate the percent
error in your determined value, based on nutritional information given on the label on a can of
Coke.

40
Sugar in Coke Lab Report Sheet:
Name_____________________________ Date______________ Lab Section______________
Provide a brief statement of the purpose of this activity and explain the idea behind a calibration
curve.
Data:
Mass of
Empty
Flask +
Stopper
(g)
Mass of
Flask +
Stopper
With
sugar (g)
Mass of
Flask +
Stopper
With
solution (g)
Mass of
Sugar
(g)
Mass of
Solution
(g)
Density
of
Solution
(g/ml)
Dissolved
sugar per
mL
solution
(g/ml)
Pure H2O
------ ------ 0.0
Flask 1
Flask 2
Flask 3
Flask 4
Flask 5
41
Results:
Copy and paste your calibration curve in the space below. Make sure you have
formatted it as described in the Report Guidelines located in the front of this
manual.
Report the amount of sugar in 1 mL and 1 can of coke, showing any necessary
calculations.
Present the percent error for your amount of sugar in a can of coke with respect to
the number given on the label, showing any necessary calculations.

42
Based upon if your value is greater or less than the labeled sugar content, provide
any valid sources of error
Sugar in Coke Lab Report:
There is not a formal lab report for this lab. Complete the
above pages using the Microsoft version of this file that is
available for download on the lab D2L page. Once the
worksheet is complete, submit the worksheet on time and
to your TA in the dropbox on D2L.

43
Pre-Lab: A Cycle of Copper Reactions
Part A
Answer the following questions in your lab notebook (be sure to show your work
for any calculations):
1. In chapter 4 of your text, read about the d ifferent types of reactions. What causes a
precipitate to form when certain combinations of aqueous salt solutions are mixed?
2. Locate the solubility table in chapter 4 and summarize which ions are generally
soluble and which are generally insoluble.
3. Look up the MSDS for nitrogen dioxide gas. What dangers does it present and what steps need
to be taken to avoid exposure?
4. This is one of the most dangerous experiments during this term because of the risk of exposure
to dangerous chemical substances. For example, concentrated nitric acid is a particularly
nasty solution; what happens when it comes in contact with skin? What safety precautions
need to be taken to avoid exposure? All of the acids and bases used in this experiment are
also potentially dangerous and should all be handled carefully.
Part B
Prepare your notebook for the lab. This includes stating the purpose of the
experiment, summarizing the procedure in a bulleted-list format (be sure to include
space for observations) and preparing any tables necessary for data collection.
At the start of your lab, remove the copies of the pages where you
completed the above work from your lab notebook and turn them into
your TA.

44
A Cycle of Copper Reactions
GOALS:
1. Cycle solid copper through a series of chemical forms via aqueous-phase reactions
2. Learn about and identify different types of aqueous reaction types
3. Calculate percent recovered copper after all of the transformations
INTRODUCTION:
This experiment will cycle elemental copper through a series of five reactions
summarized below:
The cycle will both begin and end with pure elemental copper. At different stages of the
cycle, copper will be present in different chemical forms. At times copper will be present in solid
compounds and other times in ionic form. Each chemical change that copper undergoes is
observable as a change in the physical properties of the solution (or precipitate). As you perform
each reaction, be certain to observe and record your observations of all physical changes.
At this point in the term, you should have been introduced (in the lecture class) to three
different types of aqueous reactions: precipitation reactions, acid-base reactions, and oxidation-
reduction (or redox) reactions (in addition, the text may have discussed gas-forming reactions).
In precipitation reactions, soluble cations and anions combine to form an insoluble compound
that leaves the solution as a solid precipitate. In acid-base reactions, an acid and base react to
produce water and a salt. Redox reactions involve the transfer of electrons. As you go through
the series of reactions you should be able to classify each reaction (with the exception of reaction
3) as one of the three above-described types of aqueous reactions.
Reaction 1: The first reaction proceeds according to the following balanced chemical
equation:
4 HNO3 (aq) + Cu (s) Cu(NO3)2 (aq) + 2 H2O (l) + 2 NO2 (g)
Cu
Cu(NO3)
2
HNO3
NaOH Cu(OH)
2
heat
CuO H2SO
4 CuSO4
Zn, HCl

45
In this first reaction, elemental copper metal is reacted with concentrated aqueous nitric acid
solution. The result of this reaction is that copper changes from its elemental state (charge = 0) to
an aqueous, ionic state (Cu2+
) in an oxidation–reduction reaction.
Reaction 2: The second reaction then converts the aqueous Cu2+
into the solid copper (II)
hydroxide (Cu(OH)2) through a precipitation reaction with sodium hydroxide according to the
following balanced chemical equation:
Cu(NO3)2 (aq) + 2 NaOH (aq) Cu(OH)2 (s) + 2 NaNO3 (aq)
Reaction 3: The third reaction takes advantage of the fact that Cu(OH)2 is thermally unstable.
When heated, Cu(OH)2 decomposes (breaks down into smaller molecules) into copper (II) oxide
and water according to the following decomposition reaction equation.
Cu(OH)2 (s) + heat CuO (s) + H2O (l)
Reaction 4: When solid CuO is reacted with sulfuric acid, the copper is returned to solution as
an ion (Cu2+
) according to the following acid-base metathesis / double displacement reaction
equation.
CuO (s) + H2SO4 (aq) CuSO4 (aq) + H2O (l)
Reaction 5: The cycle of reactions is completed in this reaction where elemental copper is
regenerated according to the following oxidation-reduction reaction equation. Thhis reaction
changes copper from its ionic state (Cu2+
) to its elemental state by exchanging electrons between
zinc and copper.
CuSO4 (aq) + Zn (s) ZnSO4 (aq) + Cu (s)
Here, zinc and copper exchange physical (and oxidation) states in and out of acidic solution.
Hydrochloric acid is then used to dissolve any excess zinc. The solid copper can then be
collected, washed, dried and weighed. Some copper is bound to be lost in all of the chemical
transformations, so the percent recovery (mass copper remaining/initial mass x 100%) is
expected to be less than 100%.
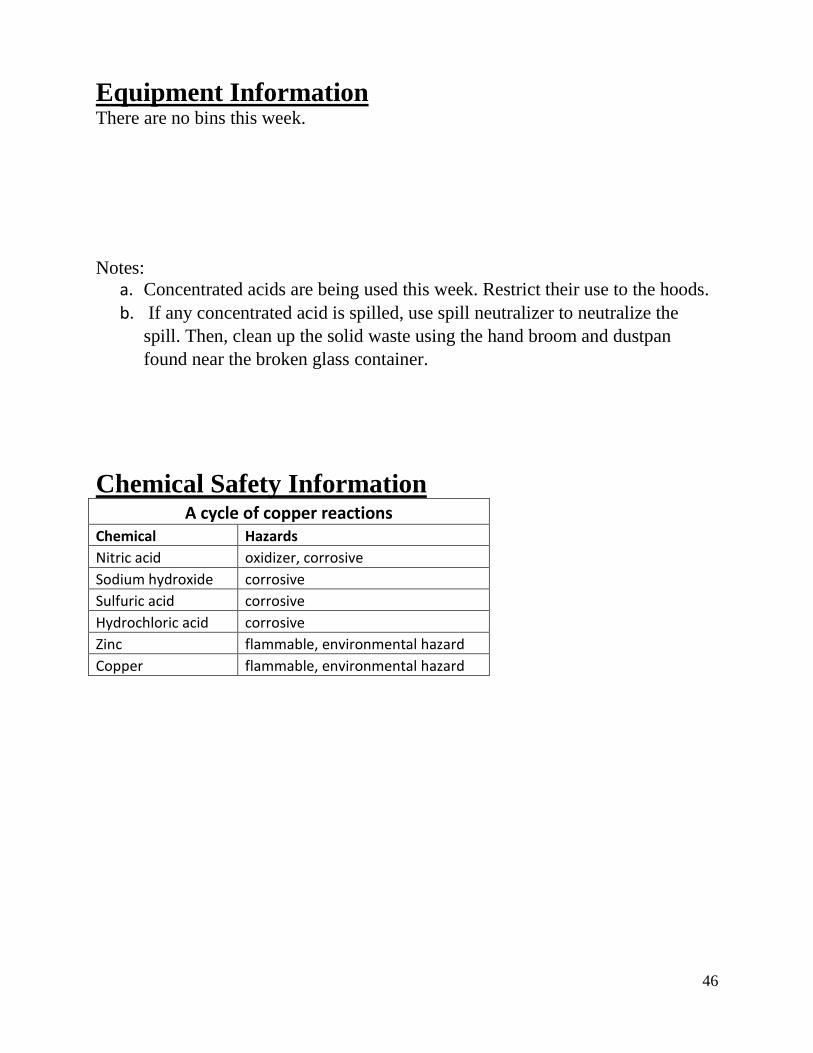
46
Equipment Information There are no bins this week.
Notes:
a. Concentrated acids are being used this week. Restrict their use to the hoods.
b. If any concentrated acid is spilled, use spill neutralizer to neutralize the
spill. Then, clean up the solid waste using the hand broom and dustpan
found near the broken glass container.
Chemical Safety Information A cycle of copper reactions
Chemical Hazards
Nitric acid oxidizer, corrosive
Sodium hydroxide corrosive
Sulfuric acid corrosive
Hydrochloric acid corrosive
Zinc flammable, environmental hazard
Copper flammable, environmental hazard
47
PROCEDURE:
Be sure to discard all waste in the waste jars as directed by your TA
Reaction 1:
Caution: Concentrated nitric acid is hazardous. Avoid getting it on your skin or clothing.
If you do get any on your skin or clothing, wash it off immediately with running cold water.
Do not breathe vapors.
Weigh out about 0.5 g of copper. Be sure to record the actual amount used to the nearest
milligram. Place the copper at the bottom of a 250 mL Erlenmeyer flask. In a graduated cylinder,
carefully measure out 5.0 mL of concentrated nitric acid.
DO THIS NEXT STEP IN THE HOOD!! NO2 gas is toxic!
In the fume hood, add the nitric acid to the flask containing the copper. The nitric acid
should completely cover the copper. Be sure to record all observations. Remaining in the hood,
swirl the flask until all of the copper has dissolved. Once the reaction is complete and the gas has
dissipated, add 20 mL of distilled water to the flask. Once you are sure that all the gas has been
removed in the fume hood, you may return to your workbench.
Reaction 2:
While stirring with a glass rod, slowly add 20 mL of 6.0 M NaOH to the flask. Be sure to
record all observations.
Reaction 3:
With occasional stirring, slowly heat the flask on a hot plate until the solution just begins
to boil. At this point you should notice that the blue Cu(OH)2 has been converted to black CuO.
If the conversion does not appear to be complete (not all of the blue Cu(OH)2 has disappeared),
heat the flask a little longer and/or ask your TA to take a look. Do not let the solution boil
vigorously. Once the conversion is complete, remove the flask from the hot plate and allow the
CuO to settle. In a clean beaker, heat ~ 200 mL of distilled water.
Add 50 mL of nearly boiling hot water to your reaction mixture. Once the CuO has
resettled (give it about 5 minutes to settle), carefully decant the supernatant liquid, removing as
much as possible without losing the desired product (CuO). Be sure to record all observations.
Reaction 4:
Carefully add 5 mL of 6.0 M H2SO4 (sulfuric acid) to the flask and swirl the mixture for
1 minute. All of the black CuO should dissolve and be gone at this point. If there is still black
solid in your reaction mixture, add an additional 1 mL aliquot of the sulfuric acid and swirl the
mixture for an additional minute. If the black solid has still not dissolved, ask your TA or repeat
the addition of 1 mL of sulfuric acid as necessary. Be sure to record all observations.

48
Reaction 5:
Caution: Concentrated hydrochloric acid is hazardous. Avoid getting it on your skin or
clothing. If you do get any on your skin or clothing, wash it off immediately with water. Do
not breathe vapors.
DO THIS NEXT STEP IN THE HOOD. Hydrogen gas is generated which is extremely
flammable. There should be no open flame in the room. Additionally, there is some
possibility of producing more nitrogen dioxide gas, so do not breathe the vapors.
Add (all at once) 1.0 g of 30-mesh zinc or zinc powder. Stir until the supernatant liquid is
colorless (not blue); the solution can be murky and grey. Decant the supernatant liquid. Remain
in the hood and add 5 mL of distilled water followed by 10 mL of concentrated hydrochloric
acid. The hydrochloric acid removes any excess zinc according to the following balanced
chemical equation.
Zn (s) + 2 HCl (aq) ZnCl2 (aq) + H2 (g)
If the hydrogen gas evolution stops before all of the solid zinc has been removed, more acid (in 1
mL aliquots) can be added. Once the evolution of hydrogen gas has become very slow, the flask
may be returned to the workbench. You may warm the mixture on a hot plate to speed up the
reaction, but do not boil the solution. Once the hydrogen gas evolution has completely stopped,
remove the flask from heat and carefully decant the liquid. Transfer the solid copper to a clean
pre-weighed beaker. Using a wash bottle to wash the copper metal into the dish can facilitate the
transfer. Wash the copper at least twice with about 5 mL of distilled water each time. Decant the
water after each wash. Wash the copper with an additional 5 mL of methanol. Allow the copper
to settle and decant the methanol. Gently heat the copper on a hot plate to evaporate any
remaining methanol and dry the copper. Once dry, remove the copper from the hot plate and
allow the beaker to cool before determining the mass of the recovered copper. Be sure to record
all observations and the final mass of the copper.
RESULTS:
Once the mass of recovered copper is known (difference between the pre-weighed beaker
plus copper and beaker alone), the percent recovery can be calculated from the following
formula:
Percent recovery = (mass of copper recovered/initial mass of copper)*100%
REFERENCE:
1. Condike, GF, J. Chem. Ed. 1975, 52, 615.

49
Copper Cycle Lab Report:
Your report for this lab should include the following sections:
Abstract:
Keep it to three sentences and be sure to discuss what you did, how you did it and
what your results (percent recovery) were.
Introduction:
Begin with a statement of the purpose of the experiment (observe various
reactions involving copper).
Provide any relevant background and key concepts (there are different types of
chemical reactions)
Include useful chemical equations (include each balanced equation and what type
of reaction it is).
Data:
Include each balanced chemical reaction and your observations for each reaction.
Include the initial and final mass of copper
Results:
Report which of the observations that suggested that a chemical reaction took
place (a precipitate formed, the solution’s color changed, there was a formation of
a gas….) and relate those observations to the components of the balanced
chemical reaction. (the black solid was…).
Report your percent recovery of copper
Attach your calculations to the back of your report
Discussion:
Discuss the experiment (reaction types involving copper)
Discuss your percent recovery and possible sources for loss of copper during the
reaction cycle. Here are some things you can think about:
Did any of your discarded waste have a blue color, if so, what does the
blue represent and how would it change your % recovery?
Did you lose any black solid while decanting, and if so, what were you
discarding and how would it change your recovery?
Was there any solid Zn remaining at the end, and if so, how would that
change your recovery?
Was your copper completely dry when you massed it at the end of the lab,
and how would it change your recovery?
Note that some of the items above increase calculated recovery and some
decrease it – identify the direction of the error in each case.
Copper Cycle Lab Report:
Submit your report on time and to your TA in the dropbox
on D2L.

50
Pre-lab: Which Alkali Metal Carbonate?
Part A
Answer the following questions in your lab notebook (be sure to show your work
for any calculations):
1. What is the law of conservation of mass?
2. How many moles of CO2 can be produced by the complete reaction of 1.53 g of
lithium carbonate with excess hydrochloric acid (balanced chemical reaction is given
below)?
Li2CO3(s) + 2HCl(aq) --> 2LiCl(aq) + H2O(l) + CO2(g)
3. In the synthesis of barium carbonate from an alkali metal carbonate (M2CO
3 where M
is one of the alkali metals) a student generated 3.723 g of barium carbonate from
2.001 g of their alkali metal carbonate. The reactants were M2CO
3 and barium
chloride. Write the balanced chemical reaction for this synthesis.
4. How many moles of barium carbonate were produced?
5. How many moles of alkali metal carbonate were reacted?
6. What is the molar mass of the alkali metal carbonate? Hint: remember the units of molar
mass are g/mol.
7. The chemical formula for the alkali metal carbonate is M2CO
3, what is the molar mass
of M? Which alkali metal is closest to this molar mass?
8. Look up the MSDS for barium chloride. How toxic is this substance? What steps need to be
taken if there is skin exposure or accidental ingestion?
Part B Prepare your notebook for the lab. This includes stating the purpose of the experiment,
summarizing the procedure in a bulleted-list format (be sure to include space for observations)
and preparing any tables necessary for data collection.
At the start of your lab, remove the copies of the pages where you completed the above work
from your lab notebook and turn them into your TA.

51
Which Alkali Metal Carbonate?
The Problem
In a search for a good cleaning formulation (as in laundry detergent or a degreaser
for metal parts) alkali metal carbonates are found to be useful. In natural deposits,
these carbonates may occur as crystals of a single alkali metal carbonate (such as
lithium carbonate) or as amorphous solids with several of the alkali metal
carbonates co-deposited.
Imagine that you are an analytical chemist and have received a sample of a pure
alkali metal carbonate from a newly-discovered deposit. Your task is to determine
which alkali metal carbonate composes the sample. You will do an experiment to
determine the atomic weight for the alkali metal in the carbonate you have and thus
which alkali metal is present. You will also evaluate sources of error as you
compare your experimental values with the expected value for the atomic weight
of the alkali metal. You will use two different methods to ensure confidence in
your results, and a third method to confirm them. Based on your experience you
will be able to recommend which procedure you would use if you had time and
resources for only one technique.
At the end of this experiment you will prepare a report giving your experimental
results. This will include the identification of your alkali metal carbonate, error
discussion for both methods, and a rationale for the preferred method you would
recommend to the lab.
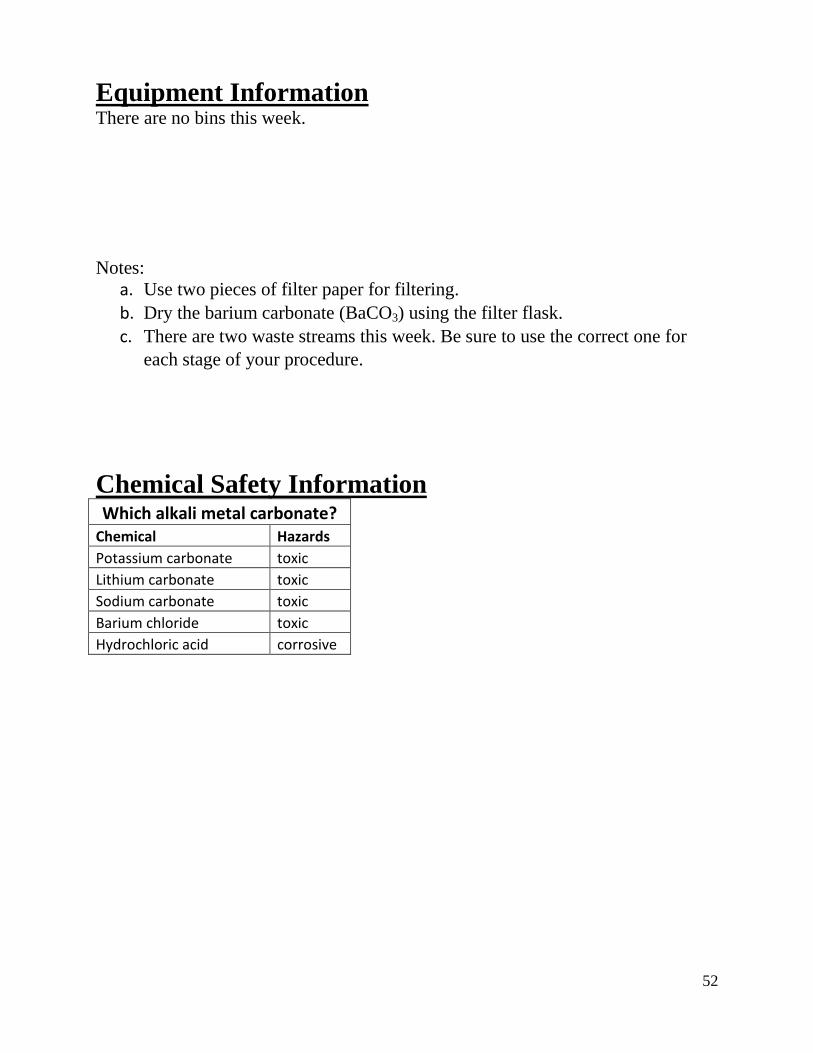
52
Equipment Information There are no bins this week.
Notes:
a. Use two pieces of filter paper for filtering.
b. Dry the barium carbonate (BaCO3) using the filter flask.
c. There are two waste streams this week. Be sure to use the correct one for
each stage of your procedure.
Chemical Safety Information Which alkali metal carbonate?
Chemical Hazards
Potassium carbonate toxic
Lithium carbonate toxic
Sodium carbonate toxic
Barium chloride toxic
Hydrochloric acid corrosive
53
Gravimetric analysis (Method 1) In this part of the experiment you will perform a synthesis and use reaction stoichiometry to
identify your unknown alkali metal carbonate. The reaction involves your aqueous carbonate
reacting with barium chloride (BaCl2) in a precipitation reaction. The product is an insoluble
barium carbonate. You will isolate and weigh it.
PROCEDURE: Be sure to discard all waste in the waste jars as directed by your TA
1. Add a 0.5 g (approximately, but massed to mg accuracy and recorded in your notebook)
sample of your carbonate to a 250 mL beaker. Add 50 mL of water and stir until the
carbonate is completely dissolved.
2. To precipitate the barium carbonate, add 20.0 mL of 1.0 M BaCl2 solution to the sample
and stir until well-mixed. CAUTION: Use gloves to handle the barium compounds.
3. Heat the BaCO3 formed to “digest” the precipitate (causing the precipitate to form larger
aggregates). This involves boiling the solution for 5 minutes with little agitation.
4. Weigh one piece of filter paper and your watch glass. Be sure to record the masses in
your notebook.
5. Filter the barium carbonate using the filter paper in a Buchner funnel using vacuum
filtration as demonstrated by your TA.
6. Wash the precipitate with water using the vacuum to pull the water through the filter and
allow the solid to dry for 10 minutes with the vacuum still on.
7. Carefully remove the solid and filter paper from the funnel and place your product on a
pre-weighed watch glass. Allow the solid to dry until near the end of the lab period. It
may be necessary to put the watch glass on a hot plate (on LOW heat for 10 minutes) to
speed up the drying process. CAUTION: The filtrate (solution left after filtration to
isolate barium carbonate) contains excess Ba2+. Dispose of in the proper waste
container (see TA if you are unsure of the proper procedure). DO NOT DUMP
THIS SOLUTION DOWN THE SINK.
8. Weigh the combined dry solid and filter paper and record the mass in your notebook.
Calculate the mass of barium carbonate by difference (removing mass of watch glass and
filters).
Analysis Use the following questions to lead you to the identity of M:
Determine the mass of barium carbonate produced as above. How many moles of barium
carbonate is this?
Use stoichiometry to determine how many moles of M2CO3 reacted to produce the barium
carbonate, and hence were present in the 1.00 g sample you started with.
Determine the molar mass of the unknown metal carbonate (not the metal itself) and compare it to
the molar mass of the possible alkali metal carbonates (Li2CO3, Na2CO3, K2CO3).
What alkali metal carbonate is your sample most likely to be?
Where are the errors most likely to enter into the experiment?

54
Simple weight loss (Method 2) In this experiment you will make use of the principle of conservation of mass to determine the
identity of your alkali metal carbonate. The metal carbonate (a base) will react with added acid to
produce carbon dioxide (CO2) gas, which will leave the system and go into the gas-phase.
Applying the law of conservation of mass you can determine the mass of CO2 evolved, by
difference from the starting mass of the reagents. The balanced chemical equation will allow you
to determine the atomic mass of the alkali metal:
M2CO3 + 2 HCl -----> CO2 + 2 MCl + H2O
Use the procedure outlined below to help you design your experiment and set up your data table.
Answer any questions you encounter along the way. You should perform the procedure three
times and should obtain a relative deviation [{(largest result – smallest result)/average
result} x 100%] of less than 10%.
PROCEDURE:
1. Place 0.5 g of your unknown in a pre-weighed 250 mL beaker.
2. Measure 40.0 mL of 1 M HCl in a pre-weighed graduated cylinder.
(Determine the actual mass of HCl added.) Pour the HCl slowly onto the
unknown metal carbonate.
3. Measure the mass of the beaker after the reaction has ceased (no further
generation of carbon dioxide gas).
Analysis: Use the following questions to lead you to the identity of M:
Determine the mass of CO2 produced (use the average from the three trials).
How many moles of CO2 were produced?
Use stoichiometry to determine how many moles of M2CO3 were present in the 1.0 g
sample you started with.
Determine the molar mass of the unknown metal carbonate (not the metal itself) and
compare it to the molar mass of the possible alkali metal carbonates (Li2CO3, Na2CO3,
K2CO3).
What alkali metal carbonate is your sample most likely to be?
Where are errors most likely to enter into the experiment? Which direction do these
errors bias the final answer (molar mass of metal carbonate)?

55
Flame test In this experiment you will make use of the fact that metal salts, when heated in a flame, emits
light whose color is characteristic to the metal ion in the salt (see Table 1). The heat excites the
electrons in the metal. When the excited electrons relax to what is called their “ground state”,
the release a photon of light that has a characteristic energy or color (if the photon is in the
visible portion of the electromagnetic spectrum). This property is used to identify unknown
metals and even quantify their amounts present in a sample.
Table 1: Characteristic Colors for the Flame
Test of Certain Group 1 Salts.
Group 1 Element
Flame Color
Li Na K
Rb
Crimson Golden Yellow Violet Blue-violet
PROCEDURE:
1. Soak a toothpick in water for 1 minute.
2. Touch the wet toothpick into the previously unused half of your unknown
solid to pick up a small quantity of the solid. Place the portion of the
toothpick with the solid on it in the hot part of the flame. Observe the
color of the flame.
3. Record your results.
4. Repeat steps 1-3 if necessary.
Experiment adapted from: Dudek, E. P. J. Chem. Educ. 1991, 68,948.
56
Which Alkali Metal Carbonate? Lab Report:
Your report for this experiment should include the following sections:
Abstract:
Keep it to three sentences and be sure to discuss what you did, how you did it, and
what your results were (molar mass and which metal carbonate).
Introduction:
Begin with a statement of the purpose of the experiment (identify the alkali metal
in the unknown carbonate using three different methods).
Provide any relevant background (balanced chemical equations and brief
explanation of the methods used) and key concepts (how the reactions relate to
the laws and how they will allow for the determination of the unknown metal).
Data:
Report the number of your unknown.
Include the data from your gravimetric analysis
Include a data table for your 3 simple weight loss trials
Include flame test information
Results:
Include a results table that summarizes your results from both methods (be sure
this includes all trials of each method).
Calculate the percent difference for the molar mass of the unknown metal
carbonate with the molar mass of each of the three possibilities (Li2CO3, Na2CO3
and K2CO3). Use this to assist in identifying your unknown metal carbonate.
Report your findings of the molar mass of your metal carbonate and the identity
of the metal carbonate.
Attach hand written sample calculations to the back of your report.
Discuss if the flame test supports your identification.
Discussion:
Discuss the experiment and any possible sources of error. Any suggested errors
should be accompanied with a discussion as to how the error could have been responsible
for the error seen (i.e. a molar mass that was lower or higher than expected).
Additionally, you should address which method (gravimetric or weight loss) you felt
was the most successful (be sure to support your answer with an explanation). Phrase this
as a recommendation of a procedure for a single-method determination of the identity of
an unknown alkali metal carbonate.
Which Alkali Metal Carbonate? Lab Report:
Submit your report on time and to your TA in the dropbox
on D2L.

57
Pre-lab: Using Conductivity to Find an Equivalence Point
Part A
Answer the following questions in your lab notebook (be sure to show work for
any calculations):
1. When the conductivity probe is placed in a solution of Ba(OH)2, do you expect the
conductivity to be high or low? Why?
2. Do you expect the conductivity to increase or decrease as you add H2SO
4 to the
solution of Ba(OH)2? Why?
3. Do you expect the conductivity in the flask to be greater or less than the original,
when you have added an equal number of moles of H2SO
4 to the moles of Ba(OH)
2
originally present?
4. If you add excess H2SO
4, past the equivalence point, what should happen to the
conductivity of the solution in the flask?
5. Write the balanced chemical reaction for the titration of strontium hydroxide with
sulfuric acid . Could you use conductivity to determine the equivalence point of this
reaction? Why or why not?
Part B
Prepare your notebook for the lab. This includes stating the purpose of the
experiment, summarizing the procedure in a bulleted-list format (be sure to include
space for observations) and preparing any tables necessary for data collection.
At the start of your lab, remove the copies of the pages where you
completed the above work from your lab notebook and turn them into
your TA.

58
Using Conductivity to Find an Equivalence Point
OBJECTIVES
In this experiment, you will
Hypothesize about the conductivity of a solution of sulfuric acid and barium hydroxide at various stages during the reaction.
Use a Conductivity Probe to monitor conductivity during the reaction.
Observe the effect of ions, precipitates, and water on conductivity.
INTRODUCTION
In this experiment, you will monitor conductivity during the reaction between sulfuric acid (H2SO4) and barium hydroxide (Ba(OH)2) in order to determine the equivalence point. [In this reaction, sulfuric acid will function as a diprotic acid and barium hydroxide as a dibasic base.] From the volume used and known concentration of the sulfuric acid, you can find the concentration of the Ba(OH)2 solution. You will also directly observed the effect of ions, precipitates, and water on solution conductivity. The balanced chemical equation for the reaction in this experiment is:
Ba2+
(aq) + 2 OH–(aq) + 2 H
+(aq) + SO4
2–(aq) BaSO4(s) + 2 H2O(l)
Before reacting, Ba(OH)2 and H2SO4 are almost completely dissociated into their respective ions. Neither of the reaction products, however, is significantly dissociated. Barium sulfate is a solid precipitate and water is predominantly in its neutral molecular form.
As 0.02 M H2SO4 is slowly added to Ba(OH)2 of unknown concentration, changes in the conductivity of the solution will be monitored using a Conductivity Probe. When the probe is placed in a solution that contains ions (and thus has the ability to conduct electricity),, an electrical circuit is completed across the electrodes that are located on either side of the hole near the bottom of the probe body. This results in a conductivity value that can be read by the computer interface. The unit of conductivity used in this experiment is microsiemens per centimeter, or µS/cm.
Prior to doing the experiment, it is important for you to hypothesize about the conductivity of the solution at various stages during the reaction, as you were asked to do in the Pre-lab. Discuss the following questions with your lab partners: Would you expect the conductivity reading to be high or low, and increasing or decreasing, in each of these situations?
When the Conductivity Probe is placed in Ba(OH)2, prior to the addition of H2SO4.
As H2SO4 is slowly added, producing BaSO4 and H2O.
When the moles of H2SO4 added equals the moles of BaSO4 originally present.
As excess H2SO4 is added (beyond the equivalence point).
When you have reached a consensus about what will happen during the experiment, proceed with the procedure below.

59
Equipment Information Each bin should contain:
Notes:
a. Use two pieces of filter paper per filtration.
b. Parafilm can be reused.
Chemical Safety Information Using conductivity to find an
equivalence point Chemical Hazards
Sulfuric acid corrosive
Barium hydroxide corrosive, toxic
1 – conductivity probe
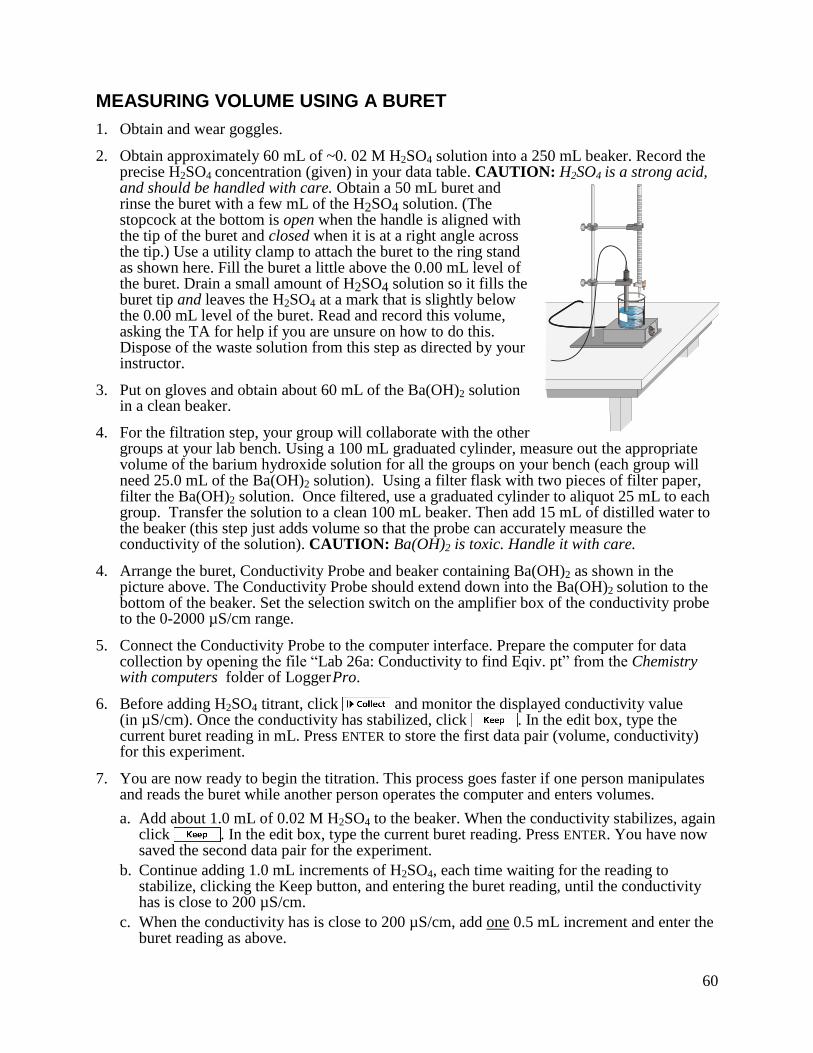
60
MEASURING VOLUME USING A BURET
1. Obtain and wear goggles.
2. Obtain approximately 60 mL of ~0. 02 M H2SO4 solution into a 250 mL beaker. Record the precise H2SO4 concentration (given) in your data table. CAUTION: H2SO4 is a strong acid, and should be handled with care. Obtain a 50 mL buret and rinse the buret with a few mL of the H2SO4 solution. (The stopcock at the bottom is open when the handle is aligned with the tip of the buret and closed when it is at a right angle across the tip.) Use a utility clamp to attach the buret to the ring stand as shown here. Fill the buret a little above the 0.00 mL level of the buret. Drain a small amount of H2SO4 solution so it fills the buret tip and leaves the H2SO4 at a mark that is slightly below the 0.00 mL level of the buret. Read and record this volume, asking the TA for help if you are unsure on how to do this. Dispose of the waste solution from this step as directed by your instructor.
3. Put on gloves and obtain about 60 mL of the Ba(OH)2 solution in a clean beaker.
4. For the filtration step, your group will collaborate with the other groups at your lab bench. Using a 100 mL graduated cylinder, measure out the appropriate volume of the barium hydroxide solution for all the groups on your bench (each group will need 25.0 mL of the Ba(OH)2 solution). Using a filter flask with two pieces of filter paper, filter the Ba(OH)2 solution. Once filtered, use a graduated cylinder to aliquot 25 mL to each group. Transfer the solution to a clean 100 mL beaker. Then add 15 mL of distilled water to the beaker (this step just adds volume so that the probe can accurately measure the conductivity of the solution). CAUTION: Ba(OH)2 is toxic. Handle it with care.
4. Arrange the buret, Conductivity Probe and beaker containing Ba(OH)2 as shown in the picture above. The Conductivity Probe should extend down into the Ba(OH)2 solution to the bottom of the beaker. Set the selection switch on the amplifier box of the conductivity probe to the 0-2000 µS/cm range.
5. Connect the Conductivity Probe to the computer interface. Prepare the computer for data collection by opening the file “Lab 26a: Conductivity to find Eqiv. pt” from the Chemistry with computers folder of Logger Pro.
6. Before adding H2SO4 titrant, click and monitor the displayed conductivity value (in µS/cm). Once the conductivity has stabilized, click . In the edit box, type the current buret reading in mL. Press ENTER to store the first data pair (volume, conductivity) for this experiment.
7. You are now ready to begin the titration. This process goes faster if one person manipulates and reads the buret while another person operates the computer and enters volumes.
a. Add about 1.0 mL of 0.02 M H2SO4 to the beaker. When the conductivity stabilizes, again click . In the edit box, type the current buret reading. Press ENTER. You have now saved the second data pair for the experiment.
b. Continue adding 1.0 mL increments of H2SO4, each time waiting for the reading to stabilize, clicking the Keep button, and entering the buret reading, until the conductivity has is close to 200 µS/cm.
c. When the conductivity has is close to 200 µS/cm, add one 0.5 mL increment and enter the buret reading as above.

61
d. Next, use 2-drop increments (~0.1 mL) until the minimum conductivity has been reached at the equivalence point. Read and enter the volume after each 2-drop addition. When you have passed the equivalence point, continue using 2-drop increments until the conductivity is greater than 100 µS/cm again.
e. Finally use 1.0 mL increments (read and enter the volume at each increment) until the conductivity reaches about 2000 µS/cm.
8. When you have finished collecting data, click . Dispose of the beaker contents in the
waste jar as directed by your TA.
9. Print a copy of the table.
10. Print a copy of the graph. Make sure each group member has the data.
PROCESSING THE DATA
1. From the data table and graph that you printed, determine the volume of H2SO4 added at the equivalence point. The graph should give you the approximate volume at this point, but recall that you must subtract the beginning volume if it wasn’t 0.00 mL. The precise volume of H2SO4 added can be confirmed by examining the data table for the minimum conductivity obtained. Record the volume of H2SO4.
2. Calculate moles of H2SO4 added at the equivalence point, using the molarity, M, of the H2SO4 and its volume, in L.
3. Calculate the moles of Ba(OH)2 at the equivalence point. Use your answer in the previous step and the ratio of moles of Ba(OH)2 and H2SO4 in the balanced chemical equation (or the 2:2 ratio of moles of H
+ to moles of OH
–).
4. From the moles and volume (25 mL) of Ba(OH)2 used, calculate the concentration of Ba(OH)2, in molarity (mol/L).
EQUIVALENCE POINT DETERMINATION: An Additional Method
An alternate way of determining the precise equivalence point of this titration is to perform two linear regressions on the data. One of these will be on the linear region of data approaching the equivalence point, and the other will be the linear region of data following the equivalence point. The equivalence point volume corresponds to the volume at the intersection of these two lines.
1. Drag your mouse cursor across the linear region of data that precedes the minimum conductivity reading. Click on the Linear Fit button, .
2. Drag your mouse cursor across the linear region of data that follows minimum conductivity reading. Click on the Linear Fit button, .
3. Choose Interpolate from the Analyze menu. Then move the mouse cursor to the volume reading when both linear fits display the same conductivity reading. This volume reading will correspond to the equivalence point volume for the titration. Record this volume and comment on whether it matches the one you selected manually in the Discussion section of your report.
This lab was modified from lab 26 “Using Conductivity to find an Equivalence Point” from Chemistry with Computers, Third Edition, Vernier, Inc.
Using Conductivity to Find an Equivalence Point:
Name_____________________________ Date______________ Lab Section______________

62
Provide a brief statement of the purpose of this activity. Be sure to define equivalence point.
Explain conductivity and the idea behind why conductivity can be used in determining the
equivalence point in a titration.

63
Data and Analysis:
Report the molarity of sulfuric acid used.
Copy and paste your titration curve in the space below (include a descriptive caption).
Report your determined concentration of Ba(OH)2 from both analysis methods (if they
differ). Show any relevant calculations.

64
Discussion:
Briefly discuss which of the two analysis methods you feel was the most accurate (be
sure to support your answer with an explanation)? Why does the conductivity not go to
zero?
Using Conductivity to Find an Equivalence Point Lab Report:
There is not a formal lab report for this lab. Complete the
above pages using the Microsoft version of this file that is
available for download on the lab D2L page. Once the
worksheet is complete, submit the worksheet on time and
to your TA in the dropbox on D2L.

65
Prelab: Atomic Emission Spectra
Part A
Answer the following questions in your lab notebook (be sure to show work for
any calculations):
1. What wavelengths of the electromagnetic spectrum correspond to visible light?
2. Why do atoms exhibit line spectra?
3. When light is emitted from the hydrogen atom, is the atom moving from a higher energy state
to a lower energy state or a lower energy state to a higher energy state?
4. What is the equation for the energy levels of the hydrogen atom? Give the units associated
with the energy equation you report.
Part B
Prepare your notebook for the lab. This includes stating the purpose of the
experiment, summarizing the procedure in a bulleted-list format (be sure to include
space for observations) and preparing any tables necessary for data collection.
At the start of your lab, remove the copies of the pages where you
completed the above work from your lab notebook and turn them into
your TA.
66
Atomic Emission Spectra Activity
Goals
To view the hydrogen emission spectrum and other atomic line spectra
To contrast the line spectra with other broad-band sources
To measure the wavelengths of the bright lines in the visible emission spectra of
hydrogen and mercury, and calculate the energy of each line
To gain an understanding of the quantized nature of the hydrogen atom
Supplies
Simple transmission grating spectroscope
Hydrogen and other elemental emission lamps
White, red, and green light sources
Definitions
1. A spectroscope is an instrument that allows you to analyze light in some way. In this case,
your spectroscope acts like a prism, splitting the light into different wavelengths.
2. A continuous spectrum is one in which a rainbow of colors is seen when viewed through a
spectroscope or prism.
3. A line spectrum, when viewed through a spectroscope, appears as one or more sharp narrow
lines (colors).
4. A band spectrum is intermediate in appearance – there will be a brightest color, but a range of
nearby wavelengths are emitted.
Background The understanding of the internal structure of the atom was advanced when Niels Bohr explained
the cause of the emission spectra of atoms using the concept of quantization. He stated that
electrons in the atom could exist at finite energy levels, but not in between them. Electrons
within an atom can be excited to higher energy states through various means, including heating
the atoms or using an electric discharge, like a spark. After exciting the electrons, the atoms emit
electromagnetic radiation as the excited electrons relax into a lower energy state. The energy of
the light emitted is equal to the difference between the energy levels in the atom. This emitted
light can be passed through a prism or reflected from a diffraction grating to spatially separate it
into its individual wavelength components (colors) generating an atomic emission spectrum, a
line spectrum characteristic of the particular sample of atoms.
As an example, the emission spectrum of hydrogen consists of only four visible lines: red, blue-
green, violet and deep violet (although your eyes may not be sensitive to the last one, since
individual’s visual acuity varies). Each color corresponds to the transition of an electron from an
excited state, a higher principal energy level, to a lower principal energy level, possibly the

67
ground state or some other allowed energy level in between. As the electron drops, it emits
energy in the form of a photon which may or may not be in the visible region.
In this experiment you will use a spectroscope and gas discharge lamps to measure the
wavelength of each bright line in the visible atomic emission spectra of both hydrogen and
mercury. You will then use these measurements to calculate the photon energy for each bright
line. Recall that the energy of light is related to the wavelength and frequency of the light,
through Planck’s constant h = 6.626 x10⁻³⁴
J sec and the speed of light in a vacuum c = 3.00 x
108 m/sec.
Other Equations That Might Be Useful
E = (2.178 x 10⁻¹⁸ J) (1/n2final - 1/n2
initial) [Rydberg equation, for Balmer series, ninitial = 2]
E = hc/ [Links wavelength and energy – be careful of the units!]
1 nm = 1 x 10⁻⁹ m
The final results of this experiment will be the wavelength (in meters) and the photon energy
of each bright line measured for hydrogen and mercury.
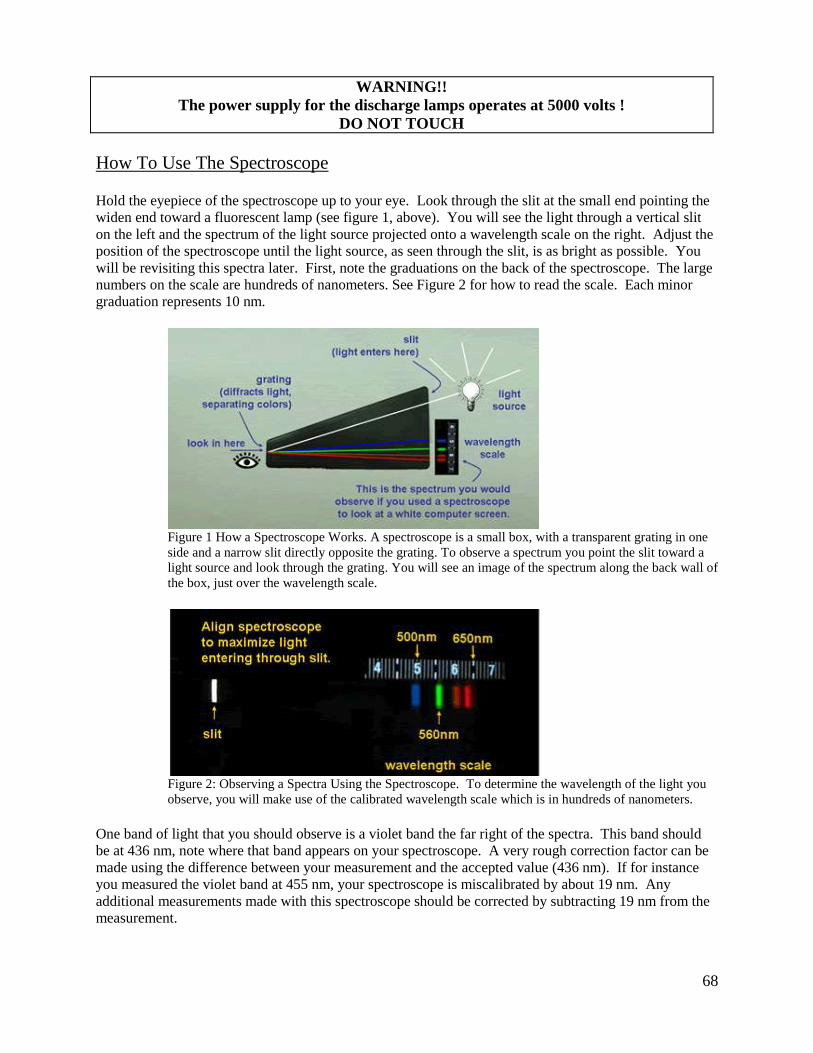
68
WARNING!!
The power supply for the discharge lamps operates at 5000 volts !
DO NOT TOUCH
How To Use The Spectroscope
Hold the eyepiece of the spectroscope up to your eye. Look through the slit at the small end pointing the
widen end toward a fluorescent lamp (see figure 1, above). You will see the light through a vertical slit
on the left and the spectrum of the light source projected onto a wavelength scale on the right. Adjust the
position of the spectroscope until the light source, as seen through the slit, is as bright as possible. You
will be revisiting this spectra later. First, note the graduations on the back of the spectroscope. The large
numbers on the scale are hundreds of nanometers. See Figure 2 for how to read the scale. Each minor
graduation represents 10 nm.
Figure 1 How a Spectroscope Works. A spectroscope is a small box, with a transparent grating in one
side and a narrow slit directly opposite the grating. To observe a spectrum you point the slit toward a
light source and look through the grating. You will see an image of the spectrum along the back wall of
the box, just over the wavelength scale.
Figure 2: Observing a Spectra Using the Spectroscope. To determine the wavelength of the light you
observe, you will make use of the calibrated wavelength scale which is in hundreds of nanometers.
One band of light that you should observe is a violet band the far right of the spectra. This band should
be at 436 nm, note where that band appears on your spectroscope. A very rough correction factor can be
made using the difference between your measurement and the accepted value (436 nm). If for instance
you measured the violet band at 455 nm, your spectroscope is miscalibrated by about 19 nm. Any
additional measurements made with this spectroscope should be corrected by subtracting 19 nm from the
measurement.
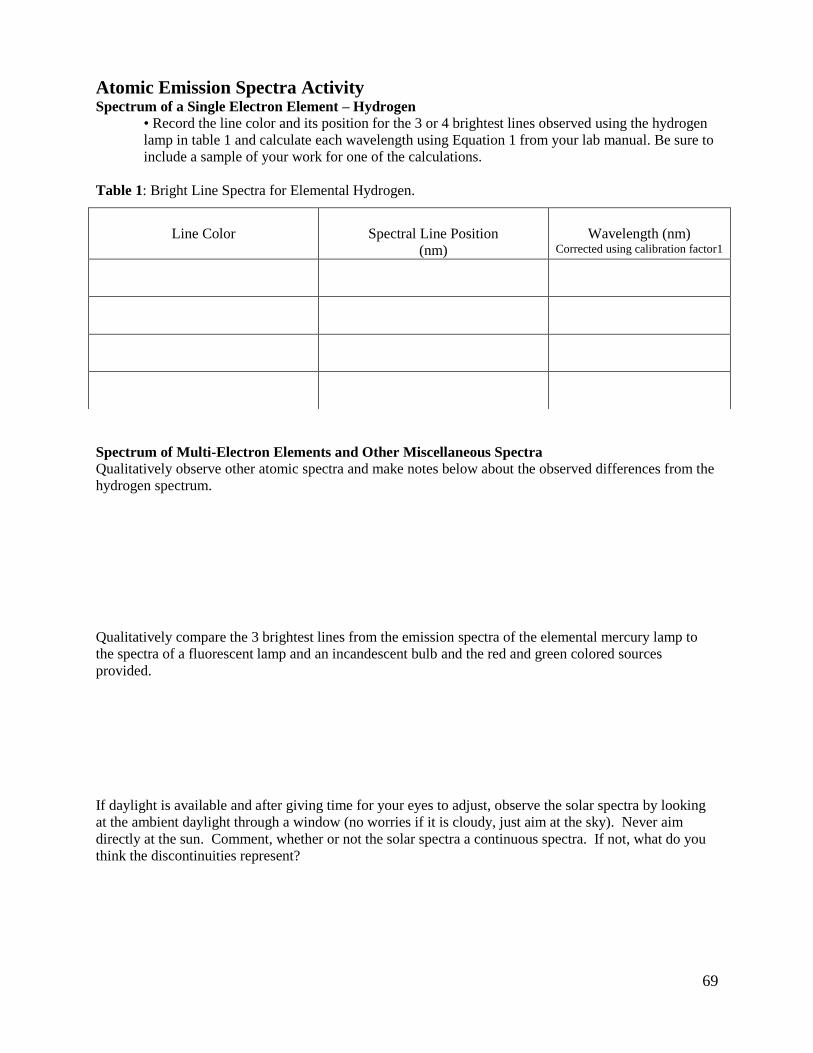
69
Atomic Emission Spectra Activity Spectrum of a Single Electron Element – Hydrogen
• Record the line color and its position for the 3 or 4 brightest lines observed using the hydrogen
lamp in table 1 and calculate each wavelength using Equation 1 from your lab manual. Be sure to
include a sample of your work for one of the calculations.
Table 1: Bright Line Spectra for Elemental Hydrogen.
Spectrum of Multi-Electron Elements and Other Miscellaneous Spectra
Qualitatively observe other atomic spectra and make notes below about the observed differences from the
hydrogen spectrum.
Qualitatively compare the 3 brightest lines from the emission spectra of the elemental mercury lamp to
the spectra of a fluorescent lamp and an incandescent bulb and the red and green colored sources
provided.
If daylight is available and after giving time for your eyes to adjust, observe the solar spectra by looking
at the ambient daylight through a window (no worries if it is cloudy, just aim at the sky). Never aim
directly at the sun. Comment, whether or not the solar spectra a continuous spectra. If not, what do you
think the discontinuities represent?
Line Color
Spectral Line Position
(nm)
Wavelength (nm) Corrected using calibration factor1

70
Data Analysis
1) For the first four electronic transitions in the Balmer Series, calculate the change in energy of the
electron (ΔE), the predicted energy of the emitted photon (Ephoton) and the predicted wavelength of the
emitted photon (λphoton). Put the calculated values in Table 2 and be sure to clearly show an example of
each calculation in the space provided.
Table 2: Calculated Values for the Balmer Series of Hydrogen.
Electronic Transition ΔE (J) Ephoton (J) λphoton (nm)
n3 → n2
n4 → n2
n5 → n2
n6 → n2
Clearly show the following calculations for the n3 → n2 transition.
-- the change in energy of the electron, ΔE
-- the predicted wavelength of the emitted photon, λphoton
2) Based on your theoretical calculations, match the electronic transitions in the Balmer Series to the
spectral lines you observed, and document your choices in Table 3. Then calculate the percent error
between your experimentally determined and calculated wavelengths.
Table 3: Comparison of Experimental and Accepted Wavelengths from the Balmer Series.
Spectral Line
Color Observed Experimental λ (nm)
from Table 1
Accepted λ (nm) from
Table 2
Electronic
Transition Percent Error
n3 → n2
n4 → n2
n5 → n2
n6 → n2
Below, clearly show your percent error calculation for the n3 → n2 transition.

71
3) It is not possible to observe the n7 → n2 transition in the Balmer Series. Why do you think that is?
4) Emission spectra are sometimes referred to as atomic fingerprints. Is it possible to use them to identify
elements in an unknown sample? Explain your reasoning: think about the Hg spectrum and that of a
fluorescent bulb.
5) Why do you think sodium vapor lights cast a different color (yellowish) than fluorescent lamps?
6) Calculate the ionization energy of the hydrogen atom. Think about this process as taking an electron
from its ground state, n = 1, to a position/energy level far, far away from the nucleus, n = ∞.
Atomic Emission Spectra Lab Report:
There is not a formal lab report for this lab. Complete the above pages using the
Microsoft version of this file that is available for download on the lab D2L page. Once
the worksheet is complete, submit the worksheet on time and to your TA in the
dropbox on D2L.

72
Pre-Lab: Determining the Concentration
of a Solution: Beer’s Law
Part A
Answer the following questions in your lab notebook (be sure to show your work
for any calculations):
1. You are given a colored solution that is labeled 1M. You need to prepare a solution
from this that is 0.5 M. Describe your procedure in detail.
2. What is the relationship between absorbance and transmittance?
3. Allura Red is a commonly used red food dye. Does Allura Red transmit or absorb red
light?
4. If 5.00 mL of a 0.5 M solution is d iluted to a final volume of 100.0 ml, what is the
concentration of the final d ilute solution?
Part B
Prepare your notebook for the lab. This includes stating the purpose of the
experiment, summarizing the procedure in a bulleted-list format (be sure to include
space for observations) and preparing any tables necessary for data collection.
At the start of your lab, remove the copies of the pages where you
completed the above work from your lab notebook and turn them into
your TA.

73
Determining the Concentration of a Solution: Beer’s Law
OBJECTIVES
In this experiment, you will
Prepare Allura Red standard solutions Use a Colorimeter to measure the absorbance value of each standard solution Find the relationship between absorbance and concentration of a solution Use the results of this experiment to determine the concentration of Allura Red in red
Gatorade
INTRODUCTION
The primary objective of this experiment is to determine the concentration of Allura Red in a commercially available beverage. You will be using the Colorimeter shown in Figure 1. In this device, light from the LED light source will pass through the solution and strike a photocell. A higher concentration of the colored solution absorbs more light (and transmits less) than a solution of lower concentration. The Colorimeter monitors the light received by the photocell and reports either an absorbance or a percent transmittance value as compared to a blank, a solution containing no absorber.
Figure 1 Figure 2
You are to prepare five Allura Red solutions of known concentration (standard solutions) and conduct a calibration procedure. Each standard solution is transferred to a small, rectangular cuvette that is placed into the Colorimeter. The amount of light that passes through the solution and strikes the photocell is used to compute the absorbance of each solution. When a calibration graph of absorbance vs. concentration is plotted for the standard solutions, a linear relationship should result, as shown in Figure 2. This linear relationship between absorbance and concentration for a solution is known as Beer’s law.
The concentration of Allura Red in an unknown solution (Gatorade) is then determined by measuring its absorbance in the same way with the Colorimeter. By locating the absorbance of the unknown solution on the vertical axis of the graph, the corresponding concentration can be found on the horizontal axis (follow the arrows in Figure 2). The concentration of the unknown can also be found using the slope of the Beer’s law line, assuming that the y-intercept of the calibration line is zero.

74
Equipment Information Each bin should contain:
Notes:
a. Today’s waste can go down the drain.
b. Do not leave a cuvette in the colorimeter at the end of class.
c. The colorimeter should be left out on the lab bench at the end of class. It
should not be put away in a bin.
1 – 10mL serological pipet
with bulb Do not aspirate liquid into
the bulb.
5 – cuvettes with lids

75
PROCEDURE
1. Obtain and wear goggles
2. Obtain about 30 mL of Allura Red stock solution in a 100 mL beaker. Add about 30 mL of distilled water to another 100 mL beaker. Be sure to record the concentration of the stock solution of Allura Red from the container.
3. You will prepare five solutions of Allura Red varying in concentration from approximately 6 x 10
-6 M to 2 x 10
-5 M. You may wish to check your concentrations and calculations with
your TA before making the solutions. Make the solutions by pipetting the correct quantity of the Allura Red stock solution into the volumetric flask and then filling to the line with distilled water. Be careful to avoid getting liquid above the fill line. Thoroughly mix each solution by inverting the stoppered flask ten times.
4. Connect the Colorimeter to the computer interface. Prepare the computer for data collection by opening the file “Lab 11: Beer’s Law” from the Chemistry 227 folder of Logger Pro. Set the colorimeter to a wavelength of 470 nm.
5. You are now ready to calibrate the Colorimeter. Prepare a blank by filling the cuvette 3/4 full with distilled water. To correctly use a Colorimeter cuvette, remember:
All cuvettes should be wiped clean and dry on the outside with a tissue.
Handle cuvettes only by the top edge of the ribbed sides.
All solutions should be free of bubbles.
Always position the cuvette with its reference mark facing toward the white reference mark at the top of the cuvette slot on the Colorimeter.
6. “Blank” the Colorimeter.
Place the cuvette with the blank (water) in the colorimeter. In Logger Pro click on
“Experiment”, then from the drop down menu select “calibrate” and “lab pro colorimeter”. In
the popup window check the box next to “one point calibration”. Click “Calibrate now”
and enter “100” in the box provided (100% T). Click “Keep” and then “Done”. You should
now see an absorbance reading of 0.000. 7. You are now ready to collect absorbance data for the five standard solutions. Click .
Empty the water from the cuvette. Using standard solution 1 (the lowest concentration sample), rinse the cuvette twice with ~1 mL amounts and then fill it 3/4 full. Wipe the outside with a tissue and place it in the Colorimeter. After closing the lid, wait for the absorbance value displayed on the computer monitor to stabilize. Then click and type the concentration of the standard solution into the edit box, and press the ENTER key. The data pair you just collected should now be plotted on the graph. [NOTE: When entering values, 2 x 10
-6 can be entered in standard computer format as 2E-6.] You may need to click
on the Autoscale button to rescale the graph as you go along.
8. Discard the cuvette contents in the waste jar as directed by your TA. Rinse the cuvette twice with standard solution 2 (next highest concentration), and fill the cuvette 3/4 full. Wipe the outside, place it in the Colorimeter, and close the lid. When the absorbance value stabilizes, click , type the concentration of the standard solution in the edit box, and press the ENTER key.
9. Repeat the Step 8 procedure to save and plot the absorbance and concentration values of standard solutions 3-5. Wait until Step 12 to do the unknown. When you have entered all of your standard solutions, click .

76
10. Be sure to record the absorbance and concentration data pairs that are displayed in the table.
11. Examine the graph of absorbance vs. concentration. To see if the curve represents a linear relationship between these two variables, click the Linear Fit button, . A best-fit linear regression line will be shown for your five data points and your blank. This line should pass near or through the data points and the origin (0,0) of the graph. [Note: Another option is to choose Curve Fit from the Analyze menu, and then select Proportional. The Proportional fit has a y-intercept value equal to 0; therefore, this regression line will always pass through the origin of the graph.]
12. Obtain a small amount of Gatorade in a small clean beaker. Use the pipette to deliver 5 mL of the Gatorade to a clean volumetric flask. Finish preparing your unknown by diluting the Gatorade to a total volume of 50 mL with distilled water and mix thoroughly. Rinse the cuvette twice with the unknown solution and fill it about 3/4 full. Wipe the outside of the cuvette, place it into the Colorimeter, and close the lid. Read the absorbance value displayed in the meter. (Important: The reading in the meter is live, so it is not necessary to click
to read the absorbance value.) When the displayed absorbance value stabilizes, record its value.
13. Discard the solutions in the waste jar as directed by your teacher.
PROCESSING THE DATA
You may use Microsoft Excel to plot the data and obtain a linear relationship between the data, or you may use the following method:
1. Determine the unknown concentration: With the linear regression curve still displayed on your graph, choose Interpolate from the Analyze menu. A vertical cursor now appears on the graph. The cursor’s concentration and absorbance coordinates are displayed in the floating box. Move the cursor along the regression line until the absorbance value is approximately the same as the absorbance value you recorded in Step 12. The corresponding concentration value is the concentration of the unknown solution, in mol/L.
2. Print a graph of absorbance vs. concentration, with a regression line and interpolated unknown concentration displayed. To keep the interpolated concentration value displayed, move the cursor straight up the vertical cursor line until the tool bar is reached. Enter your name(s) and the number of copies of the graph you want and print.
3. Use the calibration curve equation to determine the concentration of Allura Red in the diluted solution (solve for Concentration, given Absorbance). Calculate the concentration of Allura Red in the undiluted Gatorade.
Allura Red has the following chemical structure:

77
With the help of your TA, calculate the molar mass of Allura Red.
Use the molar mass to determine what mass of Allura Red you would consume if you drank one
20 ounce bottle of Gatorade.
Finally, determine the number of molecules of Allura Red you would consume if you drank one
20 ounce bottle of Gatorade (is molar mass necessary for this step?).
This lab was modified from lab 11 “Determining the Concentration of a Solution: Beer’s Law” from Chemistry with
Computers, Third Edition, Vernier, Inc.

78
Determining the Concentration of a Solution: Beer’s Law Lab Report:
Your report for this lab should include the following sections:
Abstract:
Your abstract must be written individually and should include the concentration
of Allura Red in Gatorade
Introduction:
Begin with a statement of the purpose of the experiment
Provide any relevant background and key concepts and an explanation of the
techniques used (calibration curve, Beer’s Law)
Data:
Include a table showing the concentrations of your standard solutions and their
absorbance values
Results:
Include a copy of your calibration curve
State the concentration of Allura Red in your diluted Gatorade solution and the
undiluted Gatorade
Attach hand written sample calculations to the back of your report
Discussion:
Discuss the experiment and any possible sources of error
Explain why you set the colorimeter to a wavelength of 470 nm.
Further questions: Answer the following questions in a separate section:
1. How many molecules of Allura Red would you consume if you drank one 20
ounce bottle of Gatorade?
2. What mass of Allura Red you would consume if you drank one 20 ounce
bottle of Gatorade? If your value is greater than the mass of one 20 ounce
bottle, be sure to recheck your calculations.
Submit your report on time and to your TA in the dropbox
on D2L.
79
Name_____________________________ Date______________ Lab Section______________
Electron Density Lab: There is not a formal lab report for this lab. Complete the below
pages using the Microsoft version of this file that is available for download on the lab D2L page.
Once the worksheet is complete, submit the worksheet on time and to your TA in the dropbox on
D2L.
1. Read sections 9.6 and 10.5 in your text book.
2. What are the three types of bonding?
3. What does the description polar bond refer to?
4. The interactions between water molecules can be described as electrostatic or coulombic,
where areas of positive charge are attracted to areas of negative charge. Draw a cartoon
of how three water molecules might be arranged in space, given this electrostatic
interaction.
5. Provide a brief explanation as to why atoms may have different values of
electronegativity. What causes a low electronegativity? High?
6. Briefly describe the difference between a nonpolar covalent and polar covalent bond.

80
Simulation
In this atomic-level simulation, you will investigate how an atoms' electronegativity value affects the
types of bonds they produce.
Enter: Phet.colorado.edu into the browser of your computer
select: Play with the Sims Chemistry Molecule Polarity
Part A Select the two atom tab in the upper left hand corner of the simulator. Turn on (check) all
“View” options. Investigate how the bond behaves when the atom's electronegativity is changed.
1. What does represent?
2. What does the symbol δ+ or δ- represent?
3. Adjust the electronegativities of atoms A and B. Can an atom with a high
electronegativity form a covalent bond? Describe under what circumstances this can
occur.
4. How does changing the electronegativity of the atoms affect the bond polarity?
5. Turn on (check) electron density in “Surface” options. Describe how a molecule’s
polarity is related to it electron density? How does the electron density around an atom with a
δ- compare to the electron density around an atom with a δ+?
6. What scenarios can bring about a higher electron density around a particular atom?

81
Electrostatic potential correlates with electron density. Electrostatic potential is basically a
measure of how a proton would react when brought to different regions of a molecule. It
provides a useful way to quickly predict polarity of a molecule or a region in a larger molecule.
Negative electrostatic potential (colored in shades of red) corresponds to an attraction of the
proton. Positive electrostatic potential (colored in shades of blue) corresponds to a repulsion of
the proton.
7. Describe how electron density is related to the electrostatic potential? In the red shaded
regions, what is responsible for a potential attraction to a proton? In the Blue shaded
regions, what would cause the repulsion?
8. Explain how the direction of the arrow in the bond dipole symbol ( ) relates to the
electron density, the partial charges and the electrostatic potential on a molecule.
9. What happens to a polar molecule when the electric field is turned on? Make sure to spin
the molecule several times while making observations. What if the molecule is nonpolar?

82
Part B
Select the three atoms tab in the upper left hand corner of the simulator. Turn on (check) all
“view options”. Investigate how the bond behaves when the electronegativity of the individual
atoms is changed. In addition to changing the electonegativities, orient the radial atoms relative
to one another by dragging them with the mouse.
1. Provide a summary as to how the bond dipoles affect the molecular dipose. Also,
describe how the geometric orientation of the bonded atoms affect the molecular dipole?
2. Provide a scenerio in which a molecule with two strong bond dipoles can have no
molecular dipole at all? Explain your answer with a drawing showing individual bond
dipoles and the overall molecular dipole.
3. Provide a scenerio in which a molecule may have a very large molecular dipole. Explain
your answer with a drawing showing individual bond dipoles and the overall molecular
dipole.
Part C One property between molecules which is explored more in CH222 is the solubility of one
substance in another. There is an adage that describes this ability, "Like dissolves like";
molecules with similar molecular dipoles will tend to interact favorably and mix. For instance,
a polar molecule will mix well (dissolve) other polar molecules (ethanol readily dissolves in
water, both are polar molecules and possess strong molecular dipoles). Octane (a major
component of gasoline) will not dissolve in water because it does not have a molecular dipole
and is thus a nonpolar molecule.
Being able to predict the polarity of a molecule is extremely important since many properties
of molecules depend on whether they are polar or non-polar. Predicting a molecule’s polarity is a

83
multi-step process that starts with drawing the Lewis structure. Using VSEPR, predict the
molecule’s molecular geometry. Individual bond polarities are finally used to predict the
molecular polarity.
1. For the following molecules complete this step-by-step process.
Molecule Lewis Structure Molecular Geometry
3-d Geometry with Bond Polarities
Polar or nonpolar?
*
CH3F
Tetrahedral
POLAR
N2
BF3
CH2F2
C is the central atom
HCN C is the central atom
*Make a prediction, and then check it in the “Real Molecules” section of the simulation.
2. Using the molecular dipoles/polarity of BF3, explain why BF3 does not mix with H2O?
Submit your report on time and to your TA in the dropbox
on D2L.

84
CH228 LABS
Pre-Lab: Enthalpy of Neutralization of Phosphoric Acid
Part A
Answer the following questions in your lab notebook (be sure to show
work for any calculations):
1. A neutralization reaction was carried out in a calorimeter. The temperature of the
solution rose from 20.0 °C to 25.6 °C. Is this reaction endothermic or exothermic?
2. A neutralization reaction was carried out in a calorimeter. The change in
temperature (∆T) of the solution was 5.6 °C and the mass of the solution was
100.0 g. Calculate the amount of heat energy gained by the solution (qsol). Use
4.18 J/(g•°C) as the specific heat, Cs, of the solution.
3. What is the value of qreaction for the neutralization reaction described in number 2?
4. How many moles of phosphoric acid are contained in 50.0 mL of 0.60 M H3PO4?
5. What is the value of Hreaction (in kJ/mol phosphoric acid) if 50.0 mL of 0.60 M
H3PO4 was used in the reaction described in number 2?
Part B
Prepare your notebook for the lab. This includes stating the purpose of the
experiment, summarizing the procedure in a bulleted-list format (be sure to
include space for observations) and preparing any tables necessary for data
collection.
At the start of your lab, remove the copies of the pages where you
completed the above work from your lab notebook and turn them
into your TA.

85
The Enthalpy of Neutralization of Phosphoric Acid
OBJECTIVES
In this experiment, you will
Measure the temperature change of the reaction between solutions of sodium hydroxide and phosphoric acid. Calculate the enthalpy, ΔH, of neutralization of phosphoric acid. Compare your calculated enthalpy of neutralization with the accepted value. Calculate the enthalpy, ΔH, of neutralization per ionizable hydrogen for phosphoric acid.
INTRODUCTION
A great deal can be learned by conducting an acid-base reaction as a titration. In addition, acid-base reactions can be observed and measured thermodynamically. In this case, the reaction is carried out in a calorimeter. If the temperature of the reaction is measured precisely, the enthalpy of neutralization of an acid by a base (or vice versa) can be determined. In this experiment, you will react phosphoric acid with sodium hydroxide.
You will use a Styrofoam cup nested in a beaker as a calorimeter, as shown in Figure 1. For purposes of this experiment, you may assume that the heat loss to the calorimeter and the surrounding air is negligible. Phosphoric acid will be the limiting reactant in this experiment, and you will accordingly be determining the enthalpy, ΔH, of neutralization of the acid. Selecting a limiting reactant helps ensure that the temperature measurements and subsequent calculations are as precise as possible.
Pages 246-248 and 257-258 in your text will provide background information.
Figure 1

86
Equipment Information Each bin should contain:
Notes:
a. Coffee cups are reusable. Do not throw them in the trash.
Chemical Safety Information Enthalpy of neutralization of phosphoric acid
Chemical Hazards
Phosphoric acid corrosive
Sodium hydroxide corrosive
2 – coffee cups Notify TA if damaged
1 – temperature probe After use, secure cord as
shown

87
PROCEDURE
1. Obtain and wear goggles. It is best to conduct this experiment in a well-ventilated room.
2. Connect a Temperature Probe to Channel 1 of the Vernier computer interface.
3. Start the Logger Pro program on your computer. Open the file “Lab 1 Phosphoric” from the Chemistry 228 folder.
4. Nest a Styrofoam cup in a 250 mL beaker as shown in Figure 1. Measure out 50.0 mL of 0.60 M H3PO4 solution into the foam cup. CAUTION: Handle the phosphoric acid with care. It can cause painful burns if it comes in contact with the skin.
5. Use a utility clamp to suspend the Temperature Probe from a ring stand (see Figure 1). Lower the Temperature Probe into the phosphoric acid solution.
6. Measure out 50.0 mL of 1.85 M NaOH solution in a graduated cylinder and transfer it to a 250 mL beaker. CAUTION: Sodium hydroxide solution is caustic. Avoid spilling it on your skin or clothing.
7. Conduct the experiment.
a. Click to begin the data collection and obtain the initial temperature of the H3PO4 solution.
b. After you have recorded three or four readings at the same temperature, add the 50.0 mL of NaOH solution to the Styrofoam cup all at once. Use a glass stirring rod to stir the reaction mixture gently and thoroughly.
c. Data will be collected for 10 minutes. You may terminate the trial early by clicking , if the temperature readings are no longer changing.
d. Click the Statistics button, . The minimum and maximum temperatures are listed in the statistics box on the graph. If the minimum temperature is not a suitable initial temperature, examine the graph and determine the initial temperature.
e. Record the initial and maximum temperatures for Trial 1.
f. Close the Statistics box by clicking the X in the corner of the box.
8. Rinse and dry the Temperature Probe, Styrofoam cup, and stirring rod. Dispose of the solution as directed.
9. Repeat Steps 4–8 to conduct a second trial. If directed, conduct a third trial. Print a copy of the graph of the second trial to include with your data and analysis.
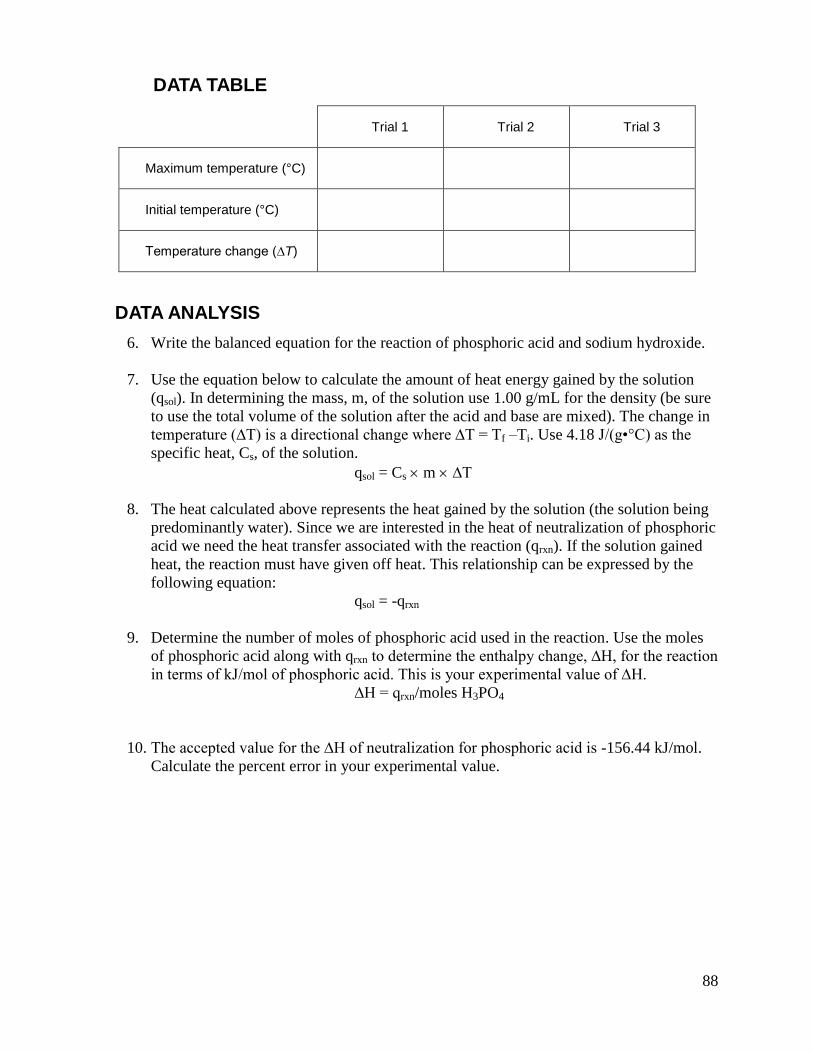
88
DATA TABLE
Trial 1 Trial 2 Trial 3
Maximum temperature (°C)
Initial temperature (°C)
Temperature change (∆T)
DATA ANALYSIS
6. Write the balanced equation for the reaction of phosphoric acid and sodium hydroxide.
7. Use the equation below to calculate the amount of heat energy gained by the solution
(qsol). In determining the mass, m, of the solution use 1.00 g/mL for the density (be sure
to use the total volume of the solution after the acid and base are mixed). The change in
temperature (∆T) is a directional change where ∆T = Tf –Ti. Use 4.18 J/(g•°C) as the
specific heat, Cs, of the solution.
qsol = Cs m ∆T
8. The heat calculated above represents the heat gained by the solution (the solution being
predominantly water). Since we are interested in the heat of neutralization of phosphoric
acid we need the heat transfer associated with the reaction (qrxn). If the solution gained
heat, the reaction must have given off heat. This relationship can be expressed by the
following equation:
qsol = -qrxn
9. Determine the number of moles of phosphoric acid used in the reaction. Use the moles
of phosphoric acid along with qrxn to determine the enthalpy change, ∆H, for the reaction
in terms of kJ/mol of phosphoric acid. This is your experimental value of ∆H.
∆H = qrxn/moles H3PO4
10. The accepted value for the ∆H of neutralization for phosphoric acid is -156.44 kJ/mol.
Calculate the percent error in your experimental value.

89
The Enthalpy of Neutralization of Phosphoric Acid Lab Report
Name_____________________________ Date______________ Lab Section______________
Describe coffee cup calorimetry and how it is used to find the enthalpy of various reactions
that occur in aqueous solutions. Make sure to include the relevant equations. Why can you
use the specific heat capacity and density of pure water to determine the enthalpy of reaction?
What assumptions must be made in order to do this?
.
Data: Insert your data table (with a caption) below that captures all of the relevant
information.

90
Results:
Report your calculated average value of ∆H of neutralization for phosphoric acid.
Include hand written sample calculations.
Report the percent error for the ∆H of neutralization for phosphoric acid. Include any
calculations..
Discussion: Is your value for the ∆H of neutralization for phosphoric acid greater than or less
than the accepted value. Think of some valid sources of error to account for your
difference and explain how they would contribute to the direction of your error.
The Enthalpy of Neutralization Lab Report:
There is not a formal lab report for this lab. Complete the above pages and submit them
to your TA.

91
Pre-Lab: Hess’s Law
Part A
Answer the following questions in your lab notebook (be sure to show work
for any calculations):
1. What is the formula that relates the temperature change observed in a substance with the
energy released or absorbed?
2. When you measure a temperature rise during a chemical reaction, is the reaction
endothermic or exothermic?
3. The enthalpy of the reaction for the reaction of calcium oxide with hydrochloric acid is
exothermic. Will the reverse reaction have a positive or negative H?
4. Hess’s Law allows us to combine reactions to determine the heat of reaction for a net
reaction that has not been measured. For the reactions described in the lab, the second
reaction is difficult to measure as written. You will measure the heat of reaction for the
reverse reaction. How will you use the measurement in the Hess’s Law calculation?
5. Calculate the enthalpy for this reaction:
2C(s) + H2(g) ---> C2H2(g) ΔH° = ??? kJ
Given the following thermochemical equations:
C2H2(g) + (5/2)O2(g) ---> 2CO2(g) + H2O(ℓ) ΔH° = -1299.5 kJ
C(s) + O2(g) ---> CO2(g) ΔH° = -393.5 kJ
H2(g) + (1/2)O2(g) ---> H2O(ℓ) ΔH° = -285.8 kJ
Part B
Prepare your notebook for the lab. This includes stating the purpose of the
experiment, summarizing the procedure in a bulleted-list format (be sure to
include space for observations) and preparing any tables necessary for data
collection.
At the start of your lab, remove the copies of the pages where you
completed the above work from your lab notebook and turn them into
your TA.

92
Enthalpy of Reaction and Hess's Law
Introduction
In this experiment you will be finding the enthalpy of formation for MgO(s)
using an
indirect method . Remember, according to Hess's Law (see your textbook for more
details), if two or more reactions can be added to give a net reaction, H° for the net
reaction is simply the sum of the H°''s for the reactions which are added . Consider
the following three reactions:
1) Mg(s)
+ 2 H+
(aq) ---> Mg
2+
(aq) + H
2(g) H
°
1
2) Mg2+
(aq) + H
2O
(l) ---> MgO
(s) + 2 H
+
(aq) H
°
2
3) H2(g)
+ 1/ 2 O2(g)
---> H2O
(l) H
°
3
4) Mg(s)
+ 1/ 2 O2(g)
---> MgO(s)
H°
4
You will determine the heat of reaction for reactions 1 and 2 experimentally, then use
the known value of the enthalpy of formation of water (H°
3 = -285.9 kJ/ mol) to
calculate H°
4 which is the enthalpy of formation of MgO. Be aware that equation (2)
is the reverse of the reaction you actually run and measure. (Note: the enthalpy of
formation of MgO cannot easily be measured .)
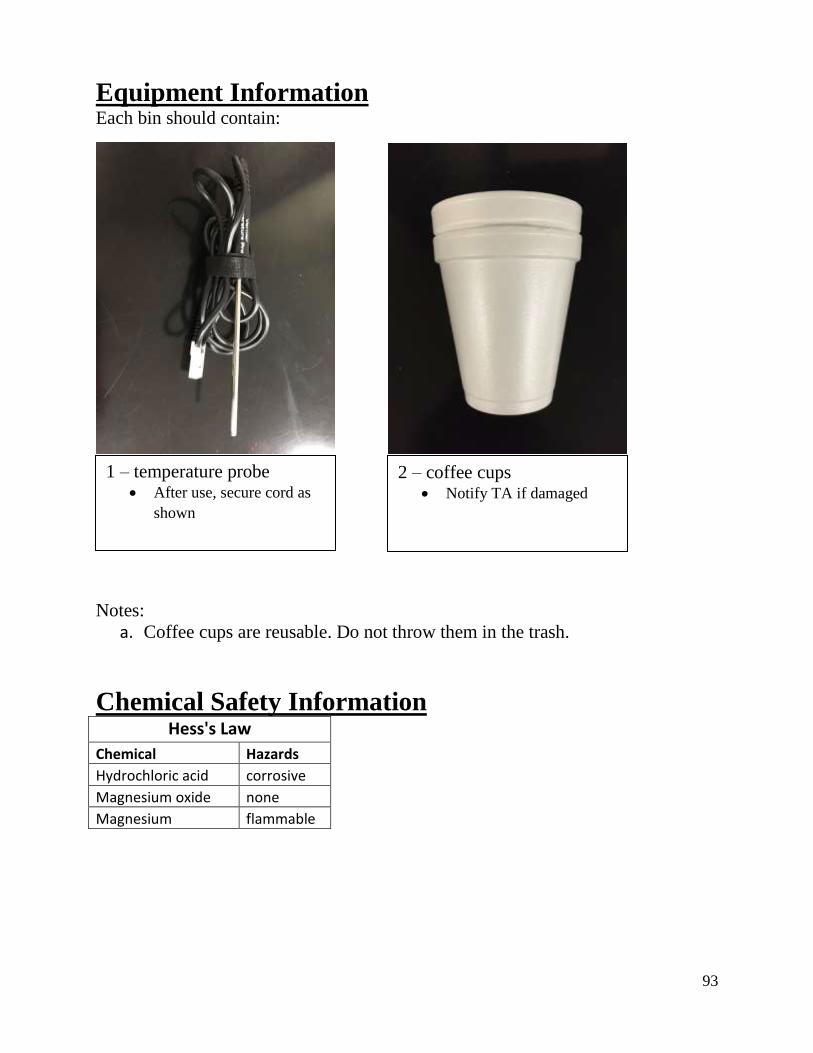
93
Equipment Information Each bin should contain:
Notes:
a. Coffee cups are reusable. Do not throw them in the trash.
Chemical Safety Information Hess's Law
Chemical Hazards
Hydrochloric acid corrosive
Magnesium oxide none
Magnesium flammable
1 – temperature probe After use, secure cord as
shown
2 – coffee cups Notify TA if damaged
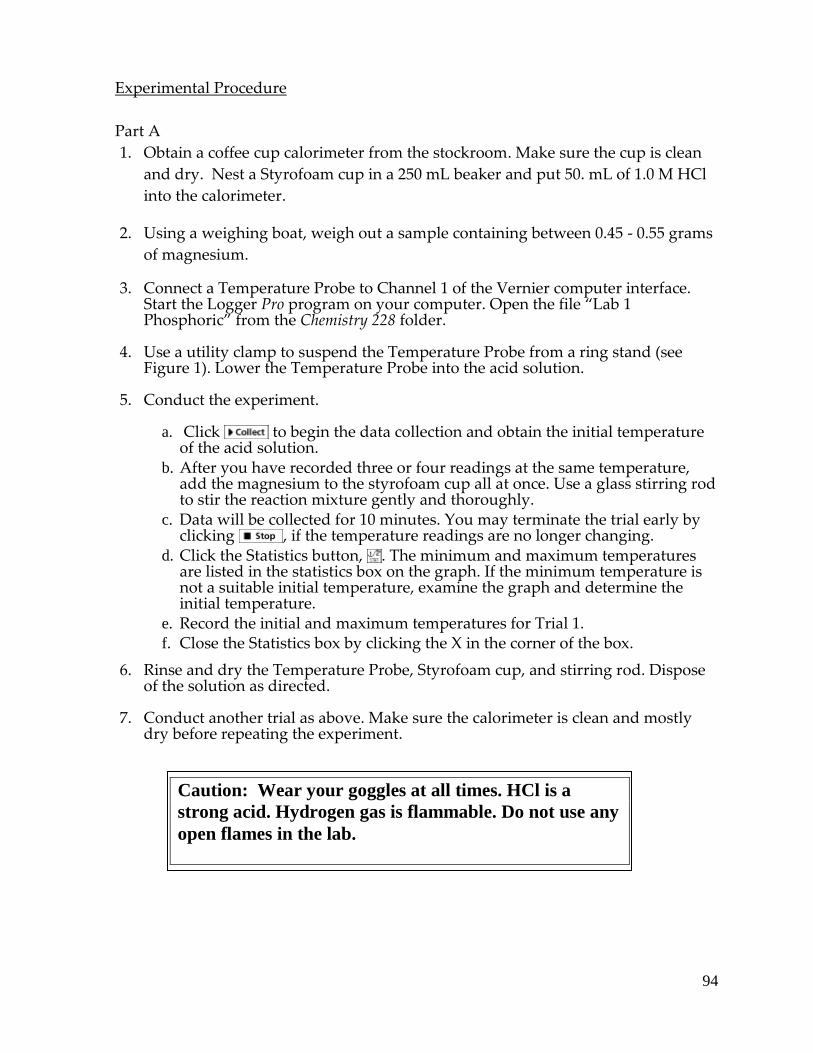
94
Experimental Procedure
Part A
1. Obtain a coffee cup calorimeter from the stockroom. Make sure the cup is clean
and dry. Nest a Styrofoam cup in a 250 mL beaker and put 50. mL of 1.0 M HCl
into the calorimeter.
2. Using a weighing boat, weigh out a sample containing between 0.45 - 0.55 grams
of magnesium.
3. Connect a Temperature Probe to Channel 1 of the Vernier computer interface. Start the Logger Pro program on your computer. Open the file “Lab 1 Phosphoric” from the Chemistry 228 folder.
4. Use a utility clamp to suspend the Temperature Probe from a ring stand (see Figure 1). Lower the Temperature Probe into the acid solution.
5. Conduct the experiment.
a. Click to begin the data collection and obtain the initial temperature of the acid solution.
b. After you have recorded three or four readings at the same temperature, add the magnesium to the styrofoam cup all at once. Use a glass stirring rod to stir the reaction mixture gently and thoroughly.
c. Data will be collected for 10 minutes. You may terminate the trial early by clicking , if the temperature readings are no longer changing.
d. Click the Statistics button, . The minimum and maximum temperatures are listed in the statistics box on the graph. If the minimum temperature is not a suitable initial temperature, examine the graph and determine the initial temperature.
e. Record the initial and maximum temperatures for Trial 1. f. Close the Statistics box by clicking the X in the corner of the box.
6. Rinse and dry the Temperature Probe, Styrofoam cup, and stirring rod. Dispose of the solution as directed.
7. Conduct another trial as above. Make sure the calorimeter is clean and mostly dry before repeating the experiment.
Caution: Wear your goggles at all times. HCl is a
strong acid. Hydrogen gas is flammable. Do not use any
open flames in the lab.
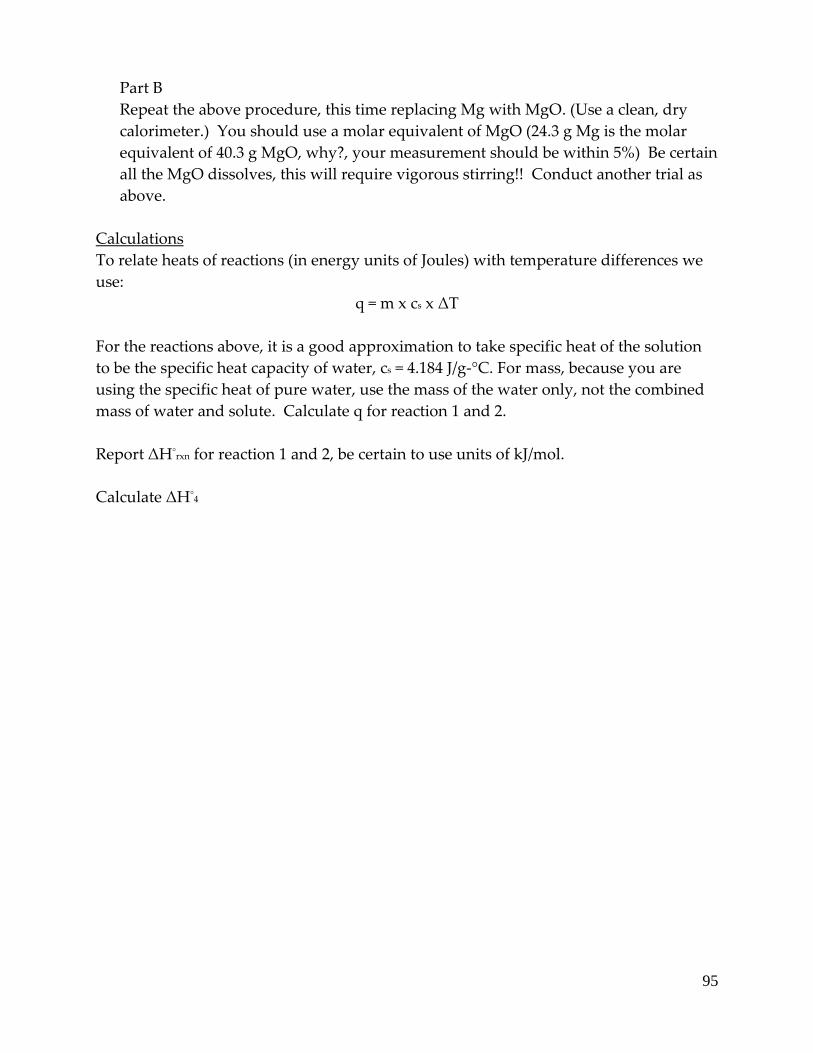
95
Part B
Repeat the above procedure, this time replacing Mg with MgO. (Use a clean, dry
calorimeter.) You should use a molar equivalent of MgO (24.3 g Mg is the molar
equivalent of 40.3 g MgO, why?, your measurement should be within 5%) Be certain
all the MgO dissolves, this will require vigorous stirring!! Conduct another trial as
above.
Calculations
To relate heats of reactions (in energy units of Joules) with temperature differences we
use:
q = m x cs x ΔT
For the reactions above, it is a good approximation to take specific heat of the solution
to be the specific heat capacity of water, cs = 4.184 J/g-°C. For mass, because you are
using the specific heat of pure water, use the mass of the water only, not the combined
mass of water and solute. Calculate q for reaction 1 and 2.
Report ΔH°rxn for reaction 1 and 2, be certain to use units of kJ/mol.
Calculate ΔH°4
96
Hess’s Law Lab Report:
Your report for this lab should include the following sections:
Abstract:
Your abstract should be written individually
Introduction:
Include a statement of purpose for this experiment, relevant conceptual
background, and general equations
Data:
Prepare a data table that includes the initial and final temperatures for each trial
Report the mass of Mg and MgO used in each trial
Results:
Prepare a results table showing the calculated Hrxn
for each trial and averages
for reactions one and two and the value of H for reaction four
Be sure to attach hand written sample calculations to the back of your report
Discussion:
Discuss the experiment and any possible sources of error
As part of your discussion, answer the following questions:
1. For an exothermic reaction, does the temperature observed rise or fall?
2. For an exothermic reaction, is H° positive or negative?
3. Is reaction 1 endothermic or exothermic? reaction 2?
4. In this lab, you measure the quantity, q. How is this d ifferent
from H°
rxn, (remember the definitions and units)?
Answer the following question and attach it to your report:
Further Analysis
An alloy (a metal mixture) containing magnesium and another metal, that does not
react with hydrochloric acid , needs to analyzed . You are asked to determine the percent
magnesium in the alloy.
a) Using what you have learned about enthalpy , describe the procedure you
would use to determine the percent magnesium in the alloy.
b) If the sample were 30% magnesium calculate the heat evolved if a 5 gram
sample were analyzed in that manner. Use your value from this experiment
for the Hrxn
for Mg in order to obtain a value.
Submit your report on time and to your TA in the dropbox
on D2L.

97
Deriving the Gas Laws Using Computer Simulations
Note: If you have a Macintosh computer or are having trouble running the simulators on your
personal computer, please use any of the university computer labs. Chemistry students are
welcome to use the computers in the chemistry department sponsored computer lab located in
SB1 room 221.
Introduction
According to the kinetic molecular theory, gases are in constant and random motion with enough
kinetic energy such that they rarely interact with one another. When gas particles collide with the
walls of a container, they rebound with no apparent loss of energy. These characteristics describe
an "Ideal Gas." Experimental evidence suggests that many common gases making up air behave
in this manner when studied at temperatures well above their boiling points.
We are constantly being exposed to the behavior of gases. Each time we pump up a tire, blow up
a balloon, use a spray can, or experience the cooling of gases as they escape from a gas storage
container, we are reminded of how gases behave with changes in temperature (T), volume (V),
pressure (P), or number of particles (n).
The behavior of gases has been scientifically investigated starting with Robert Boyle's work in
1662, followed by Jacques Charles' (1787) and Joseph Gay-Lussac's work (1802). Together these
studies led to the so called "Gas Laws" which relate volume (V), pressure (P), temperature (T)
and numbers of particles of gas (n). In a scientific manner, one can derive the mathematical
relationships that exist between these variables by holding two of the variables constant,
changing one and monitoring the effect on the fourth variable. To derive the relationships, you
will be using an interactive research-based simulation produced by the PhET project at the
University of Colorado.
PROCEDURE 1: Pressure Volume Relationship 1. Go to the Physics Education Technology from the University of Colorado at:
http://phet.colorado.edu/new/simulations/sims.php?sim=Gas_Properties
2. Click the RUN NOW button under the Gas Properties Simulation window (highlighted in
green).
3. Play around with the simulator and see what sorts of tools are available to you to analyze
the behaviors of gases. Qualitatively get a feel for the relationships that exist between the
four variables that describe gases: P, V, n and T. If you ever get to a point that you need
to reset the simulator, you can always hit the reset button at the bottom right of the
screen.
4. If you have not already done so, on the lower right side of the screen, click on the
RESET button.
5. On the right side of the screen, click on the MEASURMENT TOOLS button. Next,
click on the RULER option to activate the ruler.

98
CLICK
HERE
6. In the upper right hand corner, click on the TEMPERATURE button under the
Constant Parameter heading. This will hold temperature constant while allowing you to
observe the relationship between pressure and volume.
CLICK
HERE
7. Using the mouse and the right button, drag the ruler into a position that will allow you to
measure the length of the container.
8. Using the mouse and the right button, grab hold of the man pushing against the container
and expand the length of the container so that it measures 9.0 nm. Record this as your
initial length (the height of the box will remain 5.0 nm and the width of the box will
remain 5.0 nm)
GRAB
AND
DRAG

99
9. Using the mouse and the right button, grab hold of the pump handle and inject one cycles
worth of gas into the chamber by pulling the handle up then pushing it back down.
MOVE UP THEN DOWN
10. Once the pressure has somewhat stabilized, record your pressure value for the chamber
length of 9.0 nm. This will represent your initial pressure in atmospheres.
PRESSURE (ATM)
11. Using the mouse and right button, grab hold of the man pushing on the container and
decrease the length of the container to approximately 8.0 nm. Once the pressure has
stabilized (again, this may take a short period of time to happen), record the new pressure
for a length of 8.0 nm.
PUSH IN

100
12. Repeat step 9 for approximate lengths of 7.0 nm, 6.0 nm, 5.0 nm, 4.0 nm, 3.0 nm, and
2.0 nm (you will probably not get to exactly 2 nm). For each trial, record the length
value and resulting pressure value in a properly labeled data table.
13. Record any qualitative observations on the behavior of the gas molecules as the volume
decreases.
14. Click the RESET button to remove all the gas particles from the chamber before moving
on to the next section.
PROCEDURE 2: Volume Temperature Relationship Devise an experiment using the simulator in which you can elucidate the relationship between
Temperature and the Volume of a gas. Collect and record your data over a wide range of
temperatures. Hint, before adding any gas, reduce the volume of the container. Make the
volume constant. Add gas (more particles seem to provide less noise in the volume
measurement). Reduce the temperature to a good low starting point. Finally, remove constant
volume and change to constant pressure before beginning your measurements.
Procedure 3: Temperature Pressure Relationship Devise an experiment using the simulator in which you can elucidate the relationship between
Temperature and the Pressure of a gas. Collect and record your data over a wide range of
temperatures, 0-600 K, in a properly labeled table
Procedure 4: Pressure Quantity Relationship Devise an experiment using the simulator in which you can elucidate the relationship between
Quantity and the Pressure of a gas. Collect and record your data over a wide range of number of
molecules in a properly labeled table
Analysis: For this lab, you will need to submit neat labeled data tables for each procedure. You must also
submit a graphical representation for each relationship. Be sure to label each axis and include a
title for each graph (Please see the information on pages 15 and 16 of this lab manual). I suggest
that you utilize Microsoft Excel or some other comparable spreadsheet software to produce your
tables and graphs. Along with the graphs and tables for each procedure, answer completely the
questions below that correlate with each section.
Analysis: Procedure 1: Pressure Volume Relationship
1. Graphically represent the Pressure (atm) Volume (nm3) relationship with volume on the
x-axis.
2. Graphically represent the Pressure (atm) and Inverse Volume, 1/V (nm-3
) relationship
with 1/V on the x axis
3. Identify the mathematical relationship that exists between pressure and volume, when
temperature and quantity are held constant, as being directly proportional or inversely
proportional. Explain your answer and write an equation that relates pressure and volume
to a constant, using variables, not the mathematical equation from the best fit line.
4. Why were you asked to graph pressure and the inverse of volume?

101
5. Calculate the slope of the line for your pressure vs. 1/volume graph. What properties does
this number represent? Would you expect it to be the same for other gases? Explain your
answer.
Analysis Questions: Procedure 2: Volume Temperature Relationship 6. Graphically represent the Temperature (K) Volume (nm
3) relationship.
7. Identify the mathematical relationship that exists between volume and temperature, when
pressure and quantity are held constant, as being directly proportional or inversely
proportional. Explain your answer and write an equation that relates volume and
temperature to a constant, using variables, not the mathematical equation from the best fit
line.
8. Calculate the slope of the line for your temperature vs. volume graph. What properties
does this number represent? Would you expect it to be the same for other gases? Explain
your answer.
Analysis Questions: Procedure 3: Temperature Pressure Relationship 9. Graphically represent the Temperature (K) Pressure (atm) relationship. Make sure the
axis that represents temperature includes a range from 0 K to 600 K.
10. Identify the mathematical relationship that exists between pressure and temperature,
when volume and quantity are held constant, as being directly proportional or inversely
proportional. Explain your answer and write an equation that relates pressure and
temperature to a constant, using variables, not the mathematical equation from the best fit
line.
11. Calculate the slope of the line for your temperature vs. pressure graph. What properties
does this number represent? Would you expect it to be the same for other gases? Explain
your answer.
12. What effect does temperature have on molecular motion. Using this explanation, explain
why both pressure and volume can decrease with decreasing temperature.
13. Absolute zero is theorized to be the temperature that all molecular motion stops. Based
on this, what would you predict to be the pressure and volume of a gas sample whose
temperature is decreased to absolute zero? Explain any problems with these expectations
using the ideal gas law.
Analysis Questions: Procedure 4: Pressure Quantity Relationship 14. Graphically represent the Quantity (number of molecules) Pressure (atm) relationship
15. Describe the impact of increasing the number of molecules (or moles) of a gas on the
pressure of a gas sample. Would you expect this trend to be the same for other gases?
Explain your answer.
16. Based on your previous observations, predict the impact of changing the number of moles
of a gas sample on the volume of the gas sample (if pressure and temperature are held
constant). What effect would changing the number of moles of a gas sample have on the
temperature of a gas sample (if pressure and volume are held constant)? Explain your
answer and state whether these relationships are proportional or inversely proportional.
Submit your report on time and to your TA in the
dropbox on D2L.

102
Pre-Lab: Decomposition of Hydrogen Peroxide
Part A
Answer the following questions in your lab notebook (be sure to show work for
any calculations):
1. What is Dalton’s law of partial pressure?
2. A mixture of three gasses (A, B and C) has a total pressure of 849 torr and the partial
pressure of A is 57 torr and the partial pressure of B is 573 torr. What is the partial
pressure of C?
3. A gas has a volume of 94 mL, a pressure of 743 torr and a temperature of 20 °C.
Calculate the number of moles of gas present. Assume ideal behavior of the gas.
4. If 0.00946 moles of O2 gas is collected from the decomposition of hydrogen peroxide,
how many moles of hydrogen peroxide were reacted?
Part B
Prepare your notebook for the lab. This includes stating the purpose of the
experiment, summarizing the procedure in a bulleted-list format (be sure to include
space for observations) and preparing any tables necessary for data collection.
At the start of your lab, remove the copies of the pages where you
completed the above work from your lab notebook and turn them into
your TA.

103
Decomposition of Hydrogen Peroxide
OBJECTIVES
Decompose hydrogen peroxide using KI as a catalyst
Measure the volume of oxygen gas generated through the decomposition reaction
Illustrate Dalton’s Law of partial pressure
Determine the number of moles of oxygen gas produced using the ideal gas law
Determine the percent hydrogen peroxide in an aqueous solution
INTRODUCTION
Hydrogen peroxide spontaneously decomposes to form oxygen gas according to the
following equation:
2 H2O2 (aq) → 2 H2O (l) + O2 (g)
This process usually occurs very slowly. Many different compounds or ions are capable of acting
as catalysts increasing the rate of the reaction. Here, potassium iodide (KI) will be used as a
catalyst to make the reaction produce products rapidly enough to study the reaction in the lab.
The apparatus we will use to collect oxygen gas in this experiment is shown in figure 1.
Hydrogen peroxide will be placed in the Erlenmyer flask. The catalyst (KI) is located in the
syringe and can be added to the Erlenmyer flask to initiate the reaction. As the reaction proceeds
oxygen gas will be produced in the Erlenmyer flask and travel through the tubing. The gas will
be collected in the graduated cylinder. The graduated cylinder is initially filled with water. As
the gas enters the cylinder it displaces water allowing the volume of the gas to be measured.
Figure 1

104
Equipment Information Each bin should contain one 100mL graduated cylinder and:
Gas capture kit components: 1x rubber stopper, 2x plastic Luer tips, 1x syringe,
1x tubing, and 1x stopcock
Notes:
a. When cleaning up, do not put temperature probe in gas capture kit bag.
b. Parafilm is reusable.
c. Water from the water displacement bath is not waste.
Chemical Safety Information Decomposition of hydrogen peroxide
Chemical Hazards
Hydrogen peroxide corrosive
Potassium iodide toxic
1 – temperature probe After use, secure cord as
shown
1 – gas capture kit See below for components
Place all components back
into bag at end of class
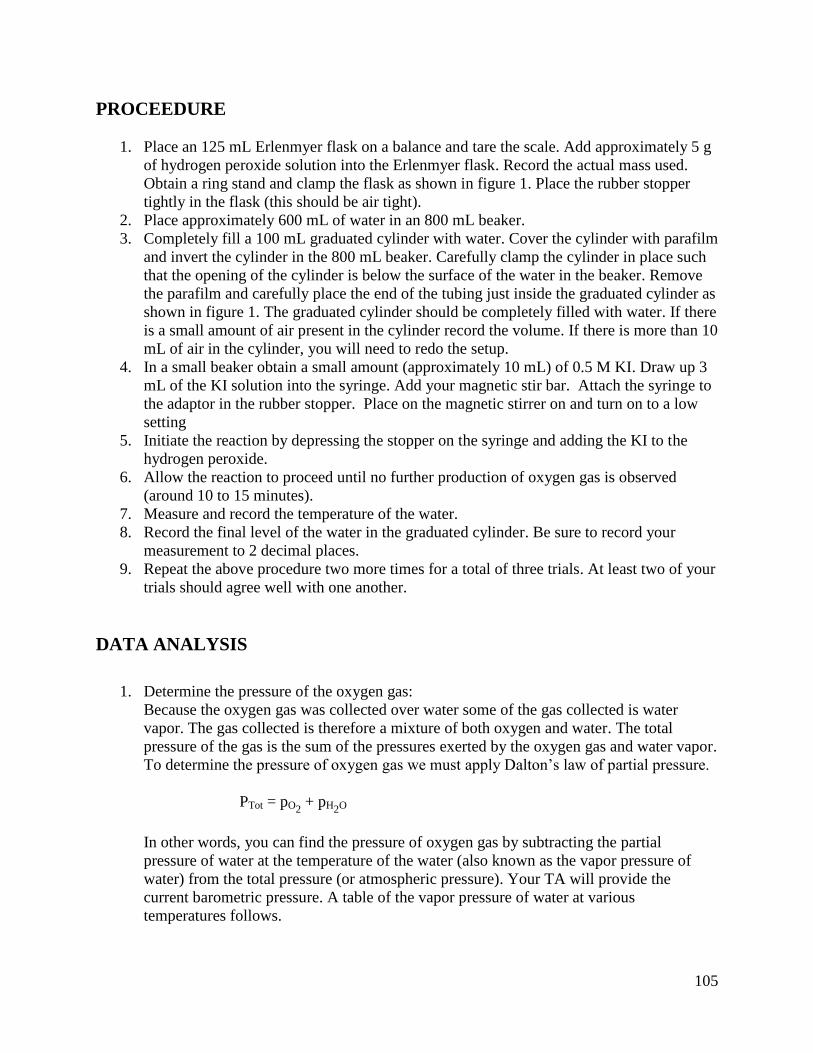
105
PROCEEDURE
1. Place an 125 mL Erlenmyer flask on a balance and tare the scale. Add approximately 5 g
of hydrogen peroxide solution into the Erlenmyer flask. Record the actual mass used.
Obtain a ring stand and clamp the flask as shown in figure 1. Place the rubber stopper
tightly in the flask (this should be air tight).
2. Place approximately 600 mL of water in an 800 mL beaker.
3. Completely fill a 100 mL graduated cylinder with water. Cover the cylinder with parafilm
and invert the cylinder in the 800 mL beaker. Carefully clamp the cylinder in place such
that the opening of the cylinder is below the surface of the water in the beaker. Remove
the parafilm and carefully place the end of the tubing just inside the graduated cylinder as
shown in figure 1. The graduated cylinder should be completely filled with water. If there
is a small amount of air present in the cylinder record the volume. If there is more than 10
mL of air in the cylinder, you will need to redo the setup.
4. In a small beaker obtain a small amount (approximately 10 mL) of 0.5 M KI. Draw up 3
mL of the KI solution into the syringe. Add your magnetic stir bar. Attach the syringe to
the adaptor in the rubber stopper. Place on the magnetic stirrer on and turn on to a low
setting
5. Initiate the reaction by depressing the stopper on the syringe and adding the KI to the
hydrogen peroxide.
6. Allow the reaction to proceed until no further production of oxygen gas is observed
(around 10 to 15 minutes).
7. Measure and record the temperature of the water.
8. Record the final level of the water in the graduated cylinder. Be sure to record your
measurement to 2 decimal places.
9. Repeat the above procedure two more times for a total of three trials. At least two of your
trials should agree well with one another.
DATA ANALYSIS
1. Determine the pressure of the oxygen gas:
Because the oxygen gas was collected over water some of the gas collected is water
vapor. The gas collected is therefore a mixture of both oxygen and water. The total
pressure of the gas is the sum of the pressures exerted by the oxygen gas and water vapor.
To determine the pressure of oxygen gas we must apply Dalton’s law of partial pressure.
PTot = pO2 + pH2O
In other words, you can find the pressure of oxygen gas by subtracting the partial
pressure of water at the temperature of the water (also known as the vapor pressure of
water) from the total pressure (or atmospheric pressure). Your TA will provide the
current barometric pressure. A table of the vapor pressure of water at various
temperatures follows.

106
Table 1: Vapor pressure of water at various temperatures
Temperature Vapor
Pressure Temperature Vapor
Pressure Temperature Vapor
Pressure
(oC) (torr) (
oC) (torr) (
oC) (torr)
15 12.8 21 18.6 27 26.7
16 13.6 22 19.8 28 28.3
17 14.5 23 21.1 29 30
18 15.5 24 22.4 30 31.8
19 16.5 25 23.8 31 33.7
20 17.5 26 25.2 32 35.7
2. Determine the volume of the oxygen gas:
When the reaction was initiated, 3 mL of KI solution was added. This volume needs to be
subtracted from the volume of gas collected. If your initial volume of gas was not zero,
this must also be taken into consideration.
VO2 = Vfinal – Vinitial – 3 mL
3. Calculate the number of moles of oxygen gas generated:
Now that the pressure, volume and temperature of the gas are known, the moles of gas
can be calculated using the ideal gas law. The temperature of the gas will be considered
to be the same temperature as the water temperature measured during the experiment.
PV = nRT
4. Calculate the amount of H2O2:
Using the balanced equation, calculate the number of moles of H2O2 present in the initial
solution. Calculate the molar mass of H2O2 and determine the grams of H2O2 present in
the initial solution.
5. Calculate the mass percent of hydrogen peroxide:
Using the mass of H2O2 calculated above and the initial mass of the H2O2 solution,
calculate the mass percent H2O2 in the initial solution.

107
Hydrogen Peroxide Lab Report:
Your report for this lab should include the following sections:
Abstract:
Your abstract should be written individually
Introduction:
Include a statement of purpose for this experiment, relevant conceptual
background, and general equations
Data:
Include a data table with data from all 3 trials
Results:
Include a results table with the mass percent of hydrogen peroxide from each trial
Be sure to attach hand written sample calculations to the back of your report
Discussion:
Discuss the experiment and any possible sources of error
Submit your report on time and to your TA in the dropbox
on D2L.

108
Pre-Lab: Vapor Pressure and Heat of Vaporization
Part A
Answer the following questions in your lab notebook (be sure to show work for
any calculations):
1. When using the equation P1/T1 = P2/T2 to relate temperature and pressure of a gas, what
must be held constant?
2. A sample of gas is held in a capped flask. At 25 °C the pressure is 693 mmHg. What is
the pressure of the gas at 37 °C?
3. If the heat of vaporization of water is 40.7 kJ/mol, how much energy is required to
vaporize 5.0 g of liquid water at 100 °C?
4. Would you expect most of the components in a perfume to have a low or high vapor
pressure? Explain.
Part B
Prepare your notebook for the lab. This includes stating the purpose of the
experiment, summarizing the procedure in a bulleted-list format (be sure to include
space for observations) and preparing any tables necessary for data collection.
At the start of your lab, remove the copies of the pages where you
completed the above work from your lab notebook and turn them into
your TA.

109
Vapor Pressure and Heat of Vaporization
When a volatile liquid is placed in a container, and the container is sealed tightly, a portion of the liquid will evaporate. The newly formed gas molecules exert pressure in the container, while some of the gas condenses back into the liquid state. If the temperature inside the container is held constant, then at some point a physical equilibrium will be reached. At this equilibrium, the rate of condensation is equal to the rate of evaporation. The pressure at equilibrium is called vapor pressure, and will remain constant as long as the temperature in the container does not change.
In mathematical terms, the relationship between the vapor pressure of a liquid and temperature is described in the Clausius-Claypeyron equation,
CTR
HP
vap
1ln
where ln P is the natural logarithm of the vapor pressure, ΔHvap is the heat of vaporization, R is the universal gas constant (8.31 J/mol•K), T is the temperature (in Kelvin) and C is a constant not related to heat capacity. Thus, the Clausius-Clayperon equation not only describes how vapor pressure is affected by temperature, but it relates these factors to the heat of vaporization of a liquid. ΔHvap is the amount of energy required to cause the vaporization of one mole of liquid at constant pressure.
In this experiment, you will introduce a specific volume of a volatile liquid into a closed vessel, and measure the pressure in the vessel at several different temperatures. By analyzing your measurements, you will be able to calculate the ΔHvap of the liquid.
OBJECTIVES
In this experiment, you will
Measure the pressure inside a sealed vessel containing a volatile liquid over a range of temperatures.
Determine the relationship between pressure and temperature of the volatile liquid.
Calculate the heat of vaporization of the liquid.
Figure 1

110
Equipment Information Each bin should contain:
Gas capture kit components: 1x rubber stopper, 2x plastic Luer tips, 1x syringe,
1x tubing, and 1x stopcock
Notes:
a. When cleaning up, do not put temperature probe in gas capture kit bag
Chemical Safety Information Vapor pressure and heat of vaporization
Chemical Hazards
Ethanol flammable, toxic
1 – gas pressure sensor Place back in bag at
the end of class
1 – gas capture kit See below for
components
Place all components
back into bag at end of
class
1 – temperature probe After use, secure cord
as shown
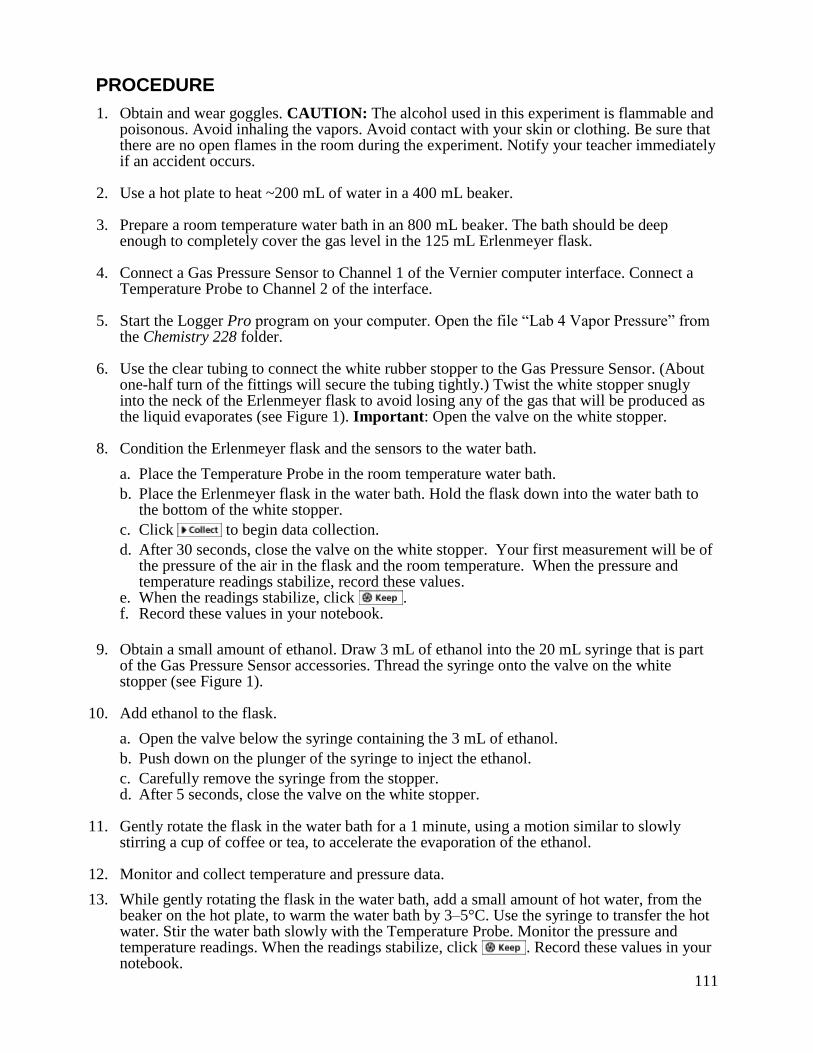
111
PROCEDURE
1. Obtain and wear goggles. CAUTION: The alcohol used in this experiment is flammable and poisonous. Avoid inhaling the vapors. Avoid contact with your skin or clothing. Be sure that there are no open flames in the room during the experiment. Notify your teacher immediately if an accident occurs.
2. Use a hot plate to heat ~200 mL of water in a 400 mL beaker.
3. Prepare a room temperature water bath in an 800 mL beaker. The bath should be deep enough to completely cover the gas level in the 125 mL Erlenmeyer flask.
4. Connect a Gas Pressure Sensor to Channel 1 of the Vernier computer interface. Connect a Temperature Probe to Channel 2 of the interface.
5. Start the Logger Pro program on your computer. Open the file “Lab 4 Vapor Pressure” from the Chemistry 228 folder.
6. Use the clear tubing to connect the white rubber stopper to the Gas Pressure Sensor. (About one-half turn of the fittings will secure the tubing tightly.) Twist the white stopper snugly into the neck of the Erlenmeyer flask to avoid losing any of the gas that will be produced as the liquid evaporates (see Figure 1). Important: Open the valve on the white stopper.
8. Condition the Erlenmeyer flask and the sensors to the water bath.
a. Place the Temperature Probe in the room temperature water bath.
b. Place the Erlenmeyer flask in the water bath. Hold the flask down into the water bath to the bottom of the white stopper.
c. Click to begin data collection.
d. After 30 seconds, close the valve on the white stopper. Your first measurement will be of the pressure of the air in the flask and the room temperature. When the pressure and temperature readings stabilize, record these values.
e. When the readings stabilize, click . f. Record these values in your notebook.
9. Obtain a small amount of ethanol. Draw 3 mL of ethanol into the 20 mL syringe that is part of the Gas Pressure Sensor accessories. Thread the syringe onto the valve on the white stopper (see Figure 1).
10. Add ethanol to the flask.
a. Open the valve below the syringe containing the 3 mL of ethanol.
b. Push down on the plunger of the syringe to inject the ethanol.
c. Carefully remove the syringe from the stopper. d. After 5 seconds, close the valve on the white stopper.
11. Gently rotate the flask in the water bath for a 1 minute, using a motion similar to slowly
stirring a cup of coffee or tea, to accelerate the evaporation of the ethanol.
12. Monitor and collect temperature and pressure data.
13. While gently rotating the flask in the water bath, add a small amount of hot water, from the beaker on the hot plate, to warm the water bath by 3–5°C. Use the syringe to transfer the hot water. Stir the water bath slowly with the Temperature Probe. Monitor the pressure and temperature readings. When the readings stabilize, click . Record these values in your notebook.
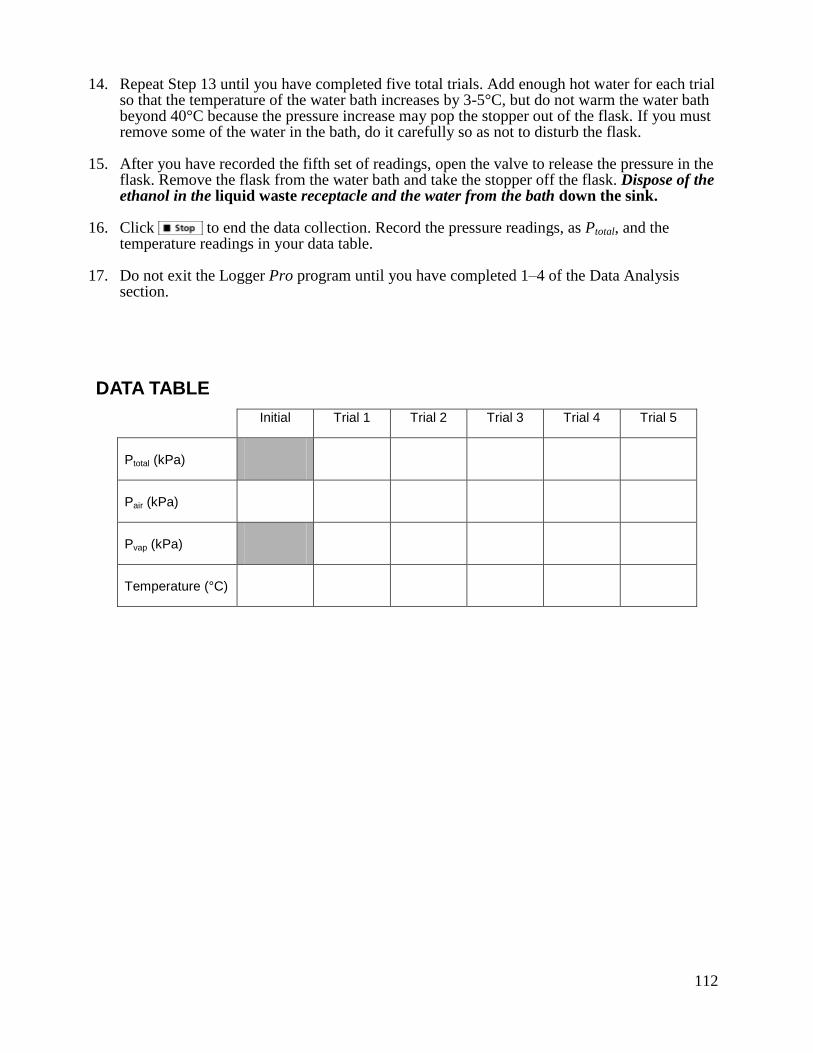
112
14. Repeat Step 13 until you have completed five total trials. Add enough hot water for each trial so that the temperature of the water bath increases by 3-5°C, but do not warm the water bath beyond 40°C because the pressure increase may pop the stopper out of the flask. If you must remove some of the water in the bath, do it carefully so as not to disturb the flask.
15. After you have recorded the fifth set of readings, open the valve to release the pressure in the flask. Remove the flask from the water bath and take the stopper off the flask. Dispose of the ethanol in the liquid waste receptacle and the water from the bath down the sink.
16. Click to end the data collection. Record the pressure readings, as Ptotal, and the temperature readings in your data table.
17. Do not exit the Logger Pro program until you have completed 1–4 of the Data Analysis section.
DATA TABLE
Initial Trial 1 Trial 2 Trial 3 Trial 4 Trial 5
Ptotal (kPa)
Pair (kPa)
Pvap (kPa)
Temperature (°C)

113
DATA ANALYSIS
1. The Pair for Trials 2-5 must be calculated because the temperatures were increased. As you
warmed the flask, the air in the flask exerted pressure that you must calculate. Use the gas law relationship shown below to complete the calculations. Remember that all gas law calculations require Kelvin temperature. Use the Pair from before the volatile liquid was added to the flask as P1 and the Kelvin temperature of Trial 1 as T1.
2
2
1
1
T
P
T
P
2. Calculate and record the Pvap for each trial by subtracting Pair from Ptotal.
3. Prepare and print a graph of Pvap (y-axis) vs. Celsius temperature (x-axis).
a. Disconnect your Gas Pressure Sensor and Temperature Probe from the interface.
b. Choose New from the File menu. An empty graph and table will be created in Logger Pro.
c. Double-click on the x-axis heading in the table, enter a name and unit, then enter the five values for temperature (°C) from your data table above.
d. Double-click on the y-axis heading in the table, enter a name and unit, then enter the five values for vapor pressure from your data table above.
e. Does the plot follow the expected trend of the effect of temperature on vapor pressure? Explain.
4. In order to determine the heat of vaporization, ΔHvap, you will first need to plot the natural log of Pvap vs. the reciprocal of absolute temperature.
a. Choose New Calculated Column from the Data menu.
b. Create a column ln vapor pressure.
c. Create a second column, reciprocal of absolute temperature, 1/(Temperature (°C) + 273).
d. On the displayed graph, click on the respective axes, and then select ln vapor pressure to plot on the y-axis, and reciprocal of absolute temperature to plot on the x-axis. Autoscale the graph, if necessary.
e. Calculate the linear regression (best-fit line) equation for this graph. Calculate ΔHvap from the slope of the linear regression.
f. Prepare and print a second graph.
5. The accepted value of the ΔHvap of ethanol is 42.32 kJ/mol. Compare your experimentally determined value of ΔHvap with the accepted value.
There is not a formal lab report for this lab. Complete the
below pages and submit them to your TA.

114
Vapor Pressure and Heat of Vaporization Lab Report:
Name_____________________________ Date______________ Lab Section______________
Provide a brief statement of the purpose of this activity. Be sure to include the meaning of
enthalpy of vaporization and why vapor pressure is temperature dependent. Additionally show
the Clausius-Clapeyron equation and describe how vapor pressure and temperature data can be
manipulated to find the enthalpy of vaporization.

115
Data:
Initial Trial 1 Trial 2 Trial 3 Trial 4 Trial 5
Ptotal (kPa)
Pair (kPa)
Pvap (kPa)
Temperature (°C)
Describe how the Pair was calculated, show a sample.
Report your value for Hvap of ethanol. Show the calculation used to arrive at the
reported value. Include a copy of your graph of ln Pvap vs. 1/T (K).
Report the percent error in your calculated value of Hvap for ethanol.
Is your value for the Hvap greater than or less than the accepted value. Think of some
valid sources of error to account for your difference and explain how they would
contribute to the direction of your error.
.

116
Pre-Lab: Using Freezing-Point Depression to Find
Molecular Weight
Part A
Answer the following questions in your lab notebook (be sure to show work for
any calculations):
1. What is a colligative property?
2. Give the equation for freezing point depression and indicate the units for each term in the
expression.
3. A measurement of the freezing temperature of a solution allows you to calculate the
concentration of the solution. What else do you need to measure to determine the molar mass of
the solid added to the solvent?
4. A student adds 1.504 g of a solid to 25.0 mL of water. The freezing temperature is measured
to be -1.20 °C. What is the molality of the solution?
5. What is the molar mass of the solid above?
Part B
Prepare your notebook for the lab. This includes stating the purpose of the
experiment, summarizing the procedure in a bulleted-list format (be sure to include
space for observations) and preparing any tables necessary for data collection.
At the start of your lab, remove the copies of the pages where you
completed the above work from your lab notebook and turn them into
your TA.

117
Using Freezing-Point Depression to Find Molecular Weight
When a solute is dissolved in a solvent, the freezing temperature is lowered in proportion to the number of moles of solute added. This property, known as freezing-point depression, is a colligative property; that is, it depends on the ratio of solute and solvent particles, not on the nature of the substance itself. The equation that shows this relationship is:
T = Kf • m
where T is the freezing point depression, Kf is the freezing point depression constant for a particular solvent (20.2°C-kg/mol for cyclohexane used in this experiment), and m is the molality of the solution (in mol solute/kg solvent).
In this experiment, you will first find the freezing temperature of the pure solvent, cyclohexane, an organic non-polar solvent, C6H12. You will then add a known mass of biphenyl (C12H10), an organic solute, to a known mass of the solvent, and determine the lowering of the freezing temperature of the solution. By measuring the freezing point depression, T, and the mass of the biphenyl used, you can use the equation above to find the molar mass of the solute, in g/mol.
OBJECTIVES
In this experiment, you will
Determine the freezing temperature of pure cyclohexane. Determine the freezing temperature of a solution of the biphenyl and cyclohexane. Examine the freezing curves for each. Calculate the experimental molar mass of biphenyl. Compare it to the accepted molar mass for biphenyl.
Figure 1

118
Equipment Information Each bin should contain:
Notes:
a. Use the 100mm test tube.
b. Use the copper stirrer to stir. Do not use the temperature probe to stir.
c. Water from water bath should be poured down the drain (not into the waste
container) unless contaminated with cyclohexane.
Chemical Safety Information Using freezing point depression to find molecular weight
Chemical Hazards
Cyclohexane flammable, toxic, health and environmental hazard
Biphenyl toxic, environmental hazard
1 – copper stirrer Use for stirring
1 – temperature probe After use, secure cord as
shown

119
PROCEDURE
1. Obtain and wear goggles.
2. Connect the Temperature Probe to the computer interface. Prepare the computer for data collection by opening the file “15 Freezing Pt Depression” from the Chemistry with Computers folder.
Part I Freezing Temperature of Pure cyclohexane
3. Fill your 250 mL beaker with ice. Add tap water until it is about 2/3 full. The cyclohexane used in this experiment is flammable. Do not use Bunsen burners during this lab.
4. Weigh a CLEAN, DRY test tube. It can be propped in a plastic 250 mL beaker to facilitate measuring; this is useful when the tube is not empty. Add 3 mL of cyclohexane to your test tube (C6H12, density = 0.779 g/ml). Do this carefully so that you do not get any solvent on the upper portion of the test tube. MAKE SURE IT LOOKS LIKE 3 mL, compare to a similar test tube with 3 mL of water in it. Weigh the test tube with solvent in it and compare the masses to determine the mass of solvent.
5. Insert the Temperature Probe into the cyclohexne. About 30 seconds are required for the probe to warm up to the temperature of its surroundings and give correct temperature readings. During this time, fasten the utility clamp to the ring stand so the test tube is above the ice water bath. Then click to begin data collection.
6. Lower the test tube into the water bath. Add a small amount of ice to your water bath to bring the temperature down. Make sure the water level outside the test tube is higher than the solvent level inside the test tube.
7. With a very slight stirring motion with the probe, continuously stir the solvent during the cooling.
8. Once the solid begins to form, stop stirring. Continue with the data aquisition until data collection has stopped (10 minute run). Allow the test tube to sit at room temperature to melt the probe out of the solid cyclohexane. Do not attempt to pull the probe out—this might damage it. Carefully wipe any excess cyclohexane liquid from the probe with a paper towel or tissue and dry the sides of the test tube. reweigh the test tube and cyclohexane to determine if there is a change in mass of the solvent.
9. To determine the freezing temperature of pure cyclohexane, you need to determine the mean (or average) temperature in the portion of graph with nearly constant temperature. Move the mouse pointer to the beginning of the graph’s flat part. Press the mouse button and hold it down as you drag across the flat part of the curve, selecting only the points in the plateau. Click on the Statistics button, . The mean temperature value for the selected data is listed in the statistics box on the graph. Record this value as the freezing temperature of cyclohexane. Close the statistics box.
10. Store your data by choosing Store Latest Run from the Experiment menu. Hide the curve from your first run by clicking on the vertical axis label and unchecking the appropriate box. Click . Repeat steps 5-10 so that you have two trials of the freezing point cyclohexane.
Part II Freezing Temperature of a Solution of biphenyl and cyclohexane
11. Measure out approximately 0.06 grams of biphenyl into a weighing boat. Add the biphenyl to the cyclohexane already in the 4” test tube. Try to prevent the biphenyl from sticking to the inside wall of the test tube where it will be difficult (or impossible) to get into solution. If you do, you will have to dump the solvent in the waste recepticle, clean and dry your apparatus, and start all over by weighing out a new portion of cyclohexane. Determine the mass of the biphenyl by weighing the test tube, solvent and biphenyl. It may take several

120
minutes for the biphenyl to dissolve. Dissolution can be encouraged through gentle agitation (be careful not to splash). Repeat Steps 3-8 to determine the freezing point of this mixture.
12. When you have completed Step 8, click on the Examine button, . To determine the freezing point of the biphenyl- cyclohexane solution, you need to determine the temperature at which the mixture initially started to freeze. Unlike pure cyclohexane, cooling a mixture of biphenyl and cyclohexane results in a gradual linear decrease in temperature during the time period when freezing takes place. As you move the mouse cursor across the graph, the temperature (y) and time (x) data points are displayed in the examine box on the graph. Locate the initial freezing temperature of the solution, as shown here. Record the freezing point in your data table.
13. Repeat the process with by adding another portion of biphenyl.
14. To print a graph of temperature vs. time showing all data runs:
a. Click on the vertical-axis label of the graph. To display both temperature runs, click More, and check the Run 1 and Latest Temperature boxes. Click .
b. Label both curves by choosing Text Annotation from the Insert menu, and typing “cyclohexane” (or “Biphenyl- cyclohexane mixture”) in the edit box. Then drag each box to a position on or near its respective curve.
c. Print the graph.
PROCESSING THE DATA (METHOD 1)
1. Determine the difference in freezing temperatures, t, between the pure cyclohexane (t1) and the mixture of cyclohexane and biphenyl (t2). Use the formula, t = t1 - t2.
2. Calculate molality (m), in mol/kg, using the formula, t = Kf • m (Kf = 20.2°C-kg/mol for cyclohexane).
3. Calculate moles of biphenyl solute, using the answer in Step 2 (in mol/kg) and the mass (in kg) of cyclohexane solvent.
4. Calculate the experimental molar mass of biphenyl, in g/mol. Use the original mass of biphenyl from your data table, and the moles of biphenyl you found in the previous step.
5. Compare your experimentally determined molar mass of biphenyl with the known value.
6. Calculate the percent error.
Time
Freezing Point

121
PROCESSING THE DATA (METHOD 2)
Here is another method that can be used to determine the freezing temperature from your data in Part II. With a graph of the Part II data displayed, use this procedure:
1. Move the mouse pointer to the initial part of the cooling curve, where the temperature has an initial rapid decrease (before freezing occurred). Press the mouse button and hold it down as you drag across the linear region of this steep temperature decrease.
2. Click on the Linear Fit button, .
3. Now press the mouse button and drag over the next linear region of the curve (the gently sloping section of the curve where freezing took place). Press the mouse button and hold it down as you drag only this linear region of the curve.
4. Click again. The graph should now have two regression lines displayed.
5. Choose Interpolate from the Analyze menu. Move the mouse pointer left to the point where the two regression lines intersect. When the small circles on each cursor line overlap each other at the intersection, the temperatures shown in either examine box should be equal to the freezing temperature for the biphenyl-cyclohexane mixture.
6. Use the temperature to calculate T and your molar mass for biphenyl. Compare your results from the two methods.
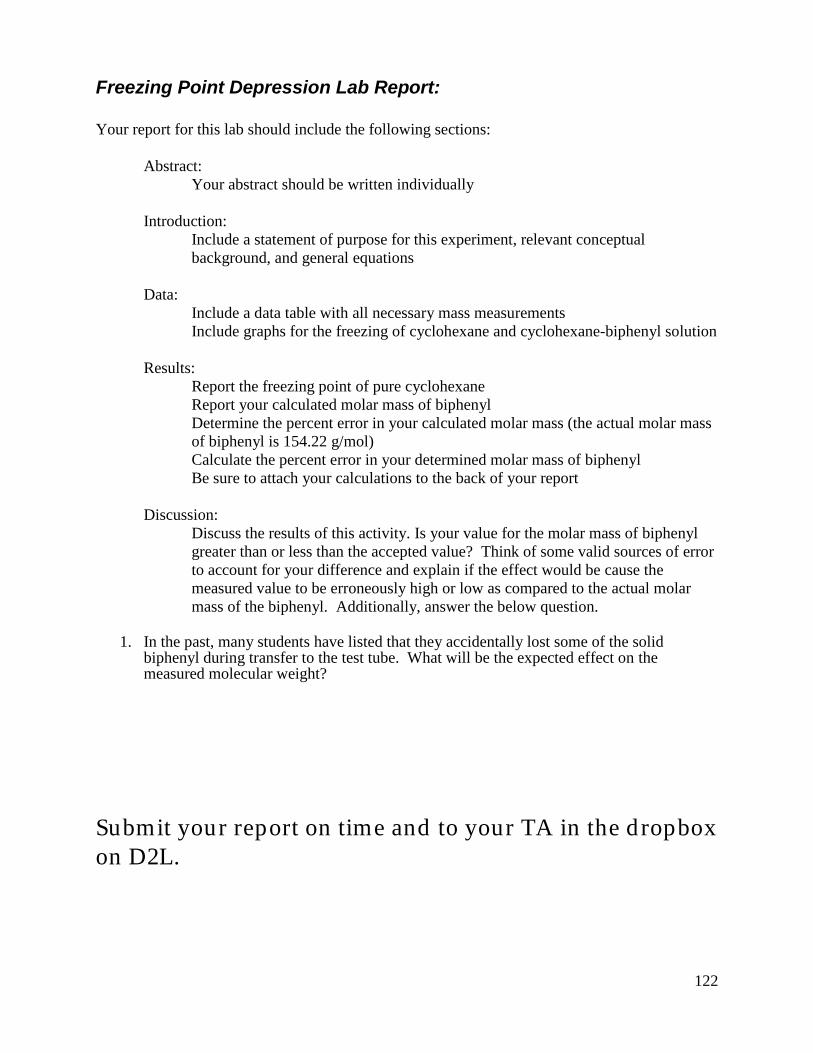
122
Freezing Point Depression Lab Report:
Your report for this lab should include the following sections:
Abstract:
Your abstract should be written individually
Introduction:
Include a statement of purpose for this experiment, relevant conceptual
background, and general equations
Data:
Include a data table with all necessary mass measurements
Include graphs for the freezing of cyclohexane and cyclohexane-biphenyl solution
Results:
Report the freezing point of pure cyclohexane
Report your calculated molar mass of biphenyl
Determine the percent error in your calculated molar mass (the actual molar mass
of biphenyl is 154.22 g/mol)
Calculate the percent error in your determined molar mass of biphenyl
Be sure to attach your calculations to the back of your report
Discussion:
Discuss the results of this activity. Is your value for the molar mass of biphenyl
greater than or less than the accepted value? Think of some valid sources of error
to account for your difference and explain if the effect would be cause the
measured value to be erroneously high or low as compared to the actual molar
mass of the biphenyl. Additionally, answer the below question.
1. In the past, many students have listed that they accidentally lost some of the solid
biphenyl during transfer to the test tube. What will be the expected effect on the measured molecular weight?
Submit your report on time and to your TA in the dropbox
on D2L.

123
Pre-Lab: The Rate and Order of a Chemical Reaction
Part A
Answer the following questions in your lab notebook (be sure to show work for
any calculations):
1. Write the general form of the rate law for the reaction you will be studying this week.
2. A first order reaction has a rate constant of 2.90 x 10⁻⁴
s-1
. Calculate the half-life for this
reaction.
3. What is the overall order of a reaction that has the following rate law? Rate = [A]2[B]
4. For a reaction where the general form of the rate law is rate = [A]m
[B]n, the following
data were collected. What is the order of the reaction with respect to A? What is the
order of the reaction with respect to B?
Initial Rate [A] [B]
0.01 M/s 0.025 M 0.025 M
0.01 M/s 0.025 M 0.050 M
0.09 M/s 0.075 M 0.025 M
Part B
Prepare your notebook for the lab. This includes stating the purpose of the
experiment, summarizing the procedure in a bulleted-list format (be sure to include
space for observations) and preparing any tables necessary for data collection.
At the start of your lab, remove the copies of the pages where you
completed the above work from your lab notebook and turn them into
your TA.

124
The Rate and Order of a Chemical Reaction
OBJECTIVES
In this experiment, you will
Conduct the reaction of KI and FeCl3 using various concentrations of reactants.
Determine the order of the reaction in KI and FeCl3.
Determine the rate law expression for the reaction.
INTRODUCTION
A basic kinetic study of a chemical reaction often involves conducting the reaction at varying concentrations of reactants. In this way, you can determine the order of the reaction in each species, and determine a rate law expression. Once you select a reaction to examine, you must decide how to follow the reaction by measuring some parameter that changes regularly as time passes, such as temperature, pH, pressure, conductance, or absorbance of light.
In this experiment you will conduct the reaction between solutions of potassium iodide and iron (III) chloride. The reaction equation is shown below, in ionic form.
2 I– (aq) + 2 Fe
3+ (aq) → I2 (aq) + 2 Fe
2+ (aq)
As this reaction proceeds, it undergoes a color change that can be precisely measured by a Colorimeter (see Figure 1). By carefully varying the concentrations of the reactants, you will determine the effect each reactant has on the rate of the reaction, and consequently the order of the reaction. From this information, you will write a rate law expression for the reaction.
Figure 1

125
Equipment Information Each bin should contain:
Notes:
a. This lab is very time sensitive. To succeed in this lab:
o Ensure good technique and decrease waste by practicing the procedure using tap
water first.
o Work in a team.
o Measure the KI and the water into the same graduated cylinder. Then mix them
with the FeCl3.
Chemical Safety Information The rate and order of chemical reaction
Chemical Hazards
Potassium iodide toxic
Iron (III) chloride corrosive, toxic
2 – 10mL graduated
cylinders
5 – cuvettes with lids Do not leave cuvettes in
colorimeter at the end of
class

126
PROCEDURE
1. Obtain and wear goggles.
2. Connect a Colorimeter to Channel 1 of the Vernier computer interface.
3. Start the Logger Pro program on your computer. Open the file “30b. Crystal Violet” from the Chemistry with Computers folder.
4. Set up and calibrate the Colorimeter.
a) Prepare a blank by filling an empty cuvette ¾ full with distilled water. Place the blank in the cuvette slot of the Colorimeter and close the lid.
b) If your Colorimeter has a CAL button, set the wavelength on the Colorimeter to 470 nm, press the CAL button, and proceed directly to Step 5. If your Colorimeter does not have a CAL button, continue with this step to calibrate your Colorimeter.
c) Choose Calibrate CH1: Colorimeter from the Experiment menu, then click .
d) Turn the wavelength knob on the Colorimeter to the “0% T” position.
e) Type 0 in the edit box.
f) When the displayed voltage reading for Reading 1 stabilizes, click .
g) Turn the knob of the Colorimeter to the Blue LED position (470 nm).
h) Type 100 in the edit box.
i) When the voltage reading for Reading 2 stabilizes, click , then click .
5. Obtain the materials you will need to conduct this experiment.
a) Two 10 mL graduated cylinders.
b) Approximately 50 mL of 0.020 M KI solution in a 100 mL beaker.
c) Approximately 50 mL of 0.020 M FeCl3 solution in a separate 100 mL beaker. CAUTION: The FeCl3 solution in this experiment is prepared in 0.1 M HCl and should be handled with care.
d) Approximately 60 mL of distilled water in a third 100 mL beaker.
6. During this experiment you will conduct 6 trials. This step describes the process for conducting the trials using the Trial 1 volumes. When you repeat this process, use the correct volume for each trial based on the table below.
a) Consider opening an online stopwatch to make sure that all measurements are started reproducibly at the same time after mixing.
b) Prepare a clean cuvette.
c) If adding water, measure out the water using a graduated cylinder and add to the test tube first.
d) Measure the FeCl3 solution using a graduated cylinder and pour it into the test tube.
Trial FeCl3 (mL) KI (mL) H2O (mL)
1 5.0 5.0 0.0
2 5.0 5.0 0.0
3 5.0 2.5 2.5
4 5.0 2.5 2.5
5 2.5 5.0 2.5
6 2.5 5.0 2.5

127
e) Measure the KI solution using a graduated cylinder. Cover the end of the test tube with your thumb and quickly invert to mix.
f) Within 15 seconds of mixing the two solutions, fill the cuvette ¾ full with the mixture. Wipe the outside of the cuvette with a tissue, place it in the Colorimeter, and close the lid and begin collecting absorbance data. The timing of this step is imperative to receiving useful data; practice several times with water before attempting with the KI and FeCl3 solutions.
7. Click to begin collecting absorbance data. Data will be gathered for 2 minutes. Observe the progress of the reaction in the beaker.
8. When the data collection is complete, carefully remove the cuvette from the Colorimeter. Dispose of the contents of the beaker and cuvette as directed. Rinse and clean the beakers and the cuvette for the next trial (this needs to be done as soon as the trial is over).
9. Examine the graph of the first trial. On the toolbar, select the Slope button. Slide the cursor to the initial time point. This tool will determine the initial slope and thus approximate the initial rate of the reaction. Record the slope as the initial rate of the Trial 1 reaction. NOTE, IT IS IMPORTANT THAT THE SLOPE HAVE MORE THAN ONE SIGNIFICANT FIGURE.
10. Repeat Steps 6–9 to conduct Trials 2–6. Add the solutions to your medium sized test-tube in this order: water followed by Fe
3+, followed by I
-. When you complete Step 9, use the same
technique to analyze Trials 2–5 that you used to analyze Trial 1.
DATA ANALYSIS
1. Calculate the initial molar concentration of FeCl3 and KI for each reaction and
prepare a data table containing the concentrations of each reaction and the initial
reaction rate.
2. What is the order of the reaction in FeCl3 and KI?
3. Write the rate law expression for the reaction.

128
The Rate and Order of a Chemical Reaction Lab Report:
Name_____________________________ Date______________ Lab Section______________
There is not a formal lab report for this lab. Complete the below pages and submit them
to your TA before leaving lab.
Briefly state the purpose of the lab. Why can the absorbance versus time data can be used as
a rate. How does absorbance relate to concentration? How can you use rate and
concentration data to determine the order in a particular reactant and thus a rate law?
.
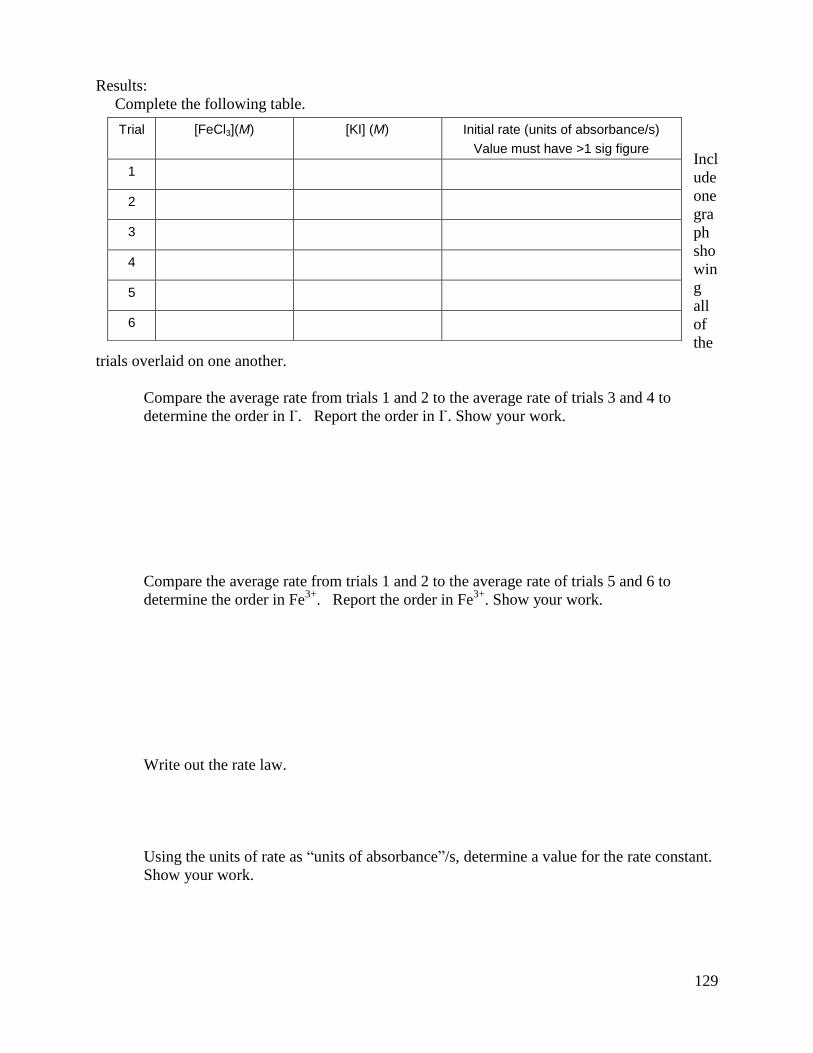
129
Results:
Complete the following table.
Incl
ude
one
gra
ph
sho
win
g
all
of
the
trials overlaid on one another.
Compare the average rate from trials 1 and 2 to the average rate of trials 3 and 4 to
determine the order in I-. Report the order in I
-. Show your work.
Compare the average rate from trials 1 and 2 to the average rate of trials 5 and 6 to
determine the order in Fe3+
. Report the order in Fe3+
. Show your work.
Write out the rate law.
Using the units of rate as “units of absorbance”/s, determine a value for the rate constant.
Show your work.
Trial [FeCl3](M) [KI] (M) Initial rate (units of absorbance/s)
Value must have >1 sig figure
1
2
3
4
5
6

130
Pre-Lab: Chemical Equilibrium:
Finding a Constant, Kc
Part A
Answer the following questions in your lab notebook (be sure to show work for
any calculations):
1. Write the equilibrium constant expression for the experiment you will be studying this
week.
2. If the equilibrium values of Fe3+
, SCN- and FeSCN
2+ are 9.5 x 10
-4 M, 3.6 x 10
-4 M and
5.7 x 10⁻⁵
M respectively, what is the value of Kc?
3. Write the general form of the dilution equation.
4. A solution is prepared by adding 18 mL of 0.200 M Fe(NO3)3 and 2 mL of 0.0020 M
KSCN. Calculate the initial concentrations of Fe3+
and SCN- in the solution.
Part B
Prepare your notebook for the lab. This includes stating the purpose of the
experiment, summarizing the procedure in a bulleted-list format (be sure to include
space for observations) and preparing any tables necessary for data collection.
At the start of your lab, remove the copies of the pages where you
completed the above work from your lab notebook and turn them into
your TA.

131
Chemical Equilibrium: Finding a Constant, Kc
The purpose of this lab is to experimentally determine the equilibrium constant, Kc, for the following chemical reaction:
Fe3+(aq) + SCN
–(aq) FeSCN
2+(aq)
iron(III) thiocyanate thiocyanoiron(III)
When Fe3+ and SCN- are combined, a dynamic equilibrium is established between these two
ions and the FeSCN2+ ion. In order to calculate the equilibrium constant, Keq, for the reaction, it
is necessary to know the concentrations of all the ions at equilibrium. In this experiment four
separate equilibrium systems, or trials, containing different concentrations of these three ions
(Fe3+
, SCN-, and FeSCN
2+) will be determined experimentally. The values for these equilibrium
concentrations will be substituted into the equilibrium constant expression to see if Keq is indeed
constant despite varied initial concentrations for the reactants. The Keq, is determined by using
the Law of Mass Action.
aA + bB cC + dD
This equation gives the equilibrium constant expression of:
Keq = [C]c[D]
d/[A]
a[B]
b
In order to determine the equilibrium concentrations for the three ions a standard solution needs
to be prepared. To prepare the standard solution, a very large concentration of Fe3+ will be added
to a small initial concentration of SCN– (hereafter referred to as [SCN
-]i. The initial [Fe
3+] in the
standard solution is 900 times larger than [SCN-]i. According to LeChatelier's principle, which
states that when a system in dynamic equilibrium is disturbed, the system responds so as to
minimize the disturbance and return the system to a state of equilibrium. This high initial
concentration Fe3+
ions on the left side of the equation forces the reaction far to the right, using
up nearly 100% of the initial SCN– ions. Using stoichiometry and the balanced equation, it is
assumed that for every mole of FeSCN2+ produced, one mole of SCN
– is used up. Thus since
nearly all of the SCN- ions are consumed in order to minimize the disturbance, the product’s
concentration, [FeSCN2+]std, at equilibrium is assumed to be equal to the [SCN
–]i.
Since the reaction produces the FeSCN2+ ions and this ion transmits the color red, the solution’s
absorbance of blue light can be measured through the use of a colorimeter (see Figure 1).
Because the red solutions absorb blue light very well, the blue LED setting on the Colorimeter is
used. The computer-interfaced Colorimeter measures the amount of blue light absorbed by the
colored solutions (absorbance, A).

132
Figure 1 Figure 2 According to Beer’s Law, there is a direct relationship between a solution’s concentration and its
absorbance. In this case the concentration is the FeSCN2+
ion and the absorbance is blue light
(470 nm). In other words, as the concentration of FeSCN2+
increases so will the absorbance of
blue light (see Figure 2). The concentration of FeSCN2+ for any of the equilibrium systems,
trials 1-4, can be found by comparing the absorbance of each equilibrium system, Aeq, to the
absorbance of the standard solution, Astd, according to the following equation:
[FeSCN2+]std/Astd = [FeSCN
2+]eq/ Aeq
Since the concentration of [FeSCN2+]std is known and the all of the absorbances for the
equilibrium solutions and the standard are measured and recorded all that needs to be done is to
solve for the unknown.
[FeSCN2+]eq =
Aeq
Astd X [FeSCN
2+]std
Knowing the [FeSCN2+]eq allows you to determine the concentrations of the other two ions at
equilibrium. For each mole of FeSCN2+ ions produced, one less mole of Fe
3+ and SCN- ions will
be found in the solution (see the 1:1 ratio of coefficients in the equation on the previous page).
At equilibrium the [Fe3+] and [SCN
-] can be determined according to the following equations:
[Fe3+]eq = [Fe
3+]i – [FeSCN2+]eq
[SCN–]eq = [SCN
–]i – [FeSCN
2+]eq Knowing the values of [Fe
3+]eq, [SCN–]eq, and [FeSCN
2+]eq, you can now calculate the value
of Kc, the equilibrium constant.

133
OBJECTIVE
In this experiment, you will determine the equilibrium constant, Kc, for the following chemical reaction:
Fe3+(aq) + SCN
–(aq) FeSCN
2+(aq)
iron(III) thiocyanate thiocyanoiron(III)
Equipment Information Each bin should contain:
Notes:
a. This lab is done on the micro scale. To help reduce waste, only procure
small amounts of the chemicals you need.
Chemical Safety Information Chemical equilibrium: Finding a constant, Kc
Chemical Hazards
Iron (III) nitrate in nitric acid corrosive, oxidizer
Potassium thiocyanate toxic
1 – 10mL serological
pipet with bulb Do not aspirate
liquid into the bulb.
5 – cuvettes with caps 1 – temperature probe After use, secure
cord as shown
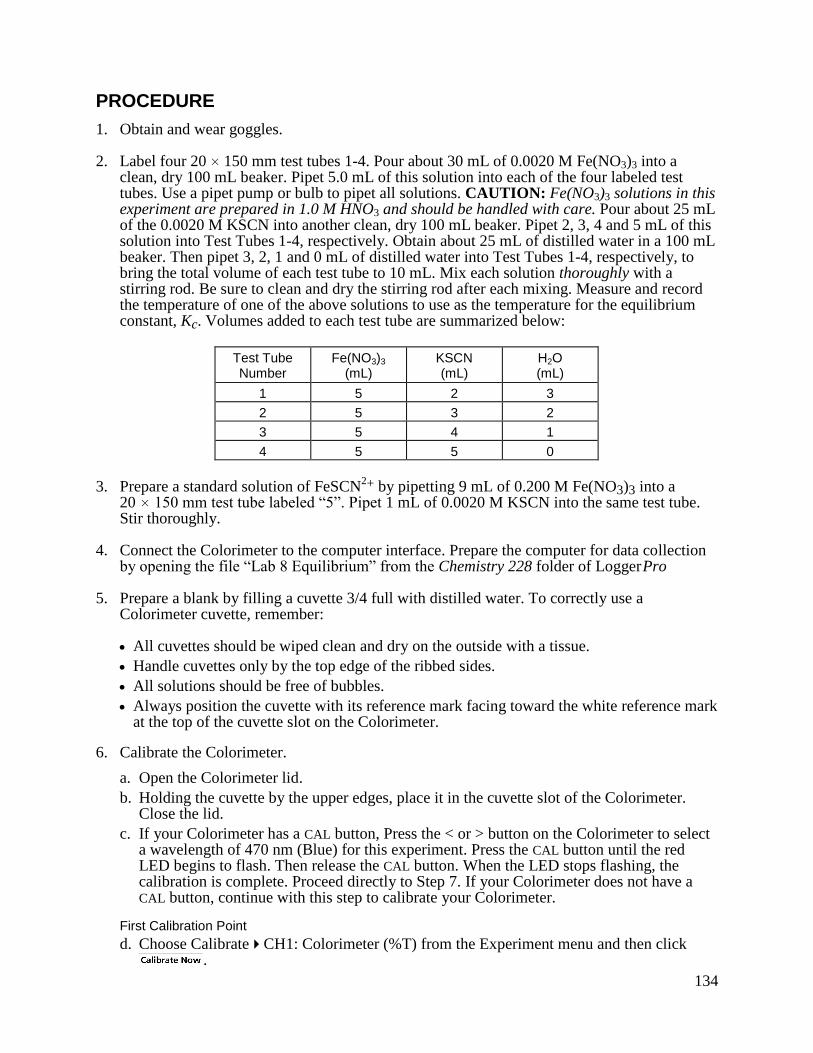
134
PROCEDURE
1. Obtain and wear goggles.
2. Label four 20 150 mm test tubes 1-4. Pour about 30 mL of 0.0020 M Fe(NO3)3 into a clean, dry 100 mL beaker. Pipet 5.0 mL of this solution into each of the four labeled test tubes. Use a pipet pump or bulb to pipet all solutions. CAUTION: Fe(NO3)3 solutions in this experiment are prepared in 1.0 M HNO3 and should be handled with care. Pour about 25 mL of the 0.0020 M KSCN into another clean, dry 100 mL beaker. Pipet 2, 3, 4 and 5 mL of this solution into Test Tubes 1-4, respectively. Obtain about 25 mL of distilled water in a 100 mL beaker. Then pipet 3, 2, 1 and 0 mL of distilled water into Test Tubes 1-4, respectively, to bring the total volume of each test tube to 10 mL. Mix each solution thoroughly with a stirring rod. Be sure to clean and dry the stirring rod after each mixing. Measure and record the temperature of one of the above solutions to use as the temperature for the equilibrium constant, Kc. Volumes added to each test tube are summarized below:
Test Tube
Number Fe(NO3)3
(mL) KSCN (mL)
H2O (mL)
1 5 2 3
2 5 3 2
3 5 4 1
4 5 5 0
3. Prepare a standard solution of FeSCN
2+ by pipetting 9 mL of 0.200 M Fe(NO3)3 into a 20 150 mm test tube labeled “5”. Pipet 1 mL of 0.0020 M KSCN into the same test tube. Stir thoroughly.
4. Connect the Colorimeter to the computer interface. Prepare the computer for data collection by opening the file “Lab 8 Equilibrium” from the Chemistry 228 folder of Logger Pro
5. Prepare a blank by filling a cuvette 3/4 full with distilled water. To correctly use a Colorimeter cuvette, remember:
All cuvettes should be wiped clean and dry on the outside with a tissue.
Handle cuvettes only by the top edge of the ribbed sides.
All solutions should be free of bubbles.
Always position the cuvette with its reference mark facing toward the white reference mark at the top of the cuvette slot on the Colorimeter.
6. Calibrate the Colorimeter.
a. Open the Colorimeter lid.
b. Holding the cuvette by the upper edges, place it in the cuvette slot of the Colorimeter. Close the lid.
c. If your Colorimeter has a CAL button, Press the < or > button on the Colorimeter to select a wavelength of 470 nm (Blue) for this experiment. Press the CAL button until the red LED begins to flash. Then release the CAL button. When the LED stops flashing, the calibration is complete. Proceed directly to Step 7. If your Colorimeter does not have a CAL button, continue with this step to calibrate your Colorimeter.
First Calibration Point
d. Choose Calibrate CH1: Colorimeter (%T) from the Experiment menu and then click .

135
e. Turn the wavelength knob on the Colorimeter to the “0% T” position.
f. Type “0” in the edit box.
g. When the displayed voltage reading for Reading 1 stabilizes, click .
Second Calibration Point
h. Turn the knob of the Colorimeter to the Blue LED position (470 nm).
i. Type “100” in the edit box.
j. When the displayed voltage reading for Reading 2 stabilizes, click , then click .
7. You are now ready to collect absorbance data for the four equilibrium systems and the
standard solution.
a. Click to begin data collection.
b. Empty the water from the cuvette. Rinse it twice with ~1 mL portions of the Test Tube 1 solution.
c. Wipe the outside of the cuvette with a tissue and then place the cuvette in the Colorimeter. After closing the lid, wait for the absorbance value displayed in the meter to stabilize. Then click , type “1” (the trial number) in edit box, and press the ENTER key.
d. Discard the cuvette contents as directed by your teacher. Rinse the cuvette twice with the Test Tube 2 solution and fill the cuvette 3/4 full. Follow the Step-c procedure to find the absorbance of this solution. Type “2” in the edit box and press ENTER.
e. Repeat the Step-d procedure to find the absorbance of the solutions in Test Tubes 3, 4, and 5 (the standard solution).
f. From the table, record the absorbance values for each of the five trials in your data table.
g. Dispose of all solutions as directed by your instructor.

136
PROCESSING THE DATA
1. Write the Kc expression for the reaction in the Data and Calculation table.
2. Calculate the initial concentration of Fe3+
, based on the dilution that results from adding KSCN solution and water to the original 0.0020 M Fe(NO3)3 solution. See Step 2 of the procedure for the volume of each substance used in Trials 1-4. Calculate [Fe3+]i using the equation:
[Fe3+
]i = Fe(NO3)3 mL
total mL (0.0020 M)
This should be the same for all four test tubes.
3. Calculate the initial concentration of SCN–, based on its dilution by Fe(NO3)3 and water:
[SCN–]i =
KSCN mL
total mL (0.0020 M)
In Test Tube 1, [SCN–]i = (2 mL / 10 mL)(0.0020 M) = 0.00040 M. Calculate this for the
other three test tubes.
4. [FeSCN2+
]eq is calculated using the formula:
[FeSCN2+
]eq = Aeq
Astd [FeSCN
2+]std
where Aeq and Astd are the absorbance values for the equilibrium and standard test tubes,
respectively, and [FeSCN2+
]std = (1/10)(0.0020) = 0.00020 M. Calculate [FeSCN2+
]eq for each of the four trials.
5. [Fe3+
]eq: Calculate the concentration of Fe3+
at equilibrium for Trials 1-4 using the equation:
[Fe3+
]eq = [Fe3+
]i – [FeSCN2+
]eq
6. [SCN–]eq: Calculate the concentration of SCN- at equilibrium for Trials 1-4 using the
equation: [SCN
–]eq = [SCN
–]i – [FeSCN
2+]eq
7. Calculate Kc for Trials 1-4. Be sure to show the Kc expression and the values substituted in for each of these calculations.
8. Using your four calculated Kc values, determine an average value for Kc. How constant were your Kc values?

137
Equilibrium Lab Report:
Your report for this lab should include the following sections:
Abstract:
Your abstract should be written individually
Introduction:
Include a statement of purpose for this experiment, relevant conceptual
background, and general equations
Data:
Include your data table with initial concentrations of each reactant for each trial
Results:
Include a results table with calculated Keq values for each trial and an average
value for Keq
Be sure to attach hand written sample calculations to the back of your report
Discussion:
Discuss the experiment and any possible sources of error
In addition, answer the following question as part of your report:
1. How are you Keq values to each other? Are they close enough to
justify the assertion that an equilibrium constant is constant?
2. What factors could have led to variations in Keq between trials.
Submit your report on time and to your TA in the dropbox
on D2L.
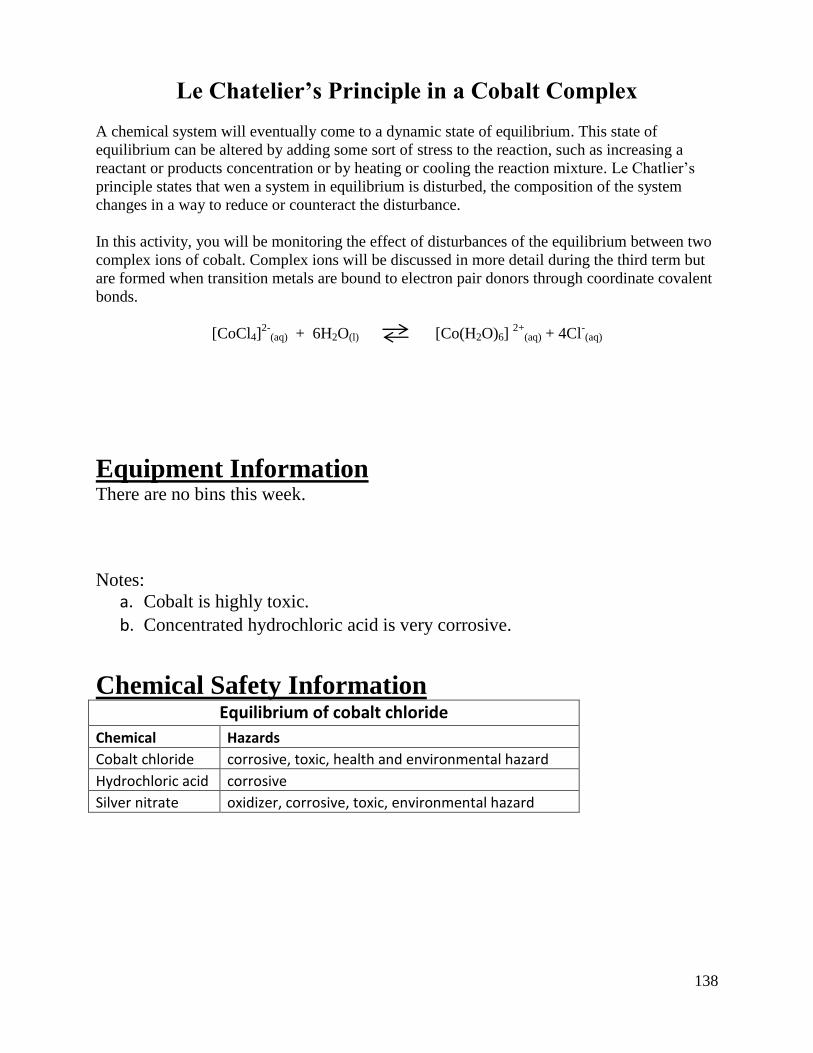
138
Le Chatelier’s Principle in a Cobalt Complex
A chemical system will eventually come to a dynamic state of equilibrium. This state of
equilibrium can be altered by adding some sort of stress to the reaction, such as increasing a
reactant or products concentration or by heating or cooling the reaction mixture. Le Chatlier’s
principle states that wen a system in equilibrium is disturbed, the composition of the system
changes in a way to reduce or counteract the disturbance.
In this activity, you will be monitoring the effect of disturbances of the equilibrium between two
complex ions of cobalt. Complex ions will be discussed in more detail during the third term but
are formed when transition metals are bound to electron pair donors through coordinate covalent
bonds.
[CoCl4]2-
(aq) + 6H2O(l) [Co(H2O)6] 2+
(aq) + 4Cl-(aq)
Equipment Information There are no bins this week.
Notes:
a. Cobalt is highly toxic.
b. Concentrated hydrochloric acid is very corrosive.
Chemical Safety Information Equilibrium of cobalt chloride
Chemical Hazards
Cobalt chloride corrosive, toxic, health and environmental hazard
Hydrochloric acid corrosive
Silver nitrate oxidizer, corrosive, toxic, environmental hazard

139
Hazards: HCl is very corrosive! Exercise caution around solution and vapors. Always make sure
to add acid to less concentrated solutions, rather than adding less concentrated solutions to the
acid. Sliver nitrate will stain skin and clothes, exercise caution and be sure to wash your hands
after the lab. Always clean up any spills!
Disposal: Cobalt chloride and silver nitrate as well as any excess acid must be properly disposed
in the labeled waste jars.
Procedure
1. Prepare a hot bath by half filling a beaker with water and placing it on a hot plate. Heat to
boiling on medium heat. Additionally, prepare an ice/water cold in a second beaker.
2. Obtain 10 mL of a 0.1 M cobalt chloride solution. Note the color.
3. Do this step in the fume hood. Obtain 15 mL of Concentrated HCl solution and while
gently stirring with your stir rod, slowly add 10 mL drop wise to your cobalt chloride
solution until vivid color change is observed. Here, you have just produce the [CoCl4]2-
(aq) complex ion. If no color change, then add additional HCl drop wise. Note the color.
4. Divide the resulting solution amongst 4 small test-tubes, filling only half-way. Do not
overfill the test-tubes (about 5 mL in each). Keep one as a control, something that you
can use to compare any color changes to.
5. To one test-tube add distilled water drop wise, while gently stirring with your stir rod,
until the color changes.
6. Keeping track of which test-tube is which, take a test-tube from step 4 and the test-tube
generated in step 5 and place them in the hot bath for 2 minutes. Note any color changes.
7. Take the test-tubes from step 6 and place in your ice bath for two minutes. Note any color
changes.
8. To a test-tube from step 4, add 0.1 M silver nitrate drop wise until a precipitate forms.
Note any color changes.
9. Be sure to dispose of all waste properly.
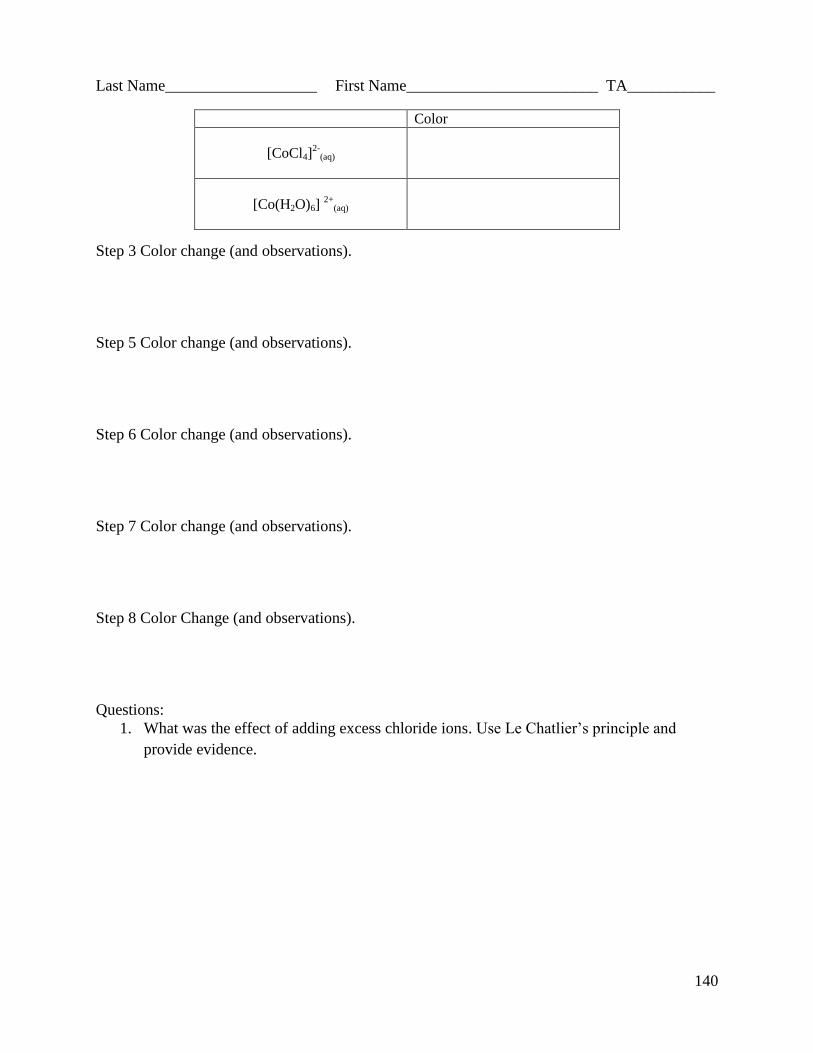
140
Last Name___________________ First Name________________________ TA___________
Step 3 Color change (and observations).
Step 5 Color change (and observations).
Step 6 Color change (and observations).
Step 7 Color change (and observations).
Step 8 Color Change (and observations).
Questions:
1. What was the effect of adding excess chloride ions. Use Le Chatlier’s principle and
provide evidence.
Color
[CoCl4]2-
(aq)
[Co(H2O)6] 2+
(aq)
141
2. Based upon the heating and cooling of the two equilibrium mixtures, propose if the
reaction is endothermic or exothermic. Use Le Chatlier’s principle and provide evidence
(would heat be considered as a reactant or product?).
[CoCl4]2-
(aq) + 6H2O(l) [Co(H2O)6] 2+
(aq) + 4Cl-(aq)
3. How did the addition of silver nitrate affect the equilibrium if neither silver ions nor
nitrate ions are in the equilibrium expression? Use Le Chatlier’s principle and provide
evidence. Additionally, write a net ionic equation to describe the precipitation reaction.
4. When perturbing the equilibrium with heating and cooling, how many times do you think
the equilibrium can be shifted before it stops working? Why? How about modification of
the equilibrium through changes in concentration?
There is not a formal lab report for this lab. Complete the above pages
using the Microsoft version of this file that is available for download on
the lab D2L page. Once the worksheet is complete, submit the
worksheet on time and to your TA in the dropbox on D2L.

142
CH229 LABS
Pre-lab: Acid Rain
Part A
Answer the following questions in your lab notebook (be sure to show your work
for any calculations):
1. Carbon dioxide (CO2) reacts with water to produce carbonic acid (H2CO3). Write the
balanced chemical equations for this reaction and showing what happens when carbonic
acid is dissolved in water.
2. What is the conjugate base of nitrous acid (HNO2)?
3. Which is a stronger acid, nitrous acid (HNO2) or nitric acid (HNO3)?
4. Which is a stronger base, nitrite (NO2-) or nitrate (NO3
-)?
5. Describe the method you will use in this lab to generate the acids found in acid rain.
Part B
Prepare your notebook for the lab. This includes stating the purpose of the
experiment, summarizing the procedure in a bulleted-list format (be sure to include
space for observations) and preparing any tables necessary for data collection.
At the start of your lab, remove the copies of the pages where you
completed the above work from your lab notebook and turn them into
your TA.
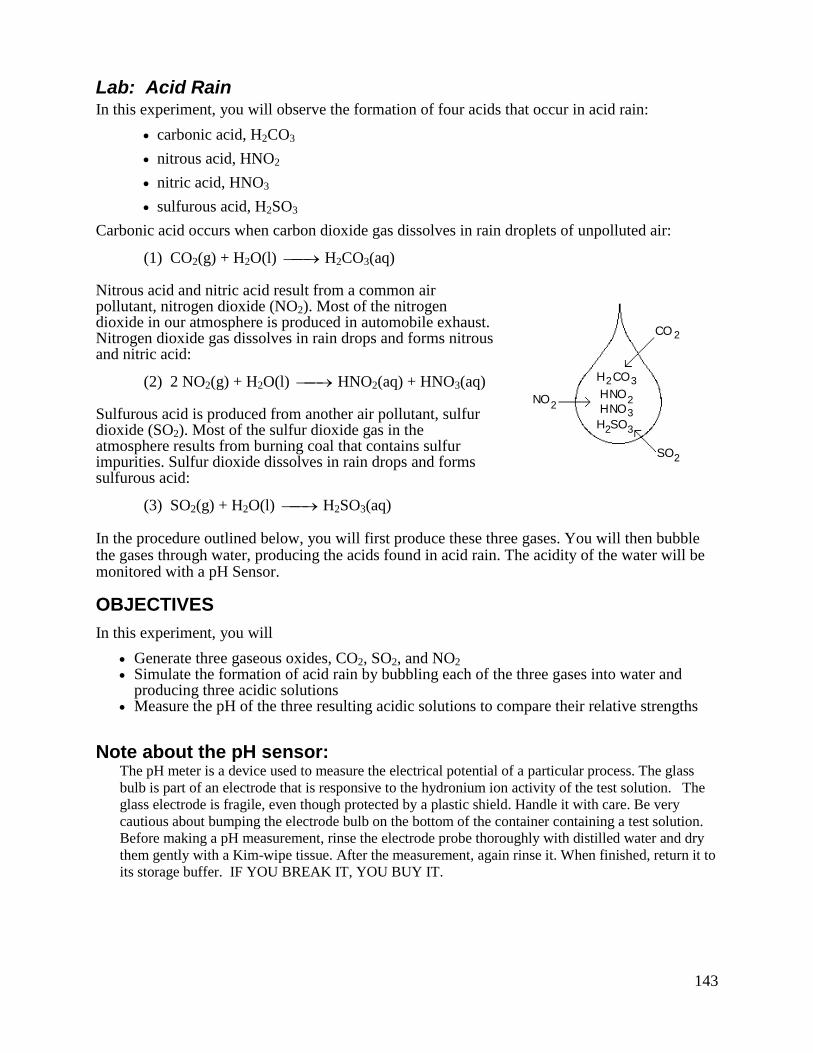
143
Lab: Acid Rain In this experiment, you will observe the formation of four acids that occur in acid rain:
carbonic acid, H2CO3
nitrous acid, HNO2
nitric acid, HNO3
sulfurous acid, H2SO3
Carbonic acid occurs when carbon dioxide gas dissolves in rain droplets of unpolluted air:
(1) CO2(g) + H2O(l) H2CO3(aq)
Nitrous acid and nitric acid result from a common air pollutant, nitrogen dioxide (NO2). Most of the nitrogen dioxide in our atmosphere is produced in automobile exhaust. Nitrogen dioxide gas dissolves in rain drops and forms nitrous and nitric acid:
(2) 2 NO2(g) + H2O(l) HNO2(aq) + HNO3(aq)
Sulfurous acid is produced from another air pollutant, sulfur dioxide (SO2). Most of the sulfur dioxide gas in the atmosphere results from burning coal that contains sulfur impurities. Sulfur dioxide dissolves in rain drops and forms sulfurous acid:
(3) SO2(g) + H2O(l) H2SO3(aq)
In the procedure outlined below, you will first produce these three gases. You will then bubble the gases through water, producing the acids found in acid rain. The acidity of the water will be monitored with a pH Sensor.
OBJECTIVES
In this experiment, you will
Generate three gaseous oxides, CO2, SO2, and NO2 Simulate the formation of acid rain by bubbling each of the three gases into water and
producing three acidic solutions Measure the pH of the three resulting acidic solutions to compare their relative strengths
Note about the pH sensor: The pH meter is a device used to measure the electrical potential of a particular process. The glass
bulb is part of an electrode that is responsive to the hydronium ion activity of the test solution. The
glass electrode is fragile, even though protected by a plastic shield. Handle it with care. Be very
cautious about bumping the electrode bulb on the bottom of the container containing a test solution.
Before making a pH measurement, rinse the electrode probe thoroughly with distilled water and dry
them gently with a Kim-wipe tissue. After the measurement, again rinse it. When finished, return it to
its storage buffer. IF YOU BREAK IT, YOU BUY IT.
NO
2
SO
CO
2
2
2H
H
H
H
CO
NO
NO
SO
2
3
3
3
2

144
Equipment Information Each bin should contain:
Notes:
a. Check the pH probe for breakage.
b. Refill pH probe with storage solution if needed. Storage solution available in the
stockroom.
Chemical Safety Information Acid Rain
Chemical Hazards
Hydrochloric acid corrosive
Sodium bicarbonate none
Sodium bisulfite corrosive
Sodium nitrite oxidizer, acutely toxic, environmental hazard
1 – pH probe After use, secure cord as
shown
7 – plastic pipets
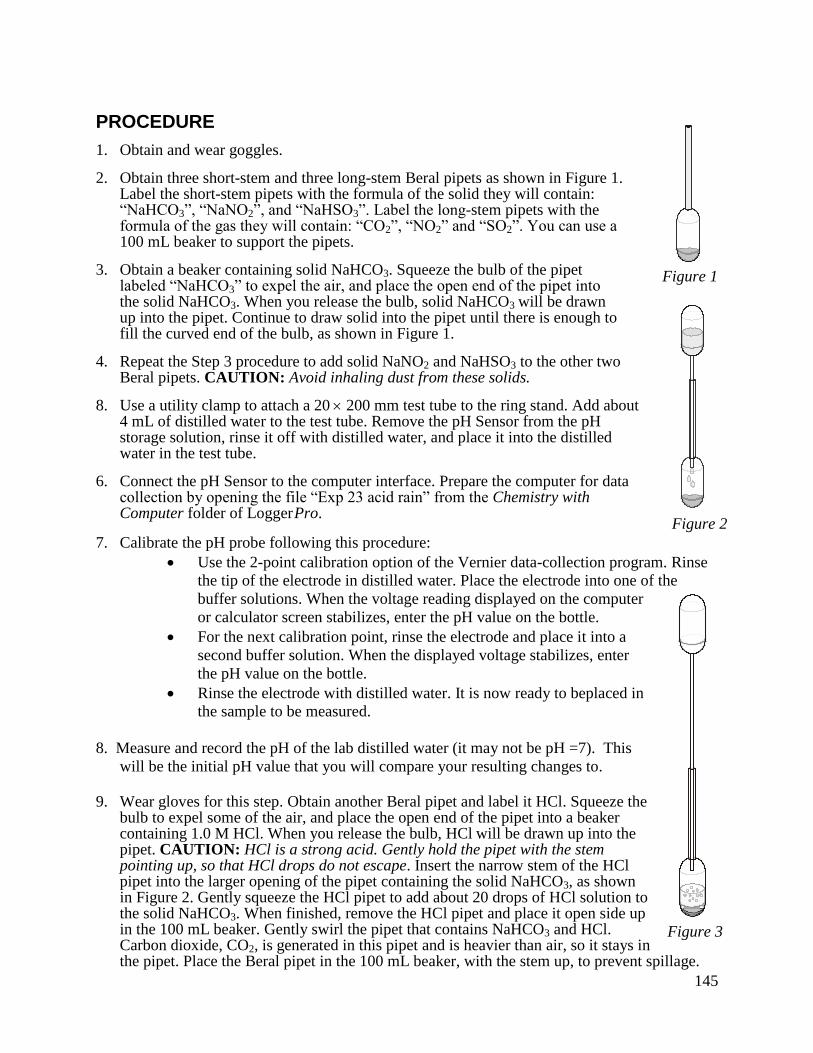
145
PROCEDURE
1. Obtain and wear goggles.
2. Obtain three short-stem and three long-stem Beral pipets as shown in Figure 1. Label the short-stem pipets with the formula of the solid they will contain: “NaHCO3”, “NaNO2”, and “NaHSO3”. Label the long-stem pipets with the formula of the gas they will contain: “CO2”, “NO2” and “SO2”. You can use a 100 mL beaker to support the pipets.
3. Obtain a beaker containing solid NaHCO3. Squeeze the bulb of the pipet labeled “NaHCO3” to expel the air, and place the open end of the pipet into the solid NaHCO3. When you release the bulb, solid NaHCO3 will be drawn up into the pipet. Continue to draw solid into the pipet until there is enough to fill the curved end of the bulb, as shown in Figure 1.
4. Repeat the Step 3 procedure to add solid NaNO2 and NaHSO3 to the other two Beral pipets. CAUTION: Avoid inhaling dust from these solids.
8. Use a utility clamp to attach a 20 200 mm test tube to the ring stand. Add about 4 mL of distilled water to the test tube. Remove the pH Sensor from the pH storage solution, rinse it off with distilled water, and place it into the distilled water in the test tube.
6. Connect the pH Sensor to the computer interface. Prepare the computer for data collection by opening the file “Exp 23 acid rain” from the Chemistry with Computer folder of Logger Pro.
7. Calibrate the pH probe following this procedure:
Use the 2-point calibration option of the Vernier data-collection program. Rinse
the tip of the electrode in distilled water. Place the electrode into one of the
buffer solutions. When the voltage reading displayed on the computer
or calculator screen stabilizes, enter the pH value on the bottle.
For the next calibration point, rinse the electrode and place it into a
second buffer solution. When the displayed voltage stabilizes, enter
the pH value on the bottle.
Rinse the electrode with distilled water. It is now ready to beplaced in
the sample to be measured.
8. Measure and record the pH of the lab distilled water (it may not be pH =7). This
will be the initial pH value that you will compare your resulting changes to.
9. Wear gloves for this step. Obtain another Beral pipet and label it HCl. Squeeze the
bulb to expel some of the air, and place the open end of the pipet into a beaker containing 1.0 M HCl. When you release the bulb, HCl will be drawn up into the pipet. CAUTION: HCl is a strong acid. Gently hold the pipet with the stem pointing up, so that HCl drops do not escape. Insert the narrow stem of the HCl pipet into the larger opening of the pipet containing the solid NaHCO3, as shown in Figure 2. Gently squeeze the HCl pipet to add about 20 drops of HCl solution to the solid NaHCO3. When finished, remove the HCl pipet and place it open side up in the 100 mL beaker. Gently swirl the pipet that contains NaHCO3 and HCl. Carbon dioxide, CO2, is generated in this pipet and is heavier than air, so it stays in the pipet. Place the Beral pipet in the 100 mL beaker, with the stem up, to prevent spillage.
Figure 1
Figure 3
Figure 2
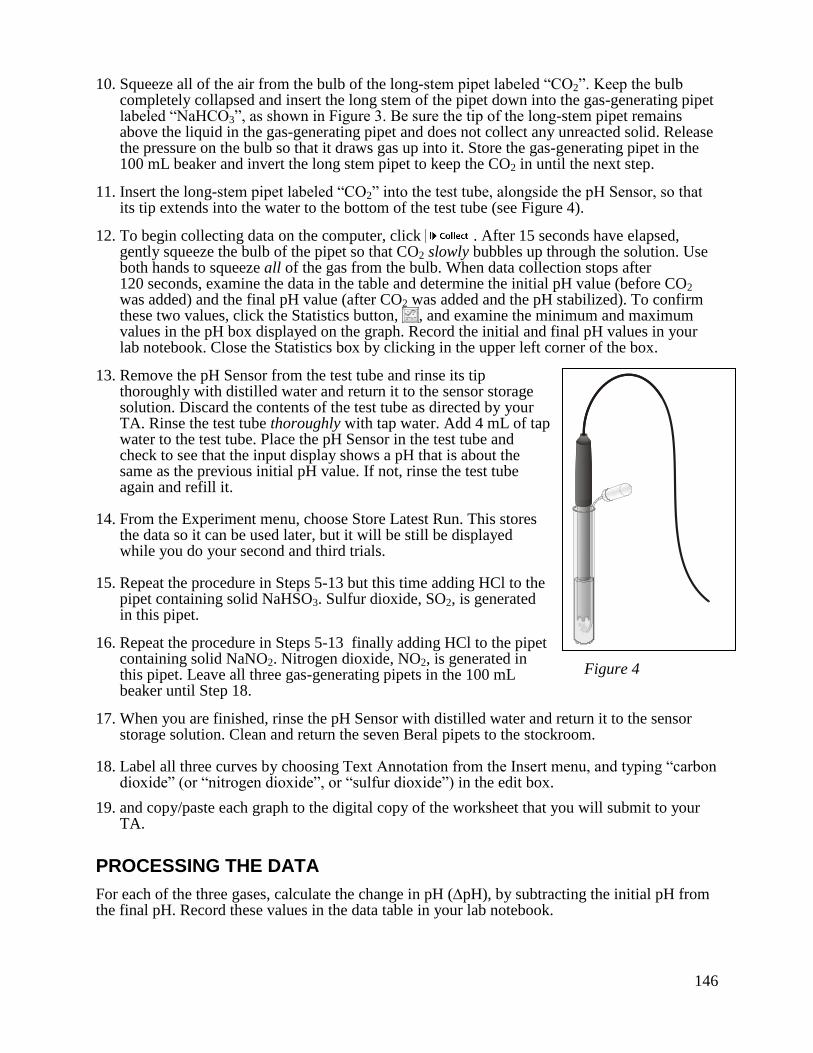
146
10. Squeeze all of the air from the bulb of the long-stem pipet labeled “CO2”. Keep the bulb completely collapsed and insert the long stem of the pipet down into the gas-generating pipet labeled “NaHCO3”, as shown in Figure 3. Be sure the tip of the long-stem pipet remains above the liquid in the gas-generating pipet and does not collect any unreacted solid. Release the pressure on the bulb so that it draws gas up into it. Store the gas-generating pipet in the 100 mL beaker and invert the long stem pipet to keep the CO2 in until the next step.
11. Insert the long-stem pipet labeled “CO2” into the test tube, alongside the pH Sensor, so that its tip extends into the water to the bottom of the test tube (see Figure 4).
12. To begin collecting data on the computer, click . After 15 seconds have elapsed, gently squeeze the bulb of the pipet so that CO2 slowly bubbles up through the solution. Use both hands to squeeze all of the gas from the bulb. When data collection stops after 120 seconds, examine the data in the table and determine the initial pH value (before CO2 was added) and the final pH value (after CO2 was added and the pH stabilized). To confirm these two values, click the Statistics button, , and examine the minimum and maximum values in the pH box displayed on the graph. Record the initial and final pH values in your lab notebook. Close the Statistics box by clicking in the upper left corner of the box.
13. Remove the pH Sensor from the test tube and rinse its tip thoroughly with distilled water and return it to the sensor storage solution. Discard the contents of the test tube as directed by your TA. Rinse the test tube thoroughly with tap water. Add 4 mL of tap water to the test tube. Place the pH Sensor in the test tube and check to see that the input display shows a pH that is about the same as the previous initial pH value. If not, rinse the test tube again and refill it.
14. From the Experiment menu, choose Store Latest Run. This stores the data so it can be used later, but it will be still be displayed while you do your second and third trials.
15. Repeat the procedure in Steps 5-13 but this time adding HCl to the pipet containing solid NaHSO3. Sulfur dioxide, SO2, is generated in this pipet.
16. Repeat the procedure in Steps 5-13 finally adding HCl to the pipet containing solid NaNO2. Nitrogen dioxide, NO2, is generated in this pipet. Leave all three gas-generating pipets in the 100 mL beaker until Step 18.
17. When you are finished, rinse the pH Sensor with distilled water and return it to the sensor storage solution. Clean and return the seven Beral pipets to the stockroom.
18. Label all three curves by choosing Text Annotation from the Insert menu, and typing “carbon dioxide” (or “nitrogen dioxide”, or “sulfur dioxide”) in the edit box.
19. and copy/paste each graph to the digital copy of the worksheet that you will submit to your TA.
PROCESSING THE DATA
For each of the three gases, calculate the change in pH (pH), by subtracting the initial pH from the final pH. Record these values in the data table in your lab notebook.
Figure 4

147
Acid Rain Lab Report Lab Report:
Name_____________________________ Date______________ Lab Section______________
There is not a formal lab report for this lab. Complete the below pages and submit them
to your TA before leaving lab.
Briefly describe the purpose of the lab. Say something about the effects of acid rain. Include
information as to how the acids were generated. With the technique used, describe if it is it
possible to control how much of each acid dissolved in the water before measuring the final
pH.
Data: Neatly draw a data table below that captures all of the relevant information. Make sure
to include the final pH and change in pH for all three gases.

148
Results: Answer the following questions.
1. In this experiment, which gas caused the smallest drop (change) in pH? What was the
change in pH?
2. Which gas (or gases) caused the largest drop in pH? What was the change in pH?
3. Coal from western states such as Montana and Wyoming is known to have a lower percentage of sulfur impurities than coal found in the eastern United States. How would burning low-sulfur coal lower the level of acidity in rainfall? Use specific information from this lab to answer the question.
4. High temperatures in the automobile engine cause nitrogen and oxygen gases from the air to combine to form nitrogen oxides. Can the nitrogen oxides in automobile exhaust contribute to acid rain? Use specific information from this lab to answer the question.
5. All three gases from this lab are produced by man but one occurs naturally at relatively high and constant concentrations. Which gas from this experiment would cause rainfall in unpolluted air to have a pH value less than 7 (sometimes as low as 5.6)?
6. Ka (the acid ionization constant) is a measure of acid strength; the higher the value of
the Ka the stronger the acid. Use the internet or the appendix in your text to look up the
Ka values for HNO2, H2SO3, and H2CO3. Which acid is the weakest? Which is the
strongest?
7. Attach copies of each curve pH curve.

149
Pre-lab: Acid Ionization Constant, Ka
Part A
Answer the following questions in your lab notebook (be sure to show work for
any calculations):
1. What would the pH of a 0.10 M solution of NaOH be (in theory)?
2. What would be the pH of a 0.10 M solution of HCl?
3. Write the equilibrium constant expression, Ka, for the ionization of acetic acid, HC2H3O2.
4. What would be the predicted pH of a 1.0 M solution of HC2H3O2?
5. Determine the volume, in mL, of 2.00 M HC2H3O2 required to prepare 50 mL of a 0.30 M
HC2H3O2 solution?
Part B
Prepare your notebook for the lab. This includes stating the purpose of the
experiment, summarizing the procedure in a bulleted-list format (be sure to include
space for observations) and preparing any tables necessary for data collection.
At the start of your lab, remove the copies of the pages where you
completed the above work from your lab notebook and turn them into
your TA.

150
Acid Ionization Constant, Ka
Acetic Acid, HC2H3O2, is a weak acid that ionizies according to the balanced chemical equation:
HC2H3O2(aq) ↔ H+(aq) + C2H3O2
–(aq)
In this experiment, you will experimentally determine the ionization constant, Ka, for acetic acid, starting with solutions of different initial concentrations.
OBJECTIVES
In this experiment, you will
Gain experience mixing solutions of specified concentration Experimentally determine the dissociation constant, Ka, of an acid Investigate the effect of initial solution concentration on the extent of dissociation
MATERIALS
Vernier pH Sensor 10 mL graduated cylinder pipet bulb 50 mL volumetric flasks
Note about the pH sensor: The pH meter is a device used to measure the electrical potential of a particular process. The
glass bulb is part of an electrode that is responsive to the hydronium ion activity of the test
solution. The glass electrode is fragile, even though protected by a plastic shield. Handle it
with care. Be very cautious about bumping the electrode bulb on the bottom of the container
containing a test solution. Before making a pH measurement, rinse the electrode probe
thoroughly with distilled water and dry them gently with a Kim-wipe tissue. After the
measurement, again rinse it. When finished, return it to its storage buffer. IF YOU BREAK
IT, YOU BUY IT.
Figure 1

151
Equipment Information Each bin should contain:
Notes:
a. Have your TA check your calculations before you start.
b. Check the pH probe for breakage.
Chemical Safety Information Acid Dissociation Constant
Chemical Hazards
Acetic acid corrosive
Vinegar corrosive
1 – 50mL volumetric
flask
1 – pH probe After use, secure
cord as shown
1 – 10mL graduated
cylinder
152
PROCEDURE
1. Obtain and wear safety goggles.
2. Put approximately 25 mL of distilled water into a 50 mL volumetric flask.
3. Your TA will assign each group two different concentrations of HC2H3O2 between 0.20 and 1.0 M. Calculate the volume of a 2.0 M HC2H3O2 stock solution necessary to make 50 mL of each solution you were assigned. Using your graduated cylinder, measure the required volume of ~2 M (write down the actual concentration) acetic acid and pour into the volumetric flask. CAUTION: Use care when handling the acetic acid. It can cause painful burns if it comes in contact with your skin or gets into your eyes. Fill the flask with distilled water to the 50 mL mark. To prevent overshooting the mark, use a wash bottle filled with distilled water or a dropper for the last few mL. Mix thoroughly.
4. Use a utility clamp to secure a pH Sensor to a ring stand as shown in Figure 1.
5. Connect the probe to the computer interface. Prepare the computer for data collection by opening the file “Exp 27 Acid Dissociation Ka” from the Chemistry w/ Computer folder of Logger Pro.
6. Calibrate the pH probe following this procedure:
Use the 2-point calibration option of the Vernier data-collection program. Rinse
the tip of the electrode in distilled water. Place the electrode into one of the
buffer solutions. When the voltage reading displayed on the computer or
calculator screen stabilizes, enter the pH value on the bottle.
For the next calibration point, rinse the electrode and place it into a second buffer
solution. When the displayed voltage stabilizes, enter the pH value on the bottle.
Rinse the electrode with distilled water. It is now ready to beplaced in the sample
to be measured.
7. Determine the pH of your solution as follows:
Use about 40 mL of distilled water in a 100 mL beaker to rinse the pH Sensor.
Pour about 20 mL of your first assigned solution into a clean 100 mL beaker and use it to thoroughly rinse the sensor.
Use the remaining 30 mL portion to determine pH. Swirl the solution vigorously. (Note: Readings may drift without proper swirling!) Record the measured pH reading in the data table in your lab notebook.
When done, place the pH Sensor in distilled water. 8. Repeat the procedure for your remaining assigned solutions.
9. Obtain 20 mL of vinegar. Measure the pH of the vinegar and record your value.

153
PROCESSING THE DATA
1. Calculate the [H+]eq from the pH values for each solution.
2. Use the obtained value for [H+]eq and the equation:
HC2H3O2(aq) H+(aq) + C2H3O2
–(aq)
to construct an ICE table and determine [C2H3O2–]eq and [HC2H3O2]eq.
3. Substitute these equilibrium concentrations into the Ka expression for HC2H3O2.
4. Compare your results with those of other students.
5. Using your calculated value of Ka for acetic acid and the pH of the commercial vinegar, determine the concentration of acetic acid in the vinegar solution.

154
Acid Ionization Lab Report:
Name_____________________________ Date______________ Lab Section______________
There is not a formal lab report for this lab. Complete the below pages and submit them
to your TA before leaving lab.
Briefly describe Ka. How does Ka relate to acid strength? Describe how you can use the pH
of an aqueous acid solution and its initial concentration to determine the Ka.
Data: Insert a data table below that captures all of the relevant information. Make sure to
include the concentrations of the HC2H3O2 solutions you made and the volume of
the stock solution and water used to make the solutions. Include the pH of vinegar
.
155
Results:
2. Report your calculated Ka value for the first concentration used. Include a copy of the
ICE table.
3. Report your calculated Ka value for the second concentration used. Include a copy of the
ICE table.
4. Report the class average Ka.
5. Compare the class average experimentally determined Ka with the accepted value at
25 °C (1.8 x 10⁻⁵
) and calculate the percent error.

156
6. Should the initial HC2H3O2 concentration have any effect on Ka? Briefly explain.
7. Calculate the percent ionization of acetic acid for each concentration you used.
8. What effect does initial HC2H3O2 concentration seem to have on the percent ionization?
9. Calculate the concentration of acetic acid in the vinegar solution

157
10. In the past, many students have listed that the accidental addition of too much acetic acid
contributed greatly to the difference between the experimental value and the accepted value. Suppose that Student A was supposed to make a 0.18 M solution by diluting 9.0 mL of 2.0 M acetic acid to 100.0 mL. The expected pH for this solution is 2.74. The Ka of acetic acid is 1.8 x 10
-5.
a. What would be the expected pH if a Student A accidentally diluted 9.1 mL
(instead of 9.0 mL) of the acid to 100 mL?
b. If student A measured the above calculated pH, what would be the resultant Ka
of acetic acid given that they expected the acid to have an initial concentration
of 0.18M ?

158
Pre-lab: Titration of a Diprotic Acid: Identifying an
Unknown Part A
Answer the following questions in your lab notebook (be sure to show work for
any calculations):
1. What is a diprotic acid? Give an example not found below in the text for this
experiment.
2. Give the balanced chemical reaction for the titration of a generic diprotic acid, H2X,
with potassium hydroxide.
3. When titrating 50.0 mL of 0.10 M H2SO4 with 0.10 M NaOH, how many mL of NaOH
will you have added to reach the 1st equivalence point?
4. A student completes a titration of an unknown diprotic acid. In this experiment, 0.79 g
of the acid is dissolved in 250.0 mL of water. It requires 13.48 mL of 1.0 M NaOH to
reach the second equivalence point. What is the molar mass of the acid?
Part B
Prepare your notebook for the lab. This includes stating the purpose of the
experiment, summarizing the procedure in a bulleted-list format (be sure to include
space for observations) and preparing any tables necessary for data collection.
At the start of your lab, remove the copies of the pages where you
completed the above work from your lab notebook and turn them into
your TA.

159
Lab: Titration of a Diprotic Acid: Identifying an Unknown A diprotic acid is an acid that yields two H
+ ions per acid molecule. Examples of diprotic acids
are sulfuric acid, H2SO4, and carbonic acid, H2CO3. A diprotic acid dissociates in water in two stages:
(1) H2X(aq) H+(aq) + HX
–(aq)
(2) HX–(aq) H
+(aq) + X
2–(aq)
Because of the successive dissociations, titration curves of diprotic acids can have two equivalence points, as shown in Figure 1. The equations for the acid-base reactions occurring between a diprotic acid, H2X, and sodium hydroxide base, NaOH, are
from the beginning to the first equivalence point:
(3) H2X + NaOH NaHX + H2O
from the first to the second equivalence point:
(4) NaHX + NaOH Na2X + H2O
from the beginning of the reaction through the second equivalence point (net reaction):
(5) H2X + 2 NaOH Na2X + 2 H2O
At the first equivalence point, all H+ ions from the first dissociation have reacted with NaOH base. At the second equivalence point, all H+ ions from both reactions have reacted (twice as many as at the first equivalence point). Therefore, the volume of NaOH added at the second equivalence point is exactly twice that of the first equivalence point (see Equations 3 and 5).
The primary purpose of this experiment is to identify an unknown diprotic acid by finding its molecular weight. A known mass of a diprotic acid is titrated with NaOH solution of known concentration. Molecular weight (or molar mass) is found in g/mole of the diprotic acid. Weighing the original sample of acid will tell you its mass in grams. Moles can be determined from the volume of NaOH titrant needed to reach the first equivalence point. The volume and the concentration of NaOH titrant are used to calculate moles of NaOH. Moles of unknown acid equal moles of NaOH at the first equivalence point (see Equation 3). Once grams and moles of the diprotic acid are known, molecular weight can be calculated, in g/mole. Molecular weight determination is a common way of identifying an unknown substance in chemistry.
You may use either the first or second equivalence point to calculate molecular weight or both. The first is somewhat easier, because moles of NaOH are equal to moles of H2X (see Equation 3). If the second equivalence point is more clearly defined on the titration curve, however, simply divide its NaOH volume by 2 to confirm the first equivalence point; or from Equation 5, use the ratio:
1 mole H2X / 2 mol NaOH
Volume NaOH
pH
1st Equivalence Point 2nd Equivalence Point
Figure 1

160
Equipment Information Each bin should contain:
Notes:
a. Check the pH probe for breakage.
b. Refill pH probe with storage solution as needed. See the stockroom if needed.
Chemical Safety Information Diprotic Acid Titration
Chemical Hazards
Unknown acid toxic
Sodium hydroxide corrosive
Indicator Mixture
- Ethanol flammable, toxic
- Bromocresol green none
- Phenol red toxic
1 – pH probe After use, secure cord as
shown

161
MATERIALS
Vernier pH Sensor Stir plate
50 mL buret Magnetic stir bar
Note about the pH sensor:
The pH meter is a device used to measure the electrical potential of a particular process. The
glass bulb is part of an electrode that is responsive to the hydronium ion activity of the test
solution. The glass electrode is fragile, even though protected by a plastic shield. Handle it
with care. Be very cautious about bumping the electrode bulb on the bottom of the container
containing a test solution. Before making a pH measurement, rinse the electrode probe
thoroughly with distilled water and dry them gently with a Kim-wipe tissue. After the
measurement, again rinse it. When finished, return it to its storage buffer. IF YOU BREAK
IT, YOU BUY IT.
PROCEDURE
1. Obtain and wear goggles.
2. Weigh out about 0.120 g of the unknown diprotic acid on a piece of weighing paper. Record the mass to the nearest 0.001 g in the data table in your lab notebook. Transfer the unknown acid to a 250 mL beaker and dissolve in 100 mL of distilled water. CAUTION: Handle the solid acid and its solution with care. Acids can harm your eyes, skin, and respiratory tract.
4. Add 6 drops of the indicator mixture. The indicator mixture contains a mixture of bromocresol green and phenol red.
4. Use a utility clamp to suspend a pH Sensor on a ring stand as shown here. Position the pH Sensor in the diprotic acid solution and adjust its position toward the outside of the beaker so it will be easier to stir the solution with a magnetic stir bar without striking the sensor. Get the stir bar spinning rapidly but smoothly and leave it on.
5. Obtain approximately 60 mL of ~0.1 M NaOH solution in a 250 mL beaker. Obtain a 50 mL buret and rinse the buret with a few mL of the ~0.1 M NaOH solution. Record the precise concentration of the NaOH solution in the data table in your lab notebook. Use a utility clamp to attach the buret to the ring stand. Fill the buret a little above the 0.00 mL level of the buret. Drain a small amount of NaOH solution into a waste beaker so it fills the buret tip and leaves the NaOH close to (but below) the 0.00 mL level of the buret. Be sure to record the actual buret reading. ALL BURET READINGS NEED TO BE RECORDED TO TWO DECIMAL PLACES. Dispose of the waste solution from this step in the waste jar as directed by your teacher. CAUTION: Sodium hydroxide solution is caustic. Avoid spilling it on your skin or clothing.
6. Connect the pH Sensor to the computer interface. Prepare the computer for data collection by opening the file “Exp 24a Acid Base Titration” from the Chemistry w/ Computer folder of Logger Pro.
7. Calibrate the pH probe following this procedure:
Use the 2-point calibration option of the Vernier data-collection program. Rinse
the tip of the electrode in distilled water. Place the electrode into one of the

162
buffer solutions. When the voltage reading displayed on the computer or
calculator screen stabilizes, enter the pH value on the bottle.
For the next calibration point, rinse the electrode and place it into a second buffer
solution. When the displayed voltage stabilizes, enter the pH value on the bottle.
Rinse the electrode with distilled water. It is now ready to be placed in the
sample to be measured.
8. You are now ready to begin the titration. This process goes faster if one person manipulates
and reads the buret while another person operates the computer and enters buret readings. Pay special attention to the color of the solution and be sure to write down the pH when color changes happen.
a. Before adding NaOH titrant, click and monitor the pH for 5-10 seconds. Once the pH has stabilized, click . In the edit box, type in the initial buret reading, and press ENTER to store the first data pair for this experiment.
b. Add enough NaOH to raise the pH by about 0.20 units. When the pH stabilizes, again click . In the edit box, type the current buret reading, to the nearest 0.01 mL. Press ENTER. You have now saved the second data pair for the experiment.
c. Continue adding NaOH solution in increments that raise the pH about 0.20 units and enter the buret reading after each addition. Proceed in this manner until the pH is 3.5.
d. When pH 3.5 is reached, change to 2-drop increments. Enter the buret reading after each increment. Additionally, note any change in the color of the solution.
e. After pH 4.5 is reached, again add larger increments that raise the pH by about 0.20 units and enter the buret reading after each addition. Continue in this manner until a pH of 7.5 is reached.
f. When pH 7.5 is reached, change back to 2-drop increments. Enter the buret reading after each increment.
g. When pH 10 is reached, again add larger increments that raise the pH by 0.20 units. Enter the buret reading after each increment. Continue in this manner until you reach a pH of 11.
9. When you have finished collecting data, click . Dispose of the beaker contents in the
waste jar as directed by your TA.
10. Print a copy of the table. Then print a copy of the graph.

163
PROCESSING THE DATA 1. On your printed graph, one of the two equivalence points is usually more clearly defined than
the other; the two-drop increments near the equivalence points frequently result in larger increases in pH (a steeper slope) at one equivalence point than the other. Indicate the more clearly defined equivalence point (first or second) in your data table.
2. Use your graph and data table to determine the volume of NaOH titrant used for the equivalence point you selected in Step 1. To do so, examine the data to find the largest increase in pH values during the 2-drop additions of NaOH. Find the NaOH volume just before this jump. Then find the NaOH volume after the largest pH jump. Identify both of these data pairs and record them.
3. Determine the volume of NaOH added at the equivalence point you selected in Step 1. To do this, add the two NaOH volumes determined in Step 2, and divide by two. For example:
12.34 + 12.44
2 = 12.39 mL
4. Calculate the number of moles of NaOH used at the equivalence point you selected in Step 1.
5. Determine the number of moles of the diprotic acid, H2X. Use Equation 3 or Equation 5 to obtain the ratio of moles of H2X to moles of NaOH, depending on which equivalence point you selected in Step 1.
6. Using the mass of diprotic acid you measured out in Step 1 of the procedure, calculate the molecular weight of the diprotic acid, in g/mol.
7. From the following list of five diprotic acids, identify your unknown diprotic acid.
Diprotic Acid Formula Molecular weight
Oxalic Acid H2C2O4 90 Malonic Acid H2C3H2O4 104 Maleic Acid H2C4H2O4 116 Malic Acid H2C4H4O5 134 Tartaric Acid H2C4H4O6 150
8. Determine the percent error for your molecular weight value in Step 6.
9. For the alternate equivalence point (the one you did not use in Step 1), use your graph and data table to determine the volume of NaOH titrant used. Examine the data to find the largest increase in pH values during the 2-drop additions of NaOH. Find the NaOH volume just before and after this jump. Underline both of these data pairs on the printed data table and record them in the Data and Calculations table. Note: Dividing or multiplying the other equivalence point volume by two may help you confirm that you have selected the correct two data pairs in this step.
10. Determine the volume of NaOH added at the alternate equivalence point, using the same method you used in Step 3.
11. On your printed graph, clearly specify the position of the equivalence point volumes you determined in Steps 3 and 10, using dotted reference lines like those in Figure 1. Specify the NaOH volume of each equivalence point on the horizontal axis of the graph.

164
Extension Using a half-titration method, it is possible to determine the acid dissociation constants, Ka1 and Ka2, for the two dissociations of the diprotic acid in this experiment. The Ka expressions for the first and second dissociations, from Equations 1 and 2, are:
Ka1 = [H+][HX-]
[H2X] Ka2 =
[H+][X2-]
[HX-]
The first half-titration point occurs when one-half of the H+ ions in the first dissociation have been titrated with NaOH, so that [H2X] = [HX
–]. Similarly, the second half-titration point occurs
when one-half of the H+ ions in the second dissociation have been titrated with NaOH, so that
[HX–] = [X
2–]. Substituting [H2X] for [HX
–] in the Ka1 expression and, [HX
–] for [X
2–] in the Ka2
expression, the following are obtained:
Ka1 = [H+] Ka2 = [H+]
Taking the base-ten log of both sides of each equation,
logKa1 = log[H+] logKa2 = log[H+]
Thus, the pH value at the first half-titration volume, Point 1 in Figure 2, is equal to the pKa1 value. The first half-titration point volume can be found by dividing the first equivalence point volume by two.
Similarly, the pH value at the second titration point, is equal to the pKa2 value. The second half-titration volume (Point 2 in Figure 2) is midway between the first and second equivalence point volumes (1st EP and 2nd EP). Use the method described below to determine the Ka1 and Ka2 values for the diprotic acid you identified in this experiment.
1. Determine the precise NaOH volume for the first half-titration point using one-half of the first equivalence point volume (determined in Step 2 or Step 9 of Processing the Data). Then determine the precise NaOH volume of the second half-titration point halfway between the first and second equivalence points.
2. On your graph of the titration curve, draw reference lines similar to those shown in Figure 2. Start with the first half-titration point volume (Point 1) and the second half-titration point volume (Point 2). Determine the pH values on the vertical axis that correspond to each of these volumes. Estimate these two pH values to the nearest 0.1 pH unit. These values are the pKa1 and pKa2 values, respectively. (Note: See if there are volume values in your data table similar to either of the half-titration volumes in Step 1. If so, use their pH values to confirm your estimates of pKa1 and pKa2 from the graph.)
3. From the pKa1 and pKa2 values you obtained in the previous step, calculate the Ka1 and Ka2 values for the two dissociations of the diprotic acid.
pK
pKa1
a2
2nd EP21 1st EP
Volume NaOH
pH
Figure 2

165
EQUIVALENCE POINT DETERMINATION: Another Method An alternate way of determining the precise equivalence point of the titration is to take the first and second derivatives of the pH-volume data. The equivalence point volume corresponds to the peak (maximum) value of the first derivative plot, and to the volume where the second derivative equals zero on the second derivative plot.
1. View the first-derivative graph (pH/vol) by clicking the on the vertical-axis label (pH), and choose First Derivative. You may need to autoscale the new graph by clicking the Autoscale button, .
2. View the second-derivative graph (2pH/vol
2) by clicking on the vertical-axis label, and
choosing Second Derivative. In Method 2, view the second-derivative on Page 3 by clicking on the Next Page button, .

166
Titration of a Diprotic Acid Lab Report: You will write a complete lab report for this lab which will contain the following sections:
Abstract:
State the molar mass and which of the unknown diprotic acids you were given and
what you found for the two Ka values
Introduction:
Include a statement of purpose for this experiment, relevant conceptual
background, and general equations (titration, titration curves, equivalence point,
diprotic acids and Ka)
Explain how these concepts can help to determine the identity of some unknown
acid
Include equations where necessary
Data:
Include in your report the recorded concentration of base used for the titration, the
mass of the unknown used. Additionally, summarize the relevant volume and pH
data collected during your titration; include only the data for the initial reading, at
each ½ equivalence point and at each equivalence point (do not turn in your raw
data, it is summarized in the titration curve you will to cite and attach).
Results:
Include in your report a copy of the titration curve, the first derivative plot and the
second derivative plot.
Tabulate your results for the calculated moles of acid, the molar mass of the acid,
the identity of the acid and the percent error in your calculated molar mass for
both equivalence points AND for both methods of determining equivalence point
Include the determined values of Ka1 and Ka2 for your acid
Attach your calculations to the end of your report
Discussion:
Discuss the experiment and any possible sources of error.
Which data analysis method (using the indicators or using the Venier pH data) do
you feel gave you better (or more easy to interpret) results? Justify your answer.
How sure are you in the identification of your unknown? Use both your Ka values
and molecular weight to identify the appropriate acid. You should look up the Ka
values of all the possible acids to find which acid best matches your unknown.
Question:
When the pH of the solution equals the pKa of an indicator, the solution will have
an intermediate color. Estimate the pKa of both indicators (bromocresol green is
the indicator that made the transition in the acidic region of the titration).
Submit your report on time and to your TA in the dropbox
on D2L.

167
Pre-lab: Buffers
Part A
Answer the following questions in your lab notebook (be sure to show work for
any calculations):
1. Buffer A: Calculate the mass of solid sodium acetate required to mix with 50.0 mL of
0.1 M acetic acid to prepare a pH 4 buffer. The Ka of acetic acid is 1.8 10–5
2. Buffer B: Calculate the mass of solid sodium acetate required to mix with 50.0 mL of
1.0 M acetic acid to prepare a pH 4 buffer. The Ka of acetic acid is 1.8 10–5
3. Write a reaction to show how a sodium acetate/acetic acid buffer would respond to a
small amount of added strong acid.
4. Write a reaction to show how a sodium acetate/acetic acid buffer would respond to a
small amount of added strong base.
Part B
Prepare your notebook for the lab. This includes stating the purpose of the
experiment, summarizing the procedure in a bulleted-list format (be sure to include
space for observations) and preparing any tables necessary for data collection.
At the start of your lab, remove the copies of the pages where you
completed the above work from your lab notebook and turn them into
your TA.

168
Lab: Buffers A buffer is a mixture of a weak acid and its conjugate base, or a weak base and its conjugate acid. A buffer’s function is to absorb small amounts of acids (H
+ or H3O
+ ions) or bases (OH
–
ions) so that the pH of the system changes by a smaller amount than it would with most other solutions.
In many systems, buffers are critical. Blood plasma, a natural example in humans, is a bicarbonate buffer that keeps the pH of blood between 7.2 and 7.6.
By design, a buffer is an equilibrium system. For example, a buffer can be prepared with nitrous acid, HNO2. The weak acid establishes an aqueous equilibrium as shown below.
HNO2 (aq) ↔ H+ (aq) + NO2
– (aq)
The equilibrium constant expression is shown below.
]HNO[
]NO][H[
2
-
2
aK
To prepare a buffer system with nitrous acid, a comparable amount of the conjugate base is added, such as sodium nitrite (NaNO2). The resulting system is a mixture of HNO2 and NO2
–
ions. The nitrous acid molecule will neutralize hydroxide ions and the nitrite ion (the conjugate) will neutralize hydronium ions; and in each case the product will be one of the original conjugates, resulting in a solution that is similar to the original one.
A variation of the equilibrium expression above, called the Henderson-Hasselbalch equation, is a useful reference in preparing a buffer solution. For our nitrous acid/sodium nitrate buffer example, the Henderson-Hasselbalch equation is shown below.
The pH range in which a buffer solution is effective is generally considered to be ±1 of the pKa corresponding to ten-fold excesses of either the acid over the conjugate base, or vice versa.
In this experiment, you will use the Henderson-Hasselbalch equation to determine the amount of acetic acid and sodium acetate needed to prepare two acidic buffer solutions. You will then prepare the buffers and test their buffer capacities by adding solutions of NaOH and HCl while monitoring the pH.
OBJECTIVES
In this experiment, you will
Prepare and test two acid buffer solutions.
Determine the buffer capacity of the prepared buffers.
]HNO[
]NO[log
2
2
apKpH
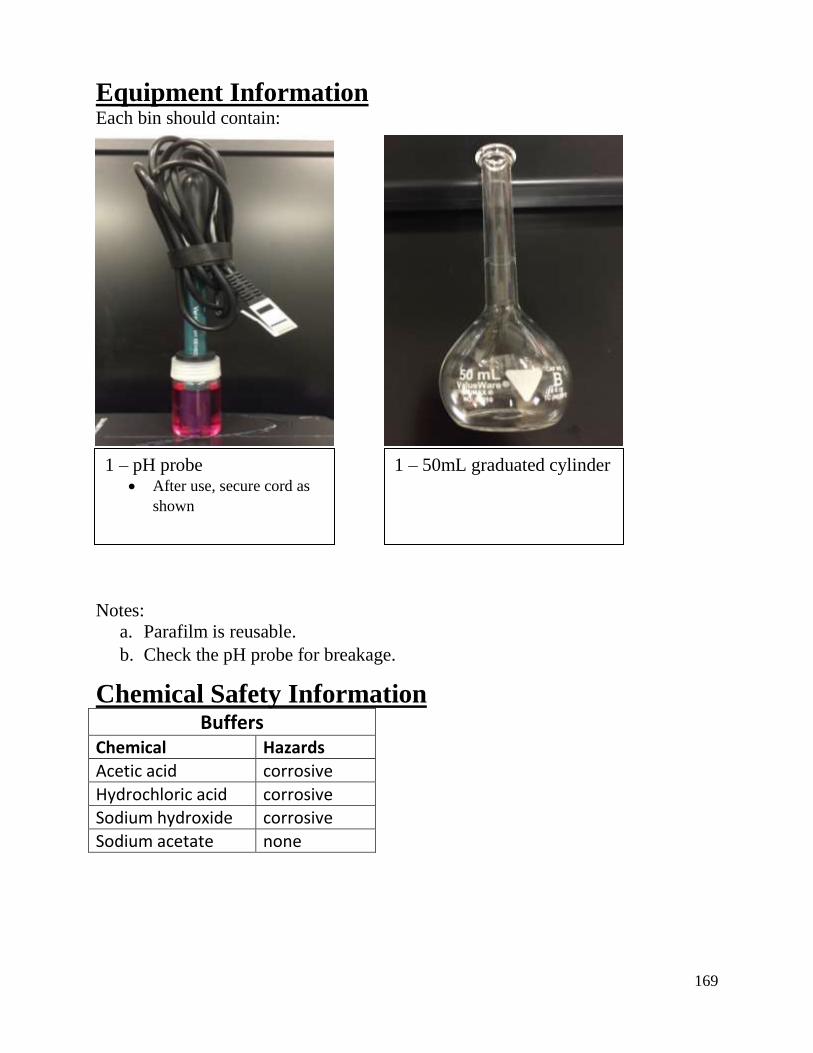
169
Equipment Information Each bin should contain:
Notes:
a. Parafilm is reusable.
b. Check the pH probe for breakage.
Chemical Safety Information Buffers
Chemical Hazards
Acetic acid corrosive
Hydrochloric acid corrosive Sodium hydroxide corrosive
Sodium acetate none
1 – pH probe After use, secure cord as
shown
1 – 50mL graduated cylinder

170
MATERIALS
Vernier pH Sensor two 50 mL burets
PROCEDURE
Part I Prepare and Test Buffer Solution A
1. Obtain and wear goggles.
2. Use your calculations from the Pre-Lab Exercise to prepare 50 mL of Buffer A. Weigh out the precise mass of sodium acetate and dissolve it in 50.0 mL of 0.1 M acetic acid solution.
3. Set up two burets, buret clamps, and ring stand (see Figure 1). Rinse and fill one buret with 0.5 M NaOH solution. Rinse and fill the second buret with 0.5 M HCl solution. CAUTION: Sodium hydroxide solution is caustic. Avoid spilling it on your skin or clothing. Handle the hydrochloric acid with care. It can cause painful burns if it comes in contact with the skin.
4. Use a graduated cylinder to measure out 10.0 mL of the Buffer A solution into a 250 mL beaker and add 15 mL of distilled water. You will stir with a stirring rod during the testing.
5. Connect a pH Sensor to Channel 1 of the Vernier computer interface. Connect the interface to the computer using the proper interface cable.
6. Start the Logger Pro program on your computer. Open the file “19 Buffers” from the Advanced Chemistry with Vernier folder.
7. Calibrate the pH probe following this procedure:
Use the 2-point calibration option of the Vernier data-collection program. Rinse
the tip of the electrode in distilled water. Place the electrode into one of the
buffer solutions. When the voltage reading displayed on the computer or
calculator screen stabilizes, enter the pH value on the bottle.
For the next calibration point, rinse the electrode and place it into a second buffer
solution. When the displayed voltage stabilizes, enter the pH value on the bottle.
Rinse the electrode with distilled water. It is now ready to beplaced in the sample
to be measured.
9. You are now ready to test Buffer A. Once you verify the initial pH of the buffer, you will
slowly and carefully add 0.5 M NaOH solution to the buffer solution.
a. Take an initial pH reading of the buffer solution. Click and monitor pH for 5–10 seconds. Once the displayed pH reading has stabilized, click . In the edit box, type the starting volume on the buret. Press the ENTER key to store the first data pair. Record the initial pH value. NOTE: if the initial pH is not within 0.3 pH units of 4.0 you should remake the buffer and begin again.
b. Add a small amount of the NaOH solution, up to 0.30 mL. When the pH stabilizes click . Enter the current buret reading and press ENTER to store the second data pair.
Figure 1

171
c. Continue adding the NaOH solution in small increments that raise the pH consistently and enter the buret reading after each increment. Your goal is to raise the pH of the buffer by precisely 2 pH units.
d. When the pH of the buffer solution is precisely 2 units greater than the initial reading, continue to add the NaOH solution in small increments until you have reached, and passed, the equivalence point of the titration. (The pH will begin to rise rapidly at the equivalence point.) Reaching the equivalence point is important for ensuring consistency in your data.
e. Click . Print a copy of the first trial.
10. Dispose of the reaction mixture in the waste jar as directed. Rinse the pH sensor with distilled water in preparation for the second titration.
11. Repeat Steps 7 and 8, using a fresh 10.0 mL sample of the Buffer A solution. For the second trial, repeat using the sodium hydroxide. For the third trial, titrate the buffer with 0.5 M HCl solution. Carefully add HCl in small increments until the pH of the solution has been lowered by precisely 2 units or no significant change continues to occur. Record the volume of HCl that was used. There is no need to print a copy of the graph, but either print the data table or copy the data into your lab notebook.
Part II Prepare and Test Buffer Solution B
12. Use your calculations from the Pre-Lab Exercise to prepare 50 mL of Buffer B. Weigh out the precise mass of sodium acetate and dissolve it in 50.0 mL of 1.0 M acetic acid solution. If necessary, refill the burets of NaOH and HCl solution.
13. Use a graduated cylinder to measure out 10.0 mL of the Buffer B solution. Repeat the necessary steps to test Buffer B in a manner similar to the Part I trials. Print a copy of your graph of the titration using the NaOH solution. Record the volume of HCl that was used to lower the pH of Buffer B by 2 units or until no significant change continues to occur.
172
Buffers Lab Report:
Your lab report should include the following sections:
Abstract:
Report the buffer capacity (defined below) for each of your buffers
Introduction:
Include a statement of purpose for this experiment, relevant conceptual
background, balanced chemical reactions, and show how buffers react with a
strong acid and with a strong base.
Data:
Include a summary of the collected data in the form of a data table. This does not
mean you should attach your raw data to your report. Summarize the data to
include those data points that are used to calculate the buffer capacity.
Results:
Include the graph of pH vs. volume of NaOH added for both buffer A and B.
Buffer capacity has a rather loose definition, yet it is an important property of
buffers. Use your data to determine the buffer capacity of Buffer A and Buffer B
and include this in the results section. Keep in mind this will be different for acid
and base. Using the moles of acid required to lower the pH by 2 and the moles of
base required to increase the pH by 2, the equation below can be used to express
buffer capacity:
Buffer capacity = moles of acid or base added / change in pH
Discussion:
Discuss the experiment and any possible sources of error
Answer the following questions as part of your discussion:
1. Say, for example, that you had prepared a Buffer C, in which you mixed 8.203
g of sodium acetate, NaC2H3O2, with 100.0 mL of 1.0 M acetic acid.
a. What would be the initial pH of Buffer C?
b. If you add 5.0 mL of 0.5 M NaOH solution to 20.0 mL each of Buffer
B and Buffer C, which buffer’s pH would change less? Explain. 2. If you wanted to carry out an experiment at ‘physiological pH’ (7.4) could you
suggest an appropriate buffer system? (Hint: The blood buffer system is incredibly complex, and does not make for a good buffer system in the lab)
3. Why were the buffers asymmetric – that is they seemed to handle added sodium hydroxide with relatively small changes in the pH while small quantities of HCl caused the pH to decrease substantially?
Submit your report on time and to your TA in the dropbox
on D2L.

173
Pre-lab: Determination of the Ksp of Calcium Hydroxide
Part A
Answer the following questions in your lab notebook (be sure to show your work for any
calculations):
1. Write the molecular balanced chemical equation and the net ionic equation for the
reaction between Ca(OH)2(aq) and HCl(aq).
2. What is the mole ratio between [OH-] and [H
+]; between [Ca
2+] and [H
+]?
3. The molar solubility of a slightly soluble ionic compound M2X3 is 2.8 x 10⁻⁶
M.
Determine the value of Ksp.
4. Which of the saturated solutions below would have the highest [OH-]?
a. M(OH)2 Ksp = 4.25 x 10⁻⁶
b. M(OH)2 Ksp = 7.39 x 10⁻⁴
c. M(OH)2 Ksp = 2.64 x 10⁻³
d. M(OH)2 Ksp = 8.52 x 10⁻⁸
5. Which of the saturated solutions shown in question 4 would have the lowest pH?
Part B
Prepare your notebook for the lab. This includes stating the purpose of the experiment,
summarizing the procedure in a bulleted-list format (be sure to include space for observations)
and preparing any tables necessary for data collection.
At the start of your lab, remove the copies of the pages where you
completed the above work from your lab notebook and turn them into
your TA.

174
Lab: Determination of the Ksp of Calcium Hydroxide
From Advanced Chemistry with Vernier, Vernier Software & Technology, 2004
INTRODUCTION Calcium hydroxide is a strong base that is sparingly soluble in water. In solution it completely
dissociates into ions as represented by the following balanced chemical equation:
Ca(OH)2 (s) ↔ Ca
2+
(aq) + 2OH–
(aq)
The solubility product expression describes, in mathematical terms, the equilibrium that is
established between the solid substance and its dissolved ions in an aqueous system. The
equilibrium expression for calcium hydroxide is shown below.
Ksp = [Ca
2+][OH
-]2 (Equation 1)
The constant that quantifies a substance’s solubility in water is called the solubility product Ksp.
All compounds, even highly soluble ones like sodium chloride, have a Ksp. However, the Ksp of a
compound is usually only considered in cases where the compound is slightly soluble and thus
the concentration of solvated ions is small.
The primary objective in this experiment is to test a saturated solution of calcium hydroxide and
use your observations and measurements to calculate the Ksp of the compound. You will do this
by three methods: The first will be to determine the concentration of Ca(OH)2 by titrating with a
standardized hydrochloric acid solution. By determining the molar concentration of dissolved
hydroxide ions in the saturated Ca(OH)2 solution and assuming they all come from calcium
hydroxide, you will have the necessary information to calculate the Ksp. The second method will
be to measure the pH of the saturated solution and calculate the concentration of the OH-(aq) ions
and use that information to determine the Ksp. The third method will use gravimetric analysis to
determine the quantity of Ca(OH)2 dissolved in a known volume of solution. The mass of
dissolved solid can be used to determine the solubility and thus the Ksp of Ca(OH)2.
OBJECTIVES
In this experiment, you will use three separate methods to determine the Ksp of calcium hydroxide and will compare the ease of use and reliability of the three
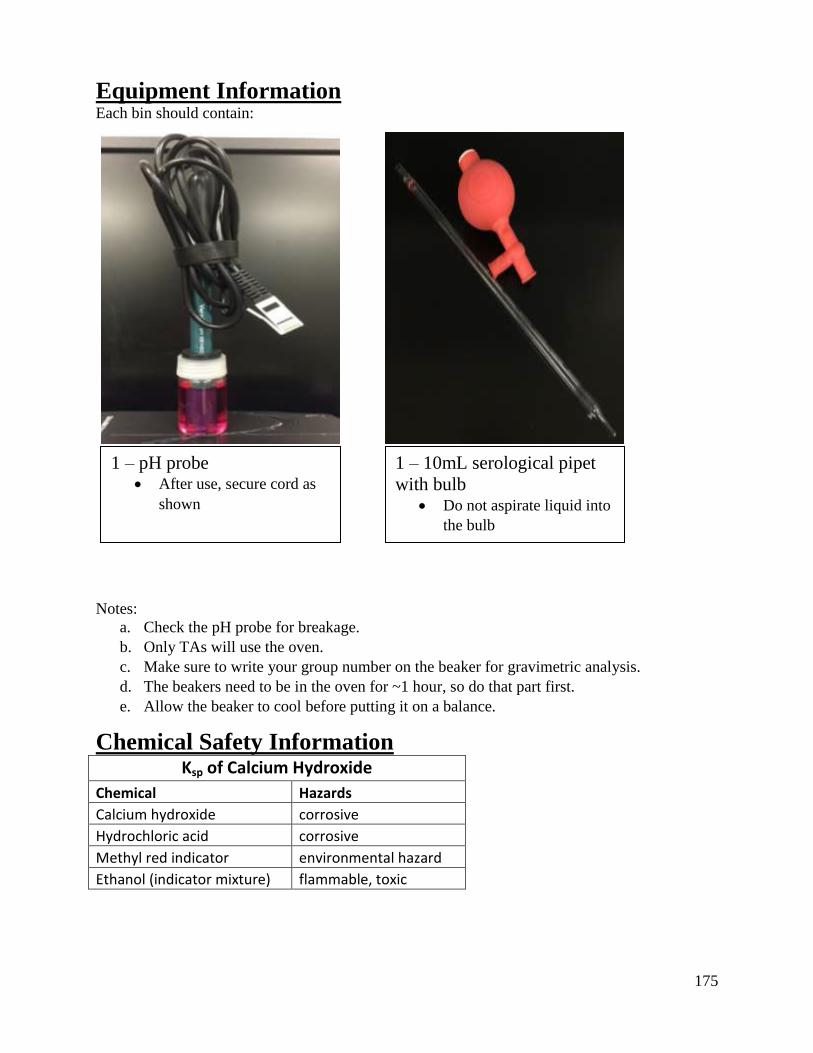
175
Equipment Information Each bin should contain:
Notes:
a. Check the pH probe for breakage.
b. Only TAs will use the oven.
c. Make sure to write your group number on the beaker for gravimetric analysis.
d. The beakers need to be in the oven for ~1 hour, so do that part first.
e. Allow the beaker to cool before putting it on a balance.
Chemical Safety Information Ksp of Calcium Hydroxide
Chemical Hazards
Calcium hydroxide corrosive
Hydrochloric acid corrosive
Methyl red indicator environmental hazard
Ethanol (indicator mixture) flammable, toxic
1 – pH probe After use, secure cord as
shown
1 – 10mL serological pipet
with bulb Do not aspirate liquid into
the bulb

176
PROCEDURE
CAUTION: Calcium hydroxide solution is caustic. Avoid spilling it on your skin or clothing.
1. Obtain and wear goggles.
2. Obtain about 50 mL of a saturated calcium hydroxide solution.
3. Set up a ring stand, ring, filter funnel, and filter paper as demonstrated by your instructor.
Filter your sample of Ca(OH)2 and transfer to a clean beaker. When you are done with
the filtering apparatus, be sure to clean the flask out with ~5 mL of acid. The acid rinse
should be deposited in the waste receptacle. Follow the acid rinse up with a thorough rise
with distilled water.
Method 1 - Gravimetric Determination (begin one lab period in advance)
1. Using a 25 mL graduated cylinder transfer exactly 20 mL of the filtered solution into a
pre-weighed and labeled 250 mL beaker. The beaker must be labeled with your section
number and your drawer number.
2. Place the beaker in the warming oven until the end of the lab period.
3. After the drying period, determine the mass of the beaker plus dry calcium hydroxide and
by difference, the mass of the calcium hydroxide.
Method 2 - Determination by pH
1. Connect a pH Sensor to Channel 1 of the Vernier computer interface. Connect the
interface to the computer using the proper interface cable.
2. Start the Logger Pro program on your computer and allow the default program to open.
3. Calibrate the pH probe following this procedure:
Use the 2-point calibration option of the Vernier data-collection program.
Rinse the tip of the electrode in distilled water. Place the electrode into
one of the buffer solutions (e.g., pH 7). When the voltage reading
displayed on the computer or calculator screen stabilizes, enter a pH value,
“7”.
For the next calibration point, rinse the electrode and place it into a second
buffer solution (e.g., pH 10). When the displayed voltage stabilizes, enter
a pH value, “10”.
Rinse the electrode with distilled water. It is now ready to be placed in the
sample to be measured.
4. Using the remaining 30 mL of the filtered solution in a 100 mL beaker and measure and
record the pH of the filtered solution in your lab notebook. Retain this solution.

177
Method 3 - Determination by Titration
1. Using a 10 mL volumetric pipette, measure exactly 10 mL of the filtered solution from
“Method 2” into a 250 mL beaker.
2. Add 3 drops of the methyl red indicator solution. The solution will turn yellow.
3. Obtain about 70 mL of 0.050 M HCl solution.
4. Connect a buret to the ring stand. Rinse the buret with ~10 mL of the acid before filling it
with the 0.0500 M HCl solution.
5. Record the initial volume of HCl in your buret to 0.01 mL as usual.
6. Using a glass stirring rod to stir the solution, semi-rapidly titrate your Ca(OH)2 sample
with the HCl until the indicator starts to turns pink. Begin adding the HCl dropwise until
the whole solution just turns pink in color that persists for 20 seconds.
7. Record the final volume of HCl in your buret and determine the volume of HCl used in
the titration (by difference).
8. Dispose of the reaction mixture in the labeled waste bottle in the fume hood
9. Repeat the steps above to titrate a second sample of the filtered Ca(OH)2 solution.
10. If the volume of HCl used in the two titrations differs by more than 10%, do a third
titration.

178
PROCESSING THE DATA
Calculations:
Determination of Ksp using the pH of the solution
Use the pH to determine the [OH-]. With the balanced chemical equation defining
the dissolution of Ca(OH)2 use the [OH-] to determine the [Ca
2+], assuming that
both ions came from calcium hydroxide. Substitute the values into equation 1 to
determine the Ksp.
Gravimetric determination of Ksp.
Determine the mass of dissolved solid. Calculate the solubility of the solution (M)
using the mass of dissolved solid, the volume of solution used in the analysis, and
the molar mass of calcium hydroxide. Substitute the molar solubility into a
version of equation 1 [Hint: use an ICE table] to determine the Ksp.
Determination of Ksp through titration.
Using the concentration and volume of HCl used, determine the [OH-] in the
saturated solution. Again use the balanced chemical equation to link the [OH-] to
[Ca2+
] and assume calcium hydroxide was the only source of both. Substitute the
concentrations into equation 1 to determine the Ksp.

179
Determination of the Ksp of Calcium Hydroxide Lab Report:
Your report for this lab should include the following sections:
Abstract
Give the Ksp for the three methods and suggest which method seems most reliable,
or if all seem equally valid, say so and average the three results to obtain a “best
value”. In either case, provide the percent error.
Introduction:
Include a statement of purpose for this experiment, relevant conceptual
background, and give the equations and a short description of the use of
equilibrium constant expressions in calculating solubility
Data:
Include 3 data tables, one for each method used to determine the Ksp
Results:
Calculate the values of Ksp for each method. Construct a data table summarizing
the results. If all three methods produced similar values for Ksp, provide an
average.
Discussion:
Use the data in Appendix II of your test book to determine the accepted value for
the Ksp. Calculate your percent error with respect to each result. Speak about
which method provided you the most accurate results and why you think that
particular method was more accurate and the others were not. (Or conclude that
all three seemed to work – under what conditions would this seem to be a valid
conclusion?)
In addition, answer the following question as part of your discussion:
1. Predict how each of the following “mistakes” would affect the value of the measured Ksp
and provide reasoning for your response. Choose the best statement for each scenario.
a) The buret was inadvertently left wet with water from cleaning.
The measured Ksp would be lower than the true value
The measured Ksp would be higher than the true value
The measured Ksp would be same as the true value
b) Using phenolphthalein as the indicator instead of methyl red.
The measured Ksp would be lower than the true value
The measured Ksp would be higher than the true value
The measured Ksp would be same as the true value
Submit your report on time and to your TA in the dropbox
on D2L.
180
Pre-lab: Thermodynamics of the Solubility of Potassium
Nitrate
Part A
Answer the following questions in your lab notebook (be sure to show work for
any calculations):
1. What is ΔG? What does the sign of ΔG tell you about the spontaneity of a reaction?
2. A researcher wants to make a solution of AgCl and water at 75 °C. For solid AgCl at
75°C, Ksp = 1.5 x 10⁻⁵
.
a. Calculate the free energy change associated with making a saturated solution of
AgCl in water at 75 °C.
b. How many grams of AgCl will dissolve in 1.0 L of water at 75 °C?
3. The Ksp for Ag2CrO4 is 9.0 x 10
-12. If 200 mL of 0.0050 M AgNO3
is combined with 300
mL of 0.0020 M K2CrO4, will a precipitate form?
4. Do you expect the dissolution of KNO3 to be endothermic or exothermic? Use Appendix
II in your text to calculate ΔHdissolution.
5. Do you expect the dissolution of KNO3 to have a positive or negative ΔS? Use Appendix
II in your text to calculate ΔSdissolution.
Part B
Prepare your notebook for the lab. This includes stating the purpose of the
experiment, summarizing the procedure in a bulleted-list format (be sure to include
space for observations) and preparing any tables necessary for data collection.
At the start of your lab, remove the copies of the pages where you
completed the above work from your lab notebook and turn them into
your TA.
181
Lab: Thermodynamics of the Solubility of Potassium Nitrate In this experiment, you will measure the solubility of KNO3 as a function of temperature. The data collected will be used to determine the Ksp, enthalpy, entropy and free energy of dissolution.
When a salt dissolves in water it will dissociate into ions. In aqueous solution potassium
nitrate (KNO3) dissociates according to the following reaction.
KNO3(s) K+
(aq) + NO3-(aq)
As the concentration of dissolved K+ and NO3
- increases, the rate at which the ions will
recombine into solid potassium nitrate, KNO3, also increases. At one set of ion concentrations
the rate of dissolution will equal the rate of precipitation. At this point the reaction is said to be at
equilibrium. The solution is now considered saturated. An equilibrium expression, Ksp, for this
process is shown in equation (1).
Ksp = [K+][NO3
-] (Equation 1)
The value for Ksp is characteristic of each compound and changes with the temperature.
Thermodynamics may be used to understand the energy changes that occur when a salt
dissolves in water. The energy difference between the solid salt and its dissolved ions is known
as the enthalpy change (ΔH), and the relative disorder of the dissolved ions is an indication of the
entropy change (ΔS). A positive enthalpy change will occur if heat must be added to dissolve the
salt in water. The enthalpy change will be negative if the dissolution process releases heat. The
entropy change for a solid salt dissolving in water will always be positive because the dissolved
ions possess more disorder than a solid crystalline salt.
The free energy change (ΔG) for a process will indicate if the process is spontaneous as
written (reactants going to products). A negative value indicates that the process is spontaneous
while a positive value denotes a nonspontaneous process. The Gibbs-Helmholtz equation, shown
in Equation 2, is a mathematical expression that relates changes in free energy, enthalpy, and
entropy.
ΔG = ΔH - TΔS (Equation 2)
ΔG can also be expressed in terms of Ksp , (equation 3).
ΔG = -RTlnKsp (Equation 3)
By combining Equations 2 and 3, it is possible to derive an equation that relates Ksp and the
Kelvin temperature to the values associated with ΔH and ΔS (equation 4).
R
S
TR
HlnK sp
1 (equation 4)

182
By plotting lnKsp versus 1/T, we get a line where the slope of the line is –ΔH/R and the y-
intercept is ΔS/R (R is the ideal gas constant 8.314 J∙mol-1
∙K-1
). The enthalpy and entropy of
dissolution can be determined by evaluating the temperature dependence of Ksp.
OBJECTIVES
In this experiment, you will
Determine the solubility of KNO3 as a function of temperature Use the solubility data to determine the Ksp for the dissolution of KNO3 Use the data and Equations 4 and 2 to calculate ΔG, ΔH and ΔS for the dissolution process
Equipment Information
Each bin should contain:
Notes:
a. Hot water bath is not waste. It should be poured down the drain unless
contaminated.
Chemical Safety Information Thermodynamics of the solubility of potassium nitrate
Chemical Hazards
Potassium nitrate oxidizer
1 – copper stirrer Use for stirring
1 – 10mL graduated
cylinder
1 – temperature probe After use, secure cord
as shown

183
PROCEDURE
1. Obtain and wear goggles.
2. Connect a Temperature Probe to Channel 1 of the Vernier computer interface.
3. Start the Logger Pro program on your computer. Allow Logger Pro to open the default program. It should list columns for collecting time and temperature.
4. Prepare a hot water bath by heating a halffilled 400 mL beaker on a hot plate
5. Mass ~2 grams of potassium nitrate and record the actual mass in your lab book.
6. Transfer the salt into your 10 mL graduated cylinder.
7. Add distilled water to 2 mL in your graduated cylinder and observe if the dissolution of KNO3 is an exothermic or endothermic process (feel the outside of the cylinder).
8. In your hot water bath, while stirring gently with the temperature probe, heat the cylinder containing the salt and water mixture. Do not leave it in the water any longer than necessary to get the salt into solution.
9. Remove your sample from the hot water bath and record the total volume of the solution (only do this after all the salt has gone into solution and do not forget to remove the temperature probe from the solution when measuring the volume).
10. While monitoring the temperature, allow the sample to cool while slowly stirring. Record the temperature at the point when the first crystals appear. The solution will appear to be “snowing.” The solution is considered to be at equilibrium when the first crystals begin to appear. At higher concentrations the process happens quite quickly.
11. Remove the probe and add 0.5 mL of distilled water. Be careful not to lose solid as you remove the thermometer probe from the cylinder to add the water.
12. Repeat steps 8 - 11 four more times until a total of 5 sets of data at different concentrations have been recorded.
13. Disposal: Place the KNO3 solution into the waste jar labeled “KNO3 Waste.” For easier removal of the KNO3 reheat the solution until the entire solid has re-dissolved and quickly pour it into the waste jar. In this case, the water can be evaporated and the potassium nitrate reused.

184
PROCESSING THE DATA
For each set of data, calculate the molar concentration of KNO3, and use that value to deduce
both K+
(aq), and NO3 –
(aq) concentrations. Use equation (1) to calculate the Ksp for each data set.
Substitute Ksp into equation (3) to calculate ΔG for each data set.
Determine the natural logarithm (ln) of the Ksp at each temperature. After converting all
temperatures into Kelvin, calculate the reciprocal of each temperature (1/T). Using a spreadsheet
program (Logger Pro has this capability or you can use Excel) construct a graph with the y-axis
being lnKsp and the x-axis being 1/T. Determine the best linear fit of the data using linear
regression and record the slope and intercept in your notebook.
From your graph, determine the values for ΔH and ΔS. Equation 4 shows that ΔH of the reaction
can be determined using the slope of the straight line from the graph, while ΔS of the reaction
can be determined from the y-intercept.

185
Thermodynamics of the Solubility of Potassium Nitrate Lab Report:
Your report for this lab should include the following sections:
Abstract:
Report the ΔH and ΔS values with percent error
Introduction:
Include a statement of purpose for this experiment, relevant conceptual
background, and give the equations and a brief description of how they are used
to obtain the thermodynamic properties in this experiment
Data:
Include a copy of the graph with the data indicating the slope and y-intercept
Results:
Calculate the values of solubility, Ksp and ΔG for each temperature data set. From
the graphical analysis of your data calculate values for ΔH and ΔS. Be sure to
attach your calculations to the end of your report.
Discussion:
Use the data in Appendix II of your text book to calculate the ΔHº and ΔSº for the
dissolution of KNO3. Calculate your percent error with respect to each result: ΔH
and ΔS. Discuss the experiment and any possible sources of error
Answer the following question as part of your discussion:
1. Compare the signs of your experimental thermodynamic values with your expectations
from the prelab.
a. Did you expect the dissolving process to be spontaneous? Do your data confirm your hypothesis?
b. Was this process endothermic or exothermic? Does this observation match your calculated enthalpy values?
c. Did you expect this process to result in an increase or decrease in disorder? How does this compare with your calculated entropy values?
Submit your report on time and to your TA in the dropbox
on D2L.
186
Pre-lab: Redox Titration: Analysis of a Commercial Bleach
Part A
Answer the following questions in your lab notebook (be sure to show your work
for any calculations):
1. Define oxidation. Define reduction. [OIL RIG/Leo the lion goes Ger?]
2. Write balanced oxidation and reduction half-reactions for the following redox reaction
equations. For each half-reaction, identify which substance is oxidized and reduced.
Eqn 1: MnO4 - + S2O3
2- S4O6 2- + Mn
2+
Eqn 2: MnO4 - + C2O4
2- MnO2 + CO2
3. Use the equations given below in the introduction of this experiment to determine the
mole ratio of thiosulfate (S2O32-
) to hypochlorite (ClO-).
4. 5.00 mL of commercial bleach was diluted to 100.0 mL. 25.0 mL of the diluted sample
was titrated with 4.56 mL of 0.100 M S2O32-
. What is the concentration of hypochlorite in
the original bleach solution? Assume the density of the commercial bleach is 1.08 g/mL.
Calculate the average percent by mass of NaClO in the commercial bleach.
Part B
Prepare your notebook for the lab. This includes stating the purpose of the
experiment, summarizing the procedure in a bulleted-list format (be sure to include
space for observations) and preparing any tables necessary for data collection.
At the start of your lab, remove the copies of the pages where you
completed the above work from your lab notebook and turn them into
your TA.

187
Lab: Redox Titration: Analysis of a commercial Bleach Solution
Many commercially available consumer products, such as bleaches and hair coloring agents,
contain oxidizing agents. The most common oxidizing agent in bleach is sodium hypochlorite,
NaClO (sometimes written NaOCl). Commercial bleach is made by bubbling chlorine gas
through a sodium hydroxide solution. Some of the chlorine is oxidized to the hypochlorite ion,
ClO-, and some is reduced to the chloride ion, Cl
-. The solution remains strongly basic. The
balanced chemical equation for the process is:
Cl2(g) + 2 OH-(aq) ClO
-(aq) + Cl
-(aq) + H2O(l)
The amount of hypochlorite ion present in a solution of bleach can be determined by an
oxidation-reduction titration. One of the best methods is the iodine-thiosulfate titration
procedure. The iodide ion, I-, is easily oxidized by almost any oxidizing agent. In acidic solution,
hypochlorite ions oxidize iodide ions to form iodine, I2. The iodine that forms is then titrated
with a standard (known concentration) solution of sodium thiosulfate. The analysis takes place in
a series of steps:
1. An acidified iodide ion solution is added to hypochlorite ion solution and the iodide is
oxidized to iodine (hypochlorite is quantitatively converted to iodine).
2 H+(aq) + ClO
-(aq) + 2 I
-(aq) Cl
-(aq) + I2(aq) + H2O(l)
2. Iodine is only slightly soluble in water, but it dissolves very well in an aqueous
solution of iodide ion, in which it forms a complex ion called the triiodide ion.
Triiodide is a combination of a neutral I2 molecule and an I- ion. The triiodide ion is
yellow in dilute solution and dark red-brown when concentrated.
I2(aq) + I-(aq) I3
-(aq)
3. The triiodide is titrated with a standard solution of thiosulfate ions, that reduce the
iodine back to iodide ions.
I3-(aq) + 2 S2O3
2-(aq) 3 I
-(aq) + S4O6
2-(aq)
During this last reaction the red-brown color of the triiodide ion fades to yellow and then the
color disappears when you reform the clear iodide ion solution. It is possible to use the
disappearance of the color of the triiodide ion as the method of determining the end point, but
this is not a very sensitive procedure (it’s hard to tell when the yellow color just disappears).
Addition of starch to a solution that contains iodine or triiodide ion forms a reversible blue
complex. The disappearance of this blue colored complex is a much more sensitive method of
determining the end point. However, if the starch is added to a solution that contains a high
concentration of iodine, the complex that forms may not be reversible. Therefore, the starch is
not added until shortly before the end point is reached (light yellow solution). Then the solution
turns blue and you titrate until the blue color goes away. The volume of thiosulfate used during
the titration and its known concentration are converted to moles which are related to moles of
hypochlorite through reactions 3, 2, and 1, and the hypochlorite concentration is calculated.

188
Equipment Information There are no bins this week.
Chemical Safety Information Bleach Lab
Chemical Hazards
Dilute bleach corrosive, environmental hazard
Potassium iodide toxic
Sodium thiosulfate none
Starch solution none
Hydrochloric acid corrosive
PROCEDURE
1. Obtain about 100 mL of diluted commercial bleach. Note that this bleach solution has been
made by diluting 3.5 mL of commercial bleach into 100 mL, meaning that the sample you
are working with is 20 times more dilute than the commercial strength. You will need to
scale back up for the final answer to this experiment.
2. Weigh out approximately 1 g solid KI. This is a large excess over what is needed.
3. Pipet 25.00 mL of the dilute bleach into an Erlenmeyer flask. Add the solid KI and about
25 mL distilled water. Swirl to dissolve the KI.
4. Working in a fume hood, slowly and with swirling, add approximately 2 mL of 3 M
HCl. The solution should be dark yellow to red-brown from the presence of the I3- complex
ions.
5. Obtain 70 mL of the sodium thiosulfate solution and use a few mL to rinse your buret, then
fill it as usual. Record the concentration of the thiosulfate in your lab notebook. Bring the
red-brown triiodide solution back to your bench and titrate the iodine with the standard
0.10 M sodium thiosulfate solution until the iodine color becomes light yellow. Add one
dropper-full of starch solution. The blue color of the starch-iodine complex should appear.
Continue to titrate until one drop of Na2S2O3 solution causes the blue color to disappear.
6. Repeat the titration, beginning with step 2, two more times.

189
PROCESSING THE DATA
1. Use the equations given in the introduction to determine the mole ratio of sodium thiosulfate
to sodium hypochlorite.
2. Using the volume of sodium thiosulfate needed for titration of 25.00 mL of diluted bleach,
calculate the molarity of the diluted bleach (hypochlorite ion).
3. Calculate the molarity of the hypochlorite ion in commercial bleach (undiluted).
4. Assuming that the density of the commercial bleach is 1.08 g/mL, calculate the percent by
mass of NaClO in the commercial bleach.
5. Calculate the average percent by mass of NaClO in commercial bleach from your three trials.
6. Read the label of the commercial bleach to find the percent by mass NaClO that is reported.
Calculate the percent error of your value, assuming that the label value is correct.

190
Analysis of a Commercial Bleach Solution Lab Report:
Your lab report should include the following sections:
Abstract:
Be sure to provide a percent by mass of sodium hypochlorite in bleach and the
percent error in your measurement
Introduction:
Include a statement of purpose for this experiment, relevant conceptual
background, and include the relevant reactions and information as to how the
concentration of sodium hypochlorite is determined
Data:
Include the recorded concentration of the thiosulfate standard used for the
titration, the labeled value of the concentration of commercial bleach and any data
tables necessary for the completion of the lab.
Results:
Tabulate your results for the calculated concentration of bleach, its labeled value
and the percent error. Attach your calculations to the end of your report.
Discussion:
Discuss the experiment and any possible sources of error.
Submit your report on time and to your TA in the dropbox
on D2L.

191
Pre-lab: Synthesis of Acetaminophen
Part A
Answer the following questions in your lab notebook (be sure to show your work
for any calculations):
1. Write the balanced chemical equation for the synthesis of acetaminophen from p-
aminophenol and acetic anhydride.
2. Starting with 1.5 grams of p-aminophenol and an excess of acetic anhydride, calculate the
theoretical yield of acetaminophen in grams. It will be necessary to look up the molecular
formulas of both the limiting reactant and the product (online?).
Part B
Prepare your notebook for the lab. This includes stating the purpose of the
experiment, summarizing the procedure in a bulleted-list format (be sure to include
space for observations) and preparing any tables necessary for data collection.
At the start of your lab, remove the copies of the pages where you
completed the above work from your lab notebook and turn them into
your TA.

192
Synthesis of Acetaminophen
Acetaminophen (N-(4-hydroxyphenyl)ethanamide) is a relatively simple organic compound that
is a common over-the-counter pain reliever and fever reducer (Figure 1). Acetaminophen is
generally considered a safe medication in the U.S. although overdoses are relatively common
and can cause fatal liver damage. Organic compounds such as Acetaminophen are generally
classified by their functional groups. Acetaminophen consists of a benzene ring core that has a
hydroxyl functional group (-OH) attached to one side and an amide functional group (Figure 2)
on the opposite side (referred to as the para position see Figure 1).
Figure 1. The molecular structure of Acetaminophen. The apex and juncture of
each line represents a carbon atom potentially bound with various numbers of
hydrogen to give each carbon a total of four bonds.
Figure 2. The structure of an amide. R, R’ and R” represent various other organic
groups or carbon chains. Find the amide group in Figure 1.
The synthesis of acetaminophen is performed by reacting p-aminophenol with acetic anhydride.
A byproduct of this reaction is acetic acid as shown Figure 3. In this lab, you will start with 1.5
grams of p-aminophenol to synthesize the crude acetaminophen product. The crude product will
be purified through a common technique called recrystallization. Recrystallization involves
dissolving a crude product in a minimal amount of hot solvent. Once the solution cools, a more
pure form of your product will recrystallize (precipitate) out of solution.
One way of assessing the purity of a substance is through Thin Layer Chromatography (TLC).
TLC is a method that can be used to separate nonvolatile components of a mixture. In this
process, a sample is applied to a “stationary phase” (filter paper, coated plastic…). A solvent,
the “mobile phase” is allowed to pass along the stationary phase through the sample. Depending
on the relative solubility of the mixture components, different substances will travel further along
the stationary phase than others, resulting in separation of the components of the mixture.
Solutes with greater affinity for the mobile phase spend longer in the mobile phase and will thus
move faster than solutes that prefer the stationary phase. A formula can be used to calculate the
relative movement of the parts of the mixture by the following equation:

193
The relative movement of the components is called the retention factor, symbolized Rf. The
distance traveled by one compound is measured from its point of origin to the center of the spot.
The distance traveled by the solvent is measured from the point of origin to the highest point that
mobile phase traveled. Rf values may change from day to day due to temperature differences,
changes in humidity, or variations in the paper or solvent. Their relative values should remain
constant. You will be comparing your final acetaminophen produce with the raw unpurified
sample and a given sample of pure unreacted p-aminophenol.
Figure 3. Synthesis reaction of acetaminophen.
Safety Precautions: Wear safety glasses or goggles at all times in the laboratory.
Acetic anhydride is corrosive and its vapor is irritating to the respiratory system. Avoid
skin contact and inhalation of the vapors. In the event of skin contact, rinse well with cold
water. If the vapors are inhaled, move to an area where fresh air is available.
Phosphoric acid is corrosive. Avoid skin contact. In the event of skin contact, rinse well
with cold water.
p-aminophenol is harmful by inhalation and by contact with the skin. In the event of skin
contact, rinse well with cold water. If the vapors are inhaled, move to an area where fresh
air is available.
NOTE: Don't use your acetaminophen for a headache! Its purity is not assured.
solvent by the traveledDistance
solute by the traveledDistanceRf

194
Equipment Information Each bin should contain:
Notes:
a. Do not put standards in the well plate. The solvent used will degrade the
plastic.
b. Phosphoric acid is very corrosive.
Chemical Safety Information Synthesis of Acetaminophen
Chemical Hazards
P-aminophenol toxic, health and environmental hazard
Ethanol flammable, toxic
Phosphoric acid corrosive
ethyl acetate flammable, toxic
hexanes flammable, toxic, health and environmental hazard
Acetic Anhydride flammable, corrosive, toxic
Acetaminophen toxic, health and environmental hazard
1 – well plate

195
Procedures: Synthesis of Acetaminophen
1. Weigh out 2.5 g of p-aminophenol. Place it in a 125-mL Erlenmeyer flask.
2. Add 25 mL of water and 25 drops of 85% H3PO4.
3. Gently heat to dissolve.
4. Move to the hood once all of the solid has dissolved. Working in the hood, while swirling
the flask add 2 mL of the acetic anhydride. Allow this to react for 5 minutes.
5. Place the mixture on ice and allow the solid to crystalize for 20 minutes. If crystallization
does not occur, it may be necessary to scratch the side of the flask with a stir rod or add a
small seed crystal of pure acetaminophen (ask your TA).
6. Collect the crystals by vacuum filtration using a Buchner funnel.
7. Wash the crystals twice on the filter with 5 mL portions of ice cold water.
Recrystallization of the Acetaminophen
1. Place the crude acetaminophen crystals in a clean 150 mL beaker. Add 20 mL of distilled
water and heat on a hot plate until all of the solid has dissolved. If the solution starts to
boil and undissolved solid still remains, add more water, a few mL at a time until the
solid dissolves.
2. Remove the beaker from the heat and allow the solution to cool. When crystals begin to
appear, put the solution on ice, cooling for 20 minutes. If crystallization does not occur, it
may be necessary to scratch the side of the flask with a stir rod.
3. Collect the crystals on a pre-weighed piece of filter paper using the Buchner funnel.
Wash the product on the filter paper with two 5 mL portions of ice cold water. Allow the
purified product to dry for 10 minutes under vacuum.
4. Weigh the product. It may be necessary to dry for a few more minutes, if it still appears
wet. Record the final dry weight in your lab notebook for the calculation of % yield.
TLC of the Acetaminophen Sample
1. In separate clean test tubes, dissolve a small spatula full (less than the ½ the size of a
small pea) of p-aminophenol, your crude product and your purified product in 1 mL of
ethanol.
2. Using a pencil, carefully draw a line roughly 2 cm from the bottom of the
chromatography plate. Make marks along this line at approximately 1 cm intervals. You
should have three marks (one for p-aminophenol, one for the raw sample and one for the
purified).
3. Label the spots on the bottom line to indicate the identity of each sample
4. Utilize a clean toothpick to transfer your dissolved samples on to the TLC plate. This is
done by dipping the toothpick in your sample and quickly tapping the toothpick to the
corresponding spot on the TLC sheet. Allow the solvent to dry and repeat the transfer
procedure 15 times.
5. Place about 1 cm of aqueous ethyl acetate mobile phase in a 250 ml beaker. The solution
must not go above the 2 cm mark on the TLC plate or touch the spots when the paper is
placed in the beaker.

196
6. Carefully prop the chromatography paper in the beaker. The solvent will wick up the
plate.
7. When the mobile phase comes to within 1 cm of the top of the TLC plate, remove the
TLC plate from the beaker.
Immediately mark the position
solvent front with the pencil.
8. Allow the TLC plate to dry in the
hood.
9. Illuminate the TLC plate with the
handheld UV lamp and circle the
spots as shown in the diagram on
the right.

197
Synthesis of acetaminophen Worksheet (no lab report)
_________________ g Mass of p-aminophenol
_________________ g Theoretical yield of acetaminophen (show your work below)
_________________ g Mass of pure product
_________________ % Percent yield (show your work below)
Roughly sketch what the TLC plate looks like when illuminated with UV light.
Origin
Solvent front

198
According to your TLC, is there a difference between your raw and purified sample? Explain.
During the crystallization of acetaminophen, what was the purpose of cooling the sample in an
ice bath?
Why should you use a minimum amount of hot solvent to dissolve the raw product during the
recrystallization step?
There is not a formal lab report for this lab. Complete the above pages
using the Microsoft version of this file that is available for download on the
lab D2L page. Once the worksheet is complete, submit the worksheet on
time and to your TA in the dropbox on D2L.

199
Pre-lab: Electrochemistry: Galvanic Cells and the Nernst
Equation
Name ___________________ TA’s Name_____________________
Below is a lab activity that is based on a series of virtual lab exercises and videos that have been
put together by The ChemCollective, an online resource for learning chemistry. To begin, please
visit the below website:
http://chemcollective.org/chem/electrochem/index.php
The above link will lead you through a series of activities aimed at improving your
understanding of Galvanic Cells. First you will take a series of observations to determine if
process is spontaneous. Based upon those observations, you will create an activity series, listing
the metals in order of their reactivity. Second, you will construct a series of virtual galvanic cells
and use those to power a stopwatch. Third, you will determine the standard reduction potential
of an unknown metal; comparing its reduction potential to a standard list, you will identify the
unknown. Finally, you will create a situation in which the cells are not in the standard condition
and measure the cell potential; using the Nernst equation, you will determine the concentration
of an unknown solution.
Introduction
Please read the introduction page. Once finished, click on the link in the bottom right
of the page to progress to the next page.
Step 1: - Investigating redox reactions of some metals and solutions of metal salts
Activity: Investigating redox reactions. After watching the video “Zinc strip in copper nitrate solution”, and reading the
instructions, click on the link labeled “start” just below the drawing of the pencil tip.
Follow the direction to complete the 3x3 grid. Answer the below questions for the
portion of the activity in which Sn(s) is placed in AgNO3(aq)
1. Is there a reaction? (circle the correct response) Yes / No
2. How many electrons are transferred ___
3. Write the balanced redox reaction for the combination of AgNO3(aq) and Sn(s)
Once the 3x3 square is complete, click on the link in the bottom right of the page to
progress to the next page.
200
Step 1: - Practice with redox reactions
1. Of the five metal ions in the list, which is the most reactive?________
2. List the metal ions from the lowest to highest tendency to undergo reduction
Once finished, click on the link in the bottom right of the page to progress to the next
page.
Step 1: - Reduction tendencies of metal ions Read the description and answer the below questions.
1. Will Cu react with Ni2+
? (circle the correct response) Yes / No Why?
2. Will Sn react with Ni2+
? (circle the correct response) Yes / No Why?
Once finished, click on the link in the bottom right of the page to progress to the next
page.
Step 2: Explaining the electron transfer process Read the description and watch the two videos explaining Galvanic Cells
Once finished, click on the link in the bottom right of the page to progress to the next
page.
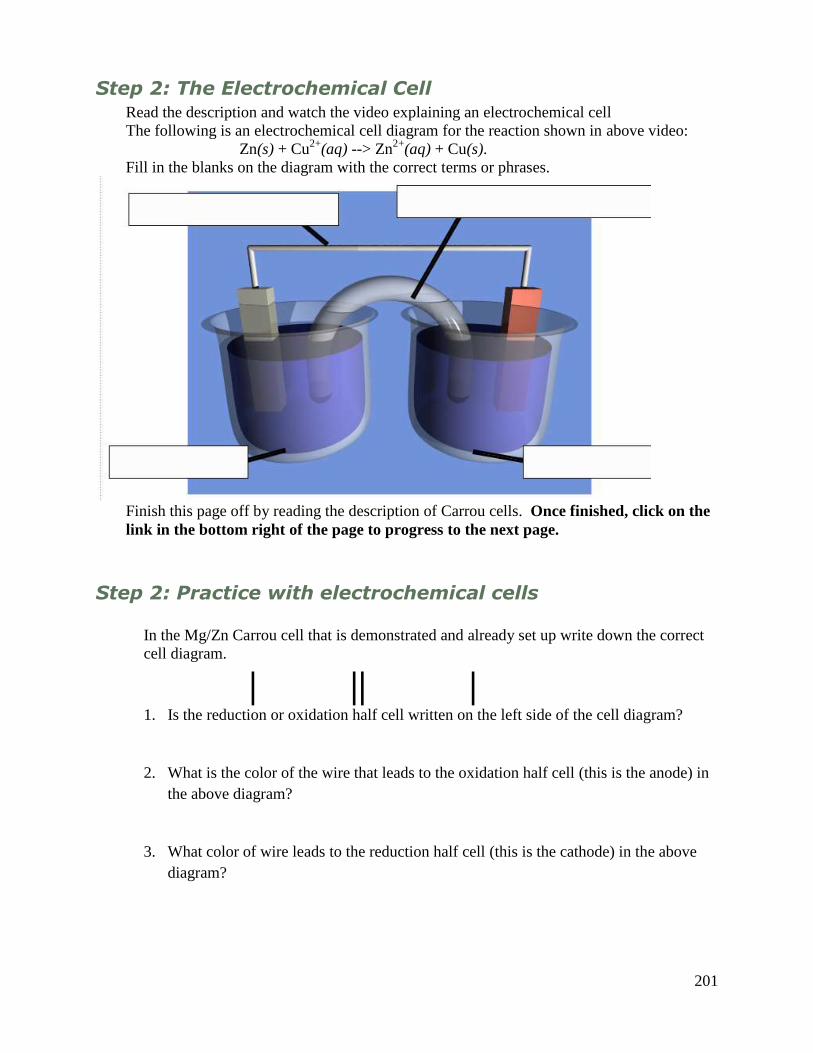
201
Step 2: The Electrochemical Cell Read the description and watch the video explaining an electrochemical cell
The following is an electrochemical cell diagram for the reaction shown in above video:
Zn(s) + Cu2+
(aq) --> Zn2+
(aq) + Cu(s).
Fill in the blanks on the diagram with the correct terms or phrases.
Finish this page off by reading the description of Carrou cells. Once finished, click on the
link in the bottom right of the page to progress to the next page.
Step 2: Practice with electrochemical cells
In the Mg/Zn Carrou cell that is demonstrated and already set up write down the correct
cell diagram.
| || |
1. Is the reduction or oxidation half cell written on the left side of the cell diagram?
2. What is the color of the wire that leads to the oxidation half cell (this is the anode) in
the above diagram?
3. What color of wire leads to the reduction half cell (this is the cathode) in the above
diagram?

202
Now, construct your own Carrou cell for the following cell Zn|Zn2+||Ag+|Ag. Please
remember that in order for the Carrou cell to function, a piece of paper must connect the
cells to each other through the well containing KNO3
4. What is the voltage of the Zn|Zn2+||Ag+|Ag voltaic Carrou cell (remember, when
correctly set up to be a galvanic cell, the voltage will be positive)?
5. What is the half reaction that is occurring at the cathode in the above cell?
6. Is this reduction or oxidation (circle the correct response)?
Once finished, click on the link in the bottom right of the page to progress to the
next page.
Step 2: Powering a stopwatch
Please watch the video showing that galvanic cells can be used to do useful work
Once finished, click on the link in the bottom right of the page to progress to the
next page.
Step 3: Measuring cell potentials
Please read the description and watch the video showing how the voltage is actually
measured using the Carrou cell. Construct a series of Carrou cells to determine the
standard cell potential for the listed combinations. Please input the voltages, with units,
in the below table.
Ag |Ag+ Cu |Cu2+ Sn | Sn2+
Ag+ | Ag Cu2+| Cu Sn2+| Sn
Once finished, click on the link in the bottom right of the page to progress to the
next page.
Step 3: Calculating cell potentials Please read the description to review how one can calculate the cell potential using a set
of standard reduction potentials.
Once finished, click on the link in the bottom right of the page to progress to the
next page.

203
Step 3: Practice with standard cell potentials
In this activity, you will measure the cell potential of a Carrou cell containing an a half
cell of unknown composition. Using the known half cell standard reduction potential,
you will determine the standard reduction potential of the unknown and identify it based
upon the table of standard reduction potentials that is linked below.
http://hyperphysics.phy-astr.gsu.edu/hbase/tables/electpot.html Read the description and create one or two Carrou cells using the unknown as one of the
half cells
1. What is the balanced half-cell reaction corresponding to the reduction of metal X?
2. What cell did you use for comparison (write the balanced half reaction)? What was
the voltage listed on the volt meter?
3. What value did you obtain for the half-cell reduction potential of metal X?
4. Referencing the linked table of standard reduction potentials, try to identify the
unknown metal.
Step 3: Applying standard cell potentials
Please read the description to review the table of standard reduction potentials is arranged
the way it is. Once finished, click on the link in the bottom right of the page to
progress to the next page.
204
Step 4: Cells in non-standard conditions
Please read the description about non-standard cells.
In the voltaic cell, Zn|Zn2+||Cu2+
|Cu, as the cell runs, what happens to the concentration
of the various ions?
1. The concentration of Zn2+
will increase / decrease (circle the best
answer)
2. The concentration of Cu2+
will increase / decrease (circle the best
answer)
Step 4: Practice with cells in non-standard conditions
Please read the directions with respect to determining the effect of changing
concentrations on cell potential.
1. Construct a standard cell, all solutions at 1 M, for both reactions, Sn| Sn2+
||Cu2+
|Cu
and Zn| Zn2+
||Sn2+
|Sn, and determine their voltage.
a. Reaction 1: Sn(s) + Cu2+
(aq) --> Sn2+
(aq) + Cu(s) ____________V
b. Reaction 2: Zn(s) + Sn2+
(aq) --> Zn2+
(aq) + Sn(s) ____________V
2. Add water to dilute by dragging the beaker of water from the bottom right of the
screen over the cell that you want to dilute. The half cell should now show the word
“Diluted” in it. What is the new voltage?
a. Reaction 1: Sn| Sn2+
(diluted)||Cu2+
|Cu ____________V
b. Reaction 2: Zn| Zn2+
||Sn2+
(diluted)|Sn ____________V

205
3. In one reaction the voltage increases, in the other it decreases. Briefly speculate
why.
4. Using the Nernst equation, determine the diluted concentration for both cells. Show
your work.
Sn| Sn2+
(diluted)||Cu2+
|Cu
Zn| Zn2+
||Sn2+
(diluted)|Sn
Once finished, put your name and your TA’s name on a hardcopy of this document. You
must submit your Voltaic Cells results to your TA by your normally scheduled lab period
on Week 10.