Embed Size (px)
Citation preview
Ch 29. Public Choice Theory & the Economics of Taxation
A. Public choice theory – economic analysis of gov’t decision making, politics, & elections.
-- How/when/how much should gov’t intervene w/ externalities?-- Candidates offer alternative packages and voters choose.
Public Choice TheoryInefficient Voting Outcomes
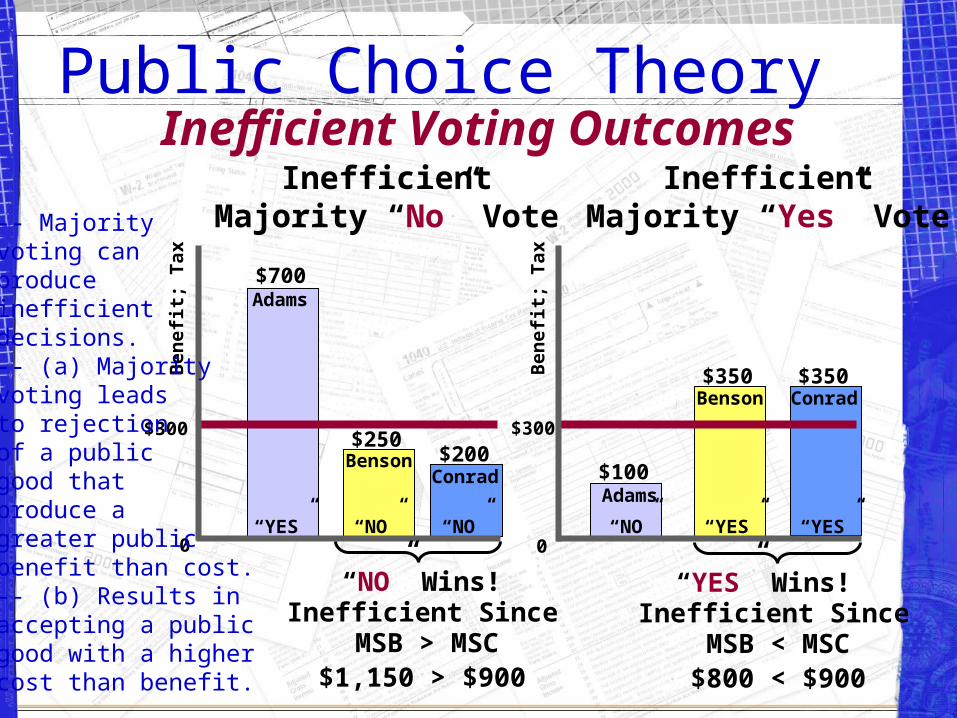
InefficientMajority “No” Vote
InefficientMajority “Yes” Vote
$300 $300
Ben
efi
t; T
ax
Ben
efi
t; T
ax0 0
$700
$250$200
$100
$350 $350
Adams
Adams
Benson
BensonConrad
Conrad
“NO” “NO” “YES” “YES”“YES” “NO”
MSB > MSC$1,150 > $900
Inefficient Since“NO” Wins!
MSB < MSC$800 < $900
Inefficient Since“YES” Wins!
-- Majority voting canproduce inefficient decisions.-- (a) Majorityvoting leads to rejectionof a public good that produce a greater publicbenefit than cost.-- (b) Results in accepting a publicgood with a higher cost than benefit.
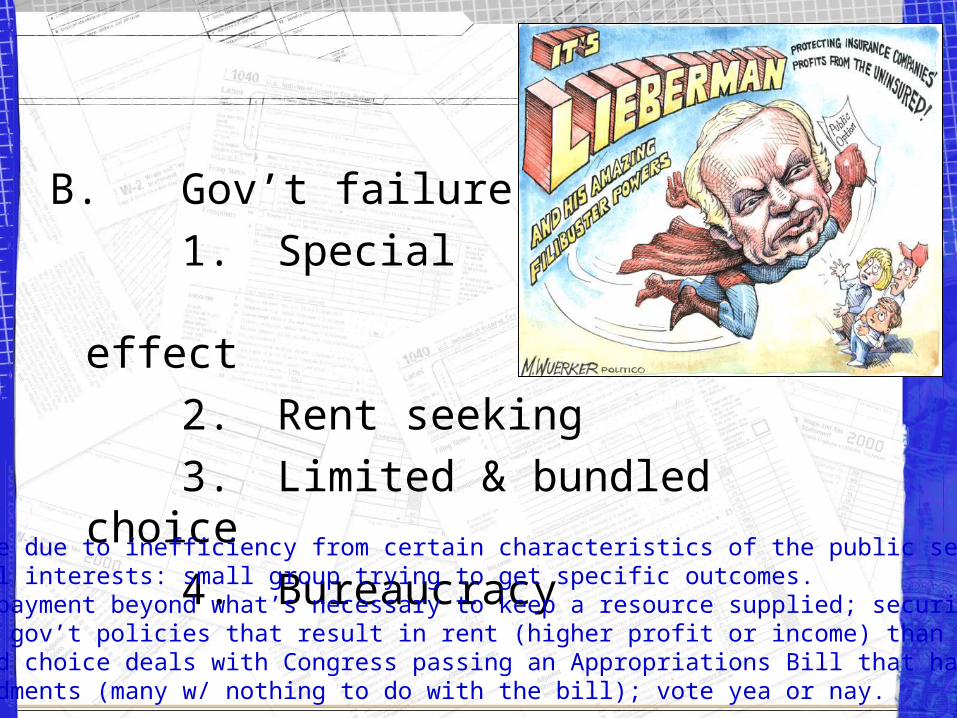
B. Gov’t failure
1. Special interest effect
2. Rent seeking
3. Limited & bundled choice
4. Bureaucracy -- Failure due to inefficiency from certain characteristics of the public sector.-- Special interests: small group trying to get specific outcomes.-- Rent: payment beyond what’s necessary to keep a resource supplied; securingfavorable gov’t policies that result in rent (higher profit or income) than normal.-- Bundled choice deals with Congress passing an Appropriations Bill that hasmany amendments (many w/ nothing to do with the bill); vote yea or nay.
C. The tax burden
1. Benefits-received principle
2. Ability-to-pay principle
-- Benefits-received of taxation asserts businesses & households should purchasethe goods & services of gov’t in same way as other commodities like a gas tax for road repairs. But, could the unemployed pay a tax for job training?-- Ability-to-pay taxation asserts that taxes are based on income & wealth.-- No scientific way to determine how much a person is able to pay in taxes.
16th Amendment(Congress to levy the Income Tax, 1913)
• Applied to mostly the rich when ratified in 1913.
• Extended to nearly everyone to finance WWII.
• 1943, withholding system adopted to ensure collections.
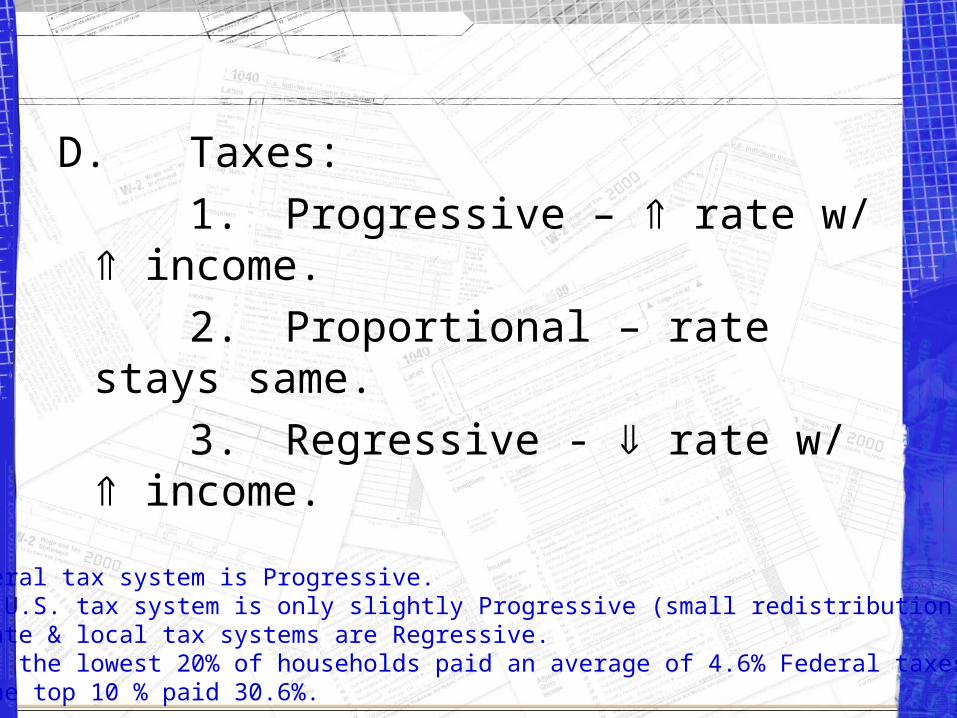
D. Taxes:
1. Progressive – rate w/ income.
2. Proportional – rate stays same.
3. Regressive - rate w/ income.
-- The Federal tax system is Progressive.-- Overall U.S. tax system is only slightly Progressive (small redistribution of wealth).-- Many state & local tax systems are Regressive.-- In 1999, the lowest 20% of households paid an average of 4.6% Federal taxes.-- 1999, the top 10 % paid 30.6%.
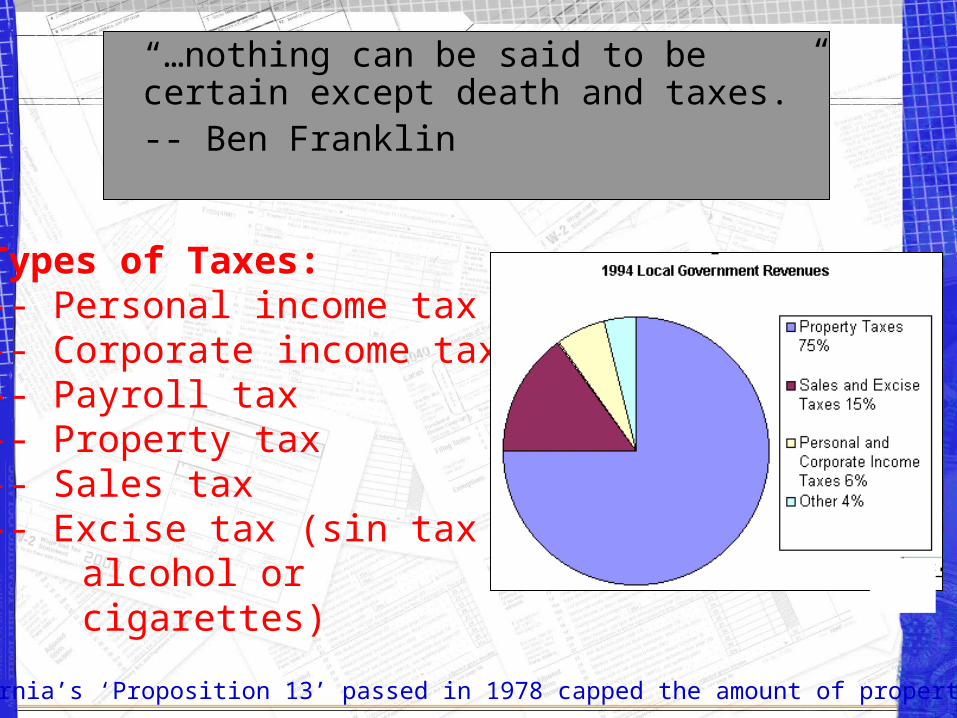
“…nothing can be said to be certain except death and taxes.”-- Ben Franklin
Types of Taxes:-- Personal income tax-- Corporate income tax-- Payroll tax-- Property tax-- Sales tax-- Excise tax (sin tax on
alcohol or cigarettes)
-- California’s ‘Proposition 13’ passed in 1978 capped the amount of property tax.
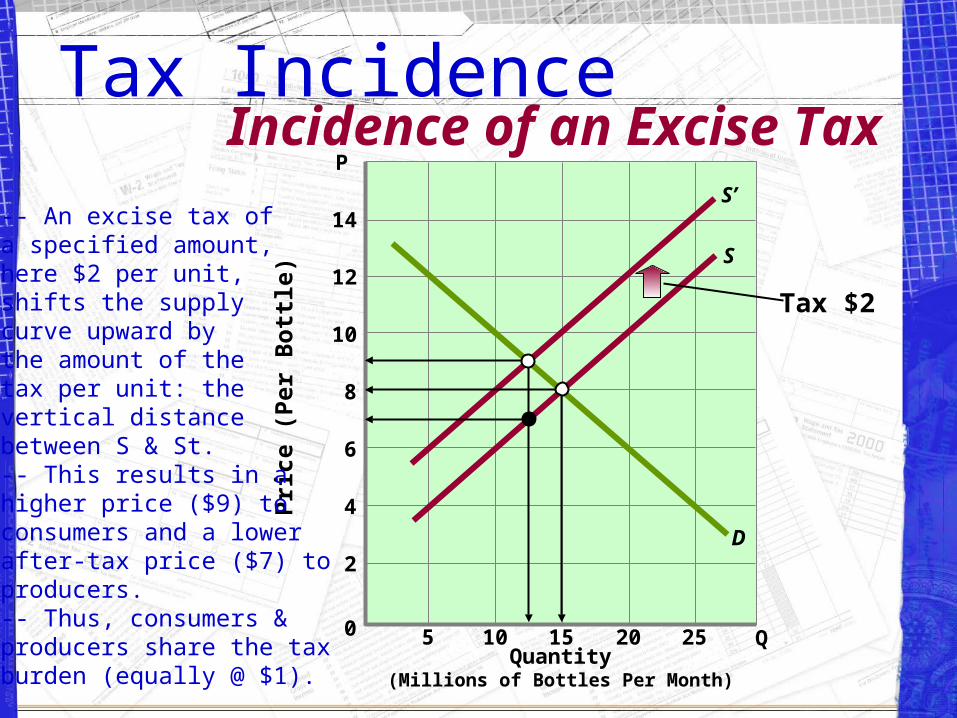
Tax IncidenceIncidence of an Excise Tax
0
2
4
6
8
10
12
14
5 10 15 20 25 Q
P
Pri
ce (
Per
Bo
ttle
)
Quantity(Millions of Bottles Per Month)
S
D
S’
Tax $2
-- An excise tax ofa specified amount,here $2 per unit,shifts the supplycurve upward bythe amount of the tax per unit: thevertical distancebetween S & St.-- This results in a higher price ($9) toconsumers and a lowerafter-tax price ($7) toproducers.-- Thus, consumers &producers share the taxburden (equally @ $1).
Tax IncidenceEfficiency Loss of a Tax
0
2
4
6
8
10
12
14
5 10 15 20 25 Q
P
Pri
ce (
Per
Bo
ttle
)
Quantity(Millions of Bottles Per Month)
S
D
S’
Tax $2
Tax Paid byConsumers
Tax Paid byProducers
EfficiencyLoss (or
DeadweightLoss)
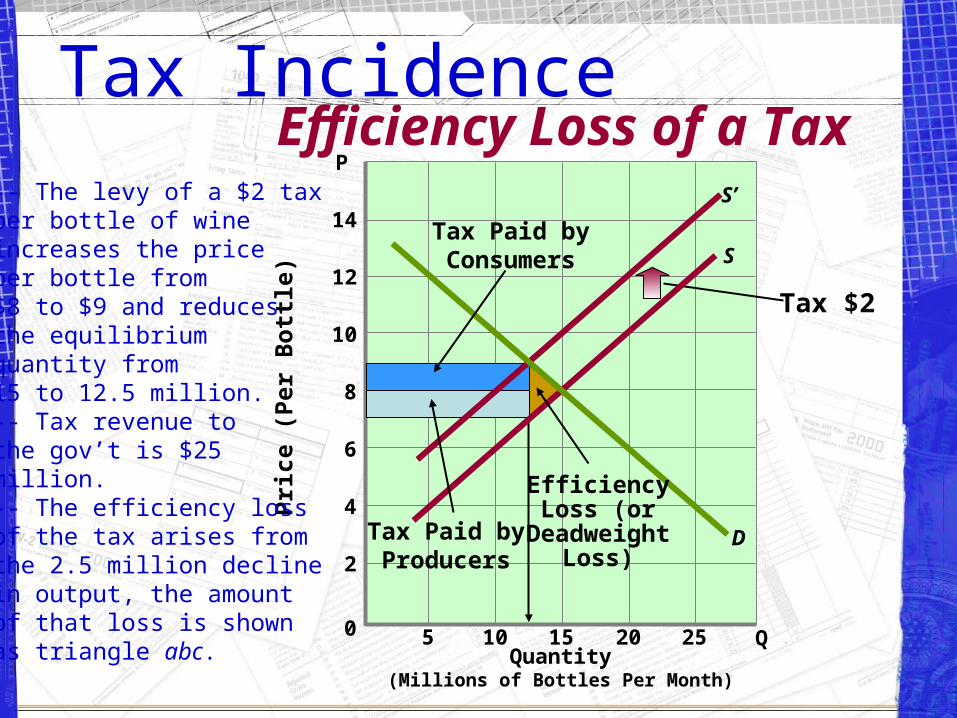
-- The levy of a $2 taxper bottle of wineincreases the price per bottle from$8 to $9 and reducesthe equilibrium quantity from15 to 12.5 million.-- Tax revenue tothe gov’t is $25 million.-- The efficiency loss of the tax arises fromthe 2.5 million declinein output, the amountof that loss is shownas triangle abc.
Tax Incidence
0
P
P
0
Tax Incidence andElastic Demand
Tax Incidence andInelastic Demand
Demand Elasticity and the Incidenceof an Excise Tax
De
Dt
Tax TaxSt
S
St
S
Q2
P1
Pe
Pa
P1
Pi
Pb
Q1 Q2Q1
aa
b
b
cc
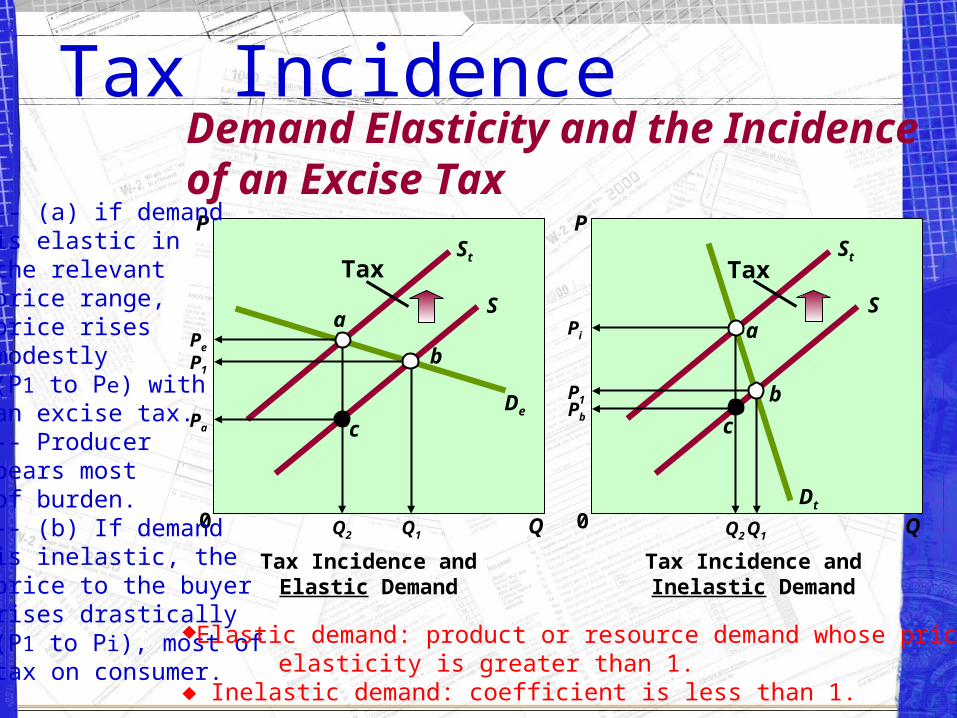
-- (a) if demandis elastic inthe relevantprice range, price rises modestly (P1 to Pe) withan excise tax.-- Producerbears mostof burden.-- (b) If demandis inelastic, theprice to the buyerrises drastically(P1 to Pi), most oftax on consumer.
Elastic demand: product or resource demand whose priceelasticity is greater than 1.
Inelastic demand: coefficient is less than 1.
Tax Incidence
0
P
P
0
Tax Incidence andElastic Supply
Tax Incidence andInelastic Supply
Supply Elasticity and the Incidenceof an Excise Tax
D D
S
SSt
St
P1
Pa
Pe
P1
Pb
Pi
Q1Q2 Q1Q2
Tax Tax
aa
bb
c
c
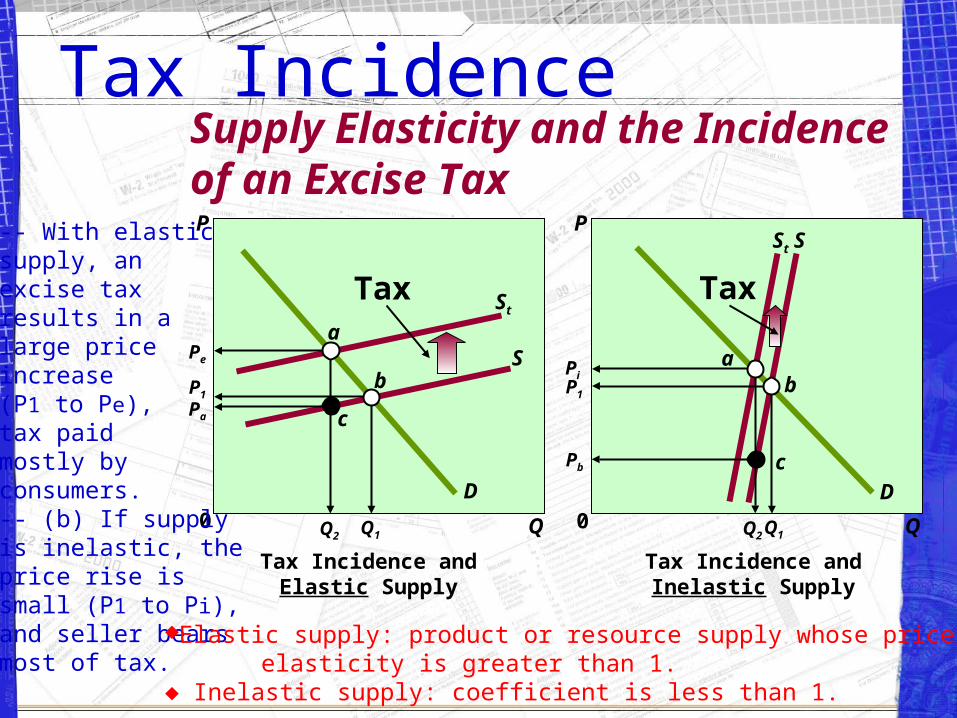
-- With elasticsupply, an excise tax results in alarge priceincrease (P1 to Pe), tax paid mostly by consumers.-- (b) If supply is inelastic, theprice rise is small (P1 to Pi), and seller bearsmost of tax.
Elastic supply: product or resource supply whose priceelasticity is greater than 1.
Inelastic supply: coefficient is less than 1.
Incidence of U.S. TaxesTaxes on Goods and Services as a Percentage of Total Tax Revenues
GLOBAL PERSPECTIVE
United KingdomNetherlands
GermanyItaly
SwedenCanadaFranceJapan
United States
0 5 10 15 20 25 30 35
32.7
30.8
29.2
26.9
26.4
26.3
25.4
20.1
17.6
Source: Organization for Economic Cooperation and Development, 2002
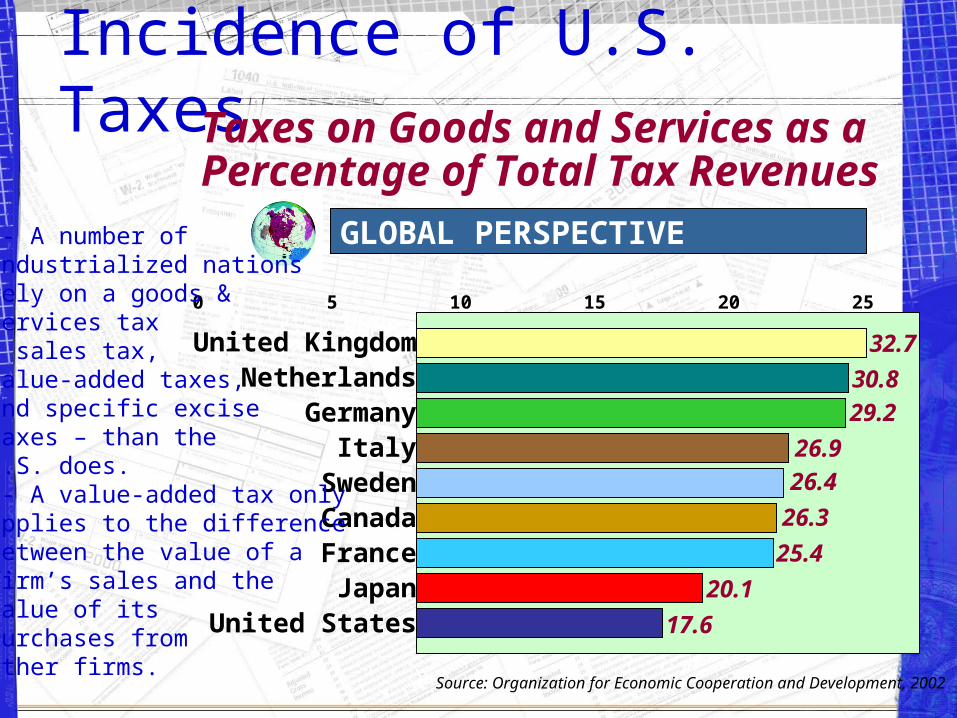
-- A number of industrialized nationsrely on a goods & services tax – sales tax,value-added taxes,and specific excise taxes – than the U.S. does.-- A value-added tax onlyapplies to the differencebetween the value of a firm’s sales and the value of its purchases fromother firms.
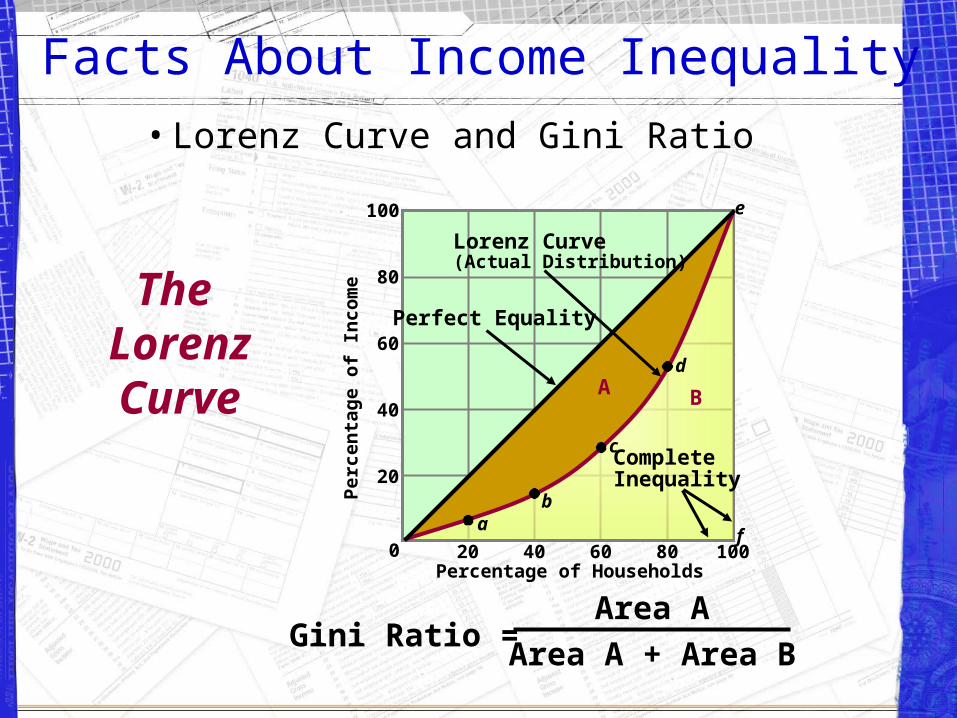
Facts About Income Inequality
• Lorenz Curve and Gini Ratio
The LorenzCurve
20 40 60 80 100
20
40
60
80
100
0
Perfect Equality
Lorenz Curve(Actual Distribution)
Complete Inequality
A B
ab
c
d
e
f
Gini Ratio =Area A
Area A + Area B
Percentage of Households
Per
cen
tag
e o
f In
co
me
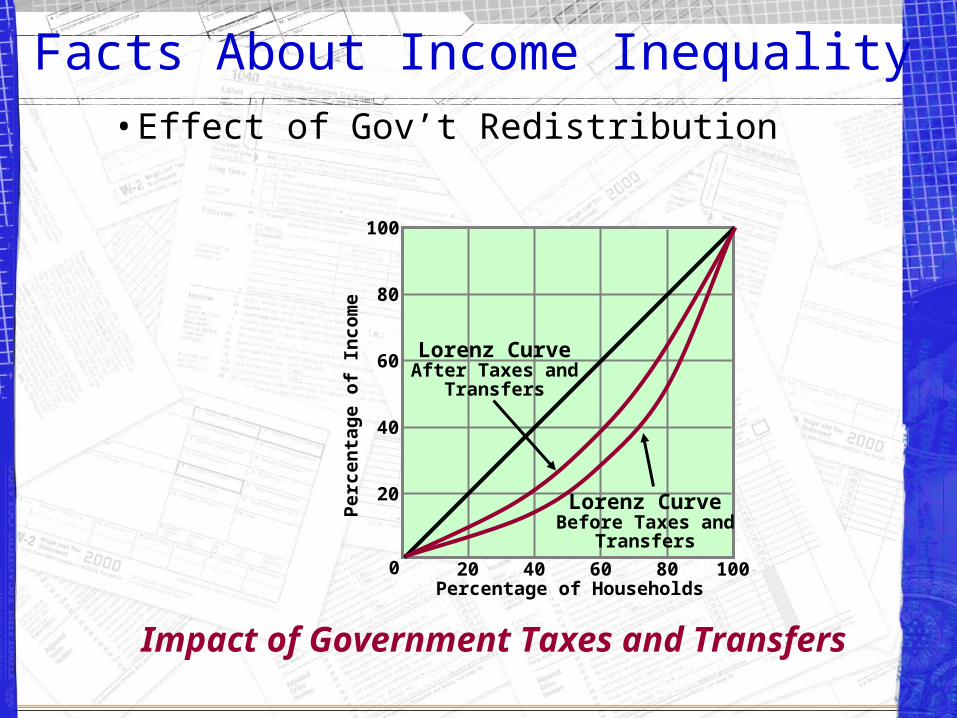
Facts About Income Inequality
• Effect of Gov’t Redistribution
20 40 60 80 100
20
40
60
80
100
0
Lorenz CurveBefore Taxes and
Transfers
Percentage of Households
Per
cen
tag
e o
f In
co
me
Lorenz CurveAfter Taxes and
Transfers
Impact of Government Taxes and Transfers