Embed Size (px)
Citation preview
Ch 3 Manufacturing Models and Metrics
Sections:
1. Mathematical Models of Production Performance
2. Manufacturing Costs
1
Why use metrics
“A system of related measures that facilitates the quantification of some particular characteristic”
To track performance in successive periods, Try out new technologies and systems to determine their
merits, identify their problems, To compare alternative methods, and To make good decisions.
2
Production Concepts and Mathematical Models
Production performance metrics:
Production rate Rp for an individual processing or assembly operation is usually expressed as an hourly rate, that is, number of work units completed per hour (pc/hr).
Cycle time Tc is defined as the time that one work unit spends being processed or assembled. It is the time between when one work unit begins processing or assembly and when the next unit begins.
3
Production Concepts and Mathematical Models
Production performance metrics:
Production capacity PC Utilization U Availability A Manufacturing lead time MLT Work-in-progress WIP
4
Operation Cycle Time
Typical cycle time for a production operation:
Tc = To + Th + Tth
where
Tc = cycle time (min/pc),
To = processing time for the operation (min/pc),
Th = handling time (min/pc) (e.g., loading and unloading the production machine), and
Tth = tool handling time (min/pc) (e.g., time to change tools)
5
Production Rate (batch/job shop/flow)
Batch production:
Batch time Tb = Tsu + QTc where
Tb= batch processing time (min)
Tsu= setup time to prepare for the batch (min)Q= batch quantity (pc)
Tc = cycle time per work unit (min/cycle)
Average production time per work unit Tp
Tp = Tb/Q= Tsu/Q + Tc
Hourly production rate Rp = 60/Tp 6
Production Rate (batch/job shop/flow)
Job shop production:
For Q = 1, Tp = Tsu + Tc
For Q > 1, Tp is determined as in batch production
Mass production:
Rp Rc = 60/Tc since Tsu/Q 0 (Q is very large)where
Rc = operation cycle rate of the machine (pc/hr)
Tc = operation cycle time (min/pc)
7
Production Rate (batch/job shop/flow)
Flow line production: Bottleneck station is the station with the largest operation
time (with highest utilization)
Tc = Tr + Max To
Tc = cycle time of the production line (min/cycle)
Tr = time to transfer work units between workstations each cycle (min/cycle)
Max To = operation time at the bottleneck station (min/cycle)
Rc = 60/Tc
Rc = theoretical (ideal) production rate (cycles/hr) 8
Production Capacity
“Max rate of output that a production facility is able to produce under a given set of assumed operating conditions”
Operating conditions: Number of shifts per day Number of days per week Employment levels
A work center is a manufacturing system in the plant typically consisting of one worker and one machine.
9
Production Capacity
Plant capacity for facility in which parts are made in one operation (no = 1):
PC = n Sw Hsh Rp where PC = weekly plant capacity (units/wk)n = number of work centers working in parallel
Sw = number of shifts per week
Hsh = hr/shift
Rp = hourly production rate of each work center (output units/hr)
10
Production Capacity
Plant capacity for facility in which parts require multiple operations (no > 1):
PCw =
where no = number of operations in the routing
w sh p
o
nS H R
n
11
Production Capacity
This capacity model assumes that all n machines are producing 100% of the time and there are no bottleneck operations due to variations in process routings to inhibit smooth flow of work through the plant.
There are some operations that are fully utilized while other operations occasionally stand idle waiting for work.
That is, utilization varies.
12
Utilization and Availability
Utilization: U =
where Q = quantity actually produced, and PC = plant capacity
“the amount of output of a production facility relative to its capacity”
Utilization can be assessed for an entire plant, a single machine in the plant or any other productive resource.
PC
Q
13
Utilization and Availability
Availability: A =
where MTBF = mean time between failures, and
MTTR = mean time to repair
“a common measure for reliability of equipment”
MTBF
MTTRMTBF
14
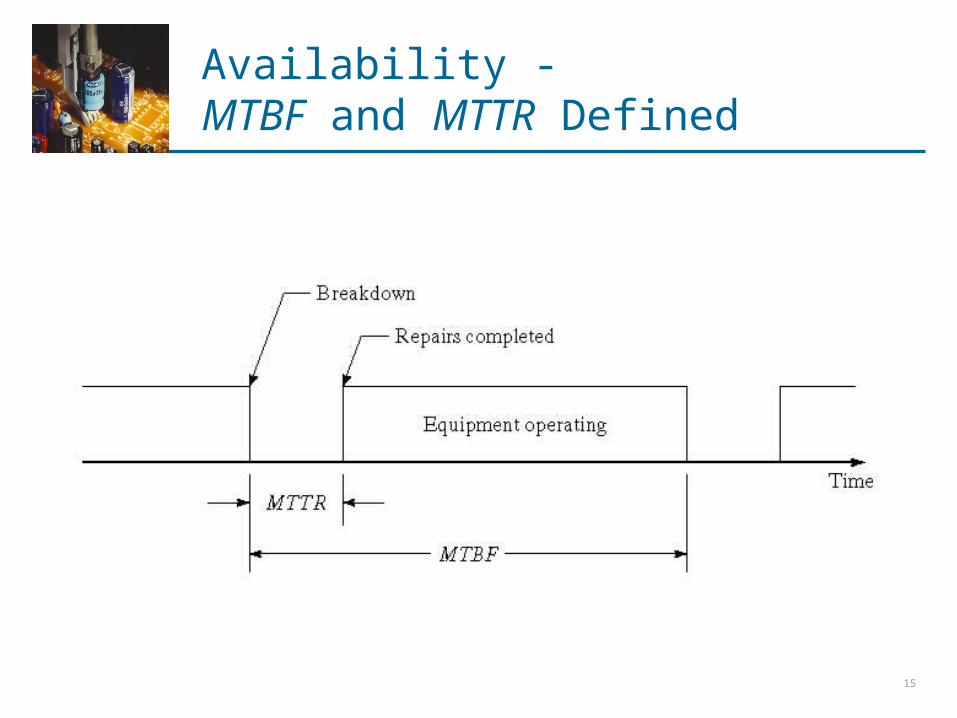
Availability - MTBF and MTTR Defined
15
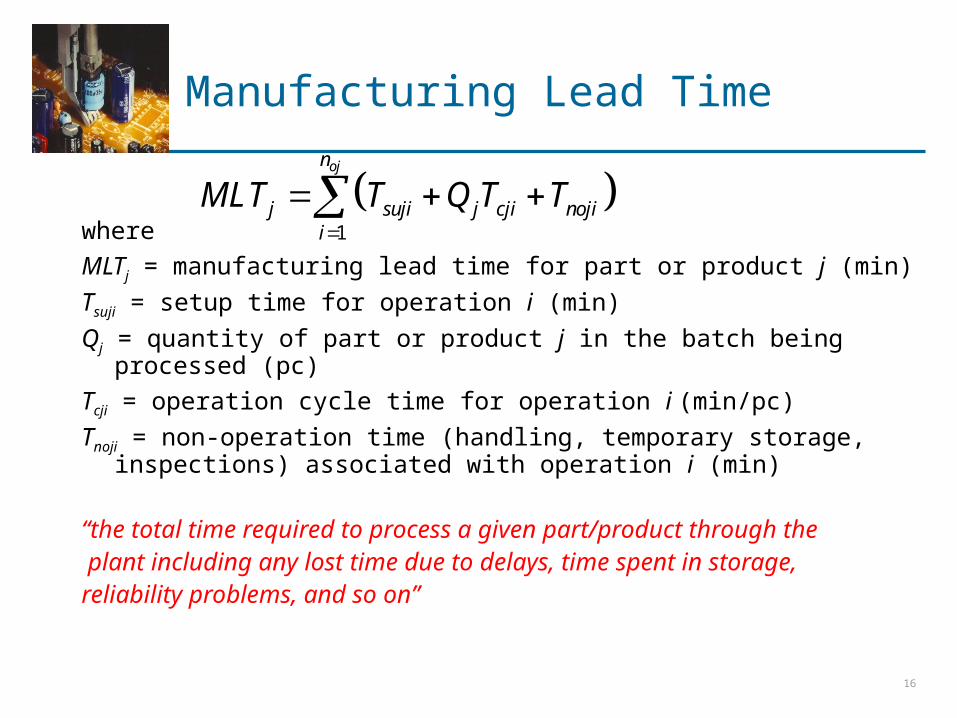
Manufacturing Lead Time
where
MLTj = manufacturing lead time for part or product j (min)
Tsuji = setup time for operation i (min)
Qj = quantity of part or product j in the batch being processed (pc)
Tcji = operation cycle time for operation i (min/pc)
Tnoji = non-operation time (handling, temporary storage, inspections) associated with operation i (min)
“the total time required to process a given part/product through the plant including any lost time due to delays, time spent in storage, reliability problems, and so on”
1
ojn
j suji j cji nojii
MLT T Q T T
16
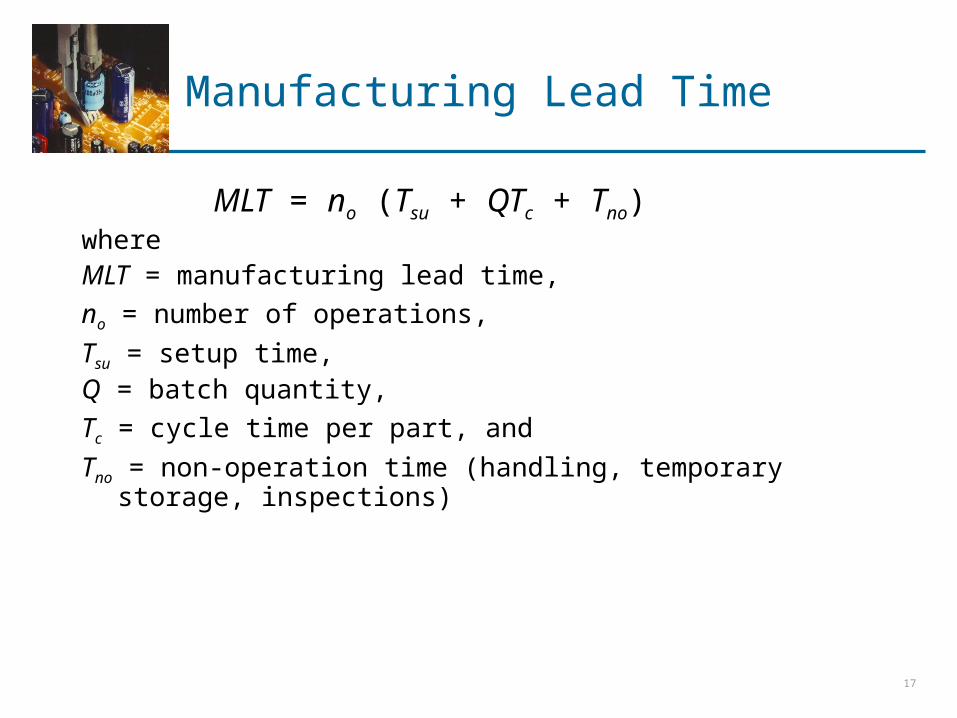
Manufacturing Lead Time
MLT = no (Tsu + QTc + Tno)where MLT = manufacturing lead time,
no = number of operations,
Tsu = setup time, Q = batch quantity,
Tc = cycle time per part, and
Tno = non-operation time (handling, temporary storage, inspections)
17
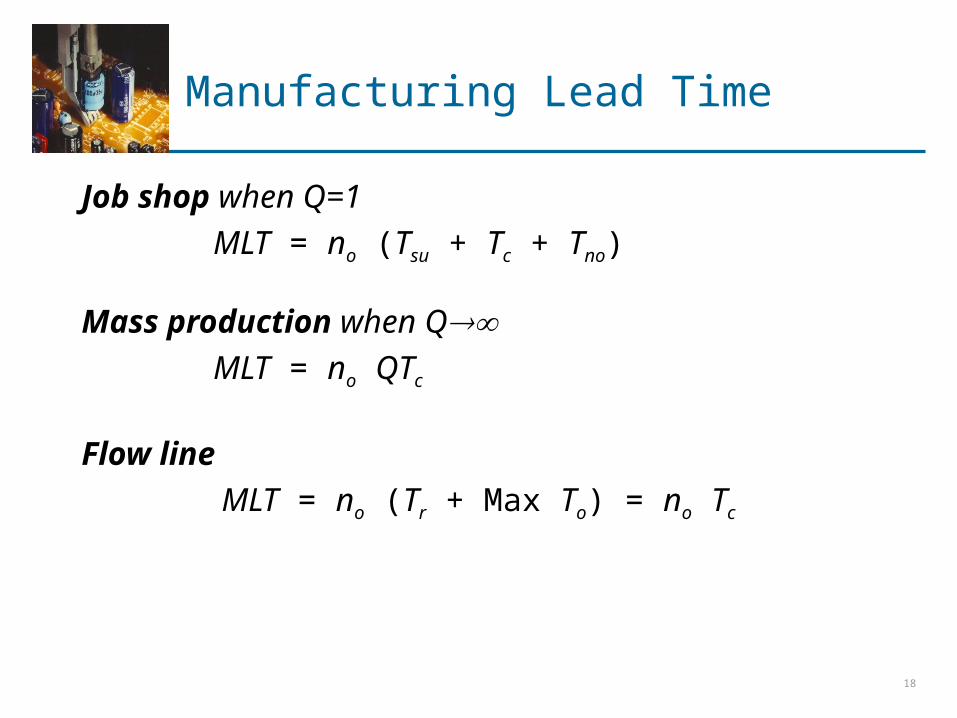
Manufacturing Lead Time
Job shop when Q=1
MLT = no (Tsu + Tc + Tno)
Mass production when QMLT = no QTc
Flow line
MLT = no (Tr + Max To) = no Tc
18
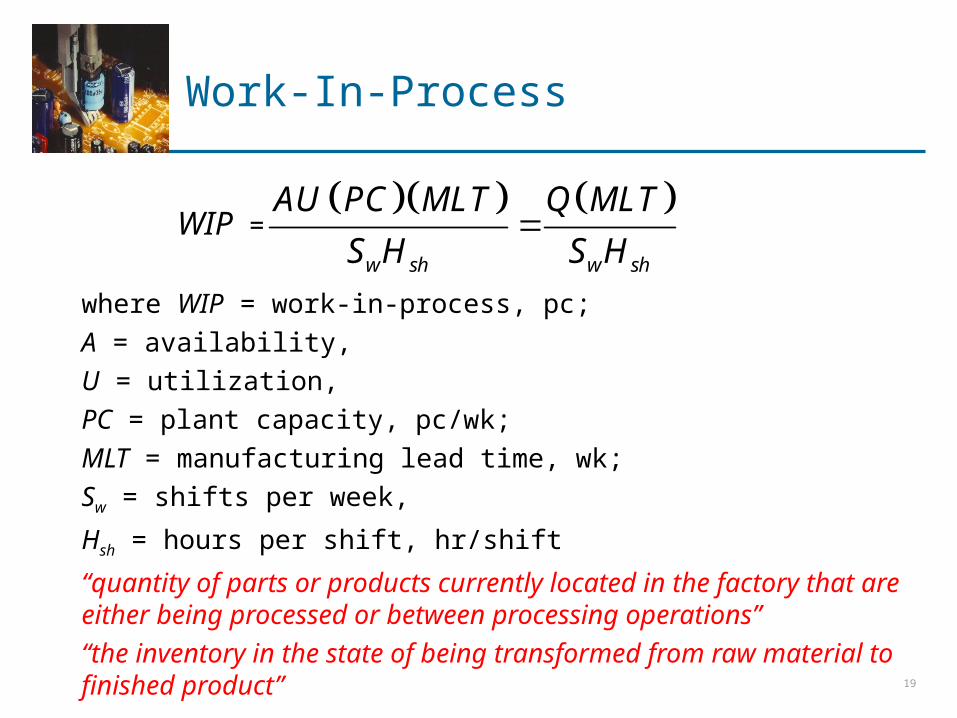
Work-In-Process
WIP =
where WIP = work-in-process, pc;
A = availability,
U = utilization,
PC = plant capacity, pc/wk;
MLT = manufacturing lead time, wk;
Sw = shifts per week,
Hsh = hours per shift, hr/shift
“quantity of parts or products currently located in the factory that are either being processed or between processing operations”
“the inventory in the state of being transformed from raw material to finished product”
w sh w sh
AU PC MLT Q MLT
S H S H
19
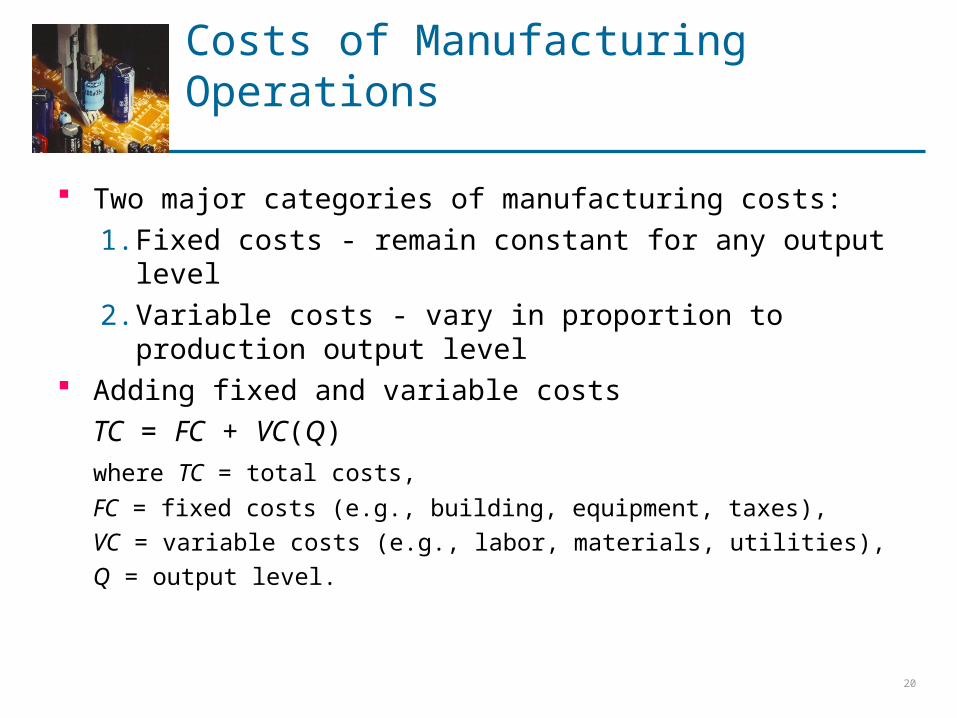
Costs of Manufacturing Operations
Two major categories of manufacturing costs:
1. Fixed costs - remain constant for any output level
2. Variable costs - vary in proportion to production output level
Adding fixed and variable costs
TC = FC + VC(Q)
where TC = total costs,
FC = fixed costs (e.g., building, equipment, taxes),
VC = variable costs (e.g., labor, materials, utilities),
Q = output level.
20
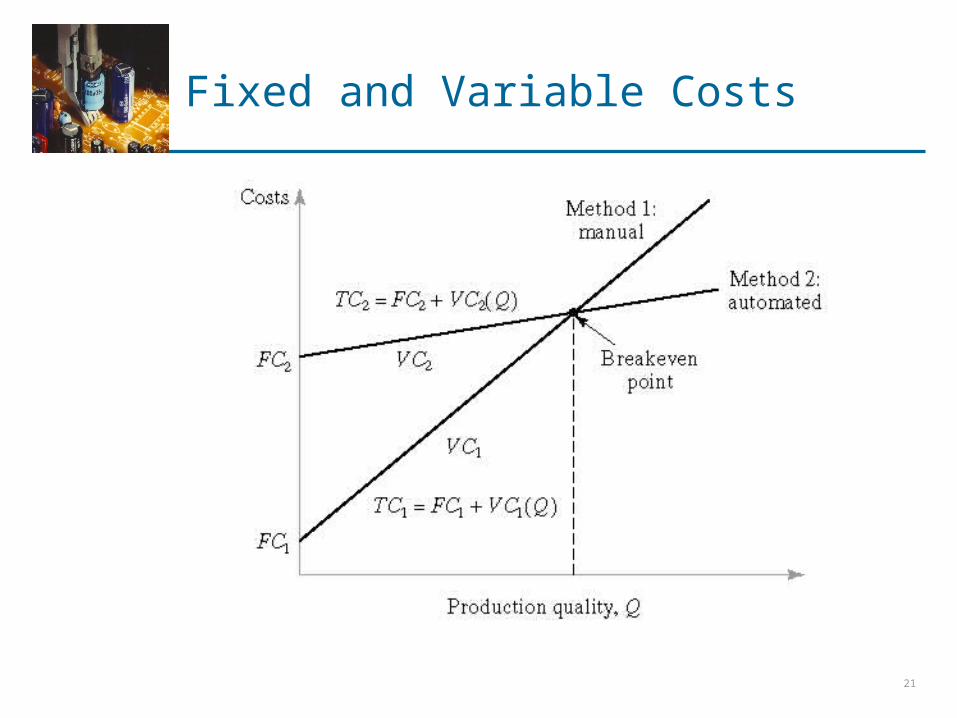
Fixed and Variable Costs
21
Manufacturing Costs
Alternative classification of manufacturing costs:
1. Direct labor - wages and benefits paid to workers
2. Materials - costs of raw materials
3. Overhead - all of the other expenses associated with running the manufacturing firm Factory overhead consists of the costs of operating
the factory other than direct labor and materials. Corporate overhead is the cost not related to the
company’s manufacturing activities.
22
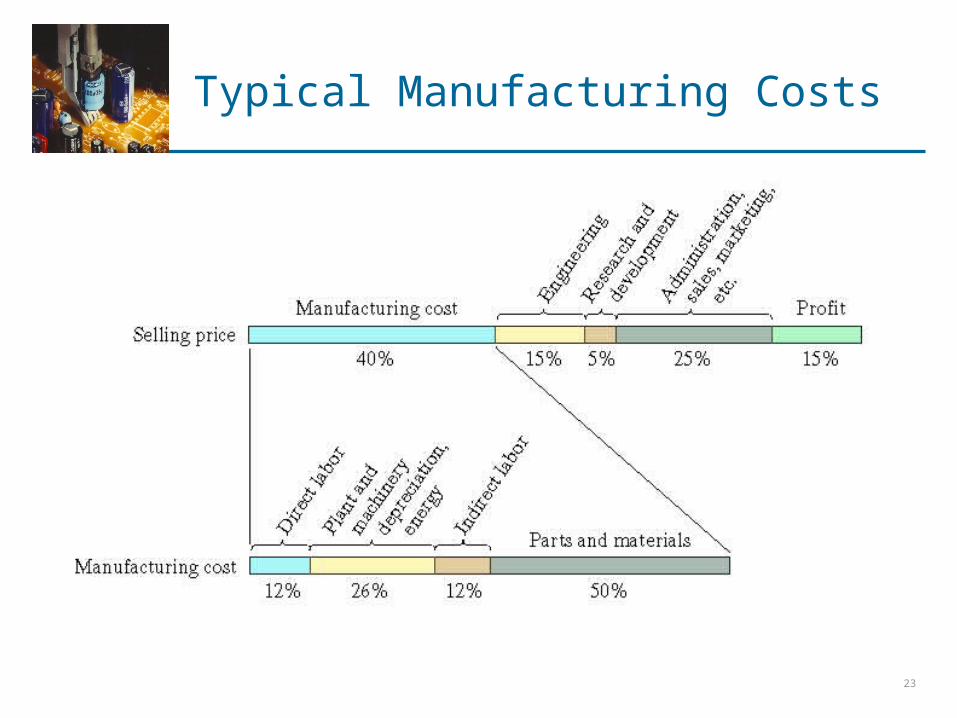
Typical Manufacturing Costs
23
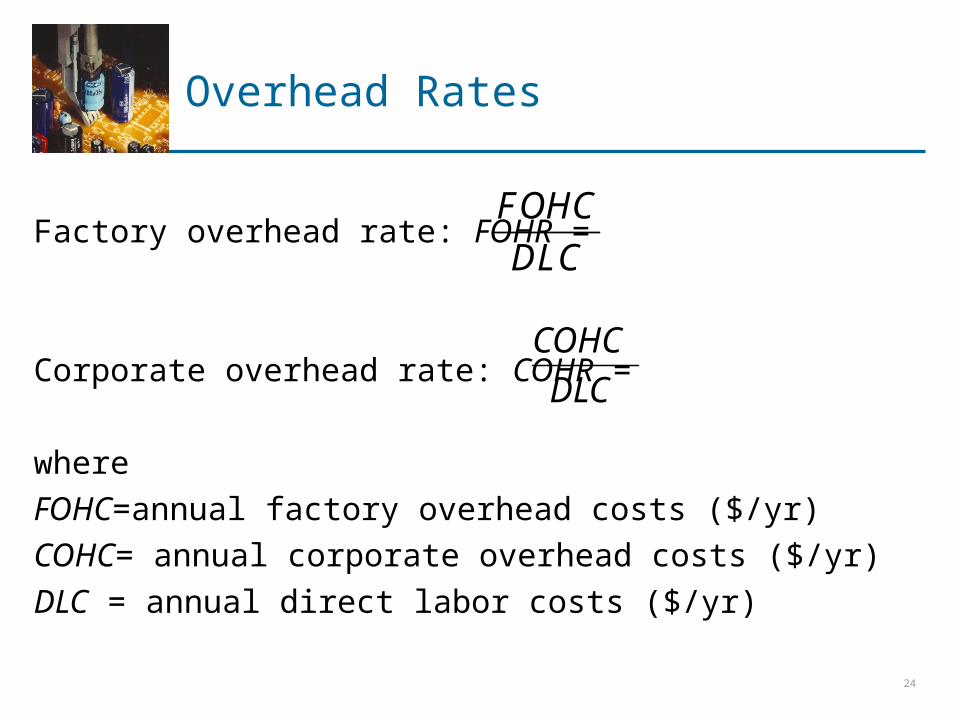
Overhead Rates
Factory overhead rate: FOHR =
Corporate overhead rate: COHR =
where
FOHC=annual factory overhead costs ($/yr)
COHC= annual corporate overhead costs ($/yr)
DLC = annual direct labor costs ($/yr)
FOHC
DLC
DLC
COHC
24
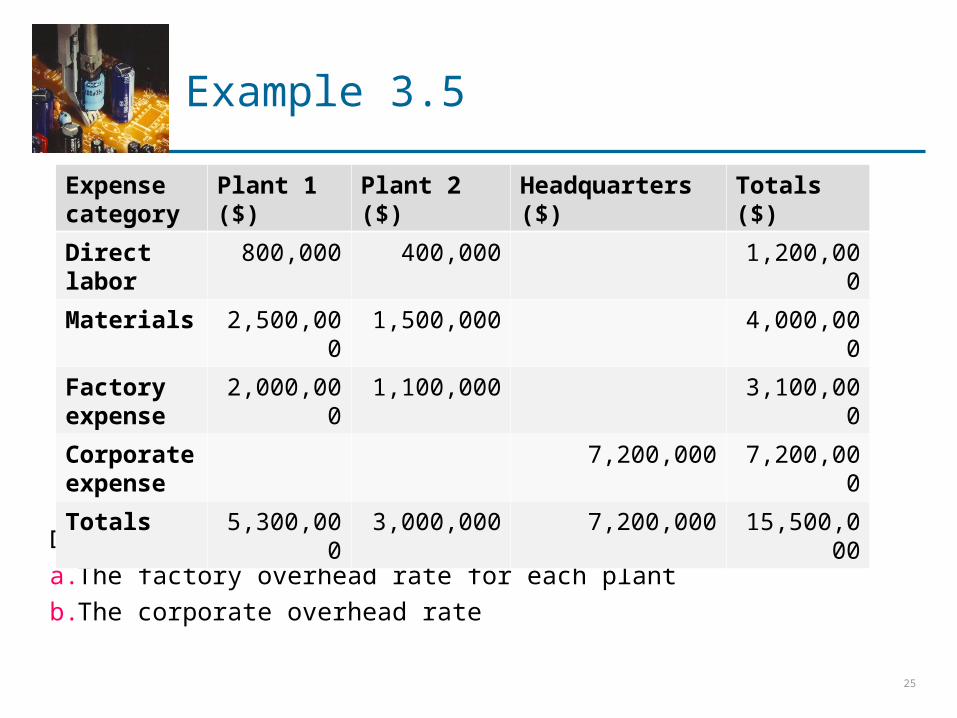
Example 3.5
Determine
a. The factory overhead rate for each plant
b. The corporate overhead rate
Expense category
Plant 1 ($) Plant 2 ($) Headquarters ($) Totals ($)
Direct labor
800,000 400,000 1,200,000
Materials 2,500,000 1,500,000 4,000,000
Factory expense
2,000,000 1,100,000 3,100,000
Corporate expense
7,200,000 7,200,000
Totals 5,300,000 3,000,000 7,200,000 15,500,000
25
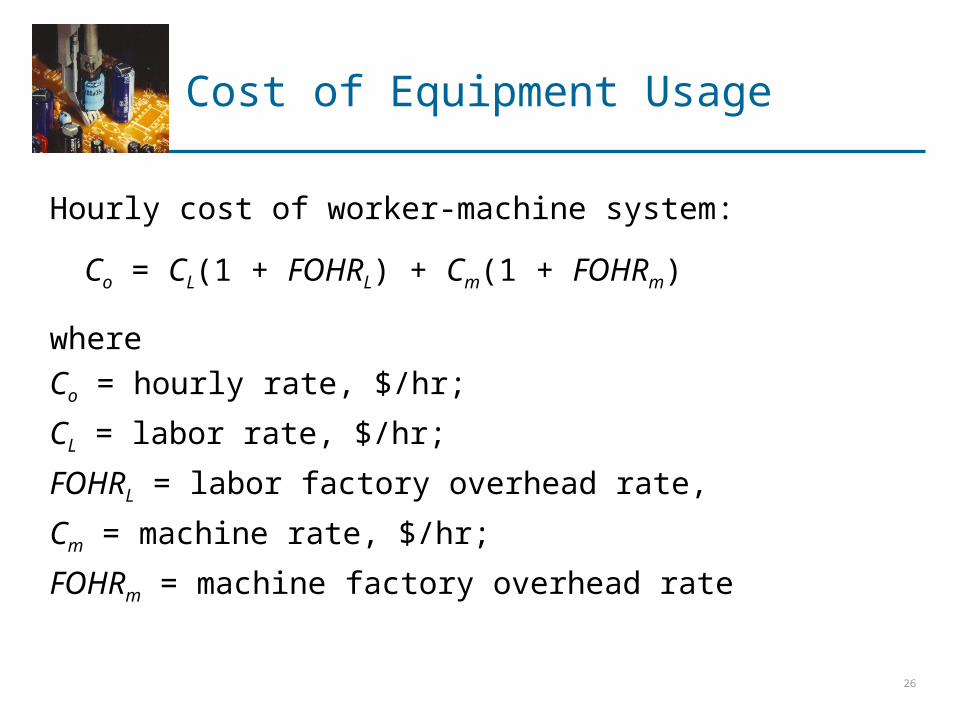
Cost of Equipment Usage
Hourly cost of worker-machine system:
Co = CL(1 + FOHRL) + Cm(1 + FOHRm)
where
Co = hourly rate, $/hr;
CL = labor rate, $/hr;
FOHRL = labor factory overhead rate,
Cm = machine rate, $/hr;
FOHRm = machine factory overhead rate
26
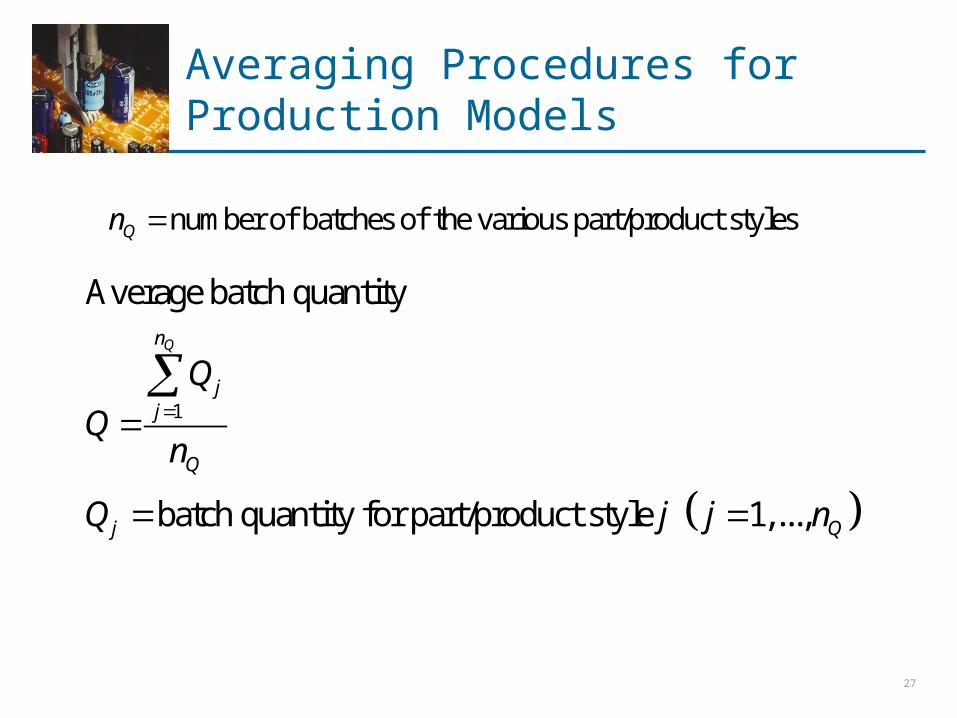
Averaging Procedures for Production Models
number of batches of the various part/product stylesQn
1
Average batch quantity
batch quantity for part/product style 1,...,
Qn
jj
Q
j Q
Q
Qn
Q j j n
27
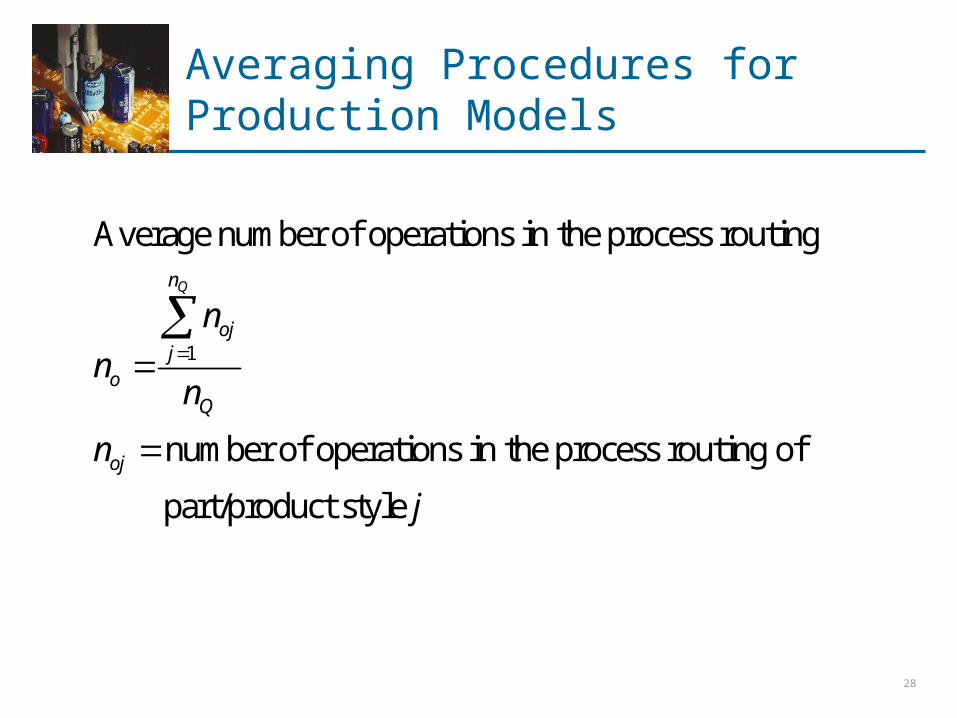
Averaging Procedures for Production Models
1
Average number of operations in the process routing
number of operations in the process routing of
part/product style
Qn
ojj
oQ
oj
n
nn
n
j
28
Averaging Procedures for Production Models
1
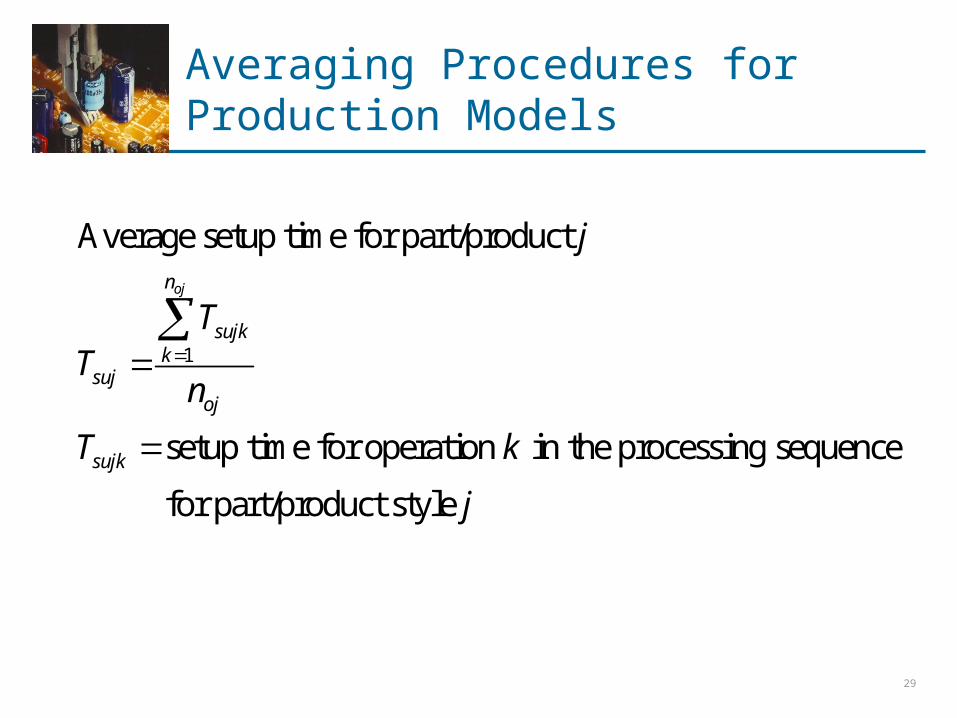
Average setup time for part/product
setup time for operation in the processing sequence
for part/product style
ojn
sujkk
sujoj
sujk
j
TT
n
T k
j
29
Averaging Procedures for Production Models
1
1
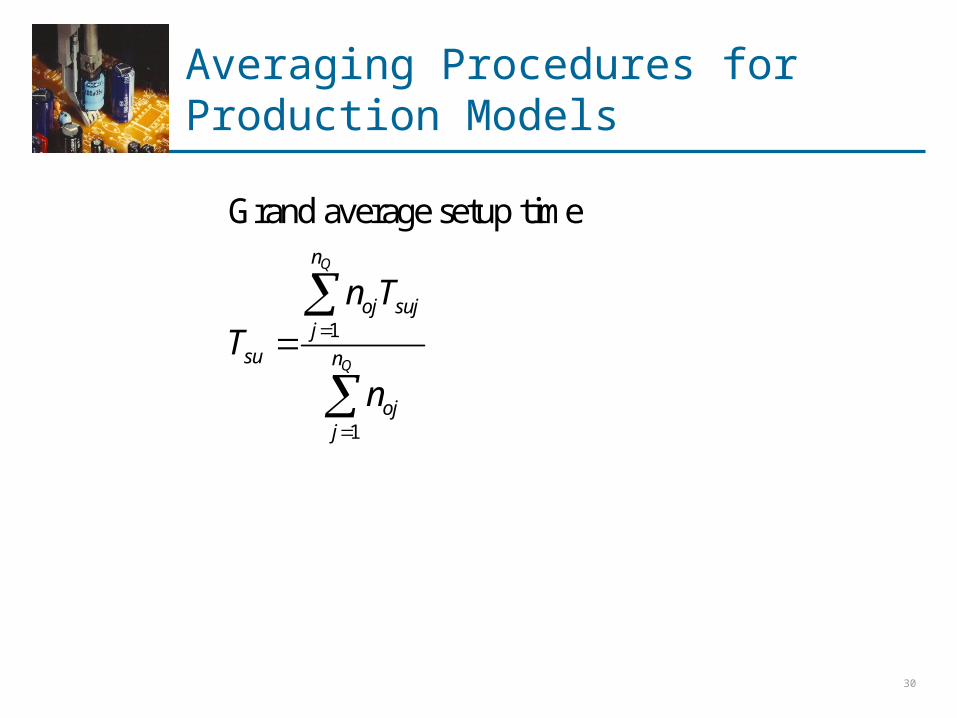
Grand average setup timeQ
Q
n
oj sujj
su n
ojj
n T
T
n
30
Averaging Procedures for Production Models
1
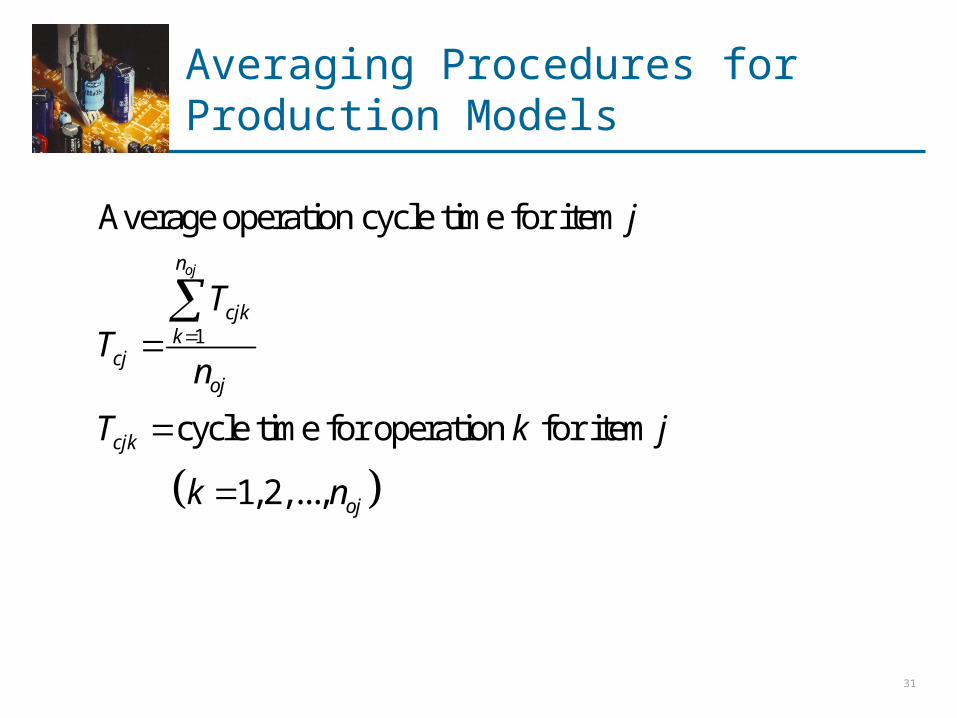
Average operation cycle time for item
cycle time for operation for item
1, 2,...,
ojn
cjkk
cjoj
cjk
oj
j
TT
n
T k j
k n
31
Averaging Procedures for Production Models
1
1
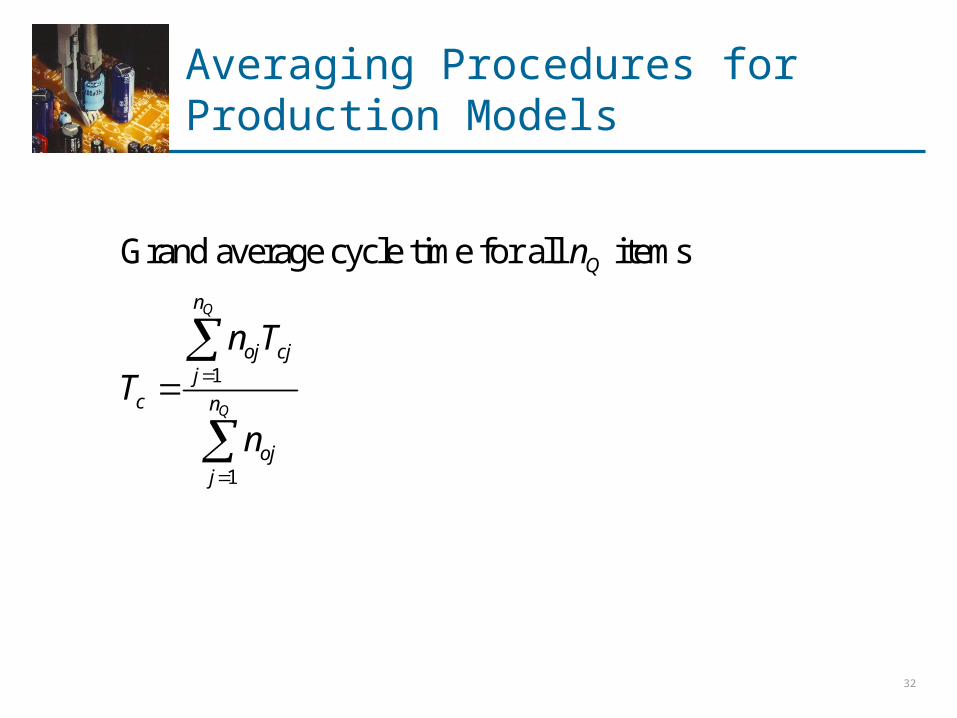
Grand average cycle time for all items
Q
Q
Q
n
oj cjj
c n
ojj
n
n T
T
n
32
Averaging Procedures for Production Models
1
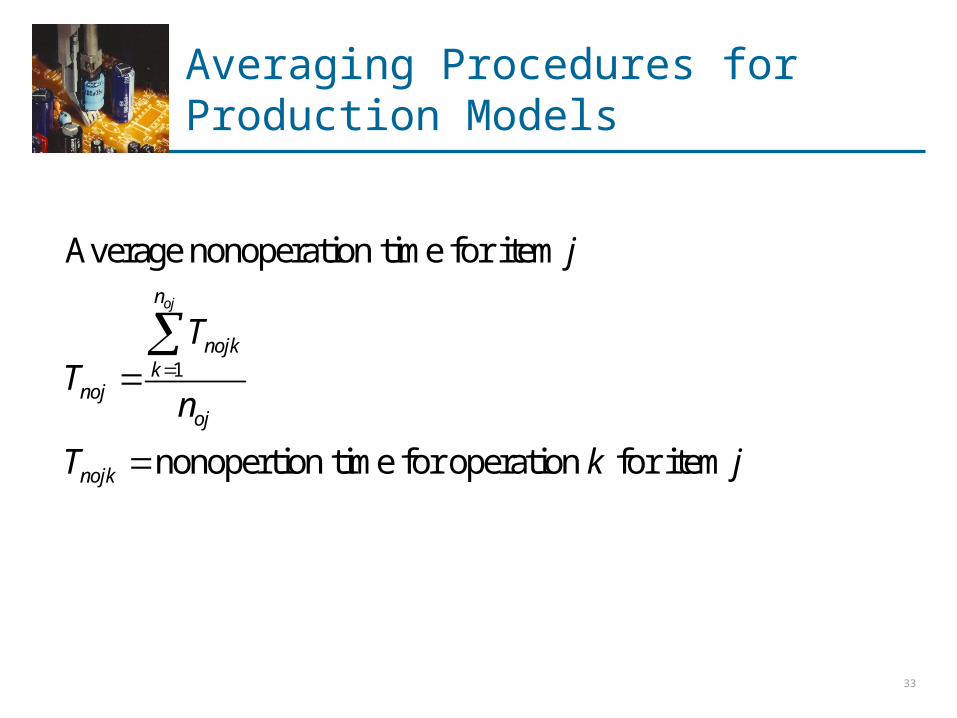
Average nonoperation time for item
nonopertion time for operation for item
ojn
nojkk
nojoj
nojk
j
TT
n
T k j
33
Averaging Procedures for Production Models
1
1
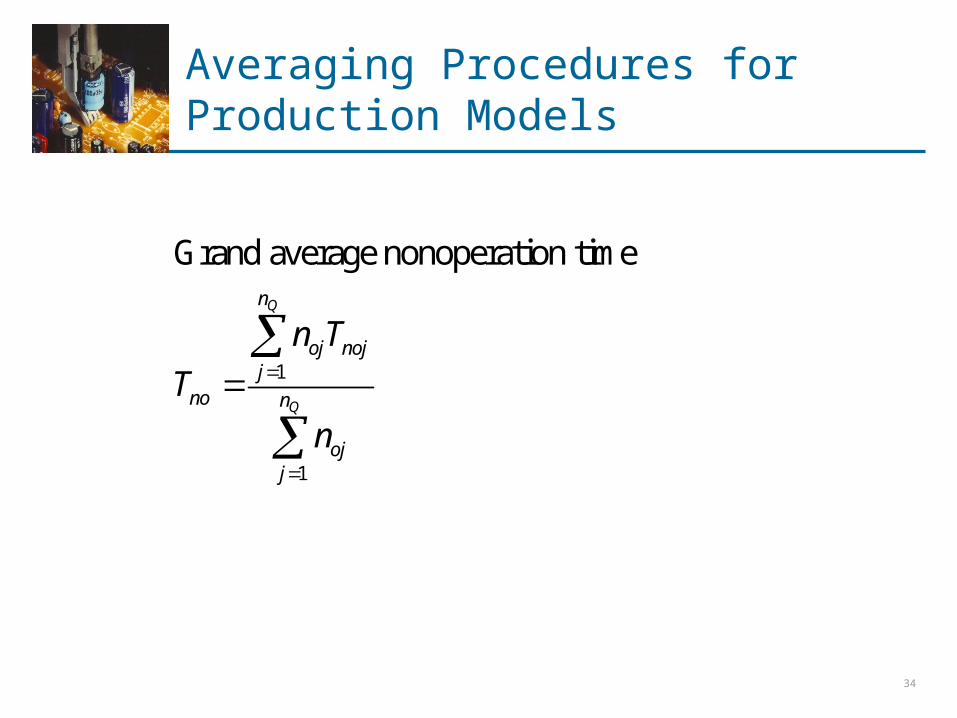
Grand average nonoperation timeQ
Q
n
oj nojj
no n
ojj
n T
T
n
34