Embed Size (px)
Citation preview

ABSTRACT
SONG, JUNLONG. Adsorption of Amphoteric and Nonionic Polymers on Model Thin Films. (Under the direction of Prof. Orlando J. Rojas).
Understanding the adsorption behaviors of polymers from solution is critical in
applications such as fiber processing, specifically in the development of fiber bonding and
lubrication. Therefore, in situ and real time Quartz Crystal Microbalance and Surface
Plasmon Resonance were employed to monitor the adsorption of hydrosoluble polymers
(including amphoteric and nonionic macromolecules) on ultrathin films of cellulose,
polypropylene, polyethylene, nylon and polyethylene terephthalate.
The extent of adsorption of amphoteric polymers on cellulose (and also on silica)
depended on the charge density of the polymer, the substrates and pH of the medium. More
importantly, the adsorbed amount exceeded that found in the case of simple polyelectrolytes.
We hypothesized that this extensive adsorption is the result of a polarization effect produced
by the charged substrate, which also determined the characteristics (thickness and
viscoelastivcity) of the adsorbed layers as well as bonding abilities.
Surface active polymers including diblock polyalkylene glycols and triblock
polymers (based on ethylene- and propylene- oxide) as well as silicone surfactants were used
to study the formation of boundary layers that are relevant in fiber lubrication. Adsorption
isotherms for the nonionic polymers followed a Langmuirian behavior in which the
hydrophobic effect was a major driving mechanism. It was concluded that surface-active
molecules form robust self assembled (lubricant) layers that withstand high shear forces and
are able to control friction and abrasion due to the unique molecular structures they form at
the interface.

Adsorption of Amphoteric and Nonionic Polymers on Model Thin Films
by Junlong Song
A dissertation submitted to the Graduate Faculty of North Carolina State University
In partial fulfillment of the Requirements for the degree of
Doctor of Philosophy
Wood and Paper Science
Raleigh, North Carolina
2008
APPROVED BY:
_______________________________ ______________________________ Dr. Orlando J. Rojas Dr. Martin A. Hubbe Committee Chair ________________________________ ______________________________ Dr. Dimitris S. Argyropoulos Dr. Kirill Efimenko

ii
BIOGRAPHY
The author was born on May 6, 1974 in Yongchuan, Chongqing, People’s Republic of China.
He grew up in his hometown until Fall 1994 when he joined Beijing Forestry University,
Beijing. He obtained a Bachelor degree in Chemical Engineering in 1998 and a Masters
degree in Pulp and Paper Science in 2001, from the same institution and department. After
graduation, he worked as a process engineer for China International Engineering Co. Ltd
(China BCEL) for three years. In July, 2004, he came to Raleigh to join the Ph.D. program in
the Department of Wood and Paper Science in North Carolina State University.
He married Hongyan Li in 2004 and they have a one year old daughter, Cindy.
iii
ACKNOWLEDGMENTS
The author is immeasurably indebted to his major advisor, Dr. Orlando J. Rojas for his
mentorship, advice and constructive criticism throughout the course of this research.
Special thanks are also extended to Ph.D. committee members, Drs. Martin A. Hubbe,
Dimitris S. Argyropoulos and Kirill Efimenko. Drs. Juan P. Hinestroza, Tom Theyson and
Wendy Krause, are appreciated for giving valuable advice and ideas.
The author also wants to express his appreciation to Yun Wang, Yan Vivian Li and Hongyi
Liu for warm discussions and for sharing thoughts and experiences. He is also in debt with
all his colleagues and friends in the Department of Wood and Paper Science, for their
assistance and encouragement and especially to the “Colloid and Interfaces” group members
with whom many memorable experiences inside and outside the university where shared.
Finally, the author would like to state his appreciation to the US Department of Agriculture
and the National Textile Center for funding the “polyampholytes” and the “boundary
lubrication” projects, respectively.
iv
TABLE OF CONTENTS
List of Tables…………………………………………………………………………….....ix
List of Figures………………………………………………………………………………....x
Chapter 1 Background …………………………………………………………………..……1
Introduction………………………………………………………………………………2
Polyampholytes in papermaking…………………………………………………………4
Lubrication and tribology in textile processing………………………………………….8
Lubrication phenomena…………………………………………………………….9
Thin film lubrication………………………………………………………………15
Techniques to study thin films and lubrication phenomena………………………19
Methods used in this research……………………………………………………..22
Applications of SPR and QCM to Study Lubricant Films………………………...28
Lateral force microscopy and molecular dynamic simulation…………………….37
Summary………………………………………………………………………………..47
References………………………………………………………………………………49
Chapter 2 Polymer Systems studied and General Hypotheses……………………….……...58
Chapter 3 Development and Characterization of Polymer Films Relevant to Fiber Surfaces ……………………………………………………………………………...………65
Abstract…………………………………………………………………………………66 Introduction……………………………………………………………………………..67 Experimental……………………………………………………………………………69
Materials………………………………………………………………………..…69
v
Methods……………………………………………………………………………69
Results and Discussion…………………………………………………………………75
AFM topography and RMS (roughness)………………………………………….75 Contact angle……………………………………………………………………...76 Thickness………………………………………………………………………….77 X-ray photoelectron spectroscopy………………………………………………...78
Spin Coating as a Platform for the Manufacture of Model Films……………….85
Model surfaces as a platform for adsorption………………………………………87
Summary………………………………………………………………………………..88
References………………………………………………………………………………90
Chapter 4 Bulk Properties of Amphoteric and Nonionic Polymers……………………….....92
Abstract…………………………………………………………………………………93 Introduction……………………………………………………………………………..94 Experiment……………………………………………………………………………...94
Materials…………………………………………………………………………..94 Methods……………………………………………………………………………98
Results and discussion………………………………………………………………….99
Bulk properties of polyampholytes…………………………………………...…...99 Bulk properties of nonionic lubricants………………………………………...…105
Conclusions……………………………………………………………………………109 References…………………………………………………………………………….110

vi
Chapter 5 Adsorption of Polyampholytes on Solid Surfaces Measured by the QCM Technique……………………………………………………………………………….......111
Abstract………………………………………………………………………………..112 Introduction……………………………………………………………………………113 Experimental…………………………………………………………………………..114
Viscosity measurement…………………………………………………………..117 Radius of gyration measurement………………………………………………...117 Cellulose thin films………………………………………………………………118 QCM-D measurements…………………………………………………………..118
Results and Discussion………………………………………………………………..119
Polyampholyte adsorption on silica surfaces…………………………………….119 Adsorption of polyampholytes on cellulose surface……………………………..134
Conclusions……………………………………………………………………………137 References……………………………………………………………………………..139
Chapter 6 Adsorption of Lubricants on PET surfaces………………………………….......143
Abstract………………………………………………………………………………..144 Introduction……………………………………………………………………………145 Experimental…………………………………………………………………………..146
Methods………………………………………………………………………….148
Results and Discussion………………………………………………………………..150
Adsorption of Nonionic Lubricant Polymers……………………………………150
vii
Effect of Lubricant Type on Adsorption…………………………………………159 Contact angle-and surface assembly……………………………………………..167
Conclusions……………………………………………………………………………169 References……………………………………………………………………………..171
Chapter 7 Adsorption of Nonionic Polymers on Cellulose, Polypropylene, Nylon and PET Surfaces ……………………………………………………………………….....................173
Abstract………………………………………………………………………………..174 Introduction……………………………………………………………………………175 Experimental…………………………………………………………………………..176
Methods…………………………………………………………………………..177
Results and discussion………………………………………………………………...178
Adsorption experiments………………………………………………………….178 Effect of the nature of surfaces on polymer adsorption………………………….182 Contact angle- and polymer assembly…………………………………………...187
Conclusions……………………………………………………………………………189 References……………………………………………………………………………..190
Chapter 8 Adsorption of Silicone-based Surfactants……………………………………….191
Abstract………………………………………………………………………………..192 Introduction……………………………………………………………………………193 Experimental…………………………………………………………………………..195
Materials…………………………………………………………………………195 Methods………………………………………………………………………….195

viii
Results and discussion………………………………………………………………...198
Adsorption of silicone surfactant on polymeric surfaces………………………..199 Adsorption isotherms of the silicone lubricant…………………………………..201 Hydrophobic forces in lubricant adsorption……………………………………..203 Friction measured by LFM………………………………………………………205
Conclusions……………………………………………………………………………207 References……………………………………………………………………………..208
Chapter 9 Lubrication Studied by Lateral Force Microscopy and Molecular Dynamic Simulation …………………………………………………………………….....................212
Abstract………………………………………………………………………………..213 Introduction……………………………………………………………………………214 Experimental…………………………………………………………………………..216
Adsorption measured by quartz crystal microbalance (QCM)…………………..216 Friction measured by Lateral Force Microscopy (LFM)………………………...216 Molecular Dynamic Simulation………………………………………………….216
Results and Discussion………………………………………………………………..218
Friction Coefficients measured by LFM…………………………………………218 Interaction energy between lubricant and surface simulated by MDS…………..222
Summary………………………………………………………………………………224 References……………………………………………………………………………..226
Chapter 10 Summary of Conclusions and Proposed Future Work ……………………...…227

ix
LIST OF TABLES
Table 1.1. Comparison between QCM and SPR techniques (*)………………………….….22 Table 3.1. Characterizations of model surfaces……………………………………………...77 Table 3.2. Comparison of the chemical composition from XPS and theoretical value….......85 Talbe 4.1. Synthesis of acrylamide-based polyampholytes and simple copolymers………..97 Talbe 4.2. Structure information of PAGs and Pluronics……………………………………98 Talbe 4.3. The maximum surface excess and area for each molecule calculated from Gibbs adsorption isotherm………………………………………………………………………...108 Table 5.1. Acrylamide-based polyampholytes (PAmp 2, 4, 8 and 16) and simple polyelectrolytes (Cat and An). Note that in the case of the polyampholytes the %mol ratio cationic:anionic groups was kept constant at 5:4 and the molecular weight was approximately the same for all polymer samples…………………………………………………………..117 Table 6.1. Structural information of polyalkylene glycols (PAGs) and Pluronics…………147 Table 6.2. Langmuir fitting parameters for adsorption curves of nonionic lubricants on PET surface after rinsing (irreversible adsorption)………………………………………………160 Table 6.3. BET fitting parameters for adsorption curves of nonionic lubricants on PET surface after rinsing (irreversible adsorption)……………………………………………....160 Table 6.4. Calculated hydrophobic numbers for tested nonionic polymers………………. 166 Table 7.1. Structural information of polyalkylene glycols (PAGs) and Pluronics…………176 Table 7.2. Langmuir parameters for (irreversible) adsorption isotherms of nonionic polymers on PP, nylon and PET surfaces (no adsorption was observed on cellulose surfaces)……. .184
x
LIST OF FIGURES
Figure 1.1. Polymer adsorption onto surfaces from solution. D is the thickness of adsorbed polymer layer………………………………………………………………………………….3 Figure 1.2. Wet strength of paper treated with xanthated starch amine (XSA) having various tertiary amine and xanthate degrees of substitution (DS). The paper samples were prepared from unbleached kraft furnish treated with 3% XSA, oven dry pulp basis, at pH 7.0. Figure redrawn from reference 32…………………………………………………………………....6 Figure 1.3. Effect of macromolecular composition and pH on the tensile strength of polymer-treated bleached kraft fibers at 1000 µS/cm conductivity 25. Structures of polymers denoted as “PAmp 2, 4, 8, 16”, “Cat” and “An” can be seen with more detail in Chapter 3)…………7 Figure 1.4. Stribeck curve, displaying the different regimes of lubrication. Figure Redrawn from original source of Stribeck curve 40…………………………………………………...11 Figure 1.5. Proposed generalized friction map of effective viscosity plotted against shear rate. Figure redrawn from reference 42…………………………………………………………...13 Figure 1.6. Proposed generalized friction map friction force plotted against sliding velocity. Figure redrawn from reference 42…………………………………………………………...14 Figure 1.7. Proposed generalized friction map of friction force plotted against load. Figure redrawn from reference 42…………………………………………………………………..15 Figure 1.8. Schematic diagram of how the effective viscosity, elasticity and relaxation change with thickness of a lubricant film. Figure redrawn from reference 41………………16 Figure 1.9. Lubricant molecules organized by shear. Figure redrawn from reference 49…..18 Figure 1.10. Schematics of surface plasmon resonance, from Ref. 89………………………23 Figure 1.11. QCM sensor (a) and schematic principle of QCM……………………………..25 Figure 1.12. Time-dependent frequency change of QCM for EM and AF adsorbed on QCM crystal at 200 °C. From reference 93………………………………………………………...30 Figure 1.13. Change in frequency for 5 MHz Si crystals upon injection of OTS (10 mM). The arrow indicates injection time. Insert is an enlargement of the region indicated by the box, to show the stability level. Figures from reference 7…………………………………………..31

xi
Figure 1.14. ΔD-Df profiles for polyampholyte adsorption on silica surfaces. The low charge density polyampholite (PAmp4) consisted of 5% cationic and 4% anionic groups while the high charge density polyampholyte (PAmp16) contained 20% of cationic and 16% anionic groups. The “cationic” polymer had a charge density of 5% (cationic groups)……………..33 Figure 1.15. ΔD-Df profile of nonionic lubricants E76P29E76 and E37P65E37 as they adsorb onto PET surfaces before rinsing………………………………………………….....34 Figure 1.16. Comparison of adsorption kinetics of a perfluoropolyether lubricant (Fomblin ZDOL) on silver surfaces as measured by SPR and QCM . Figure from reference 84……...35 Figure 1.17. Decoupling water content through the combination of QCM and SPR measurements. The polymer used in this experiment is a cationic polyamide, with molecular weight of ca. 3 millions. Coupled water determined by this method was found to be 25%....37 Figure 1.18. Schematic of lateral force microscopy and twisting and bending motions acting on the cantilever……………………………………………………………………………...39 Figure 1.19. Lateral deflection of the cantilever from changes in surface friction (top) and from changes in slope (bottom)...............................................................................................40 Figure 1.20. One line scanning profiles for the cellulose coated surface both in a Pluronic lubricant (E19P29E19, see Chapter 3 for detail) solutions and in air. P65 is the symbol of lubricant E19P29E19, which is a triblock copolymer with 19 EO groups at both ends and 29 PO groups in the middle. P65-1~P65-5 represent a series of ethanol solutions with the increase of ethanol concentration. Data contributed by project member Yan (Vivian) Li, from Cornell University……………………………………………………………………………41 Figure 1.21. Sandwich-like layer to study the effect of shear in MDS. Top and bottom layers are Fe. Lubricant used was octane, C8H18, which can be seen between the two surfaces. The shear velocity for the two solid surfaces was set to 5 m/s. MDS results contributed by project member Hongyi Liu, from NC State…………………………………………………………42 Figure 1.22. Animation of shear process for lubricant octane confined between two Fe surfaces. Shear velocity applied on both solid surfaces was 5 m/s. MDS results contributed by project member Hongyi Liu, from NC State……………………………………………..44 Figure 1.23. Average density distribution (a) and velocity profile (b) of octane between two Fe surfaces. Shear velocity applied at both solid surfaces was set to 5 m/s. MDS results contributed by project member Hongyi Liu, from NC State………………………………...45

xii
Figure 1.24. Temperature profile of octane between two Fe surfaces. Shear velocity applied at both solid surfaces was set to 5 m/s. MDS results contributed by project member Hongyi Liu, from NC State…………………………………………………………………………...46 Figure 2.1. Conformation of adsorbed polymers at interfaces for (a) homopolymers, (b) end-functionalized homopolymers, (c) Block polymers, and (d) polyampholytes……………….60 Figure 3.1. AFM images of model films of (a) cellulose, (b) PP, (c) PE, (d) Nylon and (E) PET on silica wafers. Scanning size was 20 x 20 m for (d) and 2 x 2 m for the rest…...76 Figure 3.2. XPS survey spectra for bare PP (a) and PE (b) films. Detail spectra (inset) for C1s BE region are included in each figure…………………………………………………..80 Figure 3.3. XPS spectra of cellulose model films (top). Detailed C1s spectra (bottom)…….83 Figure 3.4. XPS spectra of model (a) Nylon and PET (b) films. Detailed C1s spectra are seen in the insets…………………………………………………………………………………..84 Figure 3.5. Ellipsometric thicknesses of PP films obtained after different sequence times (larger sequence number indicates longer time and therefore larger )……………………... 87 Figure 3.6. Adsorption of a nonionic polymer (lubricant) (E37P56E37) on various model films . Adsorption isotherm was obtained by using the QCM-D technique………………... 88 Figure 4.1. Molecular composition of monomers in random polyampholytes prepared by free-radical polymerization (DMAPAA, IA and AM)………………………………………96 Figure 4.2. Chemical structure of PAGs (a) and Pluronics (b)………………………………97 Figure 4.3. Viscosity of polyampholytes (a) and viscosity changes against % charged groups of polyampholytes and simple polyelectrolytes (b)………………………………………...100 Figure 4.4. Viscosity for simple polyelectrolytes Cat and An (see Table 4-1)……………..101 Figure 4.5. Relative viscosity of polyampholytes with salt (ionic strength = 0.01M )……..102 Figure 4.6. Relative viscosity of polyampholytes measured at pH 4 (a), pH 5 (b), and pH 8.5(c) after applying Poly aluminum chlorohydrate (PAC)………………………………...103 Figure 4.7. Effects of polyampholyte charge density and PAC addition on relative viscosities at (a) pH=4 and (b) pH=5…………………………………………………………………..104
xiii
Figure 4.8. The radius of gyration of PAmp4 at different pH conditions…………………..105 Figure 4.9. Surface tension and CMC determination for bi-block polymer PAGs (a) and tri-block polymer Pluronics (b)………………………………………………………………..107 Figure 4.10. Surface tension and CMC for the silicone surfactant LN336-100I…………..107 Figure 5.1. Molecular composition of monomers in random polyampholytes prepared by free-radical polymerization (DMAPAA, IA and AM)……………………………………..116 Figure 5.2. Frequency (top) and Energy dissipation change (bottom) curves for polyampholytes PAmp2, PAmp4, PAmp8 and PAmp16 as well as simple polyelectrolytes Cat and An at pH 4………………………………………………………………………….121 Figure 5.3. Frequency (top) and Energy dissipation change (bottom) curves for polyampholytes PAmp2, PAmp4, PAmp8 and PAmp16 as well as simple polyelectrolytes Cat and An at pH 7………………………………………………………………………….122 Figure 5.4. Frequency (top) and Energy dissipation change (bottom) curves for polyampholytes PAmp2, PAmp4, PAmp8 and PAmp16 as well as simple polyelectrolytes Cat and An at pH 10………………………………………………………………………...124 Figure 5.5. Comparison of thickness calculated by Sauerbrey and Voigt models for low (PAmp2, left) and high (PAmp8, right) charge density polyampholytes…………………..128 Figure 5.6. ΔD-Δf profile during adsorption on silica of polyampholytes and polyelectrolytes……………………………………………………………………………. 130 Figure 5.7. Frequency change for different polyelectrolytes after reaching adsorption equilibrium………………………………………………………………………………….132 Figure 5.8. Illustrative chart with the net charge of surfaces and polymers at different pH and indication of dominant electrostatic interactions between surfaces and polymers…………133 Figure 5.9. Polymer adsorption isotherms for cellulose substrates as measured by frequency (top) and, dissipation (b) changes with time……………………………………………….135 Figure 5.10. ΔD-Δf profile during adsorption on celluylose of polyampholytes and polyelectrolytes……………………………………………………………………………..136 Figure 6.1. Chemical structure of polyalkylene glycols (PAGs) (left) and Pluronics (right)……………………………………………………………………………………… 147

xiv
Figure 6.2. Typical QCM f and D curves for an adsorbing nonionic polymer. Polymer sample was E76P29E76 in 0.0001% aqueous solution. Frequency (f) change (left axis) and dissipation (D) change (right axis) for three overtones (3, 5, 7) were recorded simultaneously. Flow rate was constant 0.1 ml/min…………………………………………………………152 Figure 6.3. Equilibrium adsorption isotherms for nonionic lubricants adsorbed on PET surfaces at 25 °C before (a) and after (b) rinsing measured by QCM. The flow rate was constant at 0.1 ml/min………………………………………………………………………154 Figure 6.4. Equilibrium adsorption isotherms for nonionic lubricants adsorbed on PET surfaces at 25 °C before (a) and after (b) rinsing measured by SPR. The flow rate was kept constant at 0.1 ml/min………………………………………………………………………155 Figure 6.5. Equilibrium adsorption isotherms for nonionic lubricants adsorbed on PET surfaces expressed by mol/m2. The data converted from Figure 6.3………………………156 Figure 6.6. D and f curves to study the conformation of adsorbed nonionic diblock polyakylene glycols (a) and triblock Pluronics (b) on PET surfaces………………………158 Figure 6.7. Fitted Langmuir parameters b and Q0 as a function of the lubricant type…….161 Figure 6.8. Fitted Langmuir parameters change with molecular weight (MW). Highly dependency of maximum adsorption density on MW can be observed……………………162 Figure 6.9. Fitted Langmuir parameters as a function of polymer’s HLB values………….163 Figure 6.10. Fitted Langmuir parameters change as a function of polymer’s hydrophobic number……………………………………………………………………………………...166 Figure 6.11. Contact angle changes for PET surfaces before and after (overnight) treatment with 1% nonionic polymer solutions followed by rinsing with mini-Q water and drying with nitrogen…………………………………………………………………………………….168 Figure 6.12. Proposed illustration for the adsorption of diblock and triblock nonionic polymers. Black segments represent the hydrophilic block of the polymer while the green segments represent the hydrophobic block of the polymer chains………………………...169 Figure 7.1. Chemical structure of polyalkylene glycols (PAGs) (left) and Pluronics (right)……………………………………………………………………………………….176

xv
Figure 7.2. Adsorption isotherms for nonionic polymers adsorbed on polypropylene surfaces. The polymer solution flow rate was kept constant at 0.1 ml/min…………………………..180 Figure 7.3. Adsorption isotherms for nonionic polymers adsorbed on nylon surfaces. The polymer solution flow rate was kept constant at 0.1 ml/min……………………………….180 Figure 7.4. Adsorption isotherms for nonionic polymers adsorbed on PET surfaces. The polymer solution flow rate was kept constant at 0.1 ml/min……………………………….181 Figure 7.5. Adsorption isotherms for nonionic polymers adsorbed on polypropylene surfaces expressed by mol/m2. The data converted from Figure 7.2………………………………..181 Figure 7.6. Adsorption isotherms for nonionic polymers adsorbed on nylon surfaces expressed by mol/m2. The data converted from Figure 7.3……………………………......182 Figure 7.7. Adsorption isotherms for nonionic polymers adsorbed on PET surfaces expressed by mol/m2. The data converted from Figure 7.4…………………………………………...182 Figure 7.8. (a) Maximum adsorption density for different polymer types adsorbing on model surfaces. (b)Affinity constant for different polymers and surfaces. The charts are plotted with increased order of polymer molecular weight and hydrophobic number, respectively. Note that the molecular weight and hydrophobic numbers are indicated in the respective charts.………………………………………………………………………………………………186 Figure 7.9. Water contact angle for PP, nylon and PET surfaces before (CTRL) and after treatment with 1% lubricant solutions (adsorption allowed overnight at 25 °C)…………...188 Figure 8.1. Surface tension of the silicone lubricant used in this investigation…………….199 Figure 8.2. Adsorption curves of silicone lubricant (0.1 % aqueous solution concentration) on polypropylene (black) and polyethylene (red) surfaces. The solid lines represent frequency change, while the dashed lines represent the change in dissipation factor…………………201 Figure 8.3. Adsorption isotherms of the silicone lubricant on PP (square) and PE (circle) surfaces. The solid and open symbols represent the adsorption mass before and after rinsing, respectively. The solid and dashed lines are the best fits to a langmurian type isotherm. The adsorbed mass was calculated from the measured QCM frequency change by using the Sauerbrey equation…………………………………………………………………………203 Figure 8.4. Friction of PE film measured by LFM in air and after treatment of LN336-100I. Data courtesy of project member Yan (Vivian) Li, Cornell University……………………206

xvi
Figure 9.1. The sandwich-like layer for shear protocol (built by Amorphous Cell with Material Studio 4.0, system size: 30Å×30Å×99.2Å (14.5Å wall+40.2Å fluid+14.5Å wall+20Å vacuum space ), 298K, 3000 molecules of water and 5 molecules of polymers. The fluid density is 1g/ml, and the PP surface density is 0.85g/cm3). Figure from project collaborator Hongyi Liu, NC State University……………………………………………..218 Figure 9.2. The relationship of friction coefficient (COF) and normal force (Fn) on cellulose (a), polyethylene (b) and polypropylene (c) films in air, water and in the presence of four types of nonionic polymers. E: polyethylene oxide; P: polypropylene oxide; R: alkyl groups. Data from project collaborator Yan Vivian Li, Cornell University………………………...222 Figure 9.3. Interaction energies of propylene oxide (PO) and ethylene oxide (EO) groups and the interaction energy difference. The surfaces used were cellulose, polypropylene (PP) and polyethylene (PE). Data from project collaborator Hongyi Liu, NC State University…….223 Figure 9.4. Simulation of adsorption behavior of RP6E8 molecules in water on PP surface. 2000 water molecules (red) and five RP6E8 molecules were placed in between the surfaces. The temperature was set at 298K, and the density of the solution assumed to be 1.0g/ml. The simulation time scale was 100 ps. Data from project collaborator Hongyi Liu, NC State University…………………………………………………………………………………..224

1
Chapter 1
Background

2
INTRODUCTION
Surfaces and interfaces play important roles in defining the interactions between “objects”
in everyday life. The term “surface” refers to an interface between an object and its environment
(e.g., air). Recent developments in science and technology have demonstrated the importance of
interfaces in materials science, including applications involving microelectronics, coatings,
colloids, and surfactants 1. In these applications, the interfacial properties can be more important
than the bulk ones and in fact define the molecular characteristics of the system.
The “thickness” of a boundary between two phases, if possible to define, is expected to be
extremely narrow. For example, the interface between two crystals can be only few atoms; on the
other hand, a thick polymer interface entails a soft contact. The scale we, in polymer science, are
interested in is much thicker than that in the case of crystals, usually in the range of one or few
polymer layers. Using polymers to modify the interface offers some advantages due to the
possibility to tune their properties, including the molar mass, architecture, and monomer
composition, etc. However, in order to effectively modify the interfacial properties of a surface,
the polymer has to be bound to the respective interface. The process whereby a polymer binds to
the surface is called “polymer adsorption”. Therefore, polymer adsorption is fundamental in many
important applications involving for example, adhesives, motor oils, colloidal stabilizers and
coatings, to mane only a few.
Adsorption is a consequence of the balance of the surface energy and the nature of the
polymer. In the bulk, the conformation of a polymer depends on the chain composition and
architecture. At an interface, the conformation is perturbed by the attraction of polymer segments

3
towards the surface (see Figure 1.1). The attraction may involve chemical or physical attraction. In
this respect, adsorption can be classified into chemisorption and physisorption, respectively 2.
DD
Figure 1.1. Polymer adsorption onto surfaces from solution. D is the thickness of adsorbed polymer layer.
Polymers or macromolecules possess a broad diversity of properties that are often related
to their dissociation ability in aqueous solution. As such they are classified into ionic (so called
polyelectrolytes) and nonionic polymers. Ionic polymers are also sub-classified into simple
polyelectrolytes, with either positive or negative charged groups, and polyampholytes, which
contain both positive and negative charged groups. As can be expected, the interaction between a
polymer and a surface is different for these different types of polymers.
Polymer adsorption has been studied for many years from theoretical and experimental
approaches 3-11. In this research, we focused on the adsorption of polyampholytes and nonionic
polymers on solid surfaces. In the next sections, a review on polyampholytes in papermaking and
nonionic lubricants in boundary lubricant will be given. At the end of this chapter, a brief account
on the techniques used to study polymer adsorption will be also presented.
4
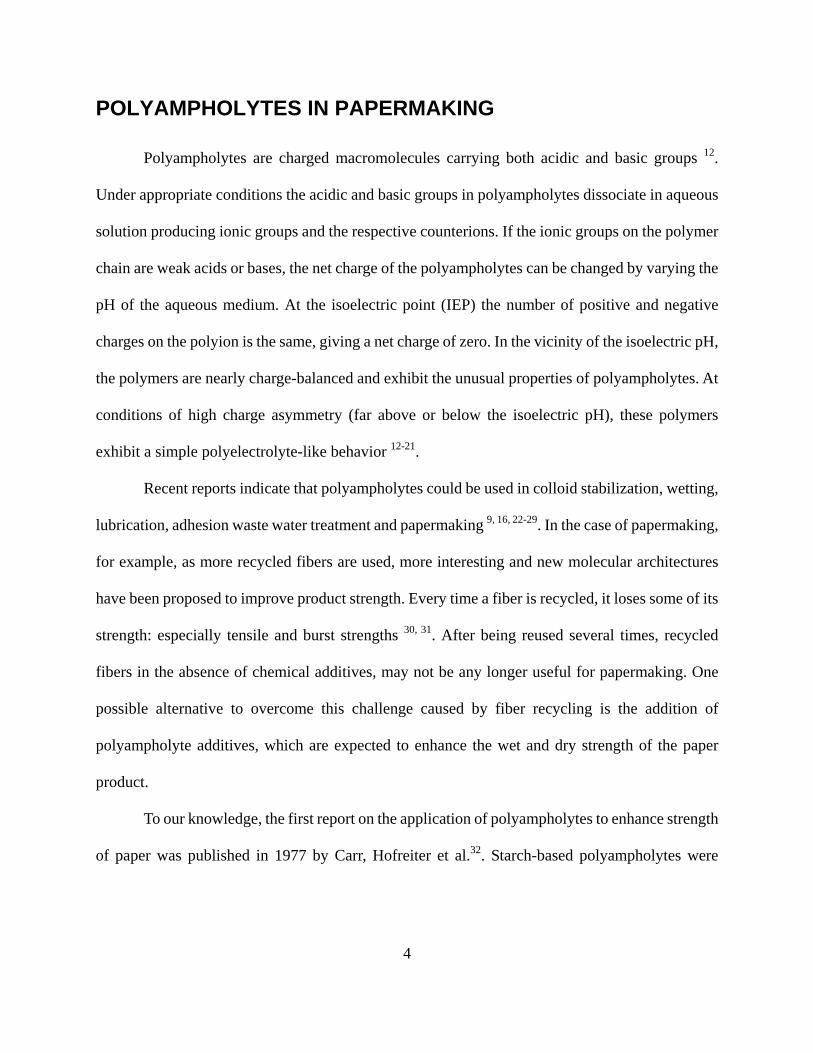
POLYAMPHOLYTES IN PAPERMAKING
Polyampholytes are charged macromolecules carrying both acidic and basic groups 12.
Under appropriate conditions the acidic and basic groups in polyampholytes dissociate in aqueous
solution producing ionic groups and the respective counterions. If the ionic groups on the polymer
chain are weak acids or bases, the net charge of the polyampholytes can be changed by varying the
pH of the aqueous medium. At the isoelectric point (IEP) the number of positive and negative
charges on the polyion is the same, giving a net charge of zero. In the vicinity of the isoelectric pH,
the polymers are nearly charge-balanced and exhibit the unusual properties of polyampholytes. At
conditions of high charge asymmetry (far above or below the isoelectric pH), these polymers
exhibit a simple polyelectrolyte-like behavior 12-21.
Recent reports indicate that polyampholytes could be used in colloid stabilization, wetting,
lubrication, adhesion waste water treatment and papermaking 9, 16, 22-29. In the case of papermaking,
for example, as more recycled fibers are used, more interesting and new molecular architectures
have been proposed to improve product strength. Every time a fiber is recycled, it loses some of its
strength: especially tensile and burst strengths 30, 31. After being reused several times, recycled
fibers in the absence of chemical additives, may not be any longer useful for papermaking. One
possible alternative to overcome this challenge caused by fiber recycling is the addition of
polyampholyte additives, which are expected to enhance the wet and dry strength of the paper
product.
To our knowledge, the first report on the application of polyampholytes to enhance strength
of paper was published in 1977 by Carr, Hofreiter et al.32. Starch-based polyampholytes were
5
prepared by xanthating cationic cornstarch derivatives, which had either tertiary amino
[-CH2CH2N(C2H5)2] or quaternary ammonium [-CH2CHOHCH2N+(CH3)3] groups attached
through linkages. Anionic xanthate groups were introduced into the cationic starch amines. The
substitution degree of the obtained derivatives ranged from 0.023 to 0.33 for the amine cation and
0.005 to 0.165 for the xanthate anion. This work demonstrated that wet-end additions of a starch
polyampholyte was effective in providing both wet and dry strengths, exceeding those given by
either cationic or anionic starch polyelectrolytes. For a given amine degree of substitution (DS),
there was a charge ratio of A (amine, positive)/X (xanthate, negative) at which each polyampholyte
gave a well-defined maximum wet strength. This A/X ratio was about 1 for tertiary amine with a
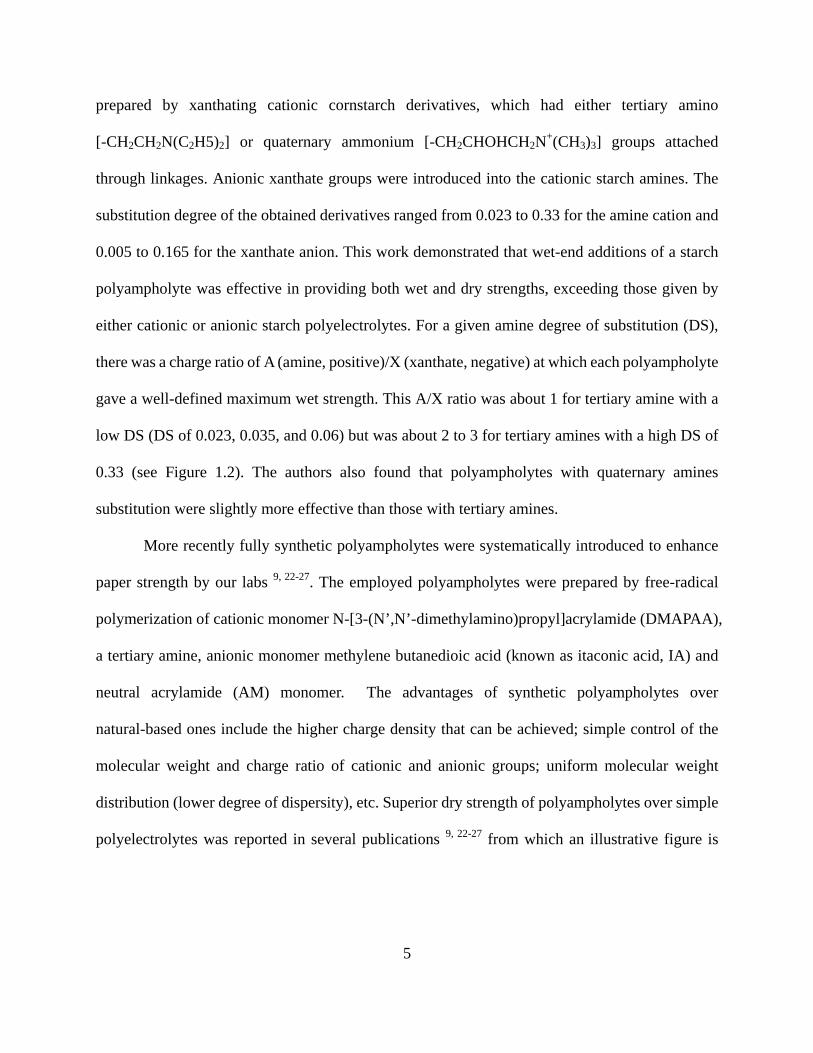
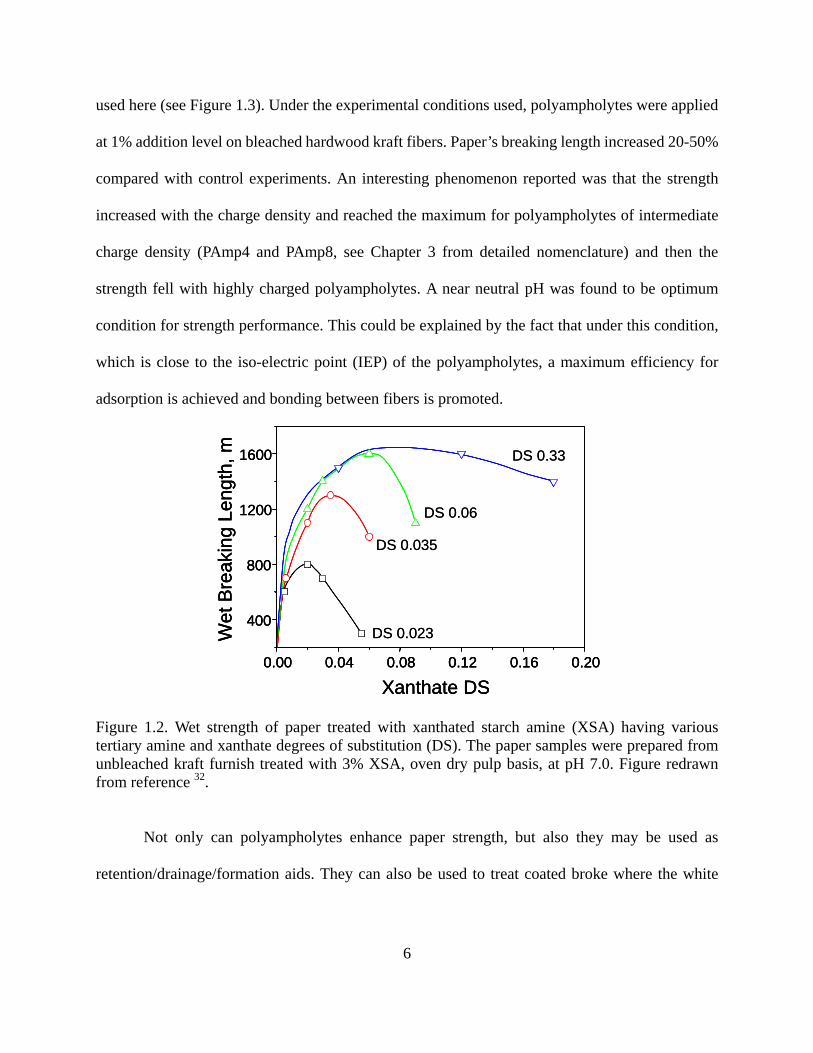
low DS (DS of 0.023, 0.035, and 0.06) but was about 2 to 3 for tertiary amines with a high DS of
0.33 (see Figure 1.2). The authors also found that polyampholytes with quaternary amines
substitution were slightly more effective than those with tertiary amines.
More recently fully synthetic polyampholytes were systematically introduced to enhance
paper strength by our labs 9, 22-27. The employed polyampholytes were prepared by free-radical
polymerization of cationic monomer N-[3-(N’,N’-dimethylamino)propyl]acrylamide (DMAPAA),
a tertiary amine, anionic monomer methylene butanedioic acid (known as itaconic acid, IA) and
neutral acrylamide (AM) monomer. The advantages of synthetic polyampholytes over
natural-based ones include the higher charge density that can be achieved; simple control of the
molecular weight and charge ratio of cationic and anionic groups; uniform molecular weight
distribution (lower degree of dispersity), etc. Superior dry strength of polyampholytes over simple
polyelectrolytes was reported in several publications 9, 22-27 from which an illustrative figure is
6
used here (see Figure 1.3). Under the experimental conditions used, polyampholytes were applied
at 1% addition level on bleached hardwood kraft fibers. Paper’s breaking length increased 20-50%
compared with control experiments. An interesting phenomenon reported was that the strength
increased with the charge density and reached the maximum for polyampholytes of intermediate
charge density (PAmp4 and PAmp8, see Chapter 3 from detailed nomenclature) and then the
strength fell with highly charged polyampholytes. A near neutral pH was found to be optimum
condition for strength performance. This could be explained by the fact that under this condition,
which is close to the iso-electric point (IEP) of the polyampholytes, a maximum efficiency for
adsorption is achieved and bonding between fibers is promoted.
0.00 0.04 0.08 0.12 0.16 0.20
400
800
1200
1600
Wet
Bre
akin
g Le
ngth
, m
Xanthate DS
DS 0.33
DS 0.06
DS 0.035
DS 0.023
0.00 0.04 0.08 0.12 0.16 0.20
400
800
1200
1600
Wet
Bre
akin
g Le
ngth
, m
Xanthate DS0.00 0.04 0.08 0.12 0.16 0.20
400
800
1200
1600
Wet
Bre
akin
g Le
ngth
, m
Xanthate DS
DS 0.33
DS 0.06
DS 0.035
DS 0.023
Figure 1.2. Wet strength of paper treated with xanthated starch amine (XSA) having various tertiary amine and xanthate degrees of substitution (DS). The paper samples were prepared from unbleached kraft furnish treated with 3% XSA, oven dry pulp basis, at pH 7.0. Figure redrawn from reference 32.
Not only can polyampholytes enhance paper strength, but also they may be used as
retention/drainage/formation aids. They can also be used to treat coated broke where the white

7
pitch or stickies and pigments are fixed to the long fibers and fiber fines and, finally, in process
water clarification to settle or float the solids from the white water for solids removal 26, 32, 33.
Despite the fact that a number of theoretical and computational efforts has been reported 13,
14, 17, 18, 21, 28, 34-36, there is a lack of experimental data to advanced our knowledge in this field. The
previous account and ensuing citations is only an example of some of the few reports available in
this area. Therefore there is a need for understanding the adsorption phenomena, especially in the
case of polyampholytes, that will lead to new functional additives and improved performance.
2.0
2.5
3.0
3.5
4.0
4.5
5.0
PAm
p2
pH=5pH=8.5
pH=4
Polymer (1% Treatment Level)
Bre
akin
g Le
ngth
(km
)
Bleached HW Kraft FibersPA
mp4
PAm
p8PA
mp1
6
Cat.
An.
Cont
rol2.0
2.5
3.0
3.5
4.0
4.5
5.0
PAm
p2
pH=5pH=8.5
pH=4
Polymer (1% Treatment Level)
Bre
akin
g Le
ngth
(km
)
Bleached HW Kraft FibersPA
mp4
PAm
p8PA
mp1
6
Cat.
An.
Cont
rol
Figure 1.3. Effect of macromolecular composition and pH on the tensile strength of polymer-treated bleached kraft fibers at 1000 µS/cm conductivity 25. Structures of polymers denoted as “PAmp 2, 4, 8, 16”, “Cat” and “An” can be seen with more detail in Chapter 3).
In this study we carried out adsorption experiments with a series of polyampholytes having
increased total charge densities at a constant ratio of cationic to anionic monomeric groups and
molecular mass. The principal aim of our efforts in polyampholyte research (Chapter 5) is to
clarify the relationship between the charge nature of these polymers and the adsorption and
8
conformation of the respective adsorbed layers.
LUBRICATION AND TRIBOLOGY IN TEXTILE PROCESSING
The science of friction, lubrication and wear, also called tribology, has long been of both
technical and practical interest, since the functioning of many mechanical systems depends on
these phenomena 37. This field has received increased attention as the incommensurable waste of
resources resulting from unwanted high friction and wear has become evident. In fact, according to
some estimations, proper attention to tribology could lead to economic savings of 1.3% to 1.6% of
the Gross National Product (GNP) 38.
In textile processing, fibers, threads and yarns go through many different stages, including
pretreatment, dyeing, printing and finishing until they are weaved into end products. Machinery
and equipment are inevitably involved in handling fibers at high shear rates. Fiber materials are
subjected to destructive abrasive forces that can be the result of both mutual abrasion between
strands and/or between the strands and equipment surfaces. In order to control friction and reduce
wear between fibers and between fibers and metal surfaces (and other materials such as ceramics,
etc.), the use of lubricants is indicated. Fiber lubricants are commonly used during the production
of many different fiber grades, including fiberglass and synthetic fibers such as polyesters,
polyolefins, polyacrylics, polyamides, etc.39. A myriad of different lubricant formulations exists
depending on the intended use and operation conditions. We worked closely with industry to
identify model fiber lubricant systems. An advisory team provided us with input and shared their
industrial expertise. Four general classes of boundary lubricants for low energy polymer surfaces
were identified:

9
(1) High molecular weight, water dispersible products - significantly reduce abrasion
damage to fibers in aggressive textile processes and seem to function most effectively in dynamic,
higher speed situations;
(2) Waxy materials - traditional boundary lubricants that function in both low speed (fiber
to fiber) and high speed (fiber to metal, fiber to ceramic) applications;
(3) Low molecular weight polymers that have high affinity for the polymer surface and
tend to structure themselves on the surface and,
(4) Silicone based materials - tend to have high affinity for the surface of many of the
polymers that are used in fibers.
Our focus in this research involved nonionic surface-active polymers and silicone
surfactants. With the technological development in fiber processing, there is a major trend in
textile operation towards higher speed, higher productivity and better quality. Therefore, the
motivation of our research rested on the need to develop better quality lubricants to meet the
requirements of fiber processing. This prompted us to understand the structure-property relations
of lubricants that would eventually lead to the design of systems that better meet textile demands.
Lubrication phenomena
Lubrication phenomena are involved when substances such as grease or oil (so-called
lubricants) are applied to moving objects to reduce friction. Amonton's law, one of the best known
theories concerning lubrication and friction, was proposed in the 17th century in order to describe
sliding friction analytically, at the macroscopic scale 37:
/fF Nμ = (Equation 1.1)

10
where μ is the coefficient of friction, which is a dimensionless scalar value that describes
the ratio of the force of friction between two bodies, Ff, and the force pressing them together and
the normal force applied, N. From a macroscopic view, μ is a constant, which is related to the
nature of both contacting objects; here the frictional force (Ff ) is independent of the apparent
contact surface. This equation can be applied in many cases, at the macroscopic scale and for
sliding objects directly in contact. However, simple experimental observation shows that frictional
forces do depend on the contact area, the surface roughness as well as the chemical nature of the
sliding substances.
When dealing with fluid lubricants, it is found that the situation becomes even more
complicated since the gap between the two moving objects may vary. The friction coefficient may
depend on the gap between the sliding surfaces as well as the sliding speeds or shear rates.
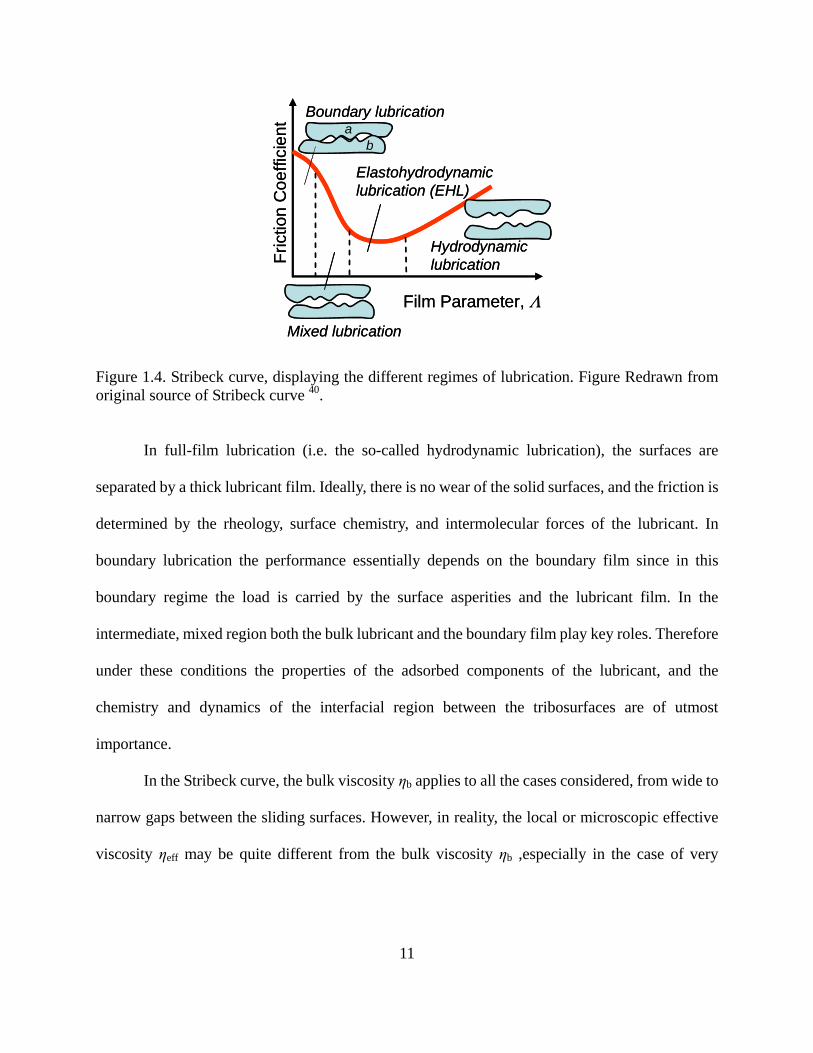
According to Hamrock 40, four different regimes of fluid film lubrication can be defined, i.e.,
boundary, mixed, elasto-hydrodynamic and hydrodynamic regimes, depending on the film
parameter Λ. A profile of friction coefficient as a function of Λ is illustrated by the Stribeck curve
(Figure 1.4). The film parameter, Λ, represents the minimum film thickness separating the two
surfaces and can be quantified by using Equation 1.2:
/bV PηΛ = × (Equation 1.2)
where V is the threadline speed in the case of textile processing; ηb is the bulk viscosity of the
lubricant (or textile finish) and P is the pressure applied between the two sliding surfaces.
11
Fric
tion
Coe
ffici
ent
Film Parameter, Λ
Boundary lubrication
Mixed lubrication
Elastohydrodynamiclubrication (EHL)
Hydrodynamiclubrication
ab
Fric
tion
Coe
ffici
ent
Film Parameter, Λ
Boundary lubrication
Mixed lubrication
Elastohydrodynamiclubrication (EHL)
Hydrodynamiclubrication
ab
Figure 1.4. Stribeck curve, displaying the different regimes of lubrication. Figure Redrawn from original source of Stribeck curve 40.
In full-film lubrication (i.e. the so-called hydrodynamic lubrication), the surfaces are
separated by a thick lubricant film. Ideally, there is no wear of the solid surfaces, and the friction is
determined by the rheology, surface chemistry, and intermolecular forces of the lubricant. In
boundary lubrication the performance essentially depends on the boundary film since in this
boundary regime the load is carried by the surface asperities and the lubricant film. In the
intermediate, mixed region both the bulk lubricant and the boundary film play key roles. Therefore
under these conditions the properties of the adsorbed components of the lubricant, and the
chemistry and dynamics of the interfacial region between the tribosurfaces are of utmost
importance.
In the Stribeck curve, the bulk viscosity ηb applies to all the cases considered, from wide to
narrow gaps between the sliding surfaces. However, in reality, the local or microscopic effective
viscosity ηeff may be quite different from the bulk viscosity ηb ,especially in the case of very

12
confined systems of ultra narrow gaps 41. Discontinuous transitions between different dynamic
states (e.g. solid-to-solid or static-to-kinetic sliding transitions) not considered in the Stribeck
theory often occur in thin films (produced by the lubricant molecules specifically adsorbed on the
surfaces). In addition, the ordering and frictional behaviors of the confined molecules are found to
switch at some critical load, velocity or temperature (which is different from the melting point of
the bulk fluid). Therefore, Luengo, Israelahvili and Granick 42 proposed a set of improved
Stribeck-type curves that are based on experimental data typical in engineering conditions. They
used three individual figures, shown as Figure 1.5, 1.6 and 1.7, to illustrate how friction changes
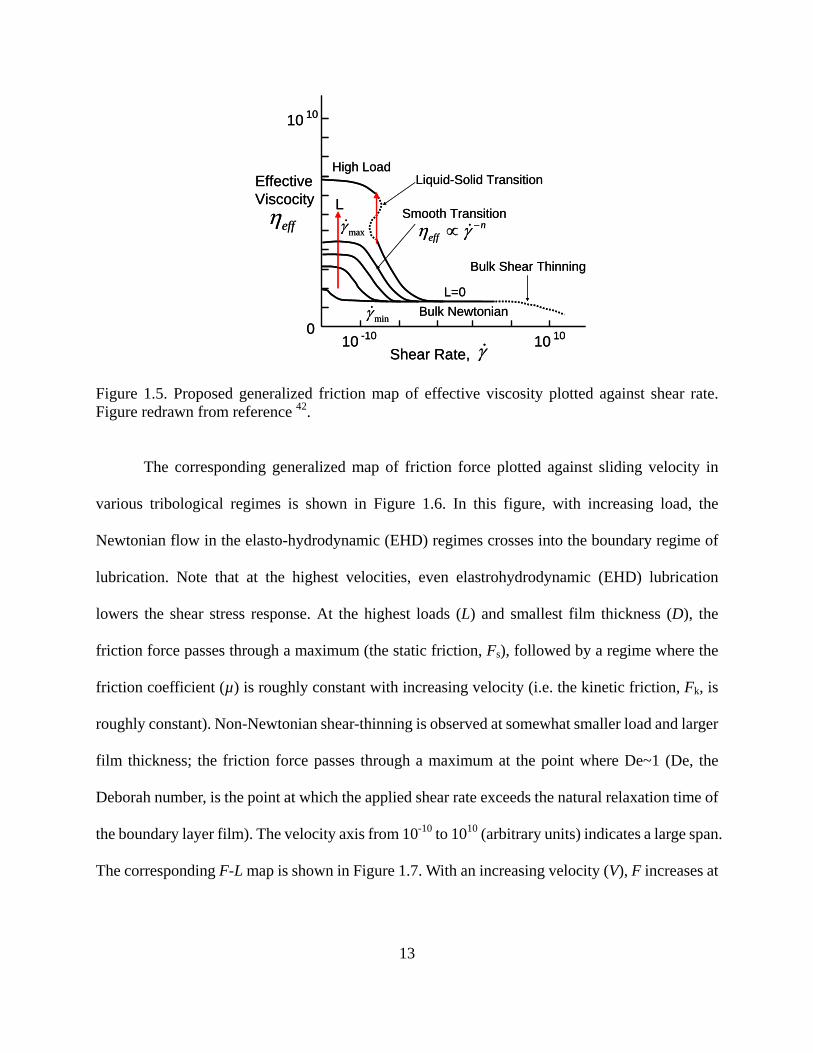
against with shear rate, sliding velocity and load. In Figure 1.5, three main classes of fluid
behaviors can be distinguished: (1) Thick film, elastro-hydrodynamic sliding: At zero load (L=0),
ηeff is independent of the shear rate except that shear–thinning may be displayed when shear rate is
sufficiently large. (2) Boundary layer film, intermediate regime: A Newtonian regime is observed
at low loads and low shear rates, but ηeff is much higher that the bulk value, ηb. As the shear rate
increases beyond minγ , these systems reach a point where the effective viscosity starts to drop with
a power-law dependence on the shear rate. As the shear rate increase still more, beyond γ max, a
second Newtonian plateau is again encountered. (3) Boundary layer films, high load: The ηeff
continues to grow with load and the behavior is Newtonian provided that the shear rate is
sufficiently low. Transition to sliding at high velocity is discontinuous and usually of the stick-slip
type.
13
010 -10 10 10
10 10
L
High LoadLiquid-Solid Transition
Smooth Transition
Shear Rate, γ
Bulk Shear Thinning
minγ Bulk NewtonianL=0
EffectiveViscocity
effη neffη γ −∝maxγ
010 -10 10 10
10 10
L
High LoadLiquid-Solid Transition
Smooth Transition
Shear Rate, γ
Bulk Shear Thinning
minγ Bulk NewtonianL=0
EffectiveViscocity
effη neffη γ −∝maxγ
Figure 1.5. Proposed generalized friction map of effective viscosity plotted against shear rate. Figure redrawn from reference 42.
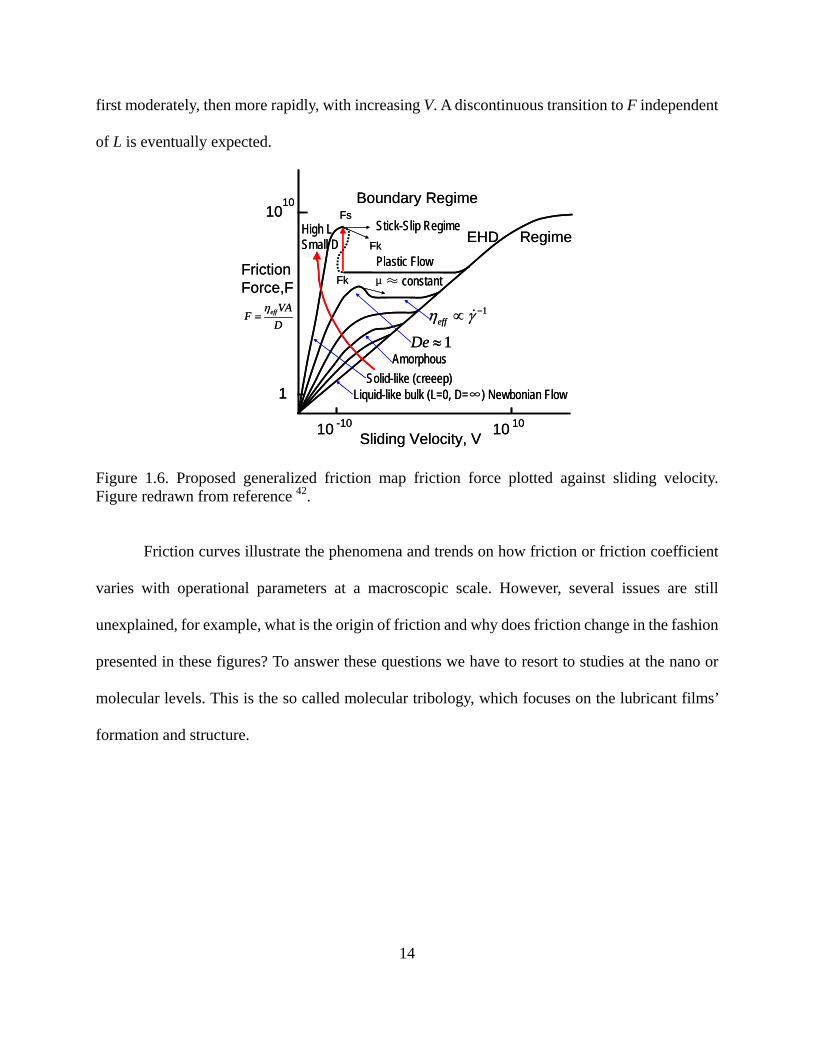
The corresponding generalized map of friction force plotted against sliding velocity in
various tribological regimes is shown in Figure 1.6. In this figure, with increasing load, the
Newtonian flow in the elasto-hydrodynamic (EHD) regimes crosses into the boundary regime of
lubrication. Note that at the highest velocities, even elastrohydrodynamic (EHD) lubrication
lowers the shear stress response. At the highest loads (L) and smallest film thickness (D), the
friction force passes through a maximum (the static friction, Fs), followed by a regime where the
friction coefficient (µ) is roughly constant with increasing velocity (i.e. the kinetic friction, Fk, is
roughly constant). Non-Newtonian shear-thinning is observed at somewhat smaller load and larger
film thickness; the friction force passes through a maximum at the point where De~1 (De, the
Deborah number, is the point at which the applied shear rate exceeds the natural relaxation time of
the boundary layer film). The velocity axis from 10-10 to 1010 (arbitrary units) indicates a large span.
The corresponding F-L map is shown in Figure 1.7. With an increasing velocity (V), F increases at
14
first moderately, then more rapidly, with increasing V. A discontinuous transition to F independent
of L is eventually expected.
Boundary Regime
EHD Regime
Liquid-like bulk (L=0, D=∞) Newbonian Flow
High LSmall D
Solid-like (creeep)
Stick-Slip Regime
Plastic Flowμ≈ constantFk
Fs
Amorphous1De ≈
1effη γ −∝
FrictionForce,F
effVAF
Dη
=
Sliding Velocity, V10 -10 10 10
1010
1
Fk
Boundary Regime
EHD Regime
Liquid-like bulk (L=0, D=∞) Newbonian Flow
High LSmall D
Solid-like (creeep)
Stick-Slip Regime
Plastic Flowμ≈ constantFk
Fs
Amorphous1De ≈
1effη γ −∝
FrictionForce,F
effVAF
Dη
=
Sliding Velocity, V10 -10 10 10
1010
1
Fk
Figure 1.6. Proposed generalized friction map friction force plotted against sliding velocity. Figure redrawn from reference 42.
Friction curves illustrate the phenomena and trends on how friction or friction coefficient
varies with operational parameters at a macroscopic scale. However, several issues are still
unexplained, for example, what is the origin of friction and why does friction change in the fashion
presented in these figures? To answer these questions we have to resort to studies at the nano or
molecular levels. This is the so called molecular tribology, which focuses on the lubricant films’
formation and structure.

15
Friction
Load, L
Low V
High V
FForce,
00
Friction
Load, L
Low V
High V
FForce,
00
Figure 1.7. Proposed generalized friction map of friction force plotted against load. Figure redrawn from reference 42.
While this thesis covers the general topic of boundary lubrication, only a few parameters
were studied. Our focus lay in the chemistry and adsorbed layer state of nonionic and silicone
surfactants. Issues related to roughness, asperities and others are not considered here.
Thin film lubrication
Lubrication in textile processing
Within the boundary lubrication regime, the load is carried by the lubricant thin film. A
typical lubricant film is very thin, usually 100 nm or lower, i.e., only several to hundreds of
molecules thick 43-45. Studying the structure of lubricant thin films and how the molecules organize
during the lubrication process is of utmost importance. Here physisorption (as opposed to
chemisorption) is a dominant effect since in textile processing the lubricant film is not always

16
intended to be retained onto the surface of the fibers, specially if the lubricant on fiber surfaces
would interfere with successive processes, such as finishing and dyeing. However, the robustness
or strength of adsorbed layer in textile processing is an issue that hasn’t been addressed
systematically.
Property changes and transitions in thin films
The properties of lubricant thin films change depending on their distance from the surface.
When the thickness of the adsorbed film is comparable to the dimensions of the lubricant
molecules themselves, the properties of the thin film is quite different than that of the bulk medium
41. As shown in Figure 1.8, the effective viscosity, elasticity and relaxation time grow with
diminishing thickness and diverges when the film thickness is sufficiently small. In this case,
classical continuum considerations, which apply to the bulk phase, do not apply to thin films.
•Viscosity•Elasticity•Relaxationtime
Solid Boundaryliquid
Bulk liquid
Continuumproperties
Å nm μm
•Viscosity•Elasticity•Relaxationtime
Solid Boundaryliquid
Bulk liquid
Continuumproperties
Å nm μm
Figure 1.8. Schematic diagram of how the effective viscosity, elasticity and relaxation change with thickness of a lubricant film. Figure redrawn from reference 41.
The diffusion coefficient of lubricant molecules in thin films also diverges when compared
with that in the bulk. Mukhopadhyay et al. 46 found that the molecular diffusion coefficient

17
decreases exponentially from the edges towards the center in systems under Hertzian contact.
Hertzian contact is an ideal model to describe deformation and lubrication. In this model, only
small deformation occurs in contact areas, contacting bodies are elastic and therefore only vertical
forces are considered. Granick et al. 47, 48 studied the influence of shear behavior on polymer
interfacial diffusion. According to their results, shear did not modify substantially the Brownian
diffusion.
Phase behaviors of lubricants may change in confinement conditions. This may be one of
the reasons why properties of thin films differ from the bulk. Confinement-induced phase states of
lubricant layers could change from liquid-like to an amorphous state and then to a solid-like state 49.
Low friction is exhibited by solid-like and liquid-like layers; high friction is exhibited by
amorphous layers. A change of some factors, such as temperature and humidity generally can shift
the phase status from the solid-like towards the amorphous or liquid-like states.
Confinement-induced solidity of lubricant was observed by Denirel and Granick 50 by placing
octamethyl cyclotetrasiloxane (OMCTS) liquids between two rigid mica plates when spacing was
decreased below ca. 10 molecular dimensions. This phenomena was also observed by Israelachvili
and coworkers 51, 52 by shearing polybutadiene (PBD) of 7000 molecular weight . They found that
at low shear rates, PBD exhibited bulk-like properties in films thicker than about 200 nm. In
thinner films (200-20 nm), the shear viscosity ηeff and moduli G' and G'' became quite different
from those of the bulk. On entering the tribology regime (film thickness <30 nm) PBD exhibited
highly nonlinear behavior and yield points, indicative of phase transitions to "glassy" or
"solid-like" states. Klein et al 53 discovered that the transition between liquid-like behavior and a

18
solid-like phase of the liquids under progressive confinement take place abruptly at a distance
around six molecular layers. The films that are thinner than six molecular layers behaved in a
solid-like fashion, in the sense that they required a critical stress in order to shear them.
Structure of lubricant films
Why can lubricants reduce friction, i.e. how do lubricants work and how do the lubricant
molecules behave under shear? This question is being investigated by several groups. Lubricant
molecules organize themselves under shear as illustrated in Figure 1.9 by Yoshizawa et al 49. A
critical velocity Vc* exists; if the sliding velocity of two surfaces are below it, a polymeric
lubricant film exhibits amorphous structure and chains of polymer interplay and entangle with
each other. In this case high friction is produced (static-kinetic sliding). This phenomenon supports
that chain interdigitation is an important molecular mechanism that gives rise to “boundary”
friction and adhesion hysteresis of monolayer-coated surfaces. If the sliding velocity of two
surfaces is above the critical velocity, polymer chains will be aligned or “combed” by shear into an
ordered conformation and therefore will result in very low friction (superkinetic sliding).
Figure 1.9. Lubricant molecules organized by shear. Figure redrawn from reference 49
Shear–induced alignment of lubricant molecules was supported by a number of
Static-kinetic sliding Superkinetic sliding
D
V>Vc* V<Vc*

19
experiments. Frantz and co-workers 54 adsorbed polyisoprene onto a single solid surface and found
that the backbone of the polymer oriented in the direction of flow. They also found that the extent
of orientation increased with increasing molecular weight. The structure of the lubricant, such as
chain length 54, packing densities 55, 56, and nature of the polymer (brush-like 11 or grafted polymer
57 and chain ends 58) influenced its alignment under shear.
Within these investigations, the work of Urbakh et al 57 is very significant. They used
grafted polyelectrolytes, hyaluronan and hylan, to mimic cartilage lubrication. These
polysaccharides (outermost cartilage layer) were not expected to be the responsible molecule for
the great lubricity of cartilage; however, the authors found that they may contribute to the load
bearing and wear protection in these surfaces. Their study showed that a low coefficient of friction
is not a requirement for, or necessarily a measure of, wear protection. This gives us much
inspiration to think about the design and formulation of lubricants and their layer structure for wear
protection.
Techniques to study thin films and lubrication phenomena
It is well known that the function of thin films in boundary lubrication and mixed
lubrication regimes is to offer friction reduction and wear protection. Therefore, thin film
lubrication is a phenomenon that exists universally in conventional tribological systems. A better
understanding of thin film lubrication will improve our knowledge of how lubricants work, and
will result in the development of superior lubricant formulations for use in industry, and also will
improve our capabilities to predict tribological failures.
In the last few decades, rapid advancements in analytical instruments and techniques and

20
the expansion in computer power offered an unprecedented opportunity to unveil how lubricant
polymers behave under boundary lubrication conditions (at the atomic/molecular or nano levels).
Atomic force microscope (AFM) with lateral force capabilities measures the friction between a
substrate and a few to several hundred atoms on a sharp tip. The lateral resolution can be less than
an atomic spacing 59, 60. On the other hand the surface force apparatus (SFA) can measure the
forces between atomically flat surfaces as their separation is varied with Ångstrom level resolution.
The friction and adhesion can be studied as a function of the chemistry and thickness of the
material between the surfaces 11, 61-65. Computer simulation has played an important role in
interpreting and explaining the findings from these experimental methods. Computer simulations
and theoretical investigations have shed much light on the molecular details underlying both
structural and dynamic behavior of liquids in the highly confined regime 66, 67.
From the molecular view, lubrication molecules adsorb on a metal or organic surface with
ordered or oriented chains. As mentioned before, the interactions of solid surfaces and lubricant
films could be physical adsorption, or chemical reactions 68. The thickness or the adsorption mass
and structure of the adsorbed layer are crucial to the performance of lubrication 69-72. SPR and
QCM both are well-established noninvasive techniques capable of providing a wealth of
information about interfacial phenomena in situ, in real time and in fluid media 3, 8, 73-87. The
resolution of surface plasmon resonance (SPR) and quartz crystal microbalance (QCM) are in the
Ångstrom/nano scale. Even though friction cannot actually be measured with QCM and SPR, they
can help find a relationship between adsorbed mass (or thickness) and lubrication phenomena.
Ellipsometry is another powerful technique which can be applied to measure the thickness of

21
adsorbed layers 88. The advantages of QCM are that it can provide some intrinsic properties of the
adsorbed film, such as its viscoelasticity (QCM with dissipation monitoring) and coupled water (if
results from the QCM are compared with those from SPR or ellipsometry).
The ability to evaluate dynamic behaviors is quite similar with both systems from a
technical point of view, but when it comes to sensitivity they differ. Table 1.1 compares the
QCM-D and SPR techniques. QCM-D systems are more sensitive to water-rich and extended
layers, while the SPR system is favored for compact and dense layers. The reason to this difference
is due to the different physical principles by which the coupled mass is measured. The mass-uptake
estimated from SPR data is based on the difference in refractive index between the adsorbed
materials and water displaced upon adsorption. Therefore, water associated with the adsorbed
materials, e.g. the hydration water, is essentially not included in the mass determination. In
contrast, changes in frequency acquired with QCM-D are affected by the coupled water arising
from hydration, the viscous drag and/or entrapment in cavities in the adsorbed film. This means
that the SPR response is proportional to the "dry mass", while in QCM-D measurements the layer
is essentially sensed as "hydrogel" composed of the macromolecules and coupled water. While
SPR measures one parameter only, the additional information contained in energy dissipation
measurements when using QCM-D increases the base for a detailed interpretation. Changes in the
dissipation are related to the shear viscous losses induced by the adsorbed layers, and thus provide
information that has the potential to identify structural differences between different adsorbed
systems, or structural changes in the same type of molecule during the adsorption process through
D-F profile.
22
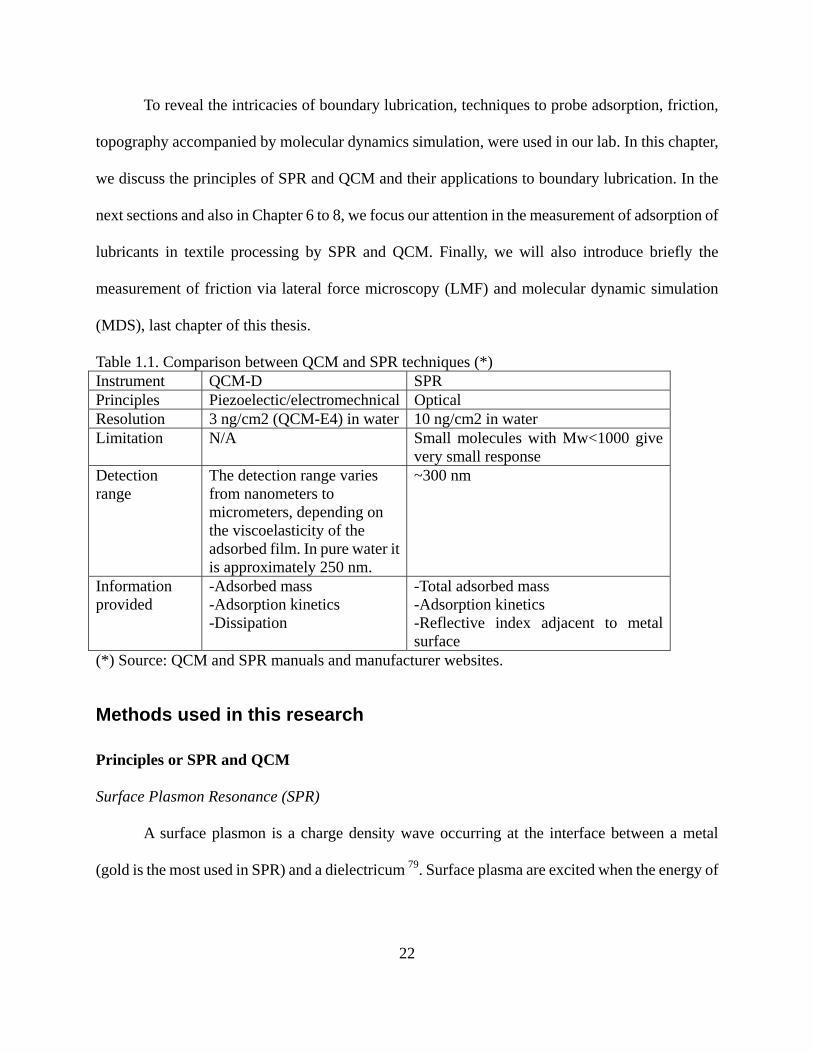
To reveal the intricacies of boundary lubrication, techniques to probe adsorption, friction,
topography accompanied by molecular dynamics simulation, were used in our lab. In this chapter,
we discuss the principles of SPR and QCM and their applications to boundary lubrication. In the
next sections and also in Chapter 6 to 8, we focus our attention in the measurement of adsorption of
lubricants in textile processing by SPR and QCM. Finally, we will also introduce briefly the
measurement of friction via lateral force microscopy (LMF) and molecular dynamic simulation
(MDS), last chapter of this thesis.
Table 1.1. Comparison between QCM and SPR techniques (*) Instrument QCM-D SPR Principles Piezoelectic/electromechnical Optical Resolution 3 ng/cm2 (QCM-E4) in water 10 ng/cm2 in water Limitation N/A Small molecules with Mw<1000 give
very small response Detection range
The detection range varies from nanometers to micrometers, depending on the viscoelasticity of the adsorbed film. In pure water it is approximately 250 nm.
~300 nm
Information provided
-Adsorbed mass -Adsorption kinetics -Dissipation
-Total adsorbed mass -Adsorption kinetics -Reflective index adjacent to metal surface
(*) Source: QCM and SPR manuals and manufacturer websites.
Methods used in this research
Principles or SPR and QCM
Surface Plasmon Resonance (SPR)
A surface plasmon is a charge density wave occurring at the interface between a metal
(gold is the most used in SPR) and a dielectricum 79. Surface plasma are excited when the energy of

23
the photon electrical field is just right so that it can interact with the free electron constellations in
the gold surface. The photon energy is then transferred to the charge density wave. This
phenomenon can be observed as a sharp dip in the reflected light intensity. The angle where the
sharp dip happens is called “SPR angle”. Outside the metal surface there is an evanescent electric
field, which decays exponentially. This evanescent field interacts with the close vicinity of the
metal. Changes in the optical properties of this region will therefore make the (SPR) angle shift.
This is the principle basis of SPR. A schematic of SPS is shown in Figure 1.10.
.
Figure 1.10. Schematics of surface plasmon resonance, from Ref. 89.
The position of the SPR angle depends on the refractive index of the substance with a
low-refractive index close to the sensing surface. The refractive index near the sensor surface
changes because of the binding of polymers to the surface. As a result, the SPR angle will change
according to the amount of bound polymers. The thickness of the adlayer can be estimated from
Equation 1.3 3, which assumes that the thickness of the dielectric film is much less than the
24
wavelength of the probing laser:
2( )( ) (sin )
2 ( )( )fm s s m m s
f cf s f m m s
nd
ελ ε ε ε ε ε ε θπ ε ε ε ε ε ε
− − += Δ
− − (Equation 1.3)
where df is the thickness of adlayer; n is the solvent refractive index; λ is the wavelength of the
incident laser; εf is the dielectric constant of the film; εs is the dielectric constant of the solvent; εm
is the real part of the dielectric constant of the metal; and θc is the critical resonant angle on the
plasmon resonance curve. So for a given system with known solvent and metal,θc is the only
variable. Equation 1.3 can be simplified as:
(sin )f cd k θ= Δ (Equation 1.4)
where k is a factor that can be obtained after a calibration. In most case, θc is very small and there is
a linear relationship between the amount of bound material and the shift of the SPR angle 79, 83.
SPR response values are usually expressed in resonance units, RU (1 RU = 0.0001°) or refractive
index units, RIU (1 RU = 0.001 RIU = 1 μRIU ). For most proteins and polymers, changing of 1
RU is roughly equivalent to a change in concentration of about 1pg/mm2 and changing of 10 μRIU
is roughly equivalent to a change in concentration of about 1 ng/cm2 on the sensor surface. The
exact conversion factor between RU and surface concentration depends on properties of the sensor
surface and the nature of the molecule responsible for the concentration change.
One limitation of SPR technique is that for those compounds with molecular weights
smaller than 100 - 200 Daltons can’t be detected because the change in refractive index for small
molecule binding is too low to be detected directly. On the other side, since the penetration depth
of the evanescent wave’s limitation, for those particles larger than this range cannot be measured

25
totally. However, both situations are not relevant in most cases and linear relationships hold 90. The
reader is referred to a number of excellent review papers 79, 83 and internet resources 90 that discuss
SPR and its principles of operation.
Quartz Crystal Microbalance with Dissipation, QCM-D
A QCM crystal consists of a thin quartz disc sandwiched between a pair of electrodes (cf.
Figure 1.11a). Due to the piezoelectric properties of quartz, it is possible to excite the crystal to
oscillation by applying an AC voltage across its electrodes (cf. Figure 1.11b).
Figure 1.11. QCM sensor (a) and schematic principle of QCM
The resonant frequency (f) of the crystal depends on the total oscillating mass, including
water coupled to the resonator. When a thin film is attached to the sensor crystal the frequency
decreases. If the film is thin and rigid, no or minimum energy dissipation occurs, the decrease in
frequency is proportional to the mass of the film. This is Sauerbrey relation 91:
20 02
q q q qt f v f c fmnf nf n
ρ ρΔ Δ ΔΔ = − = − = − (Equation 1.5)
C = 17.7 ng Hz-1 cm-2 for a 5 MHz quartz crystal. n = 1,3,5,7 is the overtone number.
Since the change in frequency can be detected very accurately the QCM operates as a very
diam. 14mm
Quartz Gold Electrode
Gold Electrode Constant voltage

26
sensitive balance. The quartz crystal microbalance (QCM) was first used to monitor thin film
deposition in vacuum or gas atmospheres at first. More recently, it was shown that the QCM may
be used in the liquid phase, thus the number of applications for the QCM increased dramatically.
The Sauerbrey relation was initially developed for adsorption from gas phase, it is now extended to
liquid media where it holds in most cases. In order to describe soft adlayers of polymer adsorbing
from liquid media, the dissipation value was introduced. Rodahl et al. 80 extended the use of the
QCM technique and introduced the measurement of the dissipation factor simultaneously with the
resonance frequency by switching on and off of the voltage applied onto the quartz. The measured
change in dissipation is due to changes in the coupling between the oscillating sensor and the
surroundings. It is affected by any energy dissipating process and thus influenced by the layer
viscoelasticity and slip of the adsorbed layer on the surface. The dissipation factor D, is the inverse
of the so-called Q factor and defined by:
12
disspated
stored
ED
Q Eπ= = (Equation 1.6)
where Edissipated is the energy dissipated during one period of oscillation and Estored is the energy
stored in the oscillating system. The resonance frequency is measured when the oscillator is on and
when it is turned off the amplitude of oscillation, A, can be determined in it decay as an
exponentially damped sinusoidal function:
/0( ) sin( )tA t A e t cτ ω ϕ−= + + (Equation 1.7)
where τ is the decay time, ω is the angular frequency at resonance, φ is the phase angle and
the constant, c, is the offset. The dissipation factor is related to the decay time through Equation

27
1.8.
1Dfπ τ
= (Equation 1.8)
Combinating Equations 1-5 and 1-8, the dissipation changes can be expressed as Equation 1.9.
Dissipation changes not only with the properties of the adsorbed layer but also with the density and
viscosity of the solution 81:
12
f f
q q
D nt f
η ρρ π
Δ = (Equation 1.9)
Generally, soft adlayers dissipate more energy and thus are of higher dissipation value. From this
point of view, dissipation value is an indicator of the conformation of the adlayers. This is the
fundamental basis of QCM-D technique.
A practical QCM-D system records the signals of fundamental frequency (5 MHz) and
overtones (e.g. 15, 25 and 35 MHz and even high frequencies for newly developed systems). Each
overtone has its own detecting range in thickness. This enables its abilities to measure non-uniform
adlayer. Theoretical work was done by Voinova and coworkers 92. A general equation was derived
to describing the dynamics of two-layer viscoelastic polymer materials of arbitrary thickness
deposited on solid (quartz) surfaces in a fluid environment.
2 2
3 32 2 2
1,20 0 3 3
1 2 jj j j
j j j
f h hh
η ωη ηρ ωπρ δ δ μ ω η=
⎧ ⎫⎡ ⎤⎛ ⎞⎪ ⎪⎢ ⎥Δ ≈ − + −⎨ ⎬⎜ ⎟ +⎢ ⎥⎝ ⎠⎪ ⎪⎣ ⎦⎭⎩∑ (Equation 1.10)
2
3 32 2 2
1,20 0 3 3
1 22
jj
j j j
D hf h
μ ωη ηπ ρ δ δ μ ω η=
⎧ ⎫⎡ ⎤⎛ ⎞⎪ ⎪⎢ ⎥Δ ≈ +⎨ ⎬⎜ ⎟ +⎢ ⎥⎝ ⎠⎪ ⎪⎣ ⎦⎩ ⎭∑ (Equation 1.11)
28
where ρ stands for density; h stands for thickness; η stands for viscosity and δ stands for the
viscous penetration depth ( 2ηδρω
= ). The subscript 0, 1, 2 and 3 denote quartz crystal, layer 1,
layer 2 and bulk solution respectively. From this model, the shift of the quartz resonance frequency
and the shift of the dissipation factor strongly depend on the viscous loading of the adsorbed layers
and on the shear storage and loss moduli of the overlayers. These results can readily be applied to
quartz crystal acoustical measurements of the viscoelasticity of polymers which conserve their
shape under the shear deformations and do not flow, and layered structures such as protein films
adsorbed from solution onto the surface of self-assembled monolayers. By measuring at multiple
frequencies and applying this model, which has been incorporated in Q-Sense software QTools ™,
the adhering film can be characterized in detail: viscosity, elasticity and correct thickness may be
extracted even for soft films when certain assumptions are made.
In summary, QCM technique with dissipation monitoring has the advantage that it can
measure the adsorbed amount via Δf and conformation via ΔD, simultaneously in situ and in real
time. Furthermore, some adlayer properties, such as viscosity, elasticity and effective thickness
can also be extracted from a set of measurements, as will be illustrated later in the respective
chapters.
Applications of SPR and QCM to Study Lubricant Films
Monitoring adsorption and desorption of lubricants
The basic application of SPR and QCM is to monitor the adsorption and desorption of
macromolecules on surfaces. They can be used in various ways to study lubrication: Firstly, they
29
are useful to find out if a lubricant has affinity or not with a given organic/polymeric substrate.
Secondly, they enable elucidation of how strong the affinity is and, thirdly, QCM and SPR can
measure the actual kinetics of adsorption and desorption.
Typical adsorption curves can be seen in other chapters of this thesis. If we take Figure 8.2
as a reference, it can be succinctly explained here that we compared the affinity difference for a
commercial silicone-based lubricant onto polyethylene (PE) and polypropylene (PP) surfaces. The
experiment started with a baseline, and then silicone lubricant solution was injected in the loop.
Correspondingly, a sharp frequency drop and dissipation raise were observed (see Figure 8.2)
since the lubricant adsorbed on the surface. When both frequency and energy dissipation reached
their equilibrium state, large amount of pure water was injected to rinse. A sharp rise in frequency
and a sharp drop in dissipation could then be observed. This behavior indicated that lubricant
molecules in bulk as well as molecules loosely bonded on the surface were removed by rinsing.
During the experimental process, the injection speed of the sample was kept constant at 0.1ml/min.
Comparing the adsorption curves of PP with those of PE, the frequency change for PP film was
observed to be larger than that for PE film, either on the basis of total adsorption (-22.5 Hz vs -18.4
Hz) or adsorption after rinsing (-10.2 Hz vs -8.6 Hz). This indicates that the affinity of silicone
lubricant with PP is much higher that that with PE surface. We note that energy dissipation values
didn’t change significantly. This indicated that the adsorbed layers on PP and PE had similar
viscoelasticities (related to thickness, composition and conformation).

30
Figure 1.12. Time-dependent frequency change of QCM for EM and AF adsorbed on QCM crystal at 200 °C. From reference 93.
Lubricant degradation can also be measured by the QCM technique. In order to monitor the
degrading process of lubricants at high temperature, Wang et al. 93 developed a QCM system
which could endure high temperatures (more than 200 ºC). They evaluated the thermal stability of
polyol ester lubricants in the QCM chamber. Figure 1.12 provides an example that demonstrates
how different lubricants showed different sensitivities to temperature. Here the lubricants were
hold in a T-controlled chamber. The lubricants degraded gradually when they were heated to very
high temperature leaving solid residues on the tested QCM crystal surfaces. Two
commercial-grade pentaerythritol tetrapelargonate based lubricants, EM, AF (codes for two
commercial lubricant compositions), are shown in this figure. During the first nine hours, both EM
and AF didn’t change too much with the temperature treatment which indicated that both
lubricants were stable. However, after exposure to high temperatures for nine hours the frequency
of AF decreased rapidly while EM barely changed. This indicated that EM was much more stable

31
than AF at the tested temperature of 200 ºC. The results from QCM can thus provide an integral
picture of the thermal stability of lubricants from the quantitative, real-time, in situ information it
generates during the thermal decomposition of the lubricants.
Kinetics of adsorption and desorption
Figure 1.13. Change in frequency for 5 MHz Si crystals upon injection of OTS (10 mM). The arrow indicates injection time. Insert is an enlargement of the region indicated by the box, to show the stability level. Figures from reference 7.
The time-dependent signals (changes in frequency and refractive index in QCM and SPR,
respectively) can be used to study the adsorption kinetics. The Langmuir isotherm, an often used
model, is a simple equation that relates adsorption and concentration. For such a mechanism, the
adsorption rate can be written as represented in Equation1.12:
( ) [1 exp( )]t tβφ αα
= − − (Equation 1.12)
where φ is the fraction of free active sites on the surface, b af ar= C k + kα and b af= C kβ . Cb is the
concentration of lubricant, while kaf and kar represent the constants of adsorption and desorption,
respectively. The parameters α and β can be obtained by fitting the frequency to Equation 1.12. An
example of QCM data with its theoretical Langmuir fit is shown in Figure 1.13 7. From the relation

32
between α and Cb, the values of kar and kaf can be determined. The results of the adsorption rate
calculations, the equilibrium constant ( eq af arK =k /k ), and free energy of adsorption were also
determined by Equation 1.13:
ln eqG RT KΔ = − (Equation 1.13)
Conformation of lubricant films revealed by the QCM-D
As described before, the conformation of adsorbed lubricant layers can be derived from
QCM data. For rigid, ultrathin, and evenly distributed adsorbed layers, the Sauerbrey equation 91
describes successfully the proportional relationship between the adsorbed mass (m) and the shift of
the QCM crystals’ resonance frequency (f ). Under these conditions, the dissipation value is a
constant. It doesn’t change with time or with increased adsorbed mass. On the other hand, if the
adsorbed material exhibits a viscoelastic behavior, such as for layers of proteins, substantial
deviations from the Sauerbrey equation can occur. Using ΔD–Δf plots one can eliminate time as an
explicit parameter and as concluded in previous studies 6, 81, 88, 94, the absolute slopes and their
changes provide information about the kinetic regimes and conformational changes 88. These slope
values indicate the conformation of adsorbed layer: The lower value indicates a softer layer. If
more than one slope exists, it can be concluded that more than one conformation states of the
adsorbed layer are present during the adsorption process. Figure 1.14 shows the relation between
dissipation change and frequency change for low and high charge density polyampholytes. From
these slope values one can draw meaningful conclusions including the fact that the low charge
density polyampholytes tend to form a uniform layer. For high charge density polyampholytes, the
adsorbed layer is no longer uniform since the slope changes and the inner layer is more compact
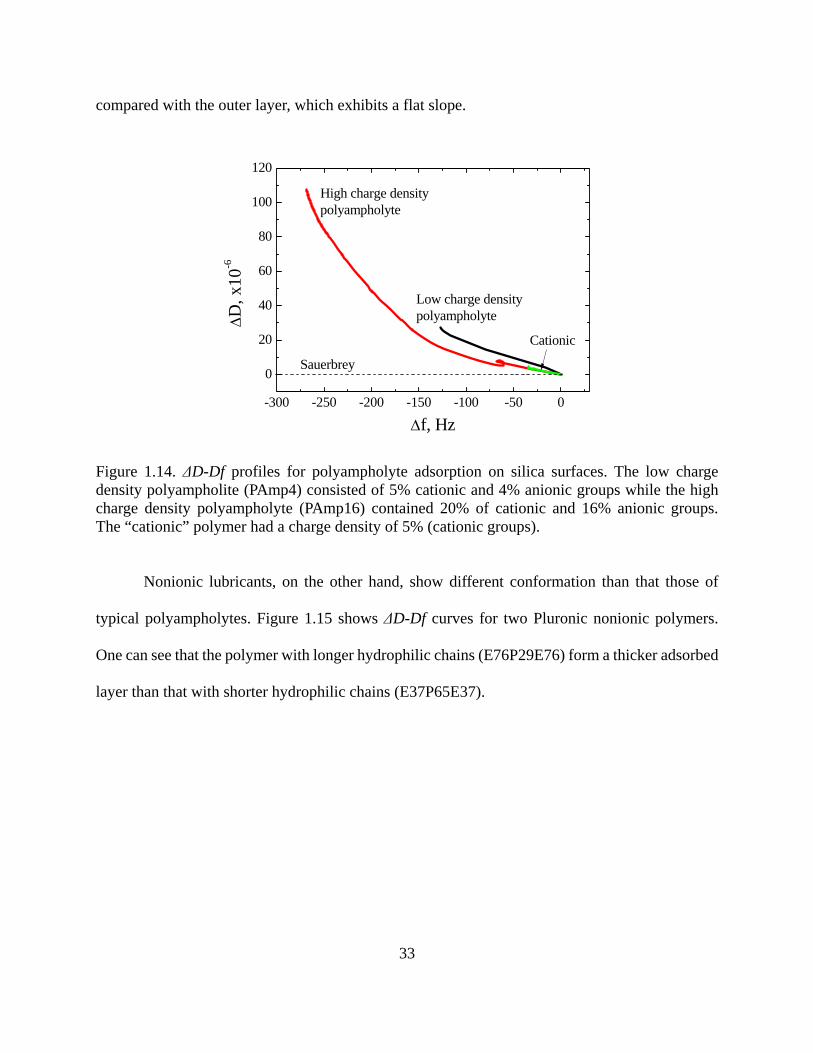
33
compared with the outer layer, which exhibits a flat slope.
-300 -250 -200 -150 -100 -50 0
0
20
40
60
80
100
120
Cationic
Low charge density polyampholyteΔD
, x10
-6
Δf, Hz
High charge density polyampholyte
Sauerbrey
Figure 1.14. ΔD-Df profiles for polyampholyte adsorption on silica surfaces. The low charge density polyampholite (PAmp4) consisted of 5% cationic and 4% anionic groups while the high charge density polyampholyte (PAmp16) contained 20% of cationic and 16% anionic groups. The “cationic” polymer had a charge density of 5% (cationic groups).
Nonionic lubricants, on the other hand, show different conformation than that those of
typical polyampholytes. Figure 1.15 shows ΔD-Df curves for two Pluronic nonionic polymers.
One can see that the polymer with longer hydrophilic chains (E76P29E76) form a thicker adsorbed
layer than that with shorter hydrophilic chains (E37P65E37).

34
-12 -10 -8 -6 -4 -2 0
0.0
0.5
1.0
1.5
E37P65E37
ΔD
, x10
-6
Δf, Hz
E76P29E76
Figure 1.15. ΔD-Df profile of nonionic lubricants E76P29E76 and E37P65E37 as they adsorb onto PET surfaces before rinsing.
Coupling QCM and SPR
As explained before SPR and QCM are often used to monitor ultrathin-film deposition and
dissociation; however, each has its own specific strengths, weaknesses, and assumptions inherent
in data collection and analysis. By combining these two techniques in performing in-situ
measurements, we are able to take advantage of the strengths of each.
By using SPR and QCM independently to monitor interfacial processes, we are able to
obtain two measures of a process that rely on fundamentally different principles of physics,
namely optical and electromechanical, respectively. Figure 1.16 is an example to demonstrate how
QCM and SPR data can be combined to study the kinetics of adsorption of a thin organic film 84.
In this case both curves agree with each other very well.

35
Figure 1.16. Comparison of adsorption kinetics of a perfluoropolyether lubricant (Fomblin ZDOL) on silver surfaces as measured by SPR and QCM . Figure from reference 84.
Any differences between the signals in QCM and SPR, indicate that the film is viscoelastic
or there is some coupled water in the adsorbed layer. By carefully considering the nature of each
measurement, one is able to decouple the viscoelastic property and the contribution of coupled
water in the film. Below we present more detailed explanation about the role of coupled water and
how to determine it.
Water is one of the most important “lubricants” and can be applied to boundary,
elastrohydrodynamic and hydrodynamic conditions. Water can be used as a boundary lubricant
due to the fluidity of hydration layers nanoconfined between two surfaces is totally different from
the water in bulk 95-98. The coupled water with lubricant polymers has the same function to protect
the contact surfaces to minimize abrasion. To measure the coupled water is not an easy task since it
is difficult to distinguish the coupled from the bulk water. In addition to the comparing QCM and
SPR signal to get some insight about water contribution, we explain below two alternative ways to
decoupled water from the bulk.
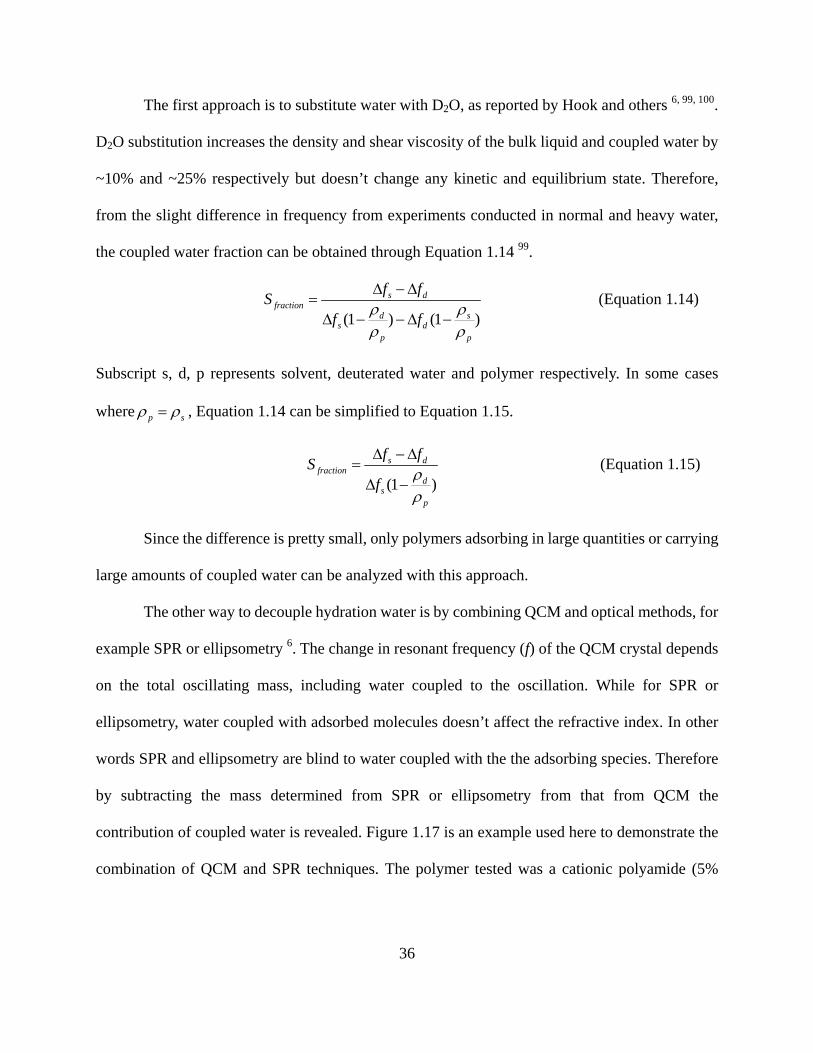
36
The first approach is to substitute water with D2O, as reported by Hook and others 6, 99, 100.
D2O substitution increases the density and shear viscosity of the bulk liquid and coupled water by
~10% and ~25% respectively but doesn’t change any kinetic and equilibrium state. Therefore,
from the slight difference in frequency from experiments conducted in normal and heavy water,
the coupled water fraction can be obtained through Equation 1.14 99.
(1 ) (1 )
s dfraction
d ss d
p p
f fSf fρ ρ
ρ ρ
Δ −Δ=Δ − −Δ −
(Equation 1.14)
Subscript s, d, p represents solvent, deuterated water and polymer respectively. In some cases
where p sρ ρ= , Equation 1.14 can be simplified to Equation 1.15.
(1 )
s dfraction
ds
p
f fSf ρ
ρ
Δ −Δ=Δ −
(Equation 1.15)
Since the difference is pretty small, only polymers adsorbing in large quantities or carrying
large amounts of coupled water can be analyzed with this approach.
The other way to decouple hydration water is by combining QCM and optical methods, for
example SPR or ellipsometry 6. The change in resonant frequency (f) of the QCM crystal depends
on the total oscillating mass, including water coupled to the oscillation. While for SPR or
ellipsometry, water coupled with adsorbed molecules doesn’t affect the refractive index. In other
words SPR and ellipsometry are blind to water coupled with the the adsorbing species. Therefore
by subtracting the mass determined from SPR or ellipsometry from that from QCM the
contribution of coupled water is revealed. Figure 1.17 is an example used here to demonstrate the
combination of QCM and SPR techniques. The polymer tested was a cationic polyamide (5%

37
cationic groups), with molecular weight ca. 3 millions. The surface used in this experiment was
negatively charged silica surface. The results showed that there was around 25% of water in the
adsorbed polymer layer. The same system was studied by using the deuterated water method.
Unfortunately, the results showed a much lower coupled water value, around 4% water content.
This may have been caused by the small adsorption amount and low fraction of water in the
adlayer, therefore the difference between sfΔ and dfΔ was relatively small, which was affected
by experimental errors significantly.
0 500 1000 1500 2000 25000
50
100
150
200
250
Aso
rbed
mas
s, ng
/cm
2
Time, seconds
SPR
QCM
Rinse with water
Figure 1.17. Decoupling water content through the combination of QCM and SPR measurements. The polymer used in this experiment is a cationic polyamide, with molecular weight of ca. 3 millions. Coupled water determined by this method was found to be 25%.
Lateral force microscopy and molecular dynamic simulation
In the previous section, we focused on the principles and applications of SPR and
QCM. Both instruments allow measurement of adsorption. In this section, we will briefly address

38
friction measurements and molecular dynamics simulation.
Lateral Force Microscopy (LFM) is a technique that can measure actual friction by lateral
forces and so it is able to evaluate lubricants’ performance on specific surfaces. Molecular
Dynamic simulation (MDS), on the other hand is a tool to simulate and quantify the interaction
between lubricant molecules and with the surfaces. MDS can be used to understand further how
lubricants interact with the surface and how lubrication properties are produced through self
assembly using theoretical predictions. Both LFM and MDS, were used with SPR and QCM
techniques, to unveil a more comprehensive understanding of lubrication phenomena.
Lateral Force Microscopy (LFM)
LFM is a technique based on scanning probe microscopy, and is one of the few
experimental methods capable of assessing forces at the single contact or atomic level.
FM is a special atomic force microscopy (AFM). They share the same principles. A typical AFM
comprises three main components: laser source, cantilever and photo-detector (see Figure 1.18).
When an atomic force microscopy (AFM) tip slides on a surface, it is deformed both in the vertical
and the horizontal directions (Figure 1.18). The force Fn, which is normal to the surface of the
sample, results in vertical bending of the free end of the cantilever. By contrast, the force Fl, which
is parallel to the probed surface and is in the opposite direction to the sliding direction, leads the
cantilever into a twisting motion. A typical AFM measures only the normal force, Fn. What
distinguishes LFM form AFM, just like the name indicates, is that it measures both Fn and Fl.
In order to precisely detect the forces between the tip and the surface, a laser beam is
reflected off the back of the cantilever onto a quadrant photodiode detector. The output of the
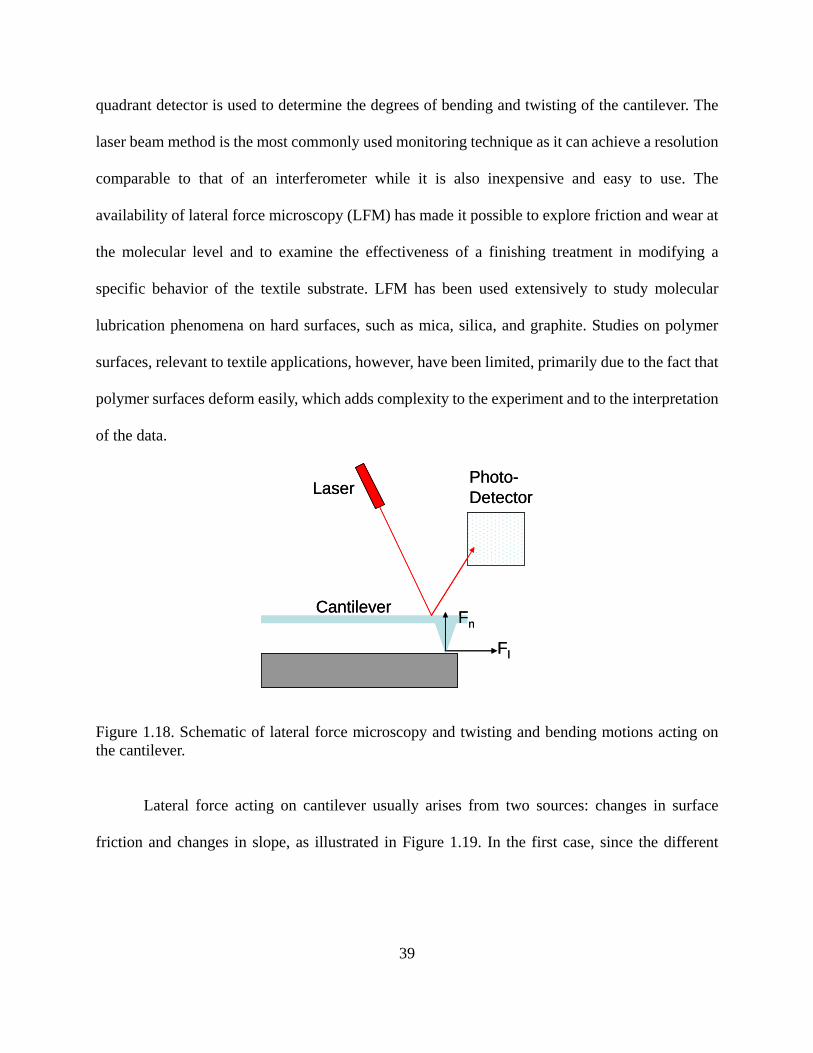
39
quadrant detector is used to determine the degrees of bending and twisting of the cantilever. The
laser beam method is the most commonly used monitoring technique as it can achieve a resolution
comparable to that of an interferometer while it is also inexpensive and easy to use. The
availability of lateral force microscopy (LFM) has made it possible to explore friction and wear at
the molecular level and to examine the effectiveness of a finishing treatment in modifying a
specific behavior of the textile substrate. LFM has been used extensively to study molecular
lubrication phenomena on hard surfaces, such as mica, silica, and graphite. Studies on polymer
surfaces, relevant to textile applications, however, have been limited, primarily due to the fact that
polymer surfaces deform easily, which adds complexity to the experiment and to the interpretation
of the data.
Laser
Cantilever
Photo-Detector
Fl
Fn
Laser
Cantilever
Photo-Detector
Fl
Fn
Figure 1.18. Schematic of lateral force microscopy and twisting and bending motions acting on the cantilever.
Lateral force acting on cantilever usually arises from two sources: changes in surface
friction and changes in slope, as illustrated in Figure 1.19. In the first case, since the different
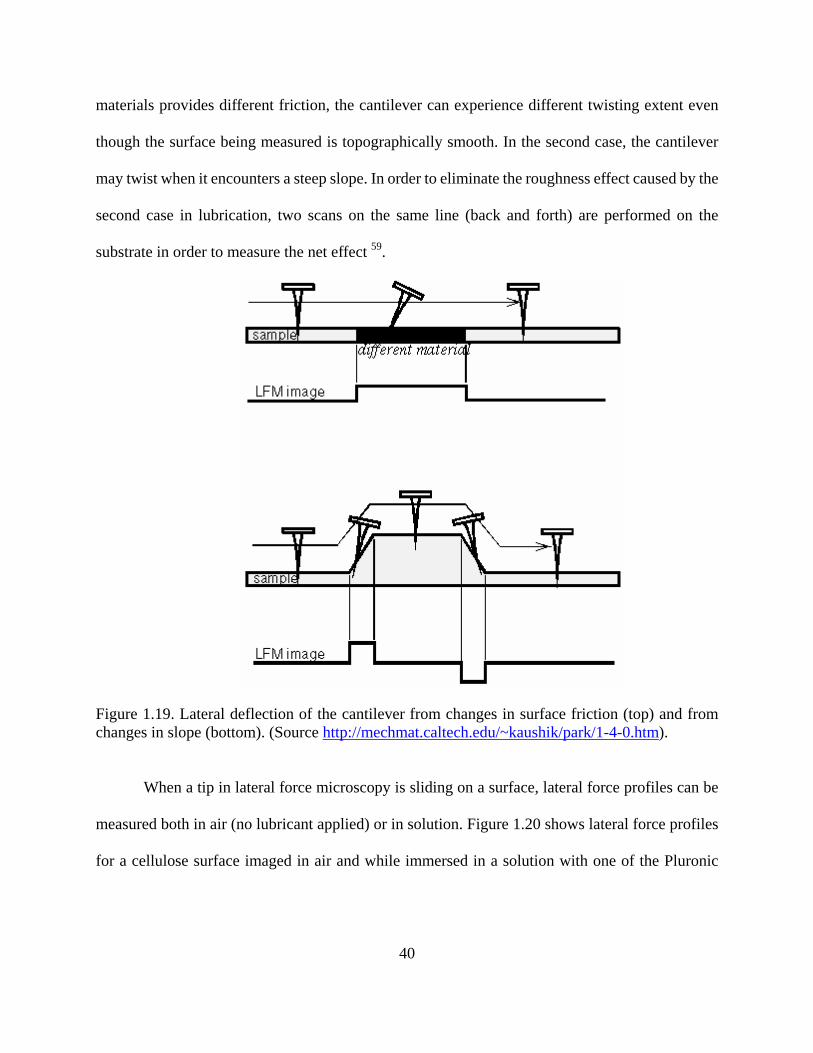
40
materials provides different friction, the cantilever can experience different twisting extent even
though the surface being measured is topographically smooth. In the second case, the cantilever
may twist when it encounters a steep slope. In order to eliminate the roughness effect caused by the
second case in lubrication, two scans on the same line (back and forth) are performed on the
substrate in order to measure the net effect 59.
Figure 1.19. Lateral deflection of the cantilever from changes in surface friction (top) and from changes in slope (bottom). (Source http://mechmat.caltech.edu/~kaushik/park/1-4-0.htm).
When a tip in lateral force microscopy is sliding on a surface, lateral force profiles can be
measured both in air (no lubricant applied) or in solution. Figure 1.20 shows lateral force profiles
for a cellulose surface imaged in air and while immersed in a solution with one of the Pluronic
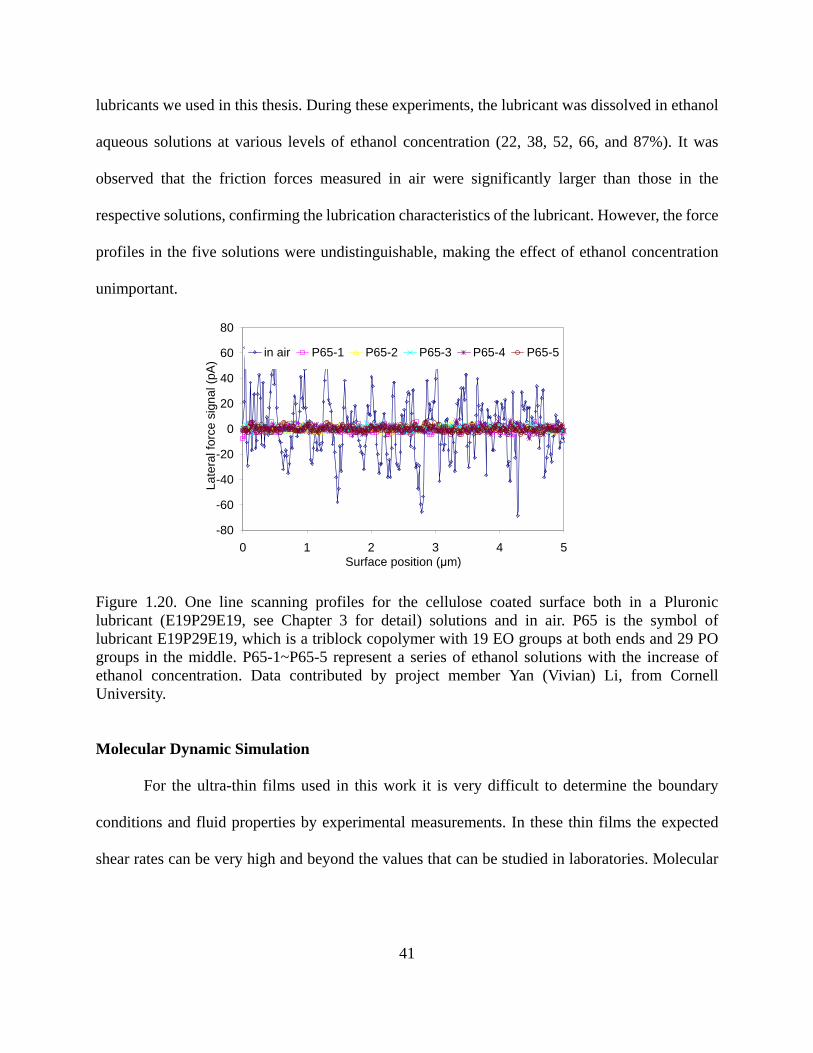
41
lubricants we used in this thesis. During these experiments, the lubricant was dissolved in ethanol
aqueous solutions at various levels of ethanol concentration (22, 38, 52, 66, and 87%). It was
observed that the friction forces measured in air were significantly larger than those in the
respective solutions, confirming the lubrication characteristics of the lubricant. However, the force
profiles in the five solutions were undistinguishable, making the effect of ethanol concentration
unimportant.
-80
-60
-40
-20
0
20
40
60
80
0 1 2 3 4 5Surface position (μm)
Late
ral f
orce
sig
nal (
pA)
in air P65-1 P65-2 P65-3 P65-4 P65-5
Figure 1.20. One line scanning profiles for the cellulose coated surface both in a Pluronic lubricant (E19P29E19, see Chapter 3 for detail) solutions and in air. P65 is the symbol of lubricant E19P29E19, which is a triblock copolymer with 19 EO groups at both ends and 29 PO groups in the middle. P65-1~P65-5 represent a series of ethanol solutions with the increase of ethanol concentration. Data contributed by project member Yan (Vivian) Li, from Cornell University.
Molecular Dynamic Simulation
For the ultra-thin films used in this work it is very difficult to determine the boundary
conditions and fluid properties by experimental measurements. In these thin films the expected
shear rates can be very high and beyond the values that can be studied in laboratories. Molecular
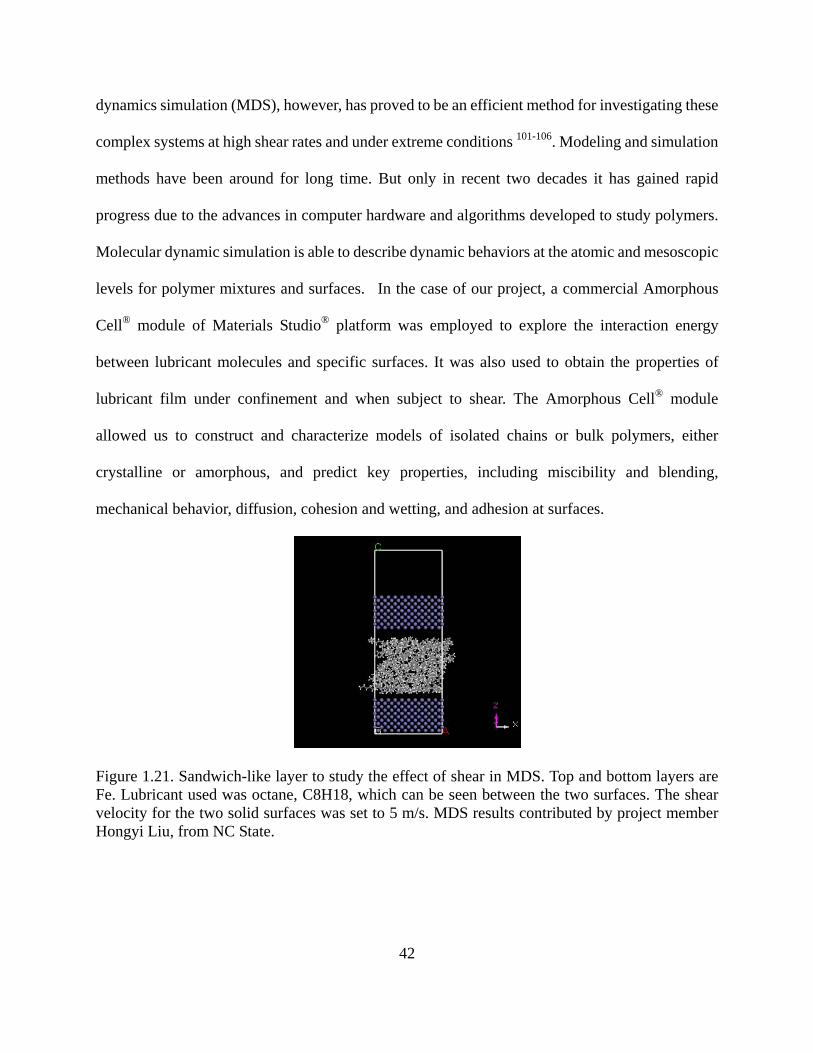
42
dynamics simulation (MDS), however, has proved to be an efficient method for investigating these
complex systems at high shear rates and under extreme conditions 101-106. Modeling and simulation
methods have been around for long time. But only in recent two decades it has gained rapid
progress due to the advances in computer hardware and algorithms developed to study polymers.
Molecular dynamic simulation is able to describe dynamic behaviors at the atomic and mesoscopic
levels for polymer mixtures and surfaces. In the case of our project, a commercial Amorphous
Cell® module of Materials Studio® platform was employed to explore the interaction energy
between lubricant molecules and specific surfaces. It was also used to obtain the properties of
lubricant film under confinement and when subject to shear. The Amorphous Cell® module
allowed us to construct and characterize models of isolated chains or bulk polymers, either
crystalline or amorphous, and predict key properties, including miscibility and blending,
mechanical behavior, diffusion, cohesion and wetting, and adhesion at surfaces.
Figure 1.21. Sandwich-like layer to study the effect of shear in MDS. Top and bottom layers are Fe. Lubricant used was octane, C8H18, which can be seen between the two surfaces. The shear velocity for the two solid surfaces was set to 5 m/s. MDS results contributed by project member Hongyi Liu, from NC State.

43
Figure 1.21 shows an illustrative MDS snapshot involving a lubricant molecular during
shearing. A sandwich-like layer with top and bottom solid walls (Fe) and lubricant liquid layer in
the middle was build. The protocol worked by imposing a user-defined velocity of 5 m/s on the
walls. The two walls were sheared with an equal but opposite velocity in the x direction and they
are held in a fixed position in the z direction relative to one another by harmonic springs
Figure 1.22 demonstrates the shear process by a series of consecutive pictures or frames.
Lubricants close to the surfaces bind to the surface while shearing can be observed.
The properties of lubricants under confinement can be simulated with the Amorphous Cell.
In Figure 1.23a, the distribution of molecular center of lubricant fluid shows a peculiar small peak
that is neighbor to the first peak nearest to the solid wall. To understand the alignment of liquid
molecules in the solid-like structure near the solid surface, we also can study the velocity profile
(Figure 1.23b). The flow observed in Figure 1.23b is quite similar to the Couette flow, which is
expected in a macroscopic sense, although the velocity gradient is slightly decreased at a point
close to the solid surface, which is resulting from increase of liquid viscosity due to the solid-like
liquid structure. On the other hand, anomalous energy distribution is observed in Figure 1.23b. In
the layers of liquid and solid molecules that are neighbor to each other, i.e., the contacting layers, it
is obvious that kinetic energy is not distributed equally. Between the solid walls, octane exhibits
two states: solid-like close to the solid wall and liquid-like in the middle of the layer, with a linear
velocity profile.

44
Figure 1.22. Animation of shear process for lubricant octane confined between two Fe surfaces. Shear velocity applied on both solid surfaces was 5 m/s. MDS results contributed by project member Hongyi Liu, from NC State.
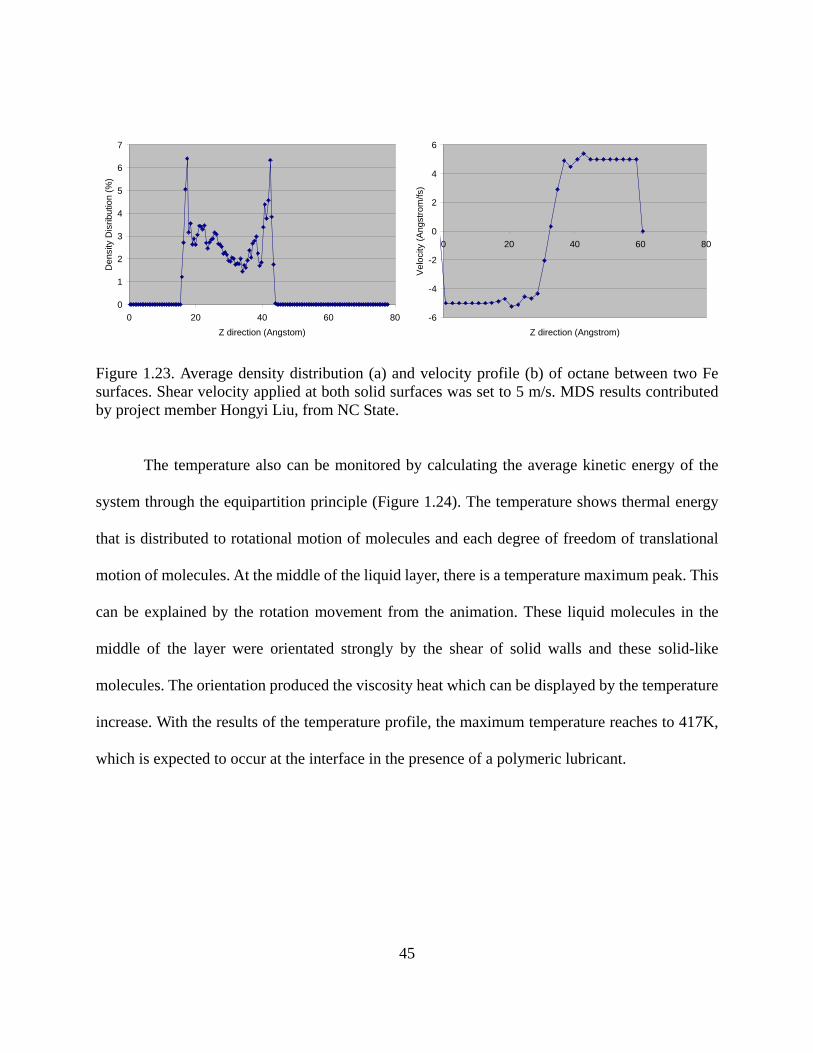
45
0
1
2
3
4
5
6
7
0 20 40 60 80Z direction (Angstom)
Den
sity
Dis
ribut
ion
(%)
-6
-4
-2
0
2
4
6
0 20 40 60 80
Z direction (Angstrom)
Velo
city
(Ang
stro
m/fs
)
Figure 1.23. Average density distribution (a) and velocity profile (b) of octane between two Fe surfaces. Shear velocity applied at both solid surfaces was set to 5 m/s. MDS results contributed by project member Hongyi Liu, from NC State.
The temperature also can be monitored by calculating the average kinetic energy of the
system through the equipartition principle (Figure 1.24). The temperature shows thermal energy
that is distributed to rotational motion of molecules and each degree of freedom of translational
motion of molecules. At the middle of the liquid layer, there is a temperature maximum peak. This
can be explained by the rotation movement from the animation. These liquid molecules in the
middle of the layer were orientated strongly by the shear of solid walls and these solid-like
molecules. The orientation produced the viscosity heat which can be displayed by the temperature
increase. With the results of the temperature profile, the maximum temperature reaches to 417K,
which is expected to occur at the interface in the presence of a polymeric lubricant.

46
0
50
100
150
200
250
300
350
400
450
0 20 40 60 80Z direction (Angstrom)
T (K
)
Figure 1.24. Temperature profile of octane between two Fe surfaces. Shear velocity applied at both solid surfaces was set to 5 m/s. MDS results contributed by project member Hongyi Liu, from NC State.
Finally, MDS was also useful to calculate the interaction energy at the octane-Fe interface
by using:
E interaction = E total - (E wall + E fluid)
=-229684.686052-(-226856.183644-304.817203)
=-2523.685178 kcal/mol· (2×28.664Å ×28.664Å)
=-3.071578kcal/mol· Å2
=-0.255cal/m2
The interaction energy of octane-Fe interface (see Figures 1.21-1.23) was negative, which
indicated that attractive forces took place in this system. Similar approaches were used in the case
of the several lubricants and surfaces investigated in this thesis, a subject that will be discussed in
later chapters.

47
SUMMARY
SPR and QCM are well-established, noninvasive techniques that are able to provide a
wealth of information about interfacial phenomena (in situ, in real time and in the presence of a
fluid) with extremely high resolution (at the nano scale levels). In this thesis we applied QCM to
monitor the adsorption of polyampholytes and simple polyelectrolytes on charged silica and
cellulose surfaces, and applied both SPR and QCM to monitor the adsorption of nonionic
lubricants on textile materials. Information was obtained from measurements with both
instruments and their combination. This approach allowed the determination of (1) the affinity of
lubricants to the substrate, (2) the conformation of adsorbed lubricant layer, (3) the kinetics of
adsorption and desorption, and (4) the thickness of the adsorbed layer as well as the amount of
coupled water in adsorbed film.
Based on information provided by SPR and QCM, we can deepen our knowledge on how
the polymers and lubricants behave in the presence of natural and synthetic surfaces. By studying
the relationship of lubricants’ structure with the performance of lubrication, novel lubricants with
superior performance can be designed. In return one can significantly improve the efficiency of
cellulose fiber and textile processing and improve the quality of products being manufactured.
LFM was used to measure actual friction, which can verify our results obtained from
adsorption: It is also instrumental to understand the effect of the extent of adsorption and the
conformation of adsorbed layers on friction. MDS, on the other hand, was used to understand how
lubricant molecules interact with the surfaces and provided a theoretical platform to compare our
experimental results. Adsorption, friction and simulation results can help to unveil a more

48
complete understanding about boundary lubrication. In the following chapters we explain in
details some of our observations.

49
REFERENCES
1. Karim, A.; Kumar, S., Polymer surfaces, interfaces and thin films. World Scientific: Singapore ; River Edge, NJ, 2000; p vii, 294 p. 2. Eisenriegler, E., Polymers near surfaces : conformation properties and relation to critical phenomena. World Scientific: Singapore ; River Edge, NJ, 1993; p x, 412 p. 3. Bailey, L. E.; Kanazawa, K. K.; Bhatara, G.; Tyndall, G. W.; Kreiter, M.; Knoll, W.; Frank, C. W., Multistep Adsorption of Perfluoropolyether Hard-Disk Lubricants onto Amorphous Carbon Substrates from Solution. Langmuir 2001, 17, (26), 8145-8155. 4. Chakraborty, A. K.; Golumbfskie, A. J., Polymer adsorption - Driven self-assembly of nanostructures. Annual Review of Physical Chemistry 2001, 52, 537-573. 5. Cheng, C.-H.; Lai, P.-Y., Conformational properties of an adsorbed charged polymer. Physical review. E, Statistical, nonlinear, and soft matter physics 2005, 71, (6 Pt 1), 060802. 6. Hook, F.; Kasemo, B.; Nylander, T.; Fant, C.; Sott, K.; Elwing, H., Variations in coupled water, viscoelastic properties, and film thickness of a Mefp-1 protein film during adsorption and cross-linking: A quartz crystal microbalance with dissipation monitoring, ellipsometry, and surface plasmon resonance study. Analytical Chemistry 2001, 73, (24), 5796-5804. 7. Hussain, Y.; Krim, J.; Grant, C., OTS adsorption: A dynamic QCM study. Colloids and Surfaces a-Physicochemical and Engineering Aspects 2005, 262, (1-3), 81-86. 8. Lundgren, S. M.; Persson, K.; Kronberg, B.; Claesson, P. M., Adsorption of fatty acids from alkane solution studied with quartz crystal microbalance. Tribology Letters 2006, 22, (1), 15-20. 9. Sezaki, T.; Hubbe, M. A.; Heitmann, J. A.; Argyropoulos, D. S., Colloidal effects of acrylamide polyampholytes - Part 2: Adsorption onto cellulosic fibers. Colloids and Surfaces a-Physicochemical and Engineering Aspects 2006, 289, (1-3), 89-95. 10. Tammelin, T.; Saarinen, T.; Osterberg, M.; Laine, J., Preparation of Langmuir/Blodgett-cellulose surfaces by using horizontal dipping procedure. Application for polyelectrolyte adsorption studies performed with QCM-D. Cellulose 2006, 13, (5), 519-535. 11. Zappone, B.; Ruths, M.; Greene, G. W.; Jay, G. D.; Israelachvili, J. N., Adsorption, lubrication, and wear of lubricin on model surfaces: Polymer brush-like behavior of a glycoprotein. Biophysical Journal 2007, 92, (5), 1693-1708.
50
12. Dobrynin, A. V.; Colby, R. H.; Rubinstein, M., Polyampholytes. Journal of Polymer Science Part B-Polymer Physics 2004, 42, (19), 3513-3538. 13. Ertas, D.; Kantor, Y., Randomly charged polymers, random walks, and their extremal properties. Phys Rev E Phys Rev E 1996, 53, (1), 846-860. 14. Gutin, A. M.; Shakhnovich, E. I., Effect of a Net Charge on the Conformation of Polyampholytes. Phys Rev E Phys Rev E 1994, 50, (5), R3322-R3325. 15. Hwang, D. C.; Damodaran, S., Equilibrium swelling properties of a novel ethylenediaminetetraacetic dianhydride (EDTAD)-modified soy protein hydrogel. Journal of Applied Polymer Science 1996, 62, (8), 1285-1293. 16. Jeon, J.; Dobrynin, A. V., Molecular dynamics simulations of polyampholyte-polyelectrolyte complexes in solutions. Macromolecules 2005, 38, (12), 5300-5312. 17. Kantor, Y.; Kardar, M., Instabilities of Charged Polyampholytes. Phys Rev E Phys Rev E 1995, 51, (2), 1299-1312. 18. Lee, N.; Thirumalai, D., Dynamics of collapse of flexible polyampholytes. Journal of Chemical Physics 2000, 113, (13), 5126-5129. 19. Long, D.; Dobrynin, A. V.; Rubinstein, M.; Ajdari, A., Electrophoresis of polyampholytes. Journal of Chemical Physics 1998, 108, (3), 1234-1244. 20. Lord, M. S.; Stenzel, M. H.; Simmons, A.; Milthorpe, B. K., The effect of charged groups on protein interactions with poly(HEMA) hydrogels. Biomaterials 2006, 27, (4), 567-575. 21. Yamakov, V.; Milchev, A.; Limbach, H. J.; Dunweg, B.; Everaers, R., Conformations of random polyampholytes. Physical Review Letters 2000, 85, (20), 4305-4308. 22. Hubbe, M. A.; Rojas, O. J.; Argyropoulos, D. S.; Wang, Y.; Song, J.; Sulic, N.; Sezaki, T., Charge and the dry-strength performance of polyampholytes - Part 2. Colloidal effects. Colloids and Surfaces a-Physicochemical and Engineering Aspects 2007, 301, (1-3), 23-32. 23. Hubbe, M. A.; Rojas, O. J.; Sulic, N.; Sezaki, T., Unique behaviour of polyampholytes as dry-strength additives. Appita Journal 2007, 60, (2), 106-+. 24. Sezaki, T.; Hubbe, M. A.; Heitmann, J. A.; Argyropoulos, D. S.; Wang, X., Colloidal effects of acrylamide polyampholytes. Colloids and Surfaces, A: Physicochemical and
51
Engineering Aspects 2006, 281, (1-3), 74-81. 25. Song, J.; Wang, Y.; Hubbe, M. A.; Rojas, O. J.; Sulic, N.; Sezaki, T., Charge and the dry-strength performance of polyampholytes. Part 1: Handsheet properties and polymer solution viscosity. Journal of Pulp and Paper Science 2006, 32, (3), 156-162. 26. Wang, Y.; Hubbe, M. A.; Sezaki, T.; Wang, X. W.; Rojas, O. J.; Argyropoulos, D. S., Aspects of retention and formation - The role of polyampholyte charge density on its interactions with cellulose. Nordic Pulp & Paper Research Journal 2006, 21, (5), 638-645. 27. Wang, Y.; Hubbe, M. A.; Rojas, O. J.; Argyropoulos, D. S.; Wang, X.; Sezaki, T., Charge and the dry-strength performance of polyampholytes. Part 3: Streaming potential analysis. Colloids and Surfaces a-Physicochemical and Engineering Aspects 2007, 301, (1-3), 33-40. 28. Bratko, D.; Chakraborty, A. K., A numerical study of polyampholyte configuration. Journal of Physical Chemistry 1996, 100, (4), 1164-1173. 29. Mazur, J.; Silberberg, A.; Katchalsky, A., Potentiometric behavior of polyampholytes. Journal of Polymer Science 1959, 35, (128), 43-70. 30. Nazhad, M. M.; Paszner, L., Fundamentals of strength loss in recycled paper. Tappi Journal 1994, 77, (9), 171-179. 31. Nazhad, M. M., Recycled fiber quality - A review. Journal of Industrial and Engineering Chemistry 2005, 11, (3), 314-329. 32. Carr, M. E.; Hofreiter, B. T.; Schulte, M. I.; Russell, C. R., Starch polyampholyte for paper. Tappi 1977, 60, (10), 66-69. 33. Henderson, K. F. Polyampholyte coagulant as retention-drainage aid, in coated broke treatment, or in process water clarification in the papermaking process. 99-US291352000034581, 19991208., 2000. 34. Kantor, Y.; Kardar, M.; Li, H., Statistical-Mechanics of Polyampholytes. Phys Rev E Phys Rev E 1994, 49, (2), 1383-1392. 35. Schiessel, H.; Blumen, A., Conformations of freely jointed polyampholytes in external fields. Journal of Chemical Physics 1996, 104, (15), 6036-6040. 36. Srivastava, D.; Muthukumar, M., Sequence dependence of conformations of polyampholytes. Macromolecules 1996, 29, (6), 2324-2326.

52
37. Dowson, D., History of tribology, 2nd Edition. Longman: London ; New York, 1998; p xvii, 677 p. 38. Jost, H. P., Tribology - Origin and Future. Wear 1990, 136, (1), 1-17. 39. Proffitt, T. J.; Patterson, H. T., Oleochemical surfactants and lubricants in the textile-industry. Journal of the American Oil Chemists Society 1988, 65, (10), 1682-1694. 40. Hamrock, B. J.; Schmid, S. R.; Jacobson, B. O.; NetLibrary Inc., Fundamentals of fluid film lubrication. 2nd ed.; Marcel Dekker: New York, 2004; p xiv, 699 p. 41. Cho, Y. K.; Cai, L.; Granick, S., Molecular tribology of lubricants and additives. Tribology International 1997, 30, (12), 889-894. 42. Luengo, G.; Israelachvili, J.; Granick, S., Generalized effects in confined fluids: New friction map for boundary lubrication. Wear 1996, 200, (1-2), 328-335. 43. Guddati, S.; Zhang, J.; Sinha, S. K.; Hsu, S. M., Nanolubrication: Characterization of patterned lubricant films on magnetic hard disks. Tribology Letters 2006, 21, (3), 253-261. 44. Guo, Q.; Li, L.; Hsia, Y. T.; Jhon, M. S., A spreading study of lubricant films via optical surface analyzer and molecular dynamics. Ieee Transactions on Magnetics 2006, 42, (10), 2528-2530. 45. Izumisawa, S.; Jhon, M. S., Calculation of disjoining pressure for lubricant films via molecular simulation. Ieee Transactions on Magnetics 2006, 42, (10), 2543-2545. 46. Mukhopadhyay, A.; Zhao, J.; Bae, S. C.; Granick, S., Contrasting friction and diffusion in molecularly thin confined films. Physical Review Letters 2002, 89, (13). 47. Mukhopadhyay, A.; Bae, S. C.; Zhao, J.; Granick, S., How confined lubricants diffuse during shear. Physical Review Letters 2004, 93, (23). 48. Granick, S.; Bae, S. C., Open questions about polymer interfacial diffusion. Journal of Polymer Science Part B-Polymer Physics 2006, 44, (24), 3434-3435. 49. Yoshizawa, H.; Chen, Y. L.; Israelachvili, J., Recent advances in molecular-level understanding of adhesion, friction and lubrication. Wear 1993, 168, (1-2), 161-166. 50. Demirel, A. L.; Granick, S., Origins of solidification when a simple molecular fluid is confined between two plates. Journal of Chemical Physics 2001, 115, (3), 1498-1512.

53
51. Israelachvili, J.; Luengo, G.; Schmitt, F. J., Thin film rheology and tribology of confined polymer melts. Abstr Pap Am Chem S 1996, 212, 104-PMSE. 52. Luengo, G.; Schmitt, F. J.; Hill, R.; Israelachvili, J., Thin film rheology and tribology of confined polymer melts: Contrasts with bulk properties. Macromolecules 1997, 30, (8), 2482-2494. 53. Klein, J.; Kumacheva, E., Simple liquids confined to molecularly thin layers. I. Confinement-induced liquid-to-solid phase transitions. Journal of Chemical Physics 1998, 108, (16), 6996-7009. 54. Frantz, P.; Perry, D.; Granick, S., Orientation of Adsorbed Polymer in Response to Shear-Flow. Colloid Surface A 1994, 86, 295-298. 55. Ruths, M., Boundary friction of aromatic self-assembled monolayers: Comparison of systems with one or both sliding surfaces covered with a thiol monolayer. Langmuir 2003, 19, (17), 6788-6795. 56. Ruths, M.; Alcantar, N. A.; Israelachvili, J. N., Boundary friction of aromatic silane self-assembled monolayers measured with the surface forces apparatus and friction force microscopy. Journal of Physical Chemistry B 2003, 107, (40), 11149-11157. 57. Urbakh, M.; Klafter, J.; Gourdon, D.; Israelachvili, J., The nonlinear nature of friction. Nature 2004, 430, (6999), 525-528. 58. Chen, N. H.; Maeda, N.; Tirrell, M.; Israelachvili, J., Adhesion and friction of polymer surfaces: The effect of chain ends. Macromolecules 2005, 38, (8), 3491-3503. 59. Behary, N.; Ghenaim, A.; El Achari, A.; Caze, C., Tribological analysis of glass fibers using atomic force microscopy (AFM)/lateral force microscopy (LFM). Journal of Applied Polymer Science 2000, 75, (8), 1013-1025. 60. Breakspear, S.; Smith, J. R.; Campbell, S. A., AFM in surface finishing: Part III. Lateral force microscopy and friction measurements. Transactions of the Institute of Metal Finishing 2003, 81, B68-B70. 61. Hu, Y. Z.; Granick, S., Microscopic study of thin film lubrication and its contributions to macroscopic tribology. Tribology Letters 1998, 5, (1), 81-88. 62. Sulek, M. W.; Wasilewski, T., Tribological properties of aqueous solutions of alkyl polyglucosides. Wear 2006, 260, (1-2), 193-204.

54
63. Drummond, C.; Rodriguez-Hernandez, J.; Lecommandoux, S.; Richetti, P., Boundary lubricant films under shear: Effect of roughness and adhesion. Journal of Chemical Physics 2007, 126, (18). 64. McGuiggan, P. M.; Gee, M. L.; Yoshizawa, H.; Hirz, S. J.; Israelachvili, J. N., Friction studies of polymer lubricated surfaces. Macromolecules 2007, 40, (6), 2126-2133. 65. Zhang, J.; Hsu, S. M.; Liew, Y. F., Nanolubrication: Patterned lubricating films using ultraviolet (UV) irradiation on hard disks. Journal of Nanoscience and Nanotechnology 2007, 7, (1), 286-292. 66. Akagaki, T.; Kato, K., Simulation of flow wear in boundary lubrication using a Vickers indentation method. Tribology Transactions 1988, 31, (3), 311-316. 67. Kong, Y. C.; Tildesley, D. J.; Alejandre, J., The molecular dynamics simulation of boundary-layer lubrication. Molecular Physics 1997, 92, (1), 7-18. 68. Hsu, S. M., Molecular basis of lubrication. Tribology International 2004, 37, (7), 553-559. 69. Rabinowi.E, Variation of Friction and Wear of Solid Lubricant Films with Film Thickness. Asle Trans 1967, 10, (1), 1-&. 70. Grudev, A. P.; Bondaren.Va, Investigation of Dependence of Coefficient of Friction on Thickness of Lubricant Film in Cold Rolling. Steel Ussr 1973, 3, (3), 219-220. 71. Visscher, M.; Kanters, A. F. C., Literature-review and discussion on measurements of leakage, lubricant film thickness and friction of reciprocating elastomeric seals. Lubrication Engineering 1990, 46, (12), 785-791. 72. Gilmour, K. R.; Paul, S.; Leacock, A. G., The influence of lubricant film thickness on friction coefficients during slow speed deep drawing operations. Journal of Tribology-Transactions of the Asme 2002, 124, (4), 846-851. 73. Stockbridge, C. D., Effects of gas pressure on quartz crystal microbalances. Vacuum Microbalance Techniques 1966, (5), 147-78. 74. Nomura, T.; Okuhara, M.; Murata, K.; Hattori, O., Behavior of a piezoelectric quartz crystal in organic-solvents. Bunseki Kagaku 1981, 30, (6), 417-418. 75. Nomura, T.; Okuhara, M., Frequency-shifts of piezoelectric quartz crystals immersed in organic liquids. Analytica Chimica Acta 1982, 142, (OCT), 281-284. 76. Kanazawa, K. K.; Gordon, J. G., Frequency of a quartz microbalance in contact with liquid.

55
Analytical Chemistry 1985, 57, (8), 1770-1771. 77. Kanazawa, K. K.; Gordon, J. G., The oscillation frequency of a quartz resonator in contact with a liquid. Analytica Chimica Acta 1985, 175, (SEP), 99-105. 78. Johannsmann, D.; Mathauer, K.; Wegner, G.; Knoll, W., Viscoelastic Properties of Thin-Films Probed with a Quartz-Crystal Resonator. Physical Review B 1992, 46, (12), 7808-7815. 79. Liedberg, B.; Nylander, C.; Lundstrom, I., Biosensing with surface-Plasmon Resonance - How it all started. Biosensors & Bioelectronics 1995, 10, (8), R1-R9. 80. Rodahl, M.; Hook, F.; Krozer, A.; Brzezinski, P.; Kasemo, B., Quartz-crystal microbalance setup for frequency and Q-factor measurements in gaseous and liquid environments. Review of Scientific Instruments 1995, 66, (7), 3924-3930. 81. Rodahl, M.; Kasemo, B., On the measurement of thin liquid overlayers with the quartz-crystal microbalance. Sensors and Actuators a-Physical 1996, 54, (1-3), 448-456. 82. Mak, C.; Krim, J., Quartz crystal microbalance studies of disorder-induced lubrication. Faraday Discussions 1997, 389-397. 83. Homola, J.; Yee, S. S.; Gauglitz, G., Surface plasmon resonance sensors: review. Sensors and Actuators B-Chemical 1999, 54, (1-2), 3-15. 84. Bailey, L. E.; Kambhampati, D.; Kanazawa, K. K.; Knoll, W.; Frank, C. W., Using surface plasmon resonance and the quartz crystal microbalance to monitor in situ the interfacial behavior of thin organic films. Langmuir 2002, 18, (2), 479-489. 85. Bruschi, L.; Mistura, G., Measurement of the friction of thin films by means of a quartz microbalance in the presence of a finite vapor pressure. Physical Review B 2001, 63, (23). 86. Wang, D.; Mousavi, P.; Grant, C. S.; Hauser, P. J.; Oxenham, W.; Martin, T. M.; Davis, R., Evaluating thermal degradation of textile finishing aids using GC and QCM. Proceedings of the National Conference on Environmental Science and Technology, Greensboro, NC, United States, Sept. 8-10, 2002 2003, 243-251. 87. Krim, J.; Abdelmaksoud, M.; Borovsky, B.; Winder, S. M., Scanning Tunneling microscope-quartz crystal microbalance studies of "Real world" and model lubricants. In Dynamics and Friction in Submicrometer Confining Systems, 2004; Vol. 882, pp 1-18. 88. Fukuzawa, K.; Shimuta, T.; Nakada, A.; Zhang, H. D.; Mitsuya, Y., Measurement of thickness of molecularly thin lubricant film using ellipsometric microscopy. Ieee Transactions on

56
Magnetics 2005, 41, (2), 808-811. 89. www.rci.rutgers.edu/~longhu/Biacore/Molecular... 90. http://chem.ch.huji.ac.il/~eugeniik/spr.htm. 91. Sauerbrey, G., The use of quartz oscillators for weighing thin layers and for microweighing. Zeitschrift Fur Physik 1959, 155, (2), 206-222. 92. Voinova, M. V.; Rodahl, M.; Jonson, M.; Kasemo, B., Viscoelastic acoustic response of layered polymer films at fluid-solid interfaces: Continuum mechanics approach. Physica Scripta 1999, 59, (5), 391-396. 93. Wang, D. X.; Mousavi, P.; Hauser, P. J.; Oxenham, W.; Grant, C. S., Novel testing system for evaluating the thermal stability of polyol ester lubricants. Industrial & Engineering Chemistry Research 2004, 43, (21), 6638-6646. 94. Edvardsson, M.; Rodahl, M.; Kasemo, B.; Hook, F., A dual-frequency QCM-D setup operating at elevated oscillation amplitudes. Analytical Chemistry 2005, 77, (15), 4918-4926. 95. Raviv, U.; Laurat, P.; Klein, J., Fluidity of water confined to subnanometre films. Nature 2001, 413, (6851), 51-54. 96. Raviv, U.; Klein, J., Fluidity of bound hydration layers. Science 2002, 297, (5586), 1540-1543. 97. Zhu, Y. X.; Granick, S., Viscosity of interfacial water. Physical Review Letters 2001, 8709, (9). 98. Leng, Y. S.; Cummings, P. T., Fluidity of hydration layers nanoconfined between mica surfaces. Physical Review Letters 2005, 94, (2). 99. Craig, V. S. J.; Plunkett, M., Determination of coupled solvent mass in quartz crystal microbalance measurements using deuterated solvents. J Colloid Interf Sci 2003, 262, (1), 126-129. 100. Notley, S. M.; Eriksson, M.; Wagberg, L., Visco-elastic and adhesive properties of adsorbed polyelectrolyte multilayers determined in situ with QCM-D and AFM measurements. Journal of Colloid and Interface Science 2005, 292, (1), 29-37. 101. Binder, K.; NetLibrary Inc., Monte Carlo and molecular dynamics simulations in polymer sciences. Oxford University Press: Oxford ; New York, 1995; p xiv, 587 p.
57
102. Colbourn, E. A., Computer simulation of polymers. 1st ed.; Longman Scientific & Technical: Essex, England ; New York, NY, 1994; p viii, 343 p. 103. Galiatsatos, V., Molecular simulation methods for predicting polymer properties. Wiley-Interscience: Hoboken, N.J., 2005; p xii, 295 p. 104. Haile, J. M., Molecular dynamics simulation : elementary methods. Wiley: New York, 1997; p xvii, 489 p. 105. Kotelyanskii, M.; Theodorou, D. N.; NetLibrary Inc., Simulation methods for polymers. Marcel Dekker Inc.: New York, 2004; p xv, 602 p. 106. Rapaport, D. C.; Ebook Library., The art of molecular dynamics simulation. 2nd ed.; Cambridge University Press: Cambridge, UK ; New York, NY, 2004; p xiii, 549 p.
58
Chapter 2
Polymer Systems Studied and
General Hypotheses
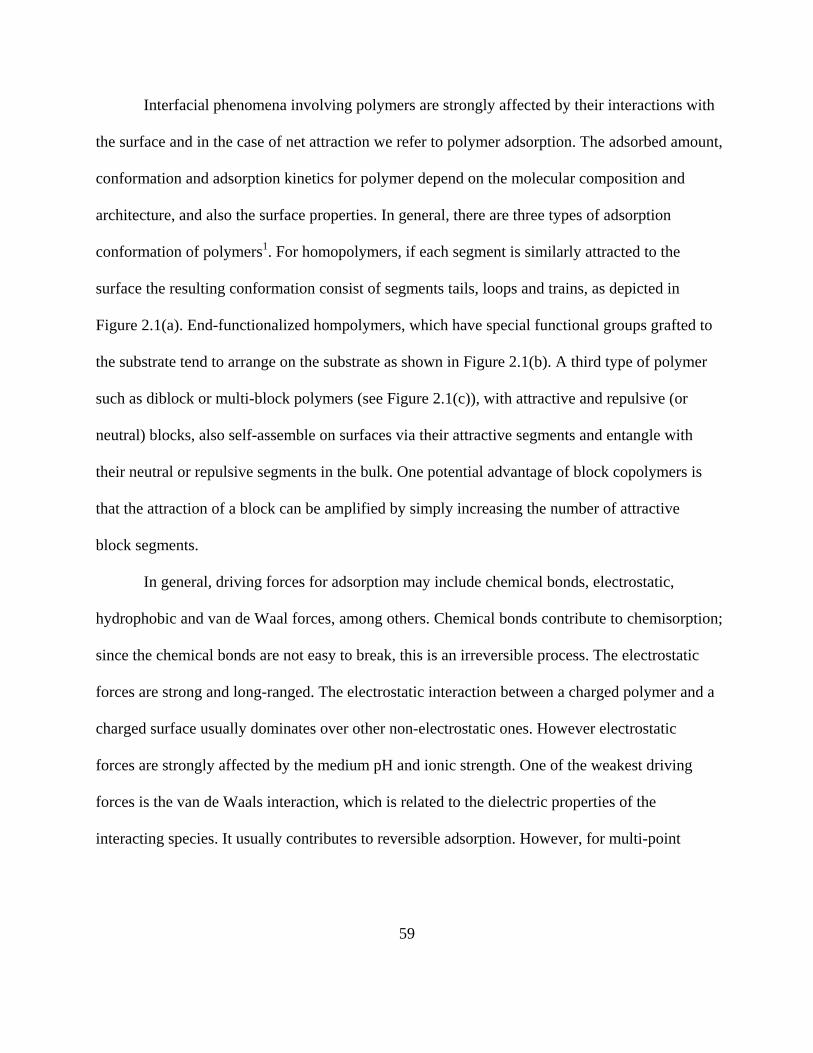
59
Interfacial phenomena involving polymers are strongly affected by their interactions with
the surface and in the case of net attraction we refer to polymer adsorption. The adsorbed amount,
conformation and adsorption kinetics for polymer depend on the molecular composition and
architecture, and also the surface properties. In general, there are three types of adsorption
conformation of polymers1. For homopolymers, if each segment is similarly attracted to the
surface the resulting conformation consist of segments tails, loops and trains, as depicted in
Figure 2.1(a). End-functionalized hompolymers, which have special functional groups grafted to
the substrate tend to arrange on the substrate as shown in Figure 2.1(b). A third type of polymer
such as diblock or multi-block polymers (see Figure 2.1(c)), with attractive and repulsive (or
neutral) blocks, also self-assemble on surfaces via their attractive segments and entangle with
their neutral or repulsive segments in the bulk. One potential advantage of block copolymers is
that the attraction of a block can be amplified by simply increasing the number of attractive
block segments.
In general, driving forces for adsorption may include chemical bonds, electrostatic,
hydrophobic and van de Waal forces, among others. Chemical bonds contribute to chemisorption;
since the chemical bonds are not easy to break, this is an irreversible process. The electrostatic
forces are strong and long-ranged. The electrostatic interaction between a charged polymer and a
charged surface usually dominates over other non-electrostatic ones. However electrostatic
forces are strongly affected by the medium pH and ionic strength. One of the weakest driving
forces is the van de Waals interaction, which is related to the dielectric properties of the
interacting species. It usually contributes to reversible adsorption. However, for multi-point
60
attachments the sum of van de Waals interactions can account to an appreciable force.
Hydrophobic forces are more complicated compared to other forces, since to date there is no full
understanding of its origins 2-4 . Depending on the hydrophobicity of the surface, the
hydrophobic effect may be classified into short-, medium- or long- range forces.
Figure 2.1. Conformation of adsorbed polymers at interfaces for (a) homopolymers, (b) end-functionalized homopolymers, (c) Block polymers, and (d) polyampholytes.
Based on the principles addressed above, the hypotheses leading to our research efforts
are applied to two cases, namely the adsorption of charged and uncharged polymers. The case of
charged polymers was studied by using polyampholytes, which are macromolecules that have
found increased use in papermaking, as paper strength aid. On the other hand, the case of
nonionic polymers was of interest in applications involving lubrication control in fiber
processing.

61
For the charged polymers we focused on polyampholytes (or amphoteric polymers)
adsorbing on charged surfaces. . Electrostatic forces are in this case the predominant driving
mechanism for the adsorption of amphoteric polymers as long as net charges exist. On the other
hand physical adsorption is the dominant effect at the isoelectric point condition for the tested
amphoteric polymers. Our polyampholyte samples were random polymers and the conformation
of the adsorbed species is expected to differ for the cases addressed above (Figure 2.1a-c).
Opposite charged groups are expected to be attracted and adsorbed onto the surface while
remaining charged groups in the polymer chain can be enriched in the outlayer. Due the steric
barrier, there is not a complete segregation of the charge and uncharged segments. Therefore the
enriched outlayer with net charges can adsorb polymers in solution to form multilayers. The
conformation of polyampholytes is therefore hypothesized to be as depicted as Fig 2.1d. Steric
barrier could influence the adsorption process especially for high charge density polymers. The
dynamics to reach equilibrium thereby enriching charged groups at the interface and outlayers
can be a long process.
In order to evaluate the hypotheses above, experiments were designed as follows:
In the case of polyampholytes, variables including charge of surfaces, charge ratio of the
polyampholytes and pH of the solution were tested, since they affect the electrostatic forces
between polyampholytes and surfaces. In our plan, four polyampholyte samples with same
charge ratio of acidic to basic groups but different charge density and one cationic and one
anionic polyelectrolytes were be investigated. The employed surfaces included silica and
cellulose. Silica could be a very good model surface for cellulose since it carries negative

62
charges in the range of pH from 4 to 10. However, silica carries more charges than cellulose at
the same pH. This gives us an opportunity to investigate how the charge density of the surfaces
affects the adsorption of polyampholytes and how the conformation of adsorbed layer varies with
the balance of charge. The solution pH was varied between pH 4, 7 and 10, representing acidic,
neutral and basic conditions, respectively.
In the case of nonionic polymers, no chemical reaction is expected and no electrostatics is
involved. Therefore only van de Waal forces and hydrophobic forces can be factored in.
Physisorption may be dominant in the case of adsorption of nonionic polymers, while the
hydrophobic forces may be the main contribution for irreversible adsorption. The affinity of
nonionic polymers to a surface in an aqueous medium depends mainly on the hydrophobic part
in the macromolecule chain. Polymers with higher molecular weight are expected to have higher
adsorption affinity due to more prominent role of van der Waal forces. Conformation of
adsorbed diblock or triblock polymers should be as shown in Figure 2.1c. Also, hydration may
play an important role in boundary lubrication.
The nonionic polymers tested are typically used as lubricants in fiber processing, and
therefore the surfaces chosen were typical ones used in textile and paper manufacture. In order to
test the statements made above, experiments were designed as follows:
Various surfaces with different surface energies were investigated, including
polypropylene (PP), polyethylene (PE), polyester (PET), nylon and cellulose. Within these
surfaces, cellulose is hydrophilic, PP is the most hydrophobic and PE posses a slight lower
hydrophobicity. The hydrophobicity of PET and nylon is between that of cellulose and PP.

63
Nonionic polymers with different chemical structure were tested. These include diblock or
triblock structures with different length of the hydrophobic and hydrophilic chains, as well as
different molecular masses. All these variables were investigated in this thesis and the results
presented in the next chapters.

64
REFERENCES
1. Karim, A.; Kumar, S., Polymer surfaces, interfaces and thin films. World Scientific: Singapore ; River Edge, NJ, 2000; p vii, 294 p. 2. Yoon, R. H.; Ravishankar, S. A., Long-range hydrophobic forces between mica surfaces in alkaline dodecylammonium chloride solutions. Journal of Colloid and Interface Science 1996, 179, (2), 403-411. 3. Yoon, R. H.; Ravishankar, S. A., Long-range hydrophobic forces between mica surfaces in dodecylammonium chloride solutions in the presence of dodecanol. Journal of Colloid and Interface Science 1996, 179, (2), 391-402. 4. Yoon, R. H.; Ravishankar, S. A., Application of extended DLVO theory.3.Effect of Octanol on the long-range hydrophobic forces between Dodecylamine-coated mica surfaces. Journal of Colloid and Interface Science 1994, 166, (1), 215-224.
65
Chapter 3
Development and Characterization of
Polymer Films Relevant to Fiber Surfaces
66
ABSTRACT
In order to use quartz crystal microbalance (QCM) and surface plasmon resonance
(SPR) sensors to monitor the adsorption behavior of lubricants onto solid surfaces, typical
textile material were deposited an ultra thin film on metal surfaces by using the spin
coating technique. Dilute solution of cellulose, polypropylene, polyethylene, nylon and
polyester were spun-coated on SPR and QCM gold sensors as well as on silicon wafers.
The optimum spinning conditions were achieved and the produced ultrathin films were
characterized by atomic force microscopy (AFM) for morphology, ellipsometry for
thickness and water contact angle for surface energy. X-ray photoelectron spectrometry
was also used t determine the surface composition of the produced films. Results showed
that the films were manufactured reproducibly, they were uniform and smooth and their
thicknesses was very small, lower than 50 nanometers (which make them suitable for
precise QCM and SPR sensing). The manufacture ultrathin model films facilitated the
studies on adsorption of polymers on flat films at the nano scale, in situ and in real time.
67
INTRODUCTION
Our work involved the use of quartz crystal microbalance (QCM), ellipsometry,
surface plasmon resonance (SPR) and atomic force microscopy (AFM) as methods that
were applied to monitor the adsorption of polymers onto surfaces relevant to fiber
technologies. Most of the tools available (including the cited techniques) demand the use
of flat, well defined surfaces and therefore use of actual fibers is usually prevented. To
this end surfaces that mimic those present in textile and paper processes were needed.
Metallic sensors are primary platforms in QCM (gold and silica resonators) and SPR
(gold wafers) techniques. Therefore, in order to employ both techniques to monitoring the
adsorption of polymers onto (model) textile and fiber surfaces, the QCM and SPR
sensors required coating in the form of thin films of organic materials that could represent
those in actual fiber operations. Films of cellulose, polypropylene (PP), polyethylene
(PE), nylon and polyester (polyethylene terephthalate, PET) were obvious candidates of
choice since these are leading materials in most common fiber formulations. As such,
ultrathin films of these (natural and synthetic) polymers were developed and applied in a
number of studies in our laboratories.
Surprisingly, to our knowledge there are no reports available concerning studies
of surface phenomena on textile-relevant model films, especially in the case of synthetic
polymers. Consequently, no standards were available for the production of reproducible,
robust model films of these materials which could be used in research concerning the
molecular mechanisms involved in adsorption, friction and wear.

68
For the preparation of polymer films, doctor-blading techniques 1 can be applied if
the target layer thickness is in the mm range. Chemical vapor deposition 2 is typically
used when organic materials to be deposited on substrates are of low boiling points. In
contrast, in the case of ultrathin films of organic molecules Langmuir-Blodgett 3-6 and
spin coating 7-10 techniques are two of the most frequently used methods. In Langmuir-
Blodgett deposition monomolecular layers can be built on the substrate and by using
multiple deposition, multilayers can also be obtained, with controlled surface density and
multilayer thickness. An advantage of these techniques is the excellent control in layer
density and the fact that very small roughness and complete coverage can be attained.
The limitation of the Langmuir-Blodgett technique, however, is the demand for relatively
complex instrumentation, laborious protocols and time consuming. In this investigation
we used spin-coating since it is very simple for implementation and involve simple
operation. The films obtained by spin coating albeit not as smooth as in the case of
Langmuir-Blodgett films were found suitable for our purposes. In spin coating the
thickness, coverage and roughness are affected by factors such as molecular weight and
concentration of the film-forming compound, solvent type (viscosity, density and surface
energy), rotation speed of the rotor and temperature 8. Through carefully control these
parameters, optimum results (roughness and thickness) can be obtained.

69
EXPERIMENTAL
Materials
All experiments were performed with deionized water from an ion-exchange
system (Pureflow, Inc.) followed treatment in a Milli-Q® Gradient unit for water with a
resultant resistivity of greater than 18MΩ.
Cellulose used was Avicel ® PH-101 (Fluka Chemical Corporation) micro-
crystalline cellulose (MCC). Medium density polyethylene (PE) (received as a powder),
polypropylene (PP) (syndiotactic and with Mn and Mw of 54000 and 127000,
respectively) and nylon 6 (with a Tg of 62.5°C and particle size of 3 mm) were all
purchased from Sigma-Aldrich. Poly (ethylene terephthalate) (PET) was provided by
Goulston Inc. (Monroe, NC). Polyvinylamine (PVAm) from BASF Corporation.
Solvents such as xylenes (HPLC grade), hexafluoroisopropanol (HFIP, 99.5+%)
and 50% N-Methylmorpholine-N-Oxide (NMMO) were purchased from Fisher Scientific.
In our experiments we used silica wafers (cut into smaller pieces of 1.5x1.5cm,
from Wafer World Inc., FL), silica or gold QCM sensors (Q-Sense Inc., Sweden) and
gold SPR sensors (Reichert Inc. NY).
Methods
All substrates except silica QCM sensors were cleaned before use with PiranhaTM
solution (70% H2SO4+30% H2O2 (30%)) for one hour without heat and then subject to by

70
UVO radiation (28 mW/cm2 at 254 nm) for 10 minutes, immediately before spin-coating.
Silica QCM sensors were cleaned by sodium dodecyl surfate (SDS, 2% aqueous solution).
Since the preparation of the films, especially those concerning the synthetic polymers,
involved newly developed methods, a detailed description of their preparation is given
below.
Preparation of cellulose films
Cellulose thin films were prepared on silica wafer or gold QCM resonators
according to a procedure reported elsewhere 11 and modified slightly as follows.
Cellulose solution was first prepared by dissolving micro-crystalline Avicel cellulose
(MCC) in 50%wt water/N-Methylmorpholine-N-Oxide (NMMO) at 115 °C. DMSO was
added to adjust the concentration (0.05%) and viscosity of the cellulose suspension.
Polyvinylamine (PVAm, BASF) was used as anchoring polymer to attach cellulose film
on the silica/gold surface. The silica/gold surfaces were immersed in PVAm for 20 min
followed by washing with milli-Q water and drying with gentle nitrogen jet. The
cellulose solution was then used in the spin coater (Laurell Technologies model WS-
400A-6NPP) by depositing one or two drops on the substrates and spun at 5000 rpm for
40 seconds. We found these conditions as optimal for obtaining robust, smooth films. The
cellulose-coated substrate was removed from the coater and then immersed in milli-Q
water for more than four hours and then placed in an oven for two hours at 80 °C. The
cellulose-coated substrates were then washed thoroughly with milli-Q water, dried with
nitrogen jet and stored at room temperature in a clean chamber for further use.
71
Preparation of PP and PE films
Thin polyethylene (PE) film prepared by spin coating was first reported by
Bartczak and Argon et al. 12. An inconvenience of their method was that an oven was
required adjacent to the spin coater to reduce the transfer time between spin coater and
the oven, which was used to prevent a drop in the temperature of the coated surfaces (and
keep a high temperature for annealing). In our modified method, an infrared lamp was
employed instead to heat the substrates. Other modifications, mainly processing
conditions, were implemented in order to obtain ultrathin and uniform films. The same
methodology was used in the case of PP films (explained below). The preparation of PP
and PE thin films involved dissolution of the polymer in xylenes (0.2% solution): In a
typical protocol 20mg PP/PE and 10ml xylenes were placed in a small flask with a
condenser (running water as cooling medium). The solution was heated and stirred for
more than 2h to dissolve the polymer. A wafer was then placed on the coater rotor head
(Laurell Technologies model WS-400A-6NPP) while an infrared lamp (250 Watts) was
used to keep the surface above 85 ºC (as measured by an infrared thermometer gun). One
or two drops of hot PP or PE solution was then immediately transferred on the substrates
and rotated at 3000 rpm for 20 seconds. The coated substrate was then removed from the
coater and then transferred to an oven where the coated substrate was kept at 80 °C for 2h.
This temperature and time was found to be sufficient to remove all residual solvent (see
XPS measurements in later section). Once cooled the coated substrate was then stored at
room temperature in a clean chamber until use.

72
Preparation of Nylon and PET films
Nylon and polyester (PET) are very difficult to dissolve in common solvents. m-
cresol at 100° C has been the solvent of choice 13. In recent years, scientists found
fluorine-containing polymers to have excellent solving for nylon and PET, even at room
temperatures 13, 14. In our work, we found that hexafluoroisopropanol (HFIP) was an
excellent solvent to dissolve both nylon and PET. Ultra thin films were prepared from
0.16% solution: 10 mg Nylon or PET and 6 g of HFIP were mixed in a small vial until
complete dissolution. The time required for dissolution was typically several hours. Once
fully dissolved, 1-2 drops of the solution were placed on the substrate which was sitting
on the rotor head of the spin coater (Laurell Technologies model WS-400A-6NPP). As
before, infrared light was used to keep the surface warm before placing the solution (at
least tens seconds of IR radiation were needed). A spinning rate of 3000 rpm and 20
seconds time were used in the coating process. The coated substrate was then removed
from the coater and transferred to an oven at 80 °C for 2h to remove the residual solvent.
The finished substrate was then stored at room temperature in a clean chamber for further
use.
AFM
Film surface morphologies were investigated by atomic force microscope (AFM)
(Q-Scope™ 250 from Quesant Instrument Corporation) with tapping mode under
atmospheric conditions. For each sample, scans were acquired on a wide area varying
from 1×1 to 20×20 µm. A planar background was subtracted from the data to compensate

73
for tilt of the sample relative to the scanning plane. The results were checked for
reproducibility by imaging several regions of the same sample.
Contact angle measurement
The contact angle of untreated and polymer-coated PET surfaces against pure
water was measured on a manual Rame-Hart goniometer. After 1 min of placing a droplet
of Mini-Q water (10 µL) onto the surface the outline of the droplet was detected with an
optical magnifier. The tangent line on the droplet in the three-phase zone was traced with
a protractor within the optics and therefore provided a measurement of the contact angle.
Film Thickness
Two methods were used to measure the thicknesses of the films obtained by spin
coating: namely, an ellipsometric and a piezoelectric method. We used a Rudolph Single
Wavelength Ellipsometer to measure the change in polarization of elliptically polarized
light when it is reflected on the sample surface. When a mineral substrate (silica wafer) is
optically modified (for example, with an ultrathin organic layer), the associated change in
polarization light can be measured and used to calculate the thickness of the coated layer.
From the changes in the ellipsometric angles (Δ, Ψ), the refractive index, n, and the
optical (ellipsometric) thickness, δe of the film can be obtained.
The QCM technique was also employed to measure the thickness of our model
films. Here the film thickness was derived from an electro-mechanical measurement as
opposed to the former optical measurement. In QCM measurements the resonant
frequency (f) of the piezoelectric material (quartz crystal) was measured. This oscillation
74
frequency depends on the effective mass of the sensor-coating layer element 15-17. As
stated by the Sauerbrey equation 18, if a thin and rigid film is adsorbed on the sensor the
decrease in frequency (relative to the bare surface) is proportional to the mass added:
c fmnΔ
Δ = − (Equation 3.1)
where C = 17.7 ng Hz-1 cm-2 for a 5 MHz quartz crystal and n = 1,3,5,7 is the overtone
number. Knowing the density of the coating layer one can therefore calculate the
respective layer thickness. In our investigation, only the QCM third overtone frequency
was measured before and after spin coating in air at constant temperature of 25 ºC. These
values were used to calculate the “QCM” thickness of the layers obtained by spin coating.
X-Ray Photoelectron Spectroscopy (XPS)
A Riber XPS system was employed to provide chemical state information for the
obtained model surfaces. In XPS the soft X-rays from the Al Kα source ionize electrons
from the elements residing on the surface of the sample. The kinetic energy of the ejected
photoelectrons was measured and the respective binding energies determined. The
binding energy, being an intrinsic characteristic of the given electrons of the core orbital,
was used to determine the composition of chemical species present in the top few atomic
layers of the material. Here XPS was used to confirm the chemical composition of the
model surfaces and therefore was useful to establish the identity (purity) of the organic
layer.
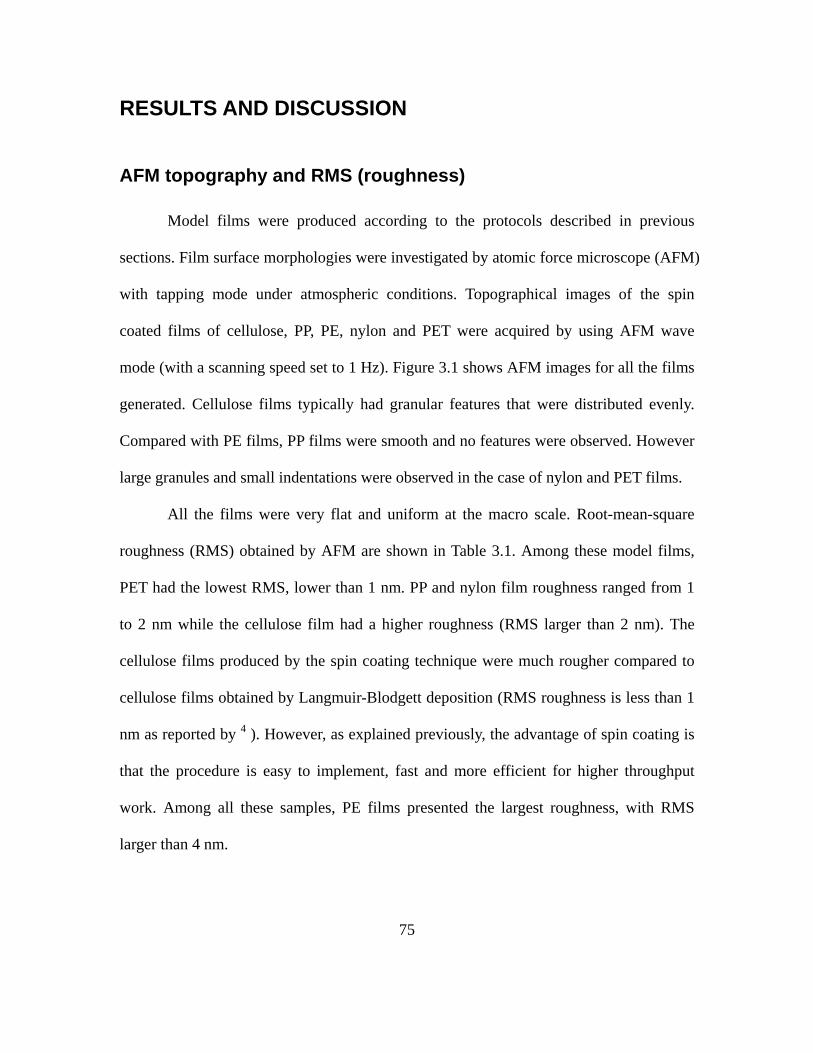
75
RESULTS AND DISCUSSION
AFM topography and RMS (roughness)
Model films were produced according to the protocols described in previous
sections. Film surface morphologies were investigated by atomic force microscope (AFM)
with tapping mode under atmospheric conditions. Topographical images of the spin
coated films of cellulose, PP, PE, nylon and PET were acquired by using AFM wave
mode (with a scanning speed set to 1 Hz). Figure 3.1 shows AFM images for all the films
generated. Cellulose films typically had granular features that were distributed evenly.
Compared with PE films, PP films were smooth and no features were observed. However
large granules and small indentations were observed in the case of nylon and PET films.
All the films were very flat and uniform at the macro scale. Root-mean-square
roughness (RMS) obtained by AFM are shown in Table 3.1. Among these model films,
PET had the lowest RMS, lower than 1 nm. PP and nylon film roughness ranged from 1
to 2 nm while the cellulose film had a higher roughness (RMS larger than 2 nm). The
cellulose films produced by the spin coating technique were much rougher compared to
cellulose films obtained by Langmuir-Blodgett deposition (RMS roughness is less than 1
nm as reported by 4 ). However, as explained previously, the advantage of spin coating is
that the procedure is easy to implement, fast and more efficient for higher throughput
work. Among all these samples, PE films presented the largest roughness, with RMS
larger than 4 nm.
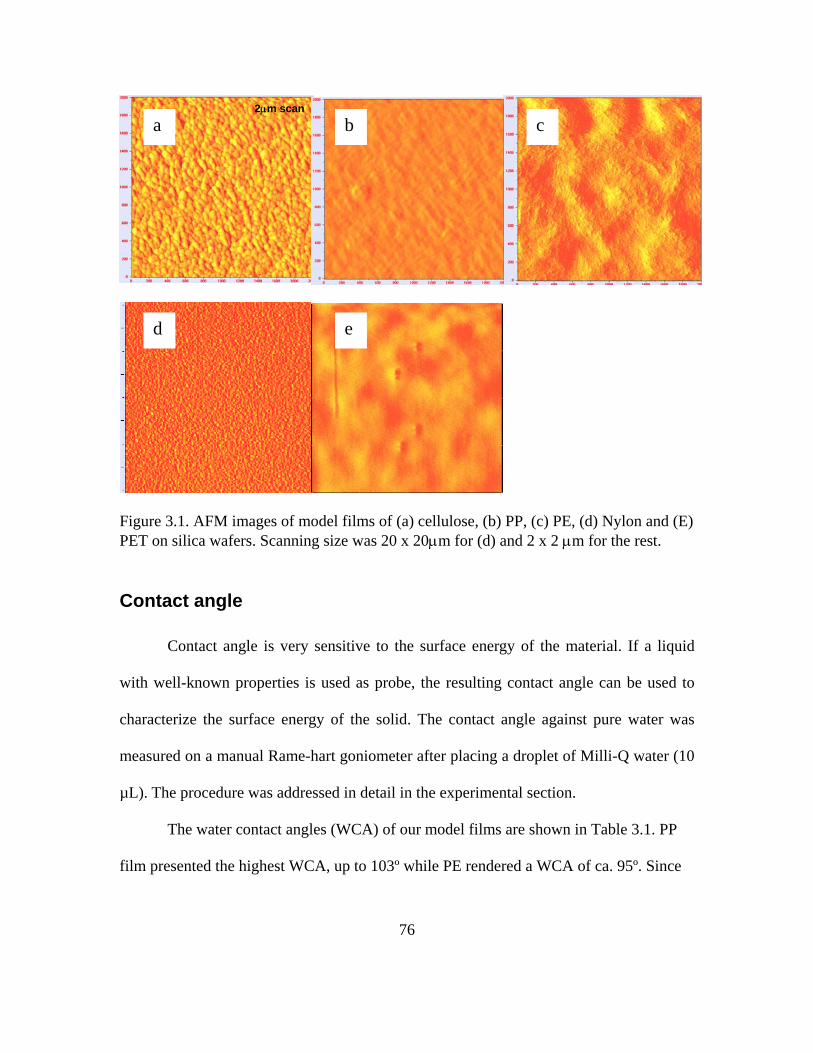
76
Figure 3.1. AFM images of model films of (a) cellulose, (b) PP, (c) PE, (d) Nylon and (E) PET on silica wafers. Scanning size was 20 x 20μm for (d) and 2 x 2 μm for the rest.
Contact angle
Contact angle is very sensitive to the surface energy of the material. If a liquid
with well-known properties is used as probe, the resulting contact angle can be used to
characterize the surface energy of the solid. The contact angle against pure water was
measured on a manual Rame-hart goniometer after placing a droplet of Milli-Q water (10
µL). The procedure was addressed in detail in the experimental section.
The water contact angles (WCA) of our model films are shown in Table 3.1. PP
film presented the highest WCA, up to 103º while PE rendered a WCA of ca. 95º. Since
2μm scan2μm scana b c
d e

77
both materials have only -CH2- or -CH3 groups, they were expected to exhibit very low
surface energies. Nylon and PET produced similar WCA (61.9º and 64.8º, respectively)
while cellulose, due to its hydrophilicity, showed the lowest WCA (28.6±3.4 º). This
value for cellulose agrees with the data from other reports (25-35 º) 4, 19.
Thickness
In this investigation, both QCM and ellipsometry were employed to measure the
thicknesses of our developed films. In the case of QCM, the frequency of the third
overtone was measured before and after spin coating in air at constant 25ºC. Since the
model films were rigid Sauerbrey equation was taken as reliable in the calculation of
thickness. The ellipsometric thickness was measured to confirm this assumption. In fact,
the data obtained from ellipsometric measurements agreed with those from QCM quite
well (see Table 3.1).
Table 3.1. Characterizations of model surfaces.
Model film
Solvent
Precursor polymer solution
Concentration(% w/w)
Thickness(nm)
RMS (nm)
WCA (deg)
PP Xylenes 0.2 17-21 19-24*
0.7-2.3 102.9±1.7
PE Xylenes 0.3 30-34 27-36*
4-6 95.1±0.7
Cellulose NMMO/DMSO 0.3 10-15 2-2.5 28.6±3.4 Nylon HFIP 0.15 41-47 1.3-2.1 61.9±1.0 PET HFIP 0.15 33-38 0.3-1.1 64.8±1.1
*Data acquired by ellipsometry. Remaining thicknesses were determined from QCM data.

78
Thicknesses of model films obtained after spin coating solutions with respective
polymer concentrations is shown in Table 3.1. In the process of preparation of these
model films, our ultimate goal was to modify surfaces of QCM and SPR sensors.
Therefore, two factors had to be considered, namely, coverage of the film and sensor
sensitivity. The surfaces of our sensors were required to be homogeneous in order to
avoid effects of the underlying substrate (thus requiring thick films). On the other hand, if
the films are excessively thick the sensitivity of SPR and QCM measurements is impaired.
A compromise between coverage and sensitivity (that also takes into account the need for
a low relative roughness), led the selection of film thickness of the order of 20-50 nm as
optimum values for experiments involving adsorption measurements.
X-ray photoelectron spectroscopy
X-ray photoelectron spectroscopy (XPS) was used to characterize the chemical
composition of model surfaces and also to confirm the absence of residual solvent in the
films. Xylenes, the solvent for PP and PE, with its aromatic ring allows a clear detection
via XPS, from the respective binding energies. In fact, if there is any residual solvent on
the film, π-π* bonding of carbons in the benzene ring would be observed at around 292
eV binding energy. As observed in the detailed XPS spectra for PP and PE (see insets in
Figure 3.20, no peaks were detected IN the region around this binding energy. Therefore,
it was apparent that evaporation at high temperature spin coating and oven treatment were
enough to fully evaporate the solvent. We noted that traces of oxygen at 527 eV were
79
detected in both PE and PP films. This small amount of oxygen was explained by partial
oxidation of the polymer during the dissolution process which, as noted before, was
carried out at elevated temperature. Since the time required to dissolve PE was longer
than that of PP, a larger oxygen peak was expected and confirmed in the survey spectra
for both films, as shown in Figure 3.2.

80
1200 1000 800 600 400 200 00
10
20
30
40
50x103
CP
S
Binding energy (eV)
x103
O1s
C1s
300 295 290 285 28002468
101214
1200 1000 800 600 400 200 00
10
20
30
40
50 x103
CP
S
Binding energy (eV)
x103
O1s
C1s
300 295 290 285 28002468
101214
Figure 3.2. XPS survey spectra for bare PP (a) and PE (b) films. Detail spectra (inset) for C1s BE region are included in each figure.
Cellulose was dissolved in NMMO, which contains nitrogen. Therefore, any XPS

81
nitrogen peak in the spectrum (corresponding to a binding energy of 400 eV) would
indicate the presence of residual solvent. As observed in Figure 3.3 no such peak was
observed; therefore it can be concluded that the cellulose films were solvent-free.
We performed multiple XPS scans on several cellulose samples. In a given sample
we also run XPS in different locations. We didn’t find evidence of sample degradation
during the X-Rays exposure time (kept as short as possible). Unfortunately, the sampling
depth of X-Rays is comparable to the film thickness. Since the roughness of the thin films
of cellulose was up to 2.8 nm and the lateral resolution of the used unmonochromated
XPS is in the nm range, some underlying areas are expected to contribute to the XPS
signal. As a result, signals from the Au substrate or adhesive PVAm anchoring layer (1-2
nm ellipsometric thickness) were present in the spectra collected.
We note that full coverage (material distribution and topography) of cellulose on
the sensor was confirmed from the AFM images while spatial distribution of material on
the surface was difficult to judge from our XPS measurements.
Regarding the chemical composition of cellulose films we observed that the
carbon emission of the XPS spectrum showed a larger contribution of the bonded carbons
in the cellulose film than the Au and N peaks from inner layers (substrate or PVAm
anchoring layer). The measured O/C ratio was 0.85, comparable to the theoretical value
of 0.83. Also, the ratio of carbon with two bonds to oxygen to the carbon with one bond
to oxygen (O–C–O/C–O or C3/C2) corresponded to a value close to the theoretical
cellulose composition (0.22 versus 0.2). The differences with respect to the theoretical

82
values for these ratios were explained by the signal contribution from carbon atoms with
shifted binding energies from the underlying PVAm. Also, possible oxidization of
molecules after treatment of film in the oven can not be ruled out. We note that a C1
peak was detected. This peak was mainly due to adsorption of airborne contaminants
during handling and XPS preparation. We consider that the obtained XPS spectra
confirmed the presence of pure cellulose and were in agreement with spectra reported
elsewhere. Survey and detailed C spectra are presented in Figure 3.3.
In order to minimize the risk of any uncovered cellulose areas, in our
investigations on nonionic polymer adsorption we utilized cellulose solutions at a
concentration of 0.5% (w/w) during the coating process of the sensor. This concentration
was found as optimal to ensure a full coverage while the sensitivity in measurement was
not diminished.
Nylon and PET were dissolved in HFIP, which is a solvent carrying six fluorine
atoms per molecule. The presence of any residual solvent on the films could be detected
by distinctive XPS fluorine peak at a binding energy of around 700 eV. As seen in Figure
3.4, no such a peak was detected in the case of nylon and PET films and therefore it can
be concluded that they were solvent-free. Small peaks and shoulder structure could be
observed in the detail spectra (insets) which covered the C1s region. These structures
confirmed the carbonyl in nylon and benzene structure, as well as carbonyl and carboxyl
groups in PET.
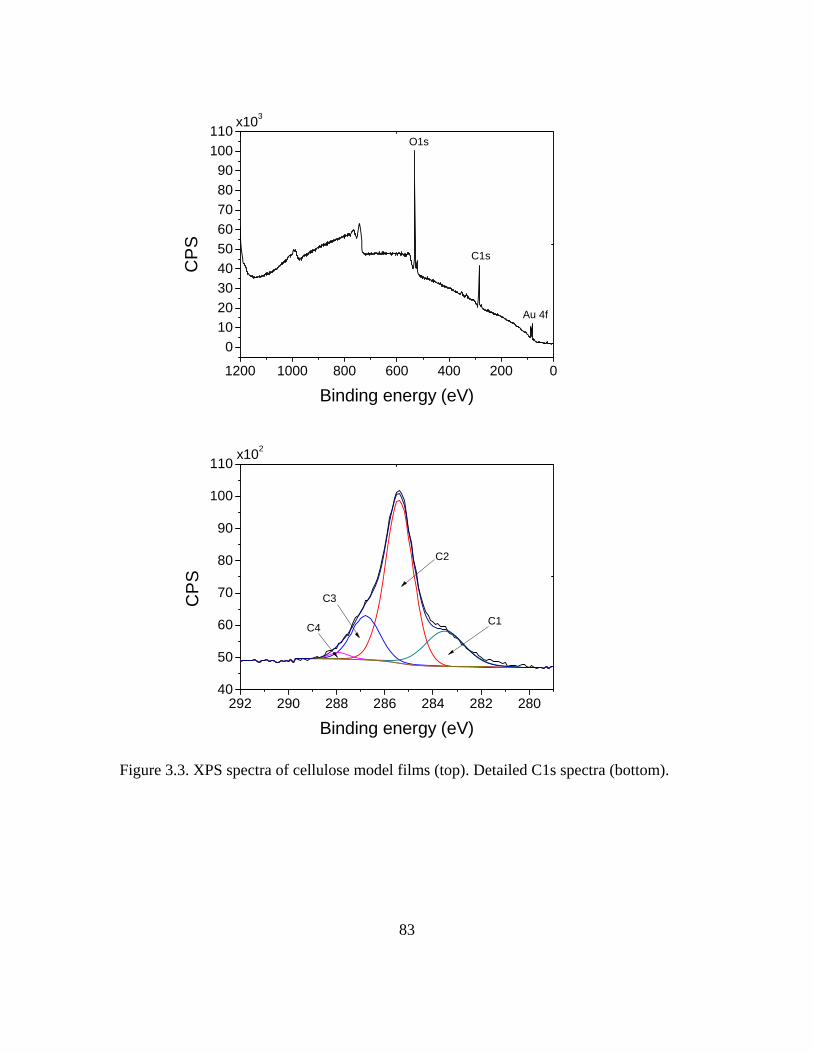
83
1200 1000 800 600 400 200 0
0102030405060708090
100110
x103
CP
S
Binding energy (eV)
O1s
C1s
Au 4f
292 290 288 286 284 282 28040
50
60
70
80
90
100
110
CP
S
Binding energy (eV)
C1
C2
C3
C4
x102
Figure 3.3. XPS spectra of cellulose model films (top). Detailed C1s spectra (bottom).

84
1200 1000 800 600 400 200 00
10
20
30
40
50x102
CP
S
Binding energy (eV)
x103
O1s
N1s
C1s
300 295 290 285 2800
20
40
60
80
1200 1000 800 600 400 200 00
10
20
30
40
50 x102
CP
S
Binding energy (eV)
x103
O1s
C1s300 295 290 285 2800
20
40
60
Figure 3.4. XPS spectra of model (a) Nylon and PET (b) films. Detailed C1s spectra are seen in the insets.

85
A summary of the main elemental composition obtained from XPS is listed in
Table 3.2. The experimental data agreed with the theoretical values very well. Based on
the evidence presented it can be concluded that the films were highly pure, homogeneous,
flat and therefore are expected to be good models for textile and fiber surfaces.
Table 3.2. Comparison of the chemical composition from XPS and theoretical value Film C
(Atom %) O
(Atom %) N
(Atom %) Au
(Atom %) PP (Expt.) 99.28 0.72 (C3H6)n 100 0
PE (Expt.) 98.7 1.3 (C2H4)n 100 0
Cellulose (Expt.) 52.93 (54.93) 45.64 (45.07) 1.43 (0) (C 6 H 10 O 5 ) n 54.55 45.55
Nylon (Expt.) 75.56 12.35 12.1 (C6 H11 O N)n 75 12.5 12.5
PET (Expt.) 69.47 30.53 (C10 H8 O4 )n 71.43 29.57
Spin Coating as a Platform for the Manufacture of Model Films
Spin coating is one of most often used techniques to prepare thin organic films due to
its efficiency and reproducibility. In the process of spin coating, an excess amount of a
solution is placed on the substrate, which is then rotated at high speed (usually in
thousands RPM) in order to spread the fluid by centrifugal force. Usually the applied
solvent is volatile, therefore it evaporates simultaneously with rotation. Rotation is
continued until the desired thickness of the film is achieved. Variables involved in the
process of spin coating which influence the thickness and uniformity of the obtained film
include viscosity, concentration, angular frequency of the rotating substrate and operation

86
temperature 7-9, 20. A model which is used to describe the final thickness in term of these
factors is the Lawrence’s equation 8:
1/ 4
0 0 0f 1/ 2
( )h c Dη∝
Ω (Equation 3.2)
where 0c is initial polymer concentration; 0η , initial kinetic viscosity; 0D , the solute
diffusivity and Ω is the spinning speed. From this relationship, which is confirmed by
extensive experimental work 7, 19, it is obvious the strong dependency between final
thickness and initial polymer concentration. This relationship was also supported by our
experiments: six PP films were made in sequence and then their thickness was measured
by ellipsometry. A clear trend could be observed for the thickness of PP films which
increased with preparation sequence. This preparation sequence is related to the time the
solution is exposed to air before use in the spin coater: The larger the sequence numbers,
the longer the time elapsed and therefore the higher the polymer concentration 0c (as a
result of solvent evaporation). Therefore, as the polymer in the container (flask) became
more concentrated with time (sequence number), the thicker the produced film would be.
Another reason which may contribute to the increased thickness of thin film is that the
viscosity of solution. Polymer was oxidized at elevated temperature (this could be
observed in the oxygen peak in XPS spectra increases with heating time). The viscosity
of solution might increase with oxidation. Higher viscosity could lead to higher thickness
of thin film. These observations mean that in order to prepare reproducible surfaces we
must exercise care in the sequence and time of preparation in order to keep same
operational conditions.

87
Note that if other thicknesses different than the targeted 20-30 nm are desired
Lawrence relationship can be used for related adjustment.
#1 #2 #3 #4 #5 #610
15
20
25
30Th
ickn
ess,
nm
Preparation sequence
Figure 3.5. Ellipsometric thicknesses of PP films obtained after different sequence times (larger sequence number indicates longer time and therefore larger 0c ).
Model surfaces as a platform for adsorption
Modified sensors were mounted in the QCM chamber and a nonionic polymer
solution was passed through to test their performance. The tested polymers was a
pluronic surfactant, E37P56E37 or a tri-block polymer with 37 ethylene oxide (EO)
groups at both ends and 56 propylene oxide (PO) groups in the middle. The adsorbed
isotherms (adsorbed mass against lubricant concentrations) on different surfaces are
shown in Figure 3.6. As demonstrated by this figure, PP surface showed the highest
adsorbed polymeric surfactant mass, while cellulose was the lowest. Nylon and PET yield

88
intermediate adsorption masses. These results indicate that the protocols used in the
preparation of ultrathin films are consistent with expected results. This together with the
previous characterization indicated that suitable flat and uniform surfaces were produced
and can be employed to study phenomena such as adsorption, friction, wear, etc.
1E-4 1E-3 0.01 0.1 10
200
400
600
800
1000
Ads
orbe
d m
ass,
ng/c
m2
Lubricant concentration, % (w/v)
PP Cellulose Nylon PET
Figure 3.6. Adsorption of a nonionic polymer (lubricant) (E37P56E37) on various model films . Adsorption isotherm was obtained by using the QCM-D technique.
SUMMARY
In summary, we reported on the methods to prepare model surfaces as substrate
for studies relevant to fiber materials. Thin films of cellulose, PP, PE, Nylon and PET
were manufactured by using spin coating and optimum conditions for such manufacture
were proposed. Robust, uniform and fully covering thin films required when using
surface-sensitive techniques, especially SPR, QCM, were presented. Among these films,

89
nylon and PET films were introduced for the first time. Finally, application of the
protocols to modify QCM sensors and use as a platform to study adsorption was
demonstrated in this chapter.
90
REFERENCES
1. Song, H. H.; Wang, C. S., NOVEL ANISOTROPIC TEXTURE OF RIGID-ROD POLY(P-PHENYLENE BENZOBISTHIAZOLE) FILM. Polymer 1993, 34, (22), 4793-4795. 2. Martin, T. P.; Lau, K. K. S.; Chan, K.; Mao, Y.; Gupta, M.; O'Shaughnessy, A. S.; Gleason, K. K., Initiated chemical vapor deposition (iCVD) of polymeric nanocoatings. Surface & Coatings Technology 2007, 201, (22-23), 9400-9405. 3. Habibi, Y.; Foulon, L.; Aguie-Beghin, V.; Molinari, M.; Douillard, R., Langmuir-Blodgett films of cellulose nanocrystals: Preparation and characterization. Journal of Colloid and Interface Science 2007, 316, (2), 388-397. 4. Holmberg, M.; Berg, J.; Stemme, S.; Odberg, L.; Rasmusson, J.; Claesson, P., Surface force studies of Langmuir-Blodgett cellulose films. J Colloid Interf Sci 1997, 186, (2), 369-381. 5. Sakakibara, K.; Ogawa, Y.; Nakatsubo, F., First cellulose Langmuir-Blodgett films towards photocurrent generation systems. Macromolecular Rapid Communications 2007, 28, (11), 1270-1275. 6. Tammelin, T.; Saarinen, T.; Osterberg, M.; Laine, J., Preparation of Langmuir/Blodgett-cellulose surfaces by using horizontal dipping procedure. Application for polyelectrolyte adsorption studies performed with QCM-D. Cellulose 2006, 13, (5), 519-535. 7. Kontturi, E.; Johansson, L. S.; Kontturi, K. S.; Ahonen, P.; Thune, P. C.; Laine, J., Cellulose nanocrystal submonolayers by spin coating. Langmuir 2007, 23, (19), 9674-9680. 8. Lawrence, C. J., The Mechanics of Spin Coating of Polymer-Films. Phys Fluids 1988, 31, (10), 2786-2795. 9. Levinson, W. A.; Arnold, A.; Dehodgins, O., Spin-Coating Behavior of Polyimide Precursor Solutions. Polym Eng Sci 1993, 33, (15), 980-988. 10. Park, M. S.; Joo, W.; Kim, J. K., Porous structures of polymer films prepared by spin coating with mixed solvents under humid condition. Langmuir 2006, 22, (10), 4594-4598.
91
11. Gunnars, S.; Wagberg, L.; Stuart, M. A. C., Model films of cellulose: I. Method development and initial results. Cellulose 2002, 9, (3-4), 239-249. 12. Bartczak, Z.; Argon, A. S.; Cohen, R. E.; Kowalewski, T., The morphology and orientation of polyethylene in films of sub-micron thickness crystallized in contact with calcite and rubber substrates. Polymer 1999, 40, (9), 2367-2380. 13. Fong, H.; Liu, W. D.; Wang, C. S.; Vaia, R. A., Generation of electrospun fibers of nylon 6 and nylon 6-montmorillonite nanocomposite. Polymer 2002, 43, (3), 775-780. 14. Veleirinho, B.; Rei, M. F.; Lopes-da-Silva, J. A., Solvent and concentration effects on the properties of electrospun poly(ethylene terephthalate) nanofiber mats. Journal of Polymer Science Part B-Polymer Physics 2008, 46, (5), 460-471. 15. Bruschi, L.; Mistura, G., Measurement of the friction of thin films by means of a quartz microbalance in the presence of a finite vapor pressure. Physical Review B 2001, 63, (23). 16. Rodahl, M.; Hook, F.; Krozer, A.; Brzezinski, P.; Kasemo, B., Quartz-crystal microbalance setup for frequency and Q-factor measurements in gaseous and liquid environments. Review of Scientific Instruments 1995, 66, (7), 3924-3930. 17. Rodahl, M.; Kasemo, B., On the measurement of thin liquid overlayers with the quartz-crystal microbalance. Sensors and Actuators a-Physical 1996, 54, (1-3), 448-456. 18. Sauerbrey, G., The use of quartz oscillators for weighing thin layers and for microweighing. Zeitschrift Fur Physik 1959, 155, (2), 206-222. 19. Sczech, R.; Riegler, H., Molecularly smooth cellulose surfaces for adhesion studies. J Colloid Interf Sci 2006, 301, (2), 376-385. 20. Meyerhofer, D., Characteristics of Resist Films Produced by Spinning. J Appl Phys 1978, 49, (7), 3993-3997.

92
Chapter 4
Bulk Properties of Amphoteric and
Nonionic Polymers
Part content of this chapter was published in “Charge and the dry-strength performance of
polyampholytes. Part 1: Handsheet properties and polymer solution viscosity”.
Song, J.; Wang, Y.; Hubbe, M. A.; Rojas, O. J.; Sulic, N.; Sezaki, T., Journal of Pulp
and Paper Science 2006, 32, (3), 156-162

93
ABSTRACT
In this investigation the bulk properties of six ionic polymers (four
polyampholytes and two simple polyelectrolytes) as well as seven nonionic lubricants are
presented. Their structural information, chemical composition, molecular weight, and
degree of polymerization, as well as surface tension, viscosity and viscosity change with
ionic strength are described here. This information is useful to understand the nature of
the samples to be used in future studies and to further help us to understand how the
nature of the polymers influences the interfacial behavior upon adsorption onto different
surfaces. The ultimate purpose is to help us to establish structure (of polyampholytes and
nonionic polymers)-properties (strength-enhancing of polyampholytes and boundary
lubrication of nonionic polymers) relations that can be used in designing new polymers in
targeted applications.
94
INTRODUCTION
In our investigation, a number of chemicals were used. Key samples, including
polyampholytes and nonionic lubricants are introduced in this chapter in order to allow a clear
understanding of their chemical structure, degree of polymerization, molecular weight, etc. Bulk
properties, such as viscosity of polyampholytes, surface tension of nonionic lubricant, are
described as well. This is expected to be helpful in understanding the interfacial behavior and
their applications and to produce relationships between the nature of chemicals and their
functions.
EXPERIMENT
Materials
Polyampholytes
All experiments were performed with deionized water from an ion-exchange system
(Pureflow, Inc.) followed treatment in a Milli-Q® Gradient unit for water with a resultant
resistivity of greater than 18MΩ. Inorganic chemicals (salt, acid and alkaline) all were of reagent
grade. Polyampholyte and polyelectrolyte samples had been prepared by free-radical
polymerization for a final content of charged monomers as indicated in Table 4.1. Synthesis
work was conducted by T. Sezaki in Harima Chemical Corp. A representative structure of the
amphoteric terpolymers used is shown in Figure 4.1. The cationic monomer was N-[3-(N’,N’-
dimethylamino)propyl]acrylamide (DMAPAA), a tertiary amine. The anionic monomer was a
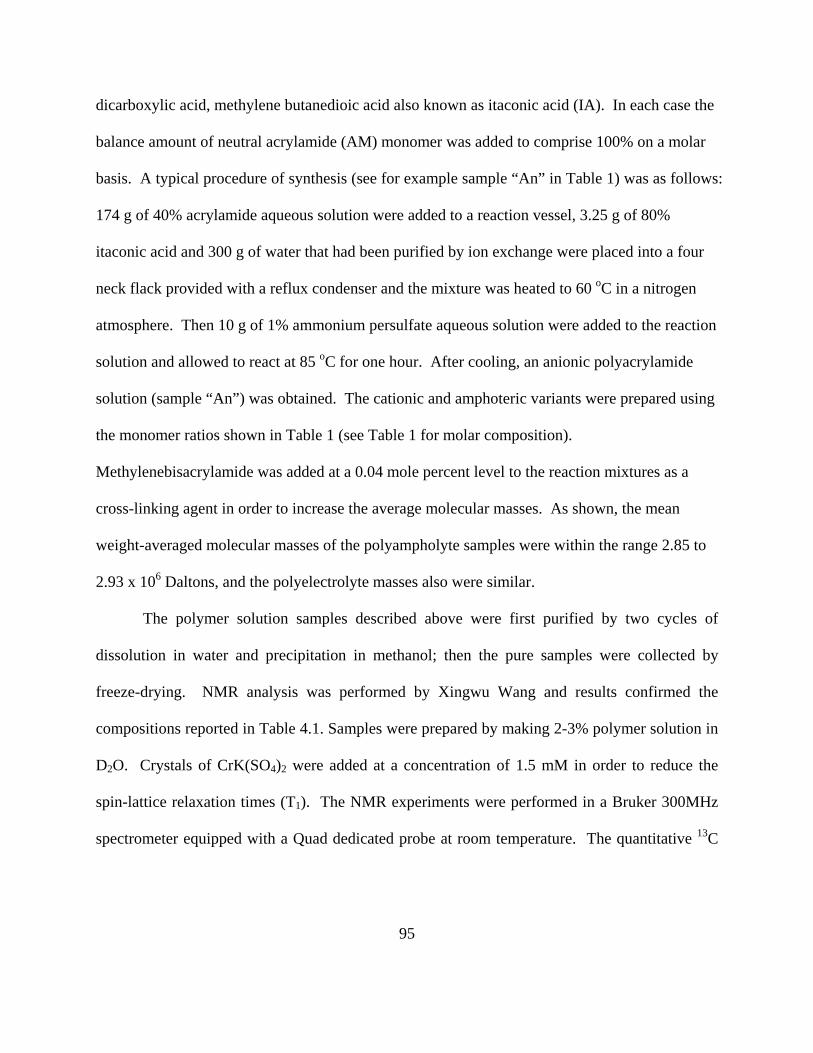
95
dicarboxylic acid, methylene butanedioic acid also known as itaconic acid (IA). In each case the
balance amount of neutral acrylamide (AM) monomer was added to comprise 100% on a molar
basis. A typical procedure of synthesis (see for example sample “An” in Table 1) was as follows:
174 g of 40% acrylamide aqueous solution were added to a reaction vessel, 3.25 g of 80%
itaconic acid and 300 g of water that had been purified by ion exchange were placed into a four
neck flack provided with a reflux condenser and the mixture was heated to 60 oC in a nitrogen
atmosphere. Then 10 g of 1% ammonium persulfate aqueous solution were added to the reaction
solution and allowed to react at 85 oC for one hour. After cooling, an anionic polyacrylamide
solution (sample “An”) was obtained. The cationic and amphoteric variants were prepared using
the monomer ratios shown in Table 1 (see Table 1 for molar composition).
Methylenebisacrylamide was added at a 0.04 mole percent level to the reaction mixtures as a
cross-linking agent in order to increase the average molecular masses. As shown, the mean
weight-averaged molecular masses of the polyampholyte samples were within the range 2.85 to
2.93 x 10⁶ Daltons, and the polyelectrolyte masses also were similar.
The polymer solution samples described above were first purified by two cycles of
dissolution in water and precipitation in methanol; then the pure samples were collected by
freeze-drying. NMR analysis was performed by Xingwu Wang and results confirmed the
compositions reported in Table 4.1. Samples were prepared by making 2-3% polymer solution in
D2O. Crystals of CrK(SO4)2 were added at a concentration of 1.5 mM in order to reduce the
spin-lattice relaxation times (T1). The NMR experiments were performed in a Bruker 300MHz
spectrometer equipped with a Quad dedicated probe at room temperature. The quantitative 13C

96
spectra were acquired using an inverse gated proton decoupling sequence with a 90o pulse and a
relaxation delay of 4.5 s, that was ~5 times of the longest T1 measured for the samples. The 1H
spectra were measured with 60o pulse and a pulse delay of 3 s. Note that in the case of
polyampholytes the molar ratio of DMAPAA and IA is 5:2. Since IA is a dicarboxylic acid the
effective content of anionic (carboxylic) groups is twice the value of the respective IA which is
equivalent to a ratio between cationic (tertiary amine) and anionic (carboxylic) groups of 5:4.
Figure 4.1. Molecular composition of monomers in random polyampholytes prepared by free-radical polymerization (DMAPAA, IA and AM).
(H3C) 2N
N H2HO
H O
OO
O
m10 -n-m
n
Itaconic acid monomer group (IA)
Acrylamide monomer group (AM)
Dimethylaminoprolylacrylamid(DMAPAA monomer group
O
NH

97
Table 4.1. Synthesis of acrylamide-based polyampholytes and simple copolymers Sample Polymer
type Basic
group * (if any)
Acidic group * (if any)
Basic group molar
content (%)
Carboxylic (acidic)
group molar content (%)
Polydispersity(Mw/Mn)
PAmp2 2.5 2 3.7 PAmp4 5 4 3.7 PAmp8 10 8 3.6 PAmp16
Ampho-
teric
DMAPAA
IA
20 16 3.8
Cat Cationic DMAPAA - 5 - 3.7 An Anionic - IA - 4 3.9
DMAPAA = N-[3-(N’,N’-dimethylamino)propyl]acrylamide ; IA = itaconic acid * measured at 25 ºC and 100 s-1. ** SEC-LALLS-VIS (TDA-302, Viscotek). . Nonionic lubricants
Nonionic lubricants used in this investigation included two sets of polymer with known
structures, polyalkylene glycols (PAGs) from Dow Chemical Co. (Midland, MI), and triblock
copolymers based on ethylene and propylene oxide (Pluronic) from BASF Corporation (Florham
Park, NJ). General chemical structures of PAGs (Figure 4.2a) and Pluronics (Figure 4.2b) can be
seen in Figure 4.2a and 4.2b respectively.
RO-[CH2CHO]n[CH2CH2O]m-H
CH3
RO-[CH2CHO]n[CH2CH2O]m-H
CH3
RO-[CH2CHO]n[CH2CH2O]m-H
CH3
RO-[CH2CHO]n[CH2CH2O]m-H
CH3
H-[CH2CH2O]m-[CH2CHO]n[CH2CH2O]m-H
CH3
H-[CH2CH2O]m-[CH2CHO]n[CH2CH2O]m-H
CH3
H-[CH2CH2O]m-[CH2CHO]n[CH2CH2O]m-H
CH3
H-[CH2CH2O]m-[CH2CHO]n[CH2CH2O]m-H
CH3
Figure 4.2. Chemical structure of PAGs (a) and Pluronics (b).
Lubricants with different m, n are listed in Table 4.2. They have different chemical
structures and different molecular weights. We intend to use these polymers as representatives of
nonionic lubricant finishes in order to understand how the respective structures influences the
assembly of lubrication layer (and thus boundary lubrication and friction).

98
Table 4.2. Structure information of PAGs and Pluronics symbol Commercial name MW n (PO) m (EO) HLB RP10E13 UCON 50-HB-400 1230 10 13 11.92 RP13E17 UCON 50-HB-660 1590 13 17 12.0 RP33E44 UCON 50-HB-5100 3930 33 44 8.51 E19P29E19 Pluronic P65 3400 29 19 21.67 E76P29E76 Pluronic F68 8400 29 76 27.97 E37P56E37 Pluronic P105 6500 56 37 17.34 * UCON polymers from Dow Co. and Pluronic polymers from BASF Co. * HLB values were calculated by the method described by Guo et al 1 * R stands for a butyl group, P stands for propylene oxide group and E stands for ethylene oxide group respectively in this table. Silicone-based lubricant was supplied by Goulston Inc. (Monroe, NC) under trade name
LN336-100I. It was a commercial product with main component silicone polymer and some
additives. The main component is a surface-active block copolymer of polyalkylene oxide-
modified polydimethylsiloxane.
Methods
Viscosity of polyampholytes
Viscosities were measured with an Ubbelohde viscometer in a thermostated water bath at
25.0 °C in 0.1% solids aqueous polymer solutions in the presence and absence of 0.01 M NaCl.
The pH was adjusted with aqueous HCl or NaOH.
Radius of gyration measurement
A DAWN laser photometer and an OPTILAB interferometric refractrometer of Wyatt
Technology Corporation were employed in this experiment. Only one sample PAmp4 with three
conditions of pH (pH4, pH7, and pH10) representing acidic, neutral and basic condition was

99
investigated. Zimm plots were obtained with a static light scattering (SLS) data fitting program
provided by Wyatt Technology Corporation.
Surface tension measurement
A Fisher Surface Tensiomat®, model 21 with a Du Noüy Ring was employed to measure
the surface tension of lubricant solutions. In the Du Noüy method, a platinum-iridium ring of
precisely known dimensions is suspended from a counter-balanced lever arm. The arm is held
horizontal by torsion applied to a taut stainless steel wire, to which it is clamped. Increasing the
torsion in the wire raises the arm and the ring, which carries with it a film of the liquid in which
it is immersed. The maximum pull force exerted on the ring by the surface was measured and
translated to units of surface tension, mN/m
RESULTS AND DISCUSSION
Bulk properties of polyampholytes
Viscosity without salt
A series of experiments were carried out to evaluate the bulk properties of solutions of
polyampholyte PAmp2 through simple polyelectrolyte An in Table 4.1. As shown in Figure 4.3a,
the relative viscosity of each of the polyampholyte solutions was strongly affected by changes in
pH. In the case of the polyampholyte samples Pamp2 through PAmp16, a broad viscosity
minimum was observed at close-to-neutral pH (about 6<pH<7). The viscosity of the
polyampholytes generally increased as the pH was changed from neutral to higher (or lower) pH.
Viscosity maxima are observed at both sides of neutral pH but then they are reduced again at
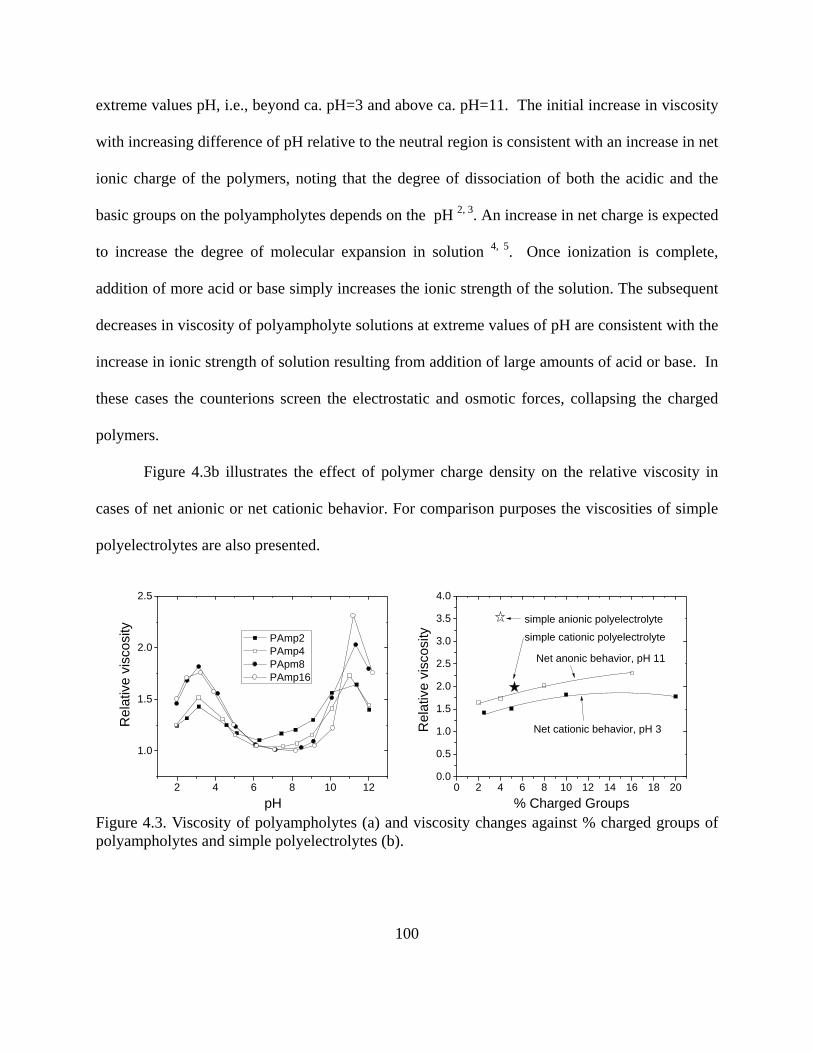
100
extreme values pH, i.e., beyond ca. pH=3 and above ca. pH=11. The initial increase in viscosity
with increasing difference of pH relative to the neutral region is consistent with an increase in net
ionic charge of the polymers, noting that the degree of dissociation of both the acidic and the
basic groups on the polyampholytes depends on the pH 2, 3. An increase in net charge is expected
to increase the degree of molecular expansion in solution 4, 5. Once ionization is complete,
addition of more acid or base simply increases the ionic strength of the solution. The subsequent
decreases in viscosity of polyampholyte solutions at extreme values of pH are consistent with the
increase in ionic strength of solution resulting from addition of large amounts of acid or base. In
these cases the counterions screen the electrostatic and osmotic forces, collapsing the charged
polymers.
Figure 4.3b illustrates the effect of polymer charge density on the relative viscosity in
cases of net anionic or net cationic behavior. For comparison purposes the viscosities of simple
polyelectrolytes are also presented.
2 4 6 8 10 12
1.0
1.5
2.0
2.5
0 2 4 6 8 10 12 14 16 18 200.0
0.5
1.0
1.5
2.0
2.5
3.0
3.5
4.0
Rel
ativ
e vi
scos
ity
pH
PAmp2 PAmp4 PApm8 PAmp16
Rel
ativ
e vi
scos
ity
% Charged Groups
Net cationic behavior, pH 3
Net anonic behavior, pH 11
simple anionic polyelectrolyte
simple cationic polyelectrolyte
Figure 4.3. Viscosity of polyampholytes (a) and viscosity changes against % charged groups of polyampholytes and simple polyelectrolytes (b).

101
Results corresponding to simple polyelectrolyte samples Cat and An are also reported in
Figure 4.4. Contrary to the observations made above for the case of amphoteric polymers, each
of the simple polyelectrolytes showed one maximum viscosity with pH. pH titrations indicated a
pKb for that the cationic polyelectrolyte Cat of 9.8, and a pKa for the anionic polyelectrolyte An
of 4.1 and 6.8 for the two carboxyl groups 6. Thus, one would expect the molecules in sample
Cat to have a relatively expanded conformation at relatively low pH values corresponding to the
charged, protonated form of the tertiary amine groups. Then, with increasing pH above a value
of 8 it is reasonable to expect a drop in viscosity, consistent with a reduced molecular extension.
Considerations in the case of the anionic polymer An are similar, except that decreasing the pH is
expected to increase the proportion of protonated, uncharged carboxylic acid groups relative to
charged carboxylate groups on the polymer.
2 4 6 8 10 12
1.0
1.5
2.0
2.5
3.0
3.5
4.0
Rel
ativ
e vi
scos
ity
pH
Cat. An.
Figure 4.4. Viscosity for simple polyelectrolytes Cat and An (see Table 4-1)
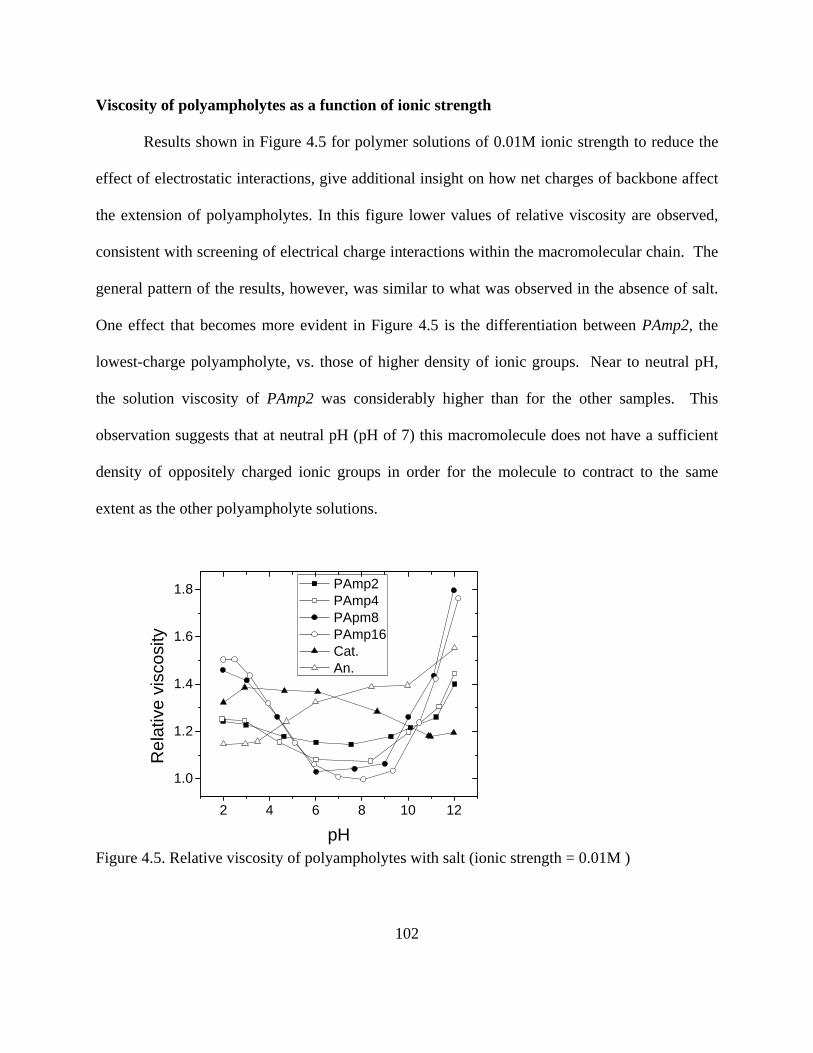
102
Viscosity of polyampholytes as a function of ionic strength
Results shown in Figure 4.5 for polymer solutions of 0.01M ionic strength to reduce the
effect of electrostatic interactions, give additional insight on how net charges of backbone affect
the extension of polyampholytes. In this figure lower values of relative viscosity are observed,
consistent with screening of electrical charge interactions within the macromolecular chain. The
general pattern of the results, however, was similar to what was observed in the absence of salt.
One effect that becomes more evident in Figure 4.5 is the differentiation between PAmp2, the
lowest-charge polyampholyte, vs. those of higher density of ionic groups. Near to neutral pH,
the solution viscosity of PAmp2 was considerably higher than for the other samples. This
observation suggests that at neutral pH (pH of 7) this macromolecule does not have a sufficient
density of oppositely charged ionic groups in order for the molecule to contract to the same
extent as the other polyampholyte solutions.
2 4 6 8 10 12
1.0
1.2
1.4
1.6
1.8
Rel
ativ
e vi
scos
ity
pH
PAmp2 PAmp4 PApm8 PAmp16 Cat. An.
Figure 4.5. Relative viscosity of polyampholytes with salt (ionic strength = 0.01M )

103
Viscosity with addition of poly aluminum chlorohydrate (PAC)
Poly aluminum chlorohydrate (PAC), with a formula Aln(OH)mCl3n-m, is often used in the
pulp and paper industries as a size bonding agent and drainage aid. It was found that there was
some synergistic effect to dry-strength enhancing of polyampholytes 6-10. In this investigation,
the viscosity of polyampholytes with addition of PAC was studied. At pH of 4, 5 and 8.5, the
relative viscosity of polyampholytes and simple polyelectrolytes change against dosage is
presented in Figure 4.6. An obvious synergistic effect of viscosity for polyampholytes could be
seen in Figure 4.6a and 4.6b at pH4 and pH5, respectively, while not presented at pH8.5 for
simple polyelectrolytes.
1E-5 1E-4 1E-3
1.2
1.4
1.6
1.8
2.0
2.2
2.4
1E-5 1E-4 1E-3
1.0
1.2
1.4
1.6
1.8
2.0
2.2
2.4
1E-5 1E-4 1E-30.5
1.0
1.5
2.0
2.5
3.0
3.5
Rel
ativ
e vi
scos
ity
(a) pH4
Rel
ativ
e vi
scos
ity
Concentration of PAC (% of polyamoholytes)
(b) pH5
Rel
ativ
e vi
scos
ity
PAmp2 PAmp4 PAmp8 PAmp16 Cat An
(c) pH8.5
Figure 4.6. Relative viscosity of polyampholytes measured at pH 4 (a), pH 5 (b), and pH 8.5(c) after applying Poly aluminum chlorohydrate (PAC).
As shown in Figure 4.7a, addition of a low level of PAC (0.01% in solution, on an as-
received basis) consistently increased the relative viscosities of polyampholyte solutions in the
absence of added salt, both at pH=4 and pH=5. The opposite was seen in the case of
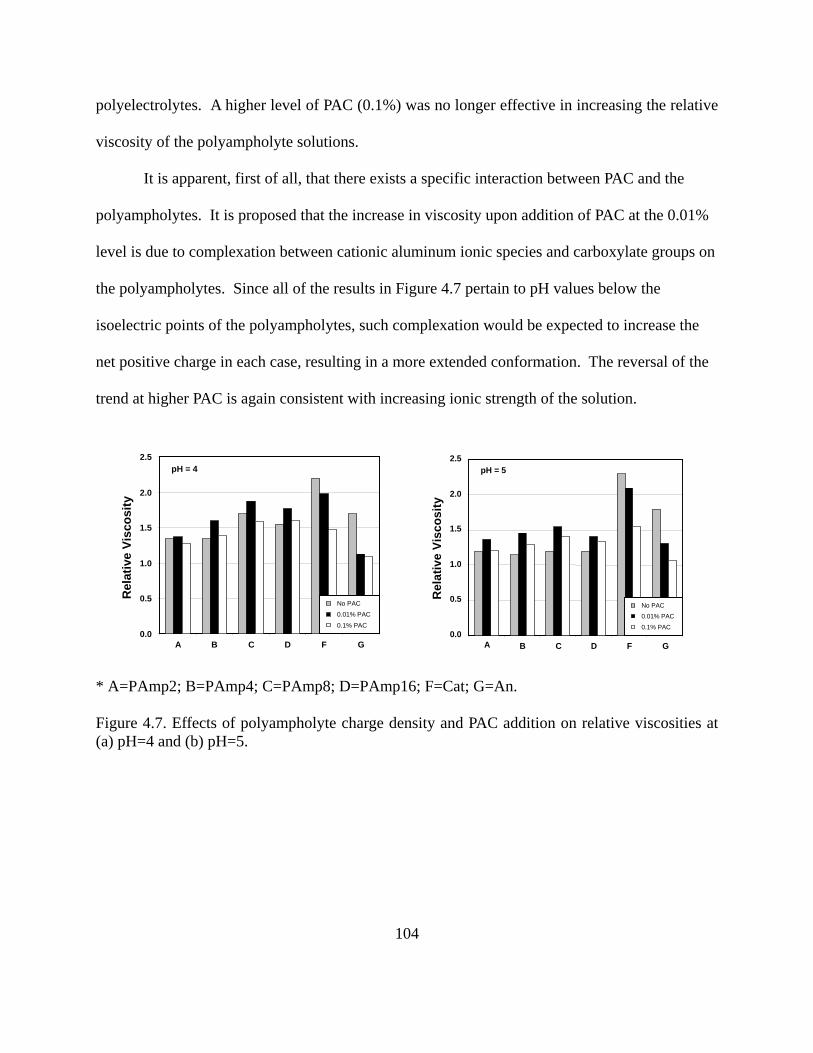
104
polyelectrolytes. A higher level of PAC (0.1%) was no longer effective in increasing the relative
viscosity of the polyampholyte solutions.
It is apparent, first of all, that there exists a specific interaction between PAC and the
polyampholytes. It is proposed that the increase in viscosity upon addition of PAC at the 0.01%
level is due to complexation between cationic aluminum ionic species and carboxylate groups on
the polyampholytes. Since all of the results in Figure 4.7 pertain to pH values below the
isoelectric points of the polyampholytes, such complexation would be expected to increase the
net positive charge in each case, resulting in a more extended conformation. The reversal of the
trend at higher PAC is again consistent with increasing ionic strength of the solution.
0.0
0.5
1.0
1.5
2.0
2.5
A B C D F G
Rel
ativ
e Vi
scos
ity
No PAC
0.01% PAC
0.1% PAC
pH = 4
A B C D F G
Rel
ativ
e Vi
scos
ity
0.0
0.5
1.0
1.5
2.0
2.5
No PAC0.01% PAC
0.1% PAC
pH = 5
* A=PAmp2; B=PAmp4; C=PAmp8; D=PAmp16; F=Cat; G=An. Figure 4.7. Effects of polyampholyte charge density and PAC addition on relative viscosities at (a) pH=4 and (b) pH=5.

105
Influence of pH on the radius of gyration
pH4 pH7 pH100
50
100
150
200
Rg (n
m)
Figure 4.8. The radius of gyration of PAmp4 at different pH conditions.
The radius of gyration at different pH conditions were performed by using multi-angle
light scattering. For example, the radius of gyration (Rg)of PAmp4 in aqueous medium at pH 7
was 69±7 nm while at pH 4 and pH 10 Rg increased up to 95±6 and 182±36 nm, respectively
(see Figure 4.8). These data agree well with the viscosity results discussed above.
Bulk properties of nonionic lubricants
Surface tension, an important property for surfactants and amphophilic polymers must be
taken into consideration when dealing with interfacial phenomena. Surface tension was measured
to characterize the adsorption at the air/liquid interface. Also, the critical micelle concentrations
(CMC) of all polymeric lubricants used in our research were determined. At the CMC, the
interface between solution and air is saturated with the solute molecules. Before this
106
concentration, the surface tension changes rapidly with surfactant concentration. Any further
addition of surfactants after CMC will lead to the formation of micelles, while the surface
tension remains constant. The curves of surface tension against polymer concentration are
presented in Figure 4.9a and 4.9b for PAG and Pluronic polymers, respectively. Figure 4.10
includes data for the silicone surfactant.
For those polymers with low MW, such as RP10E13 and RP13E17, the surface tension
changes roughly linearly with concentration. Lubricants with higher MW, larger than 3000
Dalton such as RP33E44 and all Pluronic polymers, showed typical surface tension curves. The
CMC was located within a concentration range around 0.0001%-0.001%.
The silicone surfactant used in this study was a surface-active block copolymer of
polyalkylene oxide-modified polydimethylsiloxane. Polydimethylsiloxane is very strong
nonpolar group which produces a lowering in surface tension. It can be observed that the surface
tension dropped sharply from ca. 72 mN/m to ca. 35 mN/m as the lubricant concentration
increased from 10-5 to 5*10-3 % (w/v). The surface tension then decreased slowly, down to 32
mN/m at 1% maximum concentration. This behavior is indicative of a surface active molecule
with strong polar and nonpolar groups. Compared with PAGs and Pluronic polymers, the
silicone lubricant showed a much lower surface tension but higher CMC. Silicone lubricant was
found to have a greater surface activity than regular hydrocarbon surfactants, as expected.

107
1E-7 1E-6 1E-5 1E-4 1E-3 0.01 0.1 1
35
40
45
50
55
60
65
70
75
1E-7 1E-6 1E-5 1E-4 1E-3 0.01 0.1 1
35
40
45
50
55
60
65
70
75 RP10E13 RP13E17 RP33E44
Surfa
ce T
ensi
on (m
N/m
)
Concentration (w/v%)
E19P29E19 E76P29E76 E37P56E37
Surfa
ce T
ensi
on (m
N/m
)
Concentration (w/v%) Figure 4.9. Surface tension and CMC determination for bi-block polymer PAGs (a) and tri-block polymer Pluronics (b).
1E-6 1E-5 1E-4 1E-3 0.01 0.1 1
30
40
50
60
70
80
Sur
face
Ten
sion
(mN
/m)
Concentration (w/v%)
Figure 4.10. Surface tension and CMC for the silicone surfactant LN336-100I. At a given temperature, the adsorption of the surface active molecules at the air/liquid
interface is related to the polymer concentration and surface tension. This relationship is
described by Gibbs adsorption equation:
1 ( )ln TRT cγ∂
Γ = −∂
(Equation 4.1)
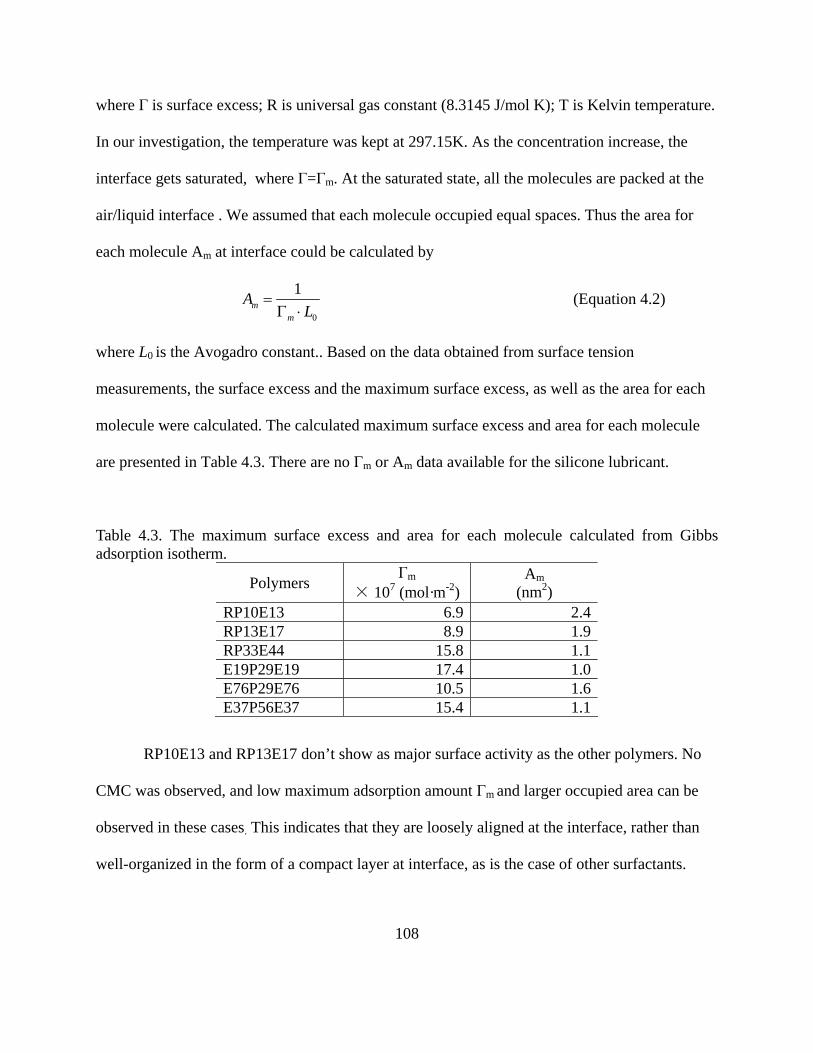
108
where Г is surface excess; R is universal gas constant (8.3145 J/mol K); T is Kelvin temperature.
In our investigation, the temperature was kept at 297.15K. As the concentration increase, the
interface gets saturated, where Г=Гm. At the saturated state, all the molecules are packed at the
air/liquid interface . We assumed that each molecule occupied equal spaces. Thus the area for
each molecule Am at interface could be calculated by
0
1m
m
AL
=Γ ⋅
(Equation 4.2)
where L0 is the Avogadro constant.. Based on the data obtained from surface tension
measurements, the surface excess and the maximum surface excess, as well as the area for each
molecule were calculated. The calculated maximum surface excess and area for each molecule
are presented in Table 4.3. There are no Гm or Am data available for the silicone lubricant.
Table 4.3. The maximum surface excess and area for each molecule calculated from Gibbs adsorption isotherm.
Polymers Гm × 107 (mol·m-2)
Am (nm2)
RP10E13 6.9 2.4 RP13E17 8.9 1.9 RP33E44 15.8 1.1 E19P29E19 17.4 1.0 E76P29E76 10.5 1.6 E37P56E37 15.4 1.1
RP10E13 and RP13E17 don’t show as major surface activity as the other polymers. No
CMC was observed, and low maximum adsorption amount Гm and larger occupied area can be
observed in these cases. This indicates that they are loosely aligned at the interface, rather than
well-organized in the form of a compact layer at interface, as is the case of other surfactants.
109
E19P29E19 and E76P29E76 share the same hydrophobic part, but exhibit quite different
occupied areas per molecule. This is obviously the result of the two longer hydrophobic chains in
the case of E76P29E76. It can be concluded that there is no one part that can totally control the
adsorption of the adsorbed polymer at the interface. Both hydrophobic and hydrophilic parts are
very important in the formation of interfacial layers.
CONCLUSIONS
In this chapter, key samples, including polyampholytes and nonionic polymers which are
used in our adsorption studies were introduced and characterized in term of their bulk properties.
The nature of polymers, such as their chemical structures, degree of polymerization and
molecular weight, and their properties, including viscosity of polyampholytes, surface tension of
nonionic lubricant, were described in detail. The information compiled here can help to further
understand the interfacial behavior during adsorption of amphoteric and nonionic polymers on
different solid surfaces and to help to establish the relationship between the nature of chemicals
and their functions.

110
REFERENCES
1. Guo, X. W.; Rong, Z. M.; Ying, X. G., Calculation of hydrophile-lipophile balance for polyethoxylated surfactants by group contribution method. Journal of Colloid and Interface Science 2006, 298, (1), 441-450. 2. Mazur, J.; Silberberg, A.; Katchalsky, A., Potentiometric behavior of polyampholytes. Journal of Polymer Science 1959, 35, (128), 43-70. 3. Bekturov, E. A.; Kudaibergenov, S. E.; Rafikov, S. R., Synthetic Polymeric Ampholytes in Solution. Journal of Macromolecular Science-Reviews in Macromolecular Chemistry and Physics 1990, C30, (2), 233-303. 4. Forster, S.; Schmidt, M., Polyelectrolytes in Solution. Physical Properties of Polymers 1995, 120, 51-133. 5. Lin, K. F.; Cheng, H. L., A simple method to estimate chain conformations of polyelectrolytes in the semidilute regime. Macromolecules 2000, 33, (13), 4961-4965. 6. Wang, Y.; Hubbe, M. A.; Sezaki, T.; Wang, X. W.; Rojas, O. J.; Argyropoulos, D. S., Aspects of retention and formation - The role of polyampholyte charge density on its interactions with cellulose. Nordic Pulp & Paper Research Journal 2006, 21, (5), 638-645. 7. Hubbe, M. A.; Rojas, O. J.; Argyropoulos, D. S.; Wang, Y.; Song, J.; Sulic, N.; Sezaki, T., Charge and the dry-strength performance of polyampholytes - Part 2. Colloidal effects. Colloids and Surfaces a-Physicochemical and Engineering Aspects 2007, 301, (1-3), 23-32. 8. Hubbe, M. A.; Rojas, O. J.; Sulic, N.; Sezaki, T., Unique behaviour of polyampholytes as dry-strength additives. Appita Journal 2007, 60, (2), 106-+. 9. Sezaki, T.; Hubbe, M. A.; Heitmann, J. A.; Argyropoulos, D. S., Colloidal effects of acrylamide polyampholytes - Part 2: Adsorption onto cellulosic fibers. Colloids and Surfaces a-Physicochemical and Engineering Aspects 2006, 289, (1-3), 89-95. 10. Song, J.; Wang, Y.; Hubbe, M. A.; Rojas, O. J.; Sulic, N.; Sezaki, T., Charge and the dry-strength performance of polyampholytes. Part 1: Handsheet properties and polymer solution viscosity. Journal of Pulp and Paper Science 2006, 32, (3), 156-162.
111
Chapter 5
Adsorption of Polyampholytes on Solid Surfaces
Measured by the QCM Technique
112
ABSTRACT
In this chapter we discuss the relation between polyampholyte bulk properties and
adsorption on silica and cellulose surfaces. Four polyampholytes carrying different charge
densities but with same ratio of positive to negative groups, and two structurally similar
polyelectrolytes (one cationic and the other anionic) were studied by using a Quartz Crystal
Microbalance (QCM). This technique allowed time-resolved measurements of changes in
frequency (Δf) (c.f. mass) and energy dissipation (ΔD) (c.f. rigidity or viscoelastic properties) of
a sensor, which made it possible to investigate the dynamics and extent of adsorption, the
viscoelastic properties and the conformation changes of the different adsorbed layers. Through
this research, we determined that the charge properties of a solid surface play a crucial role in the
adsorption behavior of polyampholytes. This is explained by the capability the surface has to
polarize the adsorbed polyampholyte layers. In our experiment, silica surfaces adsorbed much
more polyampholytes than cellulose surfaces, under the same experimental conditions. The
polyampholytes with the higher charge density adsorbed more extensively on silica and also
produced a softer adsorbed layer. We propose that this is due to the polarization effect of the
highly-charged silica surfaces on the high charge density polyampholytes. In the case of
cellulose surfaces we conclude that the effect of charge density is less important as compared to
that of silica surfaces.
113
INTRODUCTION
Polyampholytes are charged macromolecules carrying both acidic and basic groups 1.
Under appropriate conditions these groups dissociate in aqueous solution, producing ionic groups
on the polymer chains and the respective counterions in solution. If the ionic groups on the
polymer chain are weak acids or bases, then the net charge of the polyampholyte can be changed
by varying the pH of the aqueous medium. At the isoelectric point the amounts of positive and
negative charges on the polyion are the same, giving a net charge of zero. In the vicinity of the
isoelectric pH, the polymers are nearly charge-balanced and exhibit the unusual properties of
polyampholytes 1-10. At conditions of high charge asymmetry (far above or far below the
isoelectric pH), these polymers behave similar to simple polyelectrolytes.
Due to the unique properties of polyampholytes they are promising in controlling wetting,
lubrication, adhesion and other phenomena 11-15. Polyampholytes are currently used to control the
colloidal stability of dispersions in such applications as waste water treatment.13, 16 Recent
reports indicate that polyampholytes provide superior strength improvements for paper
manufacture, compared to the addition of simple polyelectrolytes 17.
There is a need for understanding the adsorption phenomena, especially in the case of
polyampholytes, that will lead to new functional materials and performance. Despite the
existence of few theoretical and computational reports on polyampholyte behaviors at solid
interfaces 2, 3, 6, 7, 10, 18-21, there is a lack of experimental data to confirm the proposed theories and
to directly allow the elucidations of the complex polyampholyte adsorption phenomena 16, 22.
114
In this study we carried out adsorption experiments with a series of polyampholytes having
increasing total charge densities at a constant ratio of cationic to anionic monomeric groups and
molecular mass.
There are several methods available to study polymer adsorption on planar surfaces.
These include radio labeling 23, reflectance FTIR 24, in situ ellipsometry 25, 26, and surface
plasmon resonance 27-32. However, the main technique employed in our experiments consisted of
a Quartz Crystal Microbalance with Dissipation monitoring (QCM-D), which provided a unique
way to investigate the adsorption behavior of polymers. In fact, the mechanical oscillatory nature
of QCM resonators enabled the measurement of unique properties such as the viscoelasticity
adsorbed polymer films in addition to the mass uptake 33-36.
In this research, silica and cellulose thin films were used as substrates to study
polyampholyte adsorption. The main aim was to clarify the relationship between the charged
nature of these polymers and the adsorption and conformation of adsorbed layer. Our results
indicated that the largest adsorption gains were obtained at intermediate charge densities and
under conditions of pH favoring instability of the aqueous polymer mixtures. This corroborated
the relationship between the bulk and the surface behavior of polyampholytes as compared with
neutral polymers as well as simple polyelectrolytes.
EXPERIMENTAL
All experiments were performed with deionized water from an ion-exchange system
(Pureflow, Inc.) followed by a Milli-Q® Gradient unit (resistivity >18MΩ). Inorganic chemicals
all were of reagent grade.

115
Polyampholyte and polyelectrolyte samples were prepared by Dr. T. Sezaki (Harima
Chemical Corp.) by free-radical polymerization for a final content of charged monomers as
indicated in Table 5.1. A representative structure of the amphoteric terpolymers used is shown
in Figure 5.1. The cationic monomer was N-[3-(N’,N’-dimethylamino)propyl]acrylamide
(DMAPAA), a tertiary amine. The anionic monomer was a dicarboxylic acid, methylene
butanedioic acid also known as itaconic acid (IA). In each case the balance amount of neutral
acrylamide (AM) monomer was added to comprise 100% on a molar basis. A typical procedure
of synthesis (see for example sample “An” in Table 1) was as follows: 174 g of 40% acrylamide
aqueous solution were added to a reaction vessel, 3.25 g of 80% itaconic acid and 300 g of water
that had been purified by ion exchange were placed into a four neck flack provided with a reflux
condenser and the mixture was heated to 60 oC in a nitrogen atmosphere. Then 10 g of 1%
ammonium persulfate aqueous solution were added to the reaction solution and allowed to react
at 85 oC for one hour. After cooling, an anionic polyacrylamide solution (sample “An”) was
obtained. The cationic and amphoteric variants were prepared using the monomer ratios shown
in Table 1 (see Table 1 for molar composition). Methylenebisacrylamide was added at a 0.04
mole percent level to the reaction mixtures as a cross-linking agent in order to increase the
average molecular masses. As shown, the mean weight-averaged molecular masses of the
polyampholyte samples were within the range 2.85 to 2.93 x 10⁶ Daltons, and the polyelectrolyte
masses also were similar.
The polymer solution samples described above were first purified by two cycles of
dissolution in water and precipitation in methanol; then the pure samples were collected by

116
freeze-drying. NMR analysis was conducted by project collaborator Dr. Xingwu Wang. Samples
for NMR analysis reported in Table 5.1 were prepared by making 2-3% polymer solution in D2O.
Crystals of CrK(SO4)2 were added at a concentration of 1.5 mM in order to reduce the spin-
lattice relaxation times (T1). The NMR experiments were performed in a Bruker 300MHz
spectrometer equipped with a Quad dedicated probe at room temperature. The quantitative 13C
spectra were acquired using an inverse gated proton decoupling sequence with a 90o pulse and a
relaxation delay of 4.5 s, which was ~5 times of the longest T1 measured for the samples. The
1H spectra were measured with 60o pulse and a pulse delay of 3 s. Note that in the case of
polyampholytes the molar ratio of DMAPAA and IA is 5:2. Since IA is a dicarboxylic acid the
effective content of anionic (carboxylic) groups is twice the value of the respective IA which is
equivalent to a ratio between cationic (tertiary amine) and anionic (carboxylic) groups of 5:4.
(H3C)2N
N H2HO
H O
OO
O
m100-n-m
n
Itaconic acid monomer group (IA)
Acrylamide monomer group (AM)
Dimethylaminoprolylacrylamide(DMAPAA) monomer group
O
NH
(H3C)2N
N H2HO
H O
OOO
O
m100-n-m
n
Itaconic acid monomer group (IA)
Acrylamide monomer group (AM)
Dimethylaminoprolylacrylamide(DMAPAA) monomer group
O
NH
Figure 5.1. Molecular composition of monomers in random polyampholytes prepared by free-radical polymerization (DMAPAA, IA and AM).

117
Table 5.1. Acrylamide-based polyampholytes (PAmp 2, 4, 8 and 16) and simple polyelectrolytes (Cat and An). Note that in the case of the polyampholytes the %mol ratio cationic:anionic groups was kept constant at 5:4 and the molecular weight was approximately the same for all polymer samples.
Sample Polymer type
Cationic groups (mol %)
Cationic groups, NMR (mol %)
Anionic groups (mol %)
Anionic groups, NMR (mol %)
Viscosity* (mPa⋅s)
Mw ** (106 Da)
PAmp2 2.5 2.6 2 2.4 5300 2.95 PAmp4 5 5 4 4.4 4900 2.85 PAmp8 10 9.5 8 9.6 4000 2.90 PAmp16
Ampho-teric
20 18 16 16.8 2400 2.93 Cat Cationic 5 5 0 (1.2) 3600 2.98 An Anionic 0.5 0.5 4 3.6 5300 3.23
*measured at 25 ºC and 100 s-1. ** SEC-LALLS-VIS (TDA-302, Viscotek).
Solution viscosities were obtained with a Brookfield Model B8L viscometer (Tokimec,
Inc.) at approximately 15% solids at 25 ºC. Molecular weight was obtained via multiangle light
scattering with a SEC-LALLS-VIS (TDA-302, Viscotek).
Viscosity measurement
Further viscosity measurements to be described was obtained with an Ubbelohde
viscometer in a thermostated water bath at 25.0 °C in 0.1% solids aqueous polymer solutions in
the presence and absence of 0.01 M NaCl. The pH was adjusted with aqueous HCl or NaOH.
Radius of gyration measurement
A DAWN laser photometer and an OPTILAB interferometric refractormeter of Wyatt
Technology Corporation were employed in these experiments. Only one sample, PAmp4 under
three conditions of pH (4, 7, and 10) representing acidic, neutral and basic conditions was
118
investigated. Zimm plots were obtained with a static light scattering (SLS)data fitting
program provided by Wyatt Technology Corporation.
Cellulose thin films
The protocol of cellulose films and the quality of films were addressed in detail in
Chapter 3.
QCM-D measurements
Adsorption of polyampholyte and polyelectrolyte samples was conducted on a Quartz
Crystal Microbalance with Dissipation mode, QCM-D Q300 model (Q-Sense, Gothenburg,
Sweden). The principles of this technique could be referred in Chapter 1. Resonators consisting
of gold-coated quartz AT-cut crystals with fundamental frequency of 5 MHz were used as
sensors. Unless stated otherwise the sensors used in this investigation were coated with a silica
layer on gold. SiO2-coated crystals were cleaned by immersion in 2% sodium dodecyl sulfate
solution (SDS) for at least 30 min, followed by double rinsing with Milli-Q grade water, drying
with N2. Just before use, SiO2-coated crystals were exposure to UV-ozone treatment for 10 min
to oxidize impurities and to regenerate SiO2 on Surface.
These crystals provide a mass sensitivity of 17.7 ng cm−2 Hz−1 for rigid layers. During the
measurement, the crystal was mounted in a thermostated liquid chamber, designed to provide a
rapid, non-perturbing exchange of the liquid in contact with one side of the sensor. This system
allows for the measurement of up to four harmonics. In this study, the frequency and dissipation
responses were recorded at around 15, 25, and 35 MHz, corresponding to the third, fifth and

119
seventh overtones (n = 3, 5, and 7, respectively). For clarity, only the normalized frequency
shifts, normalized Δf (Δfn/n), and the dissipation shifts, ΔD, for the third overtone are presented.
In a typical experiment, fresh polymer solutions were prepared with Milli-Q water, at a
concentration of 0.1 µl/g with background ionic strength of buffer solution of 0.1mM. Before
running the polymer solutions, the instrument was stabilized with the respective buffer solution.
After running the QCM for ten min with the buffer solution a constant QCM baseline was
obtained and thereafter 1 ml polymer solution was injected in the adsorption module at a low rate
(0.12ml/min). The frequency and dissipation were monitored until equilibrium. Finally, 3 ml
buffer solution was used to rinse the adsorbed layer (using the same injection rate). By using this
rinsing procedure any loosely bound polymer was removed from the interface and the net
adsorption was therefore accounted for.
RESULTS AND DISCUSSION
Polyampholyte adsorption on silica surfaces
Adsorption kinetics
Figures 5-2, 3 and 4 show the adsorption curves for the polyampholytes PAmp2, PAmp4,
PAmp8 and PAmp16 as well as simple polyelectrolytes Cat and An at three different pH
conditions of the buffer solution (pH 4, 7 and 10). The data plotted in the top panel of each figure
represent the frequency change monitored with time, while those on the bottom frames represent
the change in energy dissipation as recorded by QCM. In all cases the dynamics of polymer
adsorption followed a similar pattern: At first, when polymers were injected into the adsorption
120
module, the molecules adsorbed rapidly on the silica surface, driven by electrostatic interactions.
It is interesting to observe that in this initial step all the polymers exhibited similar adsorption
rates (similar slope in the adsorption curves). Following this first step a slower adsorption
dynamics was observed. The turning point from the fast to slow adsorption rate was related
inversely with the charge density of polymer, in both acidic and basic conditions. Note that the
polymer of higher charge density was more effective in neutralizing the solid surface charge.
However, at around pH 7 (the isoelectric point for the different polyampholytes) a net charge of
zero was expected and the coiled polyampholytes produced less distinctive effects.

121
0 500 1000 1500 2000
-350
-300
-250
-200
-150
-100
-50
0Fr
eque
ncy
chan
ge, H
z
Time, min
PAmp2 PAmp4 PAmp8 PAmp16 Cat
0 500 1000 1500 2000
0
25
50
75
100
125
150
175
Ener
gy D
issi
patio
n, x
10-6
Time, min
PAmp2 PAmp4 PAmp8 PAmp16 Cat
Figure 5.2. Frequency (top) and Energy dissipation change (bottom) curves for polyampholytes PAmp2, PAmp4, PAmp8 and PAmp16 as well as simple polyelectrolytes Cat and An at pH 4.

122
0 200 400 600 800 1000 1200 1400-300
-250
-200
-150
-100
-50
0Fr
eque
ncy
chan
ge, H
z
Time, min
PAmp2PAmp4PAmp8PAmp16CatAn
0 200 400 600 800 1000 1200 1400
0
20
40
60
80
100
120
Ener
gy d
issi
patio
n, x
10-6
Time, min
PAmp2PAmp4PAmp8PAmp16CatAn
Figure 5.3. Frequency (top) and Energy dissipation change (bottom) curves for polyampholytes PAmp2, PAmp4, PAmp8 and PAmp16 as well as simple polyelectrolytes Cat and An at pH 7.

123

124
0 100 200 300 400 500 600-350
-300
-250
-200
-150
-100
-50
0Fr
eque
ncy
chan
ge, H
z
Time, min
PAmp2PAmp4PAmp8PAmp16Cat
0 100 200 300 400 500 600
0
50
100
150
200 PAmp2PAmp4PAmp8PAmp16Cat
Ener
gy d
issi
patio
n, x
10-6
Time, min
Figure 5.4. Frequency (top) and Energy dissipation change (bottom) curves for polyampholytes PAmp2, PAmp4, PAmp8 and PAmp16 as well as simple polyelectrolytes Cat and An at pH 10.

125
Interestingly, the simple cationic polyelectrolyte Cat reached the turning point much
faster than any of the other polymers. Furthermore, there was an obvious difference between low
and high charge density polyampholytes: For the low charge density polymers an equilibrium
adsorption was reached relatively fast (frequency changes are minimal after the turning point).
However, for the highly charge polyampholytes, equilibrium was reached only after a longer
time (frequency changes are slower). It is proposed that this phenomenon is caused by the
conformational change of the polymers at the interface and also by the possible formation of
multiple layers.
This process can be also observed from the change in dissipation values depicted on the
bottom panels of Figure 5.2, 3 and 4. The energy dissipation for adsorbing polyampholytes
PAmp8 and pAmp16 were much larger than for polyampholytes PAmp2 and pAmp4. They were
also larger than for the simple polyelectrolytes. The dissipation value increased with the
increasing charge density of the polymers. If one takes a larger dissipation value as indication of
a softer layer, the dissipation results were therefore consistent with the formation of multiple
layers, as proposed before.
Note that in all curves presented in Figures 5-2 to 4, a large amount of buffer was used to
rinse excess (loosely adsorbed) polymer from the interface. A second equilibrium amount can be
derived, i.e., the effective (or irreversible) adsorbed mass after rinsing.
In our cases, the dissipation value for all the polyampholytes or polyelectrolytes were
very high. Therefore, the Sauerbrey approximation could not be applied for accurate calculation
of the adsorbed mass. Therefore, we applied the Voigt model to calculate the thickness and mass
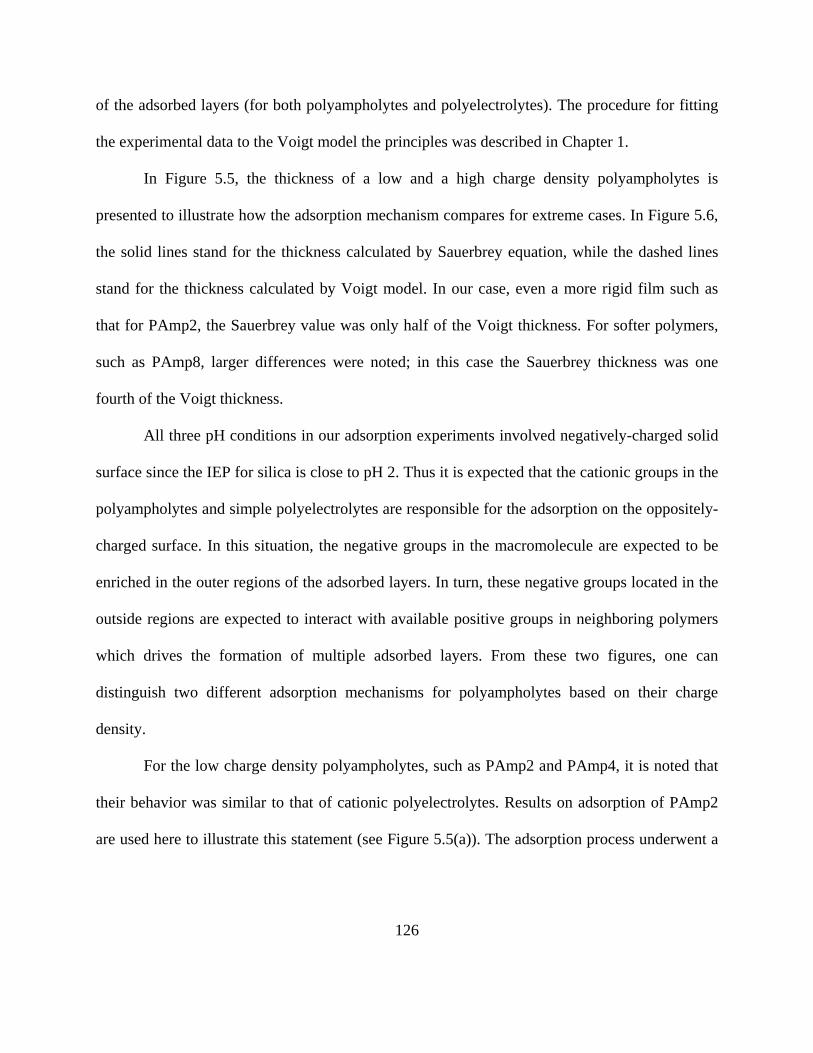
126
of the adsorbed layers (for both polyampholytes and polyelectrolytes). The procedure for fitting
the experimental data to the Voigt model the principles was described in Chapter 1.
In Figure 5.5, the thickness of a low and a high charge density polyampholytes is
presented to illustrate how the adsorption mechanism compares for extreme cases. In Figure 5.6,
the solid lines stand for the thickness calculated by Sauerbrey equation, while the dashed lines
stand for the thickness calculated by Voigt model. In our case, even a more rigid film such as
that for PAmp2, the Sauerbrey value was only half of the Voigt thickness. For softer polymers,
such as PAmp8, larger differences were noted; in this case the Sauerbrey thickness was one
fourth of the Voigt thickness.
All three pH conditions in our adsorption experiments involved negatively-charged solid
surface since the IEP for silica is close to pH 2. Thus it is expected that the cationic groups in the
polyampholytes and simple polyelectrolytes are responsible for the adsorption on the oppositely-
charged surface. In this situation, the negative groups in the macromolecule are expected to be
enriched in the outer regions of the adsorbed layers. In turn, these negative groups located in the
outside regions are expected to interact with available positive groups in neighboring polymers
which drives the formation of multiple adsorbed layers. From these two figures, one can
distinguish two different adsorption mechanisms for polyampholytes based on their charge
density.
For the low charge density polyampholytes, such as PAmp2 and PAmp4, it is noted that
their behavior was similar to that of cationic polyelectrolytes. Results on adsorption of PAmp2
are used here to illustrate this statement (see Figure 5.5(a)). The adsorption process underwent a
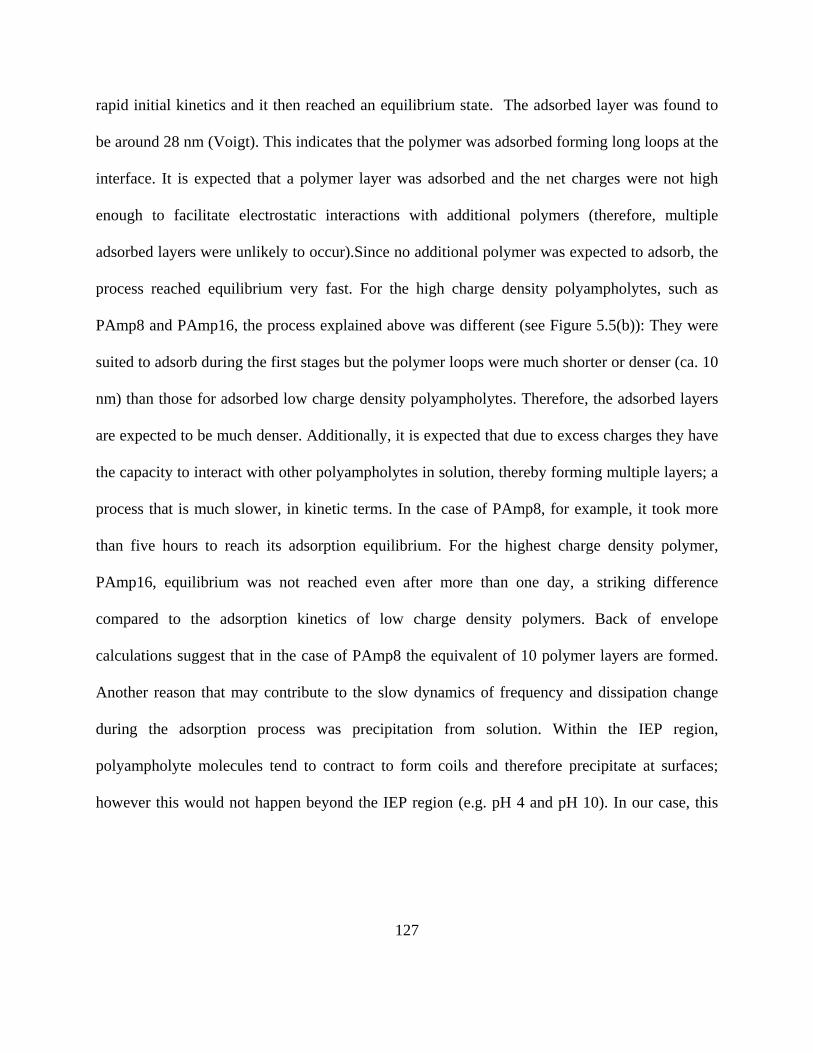
127
rapid initial kinetics and it then reached an equilibrium state. The adsorbed layer was found to
be around 28 nm (Voigt). This indicates that the polymer was adsorbed forming long loops at the
interface. It is expected that a polymer layer was adsorbed and the net charges were not high
enough to facilitate electrostatic interactions with additional polymers (therefore, multiple
adsorbed layers were unlikely to occur).Since no additional polymer was expected to adsorb, the
process reached equilibrium very fast. For the high charge density polyampholytes, such as
PAmp8 and PAmp16, the process explained above was different (see Figure 5.5(b)): They were
suited to adsorb during the first stages but the polymer loops were much shorter or denser (ca. 10
nm) than those for adsorbed low charge density polyampholytes. Therefore, the adsorbed layers
are expected to be much denser. Additionally, it is expected that due to excess charges they have
the capacity to interact with other polyampholytes in solution, thereby forming multiple layers; a
process that is much slower, in kinetic terms. In the case of PAmp8, for example, it took more
than five hours to reach its adsorption equilibrium. For the highest charge density polymer,
PAmp16, equilibrium was not reached even after more than one day, a striking difference
compared to the adsorption kinetics of low charge density polymers. Back of envelope
calculations suggest that in the case of PAmp8 the equivalent of 10 polymer layers are formed.
Another reason that may contribute to the slow dynamics of frequency and dissipation change
during the adsorption process was precipitation from solution. Within the IEP region,
polyampholyte molecules tend to contract to form coils and therefore precipitate at surfaces;
however this would not happen beyond the IEP region (e.g. pH 4 and pH 10). In our case, this
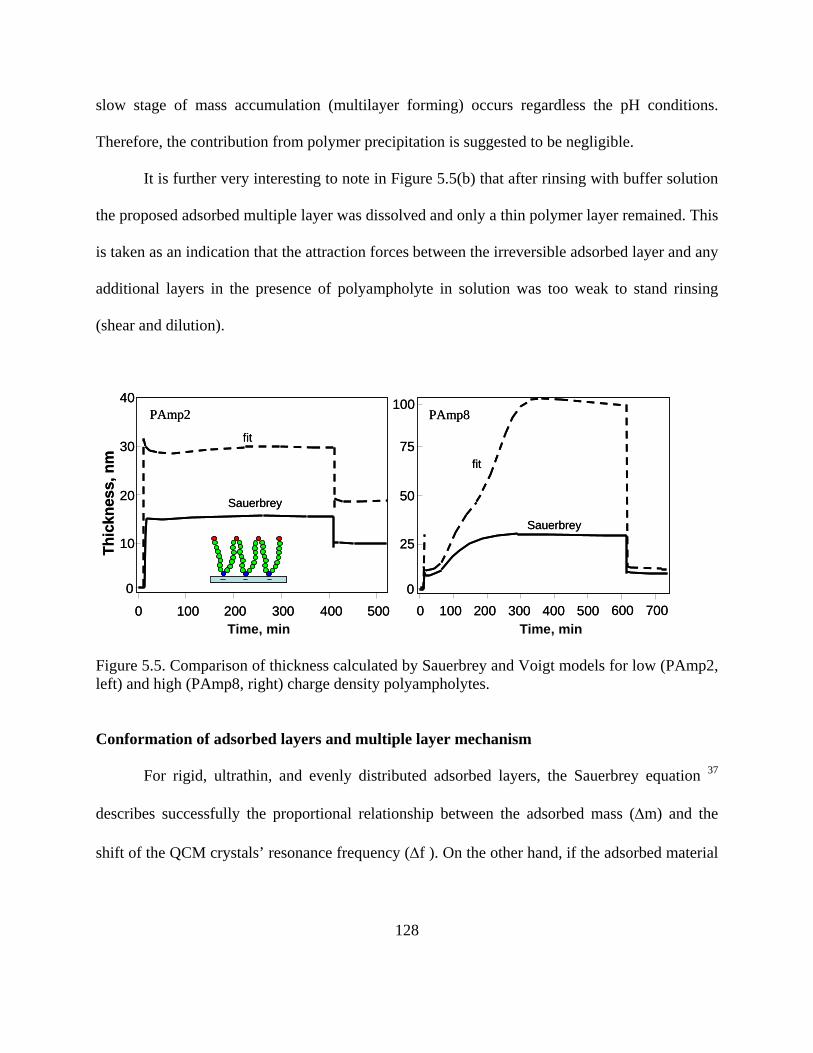
128
slow stage of mass accumulation (multilayer forming) occurs regardless the pH conditions.
Therefore, the contribution from polymer precipitation is suggested to be negligible.
It is further very interesting to note in Figure 5.5(b) that after rinsing with buffer solution
the proposed adsorbed multiple layer was dissolved and only a thin polymer layer remained. This
is taken as an indication that the attraction forces between the irreversible adsorbed layer and any
additional layers in the presence of polyampholyte in solution was too weak to stand rinsing
(shear and dilution).
PAmp2
Time, min
Thic
knes
s, n
m
40
0 100 200 300 400
0
10
20
30
500Time, min
Sauerbrey
fit
Sauerbrey
fit
100
0 100 200 300 4000
25
50
75
500 600 700
PAmp8PAmp2
Time, min
Thic
knes
s, n
m
40
0 100 200 300 400
0
10
20
30
500Time, min
Sauerbrey
fit
Sauerbrey
fit
100
0 100 200 300 4000
25
50
75
500 600 700
PAmp8
Figure 5.5. Comparison of thickness calculated by Sauerbrey and Voigt models for low (PAmp2, left) and high (PAmp8, right) charge density polyampholytes.
Conformation of adsorbed layers and multiple layer mechanism
For rigid, ultrathin, and evenly distributed adsorbed layers, the Sauerbrey equation 37
describes successfully the proportional relationship between the adsorbed mass (Δm) and the
shift of the QCM crystals’ resonance frequency (Δf ). On the other hand, if the adsorbed material
129
exhibits a viscoelastic behavior, such as for layers of proteins or DNA, substantial deviations
from the Sauerbrey equation can occur 33, 35, 38, 39. Our results fall in the latter category. If one
observes the dissipation value for polyampholytes, values as high as 200×10-6 were reached.
ΔD–Δf plots eliminate time as an explicit parameter and as concluded in previous studies 33, 35, 38,
39, the absolute slope and the changes in the slope in these plots provide information about the
kinetic regimes and conformational changes. Figure 5.6 shows the relation between dissipation
and frequency changes at pH 7 condition. It is noted that for the other conditions of adsorption at
pH 4 or 10, the ΔD–Δf plot exhibited similar trends and are not shown here for brevity. At the
beginning of adsorption, all polymers, including polyampholytes and polyelectrolytes, produced
a ΔD–Δf profile that resembles a straight line (see inset of Figure 5.6). The slope is indicator of
the conformation. An interesting phenomenon that was observed is that slope is in the order of
charge density. PAmp2 had the steepest slope and thus had the softest conformation while the
opposite applied to the case of PAmp16. The cationic polymer had similar slope to PAmp16, but
the anionic polymer was just a “point” in this D-f profile because it did not adsorb. As the
adsorbed mass increases, the changes in slopes differ for polyampholytes with low and high
charge density. For polyampholytes with low charge density, for example, PAmp2 and PAmp4,
as well as simple polyelectrolytes, the profile was a straight line and no change in slope was
observed. Polyampholytes with high charge density, for example, PAmp8 and PAmp16, showed
a change in slope (becoming steeper with increased f). This indicates that there was no major
conformation change for low charge density polyampholytes and simple polyelectrolytes, but
there was conformation change for high charge density polyampholytes. This observation agrees

130
with our earlier hypothesis that adsorption occurs as a single/simple layer for low charge density
polyampholytes and simple polyelectrolytes, but multilayer, more complex polymer adsorption
occurs for high charge density polyampholytes. Furthermore, the softness (viscoelasticity) of the
adsorbed film was expected to increase as the adsorbing polymers were farther from the solid
plane and probably with more loose segments and hydration water.
-300 -250 -200 -150 -100 -50 0
0
20
40
60
80
100
120
Ener
gy d
issi
patio
n, x
10-6
Frequency change, Hz
PAmp2PAmp4PAmp8PAmp16CatAn
-100 -75 -50 -25 00
5
10
15
20
Figure 5.6. ΔD-Δf profile during adsorption on silica of polyampholytes and polyelectrolytes.
Effect of Solution pH on polyampholyte adsorption
The QCM frequency measured at adsorption equilibrium for different pH conditions is
shown in Figure 5.7. If one takes a larger frequency as indication of a larger adsorbed amount it
is clear that in all cases the extent of adsorption for polyampholytes is consistently larger than for
those of simple polyelectrolytes. For the negatively charged polyelectrolyte, An, no adsorption is
observed. In the case of the polyampholytes, it is evident that as the charge density is increased, a

131
larger adsorption is measured. Changes in the pH of the polymer solution did not play a
distinctive role in terms of the extent of polyampholyte adsorption. Dobrynin and Rubinstein 40
demonstrated that polyampholytes was able to adsorb on both cationic and anionic surfaces,
since they had both charge groups. These authors demonstrated that the adsorbed polymers could
change conformation in solution to allow the opposite charge groups to interact more effectively
with the oppositely charged surfaces.

132
PAmp2 PAmp4 PAmp8 PAmp16 Cat An0
-50
-100
-150
-200
-250
-300
-350
Freq
uenc
y ch
ange
, Hz
pH4 pH7 pH10
Before rinsing
PAmp2 PAmp4 PAmp8 PAmp16 Cat An0
-50
-100
-150
-200
-250
-300
-350After rinsing
Freq
uenc
y ch
ange
, Hz
pH4 pH7 pH10
Figure 5.7. Frequency change for different polyelectrolytes after reaching adsorption equilibrium.
An interesting phenomenon can be observed after inspection of Figure 5.7: In this figure
it can be seen that the frequency change for adsorption at pH 4 and 10 was larger than that in pH

133
7. We attribute this observation to the fact that water couples to a larger extent with polymer at
the extreme pH values. At pH4 and pH10, which are far from the IEP of the polyampholytes, the
polymers tend to be extended, while at pH7, which is very close to their IEP, they trend to
contract into coils therefore preventing water molecules to couple, as extensively as in the other
cases, with the polymer segments. The polyampholytes’ conformation in solution (extension or
contract according to media pH conditions) can be related to the viscosity and hydrodynamic
radius results presented in Chapter 4.
pH 2 4 6 8 10 12
+ - - - - - -
+ + + + + +
- -- -- -
- -- -- -+ + +/- +/- -/+ -/+
Min adsorptionDoesn’t adsorbMin adsorption
Max adsorption Adsorb
Max adsorption
AdsorbsDoesn’t adsorb
Adsorption
Cat An
PAmp
Silica
CatAn
PAmp
pH 2 4 6 8 10 12
+ - - - - - -
+ + + + + +
- -- -- -
- -- -- -+ + +/- +/- -/+ -/+
Min adsorptionDoesn’t adsorbMin adsorption
Max adsorption Adsorb
Max adsorption
AdsorbsDoesn’t adsorb
Adsorption
Cat An
PAmp
Silica
CatAn
PAmp
Figure 5.8. Illustrative chart with the net charge of surfaces and polymers at different pH and indication of dominant electrostatic interactions between surfaces and polymers.
Figure 5.8 illustrates the electrostatic interaction between silica and the tested polymers.
The silica surface is negatively charged in the pH range from 4 to 10, while the simple cationic
and anionic polyelectrolytes are always positively and negatively charged, respectively. The
polyampholytes carry net positive charges between pH4 and the respective IEP while a net
negative charge is dominant between the respective IEP and pH10.

134
This model can be used to explain the extent of adsorption for the cationic and anionic
polymers. However, rationalization of the adsorption of polyampholytes is more challenging.
From this model, the polyampholytes carry zero or negative net charges at pH7 and pH10,
respectively; therefore it is expected that no or little polyampholyte adsorption occurs at around
these two pHs. This is in contrast with our experimental observations: There is a quite large
adsorption at these pHs. It is hypothesized that hydrogen bonding between the polymers and the
surfaces may contribute to some extent to this behavior. What is more evident, however, is that
the polarization effect in the case of charged surfaces is a dominant driving mechanism for
adsorption, as will be discussed in the next section.
Adsorption of polyampholytes on cellulose surface
Adsorption studies of polyampholytes onto cellulose surfaces were performed only in the
pH 7 condition. Figure 5.9(a) and (b) show the change in QCM frequency and dissipation with
adsorption time. The curves are quite different from those discussed before for silica surfaces.
First, the extent of adsorption was much lower on cellulose compared to the case of silica
surfaces. The second difference was that in the adsorption equilibrium state the dissipation
values were much higher. Inspection of the frequency curves revealed that reorganization or
maybe some desorption occurred in the case of polyampholytes PAmp8 and PAmp16. This
reorganization phenomenon of polymers also can see in Figure 5.10.
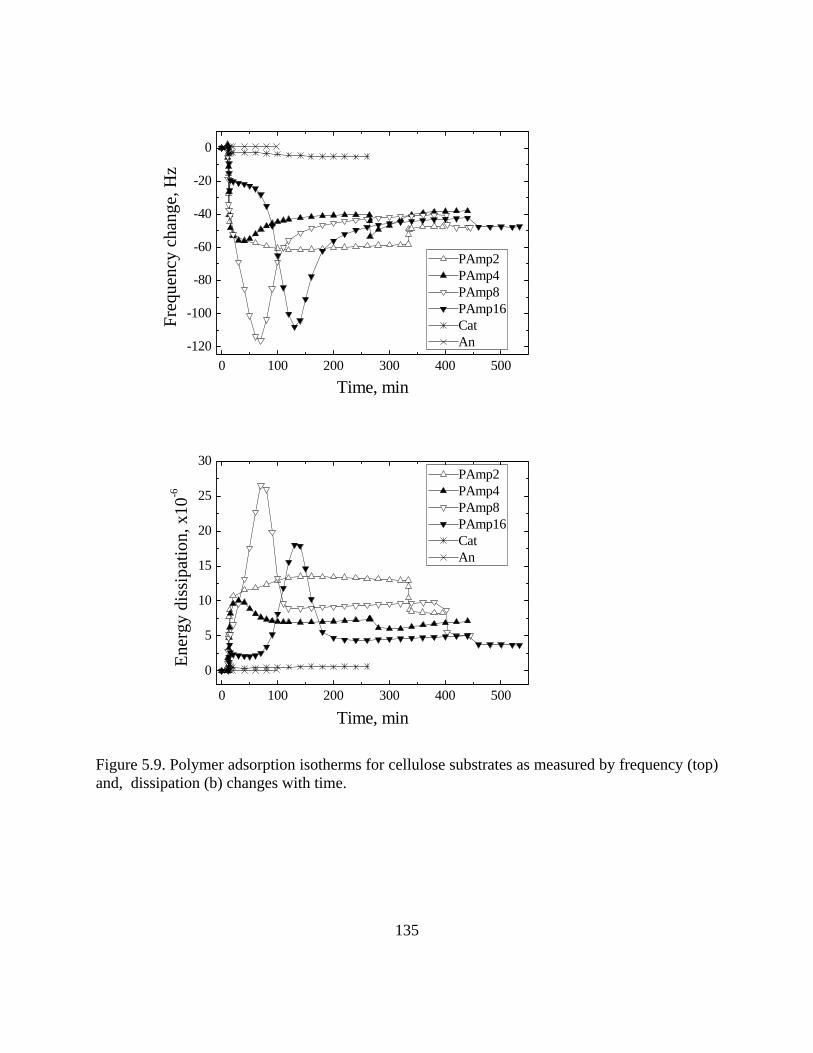
135
0 100 200 300 400 500-120
-100
-80
-60
-40
-20
0
Freq
uenc
y ch
ange
, Hz
Time, min
PAmp2PAmp4PAmp8PAmp16CatAn
0 100 200 300 400 500
0
5
10
15
20
25
30
Ener
gy d
issi
patio
n, x
10-6
Time, min
PAmp2PAmp4PAmp8PAmp16CatAn
Figure 5.9. Polymer adsorption isotherms for cellulose substrates as measured by frequency (top) and, dissipation (b) changes with time.

136
-120 -100 -80 -60 -40 -20 0
0
5
10
15
20
25En
ergy
dis
sipa
tion,
x10
-6
Frequency change, Hz
PAmp2PAmp4PAmp8PAmp16CatAn
Figure 5.10. ΔD-Δf profile during adsorption on celluylose of polyampholytes and polyelectrolytes.
Why does desorption occur in the case of cellulose surface but not onto silica surfaces?
Dobrynin, Rubinstein and Joanny have recently proposed a new adsorption mechanism that is
induced by the polarization of the chains in the electric field of the surface 40. In fact, one of the
most interesting features of polyampholytes is their polarizability in external electric fields. The
electric field pulls oppositely charged monomers in opposite directions, polarizing the chain.
However, the redistribution of the charged monomers inside the polymer coil is opposed by the
chain elasticity. As a result of these conflicting forces the polyampholyte chain is stretched into a
‘‘tug of war’’ configuration. It has recently been established that the polarization of
polyampholyte chains is responsible for adsorption of these polymers on charged surfaces,
resulting in formation of multiple protective polymer layers 11, 40-44. Even net neutral

137
polyampholytes with equal numbers of positively and negatively charged monomers are able to
adsorb on a charged surface due to a polarization-induced attractive interaction as long as the
surface charge is high enough 11.
Although cellulose surfaces also bear negative charges, its charge density is much lower
than that on the silica surfaces. According to Radtchenko et al. 45-47, the charge density of
cellulose in their case was 0.80 and 0.21 mC/m2 at pH 9.5 and pH 4, respectively. On the other
hand, the charge density of silica surface in aqueous medium was 20 and 100 mC/m2 at pH 4 and
8, respectively 47, 48. According to Dobrynin’s theory 40, adsorbed polyampholytes films on
cellulose would be of the a uniform multiple layer type, with stretched chains, while the
adsorption of polyampholytes on silica would be multiple layers with self-similar stretched
pseudo-brush in the inner layer and stretched chains in the outer layers. Our experimental data
agrees this theory very well.
CONCLUSIONS
The adsorption onto charged surfaces for four polyampholytes with charge density ratios
of 1:2:4:8 and two simple polyelectrolytes (anionic and cationic) were measured by using the
QCM-D technique. It was found that the charge properties of both substrates and polymers were
important in the adsorption mechanism (extent and confirmation). Adsorption in the case of high
charge density surfaces and high charge density polyampholyte is driven by polarization
mechanisms. Under this situation, the adsorbed polyampholytes tend to form multiple,
dissipative layers. The further the layer is away from the substrate, the softer and looser it is. For
surfaces of low charge density adsorbing low charge density polyampholytes, polarization is
138
unlikely to occur. Under this situation, simple, more compact layers are observed. Overall, the
results presented in this chapter allow a better understanding of polyampholyte adsorption and
reveals that the extension of adsorption and conformation of the adsorbed species is a result of a
subtle balance of factors (including charge properties of surfaces, charge density of
polyampholytes and pH of the aqueous medium).

139
REFERENCES
1. Dobrynin, A. V.; Colby, R. H.; Rubinstein, M., Polyampholytes. Journal of Polymer Science Part B-Polymer Physics 2004, 42, (19), 3513-3538. 2. Ertas, D.; Kantor, Y., Randomly charged polymers, random walks, and their extremal properties. Phys Rev E Phys Rev E 1996, 53, (1), 846-860. 3. Gutin, A. M.; Shakhnovich, E. I., Effect of a Net Charge on the Conformation of Polyampholytes. Phys Rev E Phys Rev E 1994, 50, (5), R3322-R3325. 4. Hwang, D. C.; Damodaran, S., Equilibrium swelling properties of a novel ethylenediaminetetraacetic dianhydride (EDTAD)-modified soy protein hydrogel. Journal of Applied Polymer Science 1996, 62, (8), 1285-1293. 5. Jeon, J.; Dobrynin, A. V., Molecular dynamics simulations of polyampholyte-polyelectrolyte complexes in solutions. Macromolecules 2005, 38, (12), 5300-5312. 6. Kantor, Y.; Kardar, M., Instabilities of Charged Polyampholytes. Phys Rev E Phys Rev E 1995, 51, (2), 1299-1312. 7. Lee, N.; Thirumalai, D., Dynamics of collapse of flexible polyampholytes. Journal of Chemical Physics 2000, 113, (13), 5126-5129. 8. Long, D.; Dobrynin, A. V.; Rubinstein, M.; Ajdari, A., Electrophoresis of polyampholytes. Journal of Chemical Physics 1998, 108, (3), 1234-1244. 9. Lord, M. S.; Stenzel, M. H.; Simmons, A.; Milthorpe, B. K., The effect of charged groups on protein interactions with poly(HEMA) hydrogels. Biomaterials 2006, 27, (4), 567-575. 10. Yamakov, V.; Milchev, A.; Limbach, H. J.; Dunweg, B.; Everaers, R., Conformations of random polyampholytes. Physical Review Letters 2000, 85, (20), 4305-4308. 11. Dobrynin, A. V., Polyampholyte adsorption on a charged sphere. Physical Review E 2001, 6305, (5). 12. Kabashima, S.; Ogura, E.; Maruyama, T.; Komatsu, M., Surface modification of glass by polyampholyte: Application to anti-fogging. Abstracts of Papers of the American Chemical Society 2004, 228, U352-U352.

140
13. Gao, H.-x.; Lu, X.-z.; Qi, Y.-q.; Cheng, S.-j., Application of polyampholyte in high turbidity water of Huanghe River. Huaxue Gongye Yu Gongcheng (Tianjin, China) 2003, 20, (3), 125-129. 14. Aubay, E.; Blokzijl, W.; Geffroy, C.; Mahmood, K.; Thompson, L. G.; Walsh, J. M.; Wong, K.; Yeung, D. Preparation of polyampholytes for laundry applications. 2001-EP409 2001057171, 20010115., 2001. 15. Wang, Z.; Hu, X., Water-soluble cationic polyelectrolytes and polyampholytes and their applications. Gaofenzi Cailiao Kexue Yu Gongcheng 1994, 10, (4), 8-16. 16. Ozon, F.; di Meglio, J. M.; Joanny, J. F., Adsorption of polyampholytes on charged surfaces. European Physical Journal E 2002, 8, (3), 321-330. 17. Sezaki, T.; Hubbe, M. A.; Heitmann, J. A.; Argyropoulos, D. S.; Wang, X., Colloidal effects of acrylamide polyampholytes. Colloids and Surfaces, A: Physicochemical and Engineering Aspects 2006, 281, (1-3), 74-81. 18. Kantor, Y.; Kardar, M.; Li, H., Statistical-Mechanics of Polyampholytes. Phys Rev E Phys Rev E 1994, 49, (2), 1383-1392. 19. Bratko, D.; Chakraborty, A. K., A numerical study of polyampholyte configuration. Journal of Physical Chemistry 1996, 100, (4), 1164-1173. 20. Schiessel, H.; Blumen, A., Conformations of freely jointed polyampholytes in external fields. Journal of Chemical Physics 1996, 104, (15), 6036-6040. 21. Srivastava, D.; Muthukumar, M., Sequence dependence of conformations of polyampholytes. Macromolecules 1996, 29, (6), 2324-2326. 22. Tran, Y.; Perrin, P.; Deroo, S.; Lafuma, F., Adsorption of randomly annealed polyampholytes at the silica-water interface. Langmuir 2006, 22, (18), 7543-7551. 23. Huguenard, C.; Varoqui, R.; Pefferkorn, E., Kinetics of Block Copolymer Adsorption. Macromolecules 1991, 24, (9), 2226-2230. 24. Billingham, J.; Breen, C.; Yarwood, J., Adsorption of polyamine, polyacrylic acid and polyethylene glycol on montmorillonite: An in situ study using ATR-FTIR. Vibrational Spectroscopy 1997, 14, (1), 19-34. 25. Zalczer, G.; Gurfein, V., Adsorption of polymers at the free surface of a good solvent: a spectroscopic ellipsometry study. Macromolecules 1992, 25, (10), 2634-6.

141
26. Besio, G. J. Polymer adsorption studied by ellipsometry. 1986. 27. Durbruel, P.; Urtti, A.; Schacht, E., Surface plasmon resonance spectroscopy as a tool to study polyplex-glycoaminoglycan interactions. Macromolecular Rapid Communications 2005, 26, (12), 992-997. 28. Toyama, S.; Aoki, K.; Kato, S., SPR observation of adsorption and desorption of water-soluble polymers on an Au surface. Chemical Sensors 2004, 20, (Suppl. B), 542-543. 29. Toyama, S.; Aoki, K., SPR analyses of adsorbed charged-polymers. Chemical Sensors 2003, 19, (Suppl. B), 46-48. 30. Sarkar, D.; Somasundaran, P., Dynamics of adsorption of polymers with different loop size and their unfolding with surfactants studied using surface plasmon resonance spectroscopy. Abstracts of Papers, 225th ACS National Meeting, New Orleans, LA, United States, March 23-27, 2003 2003, COLL-176. 31. Green, R. J.; Davies, J.; Davies, M. C.; Roberts, C. J.; Tendler, S. J. B., Surface plasmon resonance for real time in situ analysis of protein adsorption to polymer surfaces. Biomaterials 1997, 18, (5), 405-413. 32. Green, R. J.; Davies, J.; Davies, M. C.; Roberts, C. J.; Tendler, S. J., Surface plasmon resonance for real time in situ analysis of protein adsorption to polymer surfaces. Biomaterials 1997, 18, (5), 405-13. 33. Edvardsson, M.; Rodahl, M.; Kasemo, B.; Hook, F., A dual-frequency QCM-D setup operating at elevated oscillation amplitudes. Analytical Chemistry 2005, 77, (15), 4918-4926. 34. Marx, K. A.; Zhou, T.; Sarma, R., Quartz crystal microbalance measurement of self-assembled micellar tubules of the amphiphilic decyl ester of D-tyrosine and their enzymatic polymerization. Biotechnology Progress 1999, 15, (3), 522-528. 35. Rodahl, M.; Kasemo, B., Frequency and dissipation-factor responses to localized liquid deposits on a QCM electrode. Sensors and Actuators B-Chemical 1996, 37, (1-2), 111-116. 36. Rodahl, M.; Kasemo, B., On the measurement of thin liquid overlayers with the quartz-crystal microbalance. Sensors and Actuators a-Physical 1996, 54, (1-3), 448-456. 37. Sauerbrey, G., VERWENDUNG VON SCHWINGQUARZEN ZUR WAGUNG DUNNER SCHICHTEN UND ZUR MIKROWAGUNG. Zeitschrift Fur Physik 1959, 155, (2), 206-222.

142
38. Hook, F.; Kasemo, B.; Nylander, T.; Fant, C.; Sott, K.; Elwing, H., Variations in coupled water, viscoelastic properties, and film thickness of a Mefp-1 protein film during adsorption and cross-linking: A quartz crystal microbalance with dissipation monitoring, ellipsometry, and surface plasmon resonance study. Analytical Chemistry 2001, 73, (24), 5796-5804. 39. Su, X. D.; Zong, Y.; Richter, R.; Knoll, W., Enzyme immobilization on poly (ethylene-co-acrylic acid) films studied by quartz crystal microbalance with dissipation monitoring. Journal of Colloid and Interface Science 2005, 287, (1), 35-42. 40. Dobrynin, A. V.; Rubinstein, M.; Joanny, J. F., Adsorption of a polyampholyte chain on a charged surface. Macromolecules 1997, 30, (15), 4332-4341. 41. Dobrynin, A. V.; Obukhov, S. P.; Rubinstein, M., Long-range multichain adsorption of polyampholytes on a charged surface. Macromolecules 1999, 32, (17), 5689-5700. 42. Dobrynin, A. V.; Zhulina, E. B.; Rubinstein, M., Structure of adsorbed polyampholyte layers at charged objects. Macromolecules 2001, 34, (3), 627-639. 43. Zhulina, E. B.; Dobrynin, A. V.; Rubinstein, M., Adsorption isotherms of polyampholytes at charged spherical particles. Journal of Physical Chemistry B 2001, 105, (37), 8917-8930. 44. Zhulina, E.; Dobrynin, A. V.; Rubinstein, M., Adsorption of a polyampholyte on a charged spherical particle. European Physical Journal E 2001, 5, (1), 41-49. 45. Poptoshev, E.; Claesson, P. M., Forces between glass surfaces in aqueous polyethylenimine solutions. Langmuir 2002, 18, (7), 2590-2594. 46. Poptoshev, E.; Claesson, P. M., Weakly charged polyelectrolyte adsorption to glass and cellulose studied by surface force technique. Langmuir 2002, 18, (4), 1184-1189. 47. Radtchenko, I. L. P., Georg; Borkovec, Michal, Direct Force Measurements between Cellulose Surfaces and Colloidal Silica Particles. Biomacromolecules 2005, 6, (6), 3057-3066. 48. Rodrigues, F. A. M., Paulo J. M.; Sposito, Garrison, Surface Charge Density of Silica Suspended in Water-Acetone Mixtures. Journal of Colloid and Interface Science 1999, 211, (2), 408-409.

143
Chapter 6
Adsorption of Lubricants on PET Surfaces
144
ABSTRACT:
The adsorption on polyester (PET) surfaces of nonionic polymer surfactants (poly
alkyl glycols and pluronics with different structures) was studied by using the QCM and
SPR techniques. The results indicate that the chain length of the hydrophobic group of the
nonionic polymers strongly correlates with the polymer affinity to the surface. The
polymer molecular weight also has a strong influence on the maximum adsorption
density. Finally, it can be concluded that hydrophobic and van der Waals interactions are
the predominant driving mechanism in the adsorption of nonionic polymers on PET
surfaces.
145
INTRODUCTION
Lubrication is an important phenomenon that takes place when substances such as
greases or oils (so called lubricants) are applied to moving objects to reduce friction. In paper
and textile processing, fibers go through many different unit operations and stages under high
shear forces. Moving machinery and equipment are heavily involved in paper and textile
processing where demands for faster production rates are ever present. Therefore, better
performance lubricants are to be applied to reduce friction and wear under extreme conditions. It
can be concluded that lubrication is an extremely important phenomenon, especially in textile
processing as it is critical to improve production and efficiency.
A typical lubricant film is very thin, usually several hundreds of molecules thick for
thicknesses of about 100 nm or lower 1, 2. Therefore, understanding the structure of lubricant thin
film and the way the molecular components organize a the interface 3 during the lubrication
process is of utmost importance 4.
Nonionic polymers are commonly used in textile finishes as a component of the
formulation to work as lubricants and to facilitate the processing of synthetic fibers in various
operations. In this chapter, the influence of the nature of nonionic polymers (including structure,
molecular weigh, HLB and hydrophobic segments’ length) on the resultant adsorption behaviors
will be discussed. The ultimate goal of this investigation is to find structure-property relations
applicable to nonionic polymers and thus set the heuristic rules that will eventually help to
optimize finish performance by the design of new lubricants.

146
Quartz Crystal Microbalance with Dissipation (QCM-D) was used to study the
interaction between a series of nonionic lubricants and the cellulose and synthetic surfaces.
QCM-D allowed the study of interfacial behaviors (including adsorption and desorption) in situ,
in real time at the nano scale. It provided information on the adsorbed mass (from vibration
frequency changes) and also energy dissipation (which is related to the conformation of the
adsorbed species). Surface Plasmon Resonance (SPR) was also employed to study the adsorption
of nonionic polymers on the model textile surface and to verify the determinations made with the
QCM-D. In order to facilitate this study , gold QCM sensors were modified with ultrathin, flat
films of nylon, polypropylene (PP), polyester (PET) and cellulose polymers, as surrogates of
textile fibers. These films were obtained by spin coating polymer solutions, as was explained in
previous chapters. However, in the present chapter, only the adsorption of nonionic lubricants
onto PET surfaces is addressed. A discussion on the influence of the substrate on the adsorption
of nonionic polymers is described in detail in a following chapter.
EXPERIMENTAL
All experiments were performed with deionized water from an ion-exchange system
(Pureflow, Inc.) which was further processed in a Milli-Q® Gradient unit to ensure ultrapure
water with resistivity greater than18MΩ.
The substrates used in this investigation were circular Q-Sense gold sensors (Q-sensor Co,
diameter is 12 mm) and square (Rechaint Co, 12 ×12 mm) wafers suitable for QCM and SPR
experiments, respectively.

147
The nonionic lubricants used in this investigation included two sets of polymers with
known structures: polyalkylene glycols (PAGs) from Dow Chemical Co. (Midland, MI), and
triblock copolymers based on ethylene oxide and propylene oxide (Pluronic) from BASF
Corporation (Florham Park, NJ). Generic chemical structures of PAGs and Pluronics are shown
in Figure 6.1.
RO-[CH2CHO]n[CH2CH2O]m-H
CH3
RO-[CH2CHO]n[CH2CH2O]m-H
CH3
RO-[CH2CHO]n[CH2CH2O]m-H
CH3
RO-[CH2CHO]n[CH2CH2O]m-H
CH3
H-[CH2CH2O]m-[CH2CHO]n[CH2CH2O]m-H
CH3
H-[CH2CH2O]m-[CH2CHO]n[CH2CH2O]m-H
CH3
H-[CH2CH2O]m-[CH2CHO]n[CH2CH2O]m-H
CH3
H-[CH2CH2O]m-[CH2CHO]n[CH2CH2O]m-H
CH3
Figure 6.1. Chemical structure of polyalkylene glycols (PAGs) (left) and Pluronics (right). Table 6.1. Structural information of polyalkylene glycols (PAGs) and Pluronics Symbol used in this thesis
Commercial name MW n (PO) m (EO) HLB
RP10E13 UCON 50-HB-400 1,230 10 13 11.92 RP13E17 UCON 50-HB-660 1,590 13 17 12.0 RP33E44 UCON 50-HB-5100 3,930 33 44 8.51 E19P29E19 Pluronic P65 3,400 29 19 21.67 E76P29E76 Pluronic F68 8,400 29 76 27.97 E37P56E37 Pluronic P105 6,500 56 37 17.34 * UCON polymers are from Dow Co. and Pluronic polymers are from BASF Co. * HLB values were calculated by the method described by Guo et al. 5 * R, P and E stand for butyl, r propylene oxide and ethylene oxide groups, respectively.
PAGs and Pluronic lubricants with different structural parameters m and n (see Figure 6.1)
used in this study are listed in Table 6.1. It is worth noting that the supplied samples not only had
different monomer composition but also different molecular weights. The lack of a systematic
variation in the molecular parameters was a limitation in our efforts; nevertheless, these
polymers are comparatively purer and better defined than commercial nonionic mixtures
commonly used in industry. Therefore they enabled us to understand better how polymer

148
structure and molecular weight affects the assembly of boundary layers (and thus influence
lubrication and friction phenomena, to be discussed in later chapters).
Methods
Preparation of model films
All substrates (gold sensors and wafers) were cleaned with Piranha solution (70%
H2SO4+30% H2O2 (30%)) for one hour and then subjected to Ultra-violet Ozone (UVO) radiation
for 10 minutes immediately before spin-coating with PET solutions.
Polyester poly(ethylene terephthalate) (PET) is a thermoplastic polymer resin of the
polyester family which is widely used in synthetic fibers; beverage, food and other liquid
containers. PET is resistant to acid, base and most solvents and for the same reason it is not
surprising that little or no report was available about PET dissolution in the manufacture of spin
coated films. However, given the fact that hexafluoroisopropanol, (HFIP) was found to be an
excellent solvent for nylon 6, even at room temperature, we developed a method to manufacture
ultrathin films of PET from same (HFIP) solution. After experimental optimization, we found
that proper amounts of PET and HFIP can form thin films (ca. 40 nm) by dissolving in small
vials (3 h minimum dissolution time) and then by applying the solution (0.16 %) onto the gold
substrate and spinning at 3000 rpm for 30 seconds. Detailed procedures and obtained PET film
characterization can be found in Chapter 3.
QCM-D technique
A QCM-E4 (Q-sense Inc.) was used in this investigation to measure the adsorption of the
nonionic polymers on PET films. The principle of the QCM technique involves the monitoring

149
of the resonant frequency (f) of a gold-coated piezoelectric material (quartz crystal) which
depends on the total oscillating mass 7-9. If the film is thin and rigid, the decrease in frequency is
proportional to the mass of the film, as stated by Saurerbrey equation 10:
c fmnΔ
Δ = − (Equation 6.1)
where C = 17.7 ng Hz-1 cm-2 for a 5 MHz quartz crystal.
n = 1,3,5,7 is the overtone number.
Since frequency can be detected very accurately, the QCM operates as a very sensitive
balance. Since the density of the given polymer film are easy to finding respective databases, the
thickness can be obtained. In our investigation, only the third overtone frequency was measured
before and after spin coating. The resonant frequency for the film in dry condition was obtained
in air at constant temperature of 25 ºC.
Surface Plasma Resonance (SPR)
A Reichert SR7000 Surface Plasmon Resonance Refractometer was used to conduct
complementary adsorption studies of the nonionic lubricants on PET films. The resolution of
SPR is about 10 ng/cm2, comparable to that of the QCM. By conducting the experiments under
the same set of conditions as those used in QCM experiments (lubricant concentration,
temperature, flow rate, etc.) more meaningful conclusions can be reached regarding the
adsorption behaviors. The use of two different physical principles (electromechanical and optical
for QCM and SPR, respectively) allows us to obtain more information about adsorption,
specially the role of coupled water.

150
Contact angle measurement
The contact angle of untreated and polymer-coated PET surfaces against pure water was
measured on a manual Rame-Hart goniometer. After 1 min of placing a droplet of Mini-Q water
(10 µL) onto the surface the outline of the droplet was detected with an optical magnifier. The
tangent line on the droplet in the three-phase zone was traced with a protractor within the optics
and therefore provided a measurement of the contact angle.
RESULTS AND DISCUSSION
Adsorption of Nonionic Lubricant Polymers
Adsorption experiments were conducted with the QCM-D as described above. Typical
QCM profiles as a function of adsorption time are shown in Figure 6.2. This is an example of
how the raw data is collected in a given experiment. Note that frequency and dissipation values
of three overtones are recorded simultaneously and can be plotted in a single chart. Since the
third overtone vibration reaches a larger area in the sensor (as compared to the other two
overtones), we used the frequency and dissipation changes from the third overtone, unless
specified otherwise.. The lubricant used in Figure 6.2 was E76P29E76 at a concentration of
0.0001%. Before any experiment, water was injected in the QCM’s sample loop continuously
until a stable (frequency and dissipation) baseline was obtained. Then nonionic (lubricant)
polymer of given concentration was injected in the loop. As a result of the introduction of the
polymer solution in the QCM chamber a sharp drop in frequency and increase in dissipation

151
were observed, as seen in Figure 6.2. These changes are indicative of the adsorption of the
lubricant on the sensor surface.
The adsorption of nonionic lubricants was found to be a very fast process, as required in
demanding actual applications. Around 10 minutes after injection, both adsorption and
dissipation curves reached a plateau. The experiment showed in Figure 6.2 was run for another
10 minutes to ensure that an equilibrium state was achieved. Thereafter, pure water was injected
to rinse the system. As a result, a sharp increase in frequency and a sharp drop in dissipation
were observed. These changes are indicative of the fact that loosely bound lubricant molecules as
well as molecules in the bulk were removed by this rinsing step. After ca. 10 minutes, the second
equilibrium state was observed with higher frequency and lower dissipation as compared with
the initial values. Based on these observations, the adsorption mass on the sensor surface was
divided into two categories: Total or reversible (first plateau) and irreversible (second plateau)
adsorbed mass.
From the changes in dissipation it can be concluded that the adsorbed film was very thin
and “rigid” (the difference of dissipation with and without lubricant film was no more than 1*10-
6 dissipation units). Note that the flow rate for fluid (with or without polymer sample) was
always kept constant at 0.1 ml/min as produced with a peristaltic (QCM) or syringe pump (SPR).
Five polymer lubricant concentrations (ranging from 0.0001% to 1%) were run in all the
adsorption experiments by QCM for at least three repetitions. The equilibrium adsorption mass
before (total adsorption) and after rinsing (irreversible adsorption) was recorded as a function of

152
concentration, as can be seen in Figures 6-3(a) and 6-3(b), respectively. In these curves each data
point was drafted from triplicate runs as those illustrated in Figure 6.2. The lubricant adsorbed
amount was calculated from the frequency change by using the Sauerbrey equation. The total
adsorption, i.e, adsorption before rinsing, changed roughly linearly with lubricant concentration.
A clear trend is observed in the case of the lubricants with lower molecular weights which
adsorbed less extensively. Similar observations apply to the irreversible adsorption. Furthermore,
it is noted that the irreversible adsorption tend to reach a saturation at the highest concentrations
used.
0 500 1000 1500 2000 2500 3000 3500-6
-5
-4
-3
-2
-1
0
Dis
sipa
tion
Val
ue (x
10-6)
Freq
uenc
y ch
ange
(Hz)
Aquired time (seconds)
F3/3
F5/5
F7/7
D7
D5
D3
-0.2
0.0
0.2
0.4
0.6
0.8
1.0
Figure 6.2. Typical QCM f and D curves for an adsorbing nonionic polymer. Polymer sample was E76P29E76 in 0.0001% aqueous solution. Frequency (f) change (left axis) and dissipation (D) change (right axis) for three overtones (3, 5, 7) were recorded simultaneously. Flow rate was constant 0.1 ml/min.

153
All samples also were studied by SPR experiments. Similar trends could be observed, as
illustrated in Figure 6.4(a) and 6-4(b). One significant difference between the data acquired from
QCM and SPR is that the calculated adsorbed mass determined from SPR was only around half
of that calculated from QCM. This difference is explained by the different principles applied in
both techniques and also by the presence of hydration water associated with ethylene oxide (EO)
groups and coupled water in the adsorbed layer (QCM is sensitive to coupled water). It is
expected that under boundary lubrication regimes, these bound water molecules contribute
positively to lubrication.

154
1E-4 1E-3 0.01 0.1 1
0100200300400500600700800900
1000
Ads
orbe
d m
ass Γ,
ng/
cm2
Nonionic polymer concentration, % (w/v)
RP10E13 RP13E17 RP33E44 E19P29E19 E76P29E76 E37P56E37
1E-4 1E-3 0.01 0.1 1
0
100
200
300
400
500
600
Ads
orbe
d m
ass Γ,
ng/
cm2
Nonionic polymer concentration, % (w/v)
RP10E13 RP13E17 RP33E44 E19P29E19 E76P29E76 E37P56E37
Figure 6.3. Equilibrium adsorption isotherms for nonionic lubricants adsorbed on PET surfaces at 25 °C before (a) and after (b) rinsing measured by QCM. The flow rate was constant at 0.1 ml/min.
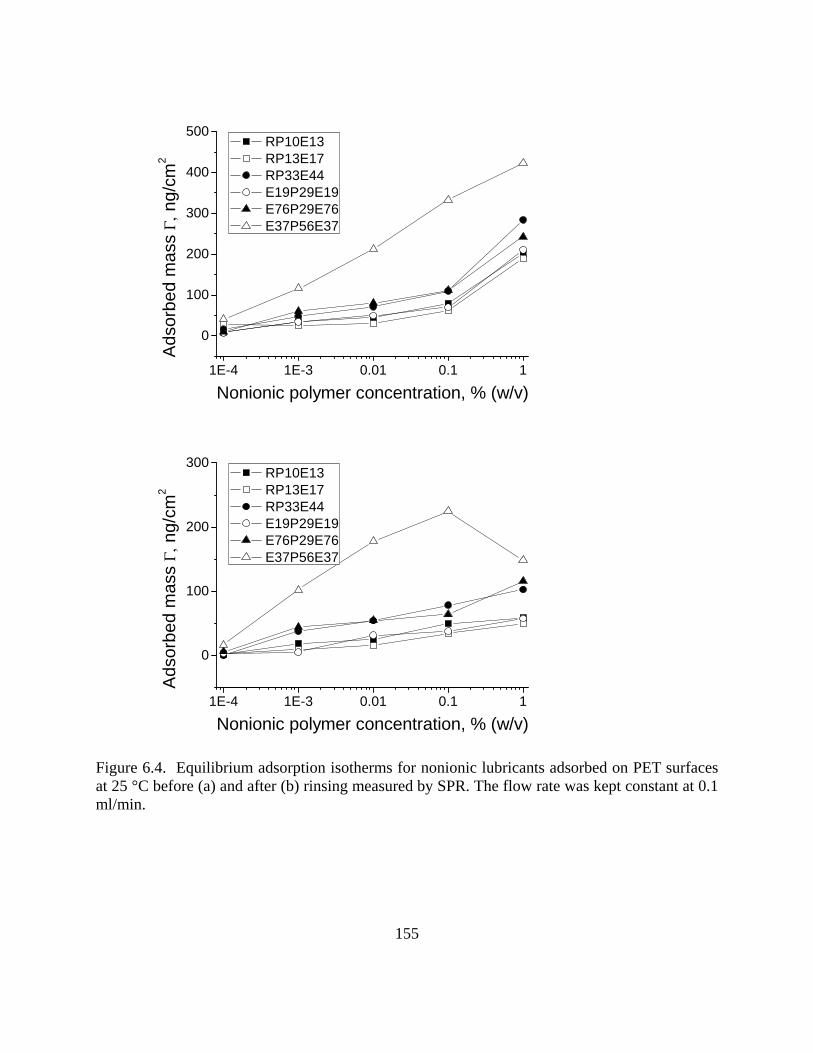
155
1E-4 1E-3 0.01 0.1 1
0
100
200
300
400
500
Ads
orbe
d m
ass Γ,
ng/
cm2
Nonionic polymer concentration, % (w/v)
RP10E13 RP13E17 RP33E44 E19P29E19 E76P29E76 E37P56E37
1E-4 1E-3 0.01 0.1 1
0
100
200
300
Ads
orbe
d m
ass Γ,
ng/
cm2
Nonionic polymer concentration, % (w/v)
RP10E13 RP13E17 RP33E44 E19P29E19 E76P29E76 E37P56E37
Figure 6.4. Equilibrium adsorption isotherms for nonionic lubricants adsorbed on PET surfaces at 25 °C before (a) and after (b) rinsing measured by SPR. The flow rate was kept constant at 0.1 ml/min.
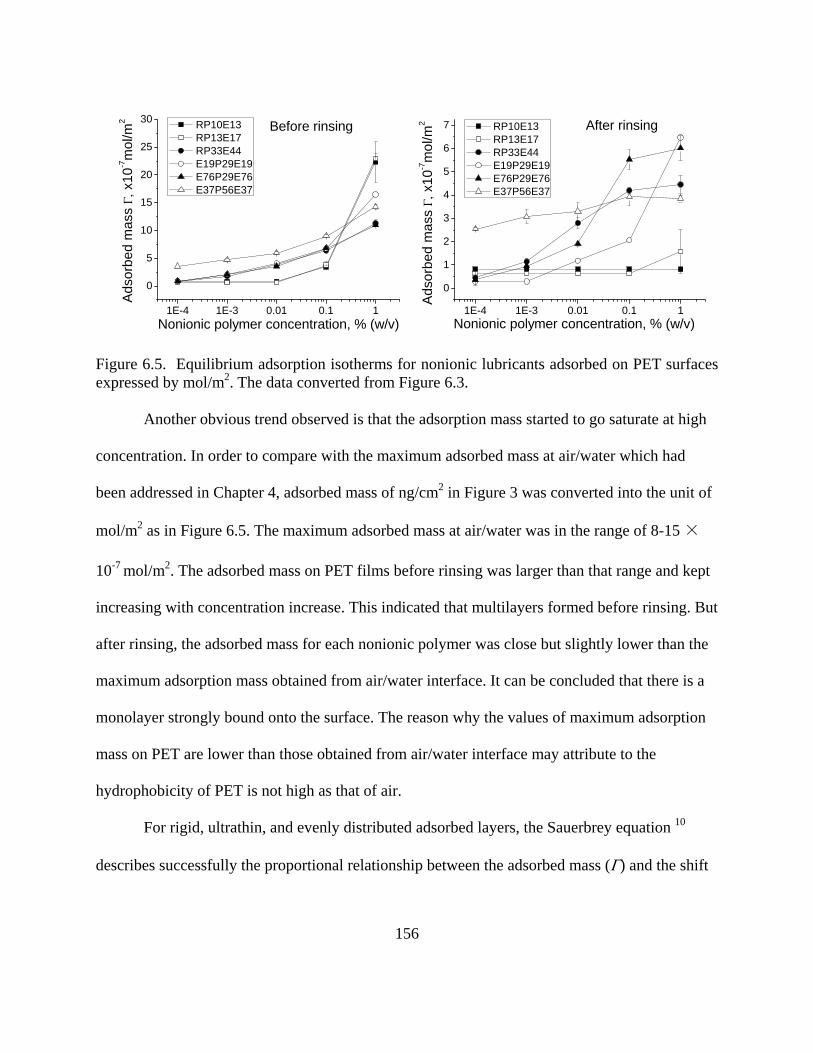
156
1E-4 1E-3 0.01 0.1 1
0
5
10
15
20
25
30
1E-4 1E-3 0.01 0.1 1
0
1
2
3
4
5
6
7
Ads
orbe
d m
ass Γ,
x10
-7m
ol/m
2
Nonionic polymer concentration, % (w/v)
After rinsingA
dsor
bed
mas
s Γ,
x10
-7m
ol/m
2
Nonionic polymer concentration, % (w/v)
RP10E13 RP13E17 RP33E44 E19P29E19 E76P29E76 E37P56E37
Before rinsing RP10E13 RP13E17 RP33E44 E19P29E19 E76P29E76 E37P56E37
Figure 6.5. Equilibrium adsorption isotherms for nonionic lubricants adsorbed on PET surfaces expressed by mol/m2. The data converted from Figure 6.3. Another obvious trend observed is that the adsorption mass started to go saturate at high
concentration. In order to compare with the maximum adsorbed mass at air/water which had
been addressed in Chapter 4, adsorbed mass of ng/cm2 in Figure 3 was converted into the unit of
mol/m2 as in Figure 6.5. The maximum adsorbed mass at air/water was in the range of 8-15 ×
10-7 mol/m2. The adsorbed mass on PET films before rinsing was larger than that range and kept
increasing with concentration increase. This indicated that multilayers formed before rinsing. But
after rinsing, the adsorbed mass for each nonionic polymer was close but slightly lower than the
maximum adsorption mass obtained from air/water interface. It can be concluded that there is a
monolayer strongly bound onto the surface. The reason why the values of maximum adsorption
mass on PET are lower than those obtained from air/water interface may attribute to the
hydrophobicity of PET is not high as that of air.
For rigid, ultrathin, and evenly distributed adsorbed layers, the Sauerbrey equation 10
describes successfully the proportional relationship between the adsorbed mass (Γ) and the shift

157
of the QCM crystals’ resonance frequency (Δf). On the other hand, if the adsorbed material
exhibits a viscoelastic behavior, (a condition that applies to many polymer and protein
adsorption), substantial deviations from the Sauerbrey equation can occur. The ΔD–Δf plots
eliminate time as an explicit parameter and as concluded in previous studies, the absolute slope
and the changes in the slope in these plots provide information about the kinetic regimes and
conformational changes 11. For the data we obtained from QCM, dissipation value ΔD was
plotted against frequency change Δf in Figure 6.5 for diblock and triblock polymers. The curves
for RP10E13 and RP13E17 overlap and exhibit a steep slope. This means that for these two
polymers with lowest molecular weight, the adsorbed film was very soft. Loops are seen in each
curve, these loops are the result of the rinsing effect. For other polymers, two slopes are observed
in the respective profiles. The first slope is flat while the second one is a steep one. Our
explanation for this distinctive behavior is that the lubricant molecules first adsorb onto the
surface as a compact layer (flat slope). As more molecules diffuse to the interface, multiple
layers can be formed (steep slope with large dissipation). Since the binding between the multiple
layers is expected to be weak compared with the molecules in the close vicinity to the surface,
they can be easily removed by rinsing (loops). Furthermore, it is also observed that the
conformation of the adsorbed layer for high molecular weight polymers is more compact than in
the cases described before.
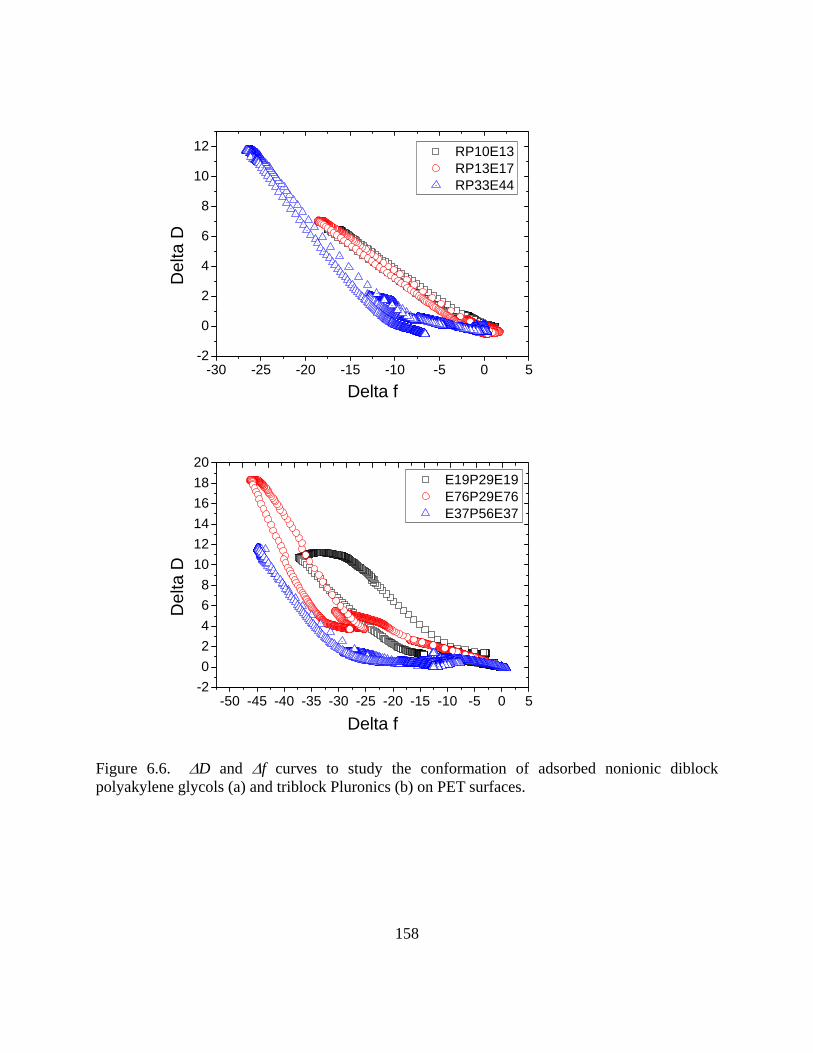
158
-30 -25 -20 -15 -10 -5 0 5-2
0
2
4
6
8
10
12 RP10E13 RP13E17 RP33E44
Del
ta D
Delta f
-50 -45 -40 -35 -30 -25 -20 -15 -10 -5 0 5-202468
101214161820
E19P29E19 E76P29E76 E37P56E37
Del
ta D
Delta f
Figure 6.6. ΔD and Δf curves to study the conformation of adsorbed nonionic diblock polyakylene glycols (a) and triblock Pluronics (b) on PET surfaces.
159
Effect of Lubricant Type on Adsorption
In order to reveal the underlying phenomena involved in lubricant-surface interactions,
we fitted the adsorption data to the Brunauer-Emmett-Teller (BET) and the Langmuir 12
isotherms . It is concluded that in all cases the adsorbed mass can be accurately described with a
Langmuir-type isotherm (see values of R-squared close to 1 in Table 6.2). On the other hand the
BET equation failed to describe the experimental data (see low values of R-squared in Table 6.3).
All the fitting work was conducted by freeware Isofit V1.2 (Free Software Foundation, Inc.
Boston, MA) by minimizing the weighted sum of squared error between experimental data and
corresponding isotherm-computed values. The Langmuir adsorption isotherm assumes a
monomolecular adsorption layer with a maximum number of equivalent binding sites, each of
which can be occupied by one molecule. The adsorbed mass Г is assumed to be a function of the
adsorbate concentration, C; maximum adsorption density, Q0 and the affinity between lubricant
and surface, b (see Equation 6.2):
0( , )1
ii
i
Q bCX CbC
Γ =+
(Equation 6.2)
The fitted parameters of the Langmuir equation for all adsorbed curves after rinsing are
listed in Table 6.2.

160
Table 6. 2. Langmuir fitting parameters for adsorption curves of nonionic lubricants on PET surface after rinsing (irreversible adsorption).
Lubricant bQ0 b Q0 R-squared RP10E13 3.08E+03 3.52E+01 8.75E+01 0.967 RP13E17 5.74E+03 3.22E+01 1.78E+02 0.93 RP33E44 2.21E+04 1.00E+02 2.21E+02 0.98
E19P29E19 1.11E+04 1.00E+02 1.11E+02 0.967 E76P29E76 1.70E+04 6.67E+01 2.55E+02 0.975 E37P56E37 4.11E+04 1.00E+02 4.11E+02 0.919
Table 6.3. BET fitting parameters for adsorption curves of nonionic lubricants on PET surface after rinsing (irreversible adsorption).
Lubricant bQ0 b Q0 R-squared RP10E13 2.28E+03 1.00E+02 2.28E+01 0.713 RP13E17 5.15E+03 1.00E+02 5.15E+01 0.984 RP33E44 3.95E+04 1.00E+02 3.95E+02 0.477
E19P29E19 4.45E+04 1.00E+02 4.45E+02 0.979 E76P29E76 1.13E+05 1.00E+02 1.13E+03 0.59 E37P56E37 2.69E+04 1.29E-03 2.09E+07 0.319
In Figure 6.7, the maximum adsorption density, Q0 and affinity between lubricant and
surface, b are plotted for the various lubricants. Lubricant RP10E13 showed the lowest
maximum adsorption density, while E37P56E37 produced the highest. Regarding the affinity
between the nonionic polymers and the PET surface, RP10E13 and RP13E17 showed the lowest
b values while R33E44, E19P29E19 and E37P56E37 have the highest ones.

161
..
0100200300400500600
020406080
100
Q0
E37P56E37
E76P29E76
E19P29E19
RP33E44
RP13E17
b
RP10E13
Figure 6.7. Fitted Langmuir parameters b and Q0 as a function of the lubricant type.
Since it is difficult to draw meaningful conclusions based on the obtained data as was
presented before, we discussed in the following sections, more details about the effect of
lubricant molecular weight and hydrophobic-hydrophilic balance on its adsorption ability
Effect of Nonionic Polymer Molecular Mass
In Figure 6.8, the maximum adsorption density and Langmuir affinity constants between
the tested lubricants and PET surface are plotted as a function of the molecular weight. A clear
trend could be distinguished for the maximum adsorption density, regardless the structure
(hydrophilic-lipophilic balance of the molecule). This is the reason why conformation of the
adsorbed layer with high molecular weight polymer is “more compact” than that with lower
molecular weight ones. On the other hand, there was no obvious trend for the fitted affinity
constants as a function of the molecular weight.

162
0
200
400
600
2000 4000 6000 8000
020406080
100
Q0
b
MW
Figure 6.8. Fitted Langmuir parameters change with molecular weight (MW). Highly dependency of maximum adsorption density on MW can be observed.
Effect of the HLB of the Lubricant on Adsorption on PET
The nonionic polymers presented in Table 6.1 are actually surface-active molecules
(polymeric surfactants) since they carry hydrophilic (EO groups) and hydrophobic (PO groups
and alkyl group) segments that provide amphophilic character to the molecule. Further,
adsorption and association behaviors typical of monomeric surfactants are also displayed by
these polymers. In fact, nonionic lubricants can assemble into layers to offer protection to
friction and wear. The hydrophilic-lipophilic balance (HLB) of a surfactant, a widely used
indicator of its partitioning tendency between oil and water phases, can also be applied to
nonionic polymers. The maximum adsorption density and affinity number between the polymeric
lubricants and PET surface are plotted against the HLB number in Figure 6.9. The HLB values

163
were calculated by the method of group contribution described by Guo et al. 5. Details about this
calculation are provided in the next section. As can be observed in Figure 6.9, there is no clear
trend regarding the effect of HLB on adsorption. However, it is expected that a lower polymer
HLB will favor larger adsorption (and larger adsorption affinity constants) on hydrophobic PET
surfaces since in this case hydrophobic interactions are dominant. Since the molecular weight is
also an important factor independent on the surface energies of the system, it is the combination
of HLB and molecular mass that explain the observed trends. Unfortunately, no series of
polymers with same molecular mass and different HLB (or vice versa) were available for more
detailed inquiries.
0
200
400
600
5 10 15 20 25 30
020406080
100
Q0
b
HLB
Figure 6.9. Fitted Langmuir parameters as a function of polymer’s HLB values.
164
Hydrophobic Numbers and Adsorption
Ever present van de Waals forces are a component of the total adsorption energy but it is
not expected to be the main driving force for irreversible adsorption. In this section we will
discuss the other, likely more important, contribution for irreversible adsorption of the tested
surfactants on PET surfaces.
Since no reaction with surface takes place upon adsorption and since there are no charged
groups in the nonionic surfactant chains, their adsorption is expected to obey physical processes
and therefore the attractive forces are a combination of van de Waals and hydrophobic effects.
Explanations of the hydrophobics forces have been attempted relatively recently in
classical discussions of surface science 13-18. It is hypothesized that the hydrophobic force
depends on the hydrophobicity of the adsorbate and surface and it can be divided into short-,
medium- and long-ranged forces. In our case, the water contact angle of PET is around 65° a
somewhat hydrophobic material and therefore the involved hydrophobic forces may be of the
short-range type.
HLB was used in the previous session as a way to determine the hydrophobicity (or
hydrophilicity) balance of the molecule. However, it is not the only method to determine the
hydrophobicity of the involved species. In fact, the group contribution and the effective chain
length proposed by Guo et al 5 inspired us to use an alternate way to characterize the
hydrophobicity of the polymers.
In group contribution methods, it is assumed that a mixture does not consist of molecules,
but of functional groups. By using thermodynamic fundamentals, it can be shown that the
165
required activity coefficients can be calculated when only the interaction parameters between the
functional groups are known. The advantage of group contribution methods is that the number of
functional groups is much smaller than the number of possible molecules 19-21.
In our case, the R and PO groups are relatively more hydrophobic than the EO groups
(see Table 6.1) and therefore we will use a descriptor for these units based on what is known for
a straight alkyl chain. A fully stretched lipophilic chain length is directly proportional to the
number of –CH2- groups. Here 2,CH effN is given by
2, 20.965 0.178CH eff CHN N= − (Equation 6.4)
and ,PO effN is given by
, 2.057 9.06PO eff PON N= + (Equation 6.5)
Where 2,CH effN and ,PO effN represent effective chain lengths for –CH2- and PO groups,
while 2CHN and PON represent actual chain lengths for –CH2- and PO groups, respectively.
In Equation 6.4 and 6.5 coefficients from group contribution calculation is used as pre-
factor: 0.475 for -CH2- , and 0.15 for PO 5.
Thus the hydrophobic number of one molecule is the product of effective chain length
and group contribution number. The calculated hydrophobic numbers for the polymers listed in
Table 6.1 are shown in Table 6.4.
When the maximum adsorption density, Q0 and affinity constant, b are plotted against the
respective hydrophobic number an obvious trend emerges, as seen in Figure 6.10: The affinity
strongly depends on the hydrophobic number. When the hydrophobic number is small, <8, the

166
affinity constant is around 20; when hydrophobic number reaches up to 10, the affinity constant
is doubled and when hydrophobic number is high, >13, the affinity reaches a maximum value of
100 and reaches a plateau. Therefore, it is concluded that the affinity is very sensitive (and
strongly depends on) the hydrophobic number of the polymer.
Table 6. 4. Calculated hydrophobic numbers for tested nonionic polymers Polymer Hydrophobic number RP10E13 6.19 RP13E17 7.15 RP33E44 13.37
E19P29E19 10.40 E76P29E76 10.28 E37P56E37 18.61
0100200300400500600
6 8 10 12 14 16 18 20
020406080
100
Q0
b
Hydrophobic number
Figure 6.10. Fitted Langmuir parameters change as a function of polymer’s hydrophobic number

167
The hydrophobic number of Guo 5 as used above incorporates both the effect of
hydrophobicity of the group (pre-factor) and the molar mass (number of hydrophobic -CH2- and
PO groups) while it decouples the contribution of the EO (hydrophilic) components. Since the
extent of adsorption depends more profoundly on the nature of the anchoring groups (the
hydrophobic ones) it is therefore reasonable to expect that the hydrophobic number relates
closely with the affinity constant. Interesting findings observed in Figure 6.10 for two samples,
E19P29E19 and E76P29E76, is noted now: Both polymers have the same hydrophobic
components, and therefore similar affinity constants were obtained from the Langmuir fitting,
even thought the maximum adsorption density was quite different. This last observation is
explained by the difference in the molecular mass for these two polymers. A maximum affinity
achieved when hydrophobic number is over 14, this indicates a polymer with a hydrophobic
number more than 14 will absorb onto PET surface, no matter how long its hydrophilic chain is.
Contact angle-and surface assembly
The contact angle is very sensitive to the surface energy of the material. Even a trace
amount of adsorbed molecules can change the contact angle to a large extent. The change in
contact angel for PET surfaces after treatment with nonionic polymeric lubricants is shown in
Figure 6.11. Spin coated PET surfaces were immersed in 1% lubricant solution and allowed to
equilibrate overnight. The surfaces were then rinsed extensively with milli-Q water and then
dried via a nitrogen gas stream directed gently on the surfaces. The water contact angle was then
measured.
As observed in Figure 6.11, P10E13, RP13E17 and E19P29E19 did not produce a

168
significant change in the water contact angle (WCA) compared with that for the bare PET
surface. RP33E44 lowered the WCA and the WCA in the case of surface treated with
E76P29E76 and E37P56E37 showed an extensive change (from 63 degree to 40 and 52 degrees,
respectively). The contact angle change supports the observed fact that a layer of nonionic
lubricant molecules forms during adsorption onto surface. As discussed in previous sections, the
hydrophobic segments of the polymer are attracted by hydrophobic surface on the surface
through hydrophobic forces, letting the hydrophilic segments to extend out, facing the water
phase to form a brush-like layer as illustrated in Figure 6.12. Therefore, the polymer which has
higher adsorption and long hydrophilic chains would lower the contact angle more significantly.
0
10
20
30
40
50
60
70
E37P56E37
E76P29E76
E19P29E19
RP33E44
RP13E17
RP10E13
Con
tact
ang
le (o )
PET
Figure 6.11. Contact angle changes for PET surfaces before and after (overnight) treatment with 1% nonionic polymer solutions followed by rinsing with mini-Q water and drying with nitrogen.
The WCA results also confirm that the adsorbed mass of E76P29E76 is lower than that of

169
E37P56E37. E76P29E76 has longer hydrophilic chains than E37P56E37 and therefore is
expected to produce a larger WCA change, as observed.
Figure 6.12. Proposed illustration for the adsorption of diblock and triblock nonionic polymers. Black segments represent the hydrophilic block of the polymer while the green segments represent the hydrophobic block of the polymer chains.
All the nonionic polymers used in this investigation are amphiphiles with hydrophobic
PO segments and hydrophilic EO segments. At the interface of PET and water, water doesn’t
favor to hydrophobic PET surface. From a thermodynamics view, when amphiphilic nonionic
polymers presence in the system, the hydrophobic segments of polymers are prone to bind to the
PET surface while hydrophilic segments are drawn toward the water phase to reduce the surface
energy. As a consequence, nonionic polymers reorient their configurations at the interface and
self-assemble to form a compact layer. The new equilibrium state is more stable than the initial
one therefore the surface is stabilized.
CONCLUSIONS
The adsorption of a nonionic lubricant onto a surface is a complex process where many
different interactions are present. The adsorption behavior and dynamics were measured by both
170
QCM and SPR techniques. The formation of an adsorbed layer of nonionic polymer on PET
surface was illustrated through Langmuir fitting. In this chapter, the nature of nonionic lubricants,
such as molecular weight, HLB value and hydrophobic number was discussed. van de Waals
and hydrophobic forces are expected to play an important role in reversible adsorption while the
hydrophobic interactions drives the irreversible adsorption. Hydrophobic segments provide the
affinity to anchor the lubricant polymers and higher molecular weight can provide maximum
adsorption density. Furthermore, the nature of molecule assembly also was investigated through
contact angle measurement and thermodynamic principles. The hydrophobic segments in an
amphophilic nonionic polymer tend to adsorb onto hydrophobic surface and hydrophilic one tend
to buoy in the solvent to reduce the interfacial energy between PET surface (hydrophobic surface)
and solvent (water). Therefore, adsorbed nonionic copolymer can stabilize the surface.
To sum up, this chapter discussed the effects of the nature of nonionic polymers in
molecular self-assembly. This is highly relevant to boundary lubrication. In next chapters, we
will discuss how the surface influences the adsorption process.
171
REFERENCES
1. Guddati, S.; Zhang, J.; Sinha, S. K.; Hsu, S. M., Nanolubrication: Characterization of patterned lubricant films on magnetic hard disks. Tribology Letters 2006, 21, (3), 253-261. 2. Guo, Q.; Li, L.; Hsia, Y. T.; Jhon, M. S., A spreading study of lubricant films via optical surface analyzer and molecular dynamics. Ieee Transactions on Magnetics 2006, 42, (10), 2528-2530. 3. Yoshizawa, H.; Chen, Y. L.; Israelachvili, J., Recent advances in molecular-level understanding of adhesion, friction and lubrication. Wear 1993, 168, (1-2), 161-166. 4. Hsu, S. M.; Ying, Z. C., Nanotribology : critical assessment and research needs. Kluwer Academic Publishers: Boston, 2003; p xi, 442 p. 5. Guo, X. W.; Rong, Z. M.; Ying, X. G., Calculation of hydrophile-lipophile balance for polyethoxylated surfactants by group contribution method. Journal of Colloid and Interface Science 2006, 298, (1), 441-450. 6. Fong, H.; Liu, W. D.; Wang, C. S.; Vaia, R. A., Generation of electrospun fibers of nylon 6 and nylon 6-montmorillonite nanocomposite. Polymer 2002, 43, (3), 775-780. 7. Bruschi, L.; Mistura, G., Measurement of the friction of thin films by means of a quartz microbalance in the presence of a finite vapor pressure. Physical Review B 2001, 63, (23). 8. Rodahl, M.; Hook, F.; Krozer, A.; Brzezinski, P.; Kasemo, B., Quartz-crystal microbalance setup for frequency and Q-factor measurements in gaseous and liquid environments. Review of Scientific Instruments 1995, 66, (7), 3924-3930. 9. Rodahl, M.; Kasemo, B., On the measurement of thin liquid overlayers with the quartz-crystal microbalance. Sensors and Actuators a-Physical 1996, 54, (1-3), 448-456. 10. Sauerbrey, G., The use of quartz oscillators for weighing thin layers and for microweighing. Zeitschrift Fur Physik 1959, 155, (2), 206-222. 11. Su, X. D.; Zong, Y.; Richter, R.; Knoll, W., Enzyme immobilization on poly (ethylene-co-acrylic acid) films studied by quartz crystal microbalance with dissipation monitoring. Journal of Colloid and Interface Science 2005, 287, (1), 35-42.

172
12. Lan, Q. D.; Bassi, A. S.; Zhu, J. X.; Margaritis, A., A modified Langmuir model for the prediction of the effects of ionic strength on the equilibrium characteristics of protein adsorption onto ion exchange/affinity adsorbents. Chemical Engineering Journal 2001, 81, (1-3), 179-186. 13. Israelachvili, J. N.; Pashley, R. M., Double-layer, van der Waals and hydrotion forces between surfaces in electrolyte-solutions. Hoppe-Seylers Zeitschrift Fur Physiologische Chemie 1981, 362, (9), 1178-1179. 14. Israelachvili, J.; Pashley, R., The hydrophobic interaction is long-range, decaying exponentially with distance. Nature 1982, 300, (5890), 341-342. 15. Pashley, R. M.; Israelachvili, J. N., DLVO and hydrotion force between mica sufaces in MG-2+, CA-2+, SR-2+, and BA-2+ chloride solutions. Journal of Colloid and Interface Science 1984, 97, (2), 446-455. 16. Yoon, R. H.; Ravishankar, S. A., Application of extended DLVO theory.3.Effect of Octanol on the long-range hydrophobic forces between Dodecylamine-coated mica surfaces. Journal of Colloid and Interface Science 1994, 166, (1), 215-224. 17. Yoon, R. H.; Ravishankar, S. A., Long-range hydrophobic forces between mica surfaces in alkaline dodecylammonium chloride solutions. Journal of Colloid and Interface Science 1996, 179, (2), 403-411. 18. Yoon, R. H.; Ravishankar, S. A., Long-range hydrophobic forces between mica surfaces in dodecylammonium chloride solutions in the presence of dodecanol. Journal of Colloid and Interface Science 1996, 179, (2), 391-402. 19. Gmehling, J., Group contribution methods - ideal tools for the synthesis and design of separation processes. Pure and Applied Chemistry 1999, 71, (6), 939-949. 20. Gmehling, J., Potential of group contribution methods for the prediction of phase equilibria and excess properties of complex mixtures. Pure and Applied Chemistry 2003, 75, (7), 875-888. 21. Gmehling, J., Potential of thermodynamic tools (group contribution methods, factual data banks) for the development of chemical processes. Fluid Phase Equilibria 2003, 210, (2), 161-173.

173
Chapter 7
Adsorption of Nonionic Polymers on
Cellulose, Polypropylene, Nylon
and PET Surfaces

174
ABSTRACT
In this chapter the adsorption of nonionic polymers on model surfaces (cellulose,
polypropylene, nylon and polyester) were studied with the QCM and SPR techniques.
The underlying driving force for adsorption of nonionic lubricants onto these surfaces is
discussed and our experimental observations confirm expected behaviors: A greater
affinity of the more hydrophobic polymer species with the hydrophobic surfaces and vice
versa. Hydrophobic interactions are concluded as being a predominant factor in
adsorption of PAGs and Pluronic polymers on textile-relevant surfaces.
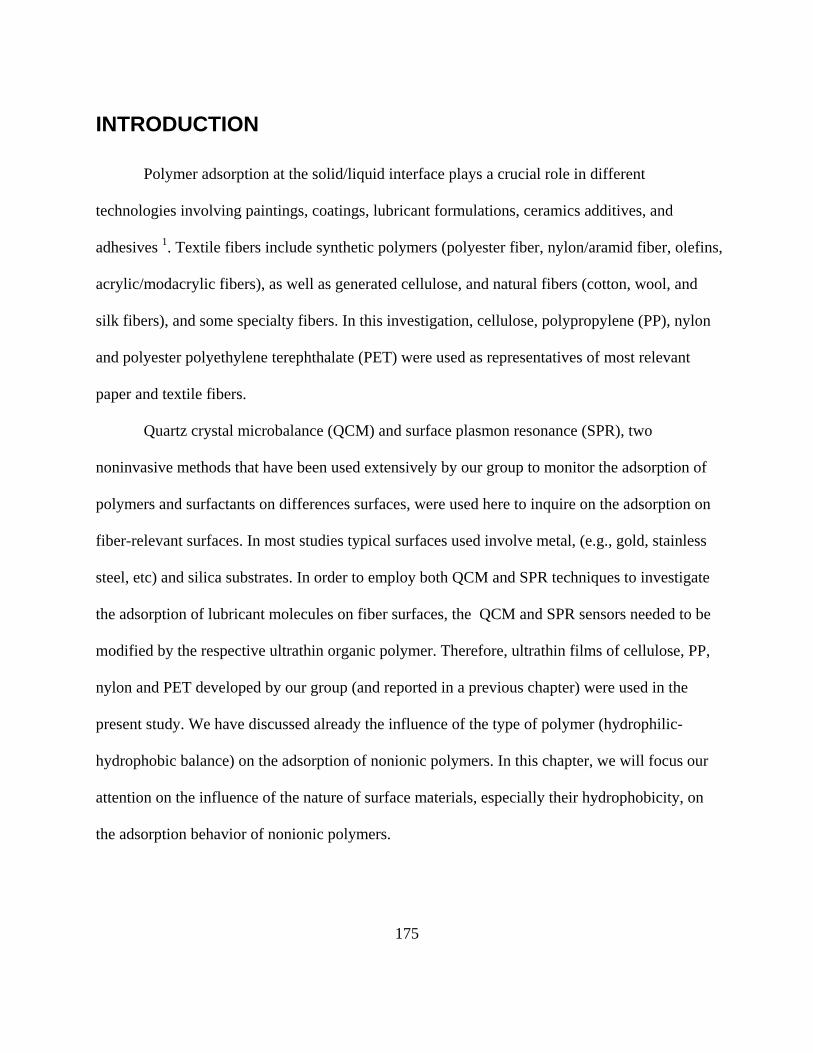
175
INTRODUCTION
Polymer adsorption at the solid/liquid interface plays a crucial role in different
technologies involving paintings, coatings, lubricant formulations, ceramics additives, and
adhesives 1. Textile fibers include synthetic polymers (polyester fiber, nylon/aramid fiber, olefins,
acrylic/modacrylic fibers), as well as generated cellulose, and natural fibers (cotton, wool, and
silk fibers), and some specialty fibers. In this investigation, cellulose, polypropylene (PP), nylon
and polyester polyethylene terephthalate (PET) were used as representatives of most relevant
paper and textile fibers.
Quartz crystal microbalance (QCM) and surface plasmon resonance (SPR), two
noninvasive methods that have been used extensively by our group to monitor the adsorption of
polymers and surfactants on differences surfaces, were used here to inquire on the adsorption on
fiber-relevant surfaces. In most studies typical surfaces used involve metal, (e.g., gold, stainless
steel, etc) and silica substrates. In order to employ both QCM and SPR techniques to investigate
the adsorption of lubricant molecules on fiber surfaces, the QCM and SPR sensors needed to be
modified by the respective ultrathin organic polymer. Therefore, ultrathin films of cellulose, PP,
nylon and PET developed by our group (and reported in a previous chapter) were used in the
present study. We have discussed already the influence of the type of polymer (hydrophilic-
hydrophobic balance) on the adsorption of nonionic polymers. In this chapter, we will focus our
attention on the influence of the nature of surface materials, especially their hydrophobicity, on
the adsorption behavior of nonionic polymers.

176
EXPERIMENTAL
All experiments were performed with deionized water from an ion-exchange system
(Pureflow, Inc.) which was further processed in a Milli-Q® Gradient unit to ensure ultrapure
water with resistivity greater than18MΩ.
The substrates used in this investigation were circular Q-Sense gold sensors (Q-sensor Co,
diameter is 12 mm) and square (Rechaint Co, 12 ×12 mm) wafers suitable for QCM and SPR
experiments, respectively.
RO-[CH2CHO]n[CH2CH2O]m-H
CH3
RO-[CH2CHO]n[CH2CH2O]m-H
CH3
RO-[CH2CHO]n[CH2CH2O]m-H
CH3
RO-[CH2CHO]n[CH2CH2O]m-H
CH3
H-[CH2CH2O]m-[CH2CHO]n[CH2CH2O]m-H
CH3
H-[CH2CH2O]m-[CH2CHO]n[CH2CH2O]m-H
CH3
H-[CH2CH2O]m-[CH2CHO]n[CH2CH2O]m-H
CH3
H-[CH2CH2O]m-[CH2CHO]n[CH2CH2O]m-H
CH3
Figure 7.1. Chemical structure of polyalkylene glycols (PAGs) (left) and Pluronics (right).
Table 7.1. Structural information of polyalkylene glycols (PAGs) and Pluronics Symbol used in this thesis
Commercial name MW n (PO) m (EO) HLB
RP10E13 UCON 50-HB-400 1,230 10 13 11.92 RP13E17 UCON 50-HB-660 1,590 13 17 12.0 RP33E44 UCON 50-HB-5100 3,930 33 44 8.51 E19P29E19 Pluronic P65 3,400 29 19 21.67 E76P29E76 Pluronic F68 8,400 29 76 27.97 E37P56E37 Pluronic P105 6,500 56 37 17.34 * UCON polymers are from Dow Co. and Pluronic polymers are from BASF Co. * HLB values were calculated by the method described by Guo et al. 2 * R, P and E stand for butyl, r propylene oxide and ethylene oxide groups, respectively.
The nonionic lubricants used in this investigation included two sets of polymers with
known structures: polyalkylene glycols (PAGs) from Dow Chemical Co. (Midland, MI), and
triblock copolymers based on ethylene oxide and propylene oxide (Pluronics) from BASF
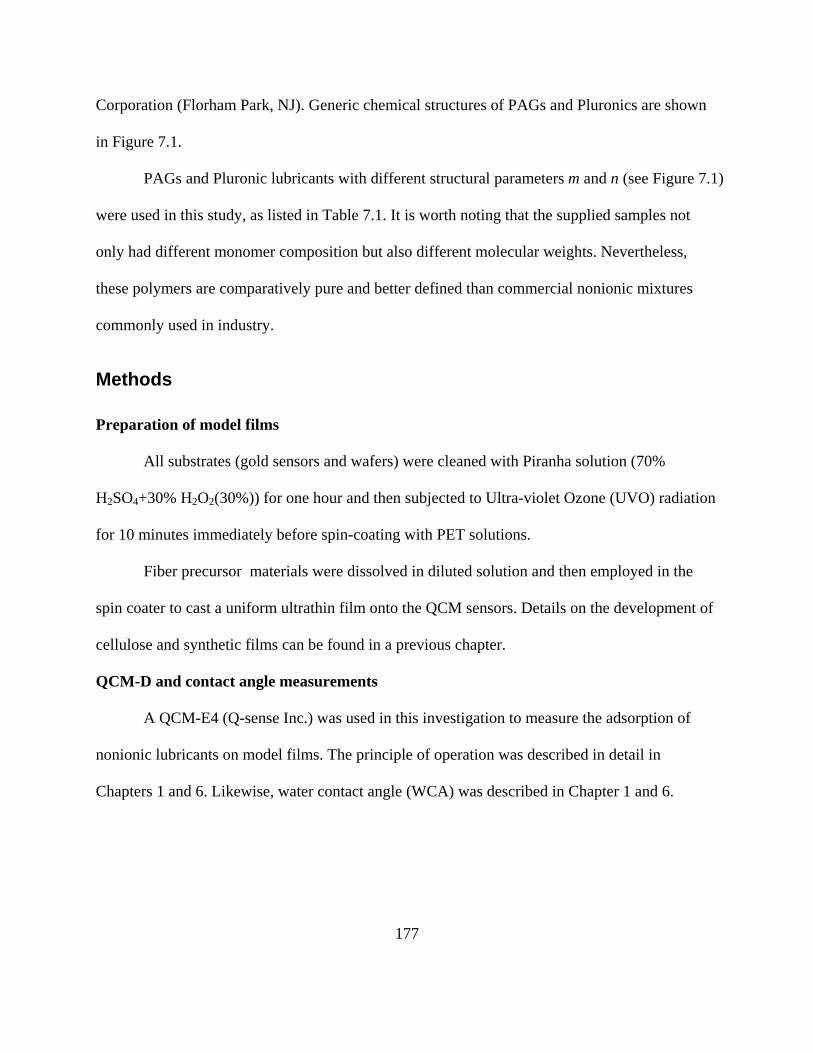
177
Corporation (Florham Park, NJ). Generic chemical structures of PAGs and Pluronics are shown
in Figure 7.1.
PAGs and Pluronic lubricants with different structural parameters m and n (see Figure 7.1)
were used in this study, as listed in Table 7.1. It is worth noting that the supplied samples not
only had different monomer composition but also different molecular weights. Nevertheless,
these polymers are comparatively pure and better defined than commercial nonionic mixtures
commonly used in industry.
Methods
Preparation of model films
All substrates (gold sensors and wafers) were cleaned with Piranha solution (70%
H2SO4+30% H2O2(30%)) for one hour and then subjected to Ultra-violet Ozone (UVO) radiation
for 10 minutes immediately before spin-coating with PET solutions.
Fiber precursor materials were dissolved in diluted solution and then employed in the
spin coater to cast a uniform ultrathin film onto the QCM sensors. Details on the development of
cellulose and synthetic films can be found in a previous chapter.
QCM-D and contact angle measurements
A QCM-E4 (Q-sense Inc.) was used in this investigation to measure the adsorption of
nonionic lubricants on model films. The principle of operation was described in detail in
Chapters 1 and 6. Likewise, water contact angle (WCA) was described in Chapter 1 and 6.

178
RESULTS AND DISCUSSION
Adsorption experiments
In this investigation, nonionic polymers with five different concentrations (from 0.0001%
to 1%) in aqueous media were used in the adsorption experiments with cellulose, polypropylene
(PP), nylon, and polyester polyethylene terephthalate (PET). For cellulose surfaces, there was no
noticeable change in either frequency or dissipation. Therefore, it was concluded that no
adsorption of the studied nonionic polymers occurred on this hydrophilic surface. This was also
confirmed by SPR experiments. For the rest of the model surfaces, the adsorption mass before
(total adsorption) and after rinsing (irreversible adsorption) were plotted against concentration, as
shown in Figures 7.2, 7.3 and 7.4, respectively for PP, nylon and PET surfaces.
An apparent trend in the Sauerbrey adsorbed mass can be observed, and was also noted in
previous chapters, i.e., those lubricants with lower molecular weight adsorbed to a lesser extent
compared to the polymers with higher molecular weight. The total adsorption was observed to
increase with concentration and no apparent saturation was reached. However, for the
irreversible adsorption a plateau with concentration was observed for nylon and PET surfaces.
In order to compare the adsorption data on solid surfaces with the maximum adsorbed
mass at air/water which had been addressed in Chapter 4, adsorbed mass of ng/cm2 in Figure 7.2
to Figure 7.4 was converted into the unit of mol/m2 as presented in Figure 7.5 to 7.7 accordingly.
The maximum adsorbed mass at air/water was in the range of 8-15 ×10-7 mol/m2. The same
observation as in Chapter in 6 is the adsorbed mass on each film before rinsing at high
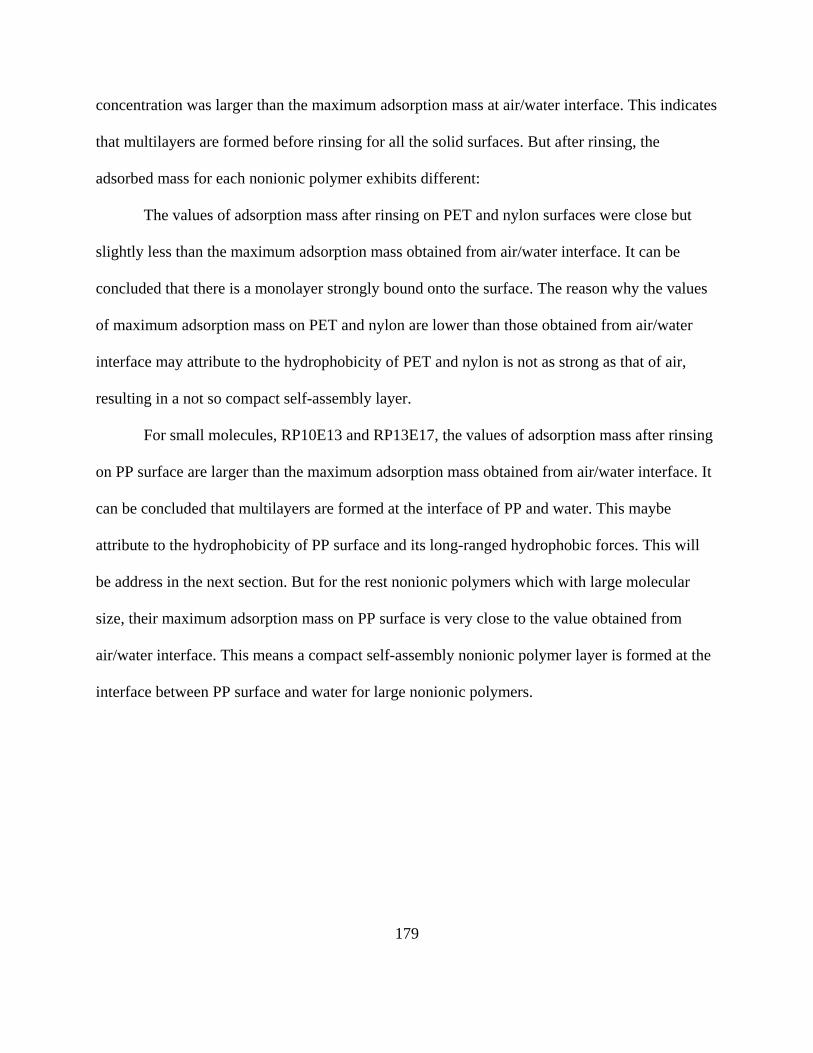
179
concentration was larger than the maximum adsorption mass at air/water interface. This indicates
that multilayers are formed before rinsing for all the solid surfaces. But after rinsing, the
adsorbed mass for each nonionic polymer exhibits different:
The values of adsorption mass after rinsing on PET and nylon surfaces were close but
slightly less than the maximum adsorption mass obtained from air/water interface. It can be
concluded that there is a monolayer strongly bound onto the surface. The reason why the values
of maximum adsorption mass on PET and nylon are lower than those obtained from air/water
interface may attribute to the hydrophobicity of PET and nylon is not as strong as that of air,
resulting in a not so compact self-assembly layer.
For small molecules, RP10E13 and RP13E17, the values of adsorption mass after rinsing
on PP surface are larger than the maximum adsorption mass obtained from air/water interface. It
can be concluded that multilayers are formed at the interface of PP and water. This maybe
attribute to the hydrophobicity of PP surface and its long-ranged hydrophobic forces. This will
be address in the next section. But for the rest nonionic polymers which with large molecular
size, their maximum adsorption mass on PP surface is very close to the value obtained from
air/water interface. This means a compact self-assembly nonionic polymer layer is formed at the
interface between PP surface and water for large nonionic polymers.

180
1E-4 1E-3 0.01 0.1 1
0
500
1000
1500
2000
2500
3000
1E-4 1E-3 0.01 0.1 1
0
200
400
600
800
1000
Ads
orbe
d m
ass Γ,
ng/
cm2
After rinsing RP10E13 RP13E17 RP33E44 E19P29E19 E76P29E76 E37P56E37
Ads
orbe
d m
ass Γ,
ng/
cm2
Nonionic polymer concentration, % (w/v)
Before rinsing
Nonionic polymer concentration, % (w/v)
RP10E13 RP13E17 RP33E44 E19P29E19 E76P29E76 E37P56E37
Figure 7.2. Adsorption isotherms for nonionic polymers adsorbed on polypropylene surfaces. The polymer solution flow rate was kept constant at 0.1 ml/min.
1E-4 1E-3 0.01 0.1 1
0
200
400
600
800
1000
1200
1E-4 1E-3 0.01 0.1 1
0
100
200
300
400
500
600
Nonionic polymer concentration, % (w/v)
Ads
orbe
d m
ass Γ,
ng/
cm2
RP10E13 RP13E17 RP33E44 E19P29E19 E76P29E76 E37P56E37
After rinsing
Adso
rbed
mas
s Γ,
ng/
cm2
Nonionic polymer concentration, % (w/v)
RP10E13 RP13E17 RP33E44 E19P29E19 E76P29E76 E37P56E37
Before rinsing
Figure 7.3. Adsorption isotherms for nonionic polymers adsorbed on nylon surfaces. The polymer solution flow rate was kept constant at 0.1 ml/min.

181
1E-4 1E-3 0.01 0.1 1
0100200300400500600700800900
1000
1E-4 1E-3 0.01 0.1 1
0
100
200
300
400
500
600
Adso
rbed
mas
s Γ,
ng/
cm2
Nonionic polymer concentration, % (w/v)
After rinsingAd
sorb
ed m
ass Γ,
ng/
cm2
Nonionic polymer concentration, % (w/v)
RP10E13 RP13E17 RP33E44 E19P29E19 E76P29E76 E37P56E37
Before rinsing RP10E13 RP13E17 RP33E44 E19P29E19 E76P29E76 E37P56E37
Figure 7.4. Adsorption isotherms for nonionic polymers adsorbed on PET surfaces. The polymer solution flow rate was kept constant at 0.1 ml/min.
1E-4 1E-3 0.01 0.1 1-5
0
5
10
15
20
25
30
35
40
1E-4 1E-3 0.01 0.1 1
0
5
10
15
20
25
30A
dsor
bed
mas
s Γ,
x10
-7m
ol/m
2 After rinsing RP10E13 RP13E17 RP33E44 E19P29E19 E76P29E76 E37P56E37
Ads
orbe
d m
ass Γ,
x10
-7m
ol/m
2
Nonionic polymer concentration, % (w/v)
Before rinsing
Nonionic polymer concentration, % (w/v)
RP10E13 RP13E17 RP33E44 E19P29E19 E76P29E76 E37P56E37
Figure 7.5. Adsorption isotherms for nonionic polymers adsorbed on polypropylene surfaces expressed by mol/m2. The data converted from Figure 7.2.
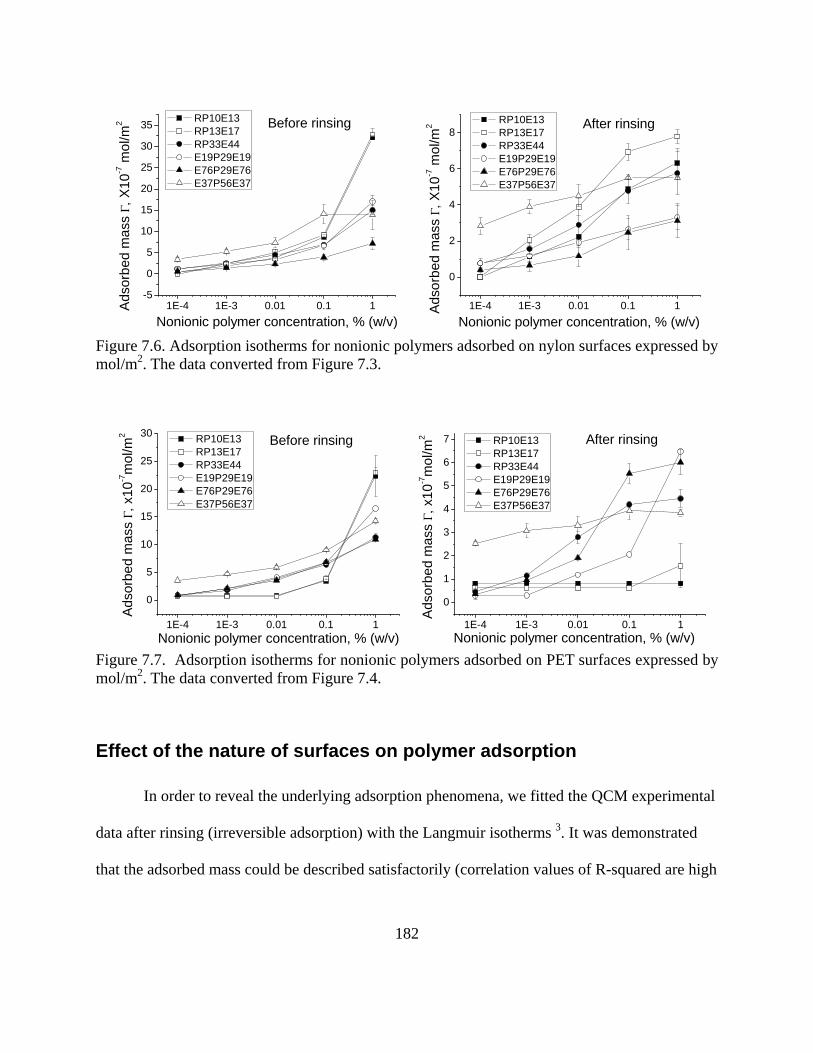
182
1E-4 1E-3 0.01 0.1 1-5
0
5
10
15
20
25
30
35
1E-4 1E-3 0.01 0.1 1
0
2
4
6
8
Nonionic polymer concentration, % (w/v)
Ads
orbe
d m
ass Γ,
X10
-7 m
ol/m
2 RP10E13 RP13E17 RP33E44 E19P29E19 E76P29E76 E37P56E37
After rinsingA
dsor
bed
mas
s Γ,
X10
-7 m
ol/m
2
Nonionic polymer concentration, % (w/v)
RP10E13 RP13E17 RP33E44 E19P29E19 E76P29E76 E37P56E37
Before rinsing
Figure 7.6. Adsorption isotherms for nonionic polymers adsorbed on nylon surfaces expressed by mol/m2. The data converted from Figure 7.3.
1E-4 1E-3 0.01 0.1 1
0
5
10
15
20
25
30
1E-4 1E-3 0.01 0.1 1
0
1
2
3
4
5
6
7A
dsor
bed
mas
s Γ,
x10
-7m
ol/m
2
Nonionic polymer concentration, % (w/v)
After rinsing
Ads
orbe
d m
ass Γ,
x10
-7m
ol/m
2
Nonionic polymer concentration, % (w/v)
RP10E13 RP13E17 RP33E44 E19P29E19 E76P29E76 E37P56E37
Before rinsing RP10E13 RP13E17 RP33E44 E19P29E19 E76P29E76 E37P56E37
Figure 7.7. Adsorption isotherms for nonionic polymers adsorbed on PET surfaces expressed by mol/m2. The data converted from Figure 7.4.
Effect of the nature of surfaces on polymer adsorption
In order to reveal the underlying adsorption phenomena, we fitted the QCM experimental
data after rinsing (irreversible adsorption) with the Langmuir isotherms 3. It was demonstrated
that the adsorbed mass could be described satisfactorily (correlation values of R-squared are high

183
in Table 7.2) with the Langmuir equation. The adsorption also was conducted on cellulose
surfaces; however, no detectable signal was observed. The Langmuir adsorption isotherm
assumes an adsorbed layer with a maximum number of equivalent binding sites, each of which
can be occupied by one molecule. The adsorbed mass Г is a function of the polymer
concentration, C, maximum adsorption density, Q0 and affinity between adsorbate and the
surface, b as in Equation 7.2:
0( , )1
ii
i
Q bCX CbC
Γ =+
(Equation 7.2)
The fitted Langmuir parameters for all adsorption isotherms (irreversible adsorption) are
listed in Table 7.2.

184
Table 7.2. Langmuir parameters for (irreversible) adsorption isotherms of nonionic polymers on PP, nylon and PET surfaces (no adsorption was observed on cellulose surfaces)..
Surface Lubricant bQ0 b Q0 R-squared RP10E13 6518.47 100.00 65.18 0.855 RP13E17 6017.46 100.00 60.17 0.844 RP33E44 32674.71 100.00 326.76 0.930
E19P29E19 17080.39 100.00 170.80 0.921 E76P29E76 18560.96 12.61 1472.36 0.962
PP
E37P56E37 63678.05 100.00 636.78 0.581 RP10E13 3079.22 35.18 87.54 0.967 RP13E17 5739.82 32.24 178.02 0.930 RP33E44 22134.31 99.99 221.37 0.980
E19P29E19 11118.58 100.00 111.19 0.967 E76P29E76 16980.93 66.65 254.78 0.975
Nylon
E37P56E37 41106.61 100.00 411.07 0.919 RP10E13 93.16 8.34 11.18 0.992 RP13E17 173.71 5.99 29.00 0.982 RP33E44 18524.07 100.00 185.24 0.991
E19P29E19 4904.31 46.32 105.87 0.922 E76P29E76 28058.80 53.20 527.44 0.986
PET
E37P56E37 29378.39 100.00 293.78 0.913
In Figure 7.8, the maximum adsorption density, Q0 and affinity between polymer and
surface, b are displayed for the polymers for the three model surfaces. The three surfaces showed
similar trends with respect to the maximum adsorption density: the maximum adsorption density
increased with molecular weight of the lubricants. This was also discussed in detail in Chapter 6.
Molecules with higher molecular weight carrying longer buoy chains favor the formation of
denser adsorbed layers compared with the resultant layers from polymers carrying short buoy
chains. By comparing the trends for all three surfaces, adsorption to the most hydrophobic PP
surface was more obvious than for the other less hydrophobic surfaces. This implies that the
hydrophobicity of the surfaces influences to a large extent the maximum adsorption density.
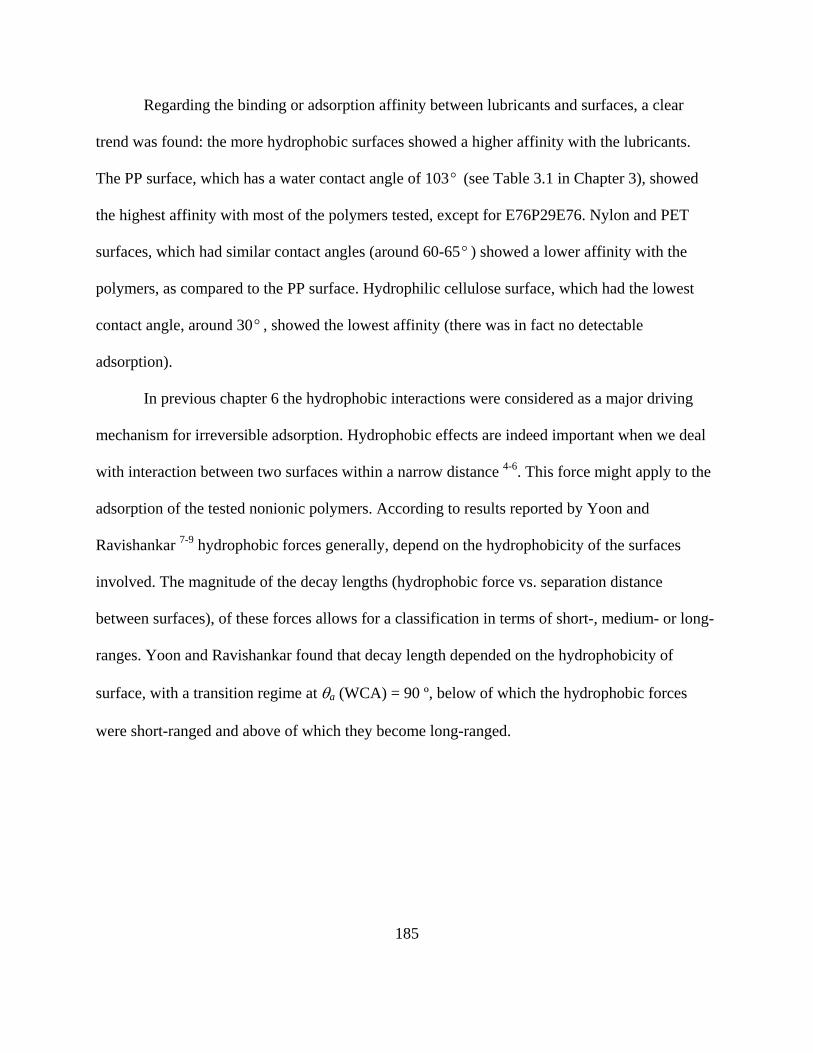
185
Regarding the binding or adsorption affinity between lubricants and surfaces, a clear
trend was found: the more hydrophobic surfaces showed a higher affinity with the lubricants.
The PP surface, which has a water contact angle of 103 ° (see Table 3.1 in Chapter 3), showed
the highest affinity with most of the polymers tested, except for E76P29E76. Nylon and PET
surfaces, which had similar contact angles (around 60-65 ° ) showed a lower affinity with the
polymers, as compared to the PP surface. Hydrophilic cellulose surface, which had the lowest
contact angle, around 30° , showed the lowest affinity (there was in fact no detectable
adsorption).
In previous chapter 6 the hydrophobic interactions were considered as a major driving
mechanism for irreversible adsorption. Hydrophobic effects are indeed important when we deal
with interaction between two surfaces within a narrow distance 4-6. This force might apply to the
adsorption of the tested nonionic polymers. According to results reported by Yoon and
Ravishankar 7-9 hydrophobic forces generally, depend on the hydrophobicity of the surfaces
involved. The magnitude of the decay lengths (hydrophobic force vs. separation distance
between surfaces), of these forces allows for a classification in terms of short-, medium- or long-
ranges. Yoon and Ravishankar found that decay length depended on the hydrophobicity of
surface, with a transition regime at θa (WCA) = 90 º, below of which the hydrophobic forces
were short-ranged and above of which they become long-ranged.
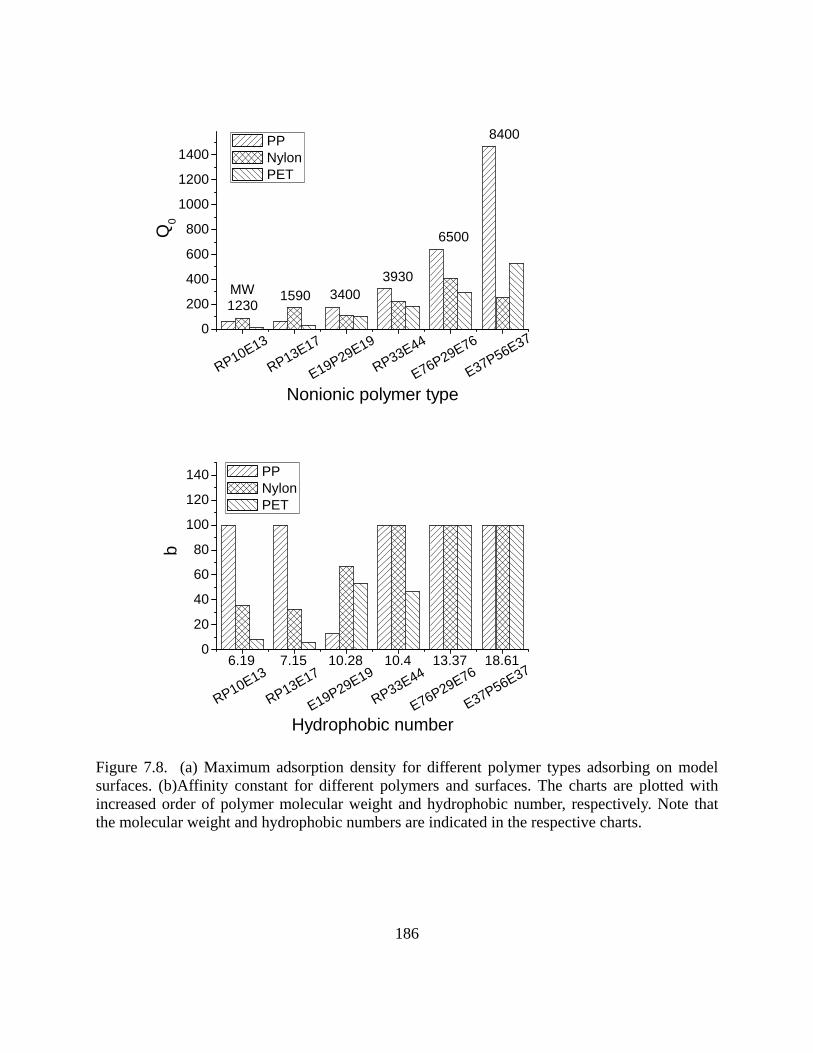
186
0
200
400
600
800
1000
1200
1400
E37P56E37
E76P29E76
RP33E44
E19P29E19
RP13E17
Q0
Nonionic polymer type
PP Nylon PET
RP10E13
12301590 3400
3930
6500
8400
MW
6.19 7.15 10.28 10.4 13.37 18.610
20
40
60
80
100
120
140
b
Hydrophobic number
PP Nylon PET
E37P56E37
E76P29E76
RP33E44
E19P29E19
RP13E17
RP10E13
Figure 7.8. (a) Maximum adsorption density for different polymer types adsorbing on model surfaces. (b)Affinity constant for different polymers and surfaces. The charts are plotted with increased order of polymer molecular weight and hydrophobic number, respectively. Note that the molecular weight and hydrophobic numbers are indicated in the respective charts.
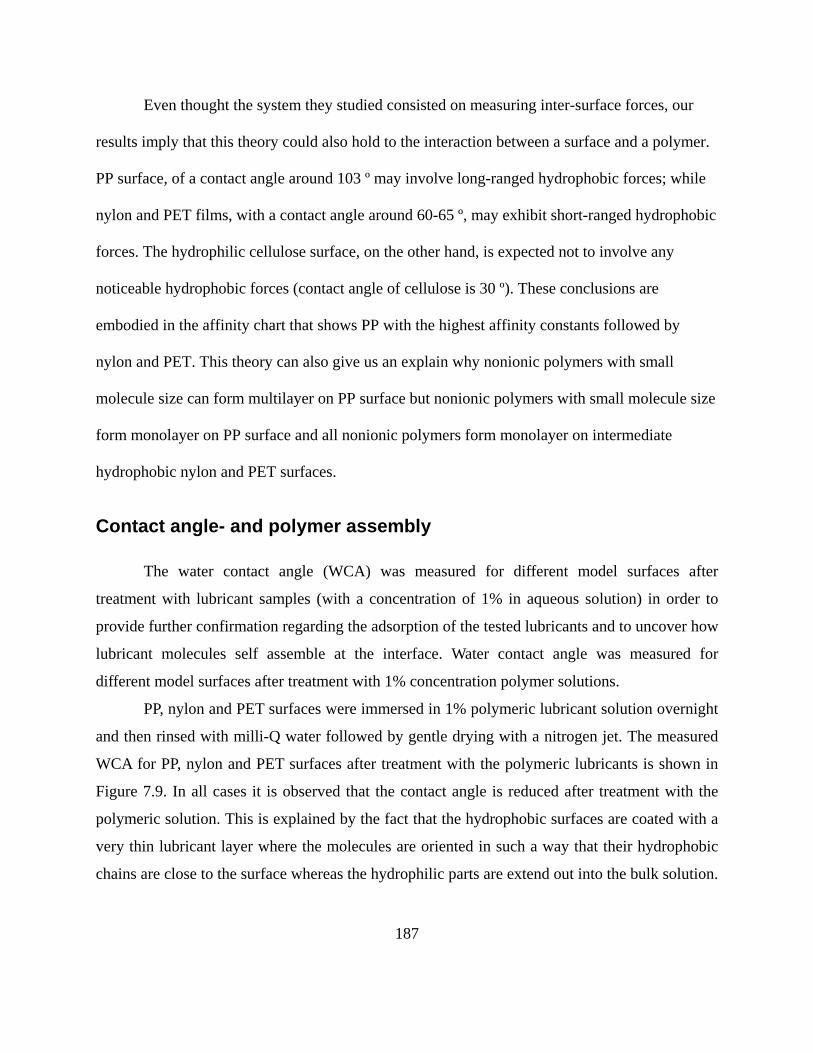
187
Even thought the system they studied consisted on measuring inter-surface forces, our
results imply that this theory could also hold to the interaction between a surface and a polymer.
PP surface, of a contact angle around 103 º may involve long-ranged hydrophobic forces; while
nylon and PET films, with a contact angle around 60-65 º, may exhibit short-ranged hydrophobic
forces. The hydrophilic cellulose surface, on the other hand, is expected not to involve any
noticeable hydrophobic forces (contact angle of cellulose is 30 º). These conclusions are
embodied in the affinity chart that shows PP with the highest affinity constants followed by
nylon and PET. This theory can also give us an explain why nonionic polymers with small
molecule size can form multilayer on PP surface but nonionic polymers with small molecule size
form monolayer on PP surface and all nonionic polymers form monolayer on intermediate
hydrophobic nylon and PET surfaces.
Contact angle- and polymer assembly
The water contact angle (WCA) was measured for different model surfaces after
treatment with lubricant samples (with a concentration of 1% in aqueous solution) in order to
provide further confirmation regarding the adsorption of the tested lubricants and to uncover how
lubricant molecules self assemble at the interface. Water contact angle was measured for
different model surfaces after treatment with 1% concentration polymer solutions.
PP, nylon and PET surfaces were immersed in 1% polymeric lubricant solution overnight
and then rinsed with milli-Q water followed by gentle drying with a nitrogen jet. The measured
WCA for PP, nylon and PET surfaces after treatment with the polymeric lubricants is shown in
Figure 7.9. In all cases it is observed that the contact angle is reduced after treatment with the
polymeric solution. This is explained by the fact that the hydrophobic surfaces are coated with a
very thin lubricant layer where the molecules are oriented in such a way that their hydrophobic
chains are close to the surface whereas the hydrophilic parts are extend out into the bulk solution.
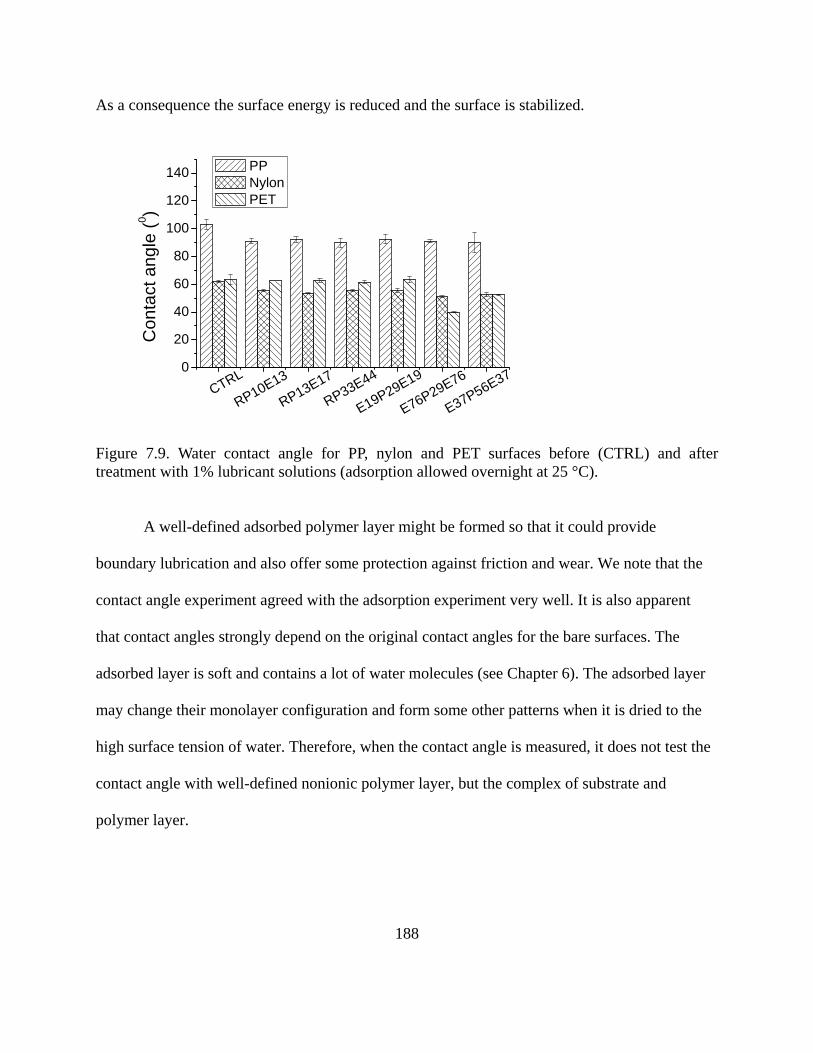
188
As a consequence the surface energy is reduced and the surface is stabilized.
0
20
40
60
80
100
120
140
RP33E44
RP13E17
RP10E13
E37P56E37
E19P29E19
E76P29E76
Con
tact
ang
le (0 )
PP Nylon PET
CTRL
Figure 7.9. Water contact angle for PP, nylon and PET surfaces before (CTRL) and after treatment with 1% lubricant solutions (adsorption allowed overnight at 25 °C).
A well-defined adsorbed polymer layer might be formed so that it could provide
boundary lubrication and also offer some protection against friction and wear. We note that the
contact angle experiment agreed with the adsorption experiment very well. It is also apparent
that contact angles strongly depend on the original contact angles for the bare surfaces. The
adsorbed layer is soft and contains a lot of water molecules (see Chapter 6). The adsorbed layer
may change their monolayer configuration and form some other patterns when it is dried to the
high surface tension of water. Therefore, when the contact angle is measured, it does not test the
contact angle with well-defined nonionic polymer layer, but the complex of substrate and
polymer layer.
189
CONCLUSIONS
The adsorption of nonionic polymeric lubricants onto fiber-relevant surfaces can be
described as a complex process. In this chapter the nature of the substrate, more specifically, its
surface hydrophobicity was studied in terms of the adsorption behavior of non ionic polymers.
From the obtained results it can be concluded that hydrophobic forces play an important role in
irreversible adsorption:
a) The hydrophobic segments in the adsorbing molecule and the surface energy of the
substrate are the most important factors to determine the extent and strength of
adsorption. Longer hydrophobic segment in a nonionic lubricant molecule and
higher hydrophobicity of the surface leads to higher affinities.
b) The molecular weight of the nonionic polymers is crucial in defining the maximum
adsorbed amount. Higher molecular weight (longer polymer chains) is more likely
to bind on the surface.

190
REFERENCES
1. Chakraborty, A. K.; Golumbfskie, A. J., Polymer adsorption - Driven self-assembly of nanostructures. Annual Review of Physical Chemistry 2001, 52, 537-573. 2. Guo, X. W.; Rong, Z. M.; Ying, X. G., Calculation of hydrophile-lipophile balance for polyethoxylated surfactants by group contribution method. Journal of Colloid and Interface Science 2006, 298, (1), 441-450. 3. Lan, Q. D.; Bassi, A. S.; Zhu, J. X.; Margaritis, A., A modified Langmuir model for the prediction of the effects of ionic strength on the equilibrium characteristics of protein adsorption onto ion exchange/affinity adsorbents. Chemical Engineering Journal 2001, 81, (1-3), 179-186. 4. Israelachvili, J. N.; Pashley, R. M., Double-layer, van der Waals and hydrotion forces between surfaces in electrolyte-solutions. Hoppe-Seylers Zeitschrift Fur Physiologische Chemie 1981, 362, (9), 1178-1179. 5. Israelachvili, J.; Pashley, R., The hydrophobic interaction is long-range, decaying exponentially with distance. Nature 1982, 300, (5890), 341-342. 6. Pashley, R. M.; Israelachvili, J. N., DLVO and hydrotion force between mica sufaces in MG-2+, CA-2+, SR-2+, and BA-2+ chloride solutions. Journal of Colloid and Interface Science 1984, 97, (2), 446-455. 7. Yoon, R. H.; Ravishankar, S. A., Application of extended DLVO theory.3.Effect of Octanol on the long-range hydrophobic forces between Dodecylamine-coated mica surfaces. Journal of Colloid and Interface Science 1994, 166, (1), 215-224. 8. Yoon, R. H.; Ravishankar, S. A., Long-range hydrophobic forces between mica surfaces in alkaline dodecylammonium chloride solutions. Journal of Colloid and Interface Science 1996, 179, (2), 403-411. 9. Yoon, R. H.; Ravishankar, S. A., Long-range hydrophobic forces between mica surfaces in dodecylammonium chloride solutions in the presence of dodecanol. Journal of Colloid and Interface Science 1996, 179, (2), 391-402.
191
Chapter 8
Adsorption of Silicone-based Surfactants

192
ABSTRACT
Aqueous silicone-based surfactants are widely used in the processing of synthetic fibers
in textile industries. Silicone surfactants enhance a number of functional and processing
properties while keeping cost-effectiveness. In this chapter we discuss the interactions between
silicone-based surfactants and textile-relevant surfaces. This information will ultimately help to
understand lubrication phenomena in fiber processing. Our results showed that the more
hydrophobic polypropylene surfaces had higher affinity with silicone-based lubricants than
polyethylene surfaces. This is explained by the fact that the hydrophobic groups in the surfactant
molecule were interact more effectively with the PP surfaces via hydrophobic forces. Also, well-
organized silicone lubricant films were observed at the interface. These adsorbed layers are
expected to provide lubricity in textile materials when subject to shear forces and offer protection
to wear and abrasion.

193
INTRODUCTION
Conventional ionic and nonionic surfactants, which are extensively used in many
industrial applications, typically contain hydrocarbon groups in the hydrophobic chain. A class
of surfactants that has received increasing attention is the silicone-based surfactants which
contain polydimethylsiloxane groups in the hydrophobic chain.
In recent years, silicone-based surfactants have been extensively investigated regarding
their applications 1-9, properties of the solution and interfacial and wetting behaviors 4, 7, 8, 10-27.
One of their outstanding features is their ability to reduce the surface tension of water down to
values as low as 20-25 mN/m. By comparison, typical organic surfactants reduce the aqueous
solution surface tension down to the 30-45 mN/m range. An additional characteristic of silicone
surfactants is their superior wetting abilities 2. For example, they are effective in spreading and
wetting such low energy surfaces as polyethylene therefore they are used as additive to help
insecticide to spread on leaves. Interestingly, even fluorocarbon surfactants which have the
lowest surface energies known, do not wet polyethylene surface as efficiently as silicone-based
surfactants. Due the unique properties of silicone-based surfactants (including the named low
surface tension, their activity in both aqueous and non-aqueous media, and their little skin
irritation effects 28), silicone-based surfactants are a commercially important class of amphiphiles
that find application in numerous processes, including the manufacture of polyurethane foams,
coatings, household and personal care products, foam control and wetting additives, etc. 2.
Silicone-based lubricants are important components in many formulations used in textile
processing; it is used in thread lubrication, surface treatment and others. Compared to organic
194
materials, silicon-based textile lubricants perform better, last longer and most importantly, they
are also extremely cost-effective.
However, studies on the adsorption behavior of silicone surfactants on solid surfaces,
especially those relevant to textile processing, are very limited 28, 29. Silicone-based surfactants
can adsorb onto hydrophobic surfaces by self-assembly through their hydrophobic moieties. The
hydrodynamic thickness of the adsorbed layer was found to increase with chain length of the
hydrophilic moiety 28, 29. One interesting and also important property found for silicone-based
surfactants was the fact that the adsorbed layer was more stable against alcohols and other
organic solvents. That means that they can be applied in aqueous as well as in nonaqueous media.
This is not a common property in surfactant chemistries since in most conditions addition of
short-chained alcohols usually results in the decrease of the aggregation number and even the
disappearance of micelles in solution, with a simultaneous loss in surface aggregation 28, 29. In
their studies with silicon surfactants, Wang and coworkers found that silicone surfactant could
provide steric repulsion up to 80% ethanol in solution, while the Pluronic-type of surfactants lost
their surface activity at approximately 40% ethanol.
In the present study, we addressed the adsorption behavior of a commercial silicone
surfactant and investigated the influence on adsorption of hydrophobicity of the substrates. Our
measurements were performed mainly with the help of a quartz crystal microbalance (QCM).
Our main objective was to reveal the molecular assembly mechanism of silicone surfactants, and
their function in boundary lubrication in textile processing.

195
In order to facilitate the study of adsorption phenomena on surfaces relevant to textile
processing, model thin films of typical polymers were deposited on QCM-D gold sensors. Films
of polypropylene (PP) and polyethylene (PE) were used to investigate the interactions with the
commercial silicone-based surfactant.
EXPERIMENTAL
Materials
All experiments were performed with deionized water from an ion-exchange system
(Pureflow, Inc.) followed by a Milli-Q® Gradient unit (resistivity >18MΩ).Substrates used in
this investigation consisted of gold QCM sensors (Q-sense, Sweden).
The studied silicone-based lubricant was supplied by Goulston Inc. (Monroe, NC) under
trade name LN336-100I. It was a commercial product with main component a surface-active
block copolymer of polyalkylene oxide-modified polydimethylsiloxane. Silicone lubricant
sample was diluted with milli-Q water for surface tension measurement and adsorption
measurement.
Methods
Gold QCM sensors were cleaned with solution consisting of 70 % H2SO4 and 30 % H2O2
(30%) for one hour without heat and then subject to UV-ozone treatment for 10 minutes,
immediately before spin-coating. Clean sensors were modified by a uniform and ultrathin (20-50
196
nm) PP or PE film through spin coating technique. Procedures of model film preparation and
film characterization can be found in Chapter 3.
Adsorption experiments with the QCM-D technique
A QCM Q-300 model (Q-sense, Inc.) was used in our experiments. Principles of QCM
were addressed in detail in Chapter 1. QCM was run in a batch mode. Polymer-coated sensors
were mounted in the QCM chamber and silicone surfactant solution was passed through with a
known given concentration. The silicone surfactant was diluted with milli-Q water and no salt
was added.
The typical procedure in the adsorption experiments consisted of the following sequential
steps: (1) first milli-Q water was injected through the QCM system to obtain a baseline; (2)
when a constant stable baseline was obtained, surfactant solution with a given concentration
(ranging from 0.0001 to 1 (w/v%)) was passed through; (3) the QCM frequency was then
monitored until adsorption equilibrium was reached, and (4) When a stable equilibrium was
obtained, large amounts of milli-Q water were used to rinse the system in order to remove
loosely bound surfactants and also excess surfactant in the bulk solution. As a consequence, a
new equilibrium frequency was reached. Typical adsorption curves monitored by QCM are
shown in Figure 8.2.
Usually, frequency and dissipation values for the third and seventh overtones were
recorded and from these data, the dynamics of adsorption of polymers were characterized in
detail. The film viscosity, elasticity and thickness were extracted from the experimental data by
fitting with a Voigt model. However, since the adsorbed mass was typically very small and little
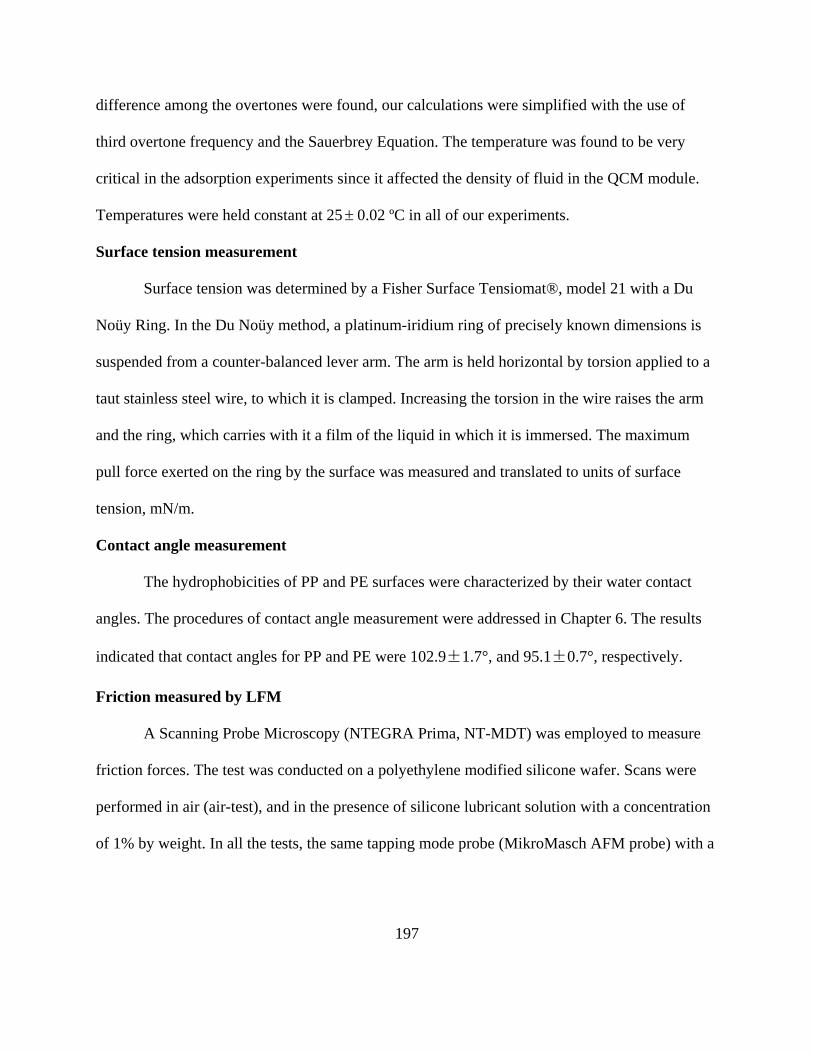
197
difference among the overtones were found, our calculations were simplified with the use of
third overtone frequency and the Sauerbrey Equation. The temperature was found to be very
critical in the adsorption experiments since it affected the density of fluid in the QCM module.
Temperatures were held constant at 25± 0.02 ºC in all of our experiments.
Surface tension measurement
Surface tension was determined by a Fisher Surface Tensiomat®, model 21 with a Du
Noüy Ring. In the Du Noüy method, a platinum-iridium ring of precisely known dimensions is
suspended from a counter-balanced lever arm. The arm is held horizontal by torsion applied to a
taut stainless steel wire, to which it is clamped. Increasing the torsion in the wire raises the arm
and the ring, which carries with it a film of the liquid in which it is immersed. The maximum
pull force exerted on the ring by the surface was measured and translated to units of surface
tension, mN/m.
Contact angle measurement
The hydrophobicities of PP and PE surfaces were characterized by their water contact
angles. The procedures of contact angle measurement were addressed in Chapter 6. The results
indicated that contact angles for PP and PE were 102.9±1.7°, and 95.1±0.7°, respectively.
Friction measured by LFM
A Scanning Probe Microscopy (NTEGRA Prima, NT-MDT) was employed to measure
friction forces. The test was conducted on a polyethylene modified silicone wafer. Scans were
performed in air (air-test), and in the presence of silicone lubricant solution with a concentration
of 1% by weight. In all the tests, the same tapping mode probe (MikroMasch AFM probe) with a
198
force constant of 0.35N/m, and a resonance frequency of 145Hz was used. All of the tests were
performed with a scanning velocity of 1Hz and a scanning size of 1 micron.
RESULTS AND DISCUSSION
The silicone lubricant used in this study was a surface-active block copolymer of
polyalkylene oxide-modified polydimethylsiloxane. Polydimethylsiloxanes are very strong
nonpolar molecules which produces an important lowering in surface tension. In fact, the surface
tension of the silicone lubricant was measured for the range of concentration as shown in Figure
8.1. It can be observed that the surface tension drops sharply from ca. 72 mN/m to ca. 35 mN/m
as the lubricant concentration increases from 10-5 to 5*10-3 % (w/v). The surface tension then
decreased slowly with concentration, down to 32 mN/m at 1% maximum concentration. This
value is not as low as stated in literature due to other components present in the mixture. Critical
micelle concentration determined by this method was around 4*10-3 % (w/v). This figure is
indicative of a surface active molecule with strong polar and nonpolar groups. Similarly to the
case of the air/liquid interface, it is expected that in the presence of a low energy solid surface
the nonpolar groups of the dissolved molecules are attracted to the surface by means of
hydrophobic forces. It is expected that the surfactant molecules arrange themselves by self
assembly in the form of a well-defined lubricant layer that is effective in reducing wear and
friction.

199
1E-6 1E-5 1E-4 1E-3 0.01 0.1 1
30
40
50
60
70
80
Sur
face
Ten
sion
(mN
/m)
Concentration (w/v%) Figure 8.1. Surface tension of the silicone lubricant used in this investigation.
Adsorption of silicone surfactant on polymeric surfaces
Adsorption from solution was conducted with the QCM instrument, as explained in the
methods section. Typical adsorption curves are shown in Figure 8.2 for PP and PE surfaces
exposed to 0.1% (w/v) lubricant solution. The change of QCM frequency with time (solid line),
which is related to the adsorbed mass, is shown on the left axis. While the change in the
dissipation factor (dashed line), which is related to the viscoelasticity of the adsorbed thin film, is
shown on the right axis. Before experiments, water was injected continuously in the QCM’s
sampling loop until a stable baseline was obtained. Silicone lubricant solution was then injected
in the sampling loop. In all cases fluid injection was performed at low shear rates, with typical
volumetric flow rate of only 0.1 ml/min. As a result of silicone lubricant injection, sharp changes
in frequency and dissipation were observed, as illustrated in Figure 8.2. These changes are

200
consistent with lubricant adsorption on the sensor’s surface. Around ten minutes after injection
the adsorption process reached equilibrium as judged by stable frequency and dissipation profiles.
Data acquisition under these stable conditions was continued for more than 1h to ensure that
adsorption equilibrium was indeed achieved. This equilibrium condition was then challenged by
injection of pure solvent (water), as a rinsing step. As a result of this rinsing step, sharp changes
in frequency and dissipation were observed. The increase in frequency indicated that loosely-
bound lubricant molecules were removed and therefore a thinner, less dissipative adsorbed layer
remained on the surface.
After 30-40 minutes from rinsing a second equilibrium state was attained with a
distinctive higher frequency and lower dissipation compared to the equilibrium values measured
in the first adsorption stage. The main difference between the two equilibrium conditions
explained so far is that in the first stage equilibrium is established between the adsorbed layer
and a solution containing lubricant molecules while in the second case equilibrium is established
with lubricant-free solvent. Based on the difference in lubricant’s chemical potential the
adsorbed mass can be classified into two categories, namely, reversible and irreversible adsorbed
mass, for the initial and the final equilibrium stages, respectively.
We now turn our focus to the difference between the PP and PE substrates. Under the
same lubricant concentration condition, the frequency change for the PP film was larger than that
for PE film, both in regard to the total (reversible) adsorption (-22.5 Hz vs -18.4 Hz for PP and
PE, respectively) and irreversible adsorption (-10.2 Hz vs -8.6 Hz for PP and PE, respectively).
This indicates that the affinity of silicone lubricant with PP is much higher that that with PE.
201
Since PP is more hydrophilic than PE there is reason to believe that the predominant driving
force for adsorption of silicone lubricant onto the hydrophobic surfaces is the hydrophobic effect.
In both cases (PP and PE) the irreversible adsorption was roughly half of the total
(reversible) adsorption. On the other hand, the change in energy dissipation for the adsorbed
silicone on PP indicates a “softer”, more dissipative layer than that on the PE substrate. This
observation is rationalized in terms of the adsorbed mass and adsorbed layer thickness which is
higher in the case of the PP substrate. For the irreversibly adsorbed layer (after rinsing
conditions), the absolute frequency is very low and no significant difference between the
behavior of lubricants adsorbed on PP and PE was observed.
0 50 100 150 200 250-25
-20
-15
-10
-5
0
Dis
sipa
tion
valu
e (x
10-6)
Freq
uenc
y C
hang
e (F
3/3,
Hz)
Time (min)
0.0
0.2
0.4
0.6
0.8
1.0
1.2
0 50 100 150 200 250-25
-20
-15
-10
-5
0
Dis
sipa
tion
valu
e (x
10-6)
Freq
uenc
y C
hang
e (F
3/3,
Hz)
Time (min)
0.0
0.2
0.4
0.6
0.8
1.0
1.2
Figure 8.2. Adsorption curves of silicone lubricant (0.1 % aqueous solution concentration) on polypropylene (black) and polyethylene (red) surfaces. The solid lines represent frequency change, while the dashed lines represent the change in dissipation factor.
Adsorption isotherms of the silicone lubricant
Five different silicone concentrations (in the range 0.001% - 10 %) were used in
adsorption experiments. The adsorbed mass before and after rinsing was plotted as a function of

202
lubricant concentration, as seen in Figure 8.3. In this figure the change in frequency registered in
the QCM was converted to effective adsorbed mass by using the Sauerbrey equation. The
changes in the reversible (total) adsorption were seen to depend linearly with the lubricant bulk
concentration. It is worth noting that the QCM not only detects the adsorbed mass, but also the
coupled water or any additional mass that might be loosely attached to the adsorbed layer. In the
case of the irreversibly adsorbed mass it is clearly seen that a saturation or plateau state is
reached with increased concentration. It can be argued that this state corresponds to an adsorbed
monolayer which could be model by a Langmuir-type isotherm. The surface density Γ of
adsorbed molecules can be expressed as a function of solute concentration in the aqueous phase,
c: with the Langmuir equation:
0( , )1
ii
i
Q bCX CbC
Γ =+
(Equation 8-1)
Langmuir isotherms for irreversible adsorbed mass on PP and PE surfaces are shown in
Figure 8.3. When compared to the adsorption isotherm on PE, the adsorption on PP can be
described as occurring with a higher affinity and saturation adsorption. In other words, the
silicone lubricant interacts more strongly with the PP than with the PE surfaces.

203
1E-3 0.01 0.1 1 10
0
500
1000
1500
2000
1E-3 0.01 0.1 1 100
100
200
300
400Γ
(Ads
orpt
ion
mas
s, n
g/cm
2 )
Concentration (w/v%) Figure 8.3. Adsorption isotherms of the silicone lubricant on PP (square) and PE (circle) surfaces. The solid and open symbols represent the adsorption mass before and after rinsing, respectively. The solid and dashed lines are the best fits to a langmurian type isotherm. The adsorbed mass was calculated from the measured QCM frequency change by using the Sauerbrey equation.
Hydrophobic forces in lubricant adsorption
Since it is expected that no reaction occurs between the (PE or PP) surface and the
(nonionic) silicone lubricant the observed adsorption is predicted to be physical in nature.
Therefore, attraction forces are proposed to be of the van de Waals type with also an important
contribution from hydrophobic effects.
The nature of the hydrophobic forces is still awaiting detailed elucidation from the
surface science community. Such forces were described by Israelachvili and Pashley in their
experiments 30-32 on the interaction forces between two cylindrical mica sheets at separation
204
distances less than 5 nm in 10-5 M cetyltrimethylammonium bromide (CTAB) solutions. At such
small separation distances, it was found that the experimentally measured forces were more
attractive than predicted by classic DLVO theory. This extra attractive force, termed by them as
hydrophobic force (Fh), was represented by a single exponential function as follows:
0 0/ exp( / )hF R C H D= − (Equation 8.2) where R is the mean radius of curvature of the interacting bodies, H the closest separation
between the two curved surfaces, Co is a pre-exponential factor, and Do is known as the decay
length.
Generally, depending on the magnitude of the decay lengths, hydrophobic forces may be
classified into short-, medium- or long- range forces. When the decay length lays in the range 1-2
nm, it is referred to as short-range hydrophobic force. If it is in the range 2-10 nm, it is referred
to as medium-range; while for distances in excess of 10 nm the force is referred to as long-range
force. Yoon and Ravishankar 33-35 also found that the decay length depended on the
hydrophobicity of the surface: below a “transition” regime for surfaces with WCA (water contact
angle) 90aθ ≈ ° , the hydrophobic forces were short-ranged and above this contact angle they
were described as long-ranged.
Even though, their findings are based on the inter-surface interactions, our previous
research on adsorption of nonionic polymer on hydrophobic surfaces also indicated that it also
applied to the interaction between surface and polymer. The water contact angle of the studied
PP and PE films were 103º and 95º, respectively. The differences in WCA can be explained by
the presence of -CH2- groups in PE while PP also contains lower surface energy -CH3 groups.

205
All in all, it is hypothesized that the larger contribution to the irreversible adsorption is from the
hydrophobic forces while van de Waals interactions are predominant in the reversible adsorption.
Unfortunately, exact information regarding the nature and composition of the commercial
silicone surfactant we used is not available. However, in textile processing it is known that
silicone nonpolar group provides the molecules with better performance 36-39, compared with
typical hydrocarbon surfactants. This group also leads to superior affinity to hydrophobic
surfaces, typical in some textile polymers.
Physisorption as a dominant effect in our experimental observations is very relevant to
textile processing. It is envisioned that typical lubricant molecules or finishes are not intended to
remain adsorbed on the surface of the fibers. A strong interaction would lead to lubricant layers
that would interfere with successive processes, including surface finishing and dyeing. While the
evidence presented here indicates that a very thin layer remains irreversibly adsorbed on the
surface of PE and PP other factors such as shear stress and the application of rinsing steps (with
solutions of different composition and ionic strength) could lead to important variations in the
surface chemistry of the treated surfaces. Such treatments should be a subject of future efforts.
Friction measured by LFM
When a tip in lateral force microscopy is sliding on a surface, lateral force profiles can be
measured both in air (no lubricant applied) and in solution. Figure 8.4 displays a line scan across
a polyethylene surface tested both in air and in the commercial silicone-based lubricant solution.
A static friction force was seen in Figure 8.4. It was known that when a tip starts to move
forward on a sample’s surface, there is a static friction force on the tip. The static friction force

206
was evident in the force profile imaged in air during the forward and the backward scanning.
However, when the tip was sliding on a surface coated with the lubricant solution, the high force
corresponding to the static friction disappeared and it was replaced by a regularly oscillating
force curve. As expected, the amplitude of force curve in the solution was much smaller than that
in air. That meant friction was reduced a large quantity by a boundary lubricant film of silicone
molecules.
-0.2
-0.1
0
0.1
0.2
0 20 40 60 80 100Surface Position (nm)
Late
ral F
orce
Sig
nal (
pA) Forward in air
Forward in LN336-100I
Backward in air
Backward in LN336-100I
Figure 8.4. Friction of PE film measured by LFM in air and after treatment of LN336-100I. Data courtesy of project member Yan (Vivian) Li, Cornell University.
Lubrication molecules adsorb on a surface with a well-defined configuration to form a
protective layer. The chemistry of the surface is changed. As we addressed in Chapter 1, the
thickness or the adsorption mass and structure of the adsorbed layer are crucial to the
performance of lubrication. In our case, it is expected that this silicone lubricant has better
lubrication performance on PP material than on PE material.

207
CONCLUSIONS
Silicone surfactants are attracting attention in application such as textile processing due to
their excellent surface activity, performance and low cost. In this study, the surface activity and
adsorption behavior on two hydrophobic surfaces of a commercial silicone surfactant was
investigated by using the QCM-D technique. Through this study, the following conclusions can
be draw: (1) Silicone surfactants are of superior surface activity, their surface tension can reach
values of ca. 30 mN/m. (2) The hydrophobic moiety of the silicone surfactant interacts with the
hydrophobic surface through hydrophobic forces, in such a way that high affinity isotherms are
observed. (3) The adsorption affinity was found to be related to the hydrophobicity of the surface,
the higher hydrophobicity of a surface, the higher the affinity with the silicone surfactants. (4)
The self assembled surfactant layer is expected to reduce the friction and prevent wear to some
extend in the condition of boundary lubrication.

208
REFERENCES
1. Christiano, S. P.; Fey, K. C., Silicone antifoam performance enhancement by nonionic surfactants in potato medium. Journal of Industrial Microbiology & Biotechnology 2003, 30, (1), 13-21. 2. Hill, R. M.; NetLibrary Inc., Silicone surfactants. Marcel Dekker: New York, 1999; p viii, 360 p. 3. O'Lenick, A. J., Silicone emulsions and surfactants. Journal of Surfactants and Detergents 2000, 3, (3), 387-393. 4. Grundke, K.; Michel, S.; Knispel, G.; Grundler, A., Wettability of silicone and polyether impression materials: Characterization by surface tension and contact angle measurements. Colloids and Surfaces a-Physicochemical and Engineering Aspects 2008, 317, (1-3), 598-609. 5. Haines, S. J.; Drake, J. M.; Chapman, P. H.; Hall, W. A.; Tashiro, Y., Bacterial adhesion to surfactant-modified silicone surfaces - Comments. Neurosurgery 2004, 54, (2), 490-491. 6. Jha, B. K.; Christiano, S. P.; Shah, D. O., Silicone antifoam performance: Correlation with spreading and surfactant monolayer packing. Langmuir 2000, 16, (26), 9947-9954. 7. Lin, L. H.; Wang, C. C.; Chen, C. W.; Chen, K. M., Water-repellency and antibacterial activities of plasma-treated cleavable silicone surfactants on nylon fabrics. Surface & Coatings Technology 2006, 201, (3-4), 674-678. 8. Somasundaran, P.; Mehta, S. C.; Purohit, P., Silicone emulsions. Advances in Colloid and Interface Science 2006, 128, 103-109. 9. Zhu, S.; Miller, W. G.; Scriven, L. E.; Davis, H. T., Superspreading of water-silicone surfactant on hydrophobic surfaces. Colloids and Surfaces a-Physicochemical and Engineering Aspects 1994, 90, (1), 63-78. 10. Gentle, T. E.; Snow, S. A., Adsorption of small silicone polyether surfactants at the air/water interface. Langmuir 1995, 11, (8), 2905-2910. 11. Hill, R. M., Silicone surfactants - new developments. Current Opinion in Colloid & Interface Science 2002, 7, (5-6), 255-261.
209
12. Kaneko, M.; Matsuzawa, K.; Uddin, M. H.; Lopez-Quintela, M. A.; Kunieda, H., Effect of hydrophobic chain length of amphiphilic silicone oil (copolymer) on the nonionic surfactant-layer curvature. Journal of Physical Chemistry B 2004, 108, (34), 12736-12743. 13. Kunieda, H.; Uddin, M. H.; Horii, M.; Furukawa, H.; Harashima, A., Effect of hydrophilic- and hydrophobic-chain lengths on the phase behavior of A-B-type silicone surfactants in water. Journal of Physical Chemistry B 2001, 105, (23), 5419-5426. 14. Kuo, P. L.; Hou, S. S.; Teng, C. K.; Liang, W. J., Function and performance of silicone copolymer (VI). Synthesis and novel solution behavior of water-soluble polysiloxanes with different hydrophiles. Colloid and Polymer Science 2001, 279, (3), 286-291. 15. Li, X.; Washenberger, R. M.; Scriven, L. E.; Davis, H. T.; Hill, R. M., Phase behavior and microstructure of water/trisiloxane E-6 and E-10 polyoxyethylene surfactant/silicone oil systems. Langmuir 1999, 15, (7), 2278-2289. 16. Lin, L. H.; Chen, K. M., Surface activity and water repellency properties of cleavable-modified silicone surfactants. Colloids and Surfaces a-Physicochemical and Engineering Aspects 2006, 275, (1-3), 99-106. 17. Neeyakorn, W.; Varma, M.; Jaye, C.; Burnette, J. E.; Lee, S. M.; Nemanich, R. J.; Grant, C. S.; Krim, J., Dynamics of vapor-phase organophosphates on silicon and OTS. Tribology Letters 2007, 27, (3), 269-276. 18. Neumann, B.; Vincent, B.; Krustev, R.; Muller, H. J., Stability of various silicone oil/water emulsion films as a function of surfactant and salt concentration. Langmuir 2004, 20, (11), 4336-4344. 19. Pandya, K. P.; Lad, K. N.; Bahadur, P., Silicone surfactants in aqueous solution .1. Surface activity and micellar behaviour. Tenside Surfactants Detergents 1996, 33, (5), 374-378. 20. Silas, J. A.; Kaler, E. W.; Hill, R. M., Effect of didodecyldimethylammonium bromide on the phase behavior of nonionic surfactant-silicone oil microemulsions. Langmuir 2001, 17, (15), 4534-4539. 21. Soni, S. S.; Sastry, N. V.; Aswal, V. K.; Goyal, P. S., Micellar structure of silicone surfactants in water from surface activity, SANS and viscosity studies. Journal of Physical Chemistry B 2002, 106, (10), 2606-2617. 22. Soni, S. S.; Sastry, N. V.; George, J.; Bohidar, H. B., Dynamic light scattering and viscosity studies on the association behavior of silicone surfactants in aqueous solutions. Journal of Physical Chemistry B 2003, 107, (22), 5382-5390.

210
23. Soni, S. S.; Sastry, N. V.; Joshi, J. V.; Seth, E.; Goyal, P. S., Study on the effects of nonelectrolyte additives on the phase, thermodynamics, and structural changes in micelles of silicone surfactants in aqueous solutions from surface activity, small angle neutron scattering, and viscosity measurements. Langmuir 2003, 19, (17), 6668-6677. 24. La Torre, C.; Bhushan, B.; Yang, J. Z.; Torgerson, P. M., Nanotribological effects of silicone type, silicone deposition level, and surfactant type on human hair using atomic force microscopy. Journal of Cosmetic Science 2006, 57, (1), 37-56. 25. Uddin, M. H.; Rodriguez, C.; Watanabe, K.; Lopez-Quintela, A.; Kato, T.; Furukawa, H.; Harashima, A.; Kunieda, H., Phase behavior and formation of reverse cubic phase based emulsion in water/poly(oxyethylene) poly(dimethylsiloxane) surfactants/silicone oil systems. Langmuir 2001, 17, (17), 5169-5175. 26. Yan, Y.; Hoffmann, H.; Drechsler, M.; Talmon, Y.; Makarsky, E., Influence of hydrocarbon surfactant on the aggregation behavior of silicone surfactant: Observation of intermediate structures in the vesicle-micelle transition. Journal of Physical Chemistry B 2006, 110, (11), 5621-5626. 27. Yao, B.; Yang, L., Equilibrium partition of polycyclic aromatic hydrocarbons in cloud point extraction with a silicone surfactant. Journal of Colloid and Interface Science 2008, 319, (1), 316-321. 28. Wang, A. F.; Jiang, L. P.; Mao, G. Z.; Liu, Y. H., Direct force measurement of silicone- and hydrocarbon-based ABA triblock surfactants in alcoholic media by atomic force microscopy. Journal of Colloid and Interface Science 2002, 256, (2), 331-340. 29. Wang, A. F.; Jiang, L. P.; Mao, G. Z.; Liu, Y. H., Direct force measurement of comb silicone surfactants in alcoholic media by atomic force microscopy. Journal of Colloid and Interface Science 2001, 242, (2), 337-345. 30. Israelachvili, J. N.; Pashley, R. M., Double-layer, van der Waals and hydrotion forces between surfaces in electrolyte-solutions. Hoppe-Seylers Zeitschrift Fur Physiologische Chemie 1981, 362, (9), 1178-1179. 31. Israelachvili, J.; Pashley, R., The hydrophobic interaction is long-range, decaying exponentially with distance. Nature 1982, 300, (5890), 341-342. 32. Pashley, R. M.; Israelachvili, J. N., DLVO and hydrotion force between mica sufaces in MG-2+, CA-2+, SR-2+, and BA-2+ chloride solutions. Journal of Colloid and Interface Science 1984, 97, (2), 446-455.
211
33. Yoon, R. H.; Ravishankar, S. A., Application of extended DLVO theory.3.Effect of Octanol on the long-range hydrophobic forces between Dodecylamine-coated mica surfaces. Journal of Colloid and Interface Science 1994, 166, (1), 215-224. 34. Yoon, R. H.; Ravishankar, S. A., Long-range hydrophobic forces between mica surfaces in alkaline dodecylammonium chloride solutions. Journal of Colloid and Interface Science 1996, 179, (2), 403-411. 35. Yoon, R. H.; Ravishankar, S. A., Long-range hydrophobic forces between mica surfaces in dodecylammonium chloride solutions in the presence of dodecanol. Journal of Colloid and Interface Science 1996, 179, (2), 391-402. 36. Dodd, M. M.; Sayers, E. A process for preparing a textile treatment auxiliary composition and a process for preparing a composition for the laundering and treatment of fabric. 2005-2548891749878, 20050805., 2007. 37. Inoue, A.; Yamada, I. Method of processing of fiber product with improved properties. 2001-1213242002115182, 20010419., 2002. 38. Schmidt, G., Silicone surfactants as auxiliary agents in textile processes. Revista de Quimica Textil 1994, 120, 28, 30-1. 39. Tian, W.-w.; Jia, X.-p.; Liu, Z.-d., Synthesis and application of silicones for textile. Jingxi Yu Zhuanyong Huaxuepin 2005, 13, (2), 4-8.
212
Chapter 9
Lubrication Studied by Lateral Force
Microscopy and Molecular Dynamic
Simulation
Yan Vivian Li and Hongyi Liu, from Cornell and NC State, respectively are
acknowledged for their contribution in this chapter.
213
ABSTRACT
In this chapter, lateral force microscopy (LFM) and Molecular Dynamic
Simulation (MDS) were employed to study boundary lubrication produced by the
adsorption of the polymers discussed in previous chapters. Friction coefficient after
treatment of nonionic polymers was measured on polypropylene (PP), polyethylene (PE)
and cellulose surfaces. Results indicated that: (1) The friction coefficient is reduced after
application of nonionic polymers on PP and PE surfaces, (2) The friction coefficients is
reduced with increased normal force, but after a threshold force, it increases sharply due
close physical contact. MDS results also confirmed that nonionic lubricants have a strong
affinity to hydrophobic PP and PE surfaces, while little affinity was observed in the case
of cellulose surface. These conclusions are in agreement with our adsorption data and
confirm our hypotheses. Finally, lubricant molecules between hydrophobic surfaces
under confinement were studied by using Molecular Dynamic Simulation (MDS). MDS
results illustrated how the hydrophobic moieties in lubricant chains approach to the
surface to eventually be adsorbed. Overall, LFM and MDS revealed the details about
lubricant molecules behavior and self-assembly on the surface to form a protective films
and change friction.

214
INTRODUCTION
Tribology in fiber processing cover issues related to friction during processing of fibers,
conversion of fibers and wovens and nonwovens into products, and handling of paper and textile
products. In all these cases boundary lubrication phenomena play important roles, even though
usually they are usually overlooked. Lubrication is most relevant in the boundary regime when
the amount of finish applied is low (~0.1 %) and, in most applications, the speed involved is
small. In boundary lubrication, the finish, usually only several molecular layers in thickness,
covers the fiber surface 1, 2. Thus the interaction between two sliding surfaces is governed at least
partially by the physicochemical properties of this adsorbed lubricant layer. Therefore, the
interaction involved during a friction process occurs at the molecular level. Accordingly, in order
to fully understand the boundary lubrication phenomena and determine the role of a finish
composition, the interaction between finish and fiber surface must be explored at such a level.
In previous chapters, the relation between affinity of lubricants and surfaces and their
chemical structure (mainly controlled by their hydrophobic length) was explored by quartz
crystal microbalance (QCM) and surface plasmon resonance (SPR). In this chapter, we will
discuss further the relation between lubrication performance and the involved chemical
structures (surface and adsorbing species). Techniques used included lateral force microscopy
(LFM), while the self-assembly of the layer of lubricants formed onto the surfaces were studied
by molecular dynamic simulation (MDS).
Lateral force microscopy (LFM) makes it possible to explore friction and wear at the
molecular level and to examine the effectiveness of a finishing treatment in modifying specific

215
behaviors on solid surfaces. LFM is based on scanning probe microscopy, and is one of the few
experimental methods capable of assessing forces at the single contact or atomic level. LFM has
been used extensively to study molecular lubrication phenomena on hard surfaces, such as mica,
silica, and graphite 3-5. Studies on polymer surfaces, relevant to fiber applications, however,
have been limited, primarily due to the fact that polymer surfaces deform easily, which adds
complexity to the experiment and to the interpretation of the data.
In the boundary regime, it is very difficult to determine the boundary conditions and fluid
properties by experimental measurement in the case of ultra-thin films. Furthermore, it is
expected that shear rates can be very high, beyond the values that can be accessed in laboratories.
Molecular dynamics simulation (MDS), however, have proved to be an indirect but efficient
method to investigate these complex systems at high shear rates and under extreme conditions 6, 7.
MDS gained rapid progress in recent years due to the advances in computer hardware and
algorithms developed to study polymers. MDS techniques include ab initio atomic level
simulation, mesoscopic treatment of polymers and polymer mixtures and macroscopic simulation.
In our case, MDS was employed to explore the interaction energy between lubricant molecules
and specific surfaces, and to study properties of lubricant films and their change under
confinement and shear. .
The experimental efforts in this part of our project were conducted by team members Yan
Vivian Li and Hongyi Liu, from Cornell and NC State Universities. Some of their results are
succinctly summarized here and put into the perspective of results of previous chapters.

216
EXPERIMENTAL
Adsorption measured by quartz crystal microbalance (QCM)
Adsorption experiments were conducted with the help of the quartz crystal microbalance
(QCM), as presented in Chapters 6 and 7. Here we attempt to relate these results with LFM and
MDS as follows.
Friction measured by Lateral Force Microscopy (LFM)
The principles of LFM were addressed in Chapter 1. In this investigation, a Scanning
Probe Microscopy (NTEGRA Prima, NT-MDT) with lateral force was employed to characterize
the performance of lubricant on three polymeric substrates (PP, PE and cellulose). All of the tests
were performed with a scanning velocity of 1Hz and a scanning size of 1 micron. Both
topography and phase images of the samples were collected simultaneously in the tapping mode
AFM. IN the case of topographic images, all images were 256×256 pixels size.
Molecular Dynamic Simulation
The program of Materials Studio® was used as a platform and the Amphous Cell model
was employed to simulate the lubricants behavior in confined and shear conditions. General
principles of these methodologies were addressed in Chapter 1. Furthermore, COMPASS 8
force-field was employed. Here the bonded terms of the potential energy function are quadratic
terms that describe the bond length and valence angles. Also a three-term Fourier transform for
torsion angles is used. For the non-bonded contributions, the van der Waals interactions were

217
calculated using a 9-12 Lennard-Jones function. Electrostatic interactions were accounted for
through a classical Coulomb potential; the charge equilibration method was used to calculate
charges for each atom. The cut-in and cutoff distances were fixed at 10 and 11 Å, respectively.
The minimum image convention was imposed in order not to duplicate nonbonded calculations.
The minimization procedure used the conjugate gradient scheme with the convergence
criterion of the root-mean-square of the atomic derivatives of 0.05 kcal mol-1Å-1. Molecular
dynamic calculations were based on the canonical NVT (constant Number of particles, Volume,
and Temperature) ensemble. The equations of motion were solved using the velocity Verlet 9
algorithm, with a time step of 1 fs.
Protocol construction
A sandwich-like layer with top and bottom solid walls (PP, PE, Cellulose) and lubricant
liquid layer in the middle were set up.
The protocol worked by imposing a user-defined velocity of 5m/s on the walls. The two
walls were sheared with an equal but opposite velocity in the x direction and they were held in a
fixed position in the z direction relative to one another by harmonic springs.
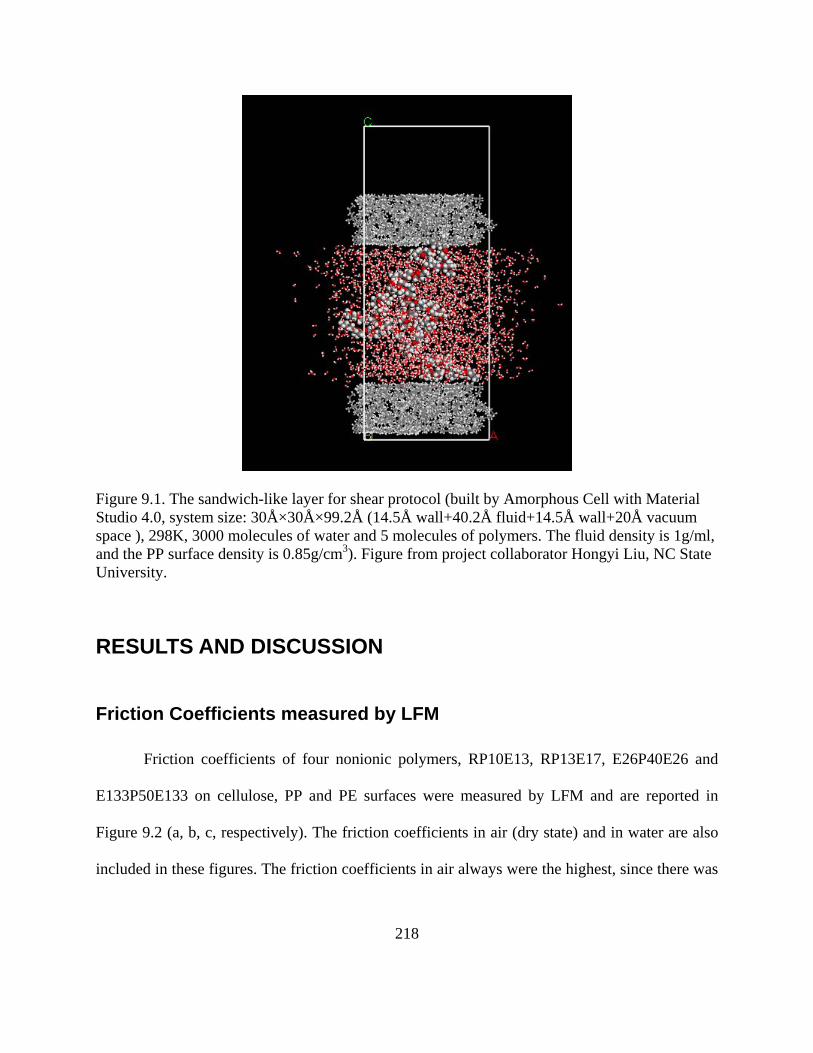
218
Figure 9.1. The sandwich-like layer for shear protocol (built by Amorphous Cell with Material Studio 4.0, system size: 30Å×30Å×99.2Å (14.5Å wall+40.2Å fluid+14.5Å wall+20Å vacuum space ), 298K, 3000 molecules of water and 5 molecules of polymers. The fluid density is 1g/ml, and the PP surface density is 0.85g/cm3). Figure from project collaborator Hongyi Liu, NC State University.
RESULTS AND DISCUSSION
Friction Coefficients measured by LFM
Friction coefficients of four nonionic polymers, RP10E13, RP13E17, E26P40E26 and
E133P50E133 on cellulose, PP and PE surfaces were measured by LFM and are reported in
Figure 9.2 (a, b, c, respectively). The friction coefficients in air (dry state) and in water are also
included in these figures. The friction coefficients in air always were the highest, since there was
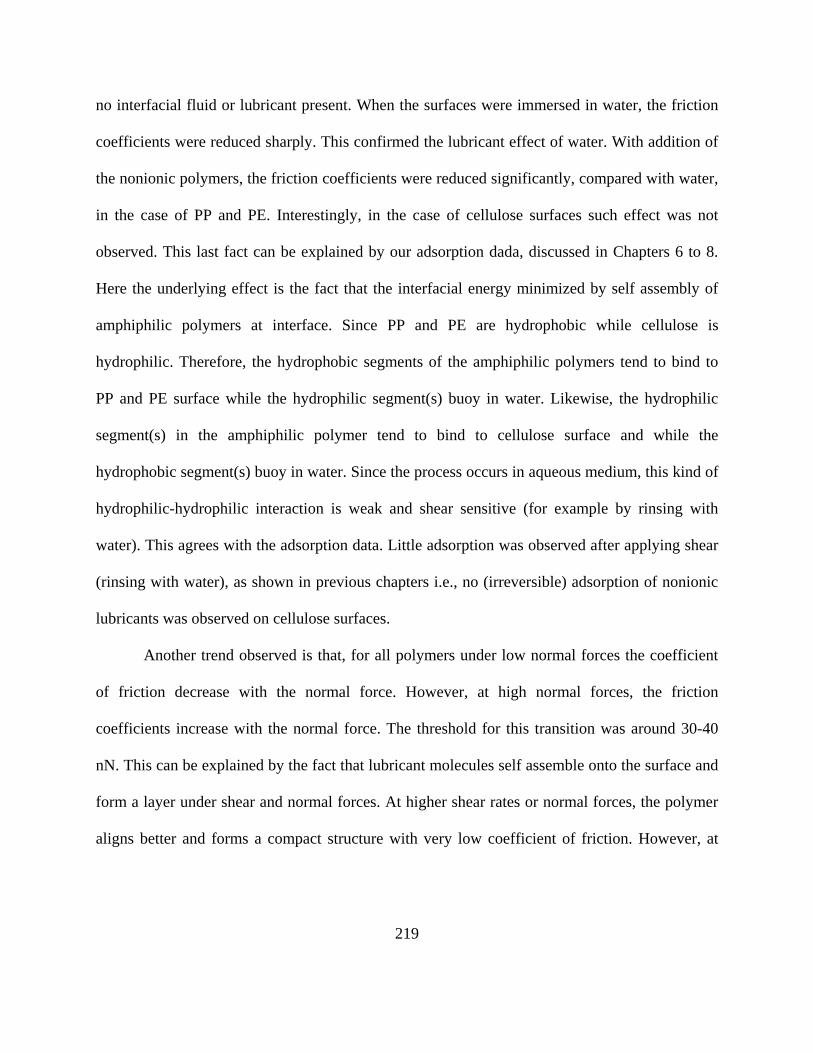
219
no interfacial fluid or lubricant present. When the surfaces were immersed in water, the friction
coefficients were reduced sharply. This confirmed the lubricant effect of water. With addition of
the nonionic polymers, the friction coefficients were reduced significantly, compared with water,
in the case of PP and PE. Interestingly, in the case of cellulose surfaces such effect was not
observed. This last fact can be explained by our adsorption dada, discussed in Chapters 6 to 8.
Here the underlying effect is the fact that the interfacial energy minimized by self assembly of
amphiphilic polymers at interface. Since PP and PE are hydrophobic while cellulose is
hydrophilic. Therefore, the hydrophobic segments of the amphiphilic polymers tend to bind to
PP and PE surface while the hydrophilic segment(s) buoy in water. Likewise, the hydrophilic
segment(s) in the amphiphilic polymer tend to bind to cellulose surface and while the
hydrophobic segment(s) buoy in water. Since the process occurs in aqueous medium, this kind of
hydrophilic-hydrophilic interaction is weak and shear sensitive (for example by rinsing with
water). This agrees with the adsorption data. Little adsorption was observed after applying shear
(rinsing with water), as shown in previous chapters i.e., no (irreversible) adsorption of nonionic
lubricants was observed on cellulose surfaces.
Another trend observed is that, for all polymers under low normal forces the coefficient
of friction decrease with the normal force. However, at high normal forces, the friction
coefficients increase with the normal force. The threshold for this transition was around 30-40
nN. This can be explained by the fact that lubricant molecules self assemble onto the surface and
form a layer under shear and normal forces. At higher shear rates or normal forces, the polymer
aligns better and forms a compact structure with very low coefficient of friction. However, at
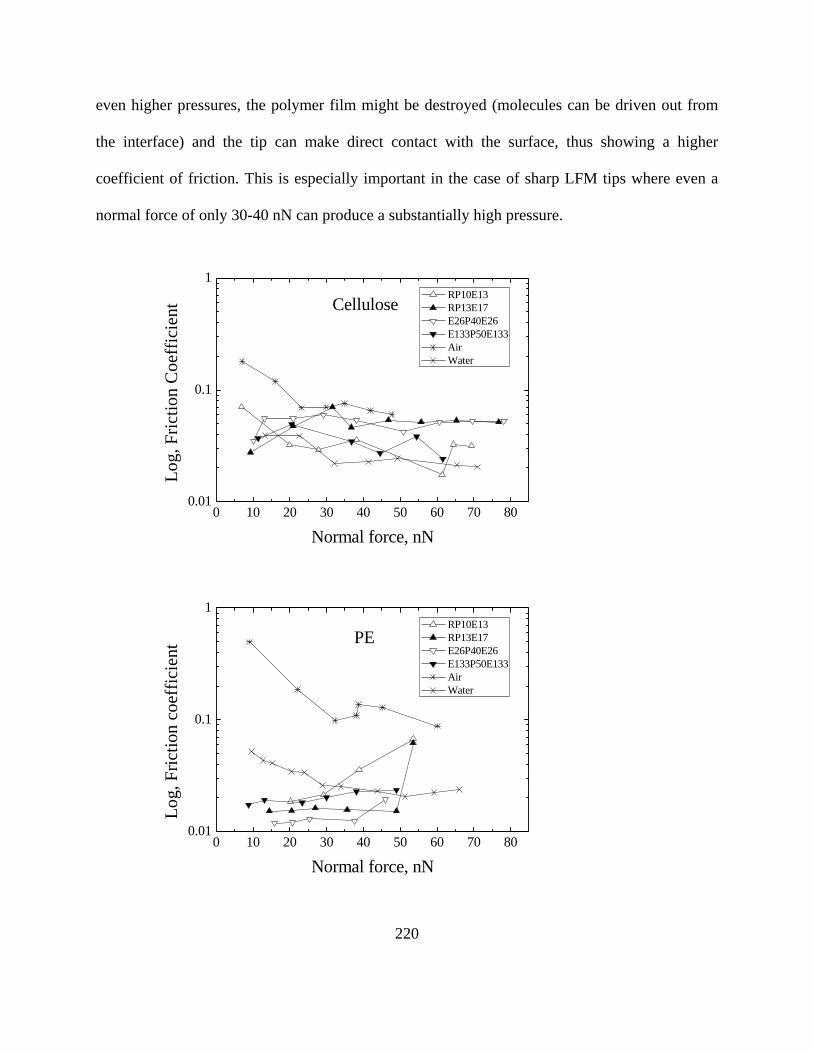
220
even higher pressures, the polymer film might be destroyed (molecules can be driven out from
the interface) and the tip can make direct contact with the surface, thus showing a higher
coefficient of friction. This is especially important in the case of sharp LFM tips where even a
normal force of only 30-40 nN can produce a substantially high pressure.
0 10 20 30 40 50 60 70 800.01
0.1
1
Cellulose
Log,
Fric
tion
Coe
ffic
ient
Normal force, nN
RP10E13 RP13E17 E26P40E26 E133P50E133 Air Water
0 10 20 30 40 50 60 70 800.01
0.1
1
PE
Log,
Fric
tion
coef
ficie
nt
Normal force, nN
RP10E13 RP13E17 E26P40E26 E133P50E133 Air Water

221
0 10 20 30 40 50 60 70 800.01
0.1
1
Log,
Fric
tion
coef
ficie
nt
Normal force, nN
RP10E13 RP13E17 E26P40E26 E133P50E133 Air Water
PP
Figure 9.2. The relationship of friction coefficient (COF) and normal force (Fn) on cellulose (a), polyethylene (b) and polypropylene (c) films in air, water and in the presence of four types of nonionic polymers. E: polyethylene oxide; P: polypropylene oxide; R: alkyl groups. Data from project collaborator Yan Vivian Li, Cornell University.
For the lubricants with different structures, unfortunately, no obvious trend can be
observed. This would require more carefully or sophisticated examination in terms of lubrication
performance and structure. However, the measured differences in friction coefficient for the
different surface morphologies of PP, PE, and cellulose surfaces confirmed that molecular self-
assembled structures were formed on the surface. These changes mainly depend on the chemical
natures of the surface and the fluid composition. In boundary lubrication, it is confirmed that
surface coatings of organized, molecular liquid films control friction and is expected to reduce
wear and abrasion in fiber processing.

222
Interaction energy between lubricant and surface simulated by MDS
In this investigation, interaction energies between nonionic polymers and PP, PE and
cellulose were calculated by MDS method. The interaction energies for propylene oxide (PO)
and ethylene oxide (EO) groups with PP, PE and cellulose were calculated separately and the
differences of interaction energies are given in Figure 9.3. Cellulose, PP and PE surfaces exhibit
similar attractive energies to PO groups, but quite different interaction energy with EO groups.
Therefore, the difference of interaction energy of PO and EO, which are key components of the
nonionic lubricants tested in this investigation, can be considered as the interaction of nonionic
lubricants to model surfaces. Cellulose showed negative attractive forces to nonionic lubricants,
this is supported by the insignificant adsorption and limited friction reduction observed in QCM
and LFM experiments, respectively. On the other hand, polypropylene and polyethylene showed
attractive forces to nonionic lubricants. This is also supported by results from adsorption and
friction experiments. It is noted that in Figure 9.3. PE had a slightly higher attractive interaction
with nonionic lubricants than PP, which is opposite to our results from adsorption experiment
presented Chapter 8.
MDS allowed us to model how a small lubricant in solution adsorbs on a surface. As an
illustration we use the case of hydrophobic PP in contact with polymer RP6E8, a very small
molecule, which has a hydrophobic head RP6 and a hydrophilic end E8. In this investigation,
two PP surfaces were constructed and then 2000 water molecules added to fiveRP6E8 molecules.
The temperature was set at 298K, and density of the solution assumed to be 1.0g/ml. The
simulation time scale was 100 ps and the initial state is shown in Figure 9.4. Polymer molecules

223
were distributed randomly in between the two surfaces (initial state). The simulation results are
shown in Figure 9.4b: It can be seen that the polymer molecules bind onto the two PP surfaces.
-4
-3
-2
-1
0
1
Inte
ract
ion
ener
gy, x
10-2
cal/m
2
Cellulose PP PE
PO EO Δ(PO,EO)
Figure 9.3. Interaction energies of propylene oxide (PO) and ethylene oxide (EO) groups and the interaction energy difference. The surfaces used were cellulose, polypropylene (PP) and polyethylene (PE). Data from project collaborator Hongyi Liu, NC State University.
Also, in Figure 9.4c a detailed image shows how the hydrophobic butyl group is adsorbed
on the hydrophobic PP surfaces. This agrees with our hypothesis that the hydrophobic forces are
the main driving force for adsorption of nonionic lubricants and self assembly on the tested
surfaces.

224
Initial state Equilibrium state
Zoom in
Initial state Equilibrium state
Zoom in
Figure 9.4. Simulation of adsorption behavior of RP6E8 molecules in water on PP surface. 2000 water molecules (red) and five RP6E8 molecules were placed in between the surfaces. The temperature was set at 298K, and the density of the solution assumed to be 1.0g/ml. The simulation time scale was 100 ps. Data from project collaborator Hongyi Liu, NC State University.
SUMMARY
In boundary lubrication, polymers and surfactants might form self-assembled molecular
structures on the surfaces. This process is driven by the molecular interactions with the surface
(of the fiber). These interactions appear to determine the alignment modes of the molecules of a
lubricant and hence its lubrication efficiency. From our simulation results, it is believed that
hydrophobic forces are the driving mechanism for adsorption. Lateral force microscopy was
effectively used in this research to measure friction. Molecular assemblies are expected to
control friction behavior of the lubricated surfaces. It is foreseen that understanding of the

225
molecular structure and conformation of the lubricant’s chemical compounds on a fiber surface
will serve as a fundamental guide for the formulation of improved finishes and fiber additives.
226
REFERENCES
1. Hamrock, B. J.; Schmid, S. R.; Jacobson, B. O.; NetLibrary Inc., Fundamentals of fluid film lubrication. 2nd ed.; Marcel Dekker: New York, 2004; p xiv, 699 p. 2. Luengo, G.; Israelachvili, J.; Granick, S., Generalized effects in confined fluids: New friction map for boundary lubrication. Wear 1996, 200, (1-2), 328-335. 3. Behary, N.; Ghenaim, A.; El Achari, A.; Caze, C., Tribological analysis of glass fibers using atomic force microscopy (AFM)/lateral force microscopy (LFM). Journal of Applied Polymer Science 2000, 75, (8), 1013-1025. 4. Breakspear, S.; Smith, J. R.; Campbell, S. A., AFM in surface finishing: Part III. Lateral force microscopy and friction measurements. Transactions of the Institute of Metal Finishing 2003, 81, B68-B70. 5. Yamanaka, K.; Tomita, E., Lateral force modulation atomic force microscope for selective imaging of friction forces. Japanese Journal of Applied Physics Part 1-Regular Papers Short Notes & Review Papers 1995, 34, (5B), 2879-2882. 6. Izumisawa, S.; Jhon, M. S., Calculation of disjoining pressure for lubricant films via molecular simulation. Ieee Transactions on Magnetics 2006, 42, (10), 2543-2545. 7. Kong, Y. C.; Tildesley, D. J.; Alejandre, J., The molecular dynamics simulation of boundary-layer lubrication. Molecular Physics 1997, 92, (1), 7-18. 8. Sun, H., COMPASS: an ab initio force-field optimized for condensed-phase applications-overview with details on alkane and benzene compounds. Journal of Physical Chemistry B 1998, 102, (38), 7338. 9. Omelyan, I. P.; Mryglod, I. M.; Folk, R., Optimized Verlet-like algorithms for molecular dynamics simulations. Physical Review E 2002, 65, (5).

227
Chapter 10
Summary of Conclusions and
Proposed Future Work
228
To summarize, this dissertation focused on the adsorption behavior of two
important classes of polymers: polyampholytes and nonionic copolymers. In both cases,
we investigated the relationship of chemical structures of the polymer (charge density of
polyampholytes and block size of the nonionic polymer) and their adsorption behavior by
using the quartz crystal microbalance with dissipation monitoring (QCM-D), surface
plasmon resonance (SPR), water contact angel (WCA), lateral force microscopy (LFM)
and molecular dynamics simulation (MDS) techniques.
QCM and SPR are non-invasive techniques that were used to monitor polymer
adsorption in situ and in real time. In order to employ QCM/SPR to monitor the adsorption
behavior, we first developed ultrathin films of cellulose, polypropylene (PP), polyethylene
(PE), nylon and polyester (PET) etc. typical paper and textile materials by using the spin
coating technique. Optimum operation conditions, such as polymer concentration,
spinning speed and temperature were documented, and the achieved model films were
characterized by atomic force microscopy (AFM) for morphology, ellipsometry for
thickness and contact angle for surface energy. Our results showed that films were
reproducible, uniform, and smooth. Their thickness was tunable through the polymer
concentration. The optimum thickness was found to be in the range of 20-50 nm in order to
attain good surface coverage and sensor sensitivity. These ultrathin model films facilitated
studies of adsorption and lubrication at the nano scale.
For the amphoteric polymers, the adsorption of four polyampholytes with charge
density ratios of 1:2:4:8 and two simple polyelectrolytes were monitored with the QCM-D

229
technique, both onto cellulose and silica surfaces. The silica surface carried much more
negative charge compared with that of the cellulose surface, at a given pH condition. It was
concluded that the charge properties of both substrates and polymers were dominant
factors for adsorption. Since the polyampholytes carry both weak base and weak acid
groups, their net charge depended on the solution pH conditions. At the iso-electric point
(IEP), the polyampholytes contracted, while far off their IEP, they showed a more
expanded conformation. The adsorption data revealed that:
(1) Polyampholytes adsorbed more extensively on silica and cellulose compared to
simple polyelectrolytes.
(2) The Adsorption mechanism was considered to be the result of a polarization
effect produced by the substrates, even for the polyampholytes at the IEP. The polarizing
ability of substrates determined the conformation of adsorbed layer and also the adsorbed
amount.
Polyampholytes tended to change their conformation, resulting in oppositely
charged groups in polyampholyte chains enriched in the inner layer while the charged
groups carrying the same charge type as the substrate was enriched in outer layers. This is
due to the fact that polarization effect of the substrate decays exponentially in the fluid
media. Therefore, for a low charge density surface and a low charge density polyampholyte,
a simple layer of adsorbed polymer was produced. The combination of a high charge
density surface and a high charge density polyampholyte enabled a stronger polarization
effect. Under this situation, the conformation of adsorbed layer tended to form multiple
230
layers. Since the polarization effect of the substrate decayed exponentially in the fluid
media, the conformation of the adsorbed multiple layers was much looser than that of inner
ones. This was evidenced by the rapid change of dissipation values of adsorbing
polyampholytes. The extension of adsorption and conformation of the adsorbed species
depended on a subtle balance of factors including charge properties of surfaces, charge
density of polyampholytes and pH of the aqueous medium.
Adsorption of nonionic polymers was investigated including diblock polyalkylene
glycols (PAGs) and triblock Pluronic polymers and also a special silicone surfactant.
Surfaces we investigated included hydrophilic cellulose, partially hydrophobic nylon and
PET and hydrophobic PP films. Conclusions that were drawn from this investigation
include:
(1) All the adsorption isotherms of nonionic polymers (diblock, triblock and
silicone polymer) were fitted successfully to a Langmuir isotherm. The strongly bonded
self assembled lubricant layer was able to bear normal pressures and also shear which
could align the adsorbed polymers into a well-defined structure to reduce the friction.
(2) The adsorption of nonionic lubrication onto the surfaces with different
hydrophobicity is controlled by the balance in surface energies. In an aqueous medium, the
nonionic (and amphiphilic) polymer prefers to adsorb onto a hydrophobic surface via its
hydrophobic moieties, leaving the hydrophilic groups extended into solution. This
produced a reduction in the interfacial energy between the substrate and solution and thus
made the system more stable. In aqueous condition, the amphiphilic polymers didn’t

231
adsorb tightly onto the hydrophilic surface due to the competition with water molecules.
(3) Hydrophobic forces were the dominant driving force for adsorption of nonionic
polymers. These forces were determined by both the hydrophobicity of the substrate and
hydrophobic moieties of the polymer. From our experiments it was evidenced that PP had
the largest adsorption amount of nonionic polymers, and nylon and PET were next. On the
other hand, no adsorption was observed on the cellulose surface.
(4) The molecular weight of the polymer is an important factor influencing
adsorption of the nonionic polymers.
(5) Compare with hydrocarbon-containing hydrophobic surfactants, silicone based
surfactants have a higher surface activity and have a higher affinity to hydrophobic
surfaces. That is one of the reasons why silicone lubricants were of superior lubrication
performance.
Future work can include but not limited to:
(1) To test the adsorption behavior and friction reduction performance at the
nanoscale for more lubricants, such as fatty acid, mineral oils and small
molecular ionic lubricants with different chemical structures.
(2) To study a more complicated lubricant system, which is composed of more than
one key component, to see how the layer of polymer adsorbs, and to explore the
optimum ratio of each component where the best performance is obtained.
(3) To test the stability of lubricant films to see the normal shear range where the
232
lubricant is able to provide protection to substrates.
(4) To test the stability of lubricant films in the presence of small molecules, such
as alcohols and acids.
(5) To uncover the function of water molecules in boundary lubrication.
(6) To relate friction at nanoscale or micro-scale to the actual macro-scale friction.
This requires evaluation in an actual friction experiment involving fiber/fiber
and fiber/metal or ceramic at the macro-scale.

ii
BIOGRAPHY
The author was born on May 6, 1974 in Yongchuan, Chongqing, People’s Republic of China.
He grew up in his hometown until Fall 1994 when he joined Beijing Forestry University,
Beijing. He obtained a Bachelor degree in Chemical Engineering in 1998 and a Masters
degree in Pulp and Paper Science in 2001, from the same institution and department. After
graduation, he worked as a process engineer for China International Engineering Co. Ltd
(China BCEL) for three years. In July, 2004, he came to Raleigh to join the Ph.D. program in
the Department of Wood and Paper Science in North Carolina State University.
He married Hongyan Li in 2004 and they have a one year old daughter, Cindy.

iii
ACKNOWLEDGMENTS
The author is immeasurably indebted to his major advisor, Dr. Orlando J. Rojas for his
mentorship, advice and constructive criticism throughout the course of this research.
Special thanks are also extended to Ph.D. committee members, Drs. Martin A. Hubbe,
Dimitris S. Argyropoulos and Kirill Efimenko. Drs. Juan P. Hinestroza, Tom Theyson and
Wendy Krause, are appreciated for giving valuable advice and ideas.
The author also wants to express his appreciation to Yun Wang, Yan Vivian Li and Hongyi
Liu for warm discussions and for sharing thoughts and experiences. He is also in debt with
all his colleagues and friends in the Department of Wood and Paper Science, for their
assistance and encouragement and especially to the “Colloid and Interfaces” group members
with whom many memorable experiences inside and outside the university where shared.
Finally, the author would like to state his appreciation to the US Department of Agriculture
and the National Textile Center for funding the “polyampholytes” and the “boundary
lubrication” projects, respectively.

iv
TABLE OF CONTENTS
List of Tables…………………………………………………………………………….....ix
List of Figures………………………………………………………………………………....x
Chapter 1 Background …………………………………………………………………..……1
Introduction………………………………………………………………………………2
Polyampholytes in papermaking…………………………………………………………4
Lubrication and tribology in textile processing………………………………………….8
Lubrication phenomena…………………………………………………………….9
Thin film lubrication………………………………………………………………15
Techniques to study thin films and lubrication phenomena………………………19
Methods used in this research……………………………………………………..22
Applications of SPR and QCM to Study Lubricant Films………………………...28
Lateral force microscopy and molecular dynamic simulation…………………….37
Summary………………………………………………………………………………..47
References………………………………………………………………………………49
Chapter 2 Polymer Systems studied and General Hypotheses……………………….……...58
Chapter 3 Development and Characterization of Polymer Films Relevant to Fiber Surfaces ……………………………………………………………………………...………65
Abstract…………………………………………………………………………………66 Introduction……………………………………………………………………………..67 Experimental……………………………………………………………………………69
Materials………………………………………………………………………..…69

v
Methods……………………………………………………………………………69
Results and Discussion…………………………………………………………………75
AFM topography and RMS (roughness)………………………………………….75 Contact angle……………………………………………………………………...76 Thickness………………………………………………………………………….77 X-ray photoelectron spectroscopy………………………………………………...78
Spin Coating as a Platform for the Manufacture of Model Films……………….85
Model surfaces as a platform for adsorption………………………………………87
Summary………………………………………………………………………………..88
References………………………………………………………………………………90
Chapter 4 Bulk Properties of Amphoteric and Nonionic Polymers……………………….....92
Abstract…………………………………………………………………………………93 Introduction……………………………………………………………………………..94 Experiment……………………………………………………………………………...94
Materials…………………………………………………………………………..94 Methods……………………………………………………………………………98
Results and discussion………………………………………………………………….99
Bulk properties of polyampholytes…………………………………………...…...99 Bulk properties of nonionic lubricants………………………………………...…105
Conclusions……………………………………………………………………………109 References…………………………………………………………………………….110

vi
Chapter 5 Adsorption of Polyampholytes on Solid Surfaces Measured by the QCM Technique……………………………………………………………………………….......111
Abstract………………………………………………………………………………..112 Introduction……………………………………………………………………………113 Experimental…………………………………………………………………………..114
Viscosity measurement…………………………………………………………..117 Radius of gyration measurement………………………………………………...117 Cellulose thin films………………………………………………………………118 QCM-D measurements…………………………………………………………..118
Results and Discussion………………………………………………………………..119
Polyampholyte adsorption on silica surfaces…………………………………….119 Adsorption of polyampholytes on cellulose surface……………………………..134
Conclusions……………………………………………………………………………137 References……………………………………………………………………………..139
Chapter 6 Adsorption of Lubricants on PET surfaces………………………………….......143
Abstract………………………………………………………………………………..144 Introduction……………………………………………………………………………145 Experimental…………………………………………………………………………..146
Methods………………………………………………………………………….148
Results and Discussion………………………………………………………………..150
Adsorption of Nonionic Lubricant Polymers……………………………………150

vii
Effect of Lubricant Type on Adsorption…………………………………………159 Contact angle-and surface assembly……………………………………………..167
Conclusions……………………………………………………………………………169 References……………………………………………………………………………..171
Chapter 7 Adsorption of Nonionic Polymers on Cellulose, Polypropylene, Nylon and PET Surfaces ……………………………………………………………………….....................173
Abstract………………………………………………………………………………..174 Introduction……………………………………………………………………………175 Experimental…………………………………………………………………………..176
Methods…………………………………………………………………………..177
Results and discussion………………………………………………………………...178
Adsorption experiments………………………………………………………….178 Effect of the nature of surfaces on polymer adsorption………………………….182 Contact angle- and polymer assembly…………………………………………...187
Conclusions……………………………………………………………………………189 References……………………………………………………………………………..190
Chapter 8 Adsorption of Silicone-based Surfactants……………………………………….191
Abstract………………………………………………………………………………..192 Introduction……………………………………………………………………………193 Experimental…………………………………………………………………………..195
Materials…………………………………………………………………………195 Methods………………………………………………………………………….195

viii
Results and discussion………………………………………………………………...198
Adsorption of silicone surfactant on polymeric surfaces………………………..199 Adsorption isotherms of the silicone lubricant…………………………………..201 Hydrophobic forces in lubricant adsorption……………………………………..203 Friction measured by LFM………………………………………………………205
Conclusions……………………………………………………………………………207 References……………………………………………………………………………..208
Chapter 9 Lubrication Studied by Lateral Force Microscopy and Molecular Dynamic Simulation …………………………………………………………………….....................212
Abstract………………………………………………………………………………..213 Introduction……………………………………………………………………………214 Experimental…………………………………………………………………………..216
Adsorption measured by quartz crystal microbalance (QCM)…………………..216 Friction measured by Lateral Force Microscopy (LFM)………………………...216 Molecular Dynamic Simulation………………………………………………….216
Results and Discussion………………………………………………………………..218
Friction Coefficients measured by LFM…………………………………………218 Interaction energy between lubricant and surface simulated by MDS…………..222
Summary………………………………………………………………………………224 References……………………………………………………………………………..226
Chapter 10 Summary of Conclusions and Proposed Future Work ……………………...…227

ix
LIST OF TABLES
Table 1.1. Comparison between QCM and SPR techniques (*)………………………….….22 Table 3.1. Characterizations of model surfaces……………………………………………...77 Table 3.2. Comparison of the chemical composition from XPS and theoretical value….......85 Talbe 4.1. Synthesis of acrylamide-based polyampholytes and simple copolymers………..97 Talbe 4.2. Structure information of PAGs and Pluronics……………………………………98 Talbe 4.3. The maximum surface excess and area for each molecule calculated from Gibbs adsorption isotherm………………………………………………………………………...108 Table 5.1. Acrylamide-based polyampholytes (PAmp 2, 4, 8 and 16) and simple polyelectrolytes (Cat and An). Note that in the case of the polyampholytes the %mol ratio cationic:anionic groups was kept constant at 5:4 and the molecular weight was approximately the same for all polymer samples…………………………………………………………..117 Table 6.1. Structural information of polyalkylene glycols (PAGs) and Pluronics…………147 Table 6.2. Langmuir fitting parameters for adsorption curves of nonionic lubricants on PET surface after rinsing (irreversible adsorption)………………………………………………160 Table 6.3. BET fitting parameters for adsorption curves of nonionic lubricants on PET surface after rinsing (irreversible adsorption)……………………………………………....160 Table 6.4. Calculated hydrophobic numbers for tested nonionic polymers………………. 166 Table 7.1. Structural information of polyalkylene glycols (PAGs) and Pluronics…………176 Table 7.2. Langmuir parameters for (irreversible) adsorption isotherms of nonionic polymers on PP, nylon and PET surfaces (no adsorption was observed on cellulose surfaces)……. .184

x
LIST OF FIGURES
Figure 1.1. Polymer adsorption onto surfaces from solution. D is the thickness of adsorbed polymer layer………………………………………………………………………………….3 Figure 1.2. Wet strength of paper treated with xanthated starch amine (XSA) having various tertiary amine and xanthate degrees of substitution (DS). The paper samples were prepared from unbleached kraft furnish treated with 3% XSA, oven dry pulp basis, at pH 7.0. Figure redrawn from reference 32…………………………………………………………………....6 Figure 1.3. Effect of macromolecular composition and pH on the tensile strength of polymer-treated bleached kraft fibers at 1000 µS/cm conductivity 25. Structures of polymers denoted as “PAmp 2, 4, 8, 16”, “Cat” and “An” can be seen with more detail in Chapter 3)…………7 Figure 1.4. Stribeck curve, displaying the different regimes of lubrication. Figure Redrawn from original source of Stribeck curve 40…………………………………………………...11 Figure 1.5. Proposed generalized friction map of effective viscosity plotted against shear rate. Figure redrawn from reference 42…………………………………………………………...13 Figure 1.6. Proposed generalized friction map friction force plotted against sliding velocity. Figure redrawn from reference 42…………………………………………………………...14 Figure 1.7. Proposed generalized friction map of friction force plotted against load. Figure redrawn from reference 42…………………………………………………………………..15 Figure 1.8. Schematic diagram of how the effective viscosity, elasticity and relaxation change with thickness of a lubricant film. Figure redrawn from reference 41………………16 Figure 1.9. Lubricant molecules organized by shear. Figure redrawn from reference 49…..18 Figure 1.10. Schematics of surface plasmon resonance, from Ref. 89………………………23 Figure 1.11. QCM sensor (a) and schematic principle of QCM……………………………..25 Figure 1.12. Time-dependent frequency change of QCM for EM and AF adsorbed on QCM crystal at 200 °C. From reference 93………………………………………………………...30 Figure 1.13. Change in frequency for 5 MHz Si crystals upon injection of OTS (10 mM). The arrow indicates injection time. Insert is an enlargement of the region indicated by the box, to show the stability level. Figures from reference 7…………………………………………..31

xi
Figure 1.14. ΔD-Df profiles for polyampholyte adsorption on silica surfaces. The low charge density polyampholite (PAmp4) consisted of 5% cationic and 4% anionic groups while the high charge density polyampholyte (PAmp16) contained 20% of cationic and 16% anionic groups. The “cationic” polymer had a charge density of 5% (cationic groups)……………..33 Figure 1.15. ΔD-Df profile of nonionic lubricants E76P29E76 and E37P65E37 as they adsorb onto PET surfaces before rinsing………………………………………………….....34 Figure 1.16. Comparison of adsorption kinetics of a perfluoropolyether lubricant (Fomblin ZDOL) on silver surfaces as measured by SPR and QCM . Figure from reference 84……...35 Figure 1.17. Decoupling water content through the combination of QCM and SPR measurements. The polymer used in this experiment is a cationic polyamide, with molecular weight of ca. 3 millions. Coupled water determined by this method was found to be 25%....37 Figure 1.18. Schematic of lateral force microscopy and twisting and bending motions acting on the cantilever……………………………………………………………………………...39 Figure 1.19. Lateral deflection of the cantilever from changes in surface friction (top) and from changes in slope (bottom)...............................................................................................40 Figure 1.20. One line scanning profiles for the cellulose coated surface both in a Pluronic lubricant (E19P29E19, see Chapter 3 for detail) solutions and in air. P65 is the symbol of lubricant E19P29E19, which is a triblock copolymer with 19 EO groups at both ends and 29 PO groups in the middle. P65-1~P65-5 represent a series of ethanol solutions with the increase of ethanol concentration. Data contributed by project member Yan (Vivian) Li, from Cornell University……………………………………………………………………………41 Figure 1.21. Sandwich-like layer to study the effect of shear in MDS. Top and bottom layers are Fe. Lubricant used was octane, C8H18, which can be seen between the two surfaces. The shear velocity for the two solid surfaces was set to 5 m/s. MDS results contributed by project member Hongyi Liu, from NC State…………………………………………………………42 Figure 1.22. Animation of shear process for lubricant octane confined between two Fe surfaces. Shear velocity applied on both solid surfaces was 5 m/s. MDS results contributed by project member Hongyi Liu, from NC State……………………………………………..44 Figure 1.23. Average density distribution (a) and velocity profile (b) of octane between two Fe surfaces. Shear velocity applied at both solid surfaces was set to 5 m/s. MDS results contributed by project member Hongyi Liu, from NC State………………………………...45

xii
Figure 1.24. Temperature profile of octane between two Fe surfaces. Shear velocity applied at both solid surfaces was set to 5 m/s. MDS results contributed by project member Hongyi Liu, from NC State…………………………………………………………………………...46 Figure 2.1. Conformation of adsorbed polymers at interfaces for (a) homopolymers, (b) end-functionalized homopolymers, (c) Block polymers, and (d) polyampholytes……………….60 Figure 3.1. AFM images of model films of (a) cellulose, (b) PP, (c) PE, (d) Nylon and (E) PET on silica wafers. Scanning size was 20 x 20 m for (d) and 2 x 2 m for the rest…...76 Figure 3.2. XPS survey spectra for bare PP (a) and PE (b) films. Detail spectra (inset) for C1s BE region are included in each figure…………………………………………………..80 Figure 3.3. XPS spectra of cellulose model films (top). Detailed C1s spectra (bottom)…….83 Figure 3.4. XPS spectra of model (a) Nylon and PET (b) films. Detailed C1s spectra are seen in the insets…………………………………………………………………………………..84 Figure 3.5. Ellipsometric thicknesses of PP films obtained after different sequence times (larger sequence number indicates longer time and therefore larger )……………………... 87 Figure 3.6. Adsorption of a nonionic polymer (lubricant) (E37P56E37) on various model films . Adsorption isotherm was obtained by using the QCM-D technique………………... 88 Figure 4.1. Molecular composition of monomers in random polyampholytes prepared by free-radical polymerization (DMAPAA, IA and AM)………………………………………96 Figure 4.2. Chemical structure of PAGs (a) and Pluronics (b)………………………………97 Figure 4.3. Viscosity of polyampholytes (a) and viscosity changes against % charged groups of polyampholytes and simple polyelectrolytes (b)………………………………………...100 Figure 4.4. Viscosity for simple polyelectrolytes Cat and An (see Table 4-1)……………..101 Figure 4.5. Relative viscosity of polyampholytes with salt (ionic strength = 0.01M )……..102 Figure 4.6. Relative viscosity of polyampholytes measured at pH 4 (a), pH 5 (b), and pH 8.5(c) after applying Poly aluminum chlorohydrate (PAC)………………………………...103 Figure 4.7. Effects of polyampholyte charge density and PAC addition on relative viscosities at (a) pH=4 and (b) pH=5…………………………………………………………………..104

xiii
Figure 4.8. The radius of gyration of PAmp4 at different pH conditions…………………..105 Figure 4.9. Surface tension and CMC determination for bi-block polymer PAGs (a) and tri-block polymer Pluronics (b)………………………………………………………………..107 Figure 4.10. Surface tension and CMC for the silicone surfactant LN336-100I…………..107 Figure 5.1. Molecular composition of monomers in random polyampholytes prepared by free-radical polymerization (DMAPAA, IA and AM)……………………………………..116 Figure 5.2. Frequency (top) and Energy dissipation change (bottom) curves for polyampholytes PAmp2, PAmp4, PAmp8 and PAmp16 as well as simple polyelectrolytes Cat and An at pH 4………………………………………………………………………….121 Figure 5.3. Frequency (top) and Energy dissipation change (bottom) curves for polyampholytes PAmp2, PAmp4, PAmp8 and PAmp16 as well as simple polyelectrolytes Cat and An at pH 7………………………………………………………………………….122 Figure 5.4. Frequency (top) and Energy dissipation change (bottom) curves for polyampholytes PAmp2, PAmp4, PAmp8 and PAmp16 as well as simple polyelectrolytes Cat and An at pH 10………………………………………………………………………...124 Figure 5.5. Comparison of thickness calculated by Sauerbrey and Voigt models for low (PAmp2, left) and high (PAmp8, right) charge density polyampholytes…………………..128 Figure 5.6. ΔD-Δf profile during adsorption on silica of polyampholytes and polyelectrolytes……………………………………………………………………………. 130 Figure 5.7. Frequency change for different polyelectrolytes after reaching adsorption equilibrium………………………………………………………………………………….132 Figure 5.8. Illustrative chart with the net charge of surfaces and polymers at different pH and indication of dominant electrostatic interactions between surfaces and polymers…………133 Figure 5.9. Polymer adsorption isotherms for cellulose substrates as measured by frequency (top) and, dissipation (b) changes with time……………………………………………….135 Figure 5.10. ΔD-Δf profile during adsorption on celluylose of polyampholytes and polyelectrolytes……………………………………………………………………………..136 Figure 6.1. Chemical structure of polyalkylene glycols (PAGs) (left) and Pluronics (right)……………………………………………………………………………………… 147

xiv
Figure 6.2. Typical QCM f and D curves for an adsorbing nonionic polymer. Polymer sample was E76P29E76 in 0.0001% aqueous solution. Frequency (f) change (left axis) and dissipation (D) change (right axis) for three overtones (3, 5, 7) were recorded simultaneously. Flow rate was constant 0.1 ml/min…………………………………………………………152 Figure 6.3. Equilibrium adsorption isotherms for nonionic lubricants adsorbed on PET surfaces at 25 °C before (a) and after (b) rinsing measured by QCM. The flow rate was constant at 0.1 ml/min………………………………………………………………………154 Figure 6.4. Equilibrium adsorption isotherms for nonionic lubricants adsorbed on PET surfaces at 25 °C before (a) and after (b) rinsing measured by SPR. The flow rate was kept constant at 0.1 ml/min………………………………………………………………………155 Figure 6.5. Equilibrium adsorption isotherms for nonionic lubricants adsorbed on PET surfaces expressed by mol/m2. The data converted from Figure 6.3………………………156 Figure 6.6. D and f curves to study the conformation of adsorbed nonionic diblock polyakylene glycols (a) and triblock Pluronics (b) on PET surfaces………………………158 Figure 6.7. Fitted Langmuir parameters b and Q0 as a function of the lubricant type…….161 Figure 6.8. Fitted Langmuir parameters change with molecular weight (MW). Highly dependency of maximum adsorption density on MW can be observed……………………162 Figure 6.9. Fitted Langmuir parameters as a function of polymer’s HLB values………….163 Figure 6.10. Fitted Langmuir parameters change as a function of polymer’s hydrophobic number……………………………………………………………………………………...166 Figure 6.11. Contact angle changes for PET surfaces before and after (overnight) treatment with 1% nonionic polymer solutions followed by rinsing with mini-Q water and drying with nitrogen…………………………………………………………………………………….168 Figure 6.12. Proposed illustration for the adsorption of diblock and triblock nonionic polymers. Black segments represent the hydrophilic block of the polymer while the green segments represent the hydrophobic block of the polymer chains………………………...169 Figure 7.1. Chemical structure of polyalkylene glycols (PAGs) (left) and Pluronics (right)……………………………………………………………………………………….176

xv
Figure 7.2. Adsorption isotherms for nonionic polymers adsorbed on polypropylene surfaces. The polymer solution flow rate was kept constant at 0.1 ml/min…………………………..180 Figure 7.3. Adsorption isotherms for nonionic polymers adsorbed on nylon surfaces. The polymer solution flow rate was kept constant at 0.1 ml/min……………………………….180 Figure 7.4. Adsorption isotherms for nonionic polymers adsorbed on PET surfaces. The polymer solution flow rate was kept constant at 0.1 ml/min……………………………….181 Figure 7.5. Adsorption isotherms for nonionic polymers adsorbed on polypropylene surfaces expressed by mol/m2. The data converted from Figure 7.2………………………………..181 Figure 7.6. Adsorption isotherms for nonionic polymers adsorbed on nylon surfaces expressed by mol/m2. The data converted from Figure 7.3……………………………......182 Figure 7.7. Adsorption isotherms for nonionic polymers adsorbed on PET surfaces expressed by mol/m2. The data converted from Figure 7.4…………………………………………...182 Figure 7.8. (a) Maximum adsorption density for different polymer types adsorbing on model surfaces. (b)Affinity constant for different polymers and surfaces. The charts are plotted with increased order of polymer molecular weight and hydrophobic number, respectively. Note that the molecular weight and hydrophobic numbers are indicated in the respective charts.………………………………………………………………………………………………186 Figure 7.9. Water contact angle for PP, nylon and PET surfaces before (CTRL) and after treatment with 1% lubricant solutions (adsorption allowed overnight at 25 °C)…………...188 Figure 8.1. Surface tension of the silicone lubricant used in this investigation…………….199 Figure 8.2. Adsorption curves of silicone lubricant (0.1 % aqueous solution concentration) on polypropylene (black) and polyethylene (red) surfaces. The solid lines represent frequency change, while the dashed lines represent the change in dissipation factor…………………201 Figure 8.3. Adsorption isotherms of the silicone lubricant on PP (square) and PE (circle) surfaces. The solid and open symbols represent the adsorption mass before and after rinsing, respectively. The solid and dashed lines are the best fits to a langmurian type isotherm. The adsorbed mass was calculated from the measured QCM frequency change by using the Sauerbrey equation…………………………………………………………………………203 Figure 8.4. Friction of PE film measured by LFM in air and after treatment of LN336-100I. Data courtesy of project member Yan (Vivian) Li, Cornell University……………………206

xvi
Figure 9.1. The sandwich-like layer for shear protocol (built by Amorphous Cell with Material Studio 4.0, system size: 30Å×30Å×99.2Å (14.5Å wall+40.2Å fluid+14.5Å wall+20Å vacuum space ), 298K, 3000 molecules of water and 5 molecules of polymers. The fluid density is 1g/ml, and the PP surface density is 0.85g/cm3). Figure from project collaborator Hongyi Liu, NC State University……………………………………………..218 Figure 9.2. The relationship of friction coefficient (COF) and normal force (Fn) on cellulose (a), polyethylene (b) and polypropylene (c) films in air, water and in the presence of four types of nonionic polymers. E: polyethylene oxide; P: polypropylene oxide; R: alkyl groups. Data from project collaborator Yan Vivian Li, Cornell University………………………...222 Figure 9.3. Interaction energies of propylene oxide (PO) and ethylene oxide (EO) groups and the interaction energy difference. The surfaces used were cellulose, polypropylene (PP) and polyethylene (PE). Data from project collaborator Hongyi Liu, NC State University…….223 Figure 9.4. Simulation of adsorption behavior of RP6E8 molecules in water on PP surface. 2000 water molecules (red) and five RP6E8 molecules were placed in between the surfaces. The temperature was set at 298K, and the density of the solution assumed to be 1.0g/ml. The simulation time scale was 100 ps. Data from project collaborator Hongyi Liu, NC State University…………………………………………………………………………………..224