Embed Size (px)
Citation preview
Copyright © 2011 John Wiley & Sons, Inc. Kimmel, Accounting, 4/e, Solutions Manual (For Instructor Use Only) 18-1
CHAPTER 18
Cost-Volume-Profit
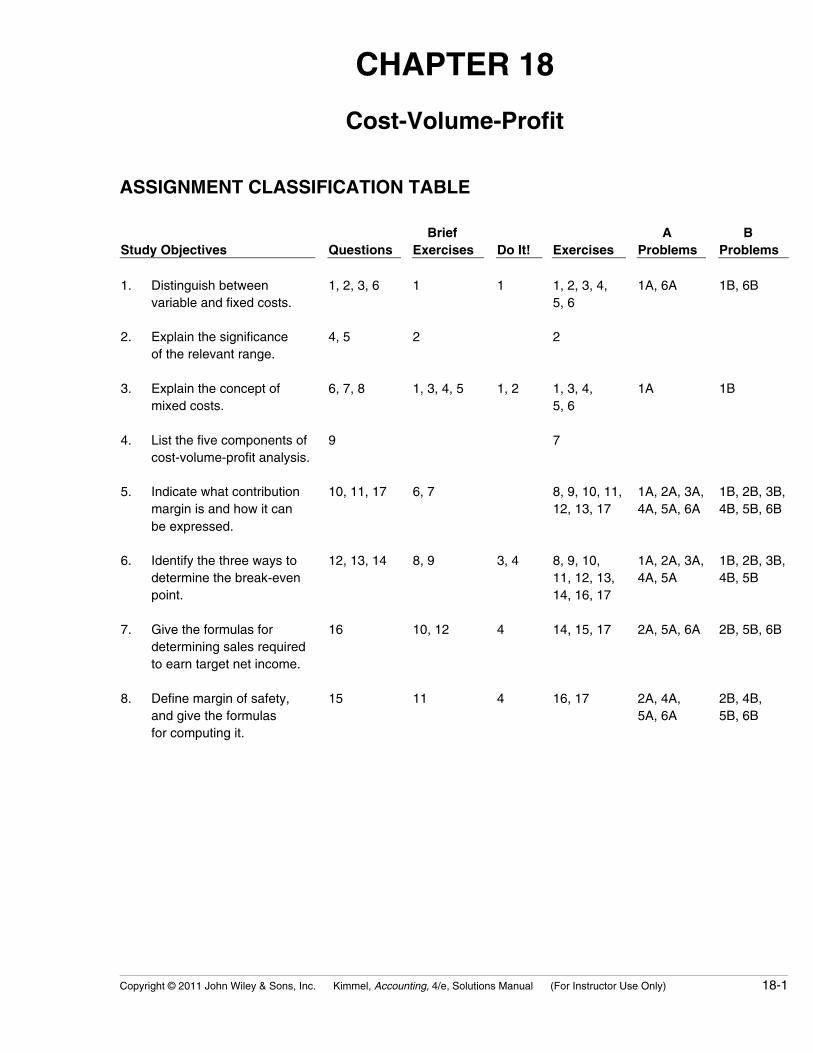
ASSIGNMENT CLASSIFICATION TABLE
Study Objectives QuestionsBrief
Exercises Do It! ExercisesA
ProblemsB
Problems
1. Distinguish betweenvariable and fixed costs.
1, 2, 3, 6 1 1 1, 2, 3, 4,5, 6
1A, 6A 1B, 6B
2. Explain the significanceof the relevant range.
4, 5 2 2
3. Explain the concept ofmixed costs.
6, 7, 8 1, 3, 4, 5 1, 2 1, 3, 4,5, 6
1A 1B
4. List the five components ofcost-volume-profit analysis.
9 7
5. Indicate what contributionmargin is and how it canbe expressed.
10, 11, 17 6, 7 8, 9, 10, 11,12, 13, 17
1A, 2A, 3A,4A, 5A, 6A
1B, 2B, 3B,4B, 5B, 6B
6. Identify the three ways todetermine the break-evenpoint.
12, 13, 14 8, 9 3, 4 8, 9, 10,11, 12, 13,14, 16, 17
1A, 2A, 3A,4A, 5A
1B, 2B, 3B,4B, 5B
7. Give the formulas fordetermining sales requiredto earn target net income.
16 10, 12 4 14, 15, 17 2A, 5A, 6A 2B, 5B, 6B
8. Define margin of safety,and give the formulasfor computing it.
15 11 4 16, 17 2A, 4A,5A, 6A
2B, 4B,5B, 6B
18-2 Copyright © 2011 John Wiley & Sons, Inc. Kimmel, Accounting, 4/e, Solutions Manual (For Instructor Use Only)
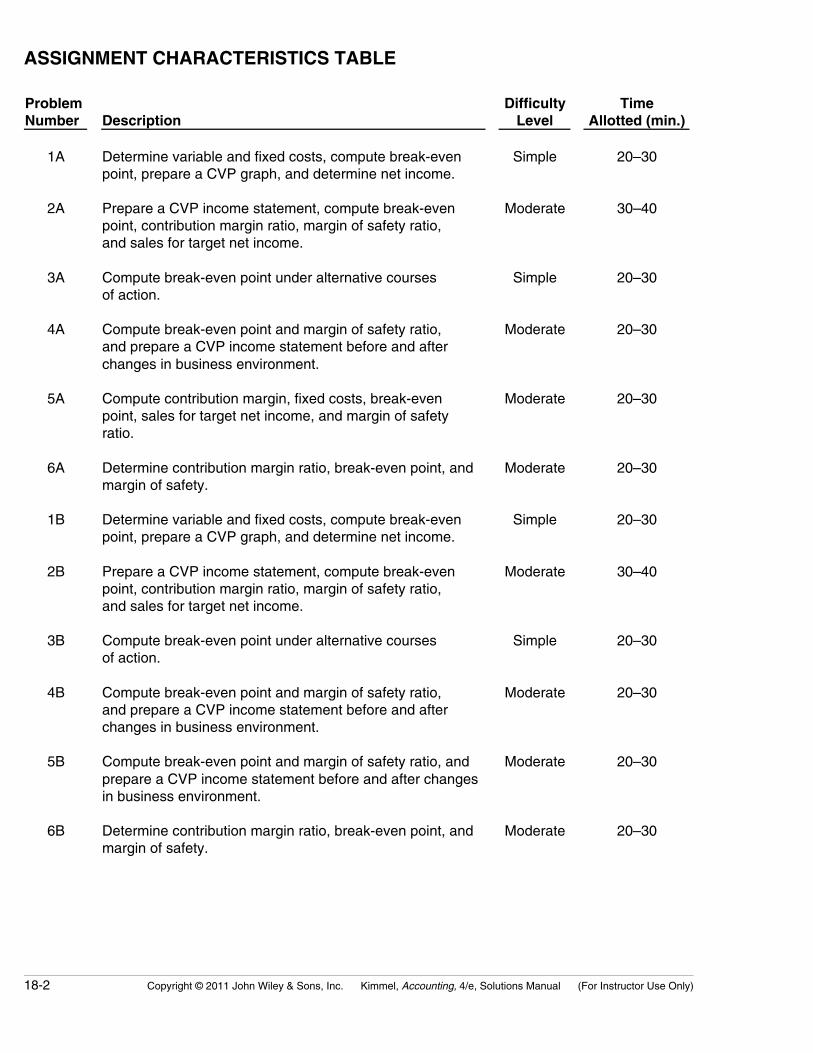
ASSIGNMENT CHARACTERISTICS TABLE
ProblemNumber Description
DifficultyLevel
TimeAllotted (min.)
1A Determine variable and fixed costs, compute break-evenpoint, prepare a CVP graph, and determine net income.
Simple 20–30
2A Prepare a CVP income statement, compute break-evenpoint, contribution margin ratio, margin of safety ratio,and sales for target net income.
Moderate 30–40
3A Compute break-even point under alternative coursesof action.
Simple 20–30
4A Compute break-even point and margin of safety ratio,and prepare a CVP income statement before and afterchanges in business environment.
Moderate 20–30
5A Compute contribution margin, fixed costs, break-evenpoint, sales for target net income, and margin of safetyratio.
Moderate 20–30
6A Determine contribution margin ratio, break-even point, andmargin of safety.
Moderate 20–30
1B Determine variable and fixed costs, compute break-evenpoint, prepare a CVP graph, and determine net income.
Simple 20–30
2B Prepare a CVP income statement, compute break-evenpoint, contribution margin ratio, margin of safety ratio,and sales for target net income.
Moderate 30–40
3B Compute break-even point under alternative coursesof action.
Simple 20–30
4B Compute break-even point and margin of safety ratio,and prepare a CVP income statement before and afterchanges in business environment.
Moderate 20–30
5B Compute break-even point and margin of safety ratio, andprepare a CVP income statement before and after changesin business environment.
Moderate 20–30
6B Determine contribution margin ratio, break-even point, andmargin of safety.
Moderate 20–30
Copyright © 2011 John Wiley & Sons, Inc. Kimmel, Accounting, 4/e, Solutions Manual (For Instructor Use Only) 18-3
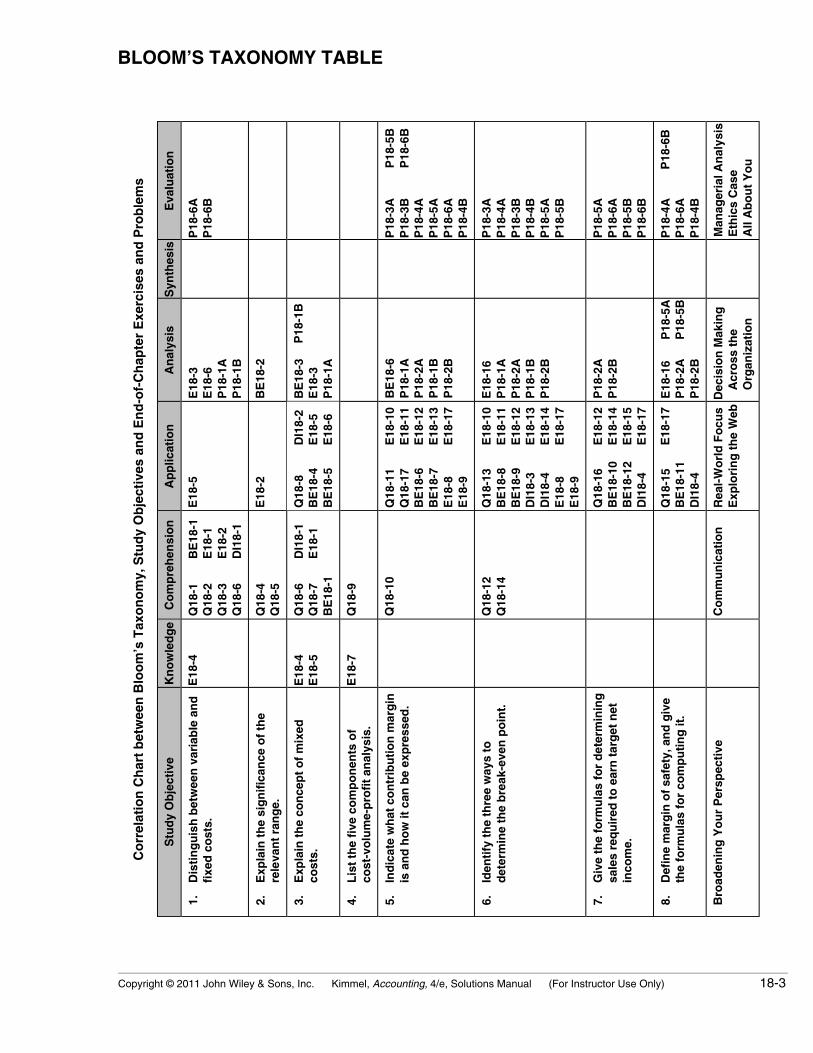
Co
rrel
atio
n C
har
t b
etw
een
Blo
om
’s T
axo
no
my,
Stu
dy
Ob
ject
ives
an
d E
nd
-of-
Ch
apte
r E
xerc
ises
an
d P
rob
lem
s
Stu
dy
Ob
ject
ive
Kn
ow
led
ge
Co
mp
reh
ensi
on
Ap
plic
atio
nA
nal
ysis
Syn
thes
isE
valu
atio
n
* 1.
Dis
tin
gu
ish
bet
wee
n v
aria
ble
an
dfi
xed
co
sts.
E18
-4Q
18-1
Q18
-2Q
18-3
Q18
-6
BE
18-1
E18
-1E
18-2
DI1
8-1
E18
-5E
18-3
E18
-6P
18-1
AP
18-1
B
P18
-6A
P18
-6B
* 2.
Exp
lain
th
e si
gn
ific
ance
of
the
rele
van
t ra
ng
e.Q
18-4
Q18
-5E
18-2
BE
18-2
* 3.
Exp
lain
th
e co
nce
pt
of
mix
edco
sts.
E18
-4E
18-5
Q18
-6Q
18-7
BE
18-1
DI1
8-1
E18
-1Q
18-8
BE
18-4
BE
18-5
DI1
8-2
E18
-5E
18-6
BE
18-3
E18
-3P
18-1
A
P18
-1B
* 4.
Lis
t th
e fi
ve c
om
po
nen
ts o
fco
st-v
olu
me-
pro
fit
anal
ysis
.E
18-7
Q18
-9
* 5.
Ind
icat
e w
hat
co
ntr
ibu
tio
n m
arg
inis
an
d h
ow
it c
an b
e ex
pre
ssed
.Q
18-1
0Q
18-1
1Q
18-1
7B
E18
-6B
E18
-7E
18-8
E18
-9
E18
-10
E18
-11
E18
-12
E18
-13
E18
-17
BE
18-6
P18
-1A
P18
-2A
P18
-1B
P18
-2B
P18
-3A
P18
-3B
P18
-4A
P18
-5A
P18
-6A
P18
-4B
P18
-5B
P18
-6B
* 6.
Iden
tify
th
e th
ree
way
s to
det
erm
ine
the
bre
ak-e
ven
po
int.
Q18
-12
Q18
-14
Q18
-13
BE
18-8
BE
18-9
DI1
8-3
DI1
8-4
E18
-8E
18-9
E18
-10
E18
-11
E18
-12
E18
-13
E18
-14
E18
-17
E18
-16
P18
-1A
P18
-2A
P18
-1B
P18
-2B
P18
-3A
P18
-4A
P18
-3B
P18
-4B
P18
-5A
P18
-5B
* 7.
Giv
e th
e fo
rmu
las
for
det
erm
inin
gsa
les
req
uir
ed t
o e
arn
tar
get
net
inco
me.
Q18
-16
BE
18-1
0B
E18
-12
DI1
8-4
E18
-12
E18
-14
E18
-15
E18
-17
P18
-2A
P18
-2B
P18
-5A
P18
-6A
P18
-5B
P18
-6B
* 8.
Def
ine
mar
gin
of
safe
ty, a
nd
giv
eth
e fo
rmu
las
for
com
pu
tin
g it
.Q
18-1
5B
E18
-11
DI1
8-4
E18
-17
E18
-16
P18
-2A
P18
-2B
P18
-5A
P18
-5B
P18
-4A
P18
-6A
P18
-4B
P18
-6B
Bro
aden
ing
Yo
ur
Per
spec
tive
Co
mm
un
icat
ion
Rea
l-W
orl
d F
ocu
sE
xplo
rin
g t
he
Web
Dec
isio
n M
akin
g
Acr
oss
th
e
Org
aniz
atio
n
Man
ager
ial A
nal
ysis
Eth
ics
Cas
eA
ll A
bo
ut
Yo
u
BLOOM’S TAXONOMY TABLE
18-4 Copyright © 2011 John Wiley & Sons, Inc. Kimmel, Accounting, 4/e, Solutions Manual (For Instructor Use Only)
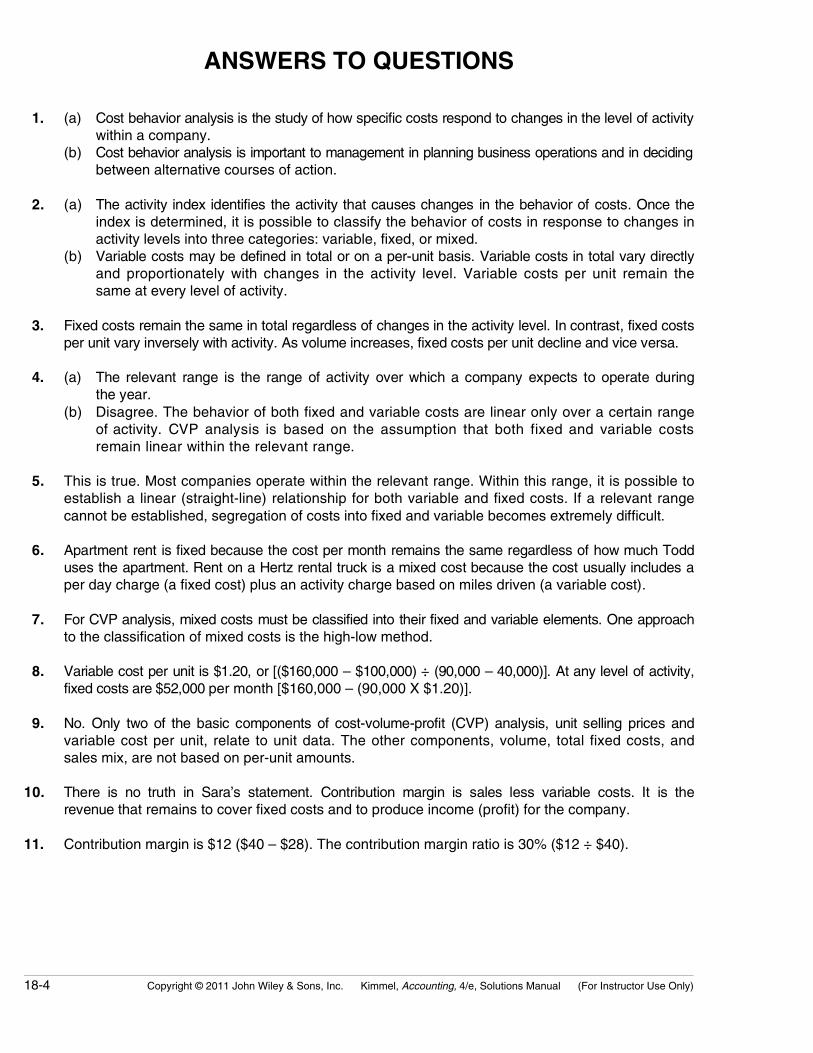
ANSWERS TO QUESTIONS
1. (a) Cost behavior analysis is the study of how specific costs respond to changes in the level of activitywithin a company.
(b) Cost behavior analysis is important to management in planning business operations and in decidingbetween alternative courses of action.
2. (a) The activity index identifies the activity that causes changes in the behavior of costs. Once theindex is determined, it is possible to classify the behavior of costs in response to changes inactivity levels into three categories: variable, fixed, or mixed.
(b) Variable costs may be defined in total or on a per-unit basis. Variable costs in total vary directlyand proportionately with changes in the activity level. Variable costs per unit remain thesame at every level of activity.
3. Fixed costs remain the same in total regardless of changes in the activity level. In contrast, fixed costsper unit vary inversely with activity. As volume increases, fixed costs per unit decline and vice versa.
4. (a) The relevant range is the range of activity over which a company expects to operate duringthe year.
(b) Disagree. The behavior of both fixed and variable costs are linear only over a certain rangeof activity. CVP analysis is based on the assumption that both fixed and variable costsremain linear within the relevant range.
5. This is true. Most companies operate within the relevant range. Within this range, it is possible toestablish a linear (straight-line) relationship for both variable and fixed costs. If a relevant rangecannot be established, segregation of costs into fixed and variable becomes extremely difficult.
6. Apartment rent is fixed because the cost per month remains the same regardless of how much Todduses the apartment. Rent on a Hertz rental truck is a mixed cost because the cost usually includes aper day charge (a fixed cost) plus an activity charge based on miles driven (a variable cost).
7. For CVP analysis, mixed costs must be classified into their fixed and variable elements. One approachto the classification of mixed costs is the high-low method.
8. Variable cost per unit is $1.20, or [($160,000 – $100,000) ÷ (90,000 – 40,000)]. At any level of activity,fixed costs are $52,000 per month [$160,000 – (90,000 X $1.20)].
9. No. Only two of the basic components of cost-volume-profit (CVP) analysis, unit selling prices andvariable cost per unit, relate to unit data. The other components, volume, total fixed costs, andsales mix, are not based on per-unit amounts.
10. There is no truth in Sara’s statement. Contribution margin is sales less variable costs. It is therevenue that remains to cover fixed costs and to produce income (profit) for the company.
11. Contribution margin is $12 ($40 – $28). The contribution margin ratio is 30% ($12 ÷ $40).
Copyright © 2011 John Wiley & Sons, Inc. Kimmel, Accounting, 4/e, Solutions Manual (For Instructor Use Only) 18-5
Questions Chapter 18 (Continued)
12. Disagree. Knowledge of the break-even point is useful to management in deciding whether to introducenew product lines, change sales prices on established products, and enter new market areas.
13. $25,000 ÷ 25% = $100,000
14. (a) The break-even point involves the plotting of three lines over the full range of activity: the totalrevenue line, the total fixed cost line, and the total cost line. The break-even point is deter-mined at the intersection of the total revenue and total cost lines.
(b) The break-even point in units is obtained by drawing a vertical line from the break-even point to thehorizontal axis. The break-even point in sales dollars is obtained by drawing a horizontal line fromthe break-even point to the vertical axis.
15. Margin of safety is the difference between actual or expected sales and sales at the break-evenpoint. 1,250 X $12 = $15,000; $15,000 – $12,000 = $3,000; $3,000 ÷ $15,000 = 20%.
16. At break-even sales, the contribution margin is equal to the fixed costs. The contribution marginratio is:
$180,000
$600,000 = 30%
The sales volume to achieve net income of $60,000 is as follows:
$180,000 + $60,000
.30 = $800,000
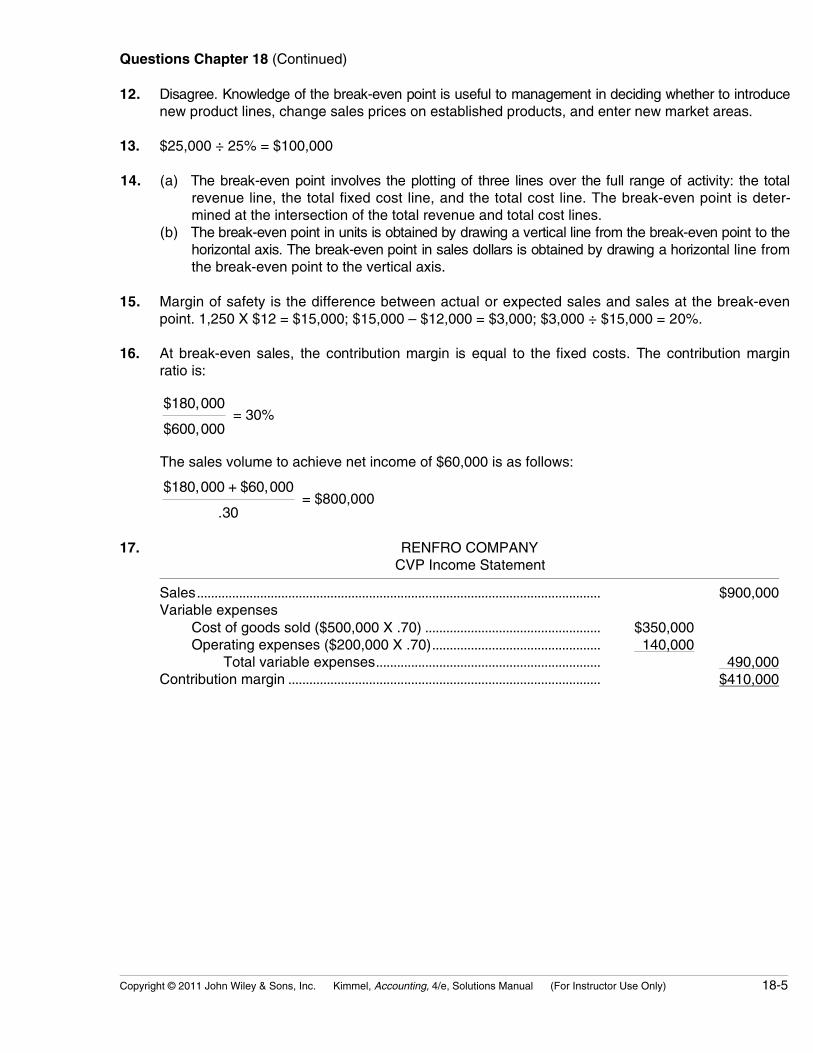
17. RENFRO COMPANYCVP Income Statement
Sales................................................................................................................... $900,000Variable expenses
Cost of goods sold ($500,000 X .70) .................................................. $350,000Operating expenses ($200,000 X .70)................................................ 140,000
Total variable expenses................................................................ 490,000Contribution margin ......................................................................................... $410,000
18-6 Copyright © 2011 John Wiley & Sons, Inc. Kimmel, Accounting, 4/e, Solutions Manual (For Instructor Use Only)
SOLUTIONS TO BRIEF EXERCISES
BRIEF EXERCISE 18-1
Indirect labor is a variable cost because it increases in total directly andproportionately with the change in the activity level.
Supervisory salaries is a fixed cost because it remains the same in total regard-less of changes in the activity level.
Maintenance is a mixed cost because it increases in total but not proportionatelywith changes in the activity level.
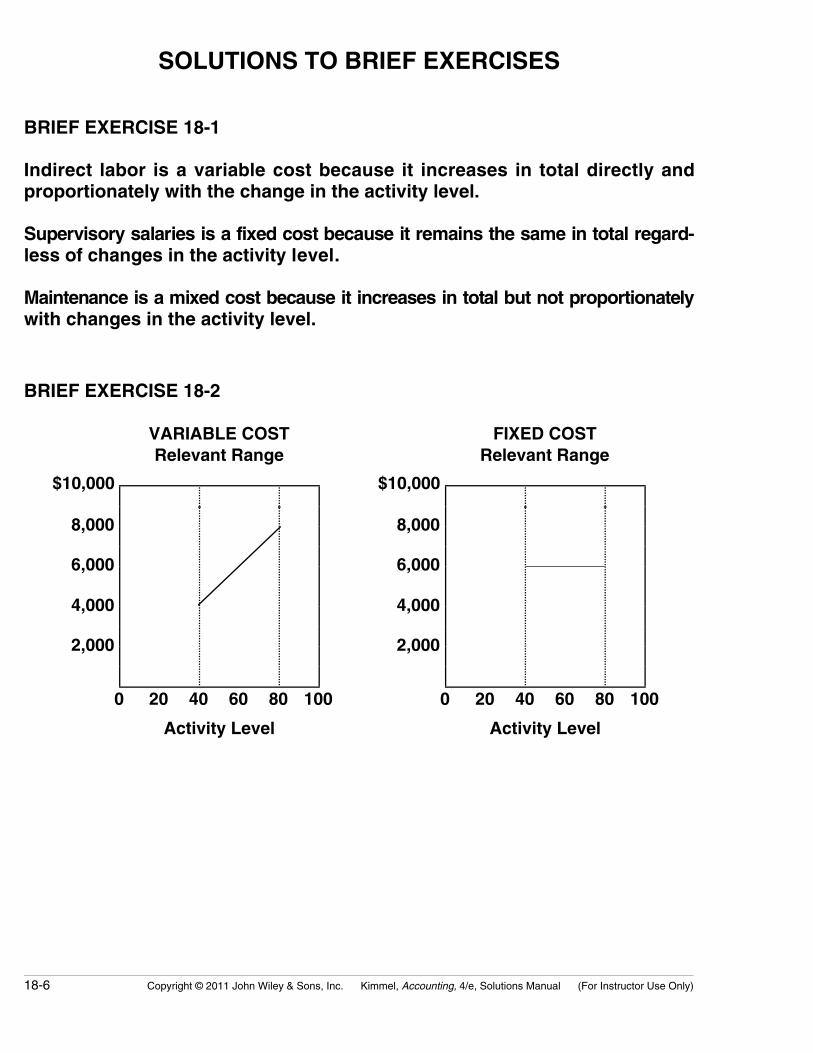
BRIEF EXERCISE 18-2
VARIABLE COSTRelevant Range
FIXED COSTRelevant Range
$10,000 $10,000
8,000 8,000
6,000 6,000
4,000 4,000
2,000 2,000
0 20 40 60 80 100 0 20 40 60 80 100
Activity Level Activity Level
Copyright © 2011 John Wiley & Sons, Inc. Kimmel, Accounting, 4/e, Solutions Manual (For Instructor Use Only) 18-7
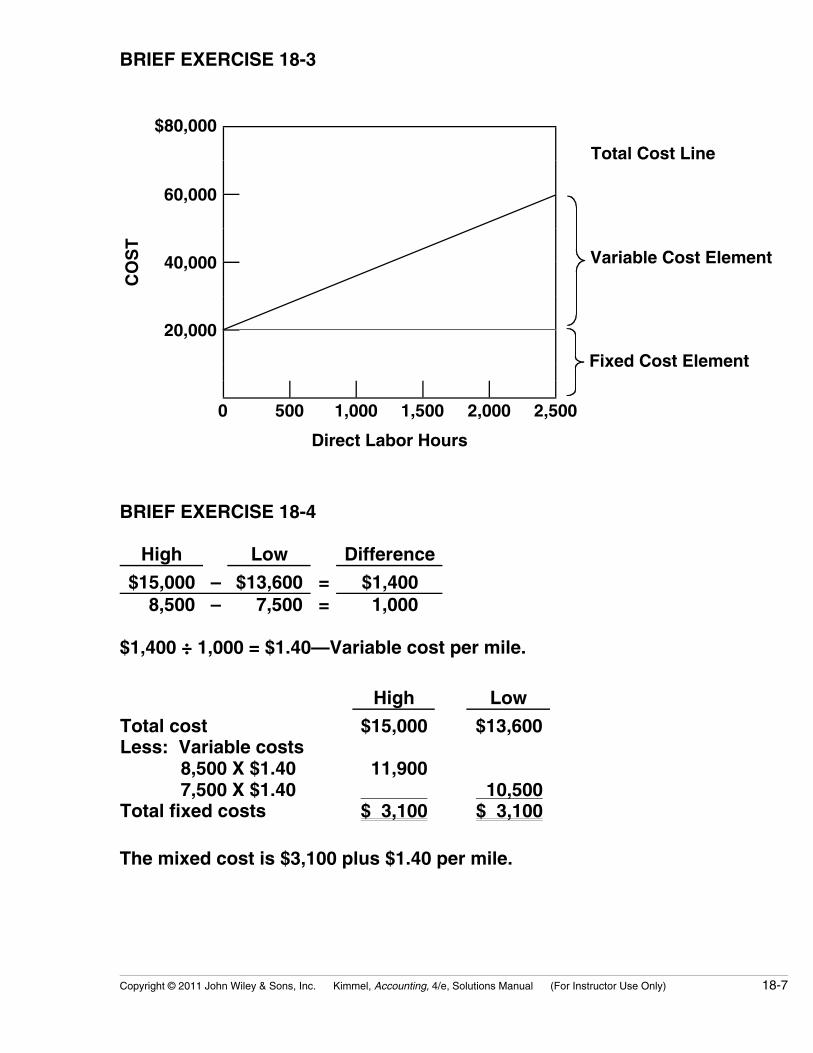
BRIEF EXERCISE 18-3
$80,000
60,000
Total Cost Line
40,000 Variable Cost Element
20,000
CO
ST
Fixed Cost Element
0 500 1,000 1,500 2,000 2,500
Direct Labor Hours
BRIEF EXERCISE 18-4
High Low Difference
$15,000 – $13,600 = $1,400 8,500 – 7,500 = 1,000
$1,400 ÷ 1,000 = $1.40—Variable cost per mile.
High Low
Total costLess: Variable costs
8,500 X $1.407,500 X $1.40
Total fixed costs
$15,000
11,900 $ 3,100
$13,600
10,500$ 3,100
The mixed cost is $3,100 plus $1.40 per mile.
18-8 Copyright © 2011 John Wiley & Sons, Inc. Kimmel, Accounting, 4/e, Solutions Manual (For Instructor Use Only)
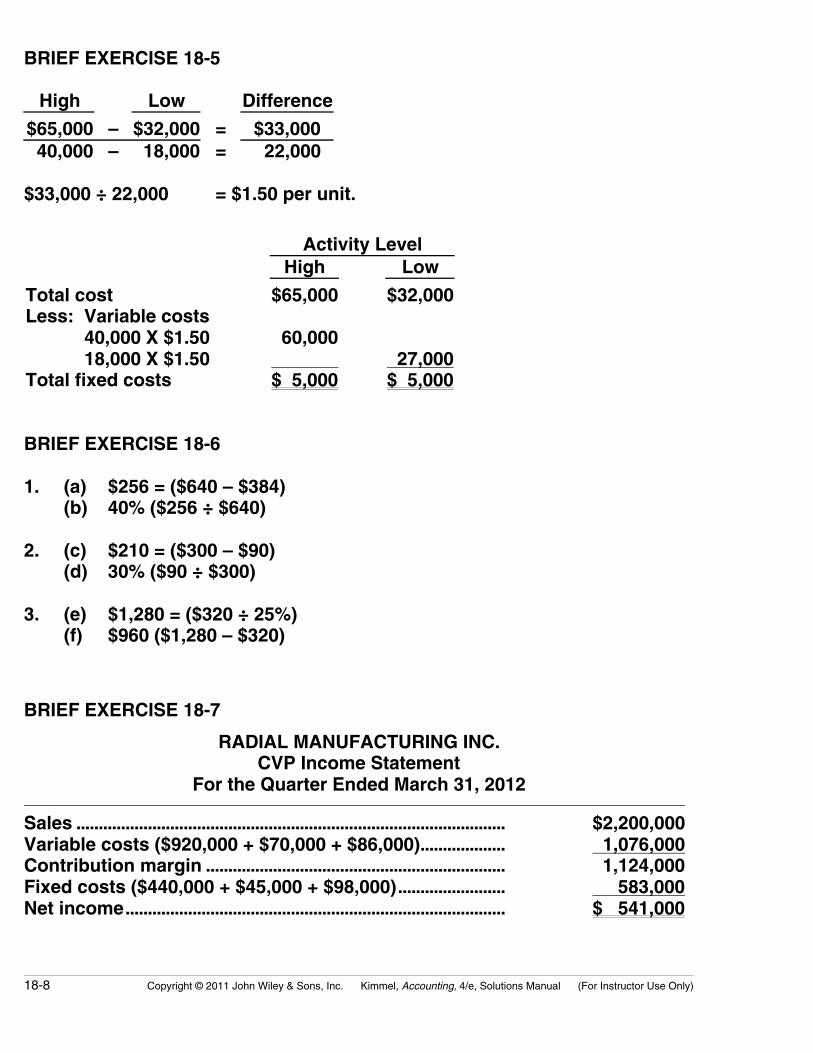
BRIEF EXERCISE 18-5
High Low Difference
$65,000 – $32,000 = $33,000 40,000 – 18,000 = 22,000
$33,000 ÷ 22,000 = $1.50 per unit.
Activity LevelHigh Low
Total costLess: Variable costs
40,000 X $1.5018,000 X $1.50
Total fixed costs
$65,000
60,000000,000$ 5,000
$32,000
27,000$ 5,000
BRIEF EXERCISE 18-6
1. (a) $256 = ($640 – $384)(b) 40% ($256 ÷ $640)
2. (c) $210 = ($300 – $90)(d) 30% ($90 ÷ $300)
3. (e) $1,280 = ($320 ÷ 25%)(f) $960 ($1,280 – $320)
BRIEF EXERCISE 18-7
RADIAL MANUFACTURING INC.CVP Income Statement
For the Quarter Ended March 31, 2012 Sales ................................................................................................ $2,200,000Variable costs ($920,000 + $70,000 + $86,000)................... 1,076,000Contribution margin ................................................................... 1,124,000Fixed costs ($440,000 + $45,000 + $98,000)........................ 583,000Net income..................................................................................... $ 541,000
Copyright © 2011 John Wiley & Sons, Inc. Kimmel, Accounting, 4/e, Solutions Manual (For Instructor Use Only) 18-9
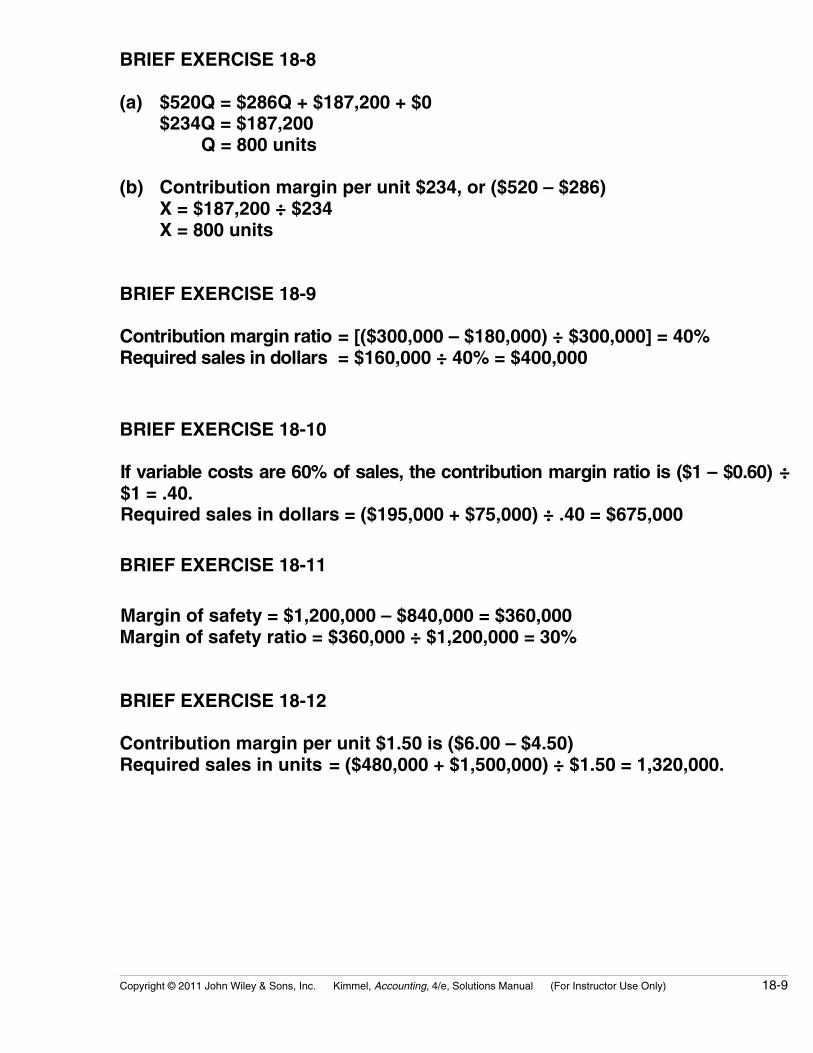
BRIEF EXERCISE 18-8
(a) $520Q = $286Q + $187,200 + $0$234Q = $187,200
Q = 800 units
(b) Contribution margin per unit $234, or ($520 – $286)X = $187,200 ÷ $234X = 800 units
BRIEF EXERCISE 18-9
Contribution margin ratio = [($300,000 – $180,000) ÷ $300,000] = 40%Required sales in dollars = $160,000 ÷ 40% = $400,000
BRIEF EXERCISE 18-10
If variable costs are 60% of sales, the contribution margin ratio is ($1 – $0.60) ÷$1 = .40.Required sales in dollars = ($195,000 + $75,000) ÷ .40 = $675,000
BRIEF EXERCISE 18-11
Margin of safety = $1,200,000 – $840,000 = $360,000Margin of safety ratio = $360,000 ÷ $1,200,000 = 30%
BRIEF EXERCISE 18-12
Contribution margin per unit $1.50 is ($6.00 – $4.50)Required sales in units = ($480,000 + $1,500,000) ÷ $1.50 = 1,320,000.
18-10 Copyright © 2011 John Wiley & Sons, Inc. Kimmel, Accounting, 4/e, Solutions Manual (For Instructor Use Only)
SOLUTIONS FOR DO IT! REVIEW EXERCISES
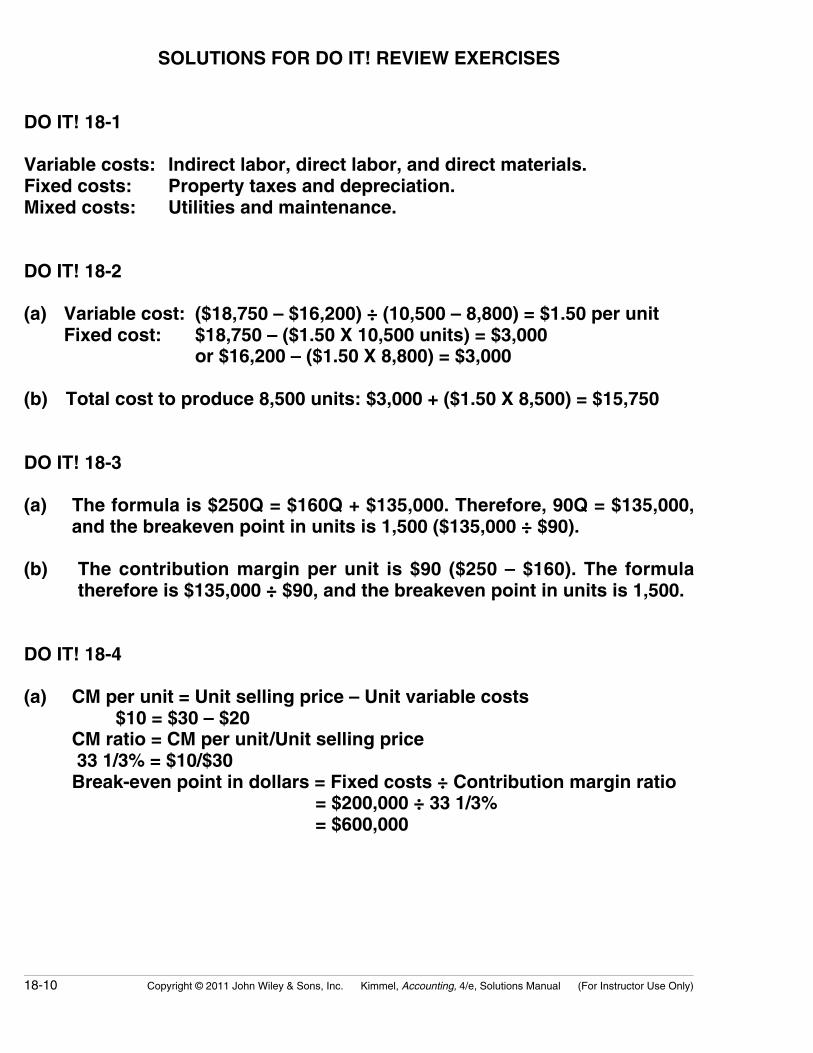
DO IT! 18-1
Variable costs: Indirect labor, direct labor, and direct materials.Fixed costs: Property taxes and depreciation.Mixed costs: Utilities and maintenance.
DO IT! 18-2
(a) Variable cost: ($18,750 – $16,200) ÷ (10,500 – 8,800) = $1.50 per unitFixed cost: $18,750 – ($1.50 X 10,500 units) = $3,000
or $16,200 – ($1.50 X 8,800) = $3,000
(b) Total cost to produce 8,500 units: $3,000 + ($1.50 X 8,500) = $15,750
DO IT! 18-3
(a) The formula is $250Q = $160Q + $135,000. Therefore, 90Q = $135,000,and the breakeven point in units is 1,500 ($135,000 ÷ $90).
(b) The contribution margin per unit is $90 ($250 – $160). The formulatherefore is $135,000 ÷ $90, and the breakeven point in units is 1,500.
DO IT! 18-4
(a) CM per unit = Unit selling price – Unit variable costs$10 = $30 – $20
CM ratio = CM per unit/Unit selling price 33 1/3% = $10/$30Break-even point in dollars = Fixed costs ÷ Contribution margin ratio
= $200,000 ÷ 33 1/3%= $600,000
Copyright © 2011 John Wiley & Sons, Inc. Kimmel, Accounting, 4/e, Solutions Manual (For Instructor Use Only) 18-11
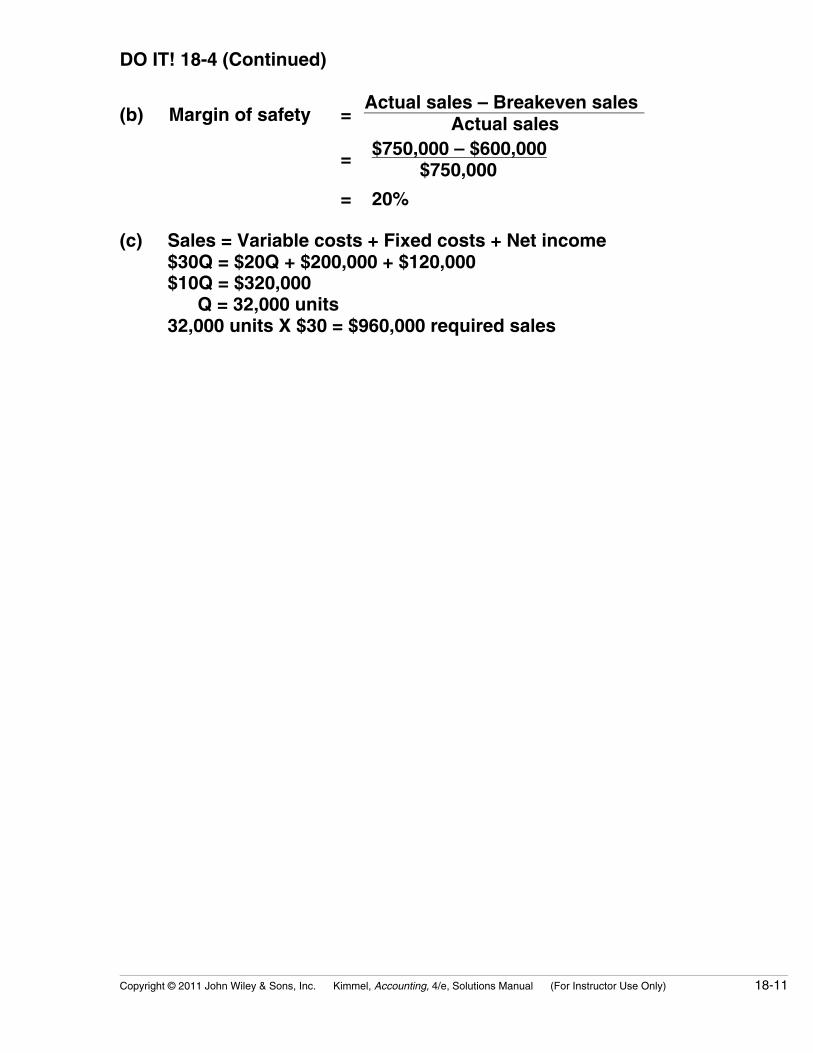
DO IT! 18-4 (Continued)
Actual sales – Breakeven sales(b) Margin of safety = Actual sales
$750,000 – $600,000= $750,000
= 20%
(c) Sales = Variable costs + Fixed costs + Net income$30Q = $20Q + $200,000 + $120,000$10Q = $320,000
Q = 32,000 units32,000 units X $30 = $960,000 required sales
18-12 Copyright © 2011 John Wiley & Sons, Inc. Kimmel, Accounting, 4/e, Solutions Manual (For Instructor Use Only)
SOLUTIONS TO EXERCISES
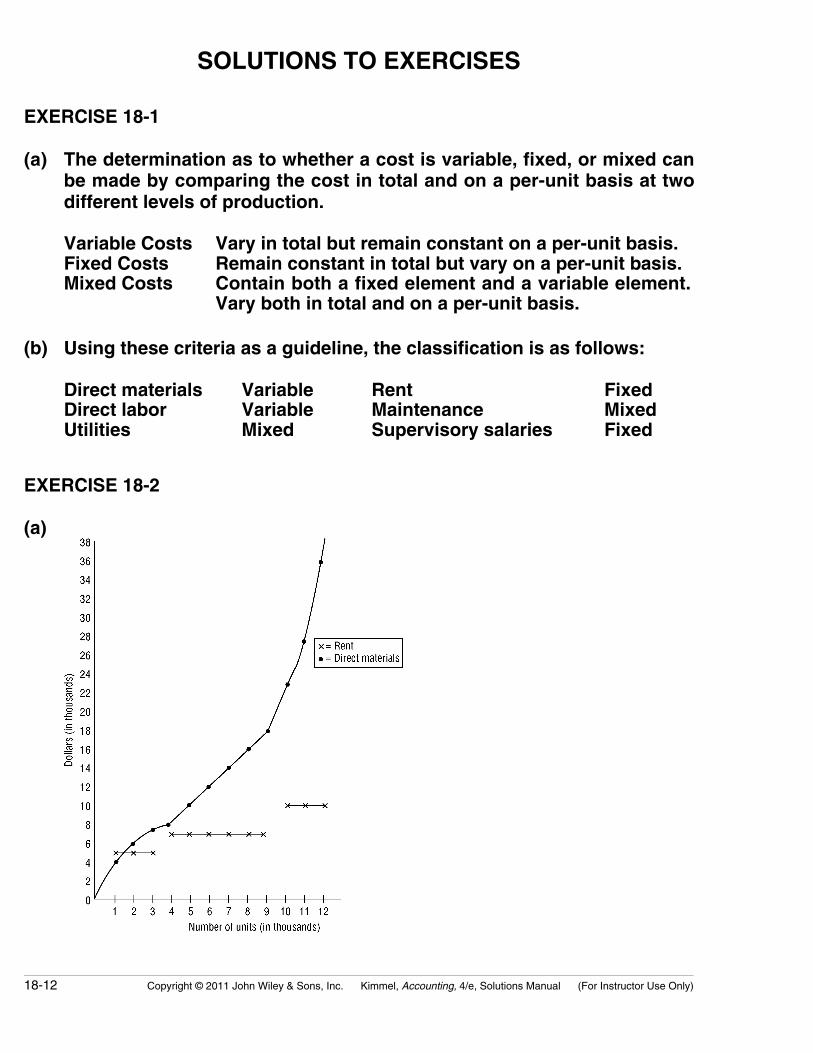
EXERCISE 18-1
(a) The determination as to whether a cost is variable, fixed, or mixed canbe made by comparing the cost in total and on a per-unit basis at twodifferent levels of production.
Variable CostsFixed CostsMixed Costs
Vary in total but remain constant on a per-unit basis.Remain constant in total but vary on a per-unit basis.Contain both a fixed element and a variable element.Vary both in total and on a per-unit basis.
(b) Using these criteria as a guideline, the classification is as follows:
Direct materialsDirect laborUtilities
VariableVariableMixed
RentMaintenanceSupervisory salaries
FixedMixedFixed
EXERCISE 18-2
(a)
Copyright © 2011 John Wiley & Sons, Inc. Kimmel, Accounting, 4/e, Solutions Manual (For Instructor Use Only) 18-13
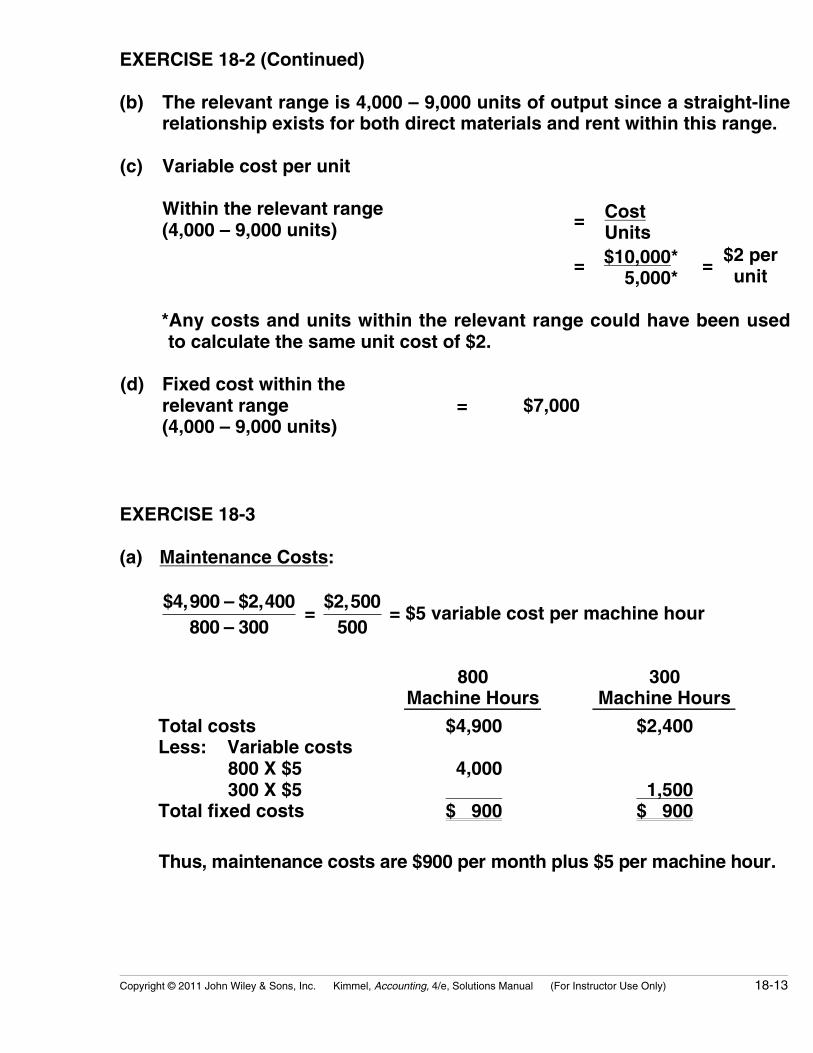
EXERCISE 18-2 (Continued)
(b) The relevant range is 4,000 – 9,000 units of output since a straight-linerelationship exists for both direct materials and rent within this range.
(c) Variable cost per unit
Within the relevant range(4,000 – 9,000 units) = Cost
Units
= $10,000* 5,000*
= $2 perunit
*Any costs and units within the relevant range could have been usedto calculate the same unit cost of $2.
(d) Fixed cost within therelevant range = $7,000(4,000 – 9,000 units)
EXERCISE 18-3
(a) Maintenance Costs:
$4,900 – $2,400800 – 300
= $2,500
500 = $5 variable cost per machine hour
800Machine Hours
300Machine Hours
Total costsLess: Variable costs
800 X $5 300 X $5
Total fixed costs
$4,900
4,000 $ 900
$2,400
1,500$ 900
Thus, maintenance costs are $900 per month plus $5 per machine hour.
18-14 Copyright © 2011 John Wiley & Sons, Inc. Kimmel, Accounting, 4/e, Solutions Manual (For Instructor Use Only)
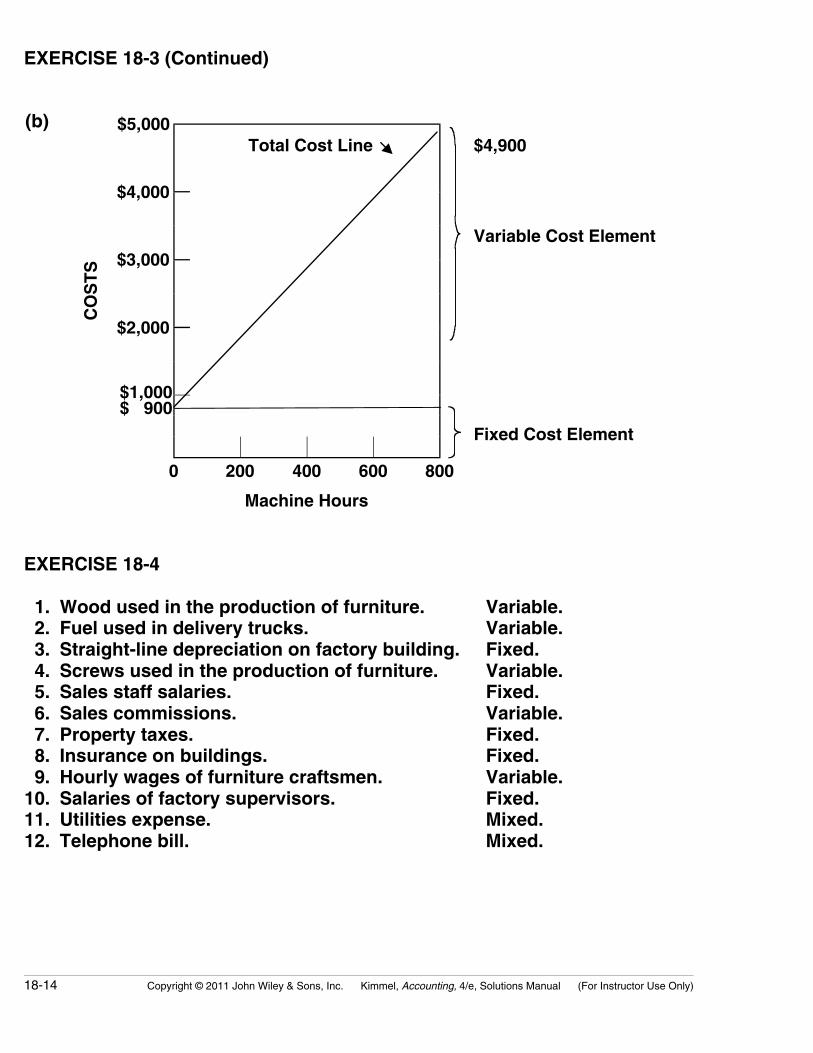
EXERCISE 18-3 (Continued)
(b) $5,000Total Cost Line $4,900
$4,000
$3,000Variable Cost Element
$2,000
$1,000$ 900
CO
ST
S
Fixed Cost Element
0 200 400 600 800
Machine Hours
EXERCISE 18-4
1. Wood used in the production of furniture. Variable. 2. Fuel used in delivery trucks. Variable. 3. Straight-line depreciation on factory building. Fixed. 4. Screws used in the production of furniture. Variable. 5. Sales staff salaries. Fixed. 6. Sales commissions. Variable. 7. Property taxes. Fixed. 8. Insurance on buildings. Fixed. 9. Hourly wages of furniture craftsmen. Variable.10. Salaries of factory supervisors. Fixed.11. Utilities expense. Mixed.12. Telephone bill. Mixed.
Copyright © 2011 John Wiley & Sons, Inc. Kimmel, Accounting, 4/e, Solutions Manual (For Instructor Use Only) 18-15
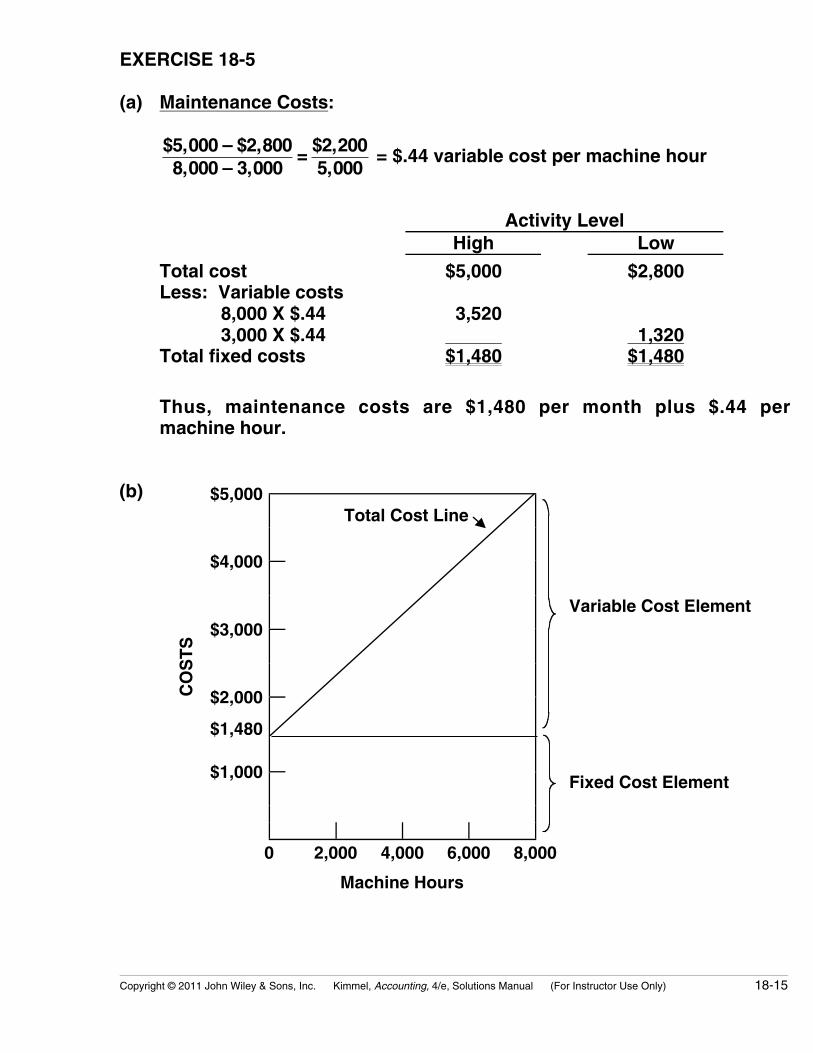
EXERCISE 18-5
(a) Maintenance Costs:
$5,000 – $2,8008,000 – 3,000
= $2,2005,000
= $.44 variable cost per machine hour
Activity LevelHigh Low
Total costLess: Variable costs
8,000 X $.443,000 X $.44
Total fixed costs
$5,000
3,52000,000$1,480
$2,800
1,320$1,480
Thus, maintenance costs are $1,480 per month plus $.44 permachine hour.
(b) $5,000Total Cost Line
$4,000
$3,000Variable Cost Element
$2,000
$1,480
$1,000 Fixed Cost Element
CO
ST
S
0 2,000 4,000 6,000 8,000
Machine Hours

18-16 Copyright © 2011 John Wiley & Sons, Inc. Kimmel, Accounting, 4/e, Solutions Manual (For Instructor Use Only)
EXERCISE 18-6
(a) Cost Fixed Variable MixedDirect materials XDirect labor XUtilities XProperty taxes XIndirect labor XSupervisory salaries XMaintenance XDepreciation X
(b) Fixed costs = $1,000 + $1,800 + $2,400 +$300 + $200
= $5,700
Variable costs to produce 3,000 units = $7,500 + $15,000 + $4,500= $27,000
Variable cost per unit = $27,000/3,000 units= $9 per unit
Variable cost portion of mixed cost = Total cost – Fixed portion
Utilities:Variable cost to produce 3,000 units = $1,800 – $300
= $1,500
Variable cost per unit = $1,500/3,000 units= $.50 per unit
Maintenance:Variable cost to produce 3,000 units = $1,100 – $200
= $900
Variable cost per unit = $900/3,000 units= $.30 per unit
Cost to produce 5,000 units = (Variable costs per + Fixed costunit X 5,000 units)
= (($9 + $.50 + $.30) X 5,000) + $5,700= $49,000 + $5,700= $54,700

Copyright © 2011 John Wiley & Sons, Inc. Kimmel, Accounting, 4/e, Solutions Manual (For Instructor Use Only) 18-17
EXERCISE 18-7
MEMO
To: Kenny Deines
From: Student
Re: Assumptions underlying CVP analysis
CVP analysis is a useful tool in analyzing the effects of changes in costsand volume on a company’s profits. However, there are some assumptionswhich underline CVP analysis. When these assumptions are not valid,the results of CVP analysis may be inaccurate.
The five assumptions are:1. The behavior of both costs and revenues is linear throughout
the relevant range of the activity index.2. All costs can be classified with reasonable accuracy as either
fixed or variable.3. Changes in activity are the only factors that affect costs.4. All units produced are sold.5. When more than one type of product is sold, the sales mix will
remain constant.
If you want further explanation of any of these assumptions, pleasecontact me.
EXERCISE 18-8
(a) Contribution margin per lawn
Contribution margin per lawn
Contribution margin ratio
=
=
=
$60 – ($13 + $12 + $2)
$33
$33 ÷ $60 = 55%
Fixed costs = $1,500 + $200 + $2,000 = $3,700
Break-even point in lawns = $3,700 ÷ $33 = 112(rounded)
(b) Break-even point in dollars = 112 lawns X $60 per lawn= $6,720 per month
ORFixed costs ÷ Contribution margin ratio = $3,700 ÷ .55
= 6,727* per month
*$7 difference is due to rounding.
18-18 Copyright © 2011 John Wiley & Sons, Inc. Kimmel, Accounting, 4/e, Solutions Manual (For Instructor Use Only)
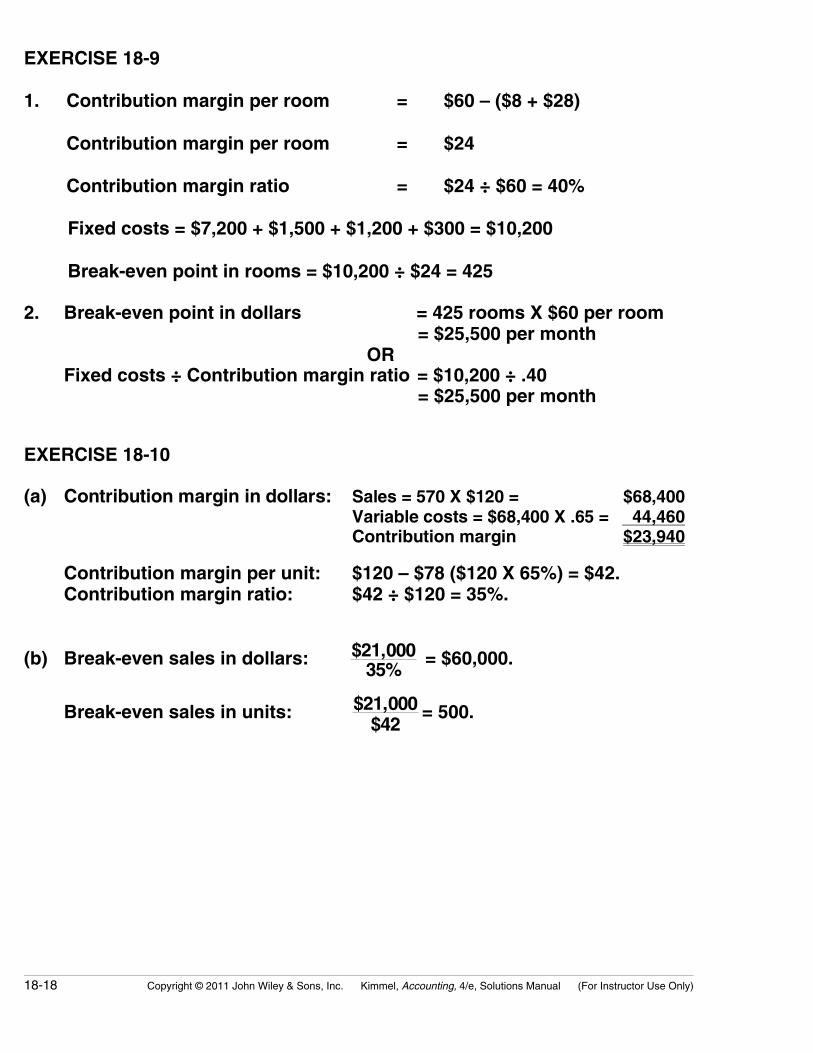
EXERCISE 18-9
1. Contribution margin per room
Contribution margin per room
Contribution margin ratio
=
=
=
$60 – ($8 + $28)
$24
$24 ÷ $60 = 40%
Fixed costs = $7,200 + $1,500 + $1,200 + $300 = $10,200
Break-even point in rooms = $10,200 ÷ $24 = 425
2. Break-even point in dollars = 425 rooms X $60 per room= $25,500 per month
ORFixed costs ÷ Contribution margin ratio = $10,200 ÷ .40
= $25,500 per month
EXERCISE 18-10
(a) Contribution margin in dollars: Sales = 570 X $120 = $68,400Variable costs = $68,400 X .65 = 44,460Contribution margin $23,940
Contribution margin per unit: $120 – $78 ($120 X 65%) = $42.Contribution margin ratio: $42 ÷ $120 = 35%.
(b) Break-even sales in dollars: $21,00035%
= $60,000.
Break-even sales in units: $21,000$42
= 500.
Copyright © 2011 John Wiley & Sons, Inc. Kimmel, Accounting, 4/e, Solutions Manual (For Instructor Use Only) 18-19
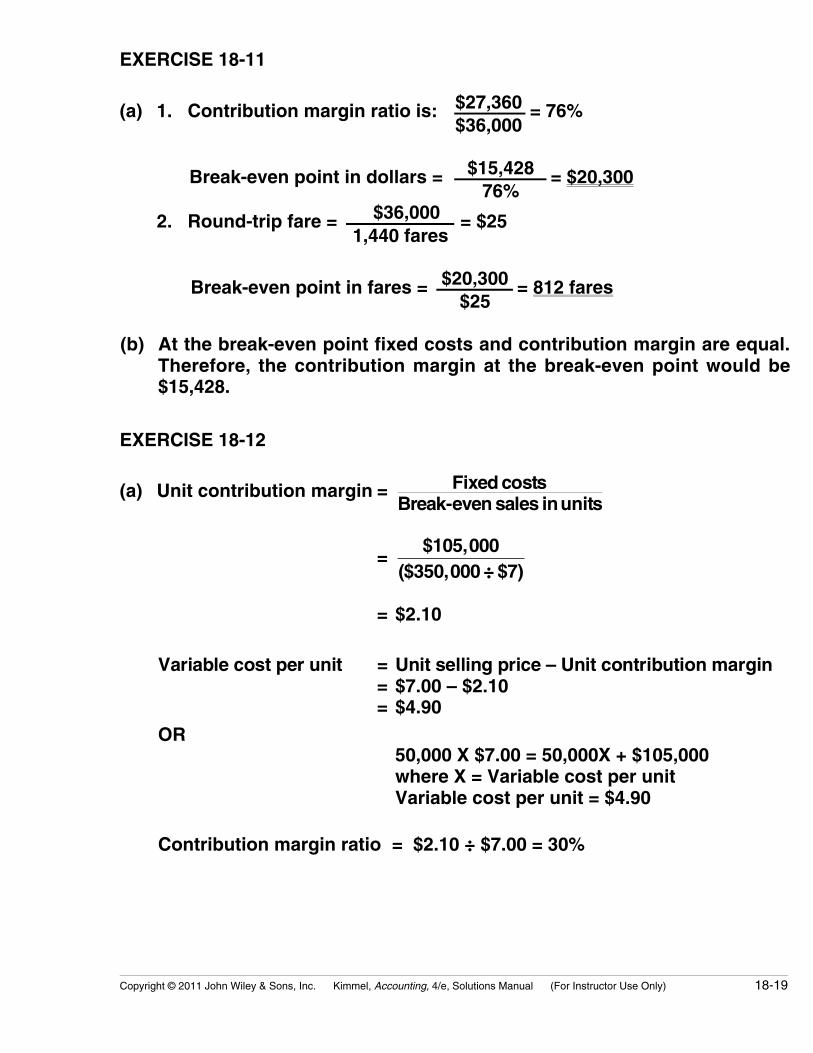
EXERCISE 18-11
$27,360(a) 1. Contribution margin ratio is:$36,000
= 76%
$15,428 Break-even point in dollars =76%
= $20,300
$36,0002. Round-trip fare =1,440 fares
= $25
$20,300 Break-even point in fares =$25
= 812 fares
(b) At the break-even point fixed costs and contribution margin are equal.Therefore, the contribution margin at the break-even point would be$15,428.
EXERCISE 18-12
(a) Unit contribution margin = Fixed costsBreak-even sales inunits
=$105,000
($350,000 ÷ $7)
= $2.10
Variable cost per unit = Unit selling price – Unit contribution margin= $7.00 – $2.10= $4.90
OR= 50,000 X $7.00 = 50,000X + $105,000= where X = Variable cost per unit= Variable cost per unit = $4.90
Contribution margin ratio = $2.10 ÷ $7.00 = 30%
18-20 Copyright © 2011 John Wiley & Sons, Inc. Kimmel, Accounting, 4/e, Solutions Manual (For Instructor Use Only)
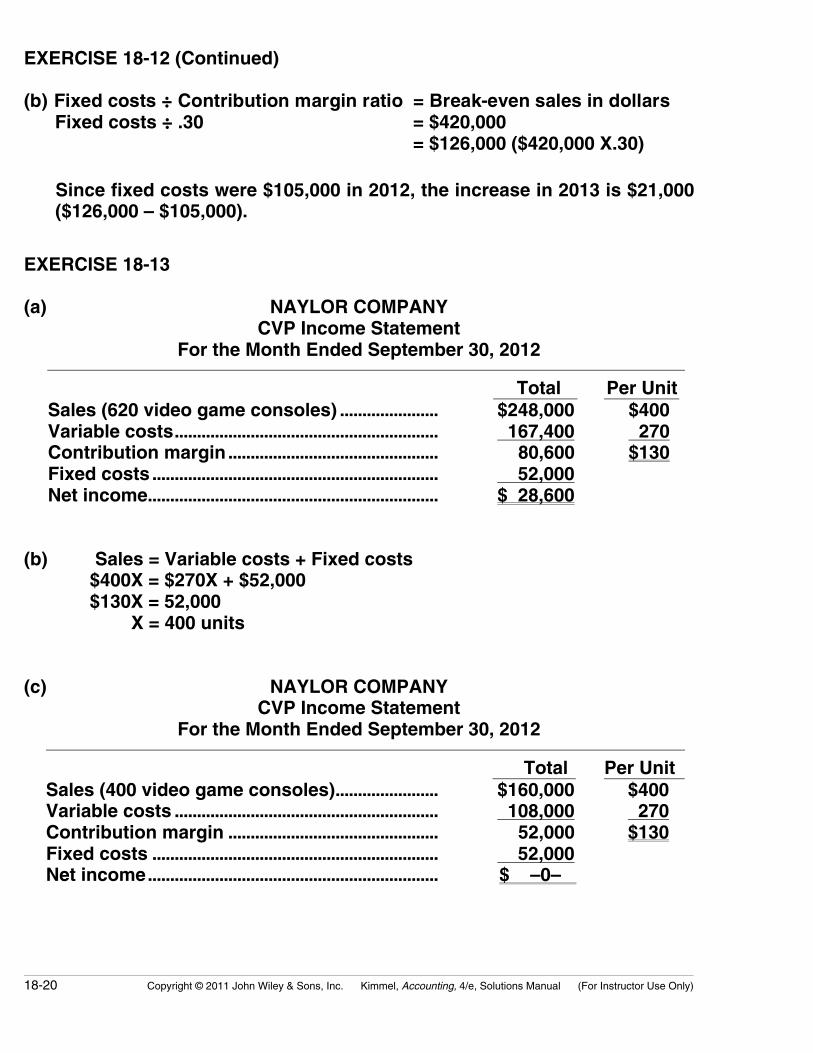
EXERCISE 18-12 (Continued)
(b) Fixed costs ÷ Contribution margin ratio = Break-even sales in dollarsFixed costs ÷ .30 = $420,000
= $126,000 ($420,000 X.30)
Since fixed costs were $105,000 in 2012, the increase in 2013 is $21,000($126,000 – $105,000).
EXERCISE 18-13
(a) NAYLOR COMPANYCVP Income Statement
For the Month Ended September 30, 2012
Total Per UnitSales (620 video game consoles) ...................... $248,000 $400Variable costs........................................................... 167,400 270Contribution margin............................................... 80,600 $130Fixed costs ................................................................ 52,000Net income................................................................. $ 28,600
(b) Sales = Variable costs + Fixed costs$400X = $270X + $52,000$130X = 52,000
X = 400 units
(c) NAYLOR COMPANYCVP Income Statement
For the Month Ended September 30, 2012
Total Per UnitSales (400 video game consoles)....................... $160,000 $400Variable costs ........................................................... 108,000 270Contribution margin ............................................... 52,000 $130Fixed costs ................................................................ 52,000Net income................................................................. $ –0–
Copyright © 2011 John Wiley & Sons, Inc. Kimmel, Accounting, 4/e, Solutions Manual (For Instructor Use Only) 18-21
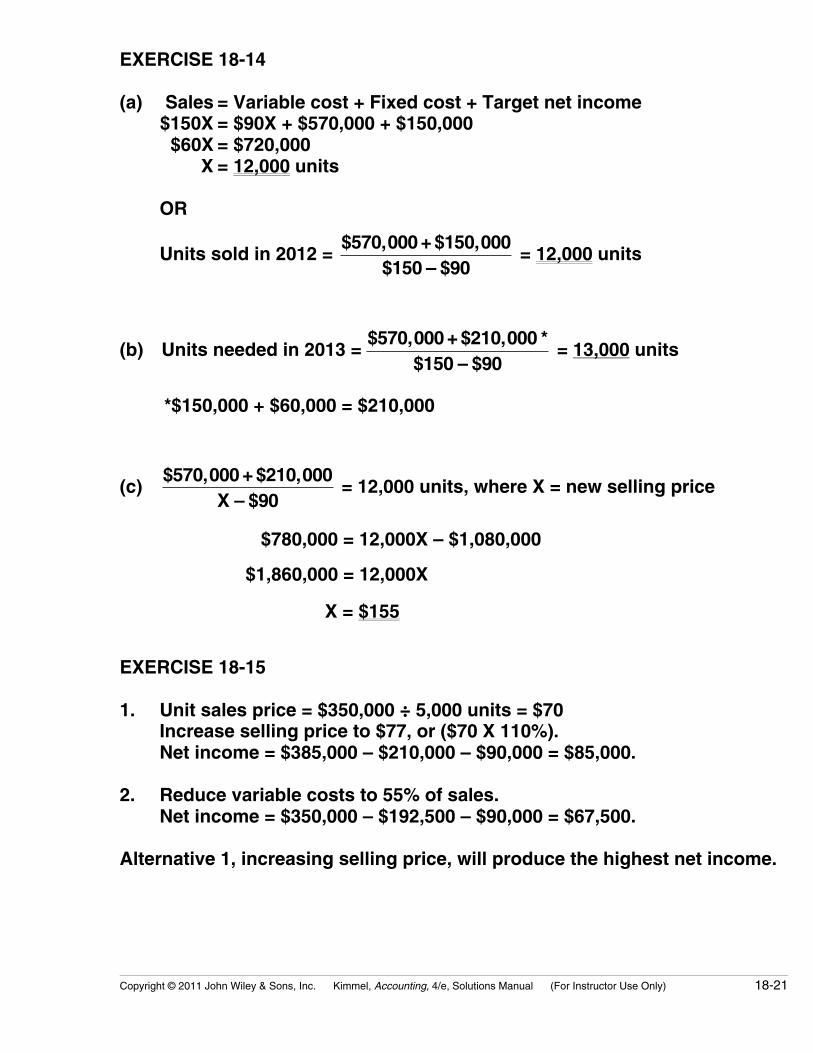
EXERCISE 18-14
(a) Sales = Variable cost + Fixed cost + Target net income$150X = $90X + $570,000 + $150,000
$60X = $720,000X = 12,000 units
OR
Units sold in 2012 = $570,000 + $150,000
$150 – $90 = 12,000 units
(b) Units needed in 2013 = $570,000 + $210,000 *
$150 – $90 = 13,000 units
*$150,000 + $60,000 = $210,000
(c)$570,000 + $210,000
X – $90 = 12,000 units, where X = new selling price
$780,000 = 12,000X – $1,080,000
$1,860,000 = 12,000X
X = $155
EXERCISE 18-15
1. Unit sales price = $350,000 ÷ 5,000 units = $70Increase selling price to $77, or ($70 X 110%).Net income = $385,000 – $210,000 – $90,000 = $85,000.
2. Reduce variable costs to 55% of sales.Net income = $350,000 – $192,500 – $90,000 = $67,500.
Alternative 1, increasing selling price, will produce the highest net income.

18-22 Copyright © 2011 John Wiley & Sons, Inc. Kimmel, Accounting, 4/e, Solutions Manual (For Instructor Use Only)
EXERCISE 18-16
(a) $3,200 Sales Line
2,800
2,400Break-even Point
Total Cost Line
2,000
1,600
1,200
800 Fixed Cost Line
400
DO
LL
AR
S (
000)
100 200 300 400 500 600 700 800
Number of Units (in thousands)
(b) 1. Break-even sales in units:
$4X = $2.40X + $800,000 $1.60X = $800,000
X = 500,000 units
2. Break-even sales in dollars:
X = .60X + $800,000.40X = $800,000 X = $2,000,000 or $800,000 ÷ 40%
(c) 1. Margin of safety in dollars: $2,500,000 – $2,000,000 = $500,000
2. Margin of safety ratio: $500,000 ÷ $2,500,000 = 20%
Copyright © 2011 John Wiley & Sons, Inc. Kimmel, Accounting, 4/e, Solutions Manual (For Instructor Use Only) 18-23
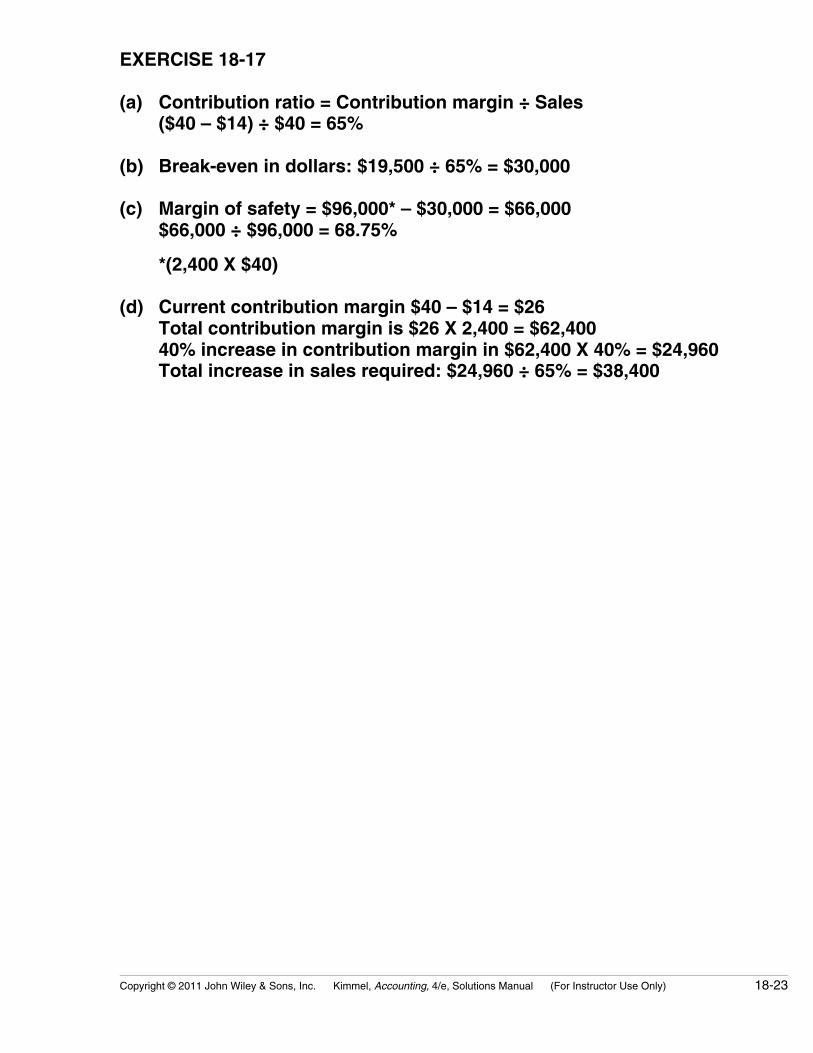
EXERCISE 18-17
(a) Contribution ratio = Contribution margin ÷ Sales($40 – $14) ÷ $40 = 65%
(b) Break-even in dollars: $19,500 ÷ 65% = $30,000
(c) Margin of safety = $96,000* – $30,000 = $66,000$66,000 ÷ $96,000 = 68.75%
*(2,400 X $40)
(d) Current contribution margin $40 – $14 = $26Total contribution margin is $26 X 2,400 = $62,40040% increase in contribution margin in $62,400 X 40% = $24,960Total increase in sales required: $24,960 ÷ 65% = $38,400
18-24 Copyright © 2011 John Wiley & Sons, Inc. Kimmel, Accounting, 4/e, Solutions Manual (For Instructor Use Only)
SOLUTIONS TO PROBLEMS
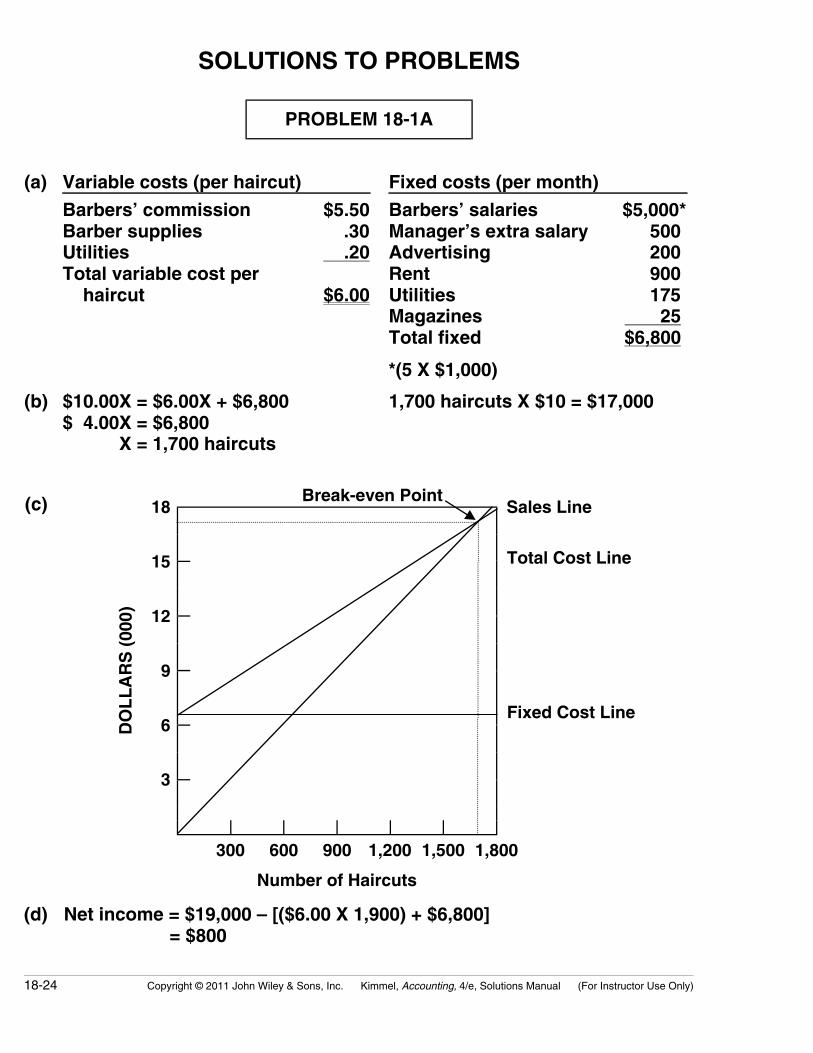
PROBLEM 18-1A
(a) Variable costs (per haircut) Fixed costs (per month)
Barbers’ commission $5.50Barber supplies .30Utilities .20Total variable cost per haircut $6.00
Barbers’ salaries $5,000*Manager’s extra salary 500Advertising 200Rent 900Utilities 175Magazines 25Total fixed $6,800
*(5 X $1,000)
(b) $10.00X = $6.00X + $6,800$ 4.00X = $6,800 X = 1,700 haircuts
1,700 haircuts X $10 = $17,000
Break-even Point(c) 18 Sales Line
15 Total Cost Line
12
9
Fixed Cost Line 6
3
DO
LL
AR
S (
000)
300 600 900 1,200 1,500 1,800
Number of Haircuts
(d) Net income = $19,000 – [($6.00 X 1,900) + $6,800]= $800
Copyright © 2011 John Wiley & Sons, Inc. Kimmel, Accounting, 4/e, Solutions Manual (For Instructor Use Only) 18-25
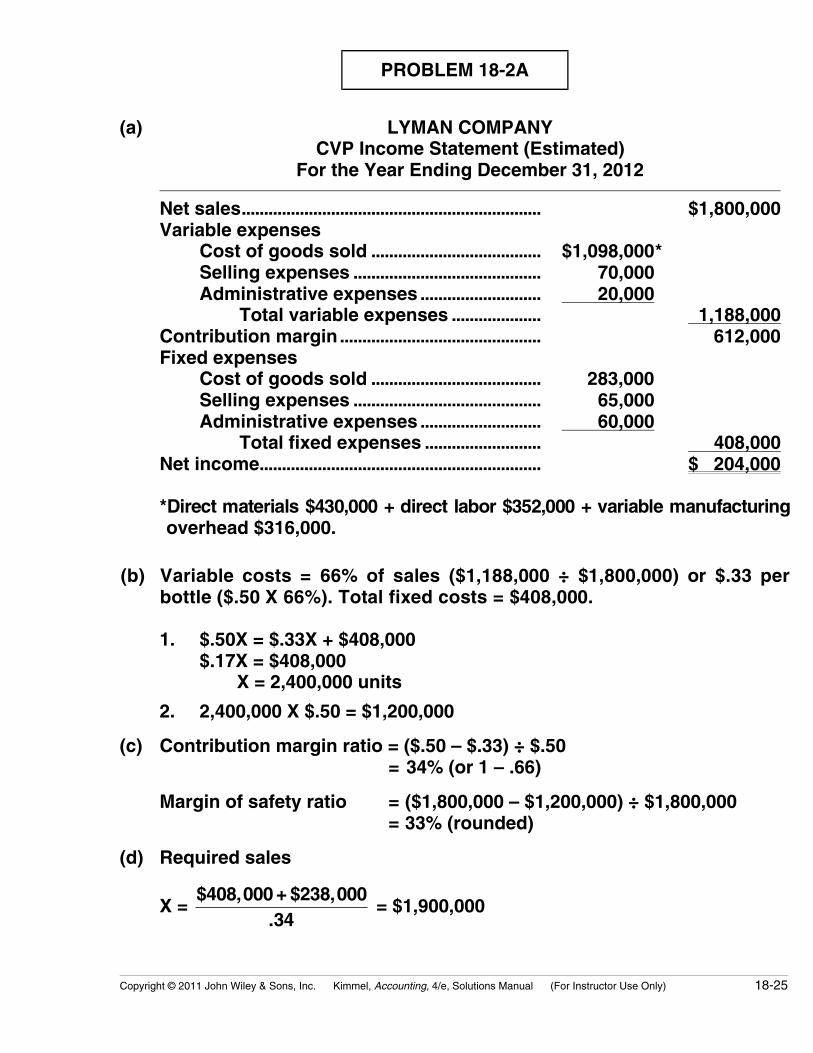
PROBLEM 18-2A
(a) LYMAN COMPANYCVP Income Statement (Estimated)
For the Year Ending December 31, 2012 Net sales................................................................... $1,800,000Variable expenses
Cost of goods sold ...................................... $1,098,000*Selling expenses .......................................... 70,000Administrative expenses ........................... 20,000
Total variable expenses .................... 1,188,000Contribution margin............................................. 612,000Fixed expenses
Cost of goods sold ...................................... 283,000Selling expenses .......................................... 65,000Administrative expenses ........................... 60,000
Total fixed expenses .......................... 408,000Net income............................................................... $ 204,000
*Direct materials $430,000 + direct labor $352,000 + variable manufacturingoverhead $316,000.
(b) Variable costs = 66% of sales ($1,188,000 ÷ $1,800,000) or $.33 perbottle ($.50 X 66%). Total fixed costs = $408,000.
1. $.50X = $.33X + $408,000$.17X = $408,000 X = 2,400,000 units
2. 2,400,000 X $.50 = $1,200,000
(c) Contribution margin ratio = ($.50 – $.33) ÷ $.50= 34% (or 1 – .66)
Margin of safety ratio = ($1,800,000 – $1,200,000) ÷ $1,800,000= 33% (rounded)
(d) Required sales
X = $408,000 + $238,000
.34 = $1,900,000
18-26 Copyright © 2011 John Wiley & Sons, Inc. Kimmel, Accounting, 4/e, Solutions Manual (For Instructor Use Only)
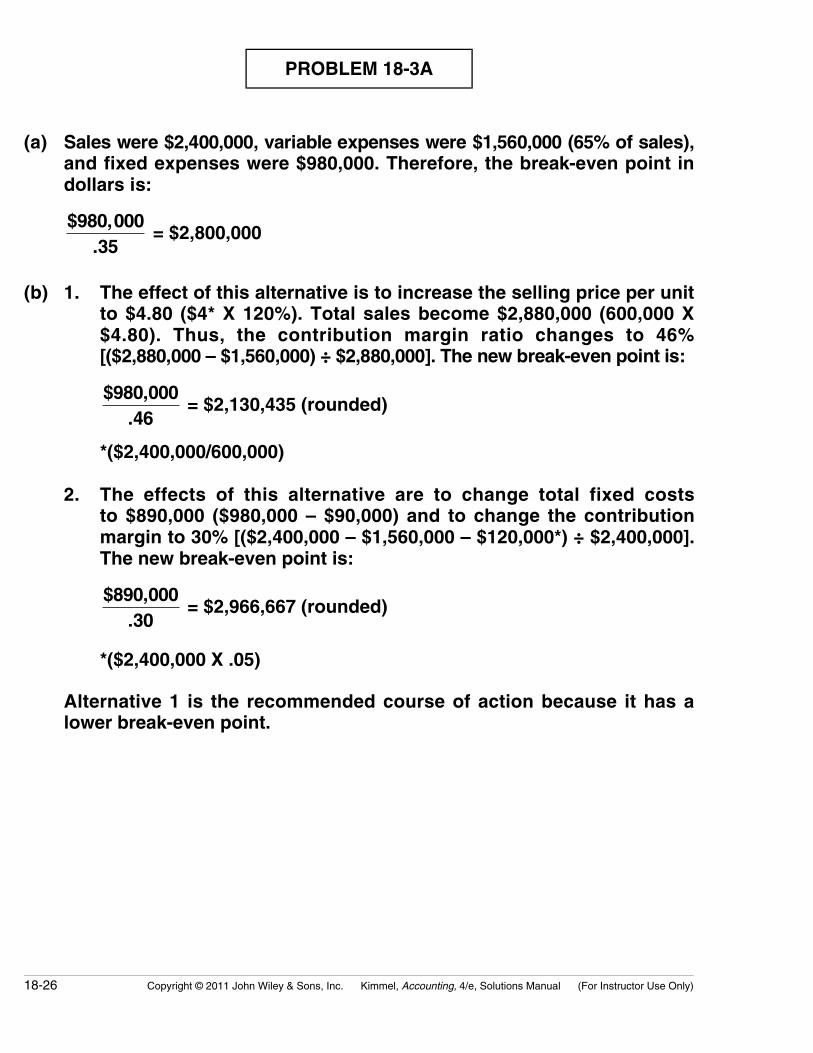
PROBLEM 18-3A
(a) Sales were $2,400,000, variable expenses were $1,560,000 (65% of sales),and fixed expenses were $980,000. Therefore, the break-even point indollars is:
$980,000.35
= $2,800,000
(b) 1. The effect of this alternative is to increase the selling price per unitto $4.80 ($4* X 120%). Total sales become $2,880,000 (600,000 X$4.80). Thus, the contribution margin ratio changes to 46%[($2,880,000 – $1,560,000) ÷ $2,880,000]. The new break-even point is:
$980,000.46
= $2,130,435 (rounded)
*($2,400,000/600,000)
2. The effects of this alternative are to change total fixed coststo $890,000 ($980,000 – $90,000) and to change the contributionmargin to 30% [($2,400,000 – $1,560,000 – $120,000*) ÷ $2,400,000].The new break-even point is:
$890,000.30
= $2,966,667 (rounded)
*($2,400,000 X .05)
Alternative 1 is the recommended course of action because it has alower break-even point.
Copyright © 2011 John Wiley & Sons, Inc. Kimmel, Accounting, 4/e, Solutions Manual (For Instructor Use Only) 18-27
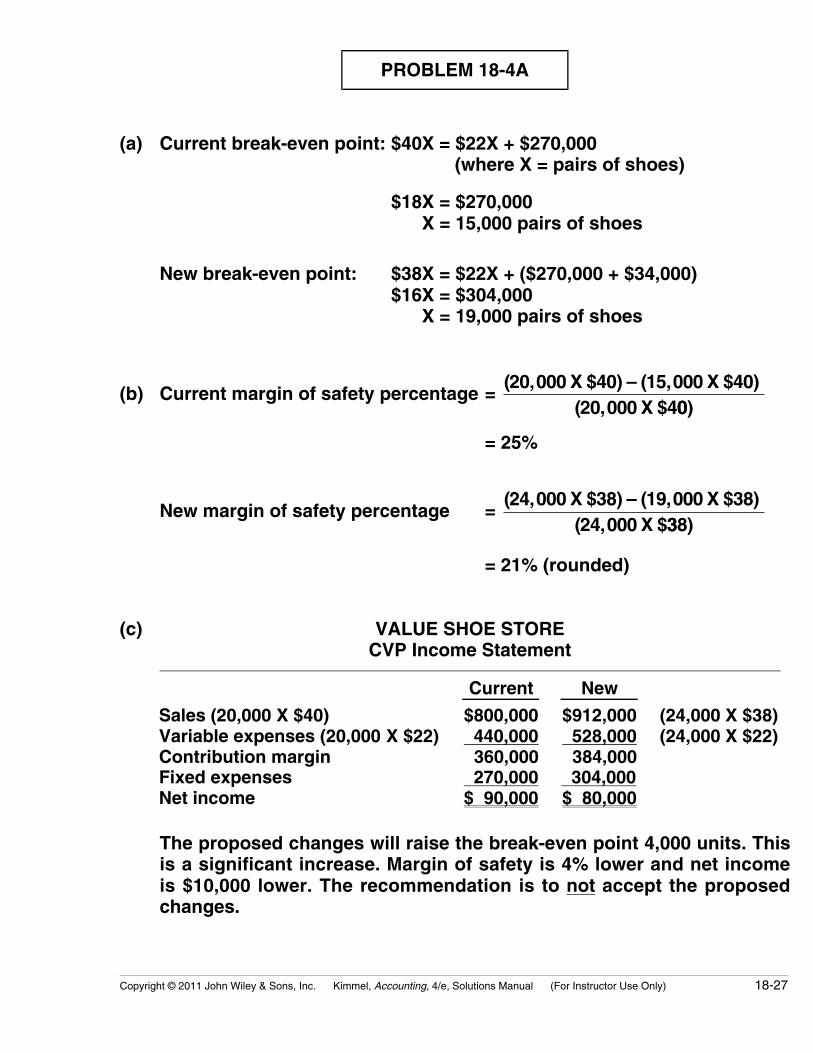
PROBLEM 18-4A
(a) Current break-even point: $40X = $22X + $270,000(where X = pairs of shoes)
$18X = $270,000X = 15,000 pairs of shoes
New break-even point: $38X = $22X + ($270,000 + $34,000)$16X = $304,000
X = 19,000 pairs of shoes
(b) Current margin of safety percentage = (20,000 X $40) – (15,000 X $40)
(20,000 X $400)
= 25%
New margin of safety percentage = (24,000 X $38) – (19,000 X $38)
(24,000 X $338)
= 21% (rounded)
(c) VALUE SHOE STORECVP Income Statement
Current New
Sales (20,000 X $40)Variable expenses (20,000 X $22)Contribution marginFixed expensesNet income
$800,000 440,000 360,000 270,000$ 90,000
$912,000 528,000 384,000 304,000$ 80,000
(24,000 X $38)(24,000 X $22)
The proposed changes will raise the break-even point 4,000 units. Thisis a significant increase. Margin of safety is 4% lower and net incomeis $10,000 lower. The recommendation is to not accept the proposedchanges.
18-28 Copyright © 2011 John Wiley & Sons, Inc. Kimmel, Accounting, 4/e, Solutions Manual (For Instructor Use Only)
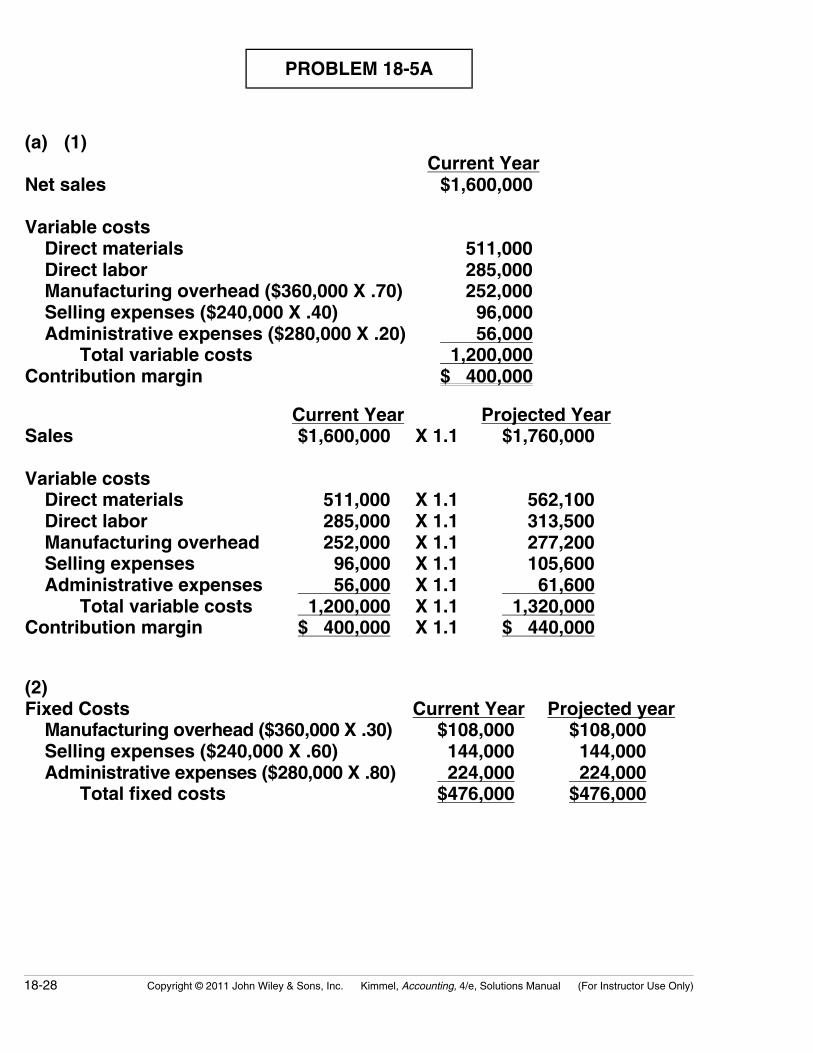
PROBLEM 18-5A
(a) (1)Current Year
Net sales
Variable costsDirect materialsDirect laborManufacturing overhead ($360,000 X .70)Selling expenses ($240,000 X .40)Administrative expenses ($280,000 X .20)
Total variable costsContribution margin
$1,600,000
511,000285,000252,000
96,000 56,000 1,200,000$ 400,000
Current Year Projected YearSales
Variable costsDirect materialsDirect laborManufacturing overheadSelling expensesAdministrative expenses
Total variable costsContribution margin
$1,600,000
511,000285,000252,000
96,000 56,000 1,200,000$ 400,000
X 1.1
X 1.1X 1.1X 1.1X 1.1X 1.1X 1.1X 1.1
$1,760,000
562,100313,500277,200105,600
61,600 1,320,000$ 440,000
(2)Fixed Costs Current Year Projected year
Manufacturing overhead ($360,000 X .30)Selling expenses ($240,000 X .60)Administrative expenses ($280,000 X .80)
Total fixed costs
$108,000144,000
224,000$476,000
$108,000144,000
224,000$476,000
Copyright © 2011 John Wiley & Sons, Inc. Kimmel, Accounting, 4/e, Solutions Manual (For Instructor Use Only) 18-29
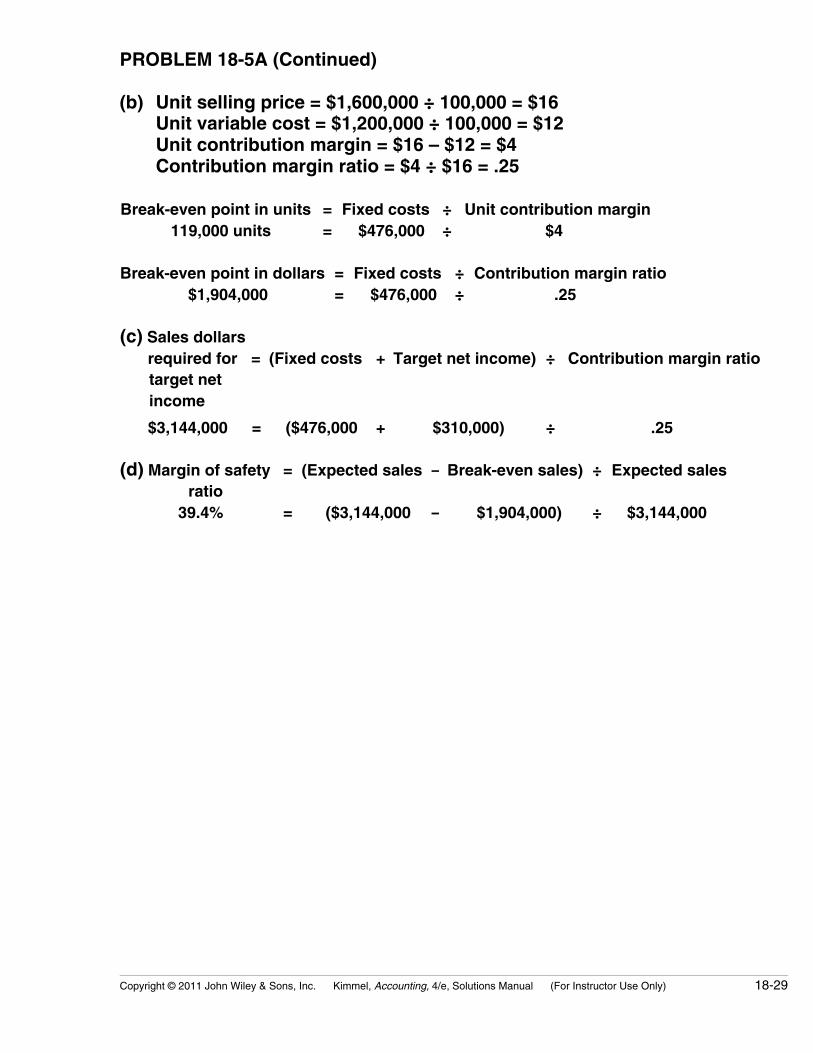
PROBLEM 18-5A (Continued)
(b) Unit selling price = $1,600,000 ÷ 100,000 = $16Unit variable cost = $1,200,000 ÷ 100,000 = $12Unit contribution margin = $16 – $12 = $4Contribution margin ratio = $4 ÷ $16 = .25
Break-even point in units = Fixed costs ÷ Unit contribution margin119,000 units = $476,000 ÷ $4
Break-even point in dollars = Fixed costs ÷ Contribution margin ratio$1,904,000 = $476,000 ÷ .25
(c) Sales dollarsrequired for = (Fixed costs + Target net income) ÷ Contribution margin ratiotarget netincome
$3,144,000 = ($476,000 + $310,000) ÷ .25
(d) Margin of safetyratio
= (Expected sales – Break-even sales) ÷ Expected sales
39.4% = ($3,144,000 – $1,904,000) ÷ $3,144,000
18-30 Copyright © 2011 John Wiley & Sons, Inc. Kimmel, Accounting, 4/e, Solutions Manual (For Instructor Use Only)
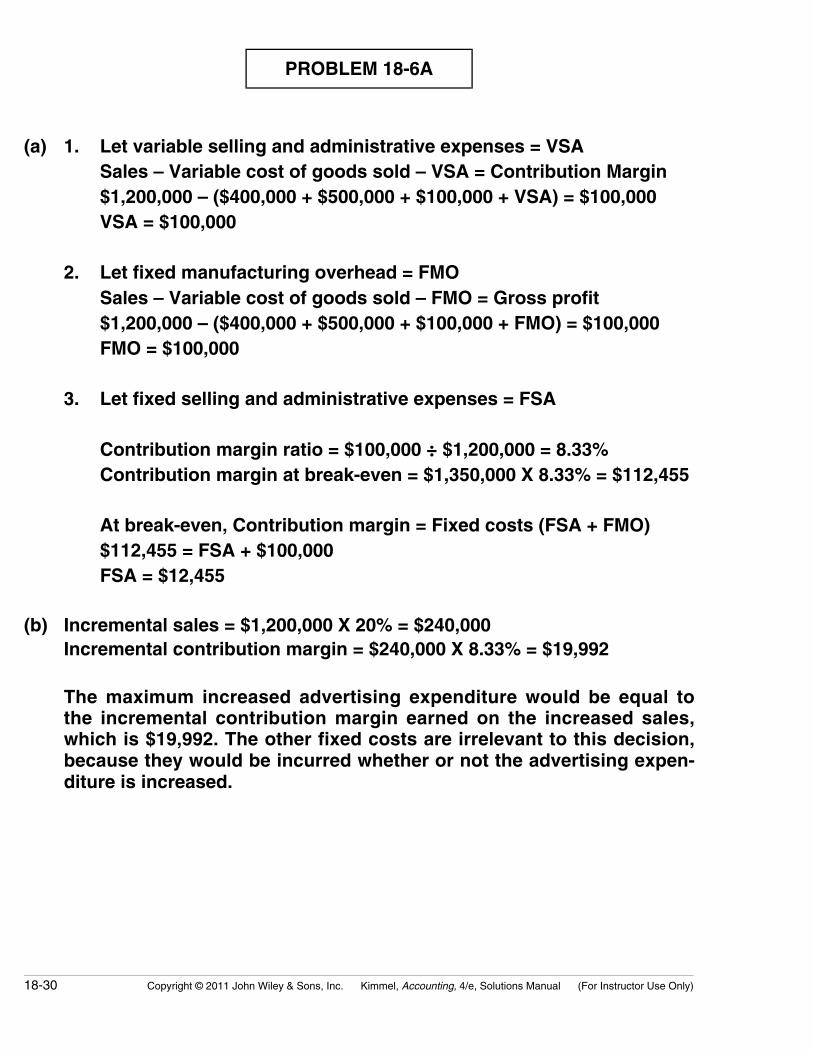
PROBLEM 18-6A
(a) 1. Let variable selling and administrative expenses = VSASales – Variable cost of goods sold – VSA = Contribution Margin$1,200,000 – ($400,000 + $500,000 + $100,000 + VSA) = $100,000VSA = $100,000
2. Let fixed manufacturing overhead = FMOSales – Variable cost of goods sold – FMO = Gross profit$1,200,000 – ($400,000 + $500,000 + $100,000 + FMO) = $100,000FMO = $100,000
3. Let fixed selling and administrative expenses = FSA
Contribution margin ratio = $100,000 ÷ $1,200,000 = 8.33%Contribution margin at break-even = $1,350,000 X 8.33% = $112,455
At break-even, Contribution margin = Fixed costs (FSA + FMO)$112,455 = FSA + $100,000FSA = $12,455
(b) Incremental sales = $1,200,000 X 20% = $240,000Incremental contribution margin = $240,000 X 8.33% = $19,992
The maximum increased advertising expenditure would be equal tothe incremental contribution margin earned on the increased sales,which is $19,992. The other fixed costs are irrelevant to this decision,because they would be incurred whether or not the advertising expen-diture is increased.
Copyright © 2011 John Wiley & Sons, Inc. Kimmel, Accounting, 4/e, Solutions Manual (For Instructor Use Only) 18-31
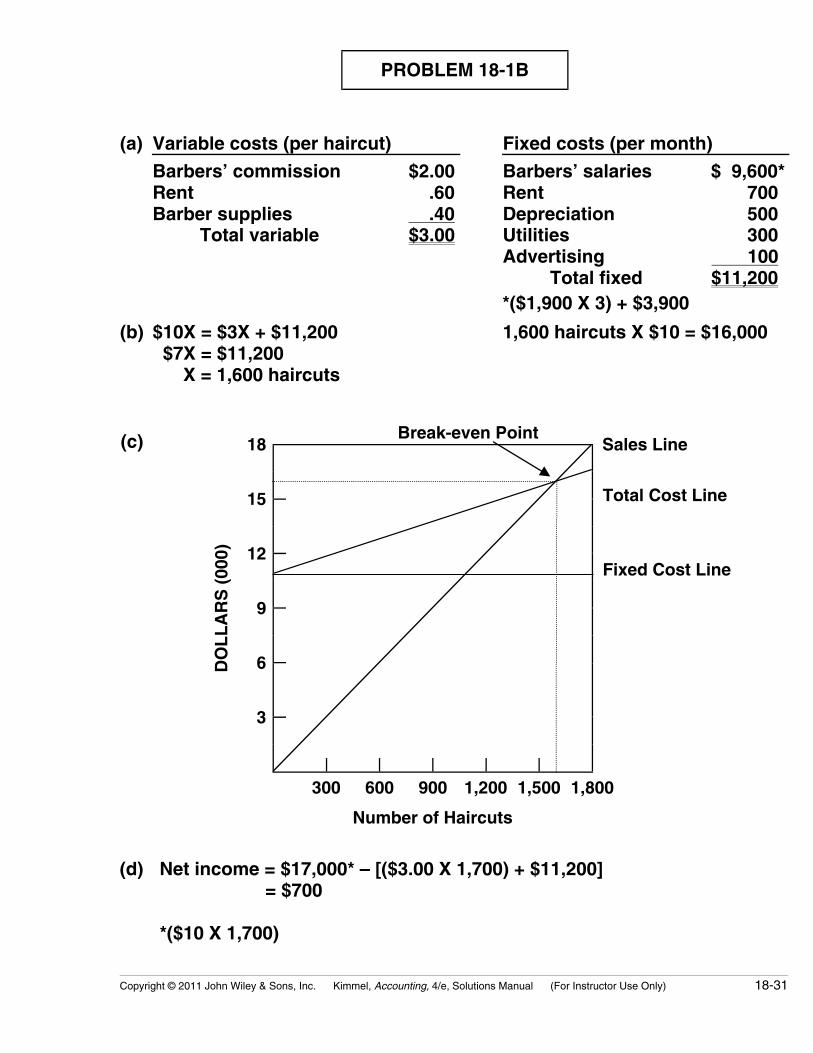
PROBLEM 18-1B
(a) Variable costs (per haircut) Fixed costs (per month)
Barbers’ commission $2.00Rent .60Barber supplies .40
Total variable $3.00
Barbers’ salaries $ 9,600*Rent 700Depreciation 500Utilities 300Advertising 100
Total fixed $11,200*($1,900 X 3) + $3,900
(b) $10X = $3X + $11,200 $7X = $11,200 X = 1,600 haircuts
1,600 haircuts X $10 = $16,000
Break-even Point(c) 18 Sales Line
15 Total Cost Line
12 Fixed Cost Line
9
6
3
DO
LL
AR
S (
000)
300 600 900 1,200 1,500 1,800
Number of Haircuts
(d) Net income = $17,000* – [($3.00 X 1,700) + $11,200]= $700
*($10 X 1,700)
18-32 Copyright © 2011 John Wiley & Sons, Inc. Kimmel, Accounting, 4/e, Solutions Manual (For Instructor Use Only)
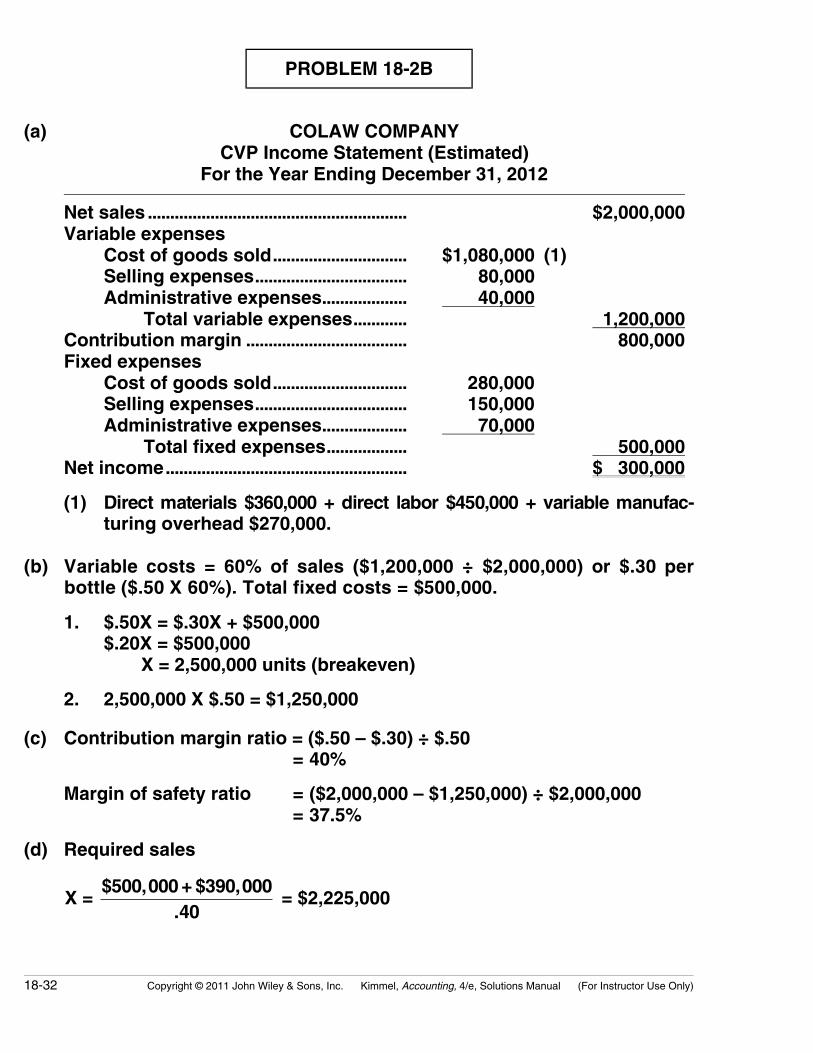
PROBLEM 18-2B
(a) COLAW COMPANYCVP Income Statement (Estimated)
For the Year Ending December 31, 2012 Net sales .......................................................... $2,000,000Variable expenses
Cost of goods sold.............................. $1,080,000 (1)Selling expenses.................................. 80,000Administrative expenses................... 40,000
Total variable expenses............ 1,200,000Contribution margin .................................... 800,000Fixed expenses
Cost of goods sold.............................. 280,000Selling expenses.................................. 150,000Administrative expenses................... 70,000
Total fixed expenses.................. 500,000Net income...................................................... $ 300,000
(1) Direct materials $360,000 + direct labor $450,000 + variable manufac-turing overhead $270,000.
(b) Variable costs = 60% of sales ($1,200,000 ÷ $2,000,000) or $.30 perbottle ($.50 X 60%). Total fixed costs = $500,000.
1. $.50X = $.30X + $500,000$.20X = $500,000 X = 2,500,000 units (breakeven)
2. 2,500,000 X $.50 = $1,250,000
(c) Contribution margin ratio = ($.50 – $.30) ÷ $.50= 40%
Margin of safety ratio = ($2,000,000 – $1,250,000) ÷ $2,000,000= 37.5%
(d) Required sales
X = $500,000 + $390,000
.40 = $2,225,000
Copyright © 2011 John Wiley & Sons, Inc. Kimmel, Accounting, 4/e, Solutions Manual (For Instructor Use Only) 18-33
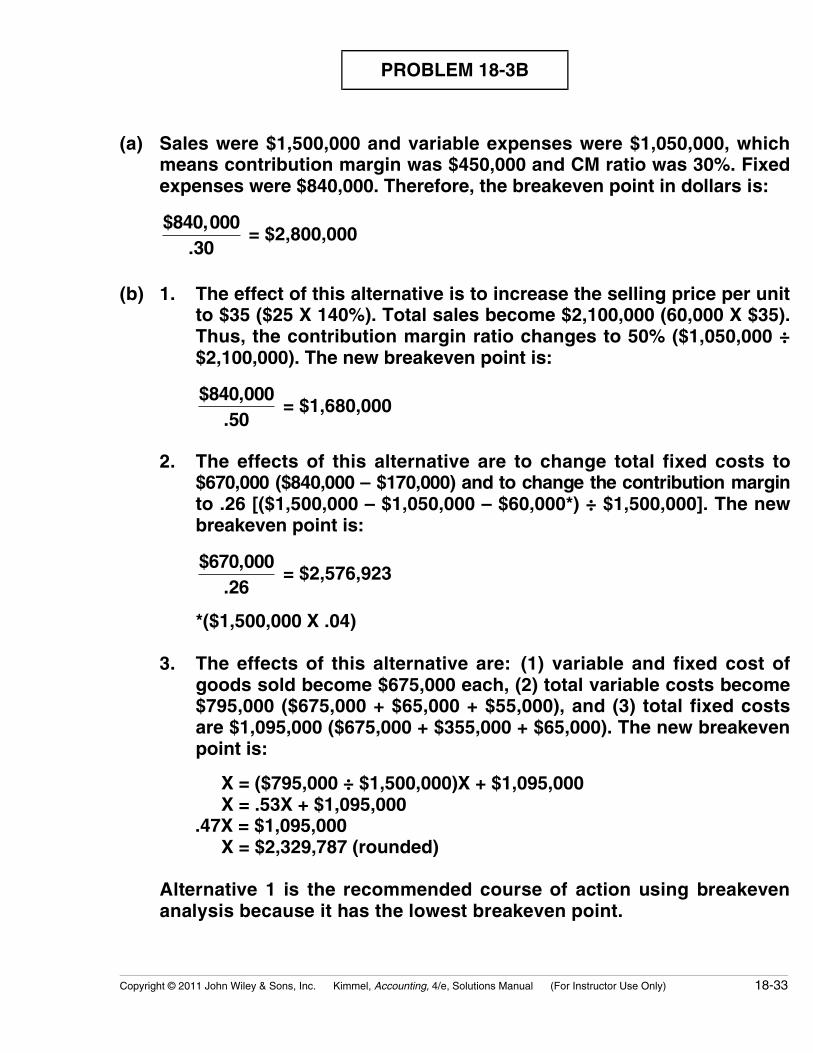
PROBLEM 18-3B
(a) Sales were $1,500,000 and variable expenses were $1,050,000, whichmeans contribution margin was $450,000 and CM ratio was 30%. Fixedexpenses were $840,000. Therefore, the breakeven point in dollars is:
$840,000.30
= $2,800,000
(b) 1. The effect of this alternative is to increase the selling price per unitto $35 ($25 X 140%). Total sales become $2,100,000 (60,000 X $35).Thus, the contribution margin ratio changes to 50% ($1,050,000 ÷$2,100,000). The new breakeven point is:
$840,000.50
= $1,680,000
2. The effects of this alternative are to change total fixed costs to$670,000 ($840,000 – $170,000) and to change the contribution marginto .26 [($1,500,000 – $1,050,000 – $60,000*) ÷ $1,500,000]. The newbreakeven point is:
$670,000.26
= $2,576,923
*($1,500,000 X .04)
3. The effects of this alternative are: (1) variable and fixed cost ofgoods sold become $675,000 each, (2) total variable costs become$795,000 ($675,000 + $65,000 + $55,000), and (3) total fixed costsare $1,095,000 ($675,000 + $355,000 + $65,000). The new breakevenpoint is:
X = ($795,000 ÷ $1,500,000)X + $1,095,000 X = .53X + $1,095,000.47X = $1,095,000 X = $2,329,787 (rounded)
Alternative 1 is the recommended course of action using breakevenanalysis because it has the lowest breakeven point.
18-34 Copyright © 2011 John Wiley & Sons, Inc. Kimmel, Accounting, 4/e, Solutions Manual (For Instructor Use Only)
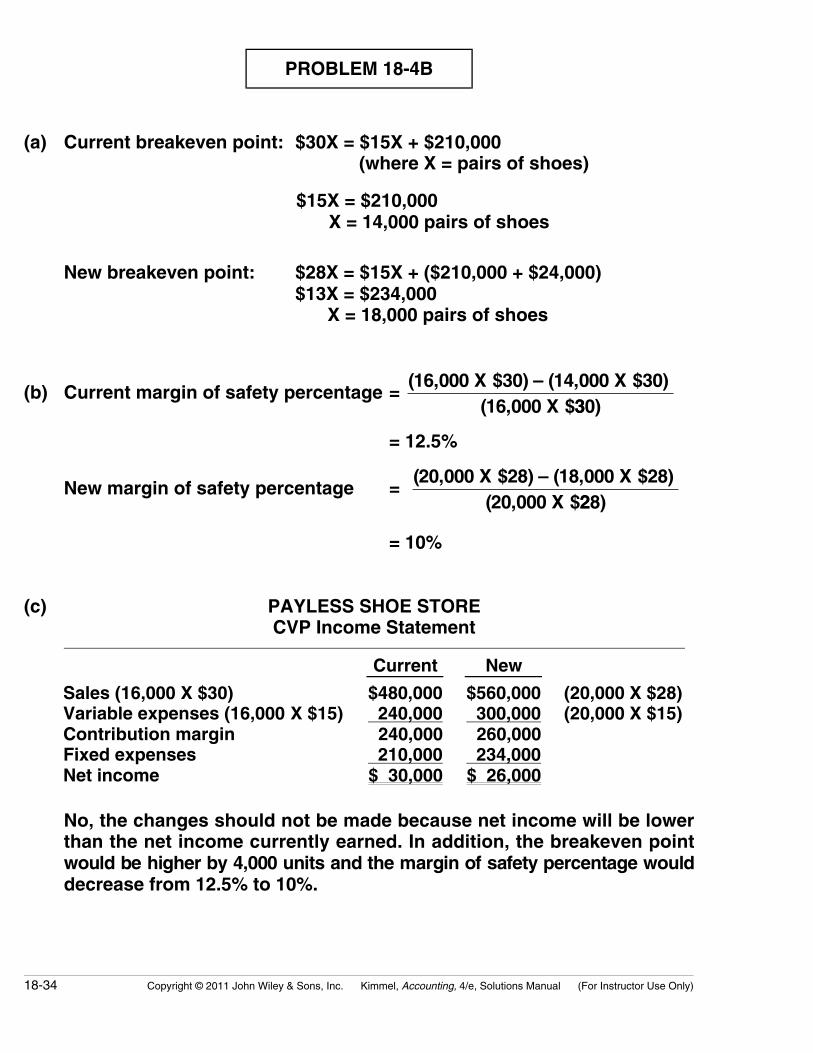
PROBLEM 18-4B
(a) Current breakeven point: $30X = $15X + $210,000(where X = pairs of shoes)
$15X = $210,000 X = 14,000 pairs of shoes
New breakeven point: $28X = $15X + ($210,000 + $24,000)$13X = $234,000 X = 18,000 pairs of shoes
(b) Current margin of safety percentage = (16,000 X $30) – (14,000 X $30)
(16,000 X $330)
= 12.5%
New margin of safety percentage = (20,000 X $28) – (18,000 X $28)
(20,000 X $228)
= 10%
(c) PAYLESS SHOE STORECVP Income Statement
Current New
Sales (16,000 X $30)Variable expenses (16,000 X $15)Contribution marginFixed expensesNet income
$480,000 240,000 240,000 210,000$ 30,000
$560,000 300,000 260,000 234,000$ 26,000
(20,000 X $28)(20,000 X $15)
No, the changes should not be made because net income will be lowerthan the net income currently earned. In addition, the breakeven pointwould be higher by 4,000 units and the margin of safety percentage woulddecrease from 12.5% to 10%.
Copyright © 2011 John Wiley & Sons, Inc. Kimmel, Accounting, 4/e, Solutions Manual (For Instructor Use Only) 18-35
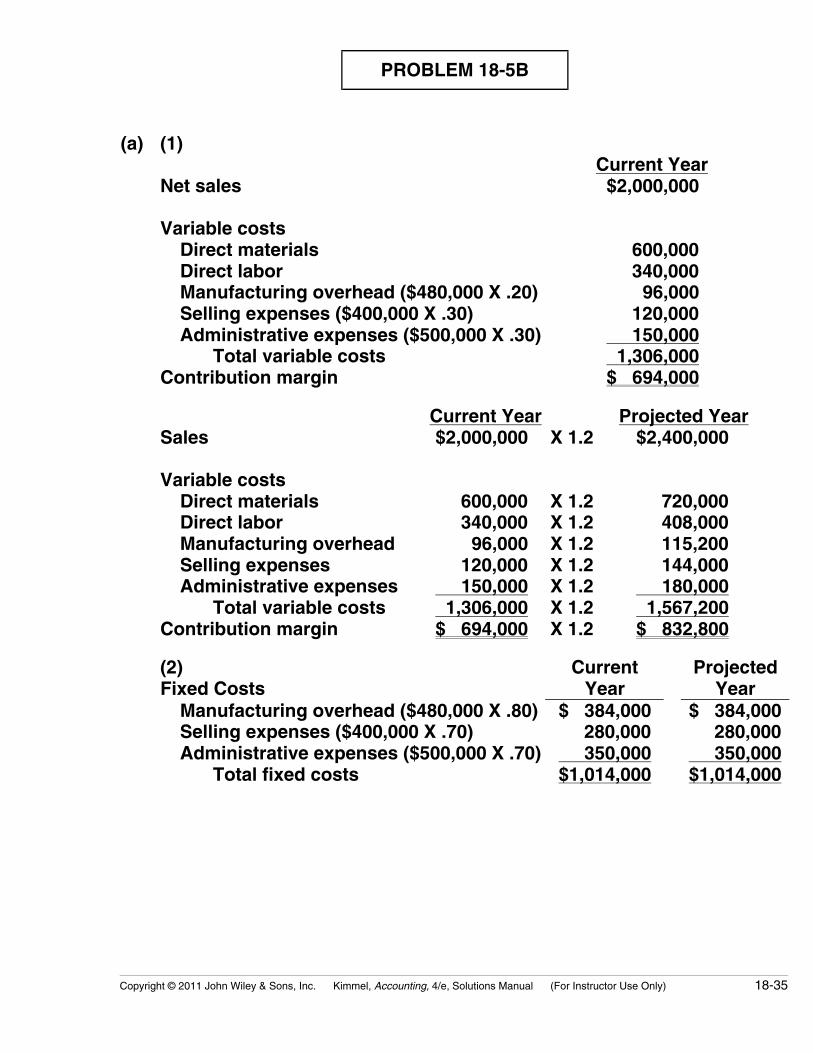
PROBLEM 18-5B
(a) (1)Current Year
Net sales
Variable costsDirect materialsDirect laborManufacturing overhead ($480,000 X .20)Selling expenses ($400,000 X .30)Administrative expenses ($500,000 X .30)
Total variable costsContribution margin
$2,000,000
600,000340,000
96,000120,000
150,000 1,306,000$ 694,000
Current Year Projected YearSales
Variable costsDirect materialsDirect laborManufacturing overheadSelling expensesAdministrative expenses
Total variable costsContribution margin
$2,000,000
600,000340,000
96,000120,000
150,000 1,306,000$ 694,000
X 1.2
X 1.2X 1.2X 1.2X 1.2X 1.2X 1.2X 1.2
$2,400,000
720,000408,000115,200144,000
180,000 1,567,200$ 832,800
(2) Current ProjectedFixed Costs Year Year
Manufacturing overhead ($480,000 X .80)Selling expenses ($400,000 X .70)Administrative expenses ($500,000 X .70)
Total fixed costs
$ 384,000280,000
350,000$1,014,000
$ 384,000280,000
350,000$1,014,000

18-36 Copyright © 2011 John Wiley & Sons, Inc. Kimmel, Accounting, 4/e, Solutions Manual (For Instructor Use Only)
PROBLEM 18-5B (Continued)
(b) Unit selling price = $2,000,000 ÷ 100,000 = $20.00Unit variable cost = $1,306,000 ÷ 100,000 = $13.06Unit contribution margin = $20.00 – $13.06 = $6.94Contribution margin ratio = $6.94 ÷ $20.00 = .347
Break-even point in units = Fixed costs ÷ Unit contribution margin146,110* units = $1,014,000 ÷ $6.94
*Rounded
Break-even point in dollars = Fixed costs ÷ Contribution margin ratio$2,922,190* = $1,014,000 ÷ .347
*Rounded
(c) Sales dollarsrequired for = (Fixed costs + Target net income) ÷ Contribution margin ratiotarget net income$4,000,000 = ($1,014,000 + $374,000) ÷ .347
(d) Margin of safetyratio
= (Expected sales – Break-even sales) ÷ Expected sales
27% = ($4,000,000 – $2,922,190) ÷ 4,000,000
(e) (1)
Net sales
Variable costsDirect materialsDirect labor ($340,000 – $140,000)Manufacturing overhead ($480,000 X .10)Selling expenses ($400,000 X .80)Administrative expenses ($500,000 X .30)
Total variable costsContribution margin
$2,000,000
600,000200,000
48,000320,000
150,000 1,318,000$ 682,000

Copyright © 2011 John Wiley & Sons, Inc. Kimmel, Accounting, 4/e, Solutions Manual (For Instructor Use Only) 18-37
PROBLEM 18-5B (Continued)
(2) Contribution margin ratio = $682,000 ÷ $2,000,000 = .341
(3) Break-even point in dollars = $862,000 ÷ .341 = $2,527,859 (rounded)
Fixed costsManufacturing overhead ($480,000 X .90)Selling expenses ($400,000 X .20)Administrative expenses ($500,000 X .70)
Total fixed costs
$432,00080,000
350,000$862,000
The break-even point in dollars declined from $2,922,190 to $2,527,859.This means that overall the company’s risk has declined because itdoesn’t have to generate as much in sales. The two changes actuallyhad opposing effects on the break-even point. By changing to a morecommission based approach to compensate its sales staff the companyreduced its fixed costs, and therefore reduced its break-even point. Incontrast, the purchase of the new equipment increased the company’sfixed costs (by increasing its equipment depreciation) and reduced itsvariable direct labor cost, both of which would increase the break-evenpoint.
18-38 Copyright © 2011 John Wiley & Sons, Inc. Kimmel, Accounting, 4/e, Solutions Manual (For Instructor Use Only)
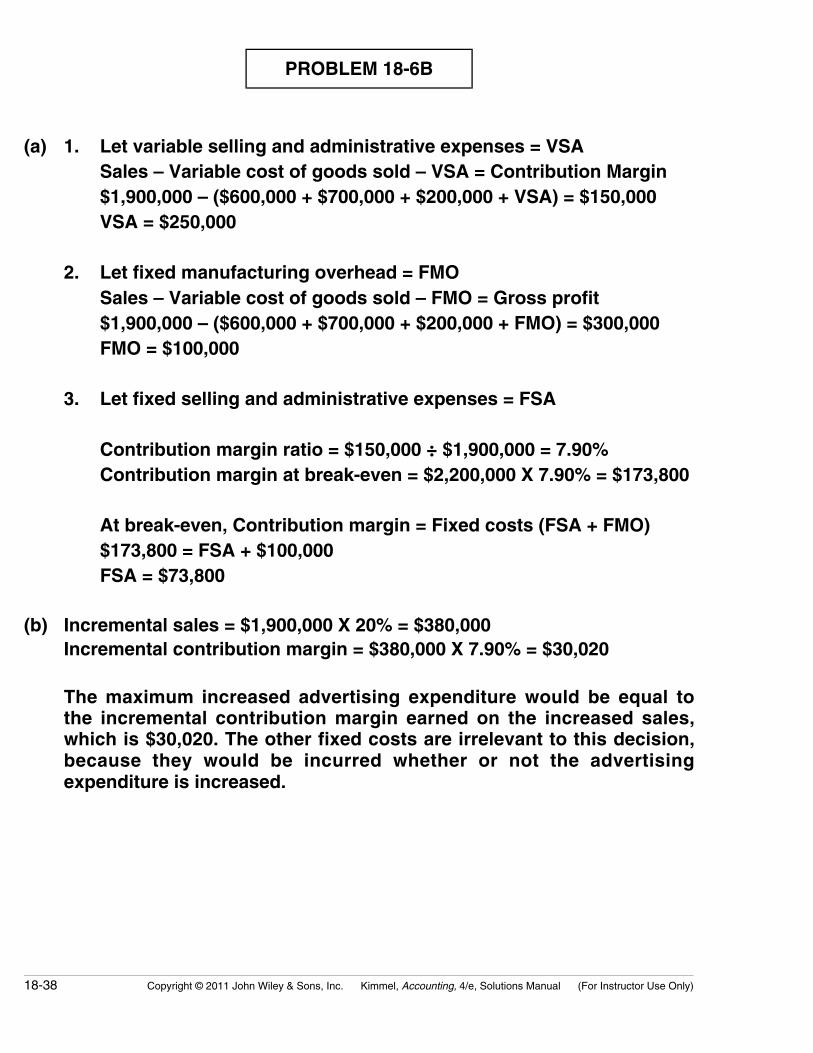
PROBLEM 18-6B
(a) 1. Let variable selling and administrative expenses = VSASales – Variable cost of goods sold – VSA = Contribution Margin$1,900,000 – ($600,000 + $700,000 + $200,000 + VSA) = $150,000VSA = $250,000
2. Let fixed manufacturing overhead = FMOSales – Variable cost of goods sold – FMO = Gross profit$1,900,000 – ($600,000 + $700,000 + $200,000 + FMO) = $300,000FMO = $100,000
3. Let fixed selling and administrative expenses = FSA
Contribution margin ratio = $150,000 ÷ $1,900,000 = 7.90%Contribution margin at break-even = $2,200,000 X 7.90% = $173,800
At break-even, Contribution margin = Fixed costs (FSA + FMO)$173,800 = FSA + $100,000FSA = $73,800
(b) Incremental sales = $1,900,000 X 20% = $380,000Incremental contribution margin = $380,000 X 7.90% = $30,020
The maximum increased advertising expenditure would be equal tothe incremental contribution margin earned on the increased sales,which is $30,020. The other fixed costs are irrelevant to this decision,because they would be incurred whether or not the advertisingexpenditure is increased.

Copyright © 2011 John Wiley & Sons, Inc. Kimmel, Accounting, 4/e, Solutions Manual (For Instructor Use Only) 18-39
BYP 18-1 DECISION MAKING ACROSS THE ORGANIZATION
(a)(1) Capital-Intensive (2) Labor-Intensive
Fixed manufacturing costs $2,508,000Incremental selling expenses 502,000Total fixed costs $3,010,000
Fixed manufacturing costs $1,538,000Incremental selling expenses 502,000Total fixed costs $2,040,000
Selling price $30.00Variable costs
Direct materials $5.00Direct labor 6.00Variable overhead 3.00Selling expenses 2.00 16.00
Contribution margin $14.00
Selling price $30.00Variable costs
Direct materials $5.50Direct labor 8.00Variable overhead 4.50Selling expenses 2.00 20.00
Contribution margin $10.00
Total fixed costs (1) $3,010,000 Total fixed costs (1) $2,040,000
Contribution margin per unit (2) $14.00 Contribution margin per unit (2) $10.00
Break-even in units (1) ÷ (2) 215,000 Break-even in units (1) ÷ (2) 204,000
(b) Martinez Company would be indifferent between the two manufac-turing methods at the volume (X) where total costs are equal.
$16X + $3,010,000 = $20X + $2,040,000 $4X = $970,000
X = 242,500 units
(c) Martinez should employ the capital-intensive manufacturing method ifannual sales are expected to exceed 242,500 units and the labor-intensivemanufacturing method if annual sales are not expected to exceed242,500 units. The labor-intensive method is more profitable for sales upto 242,500 units because the fixed costs are lower. The capital-intensivemethod is more profitable for sales above 242,500 units because itscontribution margin is higher.
18-40 Copyright © 2011 John Wiley & Sons, Inc. Kimmel, Accounting, 4/e, Solutions Manual (For Instructor Use Only)
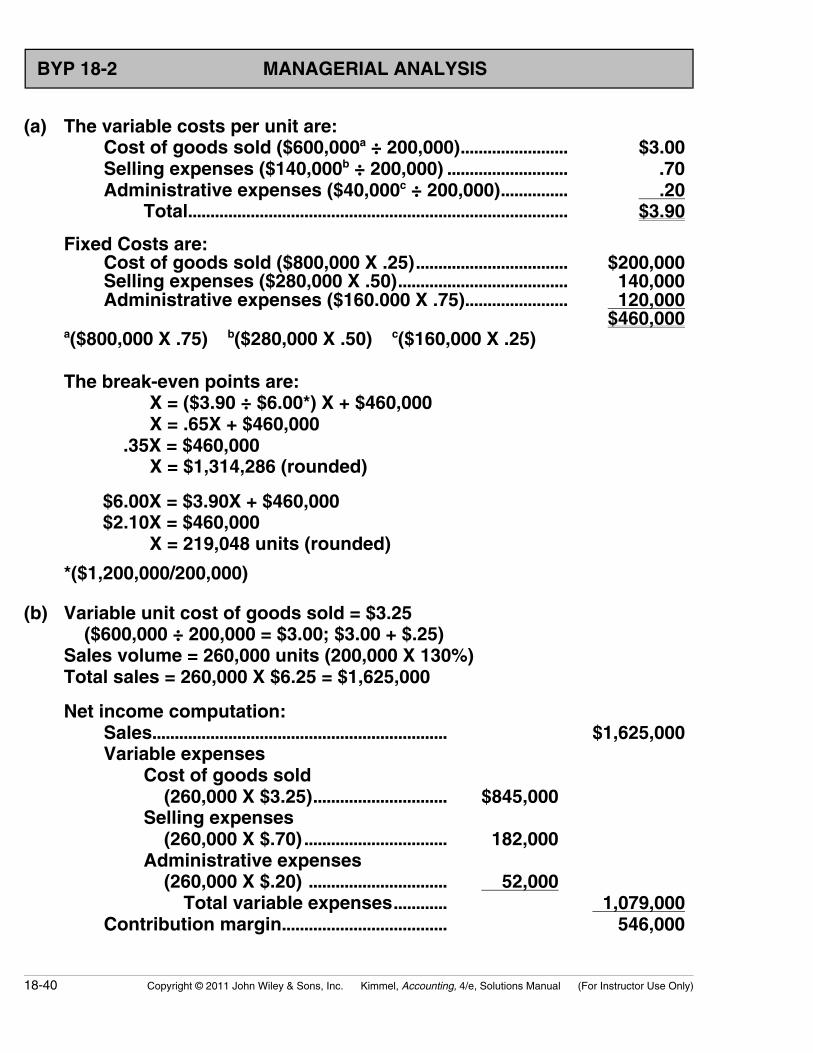
BYP 18-2 MANAGERIAL ANALYSIS
(a) The variable costs per unit are:Cost of goods sold ($600,000a ÷ 200,000)........................ $3.00Selling expenses ($140,000b ÷ 200,000) ........................... .70Administrative expenses ($40,000c ÷ 200,000)............... .20
Total..................................................................................... $3.90
Fixed Costs are:Cost of goods sold ($800,000 X .25).................................. $200,000Selling expenses ($280,000 X .50)...................................... 140,000Administrative expenses ($160.000 X .75)....................... 120,000
$460,000a($800,000 X .75) b($280,000 X .50) c($160,000 X .25)
The break-even points are: X = ($3.90 ÷ $6.00*) X + $460,000 X = .65X + $460,000 .35X = $460,000 X = $1,314,286 (rounded)
$6.00X = $3.90X + $460,000$2.10X = $460,000 X = 219,048 units (rounded)
*($1,200,000/200,000)
(b) Variable unit cost of goods sold = $3.25 ($600,000 ÷ 200,000 = $3.00; $3.00 + $.25)Sales volume = 260,000 units (200,000 X 130%)Total sales = 260,000 X $6.25 = $1,625,000
Net income computation:Sales.................................................................. $1,625,000Variable expenses
Cost of goods sold (260,000 X $3.25).............................. $845,000Selling expenses (260,000 X $.70) ................................ 182,000Administrative expenses (260,000 X $.20) ............................... 52,000
Total variable expenses............ 1,079,000Contribution margin..................................... 546,000

Copyright © 2011 John Wiley & Sons, Inc. Kimmel, Accounting, 4/e, Solutions Manual (For Instructor Use Only) 18-41
BYP 18-2 (Continued)
Fixed expensesCost of goods sold ............................. $200,000Selling expenses ................................. 140,000Administrative expenses .................. 120,000
Total fixed expenses ................. 460,000Net income...................................................... $ 86,000
X = ($1,079,000 ÷ $1,625,000)X + $460,000 X = .66X + $460,000.34X = $460,000 X = $1,352,941 (rounded)
Profits and the break-even point would both increase.
(c) Sales [320,000 (1) X ($6.00 – $.30)] .................. $1,824,000Variable expenses
Cost of goods sold (320,000 X $3.00) ...................................... $960,000Selling expenses (320,000 X $.79) .......... 252,800Administrative expenses (320,000 X $.20) ....................................... 64,000
Total variable expenses .................... 1,276,800Contribution margin............................................. 547,200Fixed expenses
Cost of goods sold ...................................... $200,000Selling expenses ($140,000 + $35,000)................................ 175,000Administrative expenses ........................... 120,000
Total fixed expenses .......................... 495,000Net income............................................................... $ 52,200
(1) Sales volume = 200,000 X 160% = 320,000
X = ($1,276,800 ÷ $1,824,000)X + $495,000 X = .70X + $495,000
.30X = $495,000 X = $1,650,000
Profits and the break-even point would both increase.
(d) Sally’s plan should be accepted. It produces a higher net income anda lower break-even point than Terry’s plan.
18-42 Copyright © 2011 John Wiley & Sons, Inc. Kimmel, Accounting, 4/e, Solutions Manual (For Instructor Use Only)
BYP 18-3 REAL-WORLD FOCUS
(a) Sweeteners and packaging are a variable cost to Coca-Cola becausetheir use is directly proportional to the amount of product produced. Ifthe unit cost of a variable cost item increases, the contribution marginwill decline. This will lead to a decline in net income unless the companycan increase its selling price, increase the number of units it sells, orreduce other costs.
(b) This description makes the marketing expenditures sound like they area variable cost, since it suggests that they vary with the amount of unitssold. However, unlike variable costs, the relationship of marketing costsis not directly proportional to sales, since other factors also influenceunits sold. Thus, it is not a pure variable cost. However, it is also not afixed cost, in that there usually is a relationship between marketingexpenditures and sales. For CVP purposes, it might best be handled asa mixed cost, having both a fixed and variable component.
(c) The first measure, gallon shipments of concentrates and syrups, is theactivity index, since it best reflects the company’s production and salesactivity at the wholesale level, its primary line of business. The secondmeasure, unit cases of finished product, indicates the amount ofactivity by Coke’s primary customers, the bottlers. Coke also keepstrack of this since it provides information about what is happening atthe retail level.
Copyright © 2011 John Wiley & Sons, Inc. Kimmel, Accounting, 4/e, Solutions Manual (For Instructor Use Only) 18-43
BYP 18-4 MANAGERIAL ACCOUNTING ON THE WEB
(a) The description of the production process is as follows:
The production of hard candy begins with the blending, cooking, andkneading of ingredients. Workers add flavoring and coloring when thecandy is kneaded. The candy is then pressed out and a roll of thickchocolate is placed in the middle of the candy. Workers then roll eachend of the product over the middle to form a pillow shape. The roll isstretched by hand at the chicken bone machine so that the width of theroll is the width of the average chicken bone, a difficult procedure.Next, the elongated roll is fed into the cutting machine. The end resultis a candy which tastes of sweet cinnamon and has a luscious surpriseof chocolate in the middle.
(b) The following costs might be identified as variable: labor (stretchingchicken bones, feeding into cutting machine), materials (flavoring, coloring,chocolate).
The following costs might be identified as fixed: depreciation of machinery,indirect labor, and utilities.
18-44 Copyright © 2011 John Wiley & Sons, Inc. Kimmel, Accounting, 4/e, Solutions Manual (For Instructor Use Only)
BYP 18-5 COMMUNICATION ACTIVITY
To: My Roommate
From: Your Roommate
Subject: Cost-Volume-Profit Questions
In response to your request for help, I provide you the following:
(a) The mathematical formula for break-even sales is:
Break-even Sales = Variable Costs + Fixed Costs
Break-even sales in dollars is found by expressing variable costs as apercentage of unit selling price. For example, if the percentage is 70%,the break-even formula becomes X = .70X + Fixed Costs. The answer willbe in sales dollars.
Break-even sales in units is found by using unit selling price and unitvariable costs in the formula. For example, if the selling price is $300and variable costs are $210, the break-even formula becomes $300X =$210X + Fixed Costs. The answer will be in sales units.
(b) The formulas for contribution margin per unit and contribution marginratio differ as shown below:
Unit Selling Price – Unit Variable Costs = Contribution Margin per Unit
Contribution Margin per Unit ÷ Unit Selling Price = Contribution Margin Ratio
You can see that CM per Unit is used in computing the CM ratio.
(c) When contribution margin is used to determine break-even sales, totalfixed costs are divided by either the contribution margin ratio or contri-bution margin per unit. Using the CM ratio results in determining thebreak-even point in dollars. Using CM per unit results in determiningthe break-even point in units.

Copyright © 2011 John Wiley & Sons, Inc. Kimmel, Accounting, 4/e, Solutions Manual (For Instructor Use Only) 18-45
BYP 18-5 (Continued)
The formula for determining break-even sales in dollars is:
Fixed Costs ÷ Contribution Margin Ratio = Break-even Sales in Dollars
The formula for determining break-even sales in units is:
Fixed Costs ÷ Contribution Margin per Unit = Break-even Sales in Units
I hope this memo answers your questions.

18-46 Copyright © 2011 John Wiley & Sons, Inc. Kimmel, Accounting, 4/e, Solutions Manual (For Instructor Use Only)
BYP 18-6 ETHICS CASE
(a) The stakeholders in this situation are:
� Jimmy Hester, accountant of Advanced Company.� The dislocated personnel of Advanced.� The senior management who made the decision.
(b) Jimmy is hiding an error and is knowingly deceiving the company’s management with inaccurate data.
(c) Jimmy’s alternatives are:
� Keep quiet.� Confess his mistake to management.
The students’ recommendations should recognize the practical aspectsof the situation but they should be idealistic and ethical. If the studentscan’t be totally ethical when really nothing is at stake, how can theyexpect to be ethical under real-world pressures?
Copyright © 2011 John Wiley & Sons, Inc. Kimmel, Accounting, 4/e, Solutions Manual (For Instructor Use Only) 18-47
BYP 18-7 ALL ABOUT YOU ACTIVITY
(a) The variable gasoline cost of going one mile in the hybrid car wouldbe $0.075 ($3.00/40). The variable gasoline cost of going one mile inthe traditional car would be $0.10 ($3.00/30).
(b) The savings per mile of driving the hybrid vehicle would be $0.025($0.10 – $0.075).
(c) In order to break even on your investment you would need to drive120,000 miles. This is determined by dividing the additional fixed costof $3,000 by the contribution margin per mile of $0.025.
(d) There are many other factors that you would want to consider in youranalysis. For example, do the vehicles differ in their expected repairbills, insurance costs, licensing fees, or ultimate resale value? Also,some states and some employers offer rebates for the purchase ofhybrid vehicles. In addition, your decision might be influenced by non-financial factors, such as a desire to reduce emissions.