Embed Size (px)
Citation preview

Cover Story 2-7Chairman’s Report 8-11Report of the Directors 12-15Programme for the 61st Annual General Meeting 16Notice of the Meeting 17-18Report of the Independent Auditors 19Consolidated Statement of Financial Position 20Consolidated Statement of Income 21Consolidated Statement of Comprehensive Income 22Consolidated Statement of Changes in Equity 23Consolidated Statement Cash Flows 24-25Statement of Financial Position 26Statement of Income 27Statement of Comprehensive Income 28Statement of Changes in Equity 29Statement of Cash Flows 30-31Notes to the Financial Statements 32-91Five Year Statistical Summary 92Social Distribution of Gross Income 2016 93Notes 94Procedure for Transfer of Shares 95Notes 96Proxy Form 97Notes 98Shareholder’s Questionnaire 99Notes 100-104

2
Have you ever taken time out to observe human behaviours and attitudes, and to reflect on how humans interact with one another and what can be seen as they interact? Relationships which form a part of the human experience require the capacity to trust, to care and to have an enquiring disposition. The stresses and strains which accompany transitioning into adulthood take away our innocence and replace it with cynicism and fear of so many things. As we become older, humans tend to forget the things we learnt while growing up.
Valuing our human connections
3
We lose our capacity to trust and become world weary, cynical about most everything and anything. We lose our “joie de vivre” and innocence. In our early stages of development, humans have an uncomplicated way of looking at life, and understand and value the importance of relationships. At that stage of development, we somehow intuitively recognise that we need each other on the journey of life. As we grow and mature, humans in spite of the slings and arrows of outrageous fortune, continue to hold firmly to the belief that relationships are to be valued as we encounter the forces of inevitable change and decay.
This reality has motivated us to refocus our attention and energies on the relational side of our corporate responsibility. As we retooled by way of structured Capital Expenditure programmes, to bring our company into the 21st Century, we recognised that for this vision to become reality and to bear fruit, all of our stakeholders, will have to be involved and be a part of this expanding relationship which will drive our company’s growth and future development.
In the fast paced environment of the 21st century, aided and abetted by the insidious culture of Social Media, the understanding of relationships has undergone a drastic change. Whether for the better or worse, is yet to be determined. For a significant section of the society, communication within relationships has been replaced with faceless texts, emojis and emoticons. The need for instant gratification has resulted in mankind no longer having an appreciation for the reality that there are no short cuts to be taken in the building and sustaining of meaningful relationships. Social Media and the Internet keeps us in touch but as some have discovered in painful ways, they are not to be considered as a substitute for getting to know a real person. This truth may be self-evident but a friendly word; a smile; empathy communicated in different ways, can make the difference in someone’s day.
In our early stages of development, humans have an uncomplicated way of looking at life, and understand and value the importance of relationships.

4
What this accomplishes, is satisfying that need which we all experience, and that is to have close connections with others which is just another way of saying that we all long for the intimacy of personal relationships.
Over the years of our Company’s existence, we have come to recognise and appreciate that there are a few basic requirements that are the foundation of the relationship we enjoy with our suppliers, employees, customers and shareholders. One such requirement is communication and that in its broadest possible understanding means dialogue. People enjoy speaking about themselves, their dreams, hopes and aspirations and what they think about many things. We have found out that as we share, our interconnectedness is strengthened resulting in multiple benefits. Another requirement is the building of trust. One of life’s truisms teaches us that people trust those who trust them. This in turn serves to remind us of the value and importance of relationships to enable us to get along with each other.
History is replete with examples of nation states and individuals who have attempted to travel the road of isolationism. Perhaps the words taken from, John Donne’s Mediation 17 “Devotions upon Emergent Occasions” served as our motivation to pursue the road of relationships:
“No man is an island, entire of itself.Everyman is a piece of the continent, a part of the main.Any man’s death diminishes me, because I am involved in Mankind. And therefore never send to know for whom the Bell tolls, it tolls for thee.”
Exploringnew relationships
If it is your intention to build relationships, then of necessity you need to go where people are.

5
If it is your intention to build relationships, then of necessity you need to go where people are. This understanding caused us to expand beyond the boundaries of Thirst Park and to create our Branches Network in Berbice, Linden, Essequibo and Bartica, and Demico House. The concept of taking the Annual General Meetings to the shareholders who are unable to come to Thirst Park had its genesis in that understanding while a variation of the same theme was explored and refined with the bringing of our Dealers to Thirst Park to familiarize them with the Production, Sales and Marketing aspects of our operations.

6
Sharing our mutual benefits
“Sometimes we need someone to turn the flashlight on for us, other times, we need to turn it on for others.”
Lizzie Velasquez

7
A better understanding of each other’s motivation and point of view has resulted in a closer and more meaningful working relationship with our Dealers and Customers. Our relationship with our employees is considered by us to be a work in progress as the dynamics within the relationship are fluid and require close monitoring and attention. Our attention to this relationship is reflected in our ensuring that the employees’ financial security and well-being are taken care of and that their work environment is conducive to ensuring that their contribution is maximised.
As we reflect on the growth and development of our Company over the years, the role of our Suppliers cannot be understated. The relationship we have enjoyed with our Suppliers has delivered multiple benefits to our mutual advantage. The improvements and upgrades to our production plants utilising 21st Century technology and the savings accrued as a result of better efficiencies and the significant reduction in waste were facilitated by way of the relationships we enjoy with our Suppliers.
All that will be accomplished within the vision we have for our Company as we journey together to the future will be as a result of the relationships we continue to enjoy with our suppliers, employees, customers and shareholders.
A better understanding of each other’s motivation and point of view has resulted in a closer and more meaningful working relationship...

8
Chairman‘s Report
My fellow shareholders, it gives me great pleasure to present my report on the performance of our Company for the period ended September 30, 2016 and to advise on the excellent results produced during the year.
The Profit after Tax for the Company was $4.357 billion compared to $2.569 billion in 2015, an increase of $1.788 billion. Included in this profit is a gain of $1.409 billion arising from the sale of its holding of ordinary shares in Banks Holdings Limited and Desnoes & Geddes (Jamaica) Ltd, and the dissolution of BCL (Barbados) Ltd which resulted in a surplus of $29.2 million over the cost of the Investment.
The Profit after Tax from the Company’s operating activities was $2.948 billion compared to $2.569 billion achieved in 2015, an increase of $379.0 million or 14.7%. These improved results were attributed to increases in revenues and physical unit sales, improvement in cost reduction and prudent management of our capital, human and financial resources.
“We rose above these challenges and achieved growth through investment in our quality brands and strategically placing our resources against the biggest growth opportunities.” Clifford Barrington Reis, C.C.H., Chairman / Managing Director

9
During the year we operated in a global environment where sluggish economic growth in most advanced economies continued, due in part to the decline in commodity prices and incremental increases in oil prices. The reduction in export earnings for Sugar, Bauxite, Rice and Timber has negatively affected the domestic environment. This, in combination with reduced public spending caused consumer uncertainty which led to reduced demand.
We rose above these challenges and achieved growth through investment in our quality brands and strategically placing our resources against the biggest growth opportunities. Necessary steps were taken to strengthen our Company’s operating capabilities to drive sustainable growth and value creation for our shareholders, customers and employees.
The Group’s turnover net of taxes was $25.516 billion compared to $24.875 billion in 2015, an increase of $641.0 million or 2.6%. The Group’s operational Profit before Tax was $6.528 billion compared to $5.285 billion, an increase of $1.243 billion or 23.5%. The Group’s Profit after Tax attributable to shareholders was $4.468 billion compared to $2.945 billion, an increase of $1.523 billion or 51.7 %.
The Group’s Net Asset Value per share has increased from $28.6 to $31.7 or by 10.8%, and the Company has increased its dividend proposal to shareholders to $0.88 per share unit resulting in an overall cost of $880 million. This is in addition to the special dividend of $0.60 per share unit that was paid in February 2016. Total dividends proposed for the current year equate to $1.480 billion.
Capital ExpenditureIn recent years the Company made capital expenditure decisions regarding investments in fixed assets as part of its journey of consolidation. These investments benefited the Company’s operations by increasing output capabilities, reducing costs and providing quality products to satisfy consumer taste and new demand. During the year a new Krones state-of-the-art Filler, along with associated Conveyors, a Bottle inspection facility and CIP Systems were installed in the Beer Plant.
An on-line Blow Moulding Machine was commissioned in the Water Bottling Plant and the upgrade of the Electrical Power Distribution System continued. The upgrading of Demico Restaurant and Bar facilities and the Fleet Replacement Policy with the acquisition of additional trucks and forklifts, continued during the year. Our I.C.T. Department’s capacity and capability were improved by way of System upgrades.
Citizens Bank Guyana IncThe Revenue of Citizens Bank Guyana Inc, a 51% owned subsidiary of the Company was $3.266 billion compared to $3.708 billion, a reduction of $442.0 million. Profit after Tax was $479.0 million compared to $907.0 million in 2015.The Total Assets increased from $43.1 billion by $7.1 billion or 16.5% to $50.2 billion. Loan Assets decreased from $30.7 billion to $29.2 billion and customers’ deposits increased from $34.9 billion to $42.1 billion. Earnings per share is $8.05 and Net Interest Income decreased from $2.65 billion in 2015 to $2.11 billion.

10
Chairman‘s Report
DividendsThe Board of Directors declared a first interim dividend of $0.25 per share unit which was paid on 16 May 2016. A second interim dividend of $0.25 per share unit was also paid on 17 October 2016 and now the Board recommends a final dividend of $0.38 per share unit with the overall cost being $880.0 million, an increase of $190.0 million or 27.5%. This is in addition to a special dividend that was paid in February 2016 of $0.60 per share unit. The total dividend payment for the year will be $1.480 Billion.
Growth in Shareholders’ ValueOver the years, continuous efforts have been made to increase shareholders’ equity. This was achieved by re-investing savings, reducing costs and the implementation of more efficient production processes. From the profits of $4.357 billion, a dividend payment of $1.480 billion is proposed leaving the amount of $2.877 billion for transfer to Retained Earnings. The total shareholders’ equity amounted to $28.541 billion compared to $25.569 billion in 2015, an increase of 11.6%.
Quality ControlFellow shareholders, the Company continues to comply with requirements that enable it to manufacture products that meet international standards. In this regard the implementation of dedicated activities to obtain continuous improvement and enhance the Company’s production efficiencies are given priority. For fiscal year 2015-2016, the Soft Drink and Novelty/Dairy Plants successfully completed their Recertification and Certification Process with Lloyds Register Control and South America Limited for the following:-
ISO 9001: 2008 - Quality Management SystemISO 22000: 2005 - Food Safety Management SystemFSSC 22000: 2014 - Food Safety System CertificationISO/TS 22002-1: 2009 - Prerequisite Programme on Food Safety
During the period under review, we have also achieved ISO Certification which is ISO/TS 22002-4:2013 for Prerequisite Programme on Packaging Manufacturing for our Non-returnable and PET Processes. In addition, we were successful at the Finance, and Environment and Safety audits that were conducted on our Company by the Coca Cola Administration. At the time of writing, the Company achieved high scores in the Guinness League of Excellence which resulted in the Company’s present position being 2nd in the Americas and 19th worldwide for the manufacture of quality Guinness.
Environmental ResponsibilityThe Company operates within the principles of sustainability so as to ensure the Health and Safety of its employees and to show concern for the environment. Our commitment to environmental responsibility is reflected in the ISO Certification 14001:2004 and 18001: 2007 - Environmental and Safety Standards in our manufacturing facilities.
“Over the years, continuous efforts have been made to increase shareholders’ equity...by re-investing savings, reducing costs and the implementation of more efficient production processes.”

11
Customer Service/DistributionWe manufacture local and international brands of products that are demanded by consumers across the Country. The investments in plant and machinery and good manufacturing practices allowed us the opportunity to build quality brands. Complemented by our flexible marketing model and our distribution capacity, we are able to ensure country-wide distribution of all of our products.Our export sales initiatives are improving. We have now extended into the North American market with the introduction of our Rum and Wine products, and Biscuits in the State of New York in the United States of America to satisfy the Guyanese diaspora.
Community Relations/PartnershipsThe Company continues to enjoy good relations with the Communities within which it operates. We have had ongoing community relation programmes in the form of sponsoring Brand Ambassadors, Sports Events, Apprenticeships and Work Study programmes. During the year we participated in the Country’s Jubilee Celebrations and presented a gift to the Nation of the Independence Arch which was placed at Agricola, the new Georgetown City limit. Additionally the Company sponsored a Mega Concert at the National Stadium and participated in the Guy Expo activities. In honour of the Jubilee celebration, the Company
launched a Jubilee Beer as well as a Jubilee Aged Rum.
Future OutlookThe continuing international economic uncertainty, and changing global weather patterns are projected to have negative macroeconomic consequences on the Nation. This will affect the way in which we manage our Company in the future. We have to continue to re-examine our core operational competencies, the exercise of prudent fiscal management and preparation of succession planning, to respond to the future challenges of managing our Company.
AcknowledgementI wish to thank the Executive Team and Employees who continue to dedicate their efforts towards the growth
and development of the Group. I also wish to thank my fellow Directors for their encouragement and
advice given throughout the year and also our shareholders, loyal customers, suppliers and
businesses who continue to support our products and services.

12
Boardof Directors Report
• Clifford Barrington Reis,C.C.H., Chairman / Managing Director Co-Managing Director / Marketing Director
Director Engineering Services Director
• Leslie B. Doodnauth, Worker Management Participation Board DirectorDirector
Human Resources / Trisco Director
board of directors left to right • Richard Berkeley Fields, S.C., Director• Michael Henry Pereira, Operations Director • Roy Errol Cheong, A.A., Vice Chairman• Christopher J. Fernandes, A.A., Director• Terrence Bynoe, Secretary / I.C.T. Executive • Dan Bryan Stoute, Director

13
• Clifford Barrington Reis,C.C.H., Chairman / Managing Director Co-Managing Director / Marketing Director
Director Engineering Services Director
• Leslie B. Doodnauth, Worker Management Participation Board DirectorDirector
Human Resources / Trisco Director
board of directors left to right • Richard Berkeley Fields, S.C., Director• Michael Henry Pereira, Operations Director • Roy Errol Cheong, A.A., Vice Chairman• Christopher J. Fernandes, A.A., Director• Terrence Bynoe, Secretary / I.C.T. Executive • Dan Bryan Stoute, Director
14
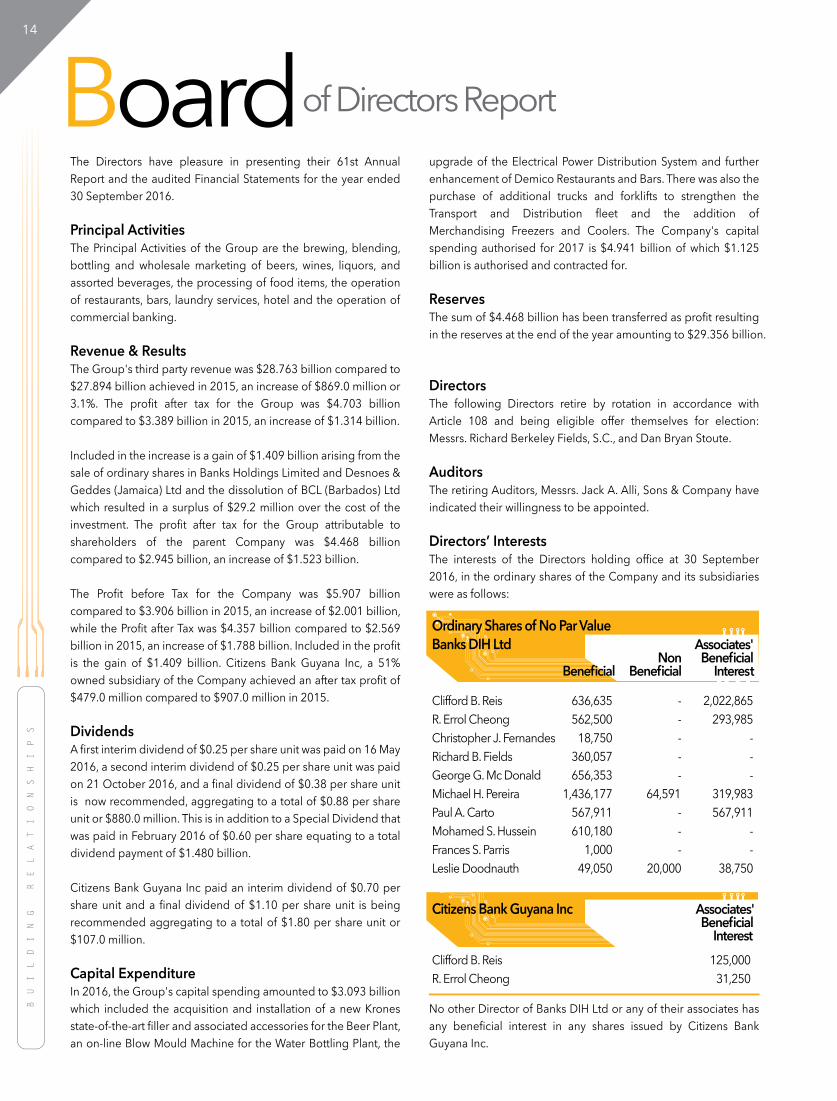
Boardof Directors ReportThe Directors have pleasure in presenting their 61st Annual Report and the audited Financial Statements for the year ended 30 September 2016.
Principal ActivitiesThe Principal Activities of the Group are the brewing, blending, bottling and wholesale marketing of beers, wines, liquors, and assorted beverages, the processing of food items, the operation of restaurants, bars, laundry services, hotel and the operation of commercial banking.
Revenue & ResultsThe Group's third party revenue was $28.763 billion compared to $27.894 billion achieved in 2015, an increase of $869.0 million or 3.1%. The profit after tax for the Group was $4.703 billion compared to $3.389 billion in 2015, an increase of $1.314 billion.
Included in the increase is a gain of $1.409 billion arising from the sale of ordinary shares in Banks Holdings Limited and Desnoes & Geddes (Jamaica) Ltd and the dissolution of BCL (Barbados) Ltd which resulted in a surplus of $29.2 million over the cost of the investment. The profit after tax for the Group attributable to shareholders of the parent Company was $4.468 billion compared to $2.945 billion, an increase of $1.523 billion.
The Profit before Tax for the Company was $5.907 billion compared to $3.906 billion in 2015, an increase of $2.001 billion, while the Profit after Tax was $4.357 billion compared to $2.569 billion in 2015, an increase of $1.788 billion. Included in the profit is the gain of $1.409 billion. Citizens Bank Guyana Inc, a 51% owned subsidiary of the Company achieved an after tax profit of $479.0 million compared to $907.0 million in 2015.
DividendsA first interim dividend of $0.25 per share unit was paid on 16 May 2016, a second interim dividend of $0.25 per share unit was paid on 21 October 2016, and a final dividend of $0.38 per share unit is now recommended, aggregating to a total of $0.88 per share unit or $880.0 million. This is in addition to a Special Dividend that was paid in February 2016 of $0.60 per share equating to a total dividend payment of $1.480 billion.
Citizens Bank Guyana Inc paid an interim dividend of $0.70 per share unit and a final dividend of $1.10 per share unit is being recommended aggregating to a total of $1.80 per share unit or $107.0 million.
Capital ExpenditureIn 2016, the Group's capital spending amounted to $3.093 billion which included the acquisition and installation of a new Krones state-of-the-art filler and associated accessories for the Beer Plant, an on-line Blow Mould Machine for the Water Bottling Plant, the
upgrade of the Electrical Power Distribution System and further enhancement of Demico Restaurants and Bars. There was also the purchase of additional trucks and forklifts to strengthen the Transport and Distribution fleet and the addition of Merchandising Freezers and Coolers. The Company's capital spending authorised for 2017 is $4.941 billion of which $1.125 billion is authorised and contracted for.
ReservesThe sum of $4.468 billion has been transferred as profit resulting in the reserves at the end of the year amounting to $29.356 billion.
DirectorsThe following Directors retire by rotation in accordance with Article 108 and being eligible offer themselves for election: Messrs. Richard Berkeley Fields, S.C., and Dan Bryan Stoute.
AuditorsThe retiring Auditors, Messrs. Jack A. Alli, Sons & Company have indicated their willingness to be appointed.
Directors’ InterestsThe interests of the Directors holding office at 30 September 2016, in the ordinary shares of the Company and its subsidiaries were as follows:
No other Director of Banks DIH Ltd or any of their associates has any beneficial interest in any shares issued by Citizens Bank Guyana Inc.
Caribanks Shipping Company LtdNo Director of Banks DIH Ltd has any beneficial interest in any shares issued by Caribanks Shipping Company Ltd.
Interest in ContractDuring the year none of the Directors had a material interest in any contract of significance to the Company.
Directors’ Fees per Annum $
R. Errol Cheong 1,492,959 Christopher J. Fernandes 1,312,902 Richard B. Fields 1,312,902 Frances Sarah Parris 1,312,902 Carl R. Cozier 1,312,902 Dan B. Stoute 1,312,902
Directors’ Service ContractsOther than normal Service Contracts with Directors under the Companies Act 1991, there are no other Service Contracts with the Directors.
Intra Group LoanBanks DIH Ltd as at 30 September 2016, had an outstanding loan of $521.2 million owing to its subsidiary, Citizens Bank Guyana Inc., which was executed on commercial terms.
Substantial ShareholdersThe following held substantial shareholdings in the Share Capital of the Company at 30 September 2016.
Banks Holdings Limited No. of Shares % Shareholding 2016 200,184,619 20.0 2015 200,184,619 20.0
Demerara Life Group of Companies No. of Shares % Shareholding 2016 96,931,679 9.7 2015 96,931,679 9.7
Trust Company (Guyana) Ltd No. of Shares % Shareholding 2016 76,803,344 7.7 2015 75,990,201 7.6
A substantial shareholder is defined as a person or entity entitled to exercise or control the exercise of five percent or more of the voting power at any general meeting of the Company.
Issued Share Capital of Subsidiaries at 30 September 2016 Ordinary Shares of No Par Value Citizens Bank Guyana Inc 59,491,300 Caribanks Shipping Co Ltd 250
Post Year End EventOn 01 December 2016 the Company repurchased 150,138,464 of its ordinary shares, representing 15 percent of the issued share capital, from Banks Holdings Limited. However Banks Holdings Limited still holds 5% of the issued share capital of the Company. This is because the company and Banks Holdings Limited under its new controlling shareholder, Ambev, have now agreed to co-operate in the marketing of beverages in the future. The consideration for the repurchase of ordinary shares was $5.524 billion financed through cash resources of $4.524 billion and borrowings of $1.0 billion. The expected impact will be a reduction in capital and reserves attributable to shareholders by an amount equivalent to the consideration given.
Corporate GovernanceWe remain dedicated to the Principles of Good Corporate Governance and to ensure that the integrity of the Group remains untarnished. The Board recognises the equitable rights of shareholders, ensures the timely and accurate disclosure of all material matters including its financial Situation, performance and ownership and the strategic guidance of the business.
The standing Committees of the Board during the year were: -The Audit & Finance Committee comprising Mr. R. Errol Cheong (Chairman), Messrs. C.J. Fernandes and R. Cozier.
The Corporate Governance & Human Resources Committee comprising Messrs. R.B. Fields (Chairman), R. Errol Cheong, D. Stoute and Ms. Frances S. Parris.
The Board of Directors of Banks DIH Ltd is charged with the supervision of the management and business affairs of the Company and monitors the manner in which the Company conducts its business. The Board sets policies, approves and assesses their implementation and reviews the results. The election of Non-executive Directors takes place at the Annual General Meeting of the Company. Non-executive Directors are elected to hold office for a period of two years and can offer themselves for election. Executive Directors are nominated to hold office for a period of two years. Their continuation as Executive Directors for any subsequent period following their nomination to the Board requires the Board's ratification.
The positions of Chairman of the Board and Chief Executive Officer or Managing Director are combined positions and held by Executive Director, Mr. Clifford B. Reis. The position of Vice-Chairman is held by a Non-executive Director, Mr. R. Errol Cheong. The position of Co-Managing Director/Marketing Director is held by Mr. George G. Mc Donald. A minimum of twelve Board meetings are held each year at the Company's Corporate Headquarters, Thirst Park, Ruimveldt, Georgetown.
Ordinary Shares of No Par ValueBanks DIH Ltd Associates' Non Beneficial Beneficial Beneficial Interest
Clifford B. Reis 636,635 - 2,022,865R. Errol Cheong 562,500 - 293,985Christopher J. Fernandes 18,750 - -Richard B. Fields 360,057 - -George G. Mc Donald 656,353 - -Michael H. Pereira 1,436,177 64,591 319,983Paul A. Carto 567,911 - 567,911Mohamed S. Hussein 610,180 - -Frances S. Parris 1,000 - -Leslie Doodnauth 49,050 20,000 38,750
Citizens Bank Guyana Inc Associates' Beneficial InterestClifford B. Reis 125,000 R. Errol Cheong 31,250

15
The Directors have pleasure in presenting their 61st Annual Report and the audited Financial Statements for the year ended 30 September 2016.
Principal ActivitiesThe Principal Activities of the Group are the brewing, blending, bottling and wholesale marketing of beers, wines, liquors, and assorted beverages, the processing of food items, the operation of restaurants, bars, laundry services, hotel and the operation of commercial banking.
Revenue & ResultsThe Group's third party revenue was $28.763 billion compared to $27.894 billion achieved in 2015, an increase of $869.0 million or 3.1%. The profit after tax for the Group was $4.703 billion compared to $3.389 billion in 2015, an increase of $1.314 billion.
Included in the increase is a gain of $1.409 billion arising from the sale of ordinary shares in Banks Holdings Limited and Desnoes & Geddes (Jamaica) Ltd and the dissolution of BCL (Barbados) Ltd which resulted in a surplus of $29.2 million over the cost of the investment. The profit after tax for the Group attributable to shareholders of the parent Company was $4.468 billion compared to $2.945 billion, an increase of $1.523 billion.
The Profit before Tax for the Company was $5.907 billion compared to $3.906 billion in 2015, an increase of $2.001 billion, while the Profit after Tax was $4.357 billion compared to $2.569 billion in 2015, an increase of $1.788 billion. Included in the profit is the gain of $1.409 billion. Citizens Bank Guyana Inc, a 51% owned subsidiary of the Company achieved an after tax profit of $479.0 million compared to $907.0 million in 2015.
DividendsA first interim dividend of $0.25 per share unit was paid on 16 May 2016, a second interim dividend of $0.25 per share unit was paid on 21 October 2016, and a final dividend of $0.38 per share unit is now recommended, aggregating to a total of $0.88 per share unit or $880.0 million. This is in addition to a Special Dividend that was paid in February 2016 of $0.60 per share equating to a total dividend payment of $1.480 billion.
Citizens Bank Guyana Inc paid an interim dividend of $0.70 per share unit and a final dividend of $1.10 per share unit is being recommended aggregating to a total of $1.80 per share unit or $107.0 million.
Capital ExpenditureIn 2016, the Group's capital spending amounted to $3.093 billion which included the acquisition and installation of a new Krones state-of-the-art filler and associated accessories for the Beer Plant, an on-line Blow Mould Machine for the Water Bottling Plant, the
upgrade of the Electrical Power Distribution System and further enhancement of Demico Restaurants and Bars. There was also the purchase of additional trucks and forklifts to strengthen the Transport and Distribution fleet and the addition of Merchandising Freezers and Coolers. The Company's capital spending authorised for 2017 is $4.941 billion of which $1.125 billion is authorised and contracted for.
ReservesThe sum of $4.468 billion has been transferred as profit resulting in the reserves at the end of the year amounting to $29.356 billion.
DirectorsThe following Directors retire by rotation in accordance with Article 108 and being eligible offer themselves for election: Messrs. Richard Berkeley Fields, S.C., and Dan Bryan Stoute.
AuditorsThe retiring Auditors, Messrs. Jack A. Alli, Sons & Company have indicated their willingness to be appointed.
Directors’ InterestsThe interests of the Directors holding office at 30 September 2016, in the ordinary shares of the Company and its subsidiaries were as follows:
No other Director of Banks DIH Ltd or any of their associates has any beneficial interest in any shares issued by Citizens Bank Guyana Inc.
Caribanks Shipping Company LtdNo Director of Banks DIH Ltd has any beneficial interest in any shares issued by Caribanks Shipping Company Ltd.
Interest in ContractDuring the year none of the Directors had a material interest in any contract of significance to the Company.
Directors’ Fees per Annum $
R. Errol Cheong 1,492,959 Christopher J. Fernandes 1,312,902 Richard B. Fields 1,312,902 Frances Sarah Parris 1,312,902 Carl R. Cozier 1,312,902 Dan B. Stoute 1,312,902
Directors’ Service ContractsOther than normal Service Contracts with Directors under the Companies Act 1991, there are no other Service Contracts with the Directors.
Intra Group LoanBanks DIH Ltd as at 30 September 2016, had an outstanding loan of $521.2 million owing to its subsidiary, Citizens Bank Guyana Inc., which was executed on commercial terms.
Substantial ShareholdersThe following held substantial shareholdings in the Share Capital of the Company at 30 September 2016.
Banks Holdings Limited No. of Shares % Shareholding 2016 200,184,619 20.0 2015 200,184,619 20.0
Demerara Life Group of Companies No. of Shares % Shareholding 2016 96,931,679 9.7 2015 96,931,679 9.7
Trust Company (Guyana) Ltd No. of Shares % Shareholding 2016 76,803,344 7.7 2015 75,990,201 7.6
A substantial shareholder is defined as a person or entity entitled to exercise or control the exercise of five percent or more of the voting power at any general meeting of the Company.
Issued Share Capital of Subsidiaries at 30 September 2016 Ordinary Shares of No Par Value Citizens Bank Guyana Inc 59,491,300 Caribanks Shipping Co Ltd 250
Post Year End EventOn 01 December 2016 the Company repurchased 150,138,464 of its ordinary shares, representing 15 percent of the issued share capital, from Banks Holdings Limited. However Banks Holdings Limited still holds 5% of the issued share capital of the Company. This is because the company and Banks Holdings Limited under its new controlling shareholder, Ambev, have now agreed to co-operate in the marketing of beverages in the future. The consideration for the repurchase of ordinary shares was $5.524 billion financed through cash resources of $4.524 billion and borrowings of $1.0 billion. The expected impact will be a reduction in capital and reserves attributable to shareholders by an amount equivalent to the consideration given.
Corporate GovernanceWe remain dedicated to the Principles of Good Corporate Governance and to ensure that the integrity of the Group remains untarnished. The Board recognises the equitable rights of shareholders, ensures the timely and accurate disclosure of all material matters including its financial Situation, performance and ownership and the strategic guidance of the business.
The standing Committees of the Board during the year were: -The Audit & Finance Committee comprising Mr. R. Errol Cheong (Chairman), Messrs. C.J. Fernandes and R. Cozier.
The Corporate Governance & Human Resources Committee comprising Messrs. R.B. Fields (Chairman), R. Errol Cheong, D. Stoute and Ms. Frances S. Parris.
The Board of Directors of Banks DIH Ltd is charged with the supervision of the management and business affairs of the Company and monitors the manner in which the Company conducts its business. The Board sets policies, approves and assesses their implementation and reviews the results. The election of Non-executive Directors takes place at the Annual General Meeting of the Company. Non-executive Directors are elected to hold office for a period of two years and can offer themselves for election. Executive Directors are nominated to hold office for a period of two years. Their continuation as Executive Directors for any subsequent period following their nomination to the Board requires the Board's ratification.
The positions of Chairman of the Board and Chief Executive Officer or Managing Director are combined positions and held by Executive Director, Mr. Clifford B. Reis. The position of Vice-Chairman is held by a Non-executive Director, Mr. R. Errol Cheong. The position of Co-Managing Director/Marketing Director is held by Mr. George G. Mc Donald. A minimum of twelve Board meetings are held each year at the Company's Corporate Headquarters, Thirst Park, Ruimveldt, Georgetown.

16
for the 61st Annual General MeetingProgrammeThirst Park, Georgetown, Saturday 28 January 2017 1. Presentation of Long Service Awards. 2. The Meeting called to order at 5.00 p.m. 3. Presentation of the Financial Statements for the year ended 30 September 2016 and the Reports of the Directors and Auditors thereon. 4. Chairman’s Report and Question Period. 5. Declaration of Dividend. 6. Directors’ Service Agreements providing for their remuneration and other items as listed under the Notice of Meeting. 7. After the Meeting is declared closed, bars will be opened until 8.30 p.m.
NOTE: One gift voucher will be presented to each shareholder/shareholding on arrival at the entrance to the meeting. This voucher will be exchanged for a gift either on arrival or after the meeting, and not at anytime thereafter. Children, family or friends of shareholders are not entitled to attend the meeting.
BOARD OF DIRECTORS EXECUTIVE DIRECTORS NON-EXECUTIVE DIRECTORS Clifford Barrington Reis, C.C.H. Chairman/Managing Director Roy Errol Cheong, A.A.-Vice Chairman, Banks DIH Limited George Gladstone McDonald Co. Managing Director/Marketing Director Richard Berkeley Fields, S.C. Principal Partner, Fields & Company Michael Henry Pereira Operations Director Christopher Joseph Fernandes, A.A. Chairman/CEO, John Fernandes Limited Paul Andrew Carto Human Resources/Trisco Director Carl Richard Cozier CEO/Managing Director, Banks Holdings Limited Mohamed Shabir Hussein Engineering Services Director Dan Bryan Stoute Consultant, Banks Holdings Limited Leslie Doodnauth Worker Management Frances Sarah Parris Participation Board Director General Manager/Corporate Secretary, Citizens Bank Guyana Inc. Terrence I. Bynoe Secretary/I.C.T. Executive BANKERS Citizens Bank Guyana Inc., 201 Camp & Charlotte Streets, Georgetown Republic Bank (Guyana) Limited, 38/40 Water Street, Georgetown Guyana Bank for Trade & Industry Limited, 47 Water Street, Georgetown Bank of Baroda, 10 Regent Street & Avenue of the Republic, Georgetown Bank of Nova Scotia, 104 Carmichael Street, Georgetown Demerara Bank Limited, 230 Camp & South Streets, Georgetown
AUDITOR ATTORNEYS-AT-LAW Messrs. Jack A. Alli, Sons & Co. Messrs. Cameron & Shepherd Messrs. Boston & Boston 145 Crown Street, Queenstown 2 Avenue of the Republic 2 Croal Street, Stabroek Georgetown, Guyana Georgetown, Guyana Georgetown, Guyana

17
Notice is hereby given that the 61st Annual General Meeting of Banks DIH Limited will be held at Thirst Park, Georgetown on Saturday, 28 January 2017 at 5.00 p.m. for the following purposes: -
A. To receive the Financial Statements for the year ended 30 September 2016 and the Reports of the Directors and Auditors thereon.
B. To consider and (if thought fit) pass the following Resolution: 1. “That the Financial Statements for the year ended 30 September 2016 and the Reports of the Directors and Auditors thereon be and are hereby adopted.”
C. To consider the declaration of a Final Dividend of $0.38 per share as recommended by the Directors in addition to a Special Interim Dividend of $0.60 per share, an Interim Dividend of $0.25 per share and a second Interim Dividend of $0.25 per share previously declared by them and (if thought fit) pass the following Resolution: 2. “That the Special Interim Dividend of $0.60 per share, the Interim Dividend of $0.25 per share and a second Interim Dividend of $0.25 per share already paid be confirmed and that a Final Dividend of $0.38 per share as recommended by the Directors in respect of the year ended 30 September 2016 be approved and paid to shareholders on the Company’s Register at the close of the business on 28 January 2017.”
E. To fix the remuneration of the Directors in accordance with Article 86 of the Company’s by-laws and Section 104 of the Companies’ Act 1991. To consider and (if thought fit) pass the following Resolution: 4. “That the remuneration of $1,112,742 per annum be paid to the Non-Executive Vice Chairman; the remuneration of $927,283 per annum be paid to each Non-Executive Director in accordance with Article 86 of the Company’s by-laws and Section 104 of the Companies’ Act 1991 and that a Travelling Allowance for each Non-Executive Director be fixed at $343,987 per annum; and that the additional sum of $68,640 per annum be provided for additional remuneration for each Director serving on Technical Committees.”
F. To appoint Auditors in accordance with Article 143 of the Company’s by-laws.
To consider and (if thought fit) pass the following resolution:
5. “That Messrs. Jack A. Alli, Sons & Company be and are hereby appointed Auditors for the period ending with the
conclusion of the next Annual General Meeting.”
G. To fix the remuneration of the Auditors in accordance with Article 146 of the Company’s by-laws. To consider and (if thought fit) pass the following Resolution: 6. “That the remuneration of the Auditors be fixed at $16,100,000 for the current financial year.”
To consider and (if thought fit) pass the following Resolutions:
3. (a) “That the Directors be elected en bloc.”
(b) “That the retiring Directors Messrs. Richard Berkeley Fields, S.C., and Dan Bryan Stoute, be and are hereby elected Directors of the Company.”
D. To elect Directors in accordance with Article 109 of the Company’s by-laws. The Directors retiring by rotation are Messrs. Richard Berkeley Fields, S.C. and Dan Bryan Stoute, who being eligible, offer themselves for election.
of the MeetingNotice

18
of the MeetingNoticeNotice of the Meeting
H. To fix charitable donations in accordance with Article 62 of the Company’s by-laws. To consider and (if thought fit) pass the following Resolution:
7. “That the amount appropriated for charitable donations be fixed at $4,130,000 for the current financial year.”
I. To transact any other business of an Ordinary Meeting.
Any member entitled to attend and vote is entitled to appoint a proxy to attend and vote instead of him. A proxy need not be a member of the Company. The instrument appointing a proxy must be stamped and deposited at the Registered Office of the
excluded when determining the forty-eight hour period.)
BY ORDER OF THE BOARD REGISTERED OFFICE
Terrence I. Bynoe Thirst Park Secretary/I.C.T. Executive Georgetown Guyana
22 December 2016
Company not less than forty-eight (48) hours before the time for holding the Meeting. (Note: Saturdays and Holidays are to be
19
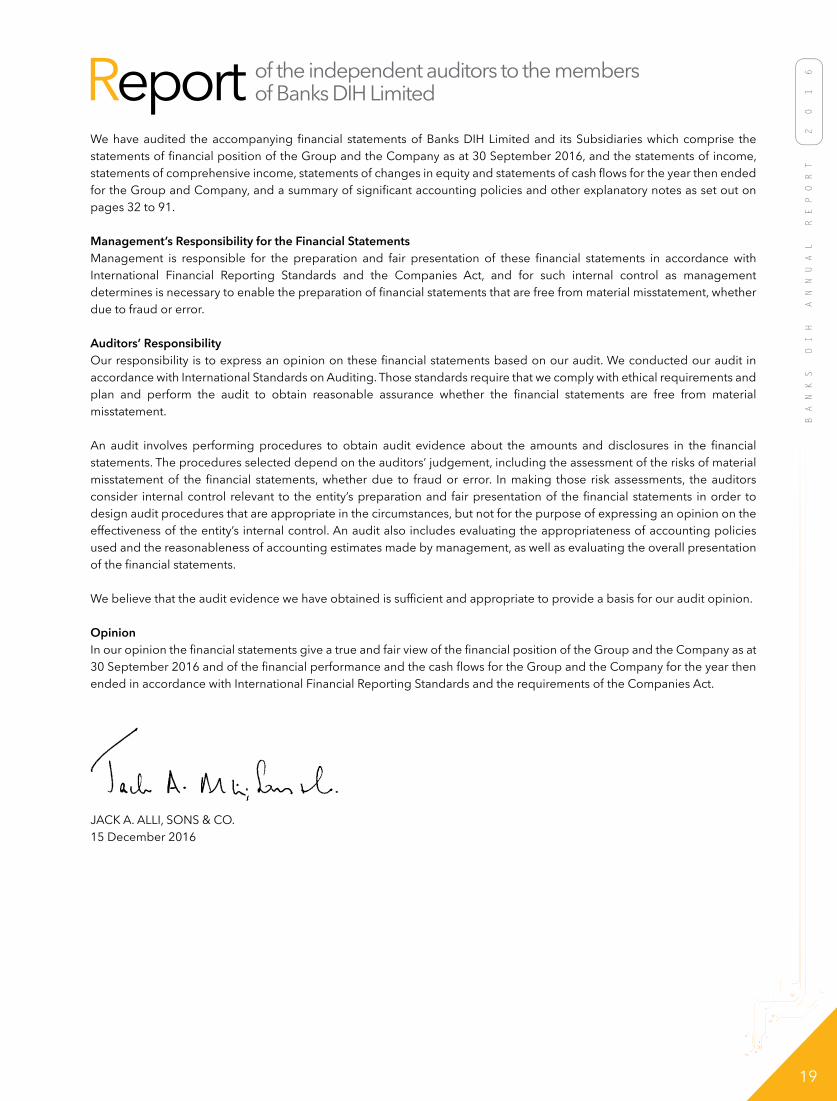
Report of the independent auditors to the members of Banks DIH Limited
We have audited the accompanying financial statements of Banks DIH Limited and its Subsidiaries which comprise the statements of financial position of the Group and the Company as at 30 September 2016, and the statements of income, statements of comprehensive income, statements of changes in equity and statements of cash flows for the year then ended for the Group and Company, and a summary of significant accounting policies and other explanatory notes as set out on pages 32 to 91.
Management’s Responsibility for the Financial StatementsManagement is responsible for the preparation and fair presentation of these financial statements in accordance with International Financial Reporting Standards and the Companies Act, and for such internal control as management determines is necessary to enable the preparation of financial statements that are free from material misstatement, whether due to fraud or error.
Auditors’ ResponsibilityOur responsibility is to express an opinion on these financial statements based on our audit. We conducted our audit in accordance with International Standards on Auditing. Those standards require that we comply with ethical requirements and plan and perform the audit to obtain reasonable assurance whether the financial statements are free from material misstatement.
An audit involves performing procedures to obtain audit evidence about the amounts and disclosures in the financial statements. The procedures selected depend on the auditors’ judgement, including the assessment of the risks of material misstatement of the financial statements, whether due to fraud or error. In making those risk assessments, the auditors consider internal control relevant to the entity’s preparation and fair presentation of the financial statements in order to design audit procedures that are appropriate in the circumstances, but not for the purpose of expressing an opinion on the effectiveness of the entity’s internal control. An audit also includes evaluating the appropriateness of accounting policies used and the reasonableness of accounting estimates made by management, as well as evaluating the overall presentation of the financial statements.
We believe that the audit evidence we have obtained is sufficient and appropriate to provide a basis for our audit opinion.
OpinionIn our opinion the financial statements give a true and fair view of the financial position of the Group and the Company as at 30 September 2016 and of the financial performance and the cash flows for the Group and the Company for the year then ended in accordance with International Financial Reporting Standards and the requirements of the Companies Act.
JACK A. ALLI, SONS & CO.15 December 2016

20
Consolidated Statement of Financial Position30 September 2016
Thousands of Guyana Dollars Note 2016 2015
ASSETSNon-current assets Property, plant and equipment 4 23,375,880 22,845,865 Investment in associates 5 5,661 47,122 Investment securities 7 1,014,693 2,644,390 Loans and advances 8 25,715,052 26,130,708 Deferred taxation 9 259,272 459,838
50,370,558 52,127,923
Current assets Inventories 10 5,163,906 5,217,051 Receivables and prepayments 11 984,801 1,058,588 Investment securities 7 1,333,055 565,748 Loans and advances 8 2,923,474 3,964,731 Cash resources 12 16,341,579 9,566,037 Taxation recoverable 143,505 3,247
26,890,320 20,375,402
TOTAL ASSETS 77,260,878 72,503,325
EQUITY AND LIABILITIESCapital and reservesattributable to shareholders Share capital 13 2,364,966 2,364,966 Reserves 14 29,356,337 26,260,314
31,721,303 28,625,280 Non-controlling interest 3,723,849 3,547,140
Total equity 35,445,152 32,172,420
Non-current liabilities Customers' deposits 17 2,295,043 985,855 Deferred taxation 9 2,302,353 2,343,234 Provision for employee benefits 18 861,620 1,529,153
5,459,016 4,858,242 Current liabilities Payables and accruals 19 2,881,829 4,253,478 Customers' deposits 17 32,871,429 30,482,450 Taxation payable 603,452 736,735
36,356,710 35,472,663
TOTAL EQUITY AND LIABILITIES 77,260,878 72,503,325
___________________________________CLIFFORD B. REIS
CHAIRMAN
___________________________________ROY E. CHEONGVICE-CHAIRMAN
The notes on pages 32 to 91 form an integral part of these financial statements. The Board of Directors approved these financial statements for issue on 15 December 2016.

21
Consolidated Statement of Incomefor the year ended 30 September 2016
Thousands of Guyana Dollars Note 2016 2015
The notes on pages 32 to 91 form an integral part of these financial statements.
Revenue 20 28,762,971 27,894,378
Changes in inventories of finished goods and work in progress 66,517 (102,953)Raw materials and consumables used (7,105,039) (7,288,589)Excise taxes (3,246,676) (3,019,646)Staff costs (4,312,882) (3,941,433)Depreciation (2,400,346) (2,226,115)Interest payable - banking (701,276) (595,190)Other operating expenses (5,997,133) (5,531,441)
PROFIT FROM OPERATIONS 5,066,136 5,189,011
Net finance income 21 25,992 16,176Share of results of associates (1,084) 94Other income 22 1,436,658 79,475
PROFIT BEFORE TAXATION 23 6,527,702 5,284,756
Taxation 24 (1,824,790) (1,895,878)
PROFIT AFTER TAXATION 4,702,912 3,388,878
ATTRIBUTABLE TO:
Equity holders of the parent 4,468,141 2,944,523Non-controlling interest 234,771 444,355
4,702,912 3,388,878
EARNINGS PER SHARE 25 4.47 Dollar 2.94 Dollar
22
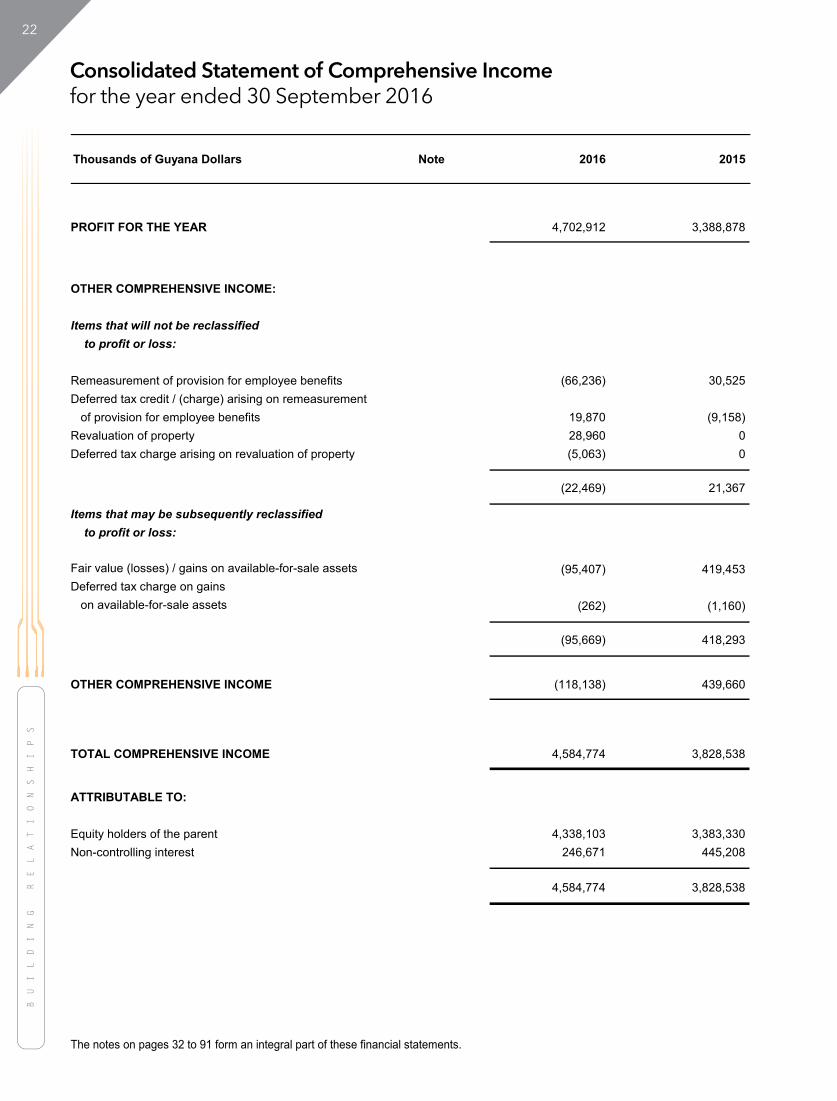
Consolidated Statement of Comprehensive Incomefor the year ended 30 September 2016
Thousands of Guyana Dollars Note 2016 2015
The notes on pages 32 to 91 form an integral part of these financial statements.
PROFIT FOR THE YEAR 4,702,912 3,388,878
OTHER COMPREHENSIVE INCOME:
Items that will not be reclassified to profit or loss:
Remeasurement of provision for employee benefits (66,236) 30,525Deferred tax credit / (charge) arising on remeasurement of provision for employee benefits 19,870 (9,158)Revaluation of property 28,960 0Deferred tax charge arising on revaluation of property (5,063) 0
(22,469) 21,367
Items that may be subsequently reclassified to profit or loss:
Fair value (losses) / gains on available-for-sale assets (95,407) 419,453Deferred tax charge on gains on available-for-sale assets (262) (1,160)
(95,669) 418,293
OTHER COMPREHENSIVE INCOME (118,138) 439,660
TOTAL COMPREHENSIVE INCOME 4,584,774 3,828,538
ATTRIBUTABLE TO:
Equity holders of the parent 4,338,103 3,383,330Non-controlling interest 246,671 445,208
4,584,774 3,828,538

23
Consolidated Statement of Changes in Equityfor the year ended 30 September 2016
NON-CONTROLLING
INTEREST TOTAL General Available-
Banking for-Sale Share Revaluation Statutory Retained Risk Investments
YEAR ENDED 30 SEPTEMBER 2016 Capital Reserve Reserve Earnings Reserve Reserve
Balance as at beginning of year 2,364,966 6,015,769 303,407 18,982,918 299,415 658,805 3,547,140 32,172,420
Comprehensive income:
Net profit for the year 0 0 0 4,468,141 0 0 234,771 4,702,912
(Losses) / gains on available-for-sale assets, net of tax 0 0 0 0 0 (95,859) 190 (95,669)
Reversal of net losses on available-for-sale assets sold 0 0 0 0 0 127,920 0 127,920
Revaluation of property, net of tax 0 12,187 0 0 0 0 11,710 23,897
Remeasurement of provision
for employee benefits, net of tax 0 0 0 (46,366) 0 0 0 (46,366)
Unwinding of deferred tax on revaluation 0 15,772 0 (15,772) 0 0 0 0
Total comprehensive income 0 27,959 0 4,406,003 0 32,061 246,671 4,712,694
Statutory transfer and transactions with owners:
Transfer from general banking risk reserve 14 0 0 0 (66,761) 66,761 0 0 0
Dividends paid to shareholders 15 0 0 0 (1,370,000) 0 0 0 (1,370,000)
Dividends paid to non-controlling interest 0 0 0 0 0 0 (69,962) (69,962)
Total of transfers and transactions with owners 0 0 0 (1,436,761) 66,761 0 (69,962) (1,439,962)
Balance as at end of year 2,364,966 6,043,728 303,407 21,952,160 366,176 690,866 3,723,849 35,445,152
ATTRIBUTABLE TO EQUITY HOLDERS OF THE PARENT
YEAR ENDED 30 SEPTEMBER 2015
Balance as at beginning of year 2,364,966 5,999,997 303,407 16,798,879 165,360 241,365 3,179,870 29,053,844
Comprehensive income:
Net profit for the year 0 0 0 2,944,523 0 0 444,355 3,388,878
Gains on available-for-sale assets, net of tax 0 0 0 0 0 417,440 853 418,293
Remeasurement of provision
for employee benefits, net of tax 0 0 0 21,367 0 0 0 21,367
Unwinding of deferred tax on revaluation 0 15,772 0 (15,772) 0 0 0 0
Other 0 0 0 7,976 0 0 (7,976) 0
Total comprehensive income 0 15,772 0 2,958,094 0 417,440 437,232 3,828,538
Statutory transfer and transactions with owners:
Transfer to general banking risk reserve 14 0 0 0 (134,055) 134,055 0 0 0
Dividends paid to shareholders 15 0 0 0 (640,000) 0 0 0 (640,000)
Dividends paid to non-controlling interest 0 0 0 0 0 0 (69,962) (69,962)
Total of transfers and transactions with owners 0 0 0 (774,055) 134,055 0 (69,962) (709,962)
Balance as at end of year 2,364,966 6,015,769 303,407 18,982,918 299,415 658,805 3,547,140 32,172,420
Thousands of Guyana Dollars Note
The notes on pages 32 to 91 form an integral part of these financial statements.

24
Consolidated Statement of Cash Flowsfor the year ended 30 September 2016
Thousands of Guyana Dollars
The notes on pages 32 to 91 form an integral part of these financial statements.
2016 2015
OPERATING ACTIVITIES
Profit before taxation 6,527,702 5,284,756
Adjustments to reconcile net profit to net cashprovided by operating activities:
Depreciation of property, plant and equipment 2,400,346 2,226,115Provision for defined benefit obligations (733,769) 45,190Loss on disposal of property, plant and equipment 176,984 41,737Gain on disposals of investment securities (1,380,293) 0Loss on dissolution of associate 688 0Dividends receivable (25,294) (71,551)Net finance income (25,992) (16,176)Net impairment of investment securities (7,007) 6,818Net impairment of loans and advances 555,451 472,600Net impairment of receivables 20,425 17,773Share of results of associated companies 1,084 (94)Loans and advances 901,462 (2,309,168)Customers' deposits 3,698,167 145,585Inventories 53,145 555,715Receivables and prepayments 53,362 5,101Reserve requirement with Bank of Guyana (985,031) 17,330Payables and accruals (1,371,649) 357,641Taxes paid (1,923,880) (1,751,002)
Net Cash Inflow - Operating Activities 7,935,901 5,028,370
INVESTING ACTIVITIES
Purchase of property, plant and equipment (3,093,350) (4,357,003)Purchase of investment securities (5,213,000) 0Net proceeds from sale of property, plant and equipment 14,965 2,325Proceeds from sale/maturity of investment securities 7,280,083 2,273,736Proceeds from dissolution of associate 39,468 0Dividends received 25,294 71,551Interest received 25,992 18,574
Net Cash Outflow - Investing Activities (920,548) (1,990,817)

25
Consolidated Statement of Cash Flowsfor the year ended 30 September 2016
Thousands of Guyana Dollars Note 2016 2015
The notes on pages 32 to 91 form an integral part of these financial statements.
FINANCING ACTIVITIES
Repayments of borrowings 0 (1,342,081)Dividends paid to shareholders (1,370,000) (640,000)Dividends paid to non-controlling interest (69,962) (69,962)Interest paid 0 (2,398)
Net Cash Outflow - Financing Activities (1,439,962) (2,054,441)
NET MOVEMENT IN CASH AND CASH EQUIVALENTS 5,575,391 983,112 CASH AND CASH EQUIVALENTS AS AT BEGINNING OF YEAR 5,971,482 4,988,370
CASH AND CASH EQUIVALENTS AS AT END OF YEAR 11,546,873 5,971,482
CASH AND CASH EQUIVALENTS COMPRISE:
Cash resources 12 11,441,814 5,651,303Investment securities with original maturity of less than three months 105,059 320,179
11,546,873 5,971,482

26
Statement of Financial Position30 September 2016
Thousands of Guyana Dollars Note 2016 2015
ASSETS
Non-current assets Property, plant and equipment 4 20,246,462 20,541,425 Investment in associates 5 8,000 18,253 Investment in subsidiaries 6 387,178 387,178 Investment securities 7 708,760 2,452,980 Deferred taxation 9 258,485 458,746
21,608,885 23,858,582
Current assets Inventories 10 5,163,906 5,217,051 Receivables and prepayments 11 856,912 931,973 Cash resources 12 7,560,582 4,060,487
13,581,400 10,209,511
TOTAL ASSETS 35,190,285 34,068,093
EQUITY AND LIABILITIES
Capital and reserves Share capital 13 2,364,966 2,364,966 Reserves 14 26,176,358 23,203,886
28,541,324 25,568,852
Non-current liabilities Borrowings 16 451,381 520,598 Deferred taxation 9 2,264,074 2,293,748 Provision for employee benefits 18 861,620 1,529,153
3,577,075 4,343,499
Current liabilities Payables and accruals 19 2,454,772 3,504,594 Borrowings 16 69,806 64,137 Taxation 547,308 587,011
3,071,886 4,155,742
TOTAL EQUITY AND LIABILITIES 35,190,285 34,068,093
___________________________________CLIFFORD B. REIS
CHAIRMAN
___________________________________ROY E. CHEONGVICE-CHAIRMAN
The notes on pages 32 to 91 form an integral part of these financial statements. The Board of Directors approved these financial statements for issue on 15 December 2016.

27
Statement of Incomefor the year ended 30 September 2016
Thousands of Guyana Dollars Note 2016 2015
The notes on pages 32 to 91 form an integral part of these financial statements.
Revenue 20 25,575,042 24,245,546
Changes in inventories of finished goods and work in progress 66,517 (102,953)Raw materials and consumables used (7,105,039) (7,288,589)Excise taxes (3,246,676) (3,019,646)Staff costs (3,907,657) (3,553,945)Depreciation (2,265,474) (2,097,017)Other operating expenses (4,791,062) (4,450,410)
PROFIT FROM OPERATIONS 4,325,651 3,732,986
Net finance cost 21 (8,079) (30,633)Other income 22 1,589,557 203,277
PROFIT BEFORE TAXATION 23 5,907,129 3,905,630
Taxation 24 (1,550,154) (1,337,124)
PROFIT AFTER TAXATION 4,356,975 2,568,506

28
Statement of Comprehensive Incomefor the year ended 30 September 2016
Thousands of Guyana Dollars 2016 2015
The notes on pages 32 to 91 form an integral part of these financial statements.
PROFIT FOR THE YEAR 4,356,975 2,568,506
OTHER COMPREHENSIVE INCOME:
Items that will not be reclassified to profit or loss:
Remeasurement of provision for employee benefits (66,236) 30,525Deferred tax credit / (charge) arising on remeasurement of provision for employee benefits 19,870 (9,158)
(46,366) 21,367
Items that may be subsequently reclassified to profit or loss:
Fair value (losses) / gains on available-for-sale assets (96,057) 416,552
OTHER COMPREHENSIVE INCOME (142,423) 437,919
TOTAL COMPREHENSIVE INCOME 4,214,552 3,006,425

29
Thousands of Guyana Dollars Note
The notes on pages 32 to 91 form an integral part of these financial statements.
Available-for-Sale
Share Revaluation Retained InvestmentsYEAR ENDED 30 SEPTEMBER 2016 Capital Reserve Earnings Reserve Total
Balance as at beginning of year 2,364,966 5,923,107 16,621,233 659,546 25,568,852
Comprehensive income: Net profit for the year 0 0 4,356,975 0 4,356,975
Losses on available-for-sale assets 0 0 0 (96,057) (96,057) Reversal of net losses on available-for-sale assets sold 0 0 0 127,920 127,920 Remeasurement of provision for employee benefits, net of tax 0 0 (46,366) 0 (46,366) Unwinding of deferred tax on revaluation 0 15,772 (15,772) 0 0
Total comprehensive income 0 15,772 4,294,837 31,863 4,342,472
Transactions with owners: Dividends paid to shareholders 15 0 0 (1,370,000) 0 (1,370,000)
Total transactions with owners 0 0 (1,370,000) 0 (1,370,000)
Balance as at end of year 2,364,966 5,938,879 19,546,070 691,409 28,541,324
YEAR ENDED 30 SEPTEMBER 2015
Balance as at beginning of year 2,364,966 5,907,335 14,687,132 242,994 23,202,427
Comprehensive income: Net profit for the year 0 0 2,568,506 0 2,568,506 Gains on available-for-sale assets 0 0 0 416,552 416,552 Remeasurement of provision for employee benefits, net of tax 0 0 21,367 0 21,367 Unwinding of deferred tax on revaluation 0 15,772 (15,772) 0 0
Total comprehensive income 0 15,772 2,574,101 416,552 3,006,425
Transactions with owners: Dividends paid to shareholders 15 0 0 (640,000) 0 (640,000)
Total transactions with owners 0 0 (640,000) 0 (640,000)
Balance as at end of year 2,364,966 5,923,107 16,621,233 659,546 25,568,852
Statement of Changes in Equityfor the year ended 30 September 2016

30
Statement of Cash Flowsfor the year ended 30 September 2016
Thousands of Guyana Dollars 2016 2015
The notes on pages 32 to 91 form an integral part of these financial statements.
OPERATING ACTIVITIES
Profit before taxation 5,907,129 3,905,630
Adjustments to reconcile net profit to net cashprovided by operating activities:
2,265,474 2,097,017 Investment property fair value gains (28,584) (9,733) Provision for defined benefit obligations (733,769) 45,190 Loss on disposal of property, plant and equipment 171,783 41,200 Gain on disposals of investment securities (1,380,293) 0 Surplus on dissolution of associate (29,215) 0 Dividends receivable (92,249) (138,624) Net finance cost 8,079 30,633 Net impairment of receivables 20,425 17,773 Inventories 53,145 555,715 Receivables and prepayments 54,636 (56,722) Payables and accruals (1,049,822) 481,941 Taxes paid (1,399,400) (1,142,595)
Net Cash Inflow - Operating Activities 3,767,339 5,827,425
INVESTING ACTIVITIES
Purchase of property, plant and equipment (2,122,660) (3,409,797) Net proceeds from sale of property, plant and equipment 8,950 1,725 Proceeds from sale of investment securities 3,156,376 0 Proceeds from dissolution of associate 39,468 0 Dividends received 92,249 138,624 Interest received 39,961 24,906
Net Cash Inflow / (Outflow) - Investing Activities 1,214,344 (3,244,542)
Depreciation of property, plant and equipment

31
Statement of Cash Flowsfor the year ended 30 September 2016
Thousands of Guyana Dollars Note 2016 2015
FINANCING ACTIVITIES
Repayments of borrowings (63,548) (100,527) Dividends paid to shareholders (1,370,000) (640,000) Interest paid (48,040) (55,539)
The notes on pages 32 to 91 form an integral part of these financial statements.
Net Cash Outflow - Financing Activities (1,481,588) (796,066)
NET MOVEMENT IN CASH AND CASH EQUIVALENTS 3,500,095 1,786,817 CASH AND CASH EQUIVALENTS AS AT BEGINNING OF YEAR 4,055,423 2,268,606
CASH AND CASH EQUIVALENTS AS AT END OF YEAR 12 7,555,518 4,055,423

32
Notes to the Financial Statements30 September 2016
1. INCORPORATION AND BUSINESS ACTIVITIES
Incorporation
Principal Activities
The principal activities of the Company and its subsidiaries (the Group) are as follows:
(a) Beverages
(b)
The operation of commercial banking.
(c) Food and Restaurants
The processing of food items and the operation of restaurants.
(d) Others
The operation of hotel and laundry services.
2. SIGNIFICANT ACCOUNTING POLICIES
(a)
The financial statements have been prepared under the historical cost convention, as modified by the revaluation ofthe properties and available-for-sale investments. The financial statements have been prepared in accordance withInternational Financial Reporting Standards as issued by the International Accounting Standards Board ('IFRSs'). TheCompany's financial statements are presented to satisfy the requirements of the Companies Act 1991.
Financial Services
Basis of Preparation
The principal accounting policies applied in the preparation of these financial statements are set out below. These policieshave been consistently applied to the years presented.
Banks DIH Limited was incorporated in Guyana on 09 September 1955. Its registered office is located at Thirst Park,Greater Georgetown.
The brewing, blending and wholesale marketing of beers, wines, liquors and assorted beverages.
The preparation of the Group's financial statements requires management to make estimates and assumptions that affect the reported amounts of revenue, expenses, assets and liabilities, and the disclosure of contingent liabilities at the date of the financial statements. Such estimates and assumptions are based on historical experience and various other factors that are believed to be reasonable in the circumstances and constitute management's best judgement at the date of the financial statements. The areas involving a higher degree of judgement or complexity, or areas where assumptions and estimates are significant to the financial statements are disclosed in note 3.

33
Notes to the Financial Statements30 September 2016
Pronouncements effective in future periods
IFRS 9 Financial instrumentsIFRS 14 Regulatory deferral accountsIFRS 15 Revenue from contracts with customersIFRS 16 Leases IFRS 2 Amendments - Classification and measurement for share-based payment
transactionsIFRS 4 Amendments - Applying IFRS 9 with IFRS 4 Insurance ContractsIFRS 11IAS 1 / IAS 7 Amendments - Disclosure initiativeIAS 16 / IAS 38IAS 16 / IAS 41IAS 27 Amendments - Equity method in separate financial statementsIAS 12 Amendments - Recognition of deferred tax assets for unrealised lossesAnnual improvements cycle (2012 - 2014): - IFRS 5 Changes in methods of disposal - IFRS 7 Servicing contracts - IAS 19 Discount rate: regional market issue - IAS 34 Disclosure of information elsewhere in the interim financial report
The following new standards and amendments and improvements to existing standards have been published and areeffective in future financial years.
Amendments - Accounting for acquisition of interests in joint operations
Clarification of acceptable methods of depreciation and amortisationAmendments - Bearer plants
2. SIGNIFICANT ACCOUNTING POLICIES (CONT'D)
(a) Basis of Preparation (Cont'd)
IFRS 9 - Financial instruments
IFRS 15 - Revenue from contracts with customers
IFRS 16 - Leases
The standard will be effective for the financial period beginning on 01 October 2018. One component of the standardsets out a single approach to determine whether a financial asset is measured at amortised cost or fair value based onhow an entity manages its financial instruments (its business model) and the contractual cash flow characteristics of thefinancial assets. The other components of the standard introduce a single, forward-looking 'expected loss' impairmentmodel and a substantially-reformed approach to hedge accounting. Management is reviewing the provisions of thisstandard to determine the impact against current practices.
The standard will be effective for the financial period beginning on 01 October 2018. The core principle of the newstandard is the recognition of revenue to depict the transfer of goods or services to customers in amounts that reflectthe consideration to which an entity expects to be entitled in exchange for those goods or services. The standardcontains enhanced disclosure requirements relative to revenue and also provides guidance for transactions that werenot previously addressed comprehensively. Management is reviewing the provisions of this standard to determine theimpact, if any, against current practices.
Of these pronouncements, those that are expected to be relevant to the Group's financial reporting are described below.
The standard will be effective for the financial period beginning on 01 October 2019. It replaces IAS 17 and removesthe classification of leases as either operating or finance leases. A single model is introduced for lessee accounting that requires assets and liabilities for all leases with a term of more than 12 months to be recognised, and the depreciationof lease assets to be shown separately from interest on lease liabilities in the income statement. Management isreviewing the provisions of this standard to determine the impact, if any, against current practices.

34
Notes to the Financial Statements30 September 2016
2. SIGNIFICANT ACCOUNTING POLICIES (CONT'D)
(b)
(c) Foreign Currencies
Functional and presentation currency
Transactions and balances
An associate is an entity over which the Group has significant influence but not control, generally accompanying ashareholding of between 20% to 50% of the voting rights. The investments in the associated companies are accountedfor under the equity method of accounting.
Basis of Consolidation
Subsidiaries are entities over which the Group has control. The Group controls an entity when it is exposed to, or hasrights to, variable returns from its involvement with the entity and has the ability to affect those returns through its powerover the entity. All inter-company transactions, balances and unrealised gains on transactions with subsidiaries areeliminated for consolidation purposes.
The consolidated financial information includes the accounts of Banks DIH Limited and its subsidiaries, together with theGroup's share of the results of its associates.
Translation differences arising on non-monetary financial assets, such as equity holdings classified as available-for-sale,are included in other comprehensive income.
Transactions involving foreign currencies are translated into the functional currency using exchange rates prevailing at thedates of the transactions. Foreign currency gains and losses resulting from the settlement of such transactions and fromthe translation at year end exchange rates of monetary assets and liabilities denominated in foreign currencies arerecognised in the statement of income.
Items included in the financial statements are measured using the currency of the primary economic environment in whichthe Group operates. The financial statements are presented in Guyana Dollars, which is the Group's functional currency.
The Group applies a policy of treating transactions with non-controlling interests as transactions with parties external tothe Group.
(d) Property, Plant and Equipment
Freehold properties 2% per annum Leasehold properties Life of lease Plant and machinery 5 - 10% per annum Furniture, fittings and equipment 6.66 - 33.33% per annum Motor vehicles 20 - 25% per annum Containers 20% per annum
No depreciation is provided on construction in progress.
The current rates of depreciation are:
Depreciation is provided on a straight line basis at rates estimated to write-off the assets over their expected usefullives. The estimated useful lives of assets are reviewed by taking account of commercial and technologicalobsolescence as well as normal wear and tear. Depreciation rates are adjusted, if appropriate.
Freehold properties of the Group are stated at revalued amounts less accumulated depreciation and impairment losses.Other properties, plant and equipment are stated at cost less accumulated depreciation and impairment losses. Propertyvalues are subject to annual management reviews. Professional valuations are conducted when these reviews indicate apotentially significant variation from recorded values.

35
Notes to the Financial Statements30 September 2016
2. SIGNIFICANT ACCOUNTING POLICIES (CONT'D)
(d) Property, Plant and Equipment (Cont’d)
(e) Investment Property
Subsequent costs are included in the asset's carrying amount or recognised as a separate asset, as appropriate, onlywhen it is probable that future economic benefits associated with the item will flow to the Group and the cost of the itemcan be measured reliably. All other repairs and maintenance are charged to the statement of income during the financialperiod in which they are incurred.
The assets’ residual values and useful lives are reviewed, and adjusted if appropriate, at each reporting date.
Property leased by the parent Company to the banking subsidiary is considered to be investment property in theCompany's financial statements. Investment property is measured initially at cost and subsequently at fair value.Changes in fair values are recognised in the statement of income.
(f) Intangible Assets (Computer Software)
(g) Impairment of Non-financial Assets
(h) Investment Securities
Assets are reviewed for impairment whenever events or changes in circumstances indicate that the carrying amount maynot be recoverable or at least at every reporting date. An impairment loss is recognised for the amount by which the asset'scarrying amount exceeds its recoverable amount. The recoverable amount is the higher of an asset's fair value less coststo sell and value in use. For the purposes of assessing impairment, assets are grouped at the lowest levels for which thereare separately identifiable cash flows (cash-generating units). Non-financial assets that suffered an impairment arereviewed for possible reversal of the impairment at each reporting date.
The Group classifies its investment securities into the following categories: 'available-for-sale' and 'held-to-maturity'.Management determines the classification of an investment security at the time of purchase.
Available-for-sale assets are non-derivative securities that are intended to be held for an indefinite period of time, whichmay be sold in response to needs for liquidity or changes in interest rates, exchange rates or equity prices. Such securitiesare carried at fair value, which is determined by reference to current trading price. Unrealised gains and losses arising fromchanges in the fair value are recognised in other comprehensive income.
Held-to-maturity assets are non-derivative financial assets with fixed or determinable payments and fixed maturities that theGroup's management has the positive intention and ability to hold to maturity. Were the Group to sell other than aninsignificant amount of held-to-maturity assets, the entire category would be tainted and reclassified as available-for-sale.Held-to-maturity investment securities are carried at amortised cost.
Investments in the associated companies and subsidiary companies are stated at cost in the Company's financialstatements.
The costs of acquiring, customising and installing computer software are capitalised and amortised on a straight line basisover the estimated useful economic life of five years. Costs associated with maintenance of computer software areexpensed as incurred.
36
Notes to the Financial Statements30 September 2016
(i) Loans and Advances
(a) for a loan or an account with fixed repayment dates -
(i) principal or interest is due and unpaid for three months or more; or(ii)
(b) for an overdraft or an account without fixed repayment dates -
(i) approved limit has been exceeded for three months or more; or(ii) credit line has expired for three months or more; or(iii) interest charges for three months or more have not been covered by deposits; or(iv)
(j) Impairment of Financial Assets
In accordance with the Bank of Guyana's Supervision Guideline 5 "Loan Portfolio Review, Classification, Provisioning, andOther Related Requirements" (SG 5), the banking subsidiary classifies loans and advances as 'non-performing' when:
interest charges for three months or more have been capitalised, refinanced, or rolled-over.
the account has developed a hardcore which was not converted into a term loan after three months or more.
A non-performing account may be restored to a performing status when all arrears of principal and interest have been paidor when it otherwise becomes well-secured and full collection is expected within three months.
Loans which have been refinanced, rescheduled, rolled-over, or otherwise modified because of weaknesses in theborrower's financial position or the non-repayment of the debt as arranged are classified as renegotiated. Facilities are onlyrenegotiated if the banking subsidiary is satisfied that the financial position of the borrower can service the debt under thenew conditions.
The Group assesses at each reporting date whether there is objective evidence that a financial asset or group of financialassets is impaired. The Group's financial assets include investment securities, loans and advances, receivables and cashresources.
Loans and advances to customers are stated at amortised cost net of an allowance for impairment losses. These arefinancial assets with fixed or determinable payments that are not quoted in an active market.
2. SIGNIFICANT ACCOUNTING POLICIES (CONT'D)
The Group's approach to impairment of financial assets is guided by IAS 39 - Financial Instruments: Recognition andMeasurement . The banking subsidiary is also subject to prudential reserving rules as stipulated by the Bank of Guyana inits Supervision Guideline 5 (SG 5). Where the impairment provision required under SG 5 is greater than that requiredunder IAS 39, the excess is dealt with as an appropriation of retained earnings to a general banking risk reserve. Bothapproaches are described in this note.
International Accounting Standard 39
(a) Assets carried at amorised cost
- significant financial difficulties of the counterparty; - actual delinquencies; - adverse change in the payment status of the counterparty; - bankruptcy or reorganisation by the counterparty.
A financial asset or a group of financial assets is impaired and impairment losses are incurred if there is objective evidenceof impairment as a result of one or more events that occurred after the initial recognition of the asset ('loss event') and thatloss event (events) adversely affects the amount or timing of future cash flows from the asset.
Objective evidence that a financial asset or group of financial assets is impaired includes observable data that comes to theGroup about the following loss events:

37
Notes to the Financial Statements30 September 2016
2. SIGNIFICANT ACCOUNTING POLICIES (CONT'D)
(j) Impairment of Financial Assets (Cont'd)
If there is objective evidence that an impairment loss on a financial asset has been incurred, the amount of the allowancefor impairment is measured as the difference between the carrying amount and the present value of the expected futurecash flows, including amounts recoverable from guarantees and collateral, discounted at the original effective interest rateof the asset. The carrying amount of the asset is reduced through the use of an allowance account and the amount of theloss is recognised in the statement of income. The treatment of impairment arising on an equity security classified asavailable-for-sale is described below.
For loans and advances, the Group first assesses whether objective evidence of impairment exists individually for financialassets that are individually significant. If the Group determines no objective evidence of impairment exists for anindividually assessed loan or advance, whether significant or not, it includes the asset in a group of loans and advanceswith similar credit risk characteristics and collectively assesses them for impairment. Assets that are individually assessedfor impairment and for which an impairment loss is or continues to be recognised are not included in a collectiveassessment of impairment.
(a) Assets carried at amorised cost (Cont’d)
(b) Assets classified as available-for-sale
Supervision Guideline 5
The following information should be considered in the review:
a) original terms and purpose of facility against current balance and status; b) financial information on the borrower;c) evaluation of the project being financed;d) status of collateral including recent valuation, legal assignments and insurance;e) past record of the borrower; andf) performance of other members of the group (if applicable).
The Group assesses at each reporting date whether there is objective evidence that a financial asset or a group of financialassets is impaired. In the case of equity investments classified as available-for-sale, a significant or prolonged decline in thefair value of the security below its cost is also evidence that the assets are impaired. If any such evidence exists for available-for-sale financial assets, the cumulative fair value losses are removed from equity and recognised in the statement of income.Impairment losses recognised in income on equity investments are not reversed through income.
The banking subsidiary is required to conduct a loan review of at least 70 percent of its portfolio including large accounts andoff-balance sheet commitments, and all past-due and non-performing accounts.

38
Notes to the Financial Statements30 September 2016
2. SIGNIFICANT ACCOUNTING POLICIES (CONT'D)
(j) Impairment of Financial Assets (Cont'd)
Write-offs and Recoveries
(k) Taxation
(l) Inventories
The principal temporary differences arise from depreciation on property, plant and equipment, revaluations of certainassets, provision for post-employment benefits and deferred income previously subject to taxation. Deferred tax assets arerecognised to the extent that it is probable that future taxable profit will be available against which the temporary differencescan be utilised.
Inventories are valued at the lower of cost and net realisable value. Cost is determined by the weighted average method.Cost of finished goods and work in progress comprise raw material costs, direct labour costs, other direct costs and relatedproduction overheads. Net realisable value is the estimated selling price in the ordinary course of business, less costs tocompletion and selling expenses.
The Group provides for deferred tax using the liability method for all temporary differences arising between the taxbases of the assets and liabilities and their carrying values for financial reporting purposes. Currently enacted tax rates areused to determine deferred corporation tax.
When an asset is uncollectible, it is written off against the related provision for impairment. Recoveries in part or in full ofamounts previously written-off are credited to the statement of income.
Each of the five categories has specific classification criteria based on facility performance, collateral status and financialcondition of borrower. Additionally, a general provision equivalent to 1 percent of the portfolio not reviewed is required.
The tax expense for the year comprises of current and deferred tax and is recognised in the statement of income and in theother comprehensive income, as appropriate.
The current corporate tax charge is identified on the basis of the tax laws enacted at the reporting date. It establishesprovisions where appropriate on the basis of amounts expected to be paid to the tax authorities.
The provision levels stipulated in SG 5 are as follows.
Classification Provision
Pass 0%Special Mention 0%Substandard
-
0%- others 20%
Doubtful 50%Loss 100%
portion secured by cash, cash substitutes,government securities or governmentguarantees
Following the review of the portfolio, accounts are classified into one of five categories being Pass, Special Mention,Substandard, Doubtful or Loss.
Supervision Guideline 5 (Cont’d)
39
Notes to the Financial Statements30 September 2016
2. SIGNIFICANT ACCOUNTING POLICIES (CONT'D)
(m) Trade Receivables
(n) Cash and Cash Equivalents
(o) Share Capital and Dividends
Ordinary shares with discretionary dividends are classified as equity.
(p)
(q) Customers' Deposits
(r) Employee Benefits
(i) Post-employment benefits
Customers' deposits are recognised initially at the nominal amount of funds received and subsequently at amortisedcost.
Trade receivables are recognised initially at fair value and subsequently measured at amortised cost using the effectiveinterest method, less a provision for impairment. A provision for impairment of trade receivables is established whenthere is objective evidence that the Group will not be able to collect all amounts due according to the original terms of thereceivables.
Cash and cash equivalents comprise cash in hand, balances with banks, the non-restricted balance with the Bank ofGuyana and investment securities with an original maturity of less than three months but excludes external paymentdeposits with commercial banks.
Dividends are recognised as a deduction from shareholders' equity in the period in which they are approved byshareholders or, as in the case of interim dividends, when paid by the directors as authorised under the Company's by-laws.
Borrowings
Borrowings are recognised initially at the proceeds received and subsequently at amortised cost. Borrowing costs thatare directly attributable to the acquisition, construction or production of an asset are capitalised as part of the cost of thatasset.
(ii) Termination gratuities
The Group operates defined contribution schemes for the majority of employees. The Group's contributions to the defined contribution schemes are charged to the statement of income in the year to which they relate.
The Company also guarantees a certain level of post-employment benefit to long- serving employees. The guaranteed benefit is based on number of years service and salary levels at retirement. The Company has made a provision for this obligation.
The governance of the post-employment benefit arrangements is the responsibility of the Trustees appointed by the Group.
The Company offers a termination gratuity to employees after a minimum number of years service, which is based on years of service and salary level at termination. The expected costs of these gratuity payments are accrued over the period of employment. The Company has made a provision for this obligation.

40
Notes to the Financial Statements30 September 2016
The provisions in respect of the guaranteed post-employment benefits and the termination gratuities represent the present value of the obligations at the year end minus the fair value of any asset held to cover the obligations.The obligations have been calculated by an independent actuary using the projected unit credit method. Actuarial gains and losses arising from experience adjustments and changes in actuarial assumptions are charged or credited to equity in other comprehensive income in the period in which they arise.Past service costs are recognised immediately in the statement of income.
2. SIGNIFICANT ACCOUNTING POLICIES (CONT'D)
(r) Employee Benefits (Cont'd)
(s) Trade Payables
(t) Revenue Recognition
-
- Dividend income is recognised when the right to receive dividend is established.
- Lease income is recognised over the term of the lease to reflect a constant rate of return.
(u)
(v) Segmental Reporting
The Group's operations are located in Guyana.
Other revenues earned by the Group are recognised as follows:
Fees and commissions are generally recognised on an accrual basis when the service has been provided. Loancommitment fees for loans that are likely to be drawn down are deferred over the term of the loan.
Leases in which a significant portion of the risks and rewards of ownership are retained by the lessor are classified asoperating leases. As lessee, payments made under an operating lease are charged to the statement of income on astraight-line basis over the period of the lease. As lessor, payments received under an operating lease are credited to thestatement of income on a straight-line basis over the period of the lease.
Leases
Interest income for the banking subsidiary is recognised on an accrual basis using the effective interest method. Inaccordance with Guyana banking regulations, where collection of interest income is considered doubtful or payment isoutstanding for 90 days or more, interest is accounted for on a cash basis. IFRS require that when loans becomeimpaired, they are written down to their recoverable amounts and interest income is thereafter recognised based on therate of interest that was used to discount the future cash flows for the purpose of measuring the recoverable amount. Thedifference between the regulatory and IFRS bases of interest recognition in this circumstance was assessed to beimmaterial.
The categories are Beverages, Commercial Banking and All Other Segments. The 'All Other Segments' category includesthe Food and Restaurants, Hotel and Laundry Services segments as these do not meet the quantitative thresholdsspecified in IFRS 8. The types of products and services in each reportable segment are identified in note 1 to thesefinancial statements.
The Group's business activities have been classified into three categories for segmental reporting in a mannerconsistent with the internal reporting provided to the chief operating decision-maker and based largely on the nature ofthe products and services. The chief operating decision-maker has been identified as the Board of Directors of the parentcompany.
Trade payables are recognised initially at fair value and subsequently measured at amortised cost using the effective rate method.
Revenue from sale of goods is recognised when significant risks and rewards of ownership of the goods are transferred to the buyer.
41
Notes to the Financial Statements30 September 2016
2. SIGNIFICANT ACCOUNTING POLICIES (CONT'D)
(w)
3. CRITICAL ACCOUNTING ESTIMATES AND JUDGEMENTS IN APPLYING ACCOUNTING POLICIES
(a) Impairment Losses on Financial Assets
Financial instruments carried on the statement of financial position include investment securities, loans and advances,receivables, customers' deposits, payables, accruals, borrowings and cash resources. The recognition methods adopted for each significant instrument is disclosed in the individual policy statements.
To identify impairment in the Group's loans, investment securities (except available-for-sale equity investments) and receivablesportfolios, judgements are made as to whether there is any observable data indicating that there is a measurable decrease in theestimated future cash flows from those assets. Estimating the quantum and timing of future recoveries involves significantjudgement. The size of receipts will depend on the future performance of the borrower/issuer/customer and the value of security,both of which will be affected by future economic conditions; additionally, collateral may not be readily marketable. The actualamount of future cash flows and the date they are received may differ from these estimates and consequently actual lossesincurred may differ from those recognised in these financial statements.
Financial Instruments
The Group follows the guidance of IAS 39 to determine whether an available-for-sale equity investment is impaired. Thisdetermination requires signficant judgement. In making this judgement, the Group evaluates, among other factors, the durationand extent to which the fair value of an investment is less than its cost; and the financial health of and short-term businessoutlook for the investee, including factors such as industry and sector performance, and operational and financial cash flow.
(b) Provisions for Employee Benefits
(c)
(d) Values of Property, Plant and Equipment
The residual values and useful lives of property, plant and equipment are reviewed at each reporting date and estimates made ofthe values expected to be obtained from disposal of the assets at the end of their useful lives and the expected period over whichthe assets are expected to be available for use.
The provision for employee benefits is based on the application of the projected unit credit method by an independent actuaryusing certain assumptions (stated in note 18). The future payments of employee benefits may differ from the estimated amountsdue to deviations from the assumptions used.
Held-to-Maturity Investments
The Group follows the guidance of IAS 39 on classifying non-derivative financial assets with fixed or determinable payments andfixed maturity as held-to-maturity. This classification requires significant judgement for which management evaluates its intentionand ability to hold such investments to maturity.

42
Notes to the Financial Statements30 September 2016
Thousands of Guyana Dollars
4. PROPERTY, PLANT AND EQUIPMENT Furniture,
Group Fittings Freehold Leasehold Plant and and Motor Construction
Cost / Valuation Properties Properties Machinery Equipment Vehicles Containers in Progress Total
As at 01 October 2015 8,052,215 74,579 13,438,697 3,367,743 2,224,084 4,373,945 3,167,115 34,698,378
Additions 15,367 0 301,123 457,044 92,643 824,364 1,402,809 3,093,350
Transfers 129,551 0 1,016,570 30,294 233,588 0 (1,410,003) 0
Disposals 0 0 (796,757) (50,849) (159,904) (231,234) 0 (1,238,744)
Revaluation 21,900 0 0 0 0 0 0 21,900
As at 30 September 2016 8,219,033 74,579 13,959,633 3,804,232 2,390,411 4,967,075 3,159,921 36,574,884
Depreciation & Impairment
As at 01 October 2015 (220,186) (69,361) (5,096,878) (2,163,646) (1,755,418) (2,547,024) 0 (11,852,513)
Depreciation charge (110,327) (5,147) (846,645) (375,858) (304,729) (757,640) 0 (2,400,346)
Written back on disposals 0 0 635,767 48,485 156,964 205,579 0 1,046,795
Written back on revaluation 7,060 0 0 0 0 0 0 7,060
As at 30 September 2016 (323,453) (74,508) (5,307,756) (2,491,019) (1,903,183) (3,099,085) 0 (13,199,004)
Net Carrying Amount
As at 30 September 2016 7,895,580 71 8,651,877 1,313,213 487,228 1,867,990 3,159,921 23,375,880
Cost / Valuation
As at 01 October 2014 7,666,093 74,486 12,689,926 3,008,150 2,130,726 3,885,994 1,435,787 30,891,162
Additions 24,779 93 340,516 444,744 61,176 756,497 2,729,198 4,357,003
Transfers 361,343 0 530,580 55,933 47,792 0 (995,648) 0
Disposals 0 0 (122,325) (141,084) (15,610) (268,546) (2,222) (549,787)
As at 30 September 2015 8,052,215 74,579 13,438,697 3,367,743 2,224,084 4,373,945 3,167,115 34,698,378
Depreciation & Impairment
As at 01 October 2014 (112,863) (67,769) (4,398,794) (1,956,746) (1,479,465) (2,116,486) 0 (10,132,123)
Depreciation charge (107,323) (1,592) (803,603) (339,017) (291,563) (683,017) 0 (2,226,115)
Written back on disposals 0 0 105,519 132,117 15,610 252,479 0 505,725
As at 30 September 2015 (220,186) (69,361) (5,096,878) (2,163,646) (1,755,418) (2,547,024) 0 (11,852,513)
Net Carrying Amount
As at 30 September 2015 7,832,029 5,218 8,341,819 1,204,097 468,666 1,826,921 3,167,115 22,845,865

43
Notes to the Financial Statements30 September 2016
Thousands of Guyana Dollars
Furniture, Fittings
Freehold Plant and and Motor Construction
Properties Machinery Equipment Vehicles Containers in Progress Total
Cost / Valuation
As at 01 October 2014 7,288,013 12,719,243 1,920,331 2,045,539 3,885,994 683,444 28,542,564
Additions 24,779 340,516 315,541 52,685 756,497 1,919,779 3,409,797
Transfers 361,343 530,580 55,933 47,792 0 (995,648) 0
Disposals 0 (122,325) (74,909) (11,546) (268,546) (2,222) (479,548)Fair value gains 9,733 0 0 0 0 0 9,733
As at 30 September 2015 7,683,868 13,468,014 2,216,896 2,134,470 4,373,945 1,605,353 31,482,546
Depreciation and Impairment
As at 01 October 2014 (92,791) (4,401,674) (1,231,349) (1,438,427) (2,116,486) 0 (9,280,727)
Depreciation charge (95,294) (808,454) (234,636) (275,616) (683,017) 0 (2,097,017)
Written back on disposals 0 105,519 67,079 11,546 252,479 0 436,623
As at 30 September 2015 (188,085) (5,104,609) (1,398,906) (1,702,497) (2,547,024) 0 (10,941,121)
Net Carrying Amount
As at 30 September 2015 7,495,783 8,363,405 817,990 431,973 1,826,921 1,605,353 20,541,425
4. PROPERTY, PLANT AND EQUIPMENT (CONT'D)
Company
Cost / Valuation
As at 01 October 2015 7,683,868 13,468,014 2,216,896 2,134,470 4,373,945 1,605,353 31,482,546
Additions 15,367 301,123 367,148 81,531 824,364 533,127 2,122,660
Transfers 129,551 1,016,570 30,294 233,588 0 (1,410,003) 0
Disposals 0 (796,757) (32,800) (142,713) (223,695) 0 (1,195,965)
Fair value gains 28,584 0 0 0 0 0 28,584
As at 30 September 2016 7,857,370 13,988,950 2,581,538 2,306,876 4,974,614 728,477 32,437,825
Depreciation and Impairment
As at 01 October 2015 (188,085) (5,104,609) (1,398,906) (1,702,497) (2,547,024) 0 (10,941,121)
Depreciation charge (97,939) (851,496) (267,365) (291,034) (757,640) 0 (2,265,474)
Written back on disposals 0 635,767 31,173 142,713 205,579 0 1,015,232
As at 30 September 2016 (286,024) (5,320,338) (1,635,098) (1,850,818) (3,099,085) 0 (12,191,363)
Net Carrying Amount
As at 30 September 2016 7,571,346 8,668,612 946,440 456,058 1,875,529 728,477 20,246,462
Included in the Company's freehold property are properties leased to the banking subsidiary with a carrying value of $617,193 (2015-$588,609). These properties are considered to be investment properties in the Company's financial statements and are carried at fair values determined at the year end by Rodrigues Architects Limited. A fair value gain of $28,584 (2015 - $9,733) is recognised in the statement of income.

44
Notes to the Financial Statements30 September 2016
Thousands of Guyana Dollars
4.
GROUP COMPANY2016 2015 2016 2015
Cost 2,988,474 2,843,556 2,645,843 2,500,925Accumulated depreciation (512,120) (469,121) (423,300) (386,266)
Net carrying amount 2,476,354 2,374,435 2,222,543 2,114,659
Interest held Interest held5. INVESTMENT IN ASSOCIATES in ordinary in ordinary
Principal Place of shares sharesactivity business 2016 2015
Nature of investment in associates
B&B Farms Inc. Poultry rearing Guyana 40% 40% BCL (Barbados) Ltd. Beverage distribution Barbados 0% 25%
GROUP COMPANY2016 2015 2016 2015
Cost of investment in associates
Cost of investment in associates 8,000 18,253 8,000 18,253Share of post acquisition reserves (2,339) 28,869 0 0
5,661 47,122 8,000 18,253
Share of associates' loss after tax from continuing operations (1,304) (52) 0 0
PROPERTY, PLANT AND EQUIPMENT (CONT'D)
If freehold properties were stated on the historical cost basis, the total carrying value of properties would be as follows:
During the current year BCL (Barbados) Ltd. filed for dissolution in Barbados. A surplus of $29,215 over the cost of the investment was received by the Company from the dissolution.
The prior year financial information for one of the associates was based on financial statements as at 31 August which represents that entity's financial year end.

45
Notes to the Financial Statements30 September 2016
Thousands of Guyana Dollars
6. INVESTMENT IN SUBSIDIARIES Interest heldPrincipal Place of in ordinary
activity business sharesNature of investment in subsidiaries
Citizens Bank Guyana Inc. Guyana 51% Caribanks Shipping Company Ltd. Dormant Guyana 100%
COMPANYCost of investment in subsidiaries 2016 2015
Cost of equity investment in subsidiaries 387,178 387,178
Non-controlling interest
2016 2015Summarised Statement of Financial Position:
Assets 50,223,938 43,114,457Liabilities 42,624,245 35,875,395
Net assets 7,599,693 7,239,062
Revenue 3,265,865 3,701,967Expenses (2,506,609) (2,234,568)
Profit before tax 759,256 1,467,399Tax charge (280,131) (560,553)
Profit after tax 479,125 906,846Other comprehensive income 24,285 1,741
Total comprehensive income 503,410 908,587
37
Commercial banking
Summarised below is financial information for the banking subsidiary which has a 49 percent non-controlling interest. Thefinancial informaion is before inter-company eliminations.
BANKING SUBSIDIARY
Summarised Statement of Comprehensive Income:

46
Notes to the Financial Statements30 September 2016
6. INVESTMENT IN SUBSIDIARIES (CONT'D)2016 2015
Non-controlling interest (cont'd)
Dividends paid to non-controlling interest 69,962 69,962
Summarised Statement of Cash Flows:
7,760,386 846,477(2,053,968) 1,327,129
(142,779) (1,442,779)
5,563,639 730,827Cash and cash equivalents as at beginning of year 5,353,278 4,622,451
Cash and cash equivalents as at end of year 10,916,917 5,353,278
7. INVESTMENT SECURITIES GROUP2016 2015 2016 2015
Held-to-maturity securities at amortised cost (net of provision for impairment) 1,505,108 623,929 0 0Available for sale securities at fair value: Quoted equity securities 841,735 2,585,426 707,855 2,452,197 Unquoted equity securities 905 783 905 783
2,347,748 3,210,138 708,760 2,452,980
Non-current 1,014,693 2,644,390 708,760 2,452,980Current 1,333,055 565,748 0 0
2,347,748 3,210,138 708,760 2,452,980
COMPANY
BANKING SUBSIDIARY
As reported in the statement of financial position:
Net cash generated from operating activitiesNet cash (used in) / generated from investing activitiesNet cash used in financial activities
Net increase in cash and cash equivalents
Thousands of Guyana Dollars

47
Notes to the Financial Statements30 September 2016
Thousands of Guyana Dollars
8. LOANS AND ADVANCES (BANKING SEGMENT) GROUP2016 2015 2016 2015
Overdrafts 2,302,646 2,695,599 0 0Term loans 12,614,367 14,892,532 0 0Mortgages 10,162,922 9,585,431 0 0Non-accrual accounts 4,694,359 3,386,076 0 0
29,774,294 30,559,638 0 0Accrued interest receivable 247,227 363,346 0 0Provision for impairment (1,382,995) (827,545) 0
0
0
28,638,526 30,095,439 0
As reported in the statement of financial position:
Non - current 25,715,052 26,130,708 0 0Current 2,923,474 3,964,731 0 0
28,638,526 30,095,439 0 0
39
COMPANY

48
Notes to the Financial Statements30 September 2016
Thousands of Guyana Dollars
9. DEFERRED TAXATION
Provisions for Fair value lossDeferred employee on investment
income benefits securities Total
Total
121 458,746 971 459,838
(43) (220,131) 0 (220,174)
0 19,870 (262) 19,608
78 258,485 709 259,272
0 258,485 0 258,485
163 454,346 2,131 456,640
(42) 13,558 0 13,516
0 (9,158) (1,160) (10,318)
121 458,746 971 459,838
0 458,746 0 458,746Balance expected to be recovered after more than 12 months
GROUP
Deferred taxes are calculated in full on temporary differences under the liability method using the applicable tax rates. There is no enforceable right to set off tax assets against liabilities within the Group and the following amounts are shown in the statement of financial position.
Provisions foremployee
benefits Total
458,746 458,746
(220,131) (220,131)
19,870 19,870
258,485 258,485
258,485 258,485
454,346 454,346
13,558 13,558
(9,158) (9,158)
458,746 458,746
458,746 458,746
COMPANY
1,598,912 744,083 239 2,343,234
(30,172) (15,772) 0 (45,944)
0 5,063 0 5,063
1,568,740 733,374 239 2,302,353
1,568,740 713,217 239 2,282,196
1,471,000 760,180 239 2,231,419
127,912 (16,097) 0 111,815
1,598,912 744,083 239 2,343,234
1,598,912 727,986 239 2,327,137
GROUP
Deferred Tax Assets
As at beginning of year
As at end of year
As at beginning of year
As at end of year
Charged to statement of income
For the year ended 30 September 2015
(Charged) / credited to statement of income
Charged to other comprehensive income
Balance expected to be recovered aftermore than 12 months
For the year ended 30 September 2016
Balance expected to be realised after more than 12 months
Deferred Tax Liabilities
As at beginning of year
As at end of year
As at beginning of year
As at end of year
Credited to statement of income
For the year ended 30 September 2015
Balance expected to be realised aftermore than 12 months
For the year ended 30 September 2016
Charged to other comprehensive income
Accelerated Revaluation Fair value gains tax gains on on investment
depreciation property securities
Accelerated Revaluation Fair value gains tax gains on on investment
depreciation property securities Total
1,559,141 734,368 239 2,293,748
(19,618) (10,056) 0 (29,674)
0 0 0 0
1,539,523 724,312 239 2,264, 074
1,539,523 708,154 239 2,247,916
1,433,111 748,194 239 2,181,544
126,030 (13,826) 0 112,204
1,559,141 734,368 239 2,293,748
1,559,141 718,596 239 2,277,976
COMPANY
Credited / (charged) to other comprehensive income
Charged / (credited) to statement of income

49
Notes to the Financial Statements30 September 2016
Thousands of Guyana Dollars
10. INVENTORIES COMPANY2016 2015 2016 2015
Production raw materials and work in progress 1,492,435 1,486,752 1,492,435 1,486,752Packaging material 991,619 1,083,694 991,619 1,083,694Spares and expense stocks 1,189,651 1,096,995 1,189,651 1,096,995Finished goods 666,728 578,689 666,728 578,689Goods in transit 823,473 970,921 823,473 970,921
5,163,906 5,217,051 5,163,906 5,217,051
11. RECEIVABLES AND PREPAYMENTS
Trade receivables (gross) 650,872 703,434 650,872 703,434Provision for impairment (38,414) (26,994) (38,414) (26,994)
Trade receivables (net) 612,458 676,440 612,458 676,440Other receivables 275,103 285,903 221,203 245,376Prepayments 97,240 96,245 23,251 10,157
984,801 1,058,588 856,912 931,973
12. CASH RESOURCES
Balance with Bank of Guyana in excess of reserve requirement 4,817,269 1,384,096 0 0Balance with subsidiary 0 0 6,925,562 3,437,219Cash in hand and balances with other banks 6,624,545 4,267,207 629,956 618,204
Included in cash and cash equivalents 11,441,814 5,651,303 7,555,518 4,055,423Reserve requirement with Bank of Guyana 4,894,701 3,909,670 0 0External payment deposit 5,064 5,064 5,064 5,064
16,341,579 9,566,037 7,560,582 4,060,487
The Group's banking entity is required to maintain a monetary reserve with the Bank of Guyana which is based oncustomers' deposits and other specified liabilities. External payment deposits are to be remitted to foreign creditors subjectto approval from the Bank of Guyana.
GROUP

50
Notes to the Financial Statements30 September 2016
Thousands of Guyana Dollars
13. SHARE CAPITAL COMPANY2016 2015
Authorised 1,400,000,000 ordinary shares of no par value Issued and Fully Paid 1,000,000,000 ordinary shares of no par value 2,364,966 2,364,966
14. RESERVES
The nature and purpose of reserves held by the Group, other than retained earnings, are:
Revaluation Reserve
Available-for-Sale Investments Reserve
Statutory Reserve
General Banking Risk Reserve
COMPANY15. DIVIDENDS PAID 2016 2015
Prior year interim paid - $0.17 per share (2015 - $0.17 per share) 170,000 170,000Prior year final dividend paid - $0.35 per share (2015 - $0.30 per share) 350,000 300,000Current year interim paid - $0.60 per share (2015 - nil) 600,000 0Current year interim paid - $0.25 per share (2015 - $0.17 per share) 250,000 170,000
1,370,000 640,000
The movements in the fair values of available-for-sale investment securities are transferred to this reserve.
The surplus arising on the revaluation of freehold properties is transferred to this reserve.
The Financial Institutions Act 1995, requires registered institutions to transfer annually a minimum of 15% of profit aftertaxation to a statutory reserve until the balance on this reserve is equal to the paid up capital of the institution. This reserveis relevant to the Group's interest in commercial banking.
This reserve represents the statutory and other loss provisions that exceed the loan impairment provision. This reserve isrelevant to the Group's interest in commercial banking.

51
Notes to the Financial Statements30 September 2016
Thousands of Guyana Dollars
15. DIVIDENDS PAID (CONT'D)
16. BORROWINGS GROUP COMPANY2016 2015 2016 2015
Loan from banking subsidiary: 2012 / 2022 (8.5% per annum) 0 0 521,187 584,735
As reported in the statement of financial position:
Current 0 0 69,806 64,137 Non-current 0 0 451,381 520,598
0 0 521,187 584,735
Repayments analysed as:
Within 1 year 0 0 69,970 64,353 Over 1 year but not exceeding 2 years 0 0 76,155 70,042 Over 2 years but not exceeding 3 years 0 0 82,887 76,233 Over 3 years but not exceeding 5 years 0 0 188,400 173,276 Over 5 years 0 0 103,775 200,831
0 0 521,187 584,735
A third interim dividend in respect of the financial year of $0.25 per share (2015 - $0.17 per share), totalling $250,000 (2015 -$170,000), has been declared and paid after the year end. A final dividend in respect of the financial year of $0.38 per share(2015 - $0.35 per share), totalling $380,000 (2015 - $350,000), is to be proposed at the annual general meeting on 28January 2017.
The Company has pledged certain property, plant and equipment as security against borrowings with an outstandingbalance of $521,187 at the year-end (2015 - $584,735). The net carrying amount of the pledged property, plant andequipment at the year-end was $2,035,981 (2015 - $2,093,563).

52
Notes to the Financial Statements30 September 2016
Thousands of Guyana Dollars
GROUP COMPANY17. CUSTOMERS' DEPOSITS (BANKING SEGMENT) 2016 2015 2016 2015
Demand deposits 6,630,785 7,724,673 0 0Savings deposits 13,729,370 11,298,024 0 0Term deposits 14,490,710 12,111,431 0 0Accrued interest payable 315,607 334,177 0 0
35,166,472 31,468,305 0 0
As reported in the statement of financial position:
Non-current 2,295,043 985,855 0 0Current 32,871,429 30,482,450 0 0
35,166,472 31,468,305 0 0
18. PROVISION FOR EMPLOYEE BENEFITS
Post-Employment TerminationBenefits Gratuities Total
Present value of obligations 1,182,469 738,766 1,921,235Fair value of assets held (1,059,615) 0 (1,059,615)
122,854 738,766 861,620
Amount recognised in statement of income:
Current service cost 11,477 27,593 39,070Past service cost 10,896 0 10,896Interest cost 66,584 40,723 107,307
88,957 68,316 157,273
GROUP AND COMPANY 2016
Amount recognised in statement of financial position:

53
Notes to the Financial Statements30 September 2016
Thousands of Guyana Dollars
18. PROVISION FOR EMPLOYEE BENEFITS (CONT'D)
Post-Employment TerminationBenefits Gratuities Total
Amount recognised in other comprehensive income:
Experience losses - demographic 19,090 12,936 32,026Experience losses - financial 34,210 0 34,210
53,300 12,936 66,236
Movement in present value of obligation:
As at beginning of year 1,133,555 672,326 1,805,881Current service cost 11,477 27,593 39,070Past service cost 10,896 0 10,896Interest cost 66,584 40,723 107,307Actuarial losses 19,090 12,936 32,026Benefits paid (59,133) (14,812) (73,945)
As at end of year 1,182,469 738,766 1,921,235
Movement in fair value of plan assets:
As at beginning of year 276,728 0 276,728Interest 50,794 0 50,794Contributions 825,436 0 825,436Benefits paid (59,133) 0 (59,133)Actuarial losses (34,210) 0 (34,210)
As at end of year 1,059,615 0 1,059,615
Actual returns on assets held 16,584 0 16,584
GROUP AND COMPANY 2016

54
Notes to the Financial Statements30 September 2016
Thousands of Guyana Dollars
18. PROVISION FOR EMPLOYEE BENEFITS (CONT'D)
Post-Employment TerminationBenefits Gratuities Total
Present value of obligations 1,133,555 672,326 1,805,881Fair value of assets held (276,728) 0 (276,728)
856,827 672,326 1,529,153
Amount recognised in statement of income:
Current service cost 12,029 26,829 38,858Interest cost 49,811 39,728 89,539
61,840 66,557 128,397
Amount recognised in other comprehensive income:
Experience losses / (gains) - demographic 113,422 (35,684) 77,738Experience gains - financial (108,263) 0 (108,263)
5,159 (35,684) (30,525)
Movement in present value of obligation:
As at beginning of year 1,006,790 655,985 1,662,775Current service cost 12,029 26,829 38,858Interest cost 59,037 39,728 98,765Actuarial losses / (gains) 113,422 (35,684) 77,738Benefits paid (57,723) (14,532) (72,255)
As at end of year 1,133,555 672,326 1,805,881
Movement in fair value of plan assets:
As at beginning of year 148,287 0 148,287Recovery of Clico assets 113,395 0 113,395Interest 9,226 0 9,226Contributions 68,675 14,532 83,207Benefits paid (57,723) (14,532) (72,255)Actuarial losses (5,132) 0 (5,132)
As at end of year 276,728 0 276,728
Actual returns on assets held 4,093 0 4,093
GROUP AND COMPANY 2015
Amount recognised in statement of financial position:
Thousands of Guyana Dollars
18. PROVISION FOR EMPLOYEE BENEFITS (CONT'D)
Principal Assumptions2016 2015
Principal actuarial assumptions used:Discount rate 6% 6%Future salary increase 4% 4%
Sensitivity Analysis
The impact on the defined benefit obligations of changes in the key assumptions are:
Post-emploment Benefits: 1% increase 1% decrease 1% increase 1% decrease
Discount rate (69,375) 77,710 (76,584) 88,297Future salary increase Nil Nil (2,692) 2,746
Termination Gratuities: 1% increase 1% decrease 1% increase 1% decrease
Discount rate (24,917) 28,115 (22,531) 25,429Future salary increase 19,387 (17,340) 14,607 (12,674)
Assets, Funding and Maturity Profile
2016 2015
Cash resources 967,879 93,931 Receivable from the Company 0 113,398
91,736 69,399
1,059,615 276,728
GROUP AND COMPANY
GROUP AND COMPANY GROUP AND COMPANY
Individual contribution accounts in insured pension scheme
Where a post-employment benefit materialises, the Company is obligated to meet the amount in excess of therelated plan assets. Where a termination gratutity materialises, the Company is obligated to meet the amount in full.
Expected contributions to the post-employment benefit arrangement for the year ending 30 September 2017 are$70,735 (2015 - $69,668). The weighted average durations of the post-employment benefit arrangement andtermination gratutities are 8 years and 4 years respectively.
2016 2015
2016 2015
The plan assets for the post-employment benefit arrangement is comprised asfollows.
GROUP AND COMPANY

55
Notes to the Financial Statements30 September 2016
Thousands of Guyana Dollars
18. PROVISION FOR EMPLOYEE BENEFITS (CONT'D)
Principal Assumptions2016 2015
Principal actuarial assumptions used:Discount rate 6% 6%Future salary increase 4% 4%
Sensitivity Analysis
The impact on the defined benefit obligations of changes in the key assumptions are:
Post-emploment Benefits: 1% increase 1% decrease 1% increase 1% decrease
Discount rate (69,375) 77,710 (76,584) 88,297Future salary increase Nil Nil (2,692) 2,746
Termination Gratuities: 1% increase 1% decrease 1% increase 1% decrease
Discount rate (24,917) 28,115 (22,531) 25,429Future salary increase 19,387 (17,340) 14,607 (12,674)
Assets, Funding and Maturity Profile
2016 2015
Cash resources 967,879 93,931 Receivable from the Company 0 113,398
91,736 69,399
1,059,615 276,728
GROUP AND COMPANY
GROUP AND COMPANY GROUP AND COMPANY
Individual contribution accounts in insured pension scheme
Where a post-employment benefit materialises, the Company is obligated to meet the amount in excess of therelated plan assets. Where a termination gratutity materialises, the Company is obligated to meet the amount in full.
Expected contributions to the post-employment benefit arrangement for the year ending 30 September 2017 are$70,735 (2015 - $69,668). The weighted average durations of the post-employment benefit arrangement andtermination gratutities are 8 years and 4 years respectively.
2016 2015
2016 2015
The plan assets for the post-employment benefit arrangement is comprised asfollows.
GROUP AND COMPANY

56
Notes to the Financial Statements30 September 2016
Thousands of Guyana Dollars
19. PAYABLES AND ACCRUALS GROUP COMPANY2016 2015 2016 2015
Trade payables 1,172,038 2,194,598 1,172,038 2,194,598Other payables 523,901 948,298 308,190 462,719Accruals 1,004,299 913,322 921,757 786,765Deferred income 181,591 197,260 52,787 60,512
2,881,829 4,253,478 2,454,772 3,504,594
20. REVENUE
Earned in Guyana: Sales of goods 25,169,477 23,833,041 25,169,477 23,833,041 Banking income 3,179,832 3,632,149 0 0 Provision of other services 56,667 53,627 56,667 53,627Earned out of Guyana: Sales of goods 348,898 358,878 348,898 358,878 Banking income 8,097 16,683 0 0
28,762,971 27,894,378 25,575,042 24,245,546
21. NET FINANCE INCOME / (CHARGE)
Interest payable to licensed financial entities 0 (2,398) (48,040) (55,539)Interest receivable (non-banking) 25,992 18,574 39,961 24,906
25,992 16,176 (8,079) (30,633)
22. OTHER INCOME
Dividends from quoted equity securities 25,294 71,551 92,249 138,624Fair value gains on investment property 0 0 28,584 9,733Gain on disposals of investment securities 1,380,293 0 1,380,293 0Other 31,071 7,924 88,431 54,920
1,436,658 79,475 1,589,557 203,277
On 02 December 2015 the Company sold its holding of ordinary shares in Banks Holdings Limited, which amounted to4,358,815 ordinary shares or 6.7 percent of the issued share capital of that entity, to SLU Beverages Limited. Thetransaction was carried out on the Barbados Stock Exchange at a price of BD$7.10 per share, which is in excess of theoriginal cost of acquisition.
The gain recognised in the statement of income (net of associated costs and accumulated fair value losses) arising on thedisposal of Banks Holdings Limited ordinary shares amounted to $1,375,353. The gain is not subject to taxation.
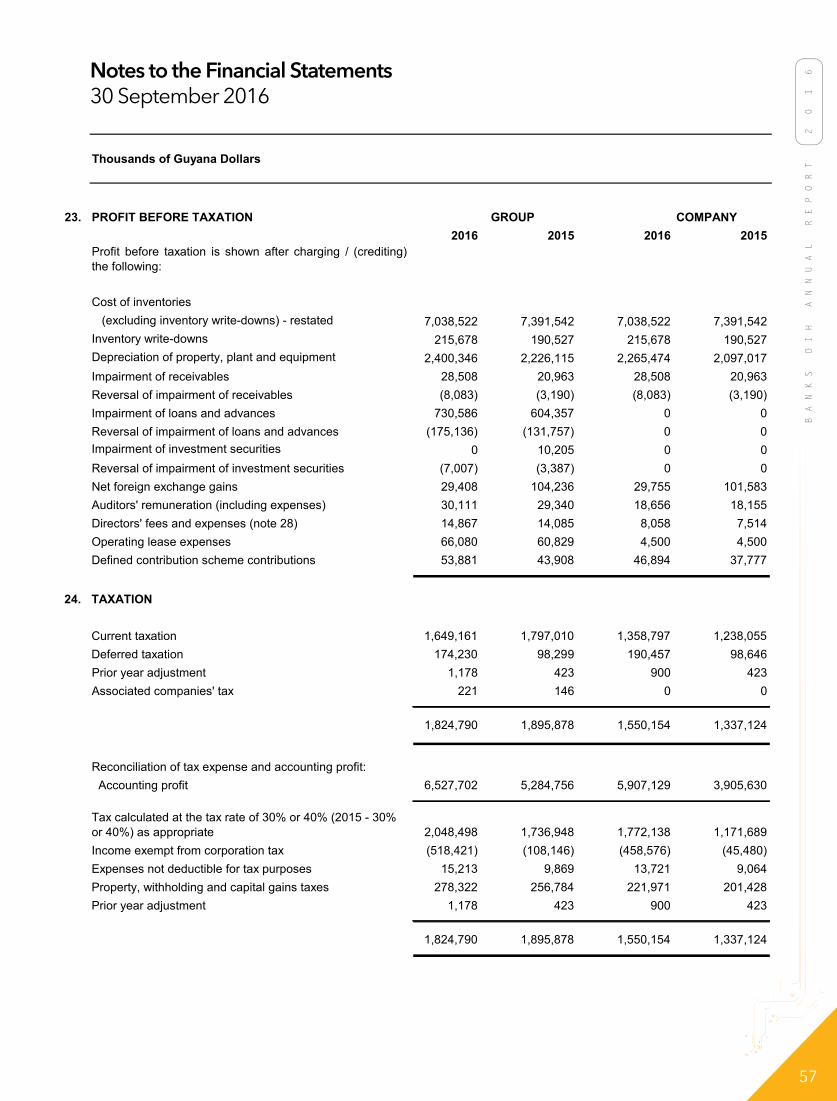
57
Notes to the Financial Statements30 September 2016
Thousands of Guyana Dollars
23. PROFIT BEFORE TAXATION COMPANY2016 2015 2016 2015
Cost of inventories (excluding inventory write-downs) - restated 7,038,522 7,391,542 7,038,522 7,391,542Inventory write-downs 215,678 190,527 215,678 190,527Depreciation of property, plant and equipment 2,400,346 2,226,115 2,265,474 2,097,017Impairment of receivables 28,508 20,963 28,508 20,963Reversal of impairment of receivables (8,083) (3,190) (8,083) (3,190)Impairment of loans and advances 730,586 604,357 0 0Reversal of impairment of loans and advances (175,136) (131,757) 0 0Impairment of investment securities 0 10,205 0 0Reversal of impairment of investment securities (7,007) (3,387) 0 0Net foreign exchange gains 29,408 104,236 29,755 101,583Auditors' remuneration (including expenses) 30,111 29,340 18,656 18,155Directors' fees and expenses (note 28) 14,867 14,085 8,058 7,514Operating lease expenses 66,080 60,829 4,500 4,500Defined contribution scheme contributions 53,881 43,908 46,894 37,777
24. TAXATION
Current taxation 1,649,161 1,797,010 1,358,797 1,238,055Deferred taxation 174,230 98,299 190,457 98,646Prior year adjustment 1,178 423 900 423Associated companies' tax 221 146 0 0
1,824,790 1,895,878 1,550,154 1,337,124
Accounting profit 6,527,702 5,284,756 5,907,129 3,905,630
2,048,498 1,736,948 1,772,138 1,171,689Income exempt from corporation tax (518,421) (108,146) (458,576) (45,480)Expenses not deductible for tax purposes 15,213 9,869 13,721 9,064Property, withholding and capital gains taxes 278,322 256,784 221,971 201,428Prior year adjustment 1,178 423 900 423
1,824,790 1,895,878 1,550,154 1,337,124
Profit before taxation is shown after charging / (crediting)the following:
Tax calculated at the tax rate of 30% or 40% (2015 - 30% or 40%) as appropriate
Reconciliation of tax expense and accounting profit:
GROUP

58
Notes to the Financial Statements30 September 2016
Thousands of Guyana Dollars
24. TAXATION (CONT'D)
GROUP25. EARNINGS PER SHARE 2016 2015
Profit attributable to equity holders of the parent 4,468,141 2,944,523
Weighted average number of shares in issue (thousands) 1,000,000 1,000,000
Basic earnings per share 4.47 Dollar 2.94 Dollar
26. CONTINGENT LIABILITIES GROUP COMPANY2016 2015 2016 2015
Bonds 7,603 2,902 7,603 2,902Guarantees 0 0 15,026 14,976
7,603 2,902 22,629 17,878
The corporation tax rate applicable to companies within the Group is dependent on the tax classification as a commercial ornon-commercial company bearing the rate of 40% or 30% (2015 - 40% or 30%) respectively. These rates have beenrecognised in the above reconciliation.
The banking subsidiary's potential liabilities under guarantees, indemnities and letters of credit at year-end totalled $581,786(2015 - $484,191).
As at the year end there were certain legal proceedings outstanding against the Group. No provision has been made asmanagement is of the opinion that such proceedings are either without merit or are unlikely to result in any significant loss tothe Group.
The dormant subsidiary has tax losses available to set off against future pre-tax income of $18,246 (2015 - $18,082). Thedeferred tax asset of $5,474 (2015 - $5,426) in relation to the tax losses associated with the dormant subsidiary was notrecognised.

59
Notes to the Financial Statements30 September 2016
Thousands of Guyana Dollars
27. COMMITMENTS GROUP COMPANY2016 2015 2016 2015
Undrawn credit facilities (banking segment) 997,916 1,237,647 0 0
Capital commitments:
For property, plant and equipment: Authorised and contracted for 1,274,980 1,267,630 1,124,980 462,252 Authorised but not contracted for 3,867,104 4,335,810 3,815,736 4,144,803
For intangible assets: Authorised and contracted for 8,694 20,223 0 0 Authorised but not contracted for 39,153 0 0 0
28. RELATED PARTY TRANSACTIONS
Key Management Compensation
Short term benefits 393,181 328,793 341,279 285,898Post employment benefits 33,847 38,641 32,711 37,620
427,028 367,434 373,990 323,518
Key management compensation includes directors' fees and expenses for services as directors as follows:
GROUP COMPANY2016 2015 2016 2015
Clifford B. Reis 1,593 1,535 0 0Roy E. Cheong 1,493 1,389 1,493 1,389Richard B. Fields 2,617 2,484 1,313 1,225Christopher J. Fernandes (resigned 30 September 2016) 1,313 1,225 1,313 1,225Carl R. Cozier 1,313 1,225 1,313 1,225Dan B. Stoute 1,313 1,225 1,313 1,225George McDonald 1,304 1,259 0 0Michael H. Pereira 1,304 1,259 0 0Paul A. Carto 1,304 1,259 0 0Frances S. Parris 1,313 1,225 1,313 1,225Leslie Doodnauth 0 0 0 0
14,867 14,085 8,058 7,514
No emoluments were paid to the executive directors for their services as directors to the parent company.

60
Notes to the Financial Statements30 September 2016
Thousands of Guyana Dollars
28. RELATED PARTY TRANSACTIONS (CONT'D) GROUP COMPANY2016 2015 2016 2015
Key Management Transactions
Loans and advances
Balance as at end of year 50,191 53,744 708 677
Interest income 3,493 2,312 274 49
Customers' deposits
Balance as at end of year 73,137 114,239 0 0
Interest expense 2,362 1,351 0 0
Parent Company Transactions with Banking Subsidiary COMPANY2016 2015
Interest charges on loans and advances 48,040 53,141Interest income on cash deposits 13,971 6,332Rental income for property 51,490 47,194Dividends received 72,817 72,817
Banks Holdings Limited GROUP AND COMPANY (Entity with significant shareholding in parent company) 2016 2015
Transactions in the year:Dividends paid 274,252 128,118Dividends received 0 44,383
Balances outstanding with the banking subsidiary at the year end are shown in notes 12 and 16. Additionally at the year endthe banking subsidiary has issued guarantees on the parent company's behalf totalling $15,026 (2015 - $14,976).

61
Notes to the Financial Statements30 September 2016
Thousands of Guyana Dollars
28. RELATED PARTY TRANSACTIONS (CONT'D) GROUP AND COMPANY 2016 2015
BCL (Barbados) Limited (Associate of Group)
Transactions in the year:Sales of finished goods 0 3,716Purchases of finished goods 0 143,189
Balance outstanding at year end:Amount payable 0 22,830
Other Related Parties 2016 2015 2016 2015
Loans repayable to the banking subsidiary 461,127 557,369 0 0
Interest income on loans repayable 48,441 84,540 0 0
Deposits held by the banking subsidiary 3,087,532 2,494,787 0 0
Interest expense on deposits 27,902 13,713 0 0
Sales of goods by the Company 118,393 108,284 118,393 108,284
Purchases of goods by the Company 75,298 60,629 75,298 60,629
Provision of services to the Group 112,073 97,912 99,403 91,250
GROUP COMPANY
Loans and advances to related parties (except those who are employees of the banking subsidiary) are on commercial terms.No provisions have been recognised in respect of loans and advances to related parties (2015 - nil).

62
Notes to the Financial Statements30 September 2016
Thousands of Guyana Dollars
29. FINANCIAL INSTRUMENTS AND FINANCIAL RISK MANAGEMENT
Categories of Financial Instruments
'Held-to-maturity' assets
'Loans and receivables' assets
‘Available-for-sale' assets
'Financial liabilities carried at amortised cost'
The following tables analyse the Group's financial instruments into the relevant IFRS 7 categories.
Financial liabilities which are not classified as fair value through the profit and loss are classified as financial liabilitiesmeasured at amortised cost. A financial liability which is acquired principally for the purpose of selling in the short-term orderivatives are categorised as fair value through the profit and loss - the Company holds no such financial liabilities.Therefore all its financial liabilities are carried at amortised cost.
55
Financial assets classified as held-to-maturity are non-derivative instruments with fixed or determinable payments and fixedmaturities that management has the positive intent and ability to hold to maturity.
Financial assets classified as loans and receivables are non-derivative instruments with fixed or determinable payments thatare not quoted in an active market.
BANKS DIH LIMITED AND ITS SUBSIDIARIES
NOTES TO THE FINANCIAL STATEMENTS
30 SEPTEMBER 2016
The Group's financial assets (investment securities, loans and advances, receivables and cash resources) are classified intothe following categories identified in IFRS 7: available-for-sale, held-to-maturity or loans and receivables. The Group'sfinancial liabilities (borrowings, customers' deposits, payables and accruals) are classified as financial liabilities measured atamortised cost.
Financial instruments carried at the reporting date include investment securities, loans and advances, receivables, cashresources, borrowings, customers' deposits, payables and accruals.
Financial assets classified as available-for-sale are non-derivative instruments that are either designated in this category ornot classified in any of the other categories.
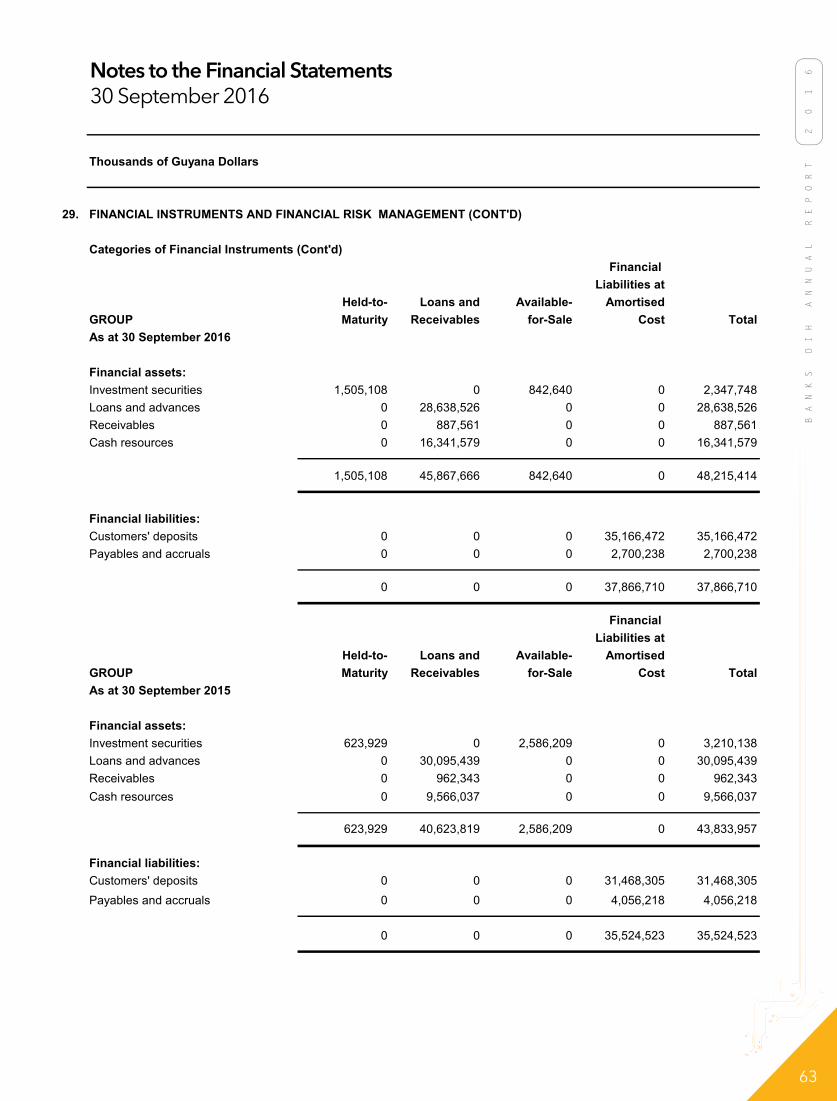
63
Notes to the Financial Statements30 September 2016
Thousands of Guyana Dollars
29. FINANCIAL INSTRUMENTS AND FINANCIAL RISK MANAGEMENT (CONT'D)
Categories of Financial Instruments (Cont'd)Financial
Liabilities atHeld-to- Loans and Available- Amortised
GROUP Maturity Receivables for-Sale Cost TotalAs at 30 September 2016
Financial assets:Investment securities 1,505,108 0 842,640 0 2,347,748Loans and advances 0 28,638,526 0 0 28,638,526Receivables 0 887,561 0 0 887,561Cash resources 0 16,341,579 0 0 16,341,579
1,505,108 45,867,666 842,640 0 48,215,414
Financial liabilities:Customers' deposits 0 0 0 35,166,472 35,166,472Payables and accruals 0 0 0 2,700,238 2,700,238
0 0 0 37,866,710 37,866,710
Financial Liabilities at
Held-to- Loans and Available- AmortisedGROUP Maturity Receivables for-Sale Cost TotalAs at 30 September 2015
Financial assets:Investment securities 623,929 0 2,586,209 0 3,210,138Loans and advances 0 30,095,439 0 0 30,095,439Receivables 0 962,343 0 0 962,343Cash resources 0 9,566,037 0 0 9,566,037
623,929 40,623,819 2,586,209 0 43,833,957
Financial liabilities:Customers' deposits 0 0 0 31,468,305 31,468,305Payables and accruals 0 0 0 4,056,218 4,056,218
0 0 0 35,524,523 35,524,523
56
BANKS DIH LIMITED AND ITS SUBSIDIARIES
NOTES TO THE FINANCIAL STATEMENTS
30 SEPTEMBER 2016

64
Notes to the Financial Statements30 September 2016
Thousands of Guyana Dollars
29. FINANCIAL INSTRUMENTS AND FINANCIAL RISK MANAGEMENT (CONT'D)
Categories of Financial Instruments (Cont'd)Financial
Liabilities atCOMPANY Loans and Available- AmortisedAs at 30 September 2016 Receivables for-Sale Cost Total
Financial assets:Investment securities 0 708,760 0 708,760Receivables 833,661 0 0 833,661Cash resources 7,560,582 0 0 7,560,582
8,394,243 708,760 0 9,103,003
Financial liabilities:Borrowings 0 0 521,187 521,187Payables and accruals 0 0 2,401,985 2,401,985
0 0 2,923,172 2,923,172
Financial Liabilities at
COMPANY Loans and Available- AmortisedAs at 30 September 2015 Receivables for-Sale Cost Total
Financial assets:Investment securities 0 2,452,980 0 2,452,980Receivables 921,816 0 0 921,816Cash resources 4,060,487 0 0 4,060,487
4,982,303 2,452,980 0 7,435,283
Financial liabilities:Borrowings 0 0 584,735 584,735Payables and accruals 0 0 3,444,082 3,444,082
0 0 4,028,817 4,028,817
BANKS DIH LIMITED AND ITS SUBSIDIARIES
NOTES TO THE FINANCIAL STATEMENTS
30 SEPTEMBER 2016
57

65
Notes to the Financial Statements30 September 2016
Thousands of Guyana Dollars
29. FINANCIAL INSTRUMENTS AND FINANCIAL RISK MANAGEMENT (CONT'D)
The main financial risks affecting the Group are discussed in the following parts to this note.
The following table presents the maximum exposure to credit risk arising on financial instruments, before taking account ofany collateral held or other credit enhancements and after allowance for impairment where appropriate.
For financial assets recognised on the statement of financial position, the exposure to credit risk equals to their carryingamounts. For guarantees and letters of credit, the maximum exposure to credit risk is the amount that the banking subsidiarywould have to pay if the guarantees and letters of credit were to be called upon. For credit commitments of the bankingsubsidiary that are irrevocable over the life of the respective facilities, the maximum exposure to credit risk is the full amountof the committed facilities.
58
The table excludes financial assets which are not deemed to give rise to credit risks, which are primarily available-for-saleequity securities held by the Group.
Credit Risk
Financial risks are inherent to the operations of the Group and management of these risks is central to the Group's continuingprofitability. The Group is exposed to credit risk, liquidity risk, interest rate risk and foreign exchange risk. The objective ofthe Group's risk management policies and efforts is to minimise the effects of the risks inherent to its operations. Riskmanagement is an ongoing process which involves the identification, assessment and monitoring of risks through theapplication of various approaches which are guided by the Group's policies. These risks are continuously monitored at boththe executive and directorate levels. Management engages in the daily monitoring of risks and provides the Board ofDirectors with monthly reports which analyse exposures to the various elements of risk.
BANKS DIH LIMITED AND ITS SUBSIDIARIES
NOTES TO THE FINANCIAL STATEMENTS
30 SEPTEMBER 2016
Risks arising from Financial Instruments
The Group takes on exposure to credit risk, which is the risk that a counterparty will be unable to pay amounts in full whendue, through its holding of investment securities, loans and advances, receivables and cash resources. It can also arise fromguarantees and letters of credit provided or credit commitments given by the banking subsidiary.

66
Notes to the Financial Statements30 September 2016
Thousands of Guyana Dollars
29. FINANCIAL INSTRUMENTS AND FINANCIAL RISK MANAGEMENT (CONT'D)
GROUP COMPANY2016 2015 2016 2015
On statement of financial position:Investment securities 1,505,108 623,929 0 0Loans and advances 28,638,526 30,095,439 0 0Receivables 887,561 962,343 833,661 921,816Cash resources 16,341,579 9,566,037 7,560,582 4,060,487
47,372,774 41,247,748 8,394,243 4,982,303
Off statement of financial position:Guarantees 581,786 484,191 0 0Credit commitments 997,916 1,237,647 0 0
1,579,702 1,721,838 0 0
Maximum exposure to credit risk 48,952,476 42,969,586 8,394,243 4,982,303
Management of investment securities and cash resources
Company
BANKS DIH LIMITED AND ITS SUBSIDIARIES
NOTES TO THE FINANCIAL STATEMENTS
30 SEPTEMBER 2016
Credit Risk (Cont'd)
Collateral is not usually collected on cash resources with banks given the sound nature of the counterparties.
59
The risk management policies and processes have been described separately for the Company and its banking subsidiary,where applicable.
Credit risk is managed to achieve a sustainable and superior risk-reward performance while maintaining exposures withinacceptable risk parameters. The Group's policies and processes for managing credit risk are described below for each of itsmajor financial assets.
In relation to its cash resources, the Board of Directors is required to approve the use of new financial institutions for theplacement of cash resources. Thereafter the use of banking facilities is at the discretion of management.
The Company's investment securities comprise equity holdings which are not considered to give rise to credit risk.

67
Notes to the Financial Statements30 September 2016
Thousands of Guyana Dollars
29. FINANCIAL INSTRUMENTS AND FINANCIAL RISK MANAGEMENT (CONT'D)
Banking subsidiary
Management of loans and advances, including exposures off the statement of financial position
Banking subsidiary
(a)
The granting of credit through loans, advances, guarantees and letters of credit is one of the banking subsidiary's majorsources of income and is therefore one of its most significant risks. The banking subsidiary therefore dedicates considerableresources towards controlling it effectively including a specialised Credit Department responsible for reviewing loanapplications and monitoring granted loan facilities within the policies and guidelines established by the Board of Directors.
Management continuously monitors the financial standing of issuers of investment securities and holders of cash balances.
Credit applications are initially reviewed by an officer of the banking subsidiary's Credit Department during which detailsof the purpose of the facility, the financial standing of the applicant and the collateral available as security are obtained.The applicant's ability to repay the sums required are assessed based on information collected and an initialrecommendation made by the Credit Department.
In executing its lending activities, the following measures are relied upon to mitigate the risk of default:
60
BANKS DIH LIMITED AND ITS SUBSIDIARIES
NOTES TO THE FINANCIAL STATEMENTS
30 SEPTEMBER 2016
Credit Risk (Cont'd)
The Board of Directors of the banking subsidiary is required to approve all acquisitions of investment securities or the use ofnew financial institutions for the placement of cash resources. Thereafter re-investments into investment securities or use ofbanking facilities with financial institutions is at the discretion of management.
Collateral is not usually collected on investment securities issued by government bodies or secured on government assets.Corporate investment securities are usually secured on the assets of the issuer. Valuations are not usually carried out onthese assets given the corporate standing of the issuers. Collateral is not usually collected on amounts due from other banksas funds are only placed with institutions that are deemed to be financially sound.
Managing the credit risks associated with investment securities and cash balances with other banks differs in an importantrespect from loans originated by the banking subsidiary in that the counterparties involved are usually government bodies orestablished financial institutions. Within the banking subsidiary, management of the portfolio of investment securities andcash balances with other banks is the responsibility of the Finance and Treasury Department.

68
Notes to the Financial Statements30 September 2016
29. FINANCIAL INSTRUMENTS AND FINANCIAL RISK MANAGEMENT (CONT'D)
(b)
(c)
(d)
(e)
(f)
(g) Oversight from the Credit Committee of the Board of Directors.
Management of Receivables
Company
(a)
(b) Credit limits are set by senior management and subject to regular monitoring.
(c) A standard repayment period of thirty to sixty days is imposed.
The Company does not collect collateral as security for receivable balances.
The banking subsidiary's exposure to any single borrower is limited by the applicable provisions of the FinancialInstitutions Act. Additionally, the banking subsidiary monitors exposure to industry segments to avoid over-exposure toany one sector.
The Credit Department is required to carry out weekly reviews of any past due or impaired facilities. For all otherfacilities, quarterly reviews are carried out by the Credit Department.
The Company's exposure to credit risk on receivables arises from credit transactions with wholesale and retail customers. Tomitigate the credit risk arising on these balances, the Company adopts the following measures:
Credit applications are subject to approval of senior management after review of the financial position of the customer,past trading and other relevant factors.
Independent valuations of collateral lodged against facilities are carried out at least every two years, where possible.Where securities are lodged as collateral, management monitors their market performance for indicators of impairment.
The banking subsidiary usually requires that collateral be lodged. Forms of acceptable collateral include cash, realestate, securities, machinery or equipment. The banking subsidiary has established policies that guide its loan to valuebased on the type of collateral lodged. During the review of the loan application, an independent valuation of thecollateral to be lodged is obtained, where possible.
Any recommended loan applications are then subject to the approval from either senior management or the Board ofDirectors depending on the level of the amount applied for. There are internally pre-set limits which dictate the level ofapproval required.
Credit Risk (Cont'd)
Thousands of Guyana Dollars

69
Notes to the Financial Statements30 September 2016
Thousands of Guyana Dollars
29. FINANCIAL INSTRUMENTS AND FINANCIAL RISK MANAGEMENT (CONT'D)
Credit Risk (Cont'd)
Credit risk concentration
GROUP Real Manu- Mining Con-As at 30 September 2016 Households Services Estate facturing and Quarry struction Agriculture Government Financial Other Total
On statement of financial position:
Investment securities 0 120,790 0 0 0 0 0 864,813 519,505 0 1,505,108
Loans and advances 788,953 9,026,526 10,964,284 1,537,168 685,151 4,334,335 640,150 0 0 661,959 28,638,526
Receivables 0 2,730 0 0 0 0 0 125 419 884,287 887,561
Cash resources 0 0 0 0 0 0 0 0 16,341,579 0 16,341,579
788,953 9,150,046 10,964,284 1,537,168 685,151 4,334,335 640,150 864,938 16,861,503 1,546,246 47,372,774
Off statement of financial position:
Guarantees 0 255,946 0 4,701 0 62,688 0 0 0 258,451 581,786
Credit commitments 24,057 616,705 0 82,174 5,000 97,022 0 0 0 172,958 997,916
24,057 872,651 0 86,875 5,000 159,710 0 0 0 431,409 1,579,702
Total 813,010 10,022,697 10,964,284 1,624,043 690,151 4,494,045 640,150 864,938 16,861,503 1,977,655 48,952,476
GROUP Real Manu- Mining Con-As at 30 September 2015 Households Services Estate facturing and Quarry struction Agriculture Government Financial Other Total
On statement of financial position:
Investment securities 0 141,919 0 0 0 0 0 8,671 473,339 0 623,929
Loans and advances 810,755 9,589,840 10,948,994 1,794,118 721,683 4,868,142 684,698 0 0 677,209 30,095,439
Receivables 0 3,215 0 0 0 0 0 1,038 185 957,905 962,343
Cash resources 0 0 0 0 0 0 0 0 9,566,037 0 9,566,037
810,755 9,734,974 10,948,994 1,794,118 721,683 4,868,142 684,698 9,709 10,039,561 1,635,114 41,247,748
Off statement of financial position:
Guarantees 0 296,288 0 4,701 0 30,847 0 0 0 152,355 484,191
Credit commitments 31,402 876,984 0 105,109 4,594 127,534 0 0 0 92,024 1,237,647
31,402 1,173,272 0 109,810 4,594 158,381 0 0 0 244,379 1,721,838
Total 842,157 10,908,246 10,948,994 1,903,928 726,277 5,026,523 684,698 9,709 10,039,561 1,879,493 42,969,586
A concentration of credit risk exists when a number of counterparties are engaged in similar activities and have similar economic characteristics that would cause their ability to meet contractual obligations to be similarly affected by changes in economic or other conditions. The analyses of credit risk concentrations presented in the following tables are based on the industry in which the counterparty is engaged and its geographic location.
The tables below analyse the Group's exposure to credit risk on its financial instruments by industry sector.

70
Notes to the Financial Statements30 September 2016
Thousands of Guyana Dollars
29. FINANCIAL INSTRUMENTS AND FINANCIAL RISK MANAGEMENT (CONT'D)
Credit Risk (Cont'd)
GROUP North
As at 30 September 2016 Guyana Caricom America Europe Total
On statement of financial position:
Investment securities 919,064 173,044 0 413,000 1,505,108
Loans and advances 28,638,526 0 0 0 28,638,526
Receivables 887,017 152 0 392 887,561
Cash resources 11,281,710 25,867 819,292 4,214,710 16,341,579
41,726,317 199,063 819,292 4,628,102 47,372,774
Off statement of financial position:
Guarantees 581,786 0 0 0 581,786
Credit commitments 997,916 0 0 0 997,916
1,579,702 0 0 0 1,579,702
Total 43,306,019 199,063 819,292 4,628,102 48,952,476
The tables below analyse the Group's exposure to credit risk on its financial instruments by geographic region.
GROUP North
As at 30 September 2015 Guyana Caricom America Europe Total
On statement of financial position:
Investment securities141,918 265,208 216,803 0 623,929
Loans and advances30,095,439 0 0 0 30,095,439
Receivables724,911 1,156 236,276 0 962,343
Cash resources6,953,345 21,324 2,572,482 18,886 9,566,037
37,915,613 287,688 3,025,561 18,886 41,247,748
Off statement of financial position:
Guarantees484,191 0 0 0 484,191
Credit commitments1,237,647 0 0 0 1,237,647
1,721,838 0 0 0 1,721,838
Total39,637,451 287,688 3,025,561 18,886 42,969,586

71
Notes to the Financial Statements30 September 2016
Thousands of Guyana Dollars
29. FINANCIAL INSTRUMENTS AND FINANCIAL RISK MANAGEMENT (CONT'D)
Credit Risk (Cont'd)
COMPANY Whole-As at 30 September 2016 Retailers salers Financial Other Total
Receivables 273,220 212,556 0 347,885 833,661Cash resources 0 0 7,560,582 0 7,560,582
273,220 212,556 7,560,582 347,885 8,394,243
Whole-As at 30 September 2015 Retailers salers Financial Other Total
Receivables 300,022 240,214 0 381,580 921,816Cash resources 0 0 4,060,487 0 4,060,487
300,022 240,214 4,060,487 381,580 4,982,303
COMPANY Out ofAs at 30 September 2016 Guyana Guyana Total
Out ofGuyana Guyana Total
Receivables 666,218 167,443 833,661Cash resources 7,560,582 0 7,560,582
8,226,800 167,443 8,394,243
As at 30 September 2015
Receivables 685,607 236,209 921,816Cash resources 4,060,487 0 4,060,487
4,746,094 236,209 4,982,303
The tables below analyse the Company's exposure to credit risk on its financial instruments by counterparty type and geographic sector.
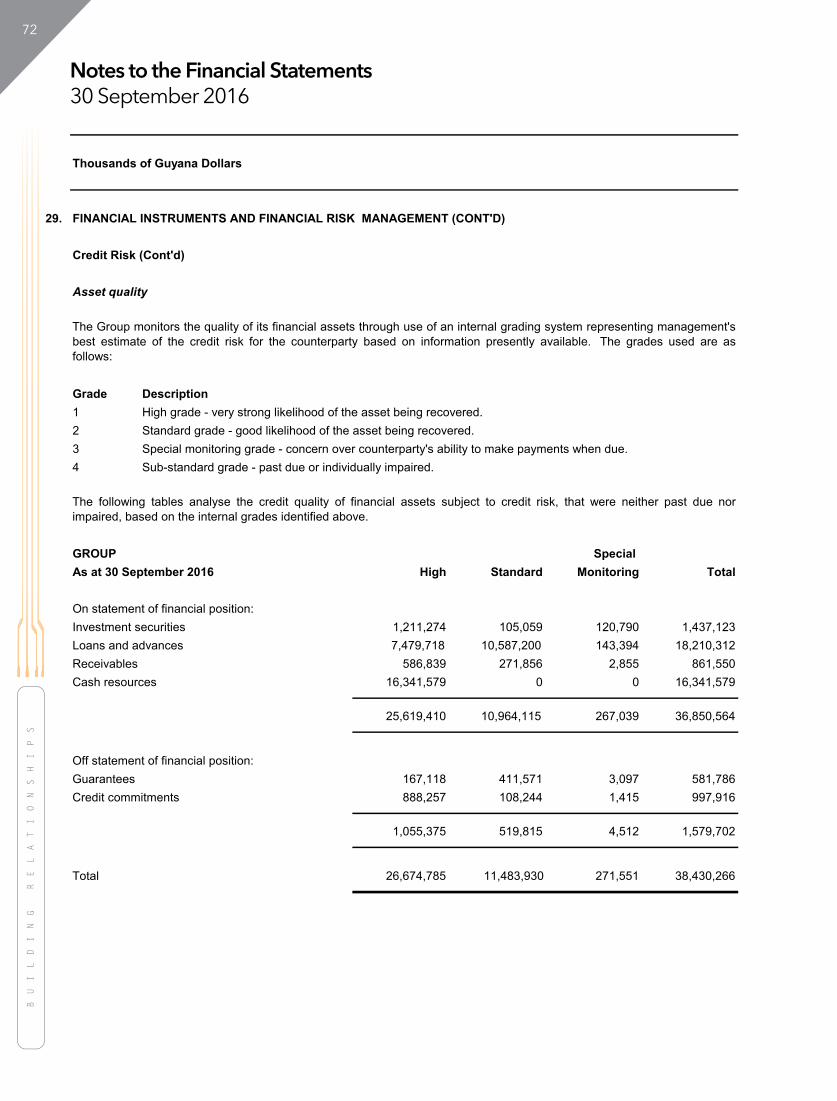
72
Notes to the Financial Statements30 September 2016
Thousands of Guyana Dollars
29. FINANCIAL INSTRUMENTS AND FINANCIAL RISK MANAGEMENT (CONT'D)
Credit Risk (Cont'd)
Asset quality
Grade Description1 High grade - very strong likelihood of the asset being recovered. 2 Standard grade - good likelihood of the asset being recovered.3 Special monitoring grade - concern over counterparty's ability to make payments when due.4 Sub-standard grade - past due or individually impaired.
GROUP Special As at 30 September 2016 High Standard Monitoring Total
On statement of financial position:Investment securities 1,211,274 105,059 120,790 1,437,123Loans and advances 7,479,718 10,587,200 143,394 18,210,312Receivables 586,839 271,856 2,855 861,550Cash resources 16,341,579 0 0 16,341,579
25,619,410 10,964,115 267,039 36,850,564
Off statement of financial position:Guarantees 167,118 411,571 3,097 581,786Credit commitments 888,257 108,244 1,415 997,916
1,055,375 519,815 4,512 1,579,702
Total 26,674,785 11,483,930 271,551 38,430,266
The following tables analyse the credit quality of financial assets subject to credit risk, that were neither past due norimpaired, based on the internal grades identified above.
67
The Group monitors the quality of its financial assets through use of an internal grading system representing management'sbest estimate of the credit risk for the counterparty based on information presently available. The grades used are asfollows:

73
Notes to the Financial Statements30 September 2016
Thousands of Guyana Dollars
29. FINANCIAL INSTRUMENTS AND FINANCIAL RISK MANAGEMENT (CONT'D)
Credit Risk (Cont'd)
GROUP Special As at 30 September 2015 High Standard Monitoring Total
On statement of financial position:Investment securities 216,803 347,428 0 564,231Loans and advances 8,186,422 11,371,939 162,645 19,721,006Receivables 643,855 285,721 115 929,691Cash resources 9,566,037 0 0 9,566,037
18,613,117 12,005,088 162,760 30,780,965
Off statement of financial position:Guarantees 85,679 395,842 2,670 484,191Credit commitments 759,541 475,779 2,327 1,237,647
845,220 871,621 4,997 1,721,838
Total 19,458,337 12,876,709 167,757 32,502,803
COMPANY Special As at 30 September 2016 High Standard Monitoring Total
Receivables 586,447 221,203 0 807,650Cash resources 7,560,582 0 0 7,560,582
8,147,029 221,203 0 8,368,232
As at 30 September 2015
Receivables 643,788 245,376 0 889,164Cash resources 4,060,487 0 0 4,060,487
4,704,275 245,376 0 4,949,651
BANKS DIH LIMITED AND ITS SUBSIDIARIES
NOTES TO THE FINANCIAL STATEMENTS
30 SEPTEMBER 2016
68

74
Notes to the Financial Statements30 September 2016
Thousands of Guyana Dollars
29. FINANCIAL INSTRUMENTS AND FINANCIAL RISK MANAGEMENT (CONT'D)
Credit Risk (Cont'd)
Financial assets that are past due but not impaired
Company
Banking subsidiary
Up to Between More than COMPANY 30 days 30-60 days 60 days Total CollateralAs at 30 September 2016
Receivables 0 26,011 0 26,011 0
As at 30 September 2015
Receivables 0 24,121 8,531 32,652 0
Up to Between More than BANKING SUBSIDIARY 30 days 30-60 days 60 days Total CollateralAs at 30 September 2016
Loans and advances 2,964,243 1,449,562 0 4,413,805 5,879,353
As at 30 September 2015
Loans and advances 2,508,575 1,371,871 0 3,880,446 5,694,300
BANKS DIH LIMITED AND ITS SUBSIDIARIES
NOTES TO THE FINANCIAL STATEMENTS
30 SEPTEMBER 2016
69
Age analyses of financial assets that are past due but not individually impaired are set out in the following tables. The tables havebeen shown separately for the Company and banking subsidiary as different criteria are used by each entity to detect past duebalances, as described below.
An asset is considered past due and included below when any payment due under the strict contractual terms is missed. The amountincluded is the entire financial asset, not just the payment of principal or interest or both, overdue.
An asset is considered past due and included below when an invoice payment that is due is missed. The amount included is theoutstanding payment.

75
Notes to the Financial Statements30 September 2016
Thousands of Guyana Dollars
29. FINANCIAL INSTRUMENTS AND FINANCIAL RISK MANAGEMENT (CONT'D)
Credit Risk (Cont'd)
Impaired financial assets
Original RevisedCarrying Impairment Carrying
GROUP Amount Provision Amount CollateralAs at 30 September 2016
Investment securities 264,368 196,383 67,985 0Loans and advances 7,397,404 1,320,606 6,076,798 10,052,484Receivables 38,414 38,414 0 0
As at 30 September 2015
Investment securities 263,088 203,390 59,698 0Loans and advances 7,321,532 785,488 6,536,044 9,213,301Receivables 26,994 26,994 0 0
The Company's impaired assets comprise the Receivables balances shown in the table above.
Collateral Held
GROUP2016 2015
Real Estate 797,149 8,02726,258 10,220
An analysis of the financial assets that have been individually assessed as impaired is shown in the table below.
The collateral held by the banking subsidiary against past due and impaired loans and advances comprise real estate andequipment primarily. The banking subsidiary's policy is to advertise collateral to the public in an effort to recoveroutstanding sums.
During the year the banking subsidiary obtained collateral from defaulting counterparties. The nature and carrying amountsof assets obtained is shown in the table below.
Equipment

76
Notes to the Financial Statements30 September 2016
Thousands of Guyana Dollars
29. FINANCIAL INSTRUMENTS AND FINANCIAL RISK MANAGEMENT (CONT'D)
Credit Risk (Cont'd)
Renegotiated Facilities
GROUP COMPANYMovement to Impairment Provisions 2016 2015 2016 2015
Impairment of Investment Securities
Balance as at beginning of year 203,390 196,572 0 0Additional provision for the year 0 10,205 0 0Reversal of provision in the year (7,007) (3,387) 0 0
Balance as at end of year 196,383 203,390 0 0
Impairment of Loans and Advances
Individually assessed:
Balance as at beginning of year 785,488 431,738 0 0Amounts written off 0 (85,611) 0 0Additional provision for the year 710,254 571,118 0 0Reversal of provision in the year (175,136) (131,757) 0 0
Balance as at end of year 1,320,606 785,488 0 0
Collectively assessed:
Balance as at beginning of year 42,057 8,818 0 0Additional provision for the year 20,332 33,239 0 0
Balance as at end of year 62,389 42,057 0 0
Renegotiations are usually considered upon request or where it is judged that a defaulting borrower will be better able toservice outstanding debt under revised conditions. During the year the banking subsidiary renegotiated the terms offinancial assets with a carrying value of $2,159,606 (2015 - $586,993), which would otherwise have been past due orimpaired. The renegotiations were primarily refinancing of facilities or rescheduling of payments.
BANKS DIH LIMITED AND ITS SUBSIDIARIES
NOTES TO THE FINANCIAL STATEMENTS
30 SEPTEMBER 2016

77
Notes to the Financial Statements30 September 2016
Thousands of Guyana Dollars
29. FINANCIAL INSTRUMENTS AND FINANCIAL RISK MANAGEMENT (CONT'D)
Credit Risk (Cont'd) GROUP COMPANY2016 2015 2016 2015
Movement to Impairment Provisions (Cont'd)
Impairment of Receivables
Balance as at beginning of year 26,994 13,826 26,994 13,826Amounts written off (9,005) (4,605) (9,005) (4,605)Additional provision for the year 28,508 20,963 28,508 20,963Reversal of provision in the year (8,083) (3,190) (8,083) (3,190)
Balance as at end of year 38,414 26,994 38,414 26,994
Total impairment provision 1,617,792 1,057,929 38,414 26,994
Impairment Provision analysed by Industry
Households 76,193 49,127 0 0Services 390,894 298,840 0 0Real Estate 172,085 117,879 0 0Manufacturing 299,647 113,966 0 0Mining and Quarry 53,205 29,725 0 0Construction 166,437 50,778 0 0Agriculture 69,810 59,062 0 0Government 43,923 50,250 0 0Financial 152,460 153,160 0 0Other 193,138 135,162 38,414 26,994
1,617,792 1,057,949 38,414 26,994

78
Notes to the Financial Statements30 September 2016
Thousands of Guyana Dollars
29. FINANCIAL INSTRUMENTS AND FINANCIAL RISK MANAGEMENT (CONT'D)
Company
Banking subsidiary
(a)
(b)
(c)
(d)
(e)
The Company's liquidity management policy involves monitoring of forecasted cashflows and considering levels of liquidassets necessary to meet these obligations. Credit lines from financial institutions are negotiated as necessary.
Liquidity Risk
This is the risk that the Group will be unable to meet its obligations when they fall due.
Funds are borrowed on the inter-bank market to meet day-to-day shortfalls.
Statutory liquidity ratios are regularly monitored.
The banking subsidiary's liquidity management process is monitored by the Finance and Treasury Department and includesthe following measures:
A portfolio of highly marketable assets is maintained that can be sold or used as collateral for funding in the event ofany unforeseen interruption to cash flow.
The banking subsidiary is required to retain a balance of cash at the Bank of Guyana to meet any unforeseen andsignificant shortfalls in liquidity. The amount to be deposited at the Bank of Guyana is dependent on the level ofliabilities held in the form of customer deposits.
Given the nature of the banking subsidiary's operations, most of its financial liabilities are not demanded on the earliest datethat repayment is due.
Management of Liquidity Risk
Day to day funding is managed by monitoring future cash flows to ensure that requirements can be met. Projectionsof cash flow profiles and expected maturities of financial instruments are relied upon to monitor future cash flows.
The Audit, Finance and Risk Management Committee of the banking subsidiary is responsible for approving the riskmanagement policies and practices. Management is responsible for implementing those approved policies and practices.

79
Notes to the Financial Statements30 September 2016
Over 3 months Over 6 months Over 1 year Within but not over but not over but not over Over
GROUP 3 months 6 months 12 months 5 years 5 years Total
As at 30 September 2016
Over 3 months Over 6 months Over 1 year Within but not over but not over but not over Over
GROUP 3 months 6 months 12 months 5 years 5 years Total
As at 30 September 2015
On statement of financial position:
Customers' deposits 24,184,396 3,420,907 5,455,299 2,411,622 0 35,472,224
Payables and accruals 2,700,238 0 0 0 0 2,700,238
Off statement of financial position:
Guarantees 159,386 89,256 212,133 121,011 0 581,786
Credit commitments 997,916 0 0 0 0 997,916
28,041,936 3,510,163 5,667,432 2,532,633 0 39,752,164
On statement of financial position:
Customers' deposits 23,408,036 2,760,890 5,450,588 52,324 0 31,671,838
Payables and accruals 4,056,218 0 0 0 0 4,056,218
Off statement of financial position:
Guarantees 261,606 52,292 117,315 52,978 0 484,191
Credit commitments 1,237,647 0 0 0 0 1,237,647
28,963,507 2,813,182 5,567,903 105,302 0 37,449,894
COMPANY
As at 30 September 2016
Borrowings 27,897 27,897 55,794 446,348 108,496 666,432
Payables and accruals 2,401,985 0 0 0 0 2,401,985
2,429,882 27,897 55,794 446,348 108,496 3,068,417
As at 30 September 2015
Borrowings 27,897 27,897 55,793 446,348 218,743 776,678
Payables and accruals 3,444,082 0 0 0 0 3,444,082
3,471,979 27,897 55,793 446,348 218,743 4,220,760
The tables below present the cash flows payable by the Group under financial liabilities by remaining contractual maturities at the reporting date. The amounts disclosed in the tables are the contractual undiscounted cash flows of financial liabilities including payments of future interest.
Contractual maturity of financial liabilities
Liquidity Risk (Cont’d)
29. FINANCIAL INSTRUMENTS AND FINANCIAL RISK MANAGEMENT (CONT'D)
Thousands of Guyana Dollars

80
Notes to the Financial Statements30 September 2016
29. FINANCIAL INSTRUMENTS AND FINANCIAL RISK MANAGEMENT (CONT'D)
Foreign Exchange Risk
Net Impact on Impact onAssets Liabilities Position % change income OCI
GROUP increase / increase / As at 30 September 2016 (decrease) (decrease)
United States Dollar 6,496,360 1,970,372 4,525,988 1.0% 45,260 0Trinidad & Tobago Dollar 392,880 0 392,880 1.0% 1,595 2,334Other 58,466 5,129 53,337 1.0% 530 3
As at 30 September 2015
United States Dollar 4,451,161 4,259,555 191,606 1.0% 1,916 0Trinidad & Tobago Dollar 402,935 0 402,935 1.0% 203 3,826Barbadian Dollar 1,647,109 0 1,647,109 1.0% 0 16,471Other 65,885 39,876 26,009 1.0% 246 14
COMPANYAs at 30 September 2016
United States Dollar 5,065,552 708,288 4,357,264 1.0% 43,573 0Trinidad & Tobago Dollar 233,444 0 233,444 1.0% 0 2,334Other 334 0 334 1.0% 0 3
As at 30 September 2015
United States Dollar 1,427,259 1,686,144 (258,885) 1.0% (2,589) 0Trinidad & Tobago Dollar 249,376 0 249,376 1.0% 0 2,494Barbadian Dollar 1,647,109 0 1,647,109 1.0% 0 16,471Other 1,387 0 1,387 1.0% 0 14
Foreign currency exposure arises from the Group's holding of foreign denominated assets and liabilities. Management of the Group reviews and manages the risk of unfavourable exchange rate movements by constant monitoring of market trends. To further mitigate against foreign exchange risk, the Group maintains a large percentage of its foreign-denominated assets and liabilities in stable currencies.
The aggregate amounts of assets and liabilities denominated in foreign currencies are shown in the tables below, along with the impact before tax of a reasonably possible change in the exchange rate (all changes in exchange rates reflect a strengthening against the Guyana Dollar).
Thousands of Guyana Dollars
81
Notes to the Financial Statements30 September 2016
29. FINANCIAL INSTRUMENTS AND FINANCIAL RISK MANAGEMENT (CONT'D)
Interest Rate Risk
Management of Interest Rate Risk
Company
Banking Subsidiary
Concentration of risk
Interest rate risk is the risk that the future cash flows of a financial instrument or its fair value will fluctuate because of changes inthe market interest rates.
The Group is exposed to certain risks associated with fluctuations in the prevailing levels of interest rates where the Group'sassets and liabilities have varying repricing dates.
The tables below set out the Group's exposure to interest rate risk by categorising the Group's assets and liabilities by the earlierof contractual repricing and maturity dates.
The banking subsidiary's interest bearing instruments include held-to-maturity investment securities, loans and advances, cashresources, customers' deposits and borrowings. The majority of these instruments are of a fixed rate nature and carried atamortised cost.
The Company's interest rate risk exposure arises primarily on its borrowings and cash balances. The risk is managed by enteringinto fixed rate instruments thereby minimising the cash flow risk that could arise.
The Audit, Finance and Risk Management Committee of the banking subsidiary is responsible for approving the risk managementpolicies and practices. Management is responsible for implementing those approved policies and practices.
Management manages this risk by a number of measures, including selection of assets which best match the maturity of liabilitiesand the offering of deposit opportunities that match the maturity profile of assets. Maturity gap profiles and interest rate sensitivityanalysis are relied upon to manage this risk.
Thousands of Guyana Dollars

82
Notes to the Financial Statements30 September 2016
29. FINANCIAL INSTRUMENTS AND FINANCIAL RISK MANAGEMENT (CONT'D)
Interest Rate Risk (Cont'd)
Concentration of risk (Cont'd) Over 1 year
but not over Over Non-interestAs at 30 September 2016 Up to 1 year 5 years 5 years bearing Total
AssetsInvestment securities 1,333,055 120,790 51,263 842,640 2,347,748Loans and advances 2,746,053 7,357,040 18,288,206 247,227 28,638,526Cash resources 564,200 0 0 15,777,379 16,341,579Other assets 0 0 0 29,933,025 29,933,025
4,643,308 7,477,830 18,339,469 46,800,271 77,260,878
LiabilitiesCustomers' deposits 32,871,429 2,295,043 0 0 35,166,472Other liabilities 0 0 0 6,649,254 6,649,254
32,871,429 2,295,043 0 6,649,254 41,815,726
Interest sensitivity gap (28,228,121) 5,182,787 18,339,469
As at 30 September 2015
AssetsInvestment securities 432,519 141,918 49,492 2,586,209 3,210,138Loans and advances 3,665,523 7,114,320 18,952,250 363,346 30,095,439Cash resources 342,774 0 0 9,223,263 9,566,037Other assets 0 0 0 29,631,711 29,631,711
4,440,816 7,256,238 19,001,742 41,804,529 72,503,325#REF!
LiabilitiesCustomers' deposits 28,120,466 985,855 0 2,361,984 31,468,305Other liabilities 0 0 0 8,862,600 8,862,600
28,120,466 985,855 0 11,224,584 40,330,905
Interest sensitivity gap (23,679,650) 6,270,383 19,001,742
BANKS DIH LIMITED AND ITS SUBSIDIARIES
NOTES TO THE FINANCIAL STATEMENTS
30 SEPTEMBER 2016
Thousands of Guyana Dollars
78
GROUP
Thousands of Guyana Dollars
29. FINANCIAL INSTRUMENTS AND FINANCIAL RISK MANAGEMENT (CONT'D)
Interest Rate Risk (Cont'd)
Concentration of risk (Cont'd)Over 1 year
but not over Over Non-interestAs at 30 September 2016 Up to 1 year 5 years 5 years bearing Total
AssetsCash resources 7,462,575 0 0 98,007 7,560,582Other assets 0 0 0 27,629,703 27,629,703
7,462,575 0 0 27,727,710 35,190,285
LiabilitiesBorrowings 0 0 521,187 0 521,187Other liabilities 0 0 0 6,127,774 6,127,774
0 0 521,187 6,127,774 6,648,961
Interest sensitivity gap 7,462,575 0 (521,187)
As at 30 September 2015
AssetsCash resources 3,761,265 0 0 299,222 4,060,487Other assets 0 0 0 30,007,606 30,007,606
3,761,265 0 0 30,306,828 34,068,093
LiabilitiesBorrowings 0 0 584,735 0 584,735Other liabilities 0 0 0 7,914,506 7,914,506
0 0 584,735 7,914,506 8,499,241
Interest sensitivity gap 3,761,265 0 (584,735)
COMPANY

83
Notes to the Financial Statements30 September 2016
Thousands of Guyana Dollars
29. FINANCIAL INSTRUMENTS AND FINANCIAL RISK MANAGEMENT (CONT'D)
Interest Rate Risk (Cont'd)
Concentration of risk (Cont'd)Over 1 year
but not over Over Non-interestAs at 30 September 2016 Up to 1 year 5 years 5 years bearing Total
AssetsCash resources 7,462,575 0 0 98,007 7,560,582Other assets 0 0 0 27,629,703 27,629,703
7,462,575 0 0 27,727,710 35,190,285
LiabilitiesBorrowings 0 0 521,187 0 521,187Other liabilities 0 0 0 6,127,774 6,127,774
0 0 521,187 6,127,774 6,648,961
Interest sensitivity gap 7,462,575 0 (521,187)
As at 30 September 2015
AssetsCash resources 3,761,265 0 0 299,222 4,060,487Other assets 0 0 0 30,007,606 30,007,606
3,761,265 0 0 30,306,828 34,068,093
LiabilitiesBorrowings 0 0 584,735 0 584,735Other liabilities 0 0 0 7,914,506 7,914,506
0 0 584,735 7,914,506 8,499,241
Interest sensitivity gap 3,761,265 0 (584,735)
COMPANY

84
Notes to the Financial Statements30 September 2016
Thousands of Guyana Dollars
29. FINANCIAL INSTRUMENTS AND FINANCIAL RISK MANAGEMENT (CONT'D)
Interest Rate Risk (Cont'd) GROUP2016 2015
The effective interest rates on significant financial assets and liabilities are: % %
Investment securities 2.0 3.1Loans and advances 10.5 10.6Customers' deposits 2.0 2.0
Price Risk
Capital Management
Company
COMPANY2016 2015
Total debt 521,187 584,735Total equity 28,541,324 25,568,852Gearing ratio 0.018 : 1 0.023 : 1
The Group is exposed to price risk on equity securities risk in relation to investment securities classified as available-for-sale.The majority of the available-for-sale investment securities is traded on one or more of the regional stock exchanges. Shouldthe market prices on available-for-sale investment securities change by 5 percent with all other variables held constant, theimpact on equity would be $35,438 (2015 - $122,649).
The Group’s objectives when managing capital are to safeguard the Group’s ability to continue as a going concern in order toprovide returns to the shareholders and benefits to other stakeholders, to maintain an optimal capital structure to reduce thecost of capital and to maintain a prudent relationship between the capital base and the underlying risks of the business.
In pursuing the capital management objectives, the Company monitors capital on the basis of the gearing ratio. This ratio iscalculated as total debt divided by total capital. The gearing ratio at the reporting date was as follows:

85
Notes to the Financial Statements30 September 2016
Thousands of Guyana Dollars
29. FINANCIAL INSTRUMENTS AND FINANCIAL RISK MANAGEMENT (CONT'D)
Capital Management (Cont'd)
Banking subsidiary
Regulatory Capital: 2016 2015
Tier I capital 6,824,704 6,619,264Tier II capital 56,996 32,711Prescribed deduction (99,049) (74,294)
6,782,651 6,577,681
Risk-weighted Assets:
On-balance sheet 29,088,060 26,627,583Off-balance sheet 290,893 242,095
29,378,953 26,869,678
Regulatory Ratios:
Tier I capital ratio 23.2% 24.6%
Total capital ratio 23.1% 24.5%
In pursuing the capital management objectives, the banking subsidiary has regard to capital requirements imposed by the Bank of Guyana. These requirements measure capital adequacy as a percentage of capital resources to risk weighted assets (Risk Asset Ratio). Risk weighted assets are a function of risk weights stipulated by the Bank of Guyana applied to the banking subsidiary's assets. The Risk Asset Ratio should not be less than 8% with a tier 1 component of not less than 4%.
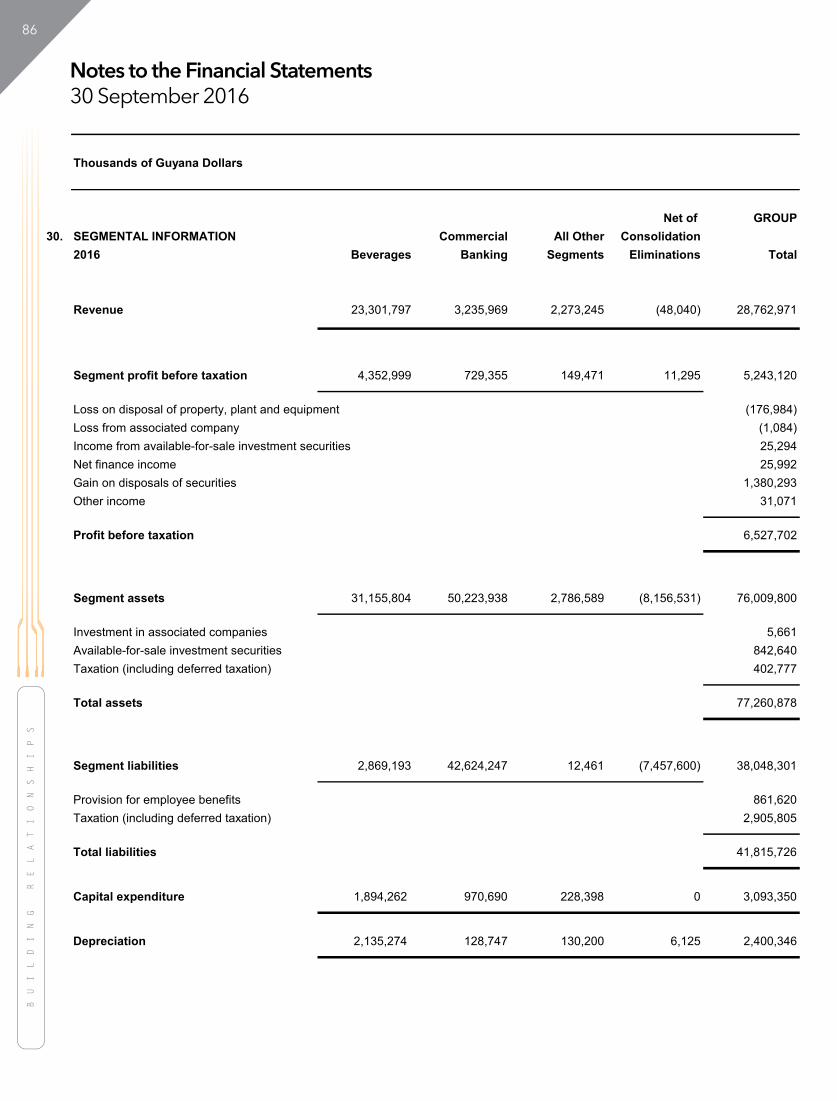
86
Notes to the Financial Statements30 September 2016
Thousands of Guyana Dollars
Net of GROUP30. SEGMENTAL INFORMATION Commercial All Other Consolidation
2016 Beverages Banking Segments Eliminations Total
Revenue 23,301,797 3,235,969 2,273,245 (48,040) 28,762,971
Segment profit before taxation 4,352,999 729,355 149,471 11,295 5,243,120
Loss on disposal of property, plant and equipment (176,984)Loss from associated company (1,084)Income from available-for-sale investment securities 25,294Net finance income 25,992Gain on disposals of securities 1,380,293Other income 31,071
Profit before taxation 6,527,702
Segment assets 31,155,804 50,223,938 2,786,589 (8,156,531) 76,009,800
Investment in associated companies 5,661Available-for-sale investment securities 842,640Taxation (including deferred taxation) 402,777
Total assets 77,260,878
Segment liabilities 2,869,193 42,624,247 12,461 (7,457,600) 38,048,301
Provision for employee benefits 861,620Taxation (including deferred taxation) 2,905,805
Total liabilities 41,815,726
Capital expenditure 1,894,262 970,690 228,398 0 3,093,350
Depreciation 2,135,274 128,747 130,200 6,125 2,400,346

87
Notes to the Financial Statements30 September 2016
Thousands of Guyana Dollars
Net of GROUP30. SEGMENTAL INFORMATION (CONT'D) Commercial All Other Consolidation
2015 Beverages Banking Segments Eliminations Total
Revenue 22,077,391 3,701,973 2,168,155 (53,141) 27,894,378
Segment profit before taxation 3,677,148 1,461,990 96,990 (5,380) 5,230,748
Loss on disposal of property, plant and equipment (41,737)Income from associated companies 94Income from available-for-sale investment securities 71,551Net finance income 16,176Other income 7,924
Profit before taxation 5,284,756
Segment assets 27,947,832 43,110,121 2,596,945 (4,247,989) 69,406,909
Investment in associated companies 47,122Available-for-sale investment securities 2,586,209Taxation (including deferred taxation) 463,085
Total assets 72,503,325
Segment liabilities 4,079,064 35,674,281 10,686 (4,042,248) 35,721,783
Provision for employee benefits 1,529,153Taxation (including deferred taxation) 3,079,969
Total liabilities 40,330,905
Capital expenditure 2,931,868 947,206 477,929 0 4,357,003
Depreciation 2,032,114 123,332 64,902 5,767 2,226,115
83

88
Notes to the Financial Statements30 September 2016
Thousands of Guyana Dollars
30. SEGMENTAL INFORMATION (CONT'D)
Other Segmental Information2016 2015
(a) Source of Revenue
Sales of beverages 23,301,797 22,077,391Commercial banking income 3,235,969 3,701,973Sales of food items 2,216,177 2,114,528Hotel and laundry services income 57,068 53,627
28,811,011 27,947,519Net of consolidation eliminations (48,040) (53,141)
Total revenue 28,762,971 27,894,378
(b) Geographical Information
(c) Major Customers
84
GROUP
The analysis of the Group's revenue between earnings in Guyana and earnings out of Guyana is shown in note 20 to these financial statements.
There are non on-current assets, other than financial instruments, located out of Guyana. The geographic analysis of the Group's financial instruments held at the year end is shown in note 29 to these financial statements.
There was no revenue deriving from transactions with a single customer that amounted to 10 percent or more of the Group's revenue.

89
Notes to the Financial Statements30 September 2016
Thousands of Guyana Dollars
31. FAIR VALUE ESTIMATION
Level 1 Quoted prices (unadjusted) in active markets for identical assets and liabilities.Level 2
Level 3
Assets carried at fair value
Available-for-sale investment securities GROUP COMPANY (included in investment securities) 2016 2015 2016 2015
Level 1 133,880 133,229 00 Level 2 707,855 2,452,197 707,855 2,452,197 Level 3 905 783 905 783
842,640 2,586,209 708,760 2,452,980
Where the fair value of an available-for-sale investment security is based on a quoted market price in an active market, theinstrument is classified in Level 1. A market is regarded as active if quoted market prices are readily and regularly availablefrom an exchange, dealer, broker, industry, industry group, pricing service, or regulatory agency, and those prices representactual and regularly occurring market transactions on an arm's length basis.
Where the fair value of an available-for-sale investment security is determined by a quoted price for an identical instrument ina market that is considered less active or by a quoted price in an active market for a similar instrument, that instrument isincluded in Level 2.
85
Fair value is the amount for which an asset could be exchanged, or a liability settled, between knowledgeable, willing partiesin an arm's length transaction.
The sections that follow provide an analysis of the fair values of the Group's and Company's assets and liabilities based onthe following hierarchy contained in IFRS 13:
Inputs other than quoted prices included within Level 1 that are observable for the asset or liability, eitherdirectly (that is, as prices) or indirectly (that is, derived from prices).Inputs for the asset or liability that are not based on observable market data (that is, unobservable inputs).
If the fair value is based on one or more significant inputs that are not derived from observable market data, the instrument isincluded in Level 3.

90
Notes to the Financial Statements30 September 2016
Freehold properties are recorded at independent professional valuations.Valuations of the parent company's properties were carried out by Rodrigues Architects Limited in September 2013 while the valuation of the banking subsidiary's freehold property was carried out by Patterson Associates in September 2016. Investment property was revalued in September 2016 by Rodrigues Architects Limited. All valuations were based on open market value.
Thousands of Guyana Dollars
31. FAIR VALUE ESTIMATION (CONT'D)
Assets carried at fair value (cont'd)
Property
Assets and liabilities not carried at fair value
2016 2016 2016 2016IFRS 13 Carrying Fair Carrying Fair
Level Amount Value Amount ValueAssets:Investment securities (Held to maturity) Level 2 1,505,108 1,505,202 0 0Loans and advances Level 2 28,638,526 28,896,112 0 0
Liabilities:Borrowings Level 2 0 0 521,187 521,187
The valuation of property has been derived by reference to the current market value in the case of land, and the replacementcost in the case of buildings. The most significant input for these valuation approaches is the value or replacement cost persquare foot which is considered to be observable. The valuation of property is classified as Level 2.
COMPANY
The table below shows the fair values of assets and liabilities which are not carried at fair value on the statement of financialposition but for which disclosure of fair value is required.
GROUP
2015 2015 2015 2015Carrying Fair Carrying FairAmount Value Amount Value
Assets:Investment securities (Held to maturity) Level 2 623,929 644,237 0 0Loans and advances Level 2 30,095,439 30,401,583 0 0
Liabilities:Borrowings Level 2 0 0 584,735 584,735
GROUP COMPANY
The fair values of held-to-maturity investment securities and loans and advances are based on net present values using discount rates reflective of market conditions for similar assets.
The fair value of borrowings is considered to approximate carrying value given the consistency of the inherent interest rate with market conditions.
The fair values of receivables, cash resources, customers' deposits and other financial liabilities approximate to carrying amounts given their short-term nature.
91
Notes to the Financial Statements30 September 2016
Thousands of Guyana Dollars
32.
(a) Proposed changes to the tax regime
The following relevant events occurred after the year end covered by these financial statements:
On 28 November 2016 the Honourable Minister of Finance of Guyana announced several proposed changes to the taxregime. Included among the proposed changes are a reduction in the corporation tax rate for manufacturing companiesand the introduction of a dual tax-rate for companies carrying out both commercial and non-commercial activities. Theseproposed changes will affect the values of the Group's deferred tax balances. These and other proposed changes will beevaluated by the Group once legislated.
POST YEAR END EVENTS
(b) Repurchase of Ordinary Shares
The Company had entered a Memorandum of Understanding (“MOU”) with Banks Holdings Limited (“BHL”) in February 2005 providing for certain co-operation arrangements between the two entities. One of the main features of that MOU was that each company would acquire ordinary shares in the other.
The MOU proceeded on the basis that it would continue in existence so long as there was no radical change in the shareholding of BHL and its controlling shareholders. From around October 2015 it became clear that there was an imminent radical change in the controlling shareholders of BHL when Ambev through one of its subsidiaries SLU Beverages made an offer to take over BHL.
Accordingly when it became inevitable that the offer was about to succeed the directors of the Company, having been advised that it was an implied term of the MOU that the alliance between the Company and BHL would come to an end in the event of a radical change in the shareholding of BHL, decided that it was in the best interests of the Company to sell its shares in BHL to Ambev.
With Ambev’s successful completion of the takeover of BHL and the sale of BDIH’s shareholding in BHL, the Company was advised that it was a natural consequence under the implied terms of the MOU that BHL should no longer continue to hold shares in the Company.
On 01 December 2016 the Company repurchased 150,138,464 of its ordinary shares, representing 15 percent of the issued share capital, from BHL. However, BHL still holds 5 percent of the issued share capital of the Company. This is because the Company and BHL under its new controlling shareholder, Ambev, have now agreed to co-operate in the marketing of beverages in the future.
The consideration for the repurchase of ordinary shares was $5,523,594, financed through cash resources of $4,523,594 and borrowings of $1,000,000. The expected impact will be a reduction in capital and reserves attributable to shareholders by an amount equivalent to the consideration given.

92
Five Year Statistical Summary
Company
YEARS TO SEPTEMBER 30 2016 2015 2014 2013 2012
Thousands of Guyana Dollars
OPERATING DATA
Sales -Net of Taxes 22,328,366 21,225,900 20,544,246 20,706,939 18,950,328 1,550,154 1,337,124 1,207,907 1,317,488 1,142,322
Net Profit after Tax for Shareholders 4,356,975 2,568,506 2,264,644 2,537,889 2,557,757 Cash Cost Of Dividends Paid 1,370,000 640,000 640,000 610,000 560,000 Net Dividend Cover 3.18 4.01 3.54 4.16 4.57
BALANCE SHEET DATANumber of issued & fully paid Capital 1,000,000 1,000,000 1,000,000 1,000,000 1,000,000 Working Capital 10,509,514 6,053,769 5,324,411 4,215,846 5,166,668 Net Property, Plant and Equipment 20,246,462 20,541,425 19,261,837 18,645,922 14,224,900 Stockholders' Equity 28,541,324 25,568,852 23,202,427 21,548,605 18,626,456 Assets 35,190,285 34,068,093 31,097,502 29,723,111 25,675,115 Liabilities 6,648,961 8,499,241 7,895,075 8,174,506 7,048,659
PER ORDINARY SHARE UNITNet Profit 4.36 2.57 2.26 2.54 2.56Stockholders' Equity 28.54 25.57 23.20 21.55 18.63Dividends paid for Year 1.37 0.64 0.64 0.61 0.56
Group
YEARS TO SEPTEMBER 30 2016 2015 2014 2013 2012
Thousands of Guyana Dollars
OPERATING DATA
Sales -Net of Taxes 25,516,295 24,874,732 23,695,420 23,645,283 21,823,667 Taxes 1,824,790 1,895,878 1,818,464 1,916,083 1,702,305 Net Profit after Tax for Shareholders 4,468,141 2,944,523 2,660,323 2,924,878 2,811,700 Cash Cost Of Dividends Paid 1,370,000 640,000 640,000 610,000 560,000 Net Dividend Cover 3.26 4.60 4.16 4.79 5.02
BALANCE SHEET DATANumber of issued & fully paid Capital 1,000,000 1,000,000 1,000,000 1,000,000 1,000,000 Working Capital (9,466,390) (15,097,261) (13,908,590) (12,106,561) (7,530,232) Net Property, Plant and Equipment 23,375,880 22,845,865 20,759,039 19,701,557 14,975,528 Stockholders' Equity 31,721,303 28,625,280 25,873,974 23,823,676 20,518,703 Assets 77,260,878 72,503,325 70,050,693 67,438,011 60,087,216 Liabilities 41,815,726 40,330,905 40,996,849 40,857,931 37,235,904
PER ORDINARY SHARE UNITNet Profit 4.47 2.94 2.66 2.92 2.81Stockholders' Equity 31.72 28.63 25.87 23.82 20.52Dividends paid for Year 1.37 0.64 0.64 0.61 0.56
Taxes

93
Social Distribution of Gross Income 2016
We present below a statement of the Social Distribution of the Group's grossincome known as 'social' accounting.
2016$(000)
Revenue (includes VAT) 31,021,864
Cost of Product including goodsbought; packing and energy (7,038,523)
Miscellaneous operating cost,Net of wages bill (6,638,285)
Net Income on Investment andDisposal of assets 1,461,566
18,806,622
Distributed as follows:
Wages bill, Pension etc. 4,312,882 Less Withheld Income Tax (710,295) 3,602,587
Withheld Income Tax 710,295
VAT, Excise Taxes, Duties, etc. 6,014,013
Corporation Tax, etc. 1,372,238 8,096,546
Contribution to Public Causes 239,002
Depreciation and Provision 5,498,487
Dividend 1,370,000
18,806,622
To Employees 19%To Government 43%To Provision for the Company's future 29%To Shareholders 7%To Public Causes 1%

94
Notes

95
1. (a) A Shareholder (Transferor) who wishes to transfer his/her shares should call at our Registered Office with the
The person(s) [Transferee (s)] to whom the share(s) is (are) to be transferred is (are) also required to call at our
(b) Our Share Registrar will assist in completing the Transfer Form(s) which must be signed by the Transferor and
Transferee.
(c) In the case where the parties are unable to come into our Registered Office, the Share Transfer Form must be
completed and signed by both the Transferor and Transferee in the presence of and attested to by a Notary Public or
(d)
transfer fee payable.
(e)
be advertised in the newspapers at the shareholder’s expense. The shareholder will also be required to submit an
.
(f) The legal personal representative of a deceased shareholder can have the shares of the deceased transferred
by submitting to our Share Registrar the share certificate(s) along with the original or certified copy of Letters of
Administration/Probate of the Estate with the Will and Statement of Assets and Liabilities attached (where applicable).
2. If at anytime you change your address or wish to revoke a stand
inform us in writing.
3. A dividend cheque that is more than six months old from the date it was issued, can be updated for payment at our
4.
effected. The fee for the ‘stop-payment’ has to be paid by the Shareholder and a new dividend cheque will be issued for
payment after six weeks have elapsed.
5. Shareholders can register for a Web Account by visiting the company’s website at www.banksdih.com. Click on Web
Account under Services and get your personalised account which will enable you to make online dividend enquiries and
monitor your shareholding.
Procedure for Transfer of Shares

96
Notes
97
Proxy Form
The undersigned shareholder of Banks DIH Limited hereby appoints
(Mr./Mrs.)_____________________________________________________________________________________________
of (address)___________________________________________________________________________________________
or failing him/her(Mr./Mrs.)______________________________________________________________________________
of (address)___________________________________________________________________________________________
as nominee of the undersigned to attend and act for the undersigned and on behalf of the undersigned at the 61st
Annual General Meeting of the said Company to be held on January 28, 2017 and at any adjournments thereof in the
same manner, to the same extent and with the same powers as if the undersigned were present at the said meeting or
such adjournments thereof.
Dated this day of 2017
To be valid, this proxy form must be completed and
than forty-eight hours before the time for holding the
meeting or adjourned meeting. (Note: Saturdays and Public Holidays are
to be excluded when determining the forty-eight hour period.)
………………………………………………………… ……………………………………………………………
Signature of Shareholder Signature of Shareholder
………………………………………………………… …………………………………………………………....
Printed Name of Shareholder Printed Name of Shareholder
$10.00RevenueStamp

98
Notes

99
Shareholder’s Questionnaire
December 22, 2016
Dear Shareholder,
I shall be glad to welcome you to the 61st Annual General Meeting on Saturday, 28 January, 2017 at Thirst Park, Ruimveldt at 5.00 p.m. (17:00 hours), and be pleased to answer any question you may care to ask. If you have a question, I would appreciate if you would write it on the form provided below, and mail it to me as soon as possible (at least 7 days before the meeting).
If you fail to mail it, you can bring it along to the meeting and hand it to one of our Ushers on arrival.
I will endeavour to answer all questions at the meeting, especially those which have been mailed in, but if your question is not answered at the meeting, I will send you a written answer afterwards.
Yours sincerely,
C. B. Reis, C.C.H.,Chairman/Managing Director
Shareholder’s Question Form
Name of Shareholder: -------------------------------------------------------------------------------------------------------------------------------------
Address: -------------------------------------------------------------------------------------------------------------------------------------------------------
Question: ------------------------------------------------------------------------------------------------------------------------------------------------------
------------------------------------------------------------------------------------------------------------------------------- --------------------------------------
------------------------------------------------------------------------------------------------------------------------------- --------------------------------------
------------------------------------------------------------------------------------------------------------------------------- --------------------------------------
----------------------------------------------------------------------------------------------------------------------------------------------------------------------
Cross out the one (You may mention my name)which does not apply (Please do not mention my name)be addressed to: The Chairman Banks DIH Limited P. O. Box 10194 Thirst Park, Georgetown

100
Notes

101
Notes

102
Notes

103
Notes

104
Notes