Embed Size (px)
Citation preview
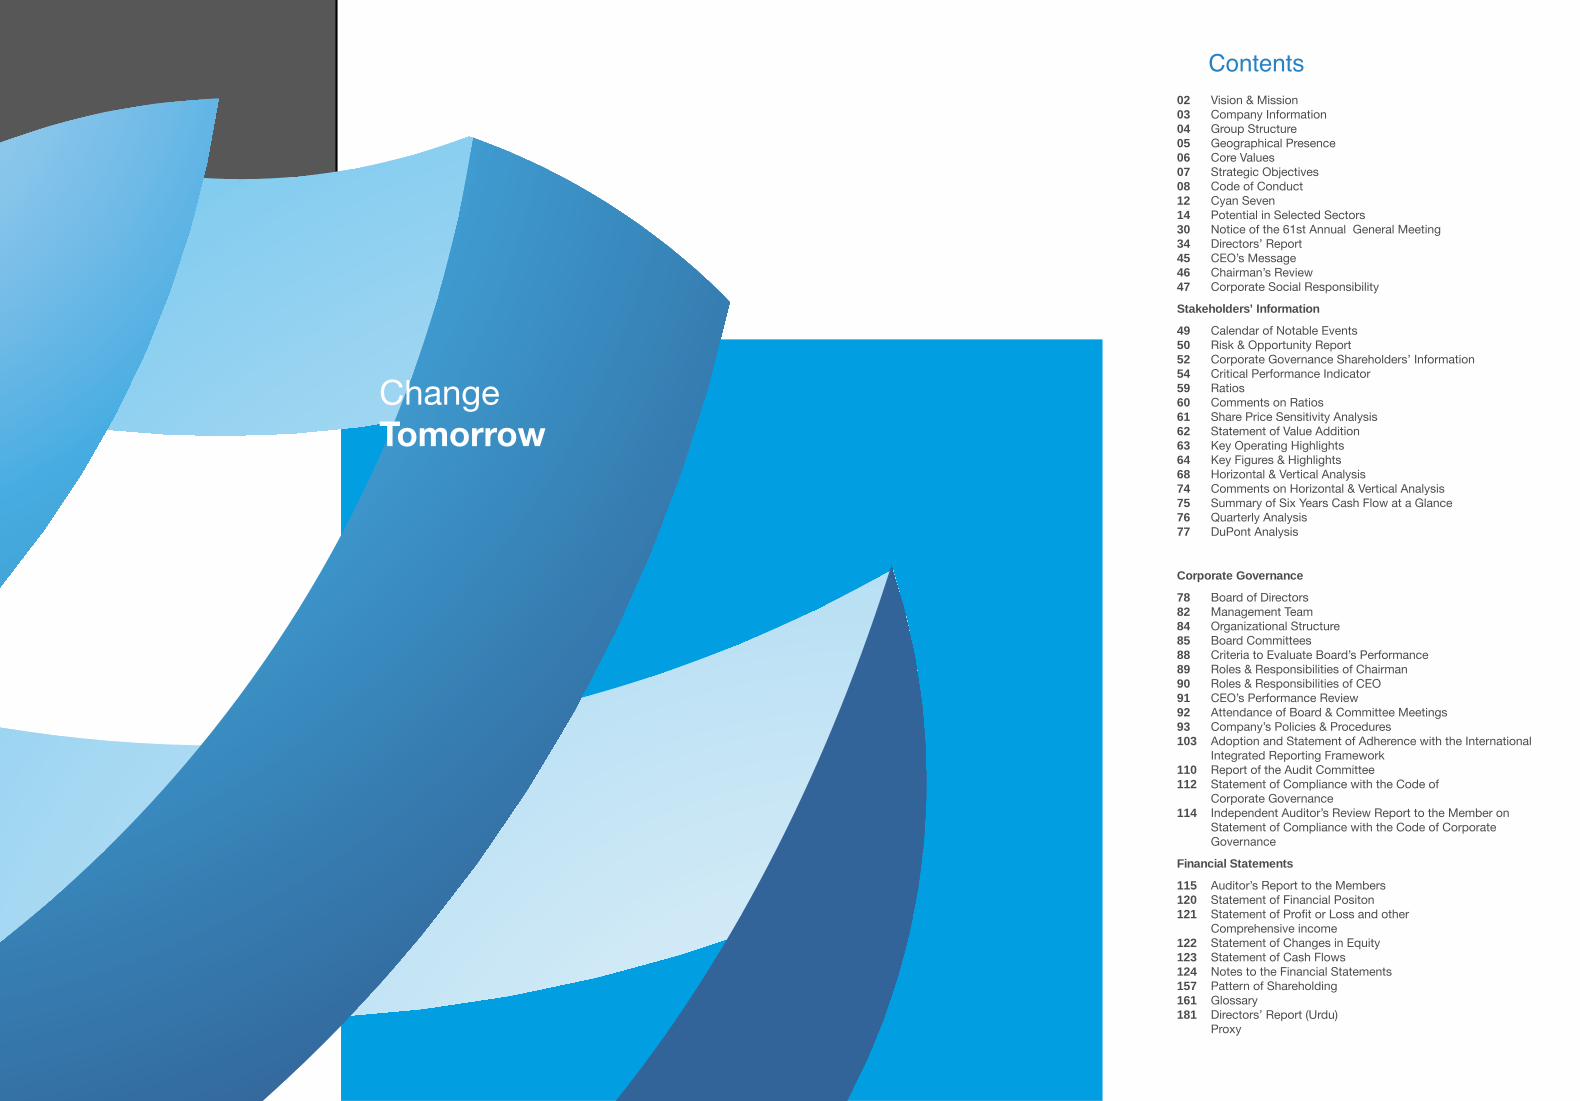
Change Tomorrow
Challenge Today
A N N U A L R E P O R T 2 0 2 0
02 Vision & Mission03 Company Information04 Group Structure05 Geographical Presence06 Core Values07 Strategic Objectives08 Code of Conduct12 Cyan Seven14 Potential in Selected Sectors30 Notice of the 61st Annual General Meeting34 Directors’ Report45 CEO’s Message46 Chairman’s Review47 Corporate Social Responsibility
Stakeholders’ Information
49 Calendar of Notable Events50 Risk & Opportunity Report52 Corporate Governance Shareholders’ Information54 Critical Performance Indicator59 Ratios60 Comments on Ratios61 Share Price Sensitivity Analysis62 Statement of Value Addition63 Key Operating Highlights64 Key Figures & Highlights68 Horizontal & Vertical Analysis 74 Comments on Horizontal & Vertical Analysis75 Summary of Six Years Cash Flow at a Glance 76 Quarterly Analysis 77 DuPont Analysis
Corporate Governance
78 Board of Directors82 Management Team84 Organizational Structure85 Board Committees88 Criteria to Evaluate Board’s Performance89 Roles & Responsibilities of Chairman90 Roles & Responsibilities of CEO91 CEO’s Performance Review92 Attendance of Board & Committee Meetings93 Company’s Policies & Procedures103 Adoption and Statement of Adherence with the International
Integrated Reporting Framework110 Report of the Audit Committee112 Statement of Compliance with the Code of
Corporate Governance 114 Independent Auditor’s Review Report to the Member on
Statement of Compliance with the Code of Corporate Governance
Financial Statements
115 Auditor’s Report to the Members 120 Statement of Financial Positon121 StatementofProfitorLossandother Comprehensive income122 Statement of Changes in Equity123 Statement of Cash Flows124 Notes to the Financial Statements 157 Pattern of Shareholding161 Glossary181 Directors’ Report (Urdu) Proxy
Contents
Challenge Today
Change Tomorrow
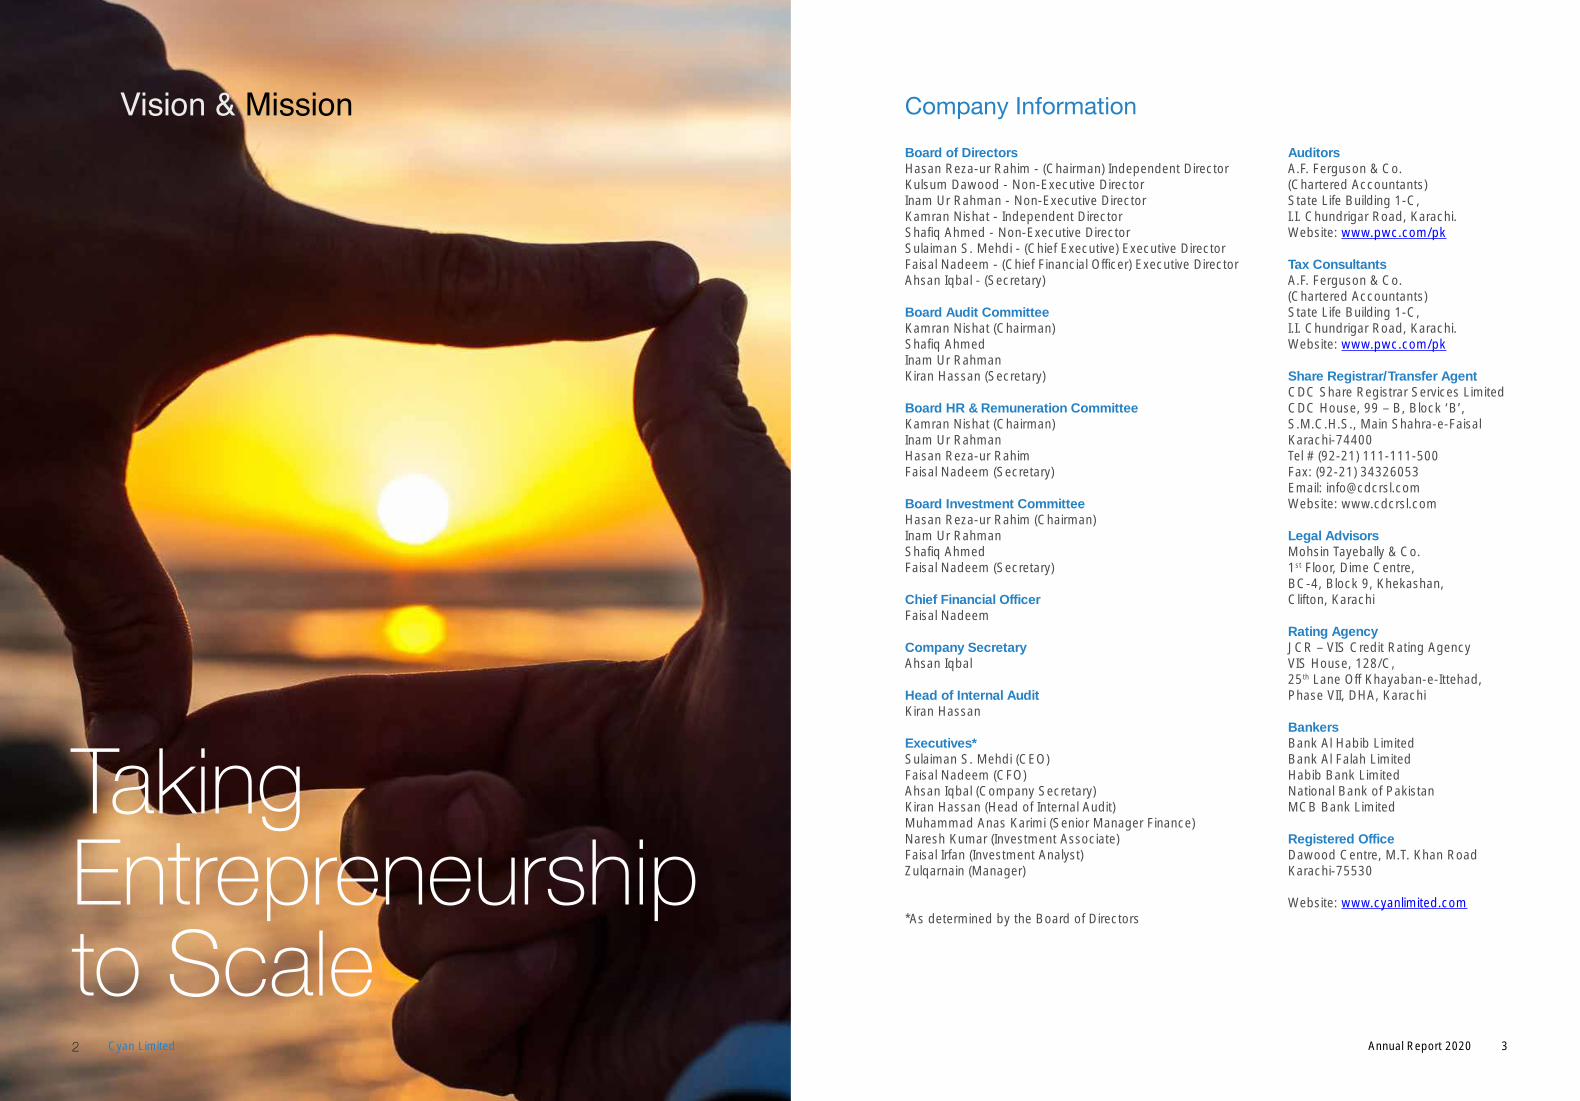
Company Information
Board of Directors AuditorsHasan Reza-ur Rahim - (Chairman) Independent Director A.F. Ferguson & Co.Kulsum Dawood - Non-Executive Director (Chartered Accountants)Inam Ur Rahman - Non-Executive Director State Life Building 1-C,Kamran Nishat - Independent Director I.I. Chundrigar Road, Karachi.Shafiq Ahmed - Non-Executive Director Website: www.pwc.com/pkSulaiman S. Mehdi - (Chief Executive) Executive DirectorFaisal Nadeem - (Chief Financial Officer) Executive Director Tax ConsultantsAhsan Iqbal - (Secretary) A.F. Ferguson & Co. (Chartered Accountants)Board Audit Committee State Life Building 1-C,Kamran Nishat (Chairman) I.I. Chundrigar Road, Karachi.Shafiq Ahmed Website: www.pwc.com/pkInam Ur Rahman Kiran Hassan (Secretary) Share Registrar/Transfer Agent CDC Share Registrar Services LimitedBoard HR & Remuneration Committee CDC House, 99 – B, Block ‘B’,Kamran Nishat (Chairman) S.M.C.H.S., Main Shahra-e-FaisalInam Ur Rahman Karachi-74400Hasan Reza-ur Rahim Tel # (92-21) 111-111-500Faisal Nadeem (Secretary) Fax: (92-21) 34326053 Email: [email protected] Investment Committee Website: www.cdcrsl.comHasan Reza-ur Rahim (Chairman) Inam Ur Rahman Legal AdvisorsShafiq Ahmed Mohsin Tayebally & Co.Faisal Nadeem (Secretary) 1st Floor, Dime Centre, BC-4, Block 9, Khekashan,Chief Financial Officer Clifton, KarachiFaisal Nadeem Rating AgencyCompany Secretary JCR – VIS Credit Rating AgencyAhsan Iqbal VIS House, 128/C, 25th Lane Off Khayaban-e-Ittehad,Head of Internal Audit Phase VII, DHA, KarachiKiran Hassan BankersExecutives* Bank Al Habib LimitedSulaiman S. Mehdi (CEO) Bank Al Falah LimitedFaisal Nadeem (CFO) Habib Bank LimitedAhsan Iqbal (Company Secretary) National Bank of PakistanKiran Hassan (Head of Internal Audit) MCB Bank LimitedMuhammad Anas Karimi (Senior Manager Finance) Naresh Kumar (Investment Associate) Registered Office Faisal Irfan (Investment Analyst) Dawood Centre, M.T. Khan RoadZulqarnain (Manager) Karachi-75530 Website: www.cyanlimited.com*As determined by the Board of Directors
Taking Entrepreneurship to Scale
Vision & Mission
3Annual Report 20202 Cyan Limited
Engro FertilizersLimited (EFERT)
Engro Eximp AgriProducts (Pvt)
Limited
Engro PowergenQadirpur Limited
(EPQL)
Engro Polymer& Chemicals
Limited (EPCL)
Friesland Campina Engro Pakistan Limited (FCEPL)
Engro ElengyTerminal (Pvt)
Limited
Engro VopakTerminal Limited(Joint Venture)
Engro Digital Limited
Engro Enfrashare(Pvt) Limited
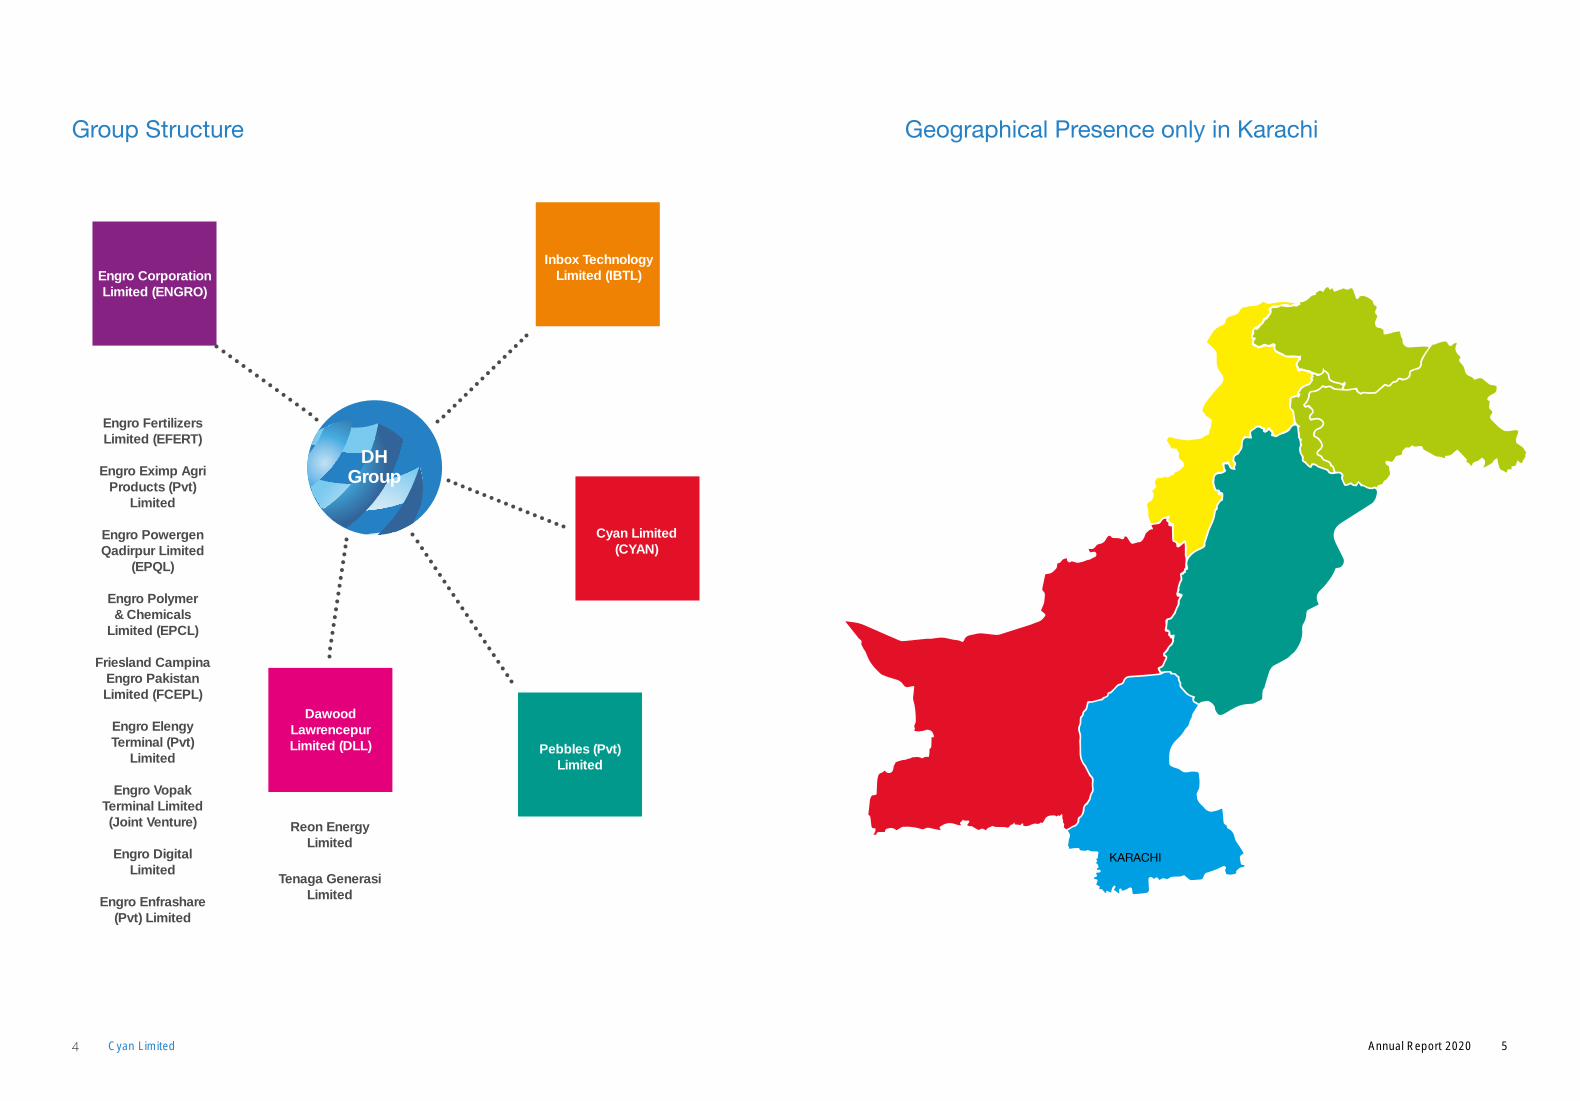
Group Structure
Reon EnergyLimited
Tenaga GenerasiLimited
Engro CorporationLimited (ENGRO)
Inbox TechnologyLimited (IBTL)
Cyan Limited(CYAN)
Pebbles (Pvt) Limited
DawoodLawrencepurLimited (DLL)
Geographical Presence only in Karachi
KARACHI
DHGroup
5Annual Report 20204 Cyan Limited
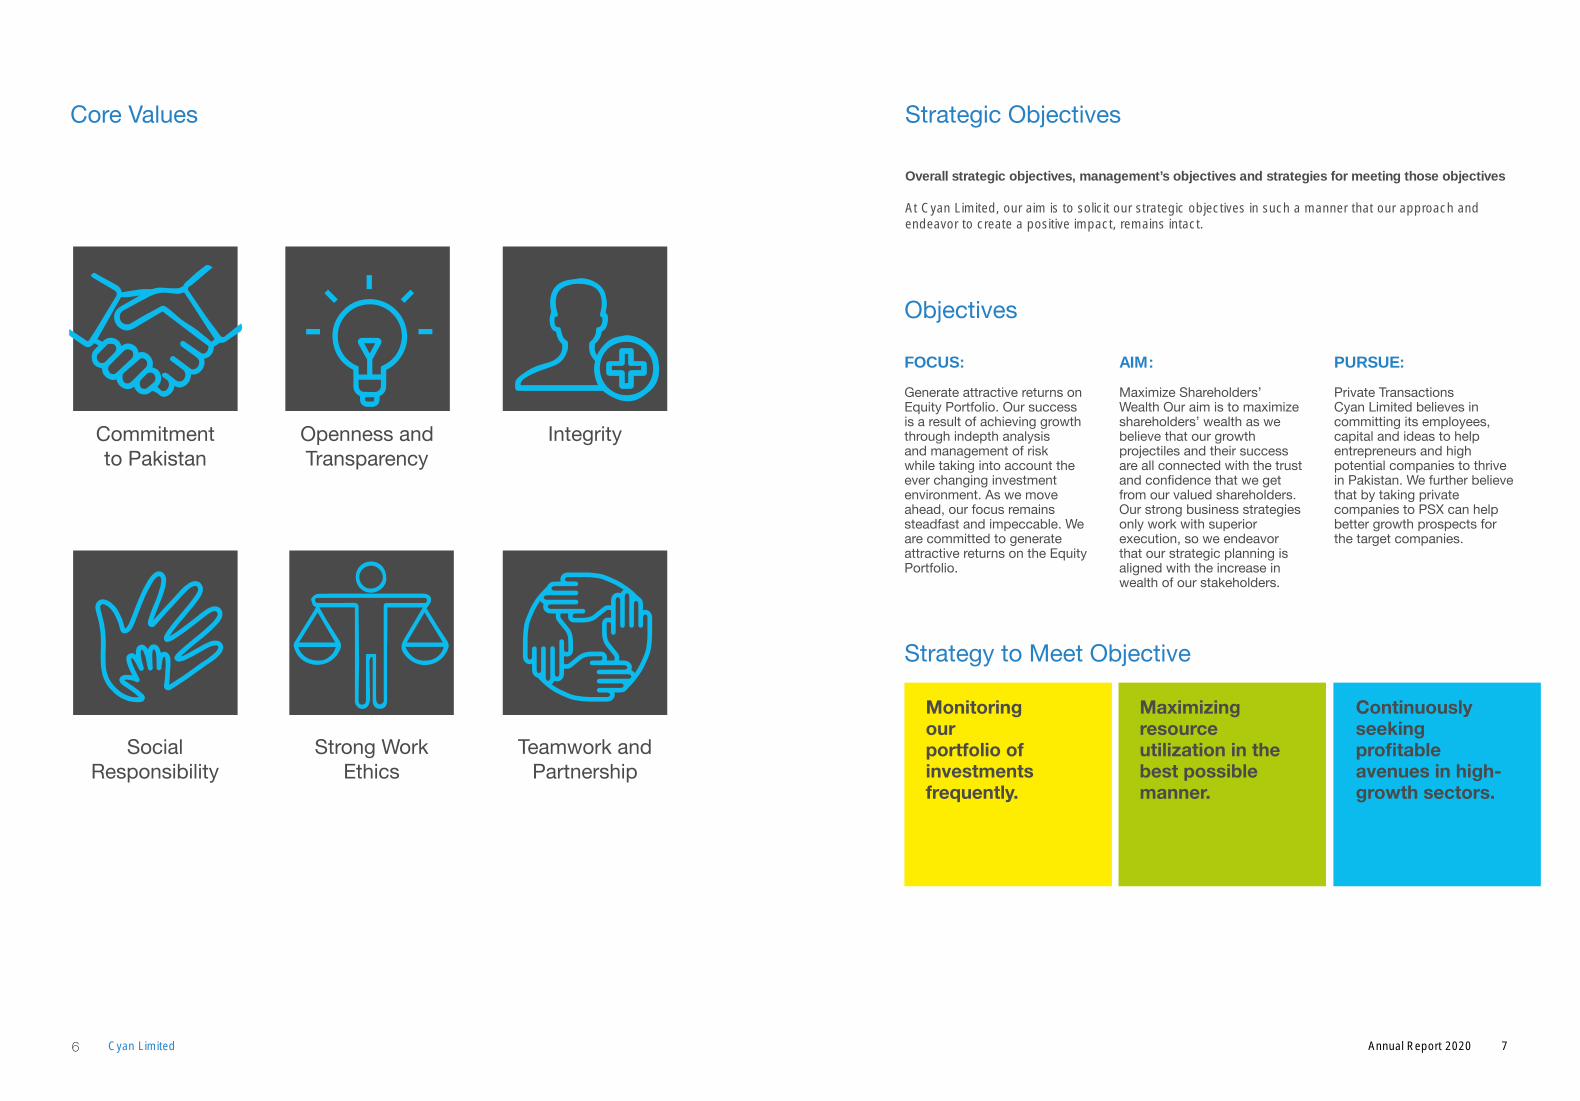
Core Values
Commitment to Pakistan
Openness and Transparency
Integrity
SocialResponsibility
Strong WorkEthics
Teamwork and Partnership
Strategic Objectives
Overall strategic objectives, management’s objectives and strategies for meeting those objectives
At Cyan Limited, our aim is to solicit our strategic objectives in such a manner that our approach and endeavor to create a positive impact, remains intact.
Monitoring our portfolio of investments frequently.
Strategy to Meet Objective
Objectives
Maximizing resourceutilization in the best possible manner.
Continuously seeking profitable avenues in high-growth sectors.
FOCUS:
Generate attractive returns on Equity Portfolio. Our success is a result of achieving growth through indepth analysis and management of risk while taking into account the ever changing investment environment. As we move ahead, our focus remains steadfast and impeccable. We are committed to generate attractive returns on the Equity Portfolio.
PURSUE:
Private TransactionsCyanLimitedbelievesincommitting its employees, capital and ideas to helpentrepreneurs and highpotential companies to thrive in Pakistan. We further believe that by taking privatecompanies to PSX can help better growth prospects for the target companies.
AIM:
Maximize Shareholders’ Wealth Our aim is to maximizeshareholders’ wealth as we believe that our growth projectiles and their success are all connected with the trust andconfidencethatwegetfrom our valued shareholders. Our strong business strategies only work with superior execution, so we endeavor that our strategic planning is aligned with the increase in wealth of our stakeholders.
7Annual Report 20206 Cyan Limited
FOR EMPLOYEES:This code is developed and adopted with a view to develop and promote the highest standards of ethical behavior, professionalism, integrity and commitment amongst the employees of the company. It is adopted with the end view of promoting good corporate governance.
The company makes it mandatory for all its employees to perform their duties and responsibilities in accordance with this code.
The company is guided by the following principles in all activities for attainment of the organizational objectives:
1. ABIDANCE OF LAWS / RULESa. All employees shall conform to and abide
by the company policies, applicable laws, regulations and directives which may from time to time be in force.
b. The employees shall not take part in, subscribe in aid of, or assist in any way, any political movement that is in disinterest of Cyan.
2. INTEGRITYa. Conduct themselves with the highest
standards of ethics, professional integrity and dignity in all dealings with the public, clients, investors and employees, and not engage in acts discreditable to Cyan and the profession. If they become aware of any irregularity that might affect the interests of Cyan, they shall inform the senior management immediately.
b. Maintain all books, data, information and records with scrupulous integrity, reporting in an accurate and timely manner all transactions/reports.
c. Avoid all such circumstance in which there is personal interest conflict, or may appear to be in conflict, with the interests of Cyan or its clients.
d. Not use their employment status to seek personal gain from those doing business or seeking to do business with Cyan, nor accept such gain, gift, favor, entertainment or other benefits, if offered.
3. CONFIDENTIALITYMaintain the privacy and confidentiality of all the information acquired during the course of professional activities and refrain from disclosing the same unless otherwise required by statutory authorities/law. All such information will remain as a trust and will only be used for the purpose for which it is intended and will not be used for the personal benefits of any individual(s). Inside information about Cyan’s clients/affairs shall not be used for their own gain, or for that of others either directly or indirectly.
4. PROFESSIONALISMServe Cyan honestly and faithfully and strictly serve Cyan’s affairs and the affairs of its constituents. Disclose and assign to Cyan all interest in any invention, improvement, discovery or work of authorship that they may make or conceive and which may arise out of their employment with Cyan. If their employment is terminated, all rights to property and information generated or obtained as part of their employment relationship will remain the exclusive property of Cyan.
5. BUSINESS/WORK ETHICSa. Respect fellow colleagues and work as a
team. They shall at all times be courteous and not let any personal differences affect their work.
b. Ensure good attendance and punctuality and demonstrate a consistently good record in this area.
c. Maintain a standard of personal hygiene and dress appropriately for attendance at work.
d. As a personal responsibility, safeguard both the tangible and intangible assets of Cyan that are under their personal control and shall not use Cyan assets for their personal benefits except where permitted by Cyan.
e. Not indulge in any kind of harassment including sexual harassment or intimidation whether committed by or against any senior/junior, co-worker, customer, vendor or visitor. They shall not use language, written or spoken in intra office communication(s) or communication(s)
Code of Conduct with individual(s) outside the office that may
contain any statement or material that is offensive to others.
f. Employees shall also not indulge in any of the following activities except with the prior permission of the competent authority:
i. Borrow money from or in any way place themselves under pecuniary obligation to broker or money lender or any employee of Cyan or any firm or person having dealings with Cyan;
ii. Buy or sell stock, share or securities of any description without funds to meet the full cost in the case of purchase or scrip’s for delivery in the case of sale. However, they can make a bona fide investment of their own funds in such stock, shares and securities in line with the employees trading policy;
iii. Lend money in their private capacity to a constituent of Cyan or have personal dealings with a constituent in the purchase or sale of bills of exchange, Government paper or any other securities;
iv. Guarantee in their private capacity the pecuniary obligation of another person or agree to indemnify in such capacity any person from loss;
v. Act as agent for an insurance company otherwise than as agent for on behalf of Cyan;
vi. Be connected with the formation or management of a joint stock company;
vii. Engage in any other commercial business or pursuit either on their own account or as agent for another or others;
viii. Accept or seek any outside employment or office whether stipendiary or honorary; and
ix. Undertake part time work for a private or public body or private person, or accept fee thereof.
FOR DIRECTORS:The Code is developed and adopted with a view
to focus the Board and each Director on areas of ethical risk; provide guidance to directors to help them recognize and deal with ethical issues; provide mechanisms to report unethical conduct; and help foster a culture of honesty and accountability.
1. CONFLICT OF INTERESTDirectors including the Chairman must avoid any conflicts of interest between the director and the Company. Any situation that involves, or may reasonably be expected to involve, a conflict of interest with the Company, should be disclosed promptly to the the Board of Directors. A “conflict of interest” can occur when:a. A director’s personal interest is adverse to or
may appear to be adverse to the interests of the Company as a whole;
b. A director, or a member of his or her immediate family, receives improper personal benefits as a result of his or her position as a director of the Company;
Some of the more common conflicts which directors should avoid are listed below:
c. Relationship of Company with third-parties. Directors may not receive a personal benefit from a person or firm which is seeking to do business or to retain business with Cyan. A director shall recuse him or herself from any Company Board decision involving another firm or Company with which the director is affiliated;
d. Compensation from non-Company sources. Directors may not accept compensation (in any form) for services performed for the Company from any source other than the Company;
e. Gifts. Directors may not offer, give or receive gifts from persons or entities who deal with Cyan in those cases where any such gift is being made in order to influence the directors’ actions as members of the Board, or where acceptance of the gifts could create the appearance of a conflict of interest; and
f. Personal use of Company assets. Directors may not use Company assets, labor or information for personal use unless approved by the Chairman of the Board or as part of
9Annual Report 20208 Cyan Limited
a compensation or expense reimbursement program available to all directors.
2. CORPORATE OPPORTUNITIES Directors are prohibited from:
a. Taking for themselves or their companies opportunities that are discovered through the use of Company property, Company information or position as a director;
b. Using the Company’s property or information for personal gain; or
c. Competing with the Company for business opportunities. However, if the Company is disinterested and the directors determine that the Company will not pursue an opportunity that relates to the Company’s business, a director may then do so.
3. CONFIDENTIALITYDirectors must maintain the confidentiality of information entrusted to them by the Company and any other confidential information about the Company that comes to them, from whatever source, in their capacity as a director, except when disclosure is authorized or legally mandated. For purposes of this Code, “confidential information” includes all non-public information relating to the Company.
4. COMPLIANCE WITH LAWS, RULES AND REGULATIONS; FAIR DEALINGDirectors must comply, and oversee compliance by employees, officers and other directors, with laws, rules and regulations applicable to the Company, including insider trading laws. Directors must deal fairly, and must oversee fair dealing by employees and officers, with the Company’s customers, suppliers, competitors and employees.
5. ENCOURAGING THE REPORTING OF ANY ILLEGAL OR UNETHICAL BEHAVIOR.Directors should promote ethical behavior and take steps to ensure the Company:a. Encourages employees to talk to supervisors,
managers and other appropriate personnel when in doubt about the best course of action in a particular situation; and
b. Encourages employees to report violations of laws, rules, regulations or the Company’s Code of Conduct to appropriate personnel.
6. COMPLIANCE STANDARDSDirectors should communicate any suspected violations of this Code promptly to the Chairman of the Audit Committee. Violations will be investigated by the Board or by persons designated by the Board, and appropriate action(s) will be taken in the event of any violations of the Code.
Cyan Seven
10 Cyan Limited
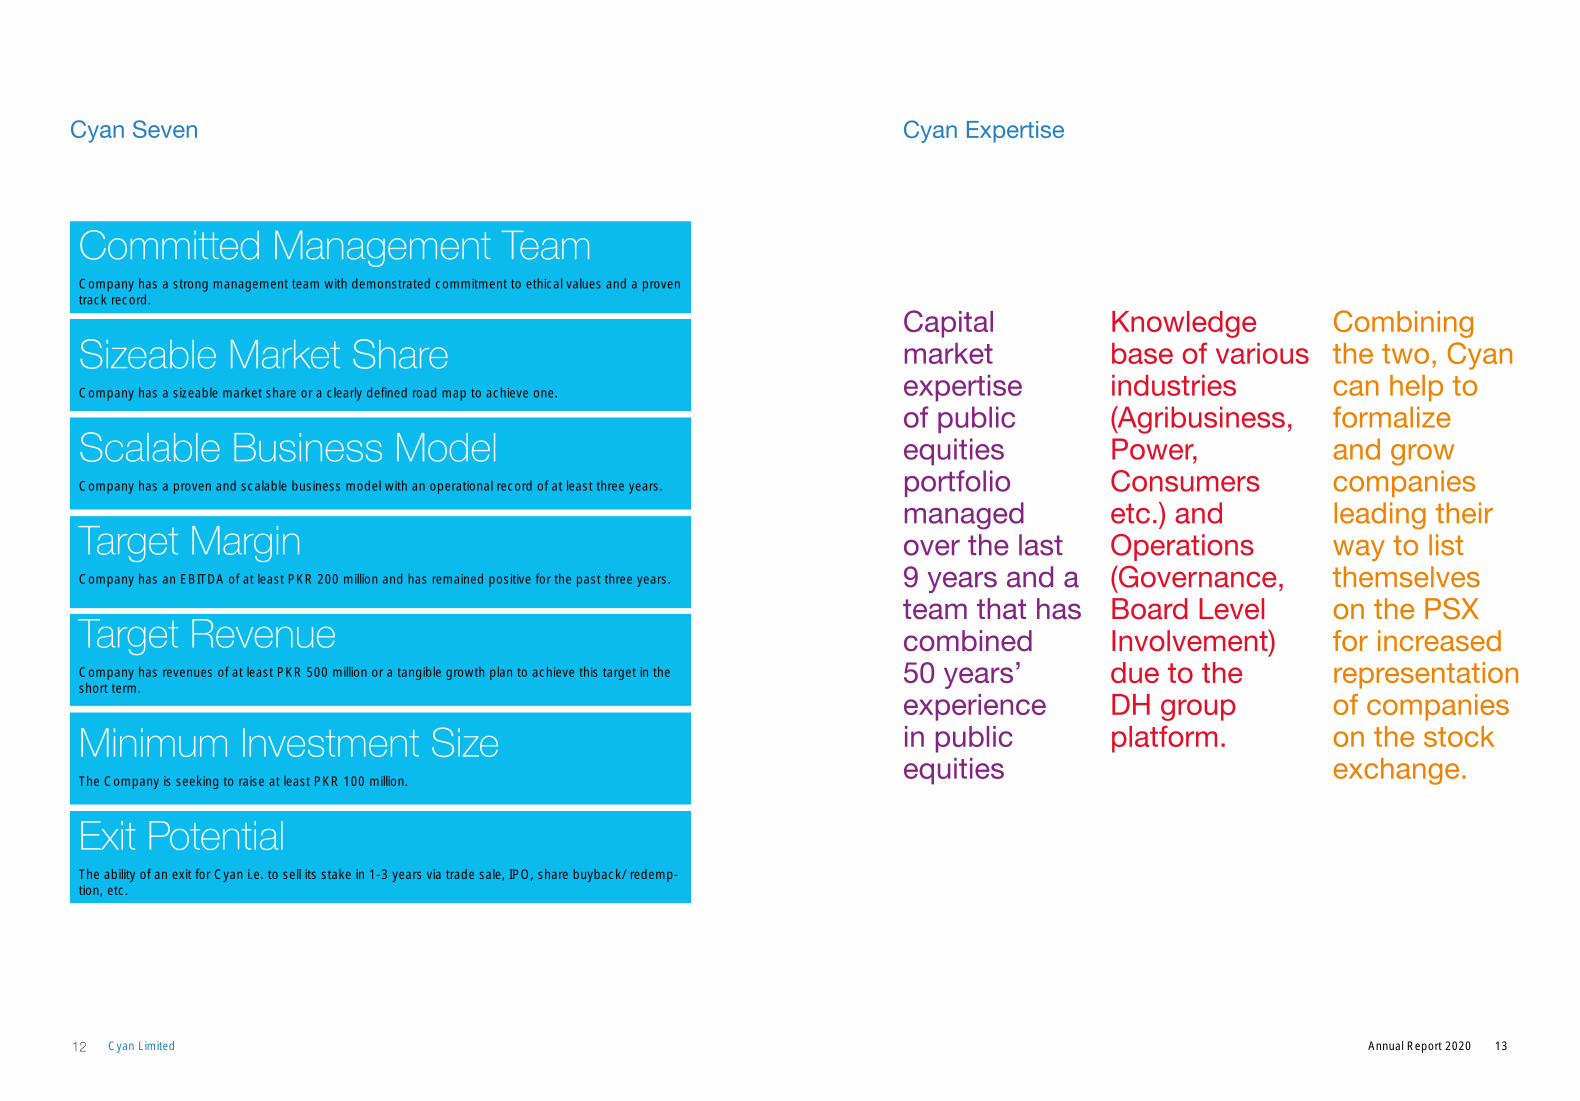
Cyan Seven
Committed Management TeamCompany has a strong management team with demonstrated commitment to ethical values and a proven track record.
Sizeable Market ShareCompany has a sizeable market share or a clearly defined road map to achieve one.
Scalable Business ModelCompany has a proven and scalable business model with an operational record of at least three years.
Target MarginCompany has an EBITDA of at least PKR 200 million and has remained positive for the past three years.
Target RevenueCompany has revenues of at least PKR 500 million or a tangible growth plan to achieve this target in the short term.
Minimum Investment SizeThe Company is seeking to raise at least PKR 100 million.
Exit PotentialThe ability of an exit for Cyan i.e. to sell its stake in 1-3 years via trade sale, IPO, share buyback/ redemp-tion, etc.
Cyan Expertise
Capital market expertise of public equities portfolio managed over the last 9 years and a team that has combined 50 years’ experience in public equities
Knowledge base of various industries (Agribusiness, Power, Consumers etc.) and Operations (Governance, BoardLevelInvolvement) due to the DH group platform.
Combining the two, Cyan can help to formalize and grow companies leading their way to list themselves on the PSX for increased representation of companies on the stock exchange.
13Annual Report 202012 Cyan Limited
Source: Pakistan Economic Survey, Trade Development Authority of Pakistan,OECD and Cyan Research
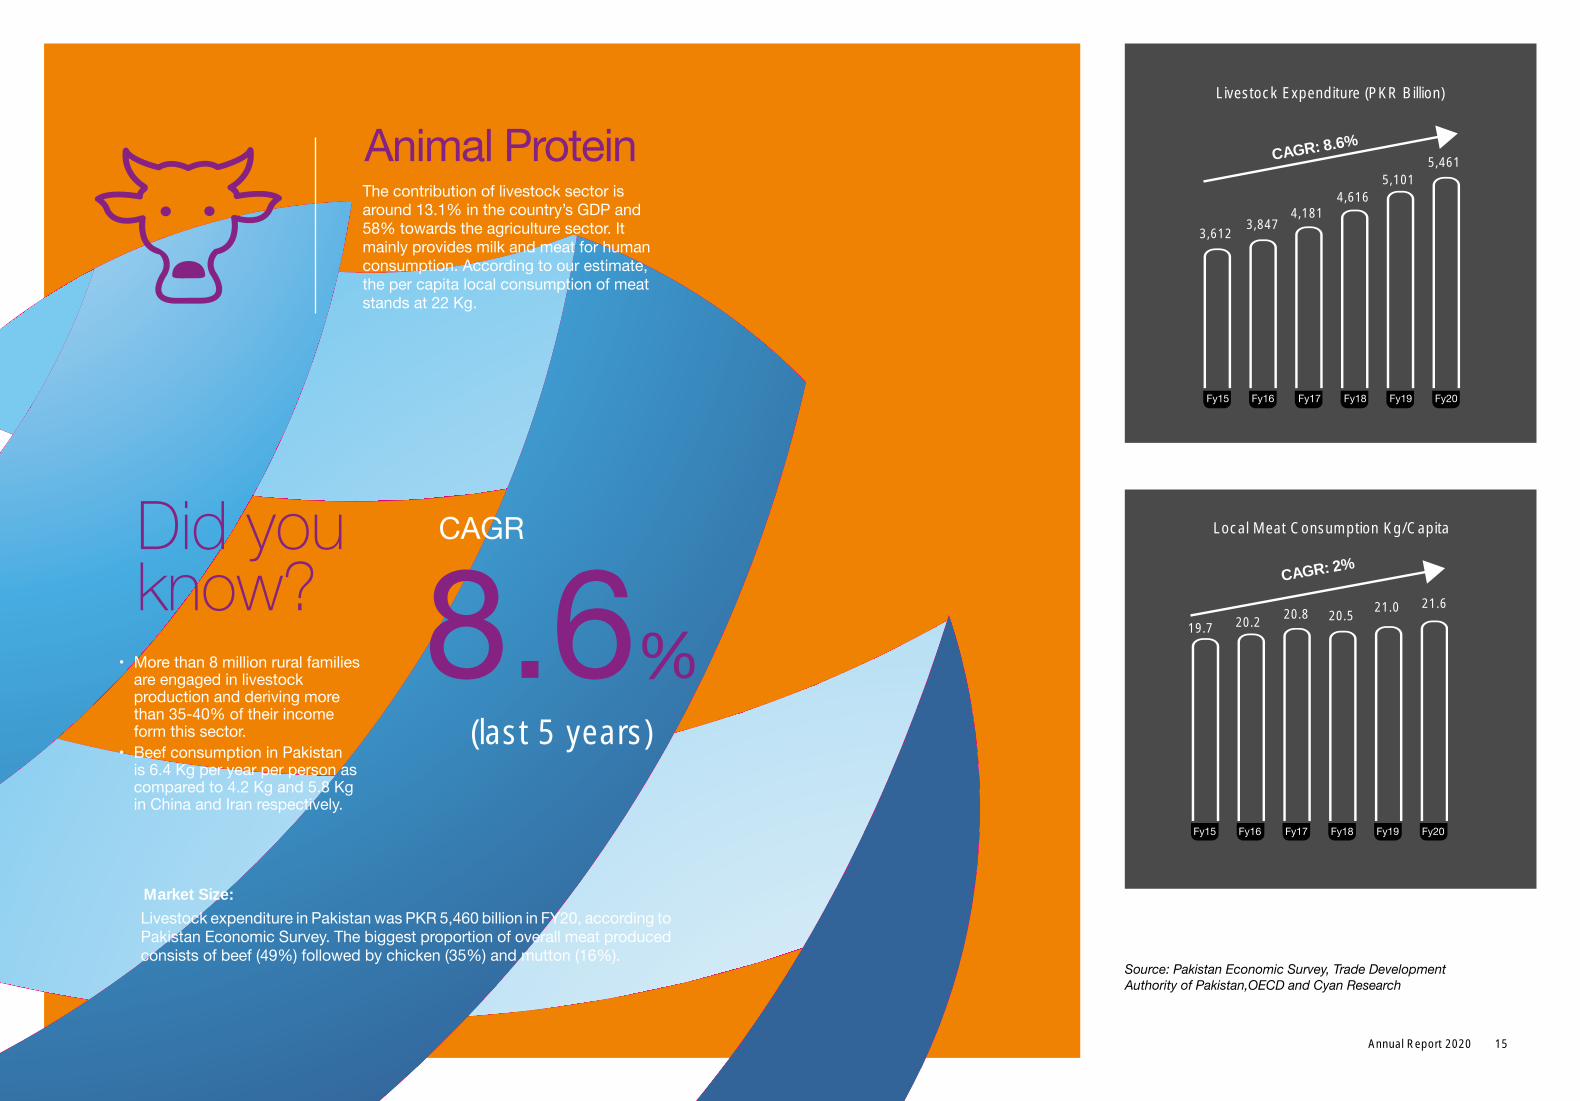
Local Meat Consumption Kg/Capita
CAGR: 2%
19.7 20.220.8 20.5
21.0 21.6
The contribution of livestock sector is around 13.1% in the country’s GDP and 58% towards the agriculture sector. It mainly provides milk and meat for human consumption. According to our estimate, the per capita local consumption of meat stands at 22 Kg.
Animal Protein
• Morethan8millionruralfamiliesare engaged in livestock production and deriving more than 35-40% of their income form this sector.
• BeefconsumptioninPakistanis 6.4 Kg per year per person as compared to 4.2 Kg and 5.8 Kg in China and Iran respectively.
Did you know?
LivestockexpenditureinPakistanwasPKR5,460billioninFY20,accordingtoPakistan Economic Survey. The biggest proportion of overall meat produced consists of beef (49%) followed by chicken (35%) and mutton (16%).
CAGR
8.6%(last 5 years)
Market Size:
CAGR: 8.6%
3,6123,847
4,1814,616
Livestock Expenditure (PKR Billion)
5,1015,461
Fy15 Fy16 Fy17 Fy18 Fy19 Fy20
Fy15 Fy16 Fy17 Fy18 Fy19 Fy20
15Annual Report 2020
Animal
Animal
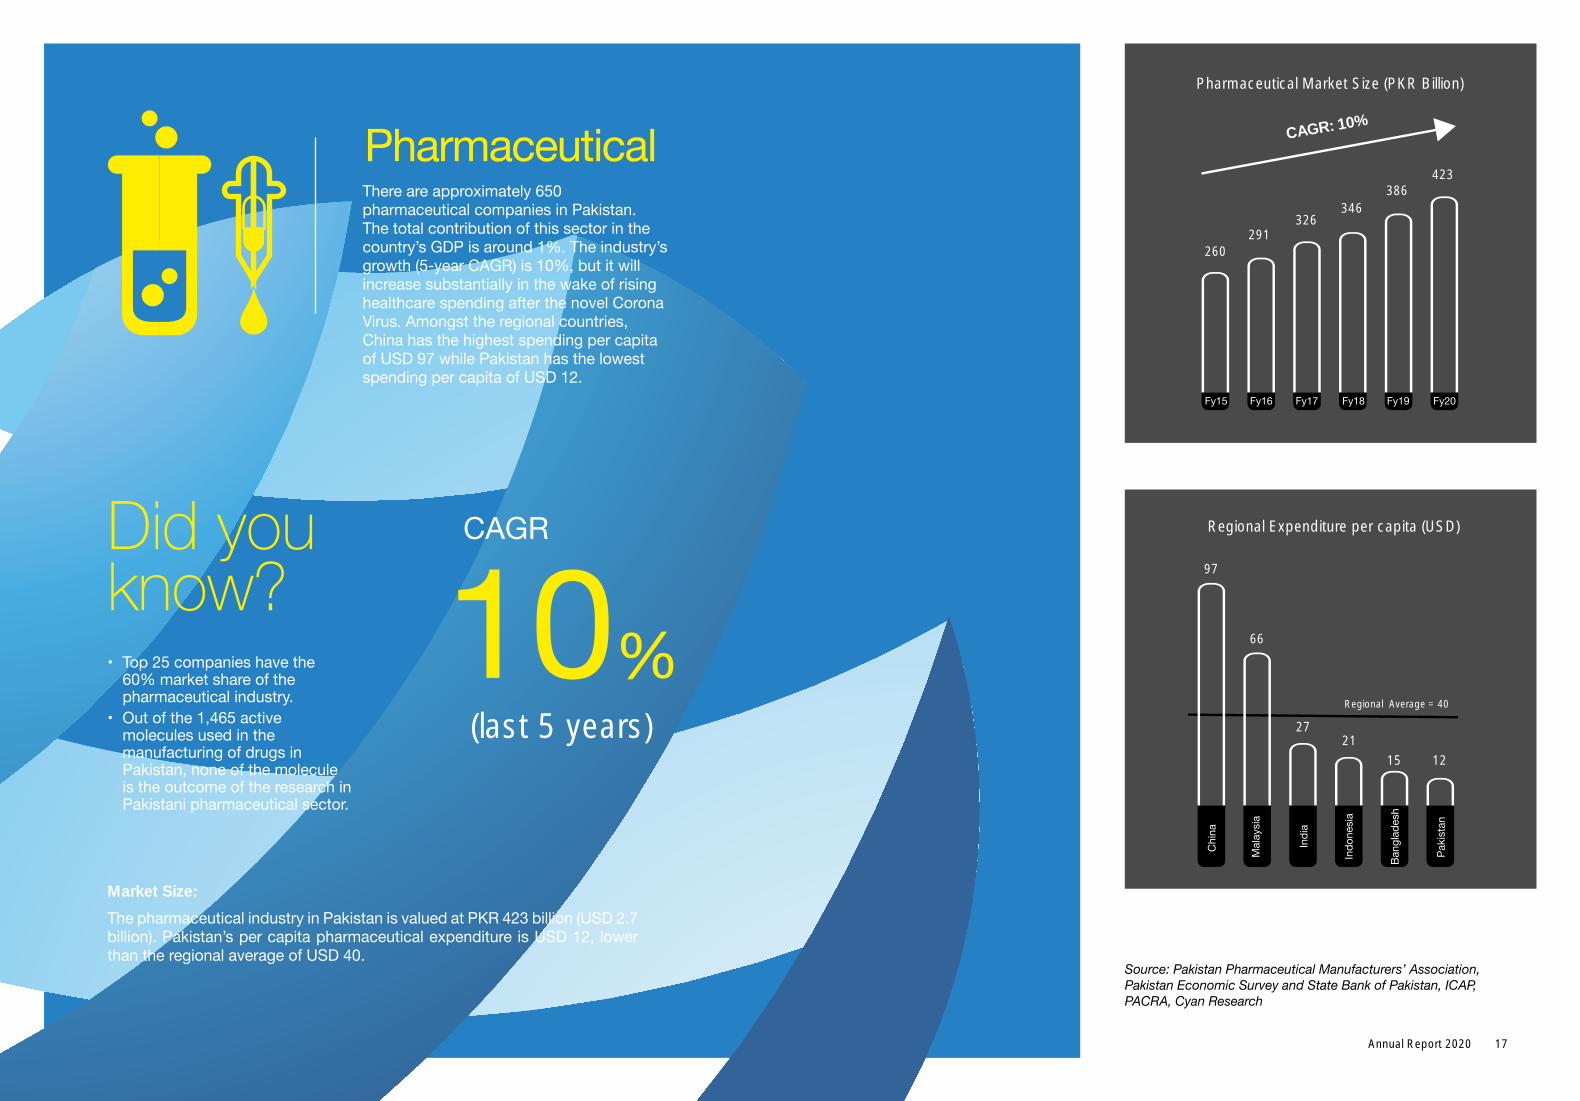
Source: Pakistan Pharmaceutical Manufacturers’ Association, Pakistan Economic Survey and State Bank of Pakistan, ICAP, PACRA, Cyan Research
There are approximately 650 pharmaceutical companies in Pakistan. The total contribution of this sector in the country’s GDP is around 1%. The industry’s growth (5-year CAGR) is 10%, but it will increase substantially in the wake of rising healthcare spending after the novel Corona Virus. Amongst the regional countries, China has the highest spending per capita of USD 97 while Pakistan has the lowest spending per capita of USD 12.
• Top25companieshavethe60% market share of the pharmaceutical industry.
• Outofthe1,465activemolecules used in the manufacturing of drugs in Pakistan, none of the molecule is the outcome of the research in Pakistani pharmaceutical sector.
Did you know?
The pharmaceutical industry in Pakistan is valued at PKR 423 billion (USD 2.7 billion). Pakistan’s per capita pharmaceutical expenditure is USD 12, lower than the regional average of USD 40.
CAGR
10%(last 5 years)
Market Size:
17Annual Report 2020
Pharmaceutical Market Size (PKR Billion)
Pharmaceutical
CAGR: 10%
260291
326346
386423
Regional Expenditure per capita (USD)
Pharmaceutical
97
66
2721
15 12
Regional Average = 40
Chi
na
Mal
aysi
a
Indo
nesi
a
Indi
a
Paki
stan
Bang
lade
sh
Pharmaceutical
Fy15 Fy16 Fy17 Fy18 Fy19 Fy20
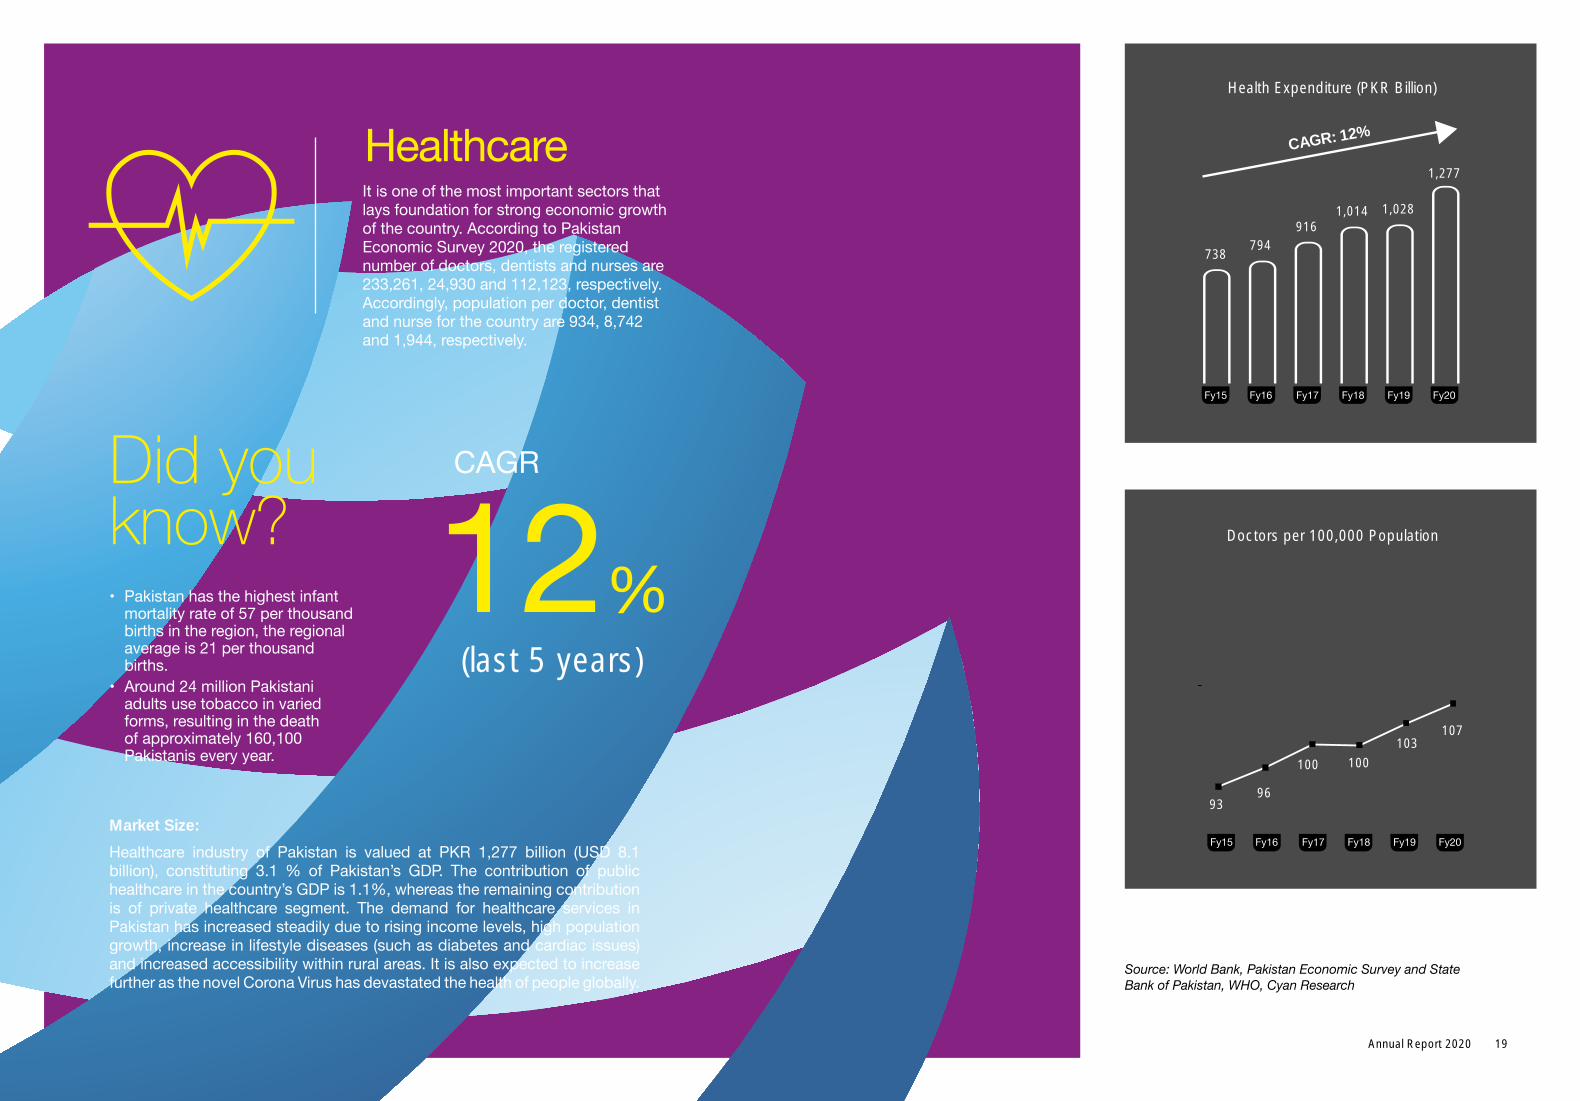
Health Expenditure (PKR Billion)
Health care
CAGR: 12%
738794
9161,014 1,028
1,277
Doctors per 100,000 Population
Health care
9396
100100
103107
Fy15 Fy16 Fy17 Fy18 Fy19 Fy20
Fy15 Fy16 Fy17 Fy18 Fy19 Fy20
Source: World Bank, Pakistan Economic Survey and State Bank of Pakistan, WHO, Cyan Research
It is one of the most important sectors that lays foundation for strong economic growth of the country. According to Pakistan Economic Survey 2020, the registered number of doctors, dentists and nurses are 233,261, 24,930 and 112,123, respectively. Accordingly, population per doctor, dentist and nurse for the country are 934, 8,742 and 1,944, respectively.
Healthcare
• Pakistanhasthehighestinfantmortality rate of 57 per thousand births in the region, the regional average is 21 per thousand births.
• Around24millionPakistaniadults use tobacco in varied forms, resulting in the death of approximately 160,100 Pakistanis every year.
Did you know?
Healthcare industry of Pakistan is valued at PKR 1,277 billion (USD 8.1 billion), constituting 3.1 % of Pakistan’s GDP. The contribution of public healthcare in the country’s GDP is 1.1%, whereas the remaining contribution is of private healthcare segment. The demand for healthcare services in Pakistan has increased steadily due to rising income levels, high population growth, increase in lifestyle diseases (such as diabetes and cardiac issues) and increased accessibility within rural areas. It is also expected to increase further as the novel Corona Virus has devastated the health of people globally.
CAGR
12%(last 5 years)
Market Size:
19Annual Report 2020
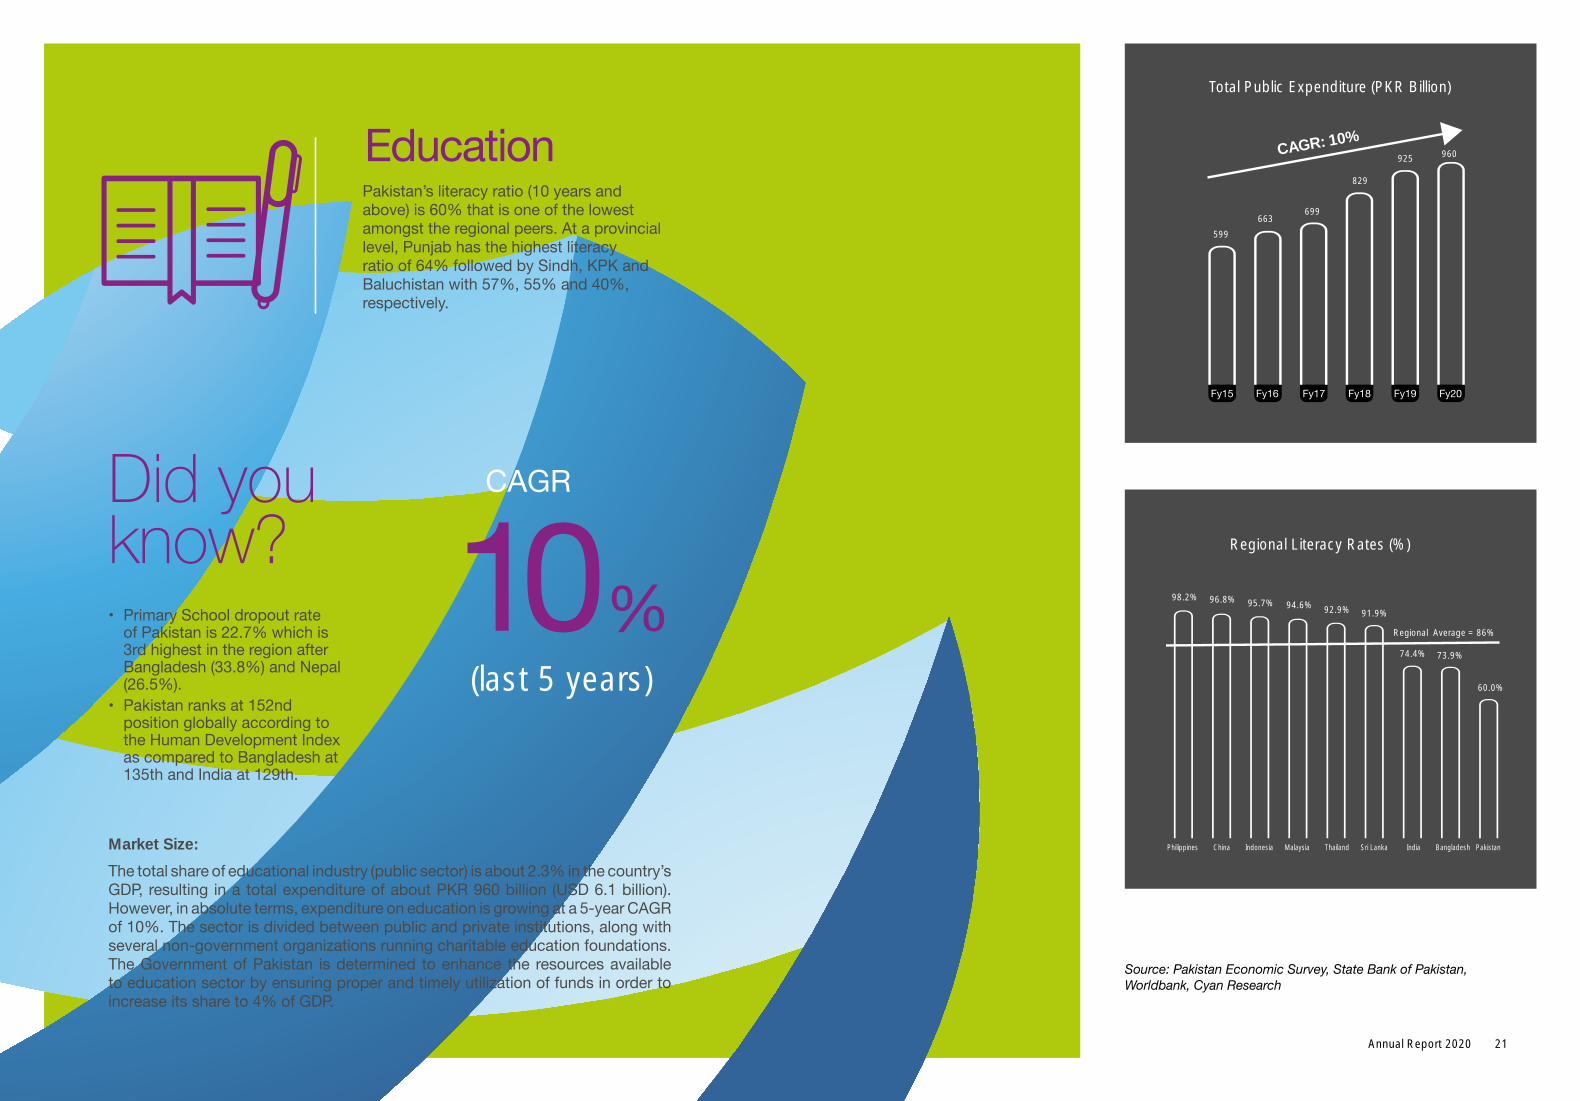
Source: Pakistan Economic Survey, State Bank of Pakistan, Worldbank, Cyan Research
Pakistan’s literacy ratio (10 years and above) is 60% that is one of the lowest amongst the regional peers. At a provincial level, Punjab has the highest literacy ratio of 64% followed by Sindh, KPK and Baluchistan with 57%, 55% and 40%, respectively.
• PrimarySchooldropoutrateof Pakistan is 22.7% which is 3rd highest in the region after Bangladesh (33.8%) and Nepal (26.5%).
• Pakistanranksat152ndposition globally according to the Human Development Index as compared to Bangladesh at 135th and India at 129th.
Did you know?
The total share of educational industry (public sector) is about 2.3% in the country’s GDP, resulting in a total expenditure of about PKR 960 billion (USD 6.1 billion). However, in absolute terms, expenditure on education is growing at a 5-year CAGR of 10%. The sector is divided between public and private institutions, along with several non-government organizations running charitable education foundations. The Government of Pakistan is determined to enhance the resources available to education sector by ensuring proper and timely utilization of funds in order to increase its share to 4% of GDP.
CAGR
10%(last 5 years)
Market Size:
Education
Regional Literacy Rates (%)
98.2%
Philippines China Indonesia Malaysia Thailand Sri Lanka India Bangladesh Pakistan
95.7%96.8%94.6% 92.9% 91.9%
Regional Average = 86%
74.4% 73.9%
60.0%
Total Public Expenditure (PKR Billion)
599
663699
829
925 960CAGR: 10%
Education
Education
Fy15 Fy16 Fy17 Fy18 Fy19 Fy20
21Annual Report 2020
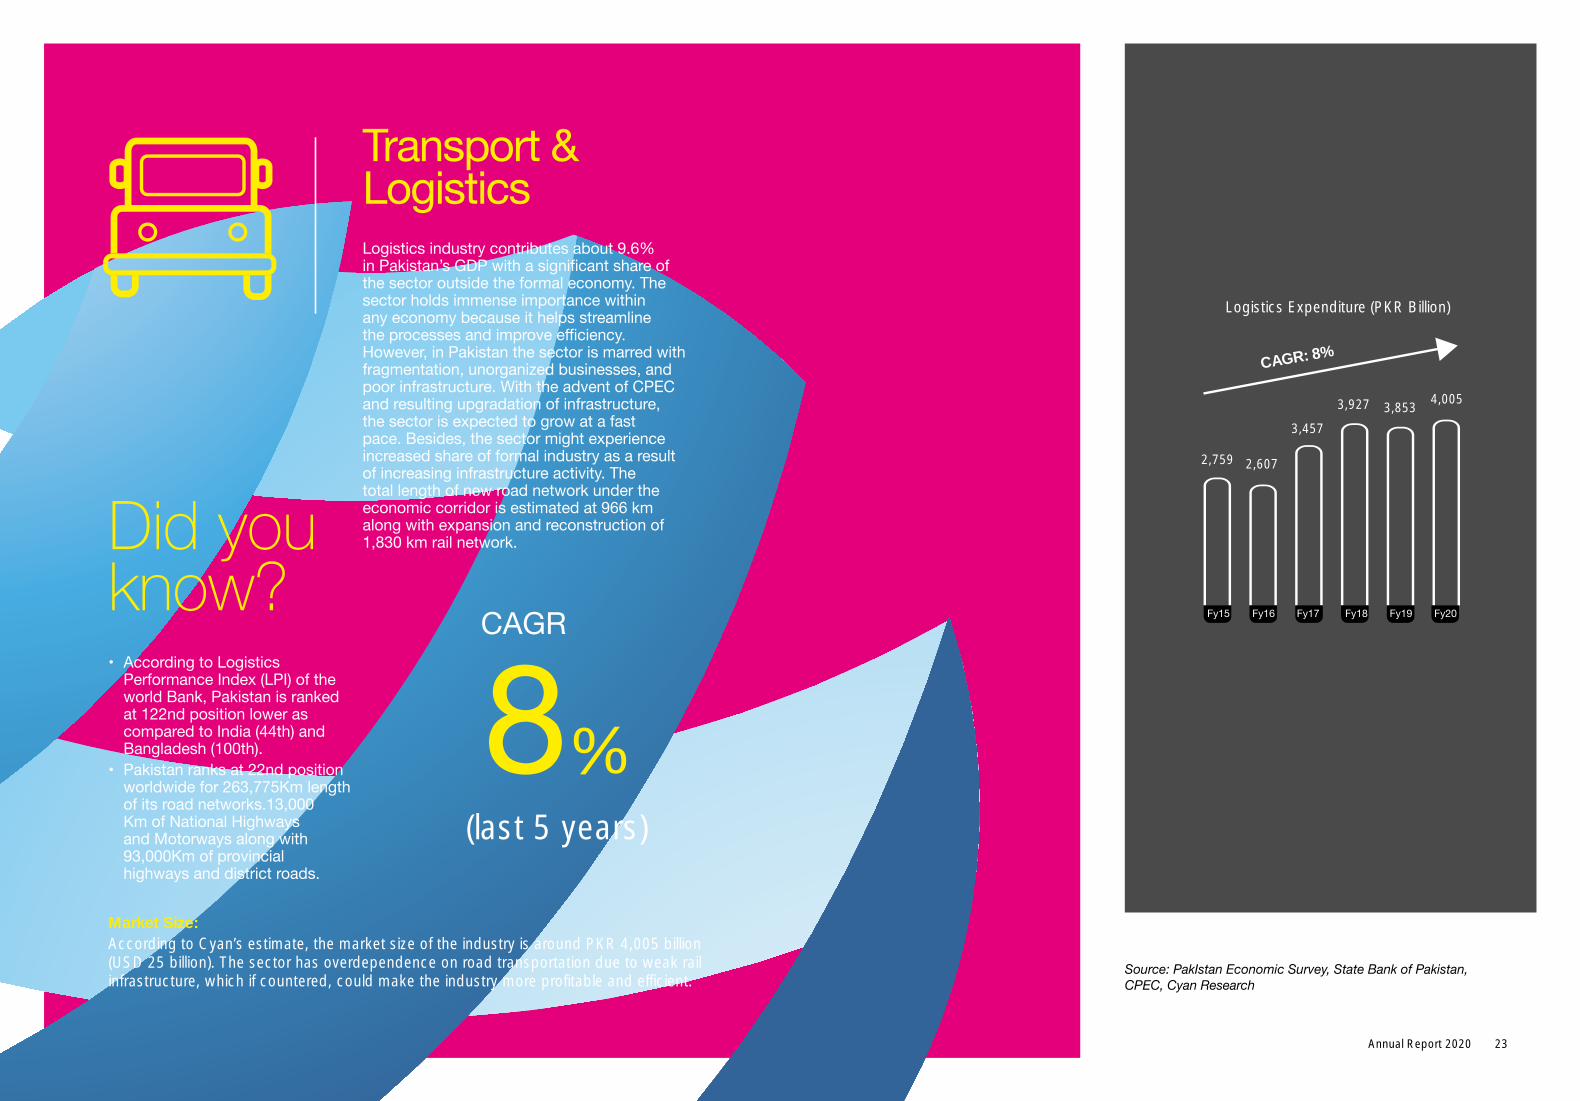
Source: PakIstan Economic Survey, State Bank of Pakistan, CPEC, Cyan Research
• AccordingtoLogisticsPerformanceIndex(LPI)oftheworld Bank, Pakistan is ranked at 122nd position lower as compared to India (44th) and Bangladesh (100th).
• Pakistanranksat22ndpositionworldwide for 263,775Km length of its road networks.13,000 Km of National Highways and Motorways along with 93,000Km of provincial highways and district roads.
Did you know?
According to Cyan’s estimate, the market size of the industry is around PKR 4,005 billion (USD 25 billion). The sector has overdependence on road transportation due to weak rail infrastructure, which if countered, could make the industry more profitable and efficient.
CAGR
8%(last 5 years)
Market Size:
Transport & LogisticsLogisticsindustrycontributesabout9.6%inPakistan’sGDPwithasignificantshareofthe sector outside the formal economy. The sector holds immense importance within any economy because it helps streamline theprocessesandimproveefficiency.However, in Pakistan the sector is marred with fragmentation, unorganized businesses, and poor infrastructure. With the advent of CPEC and resulting upgradation of infrastructure, the sector is expected to grow at a fast pace. Besides, the sector might experience increased share of formal industry as a result of increasing infrastructure activity. The total length of new road network under the economic corridor is estimated at 966 km along with expansion and reconstruction of 1,830 km rail network.
Logistics Expenditure (PKR Billion)
Logistics
CAGR: 8%
2,759 2,607
3,457
3,927 3,8534,005
Fy15 Fy16 Fy17 Fy18 Fy19 Fy20
23Annual Report 2020
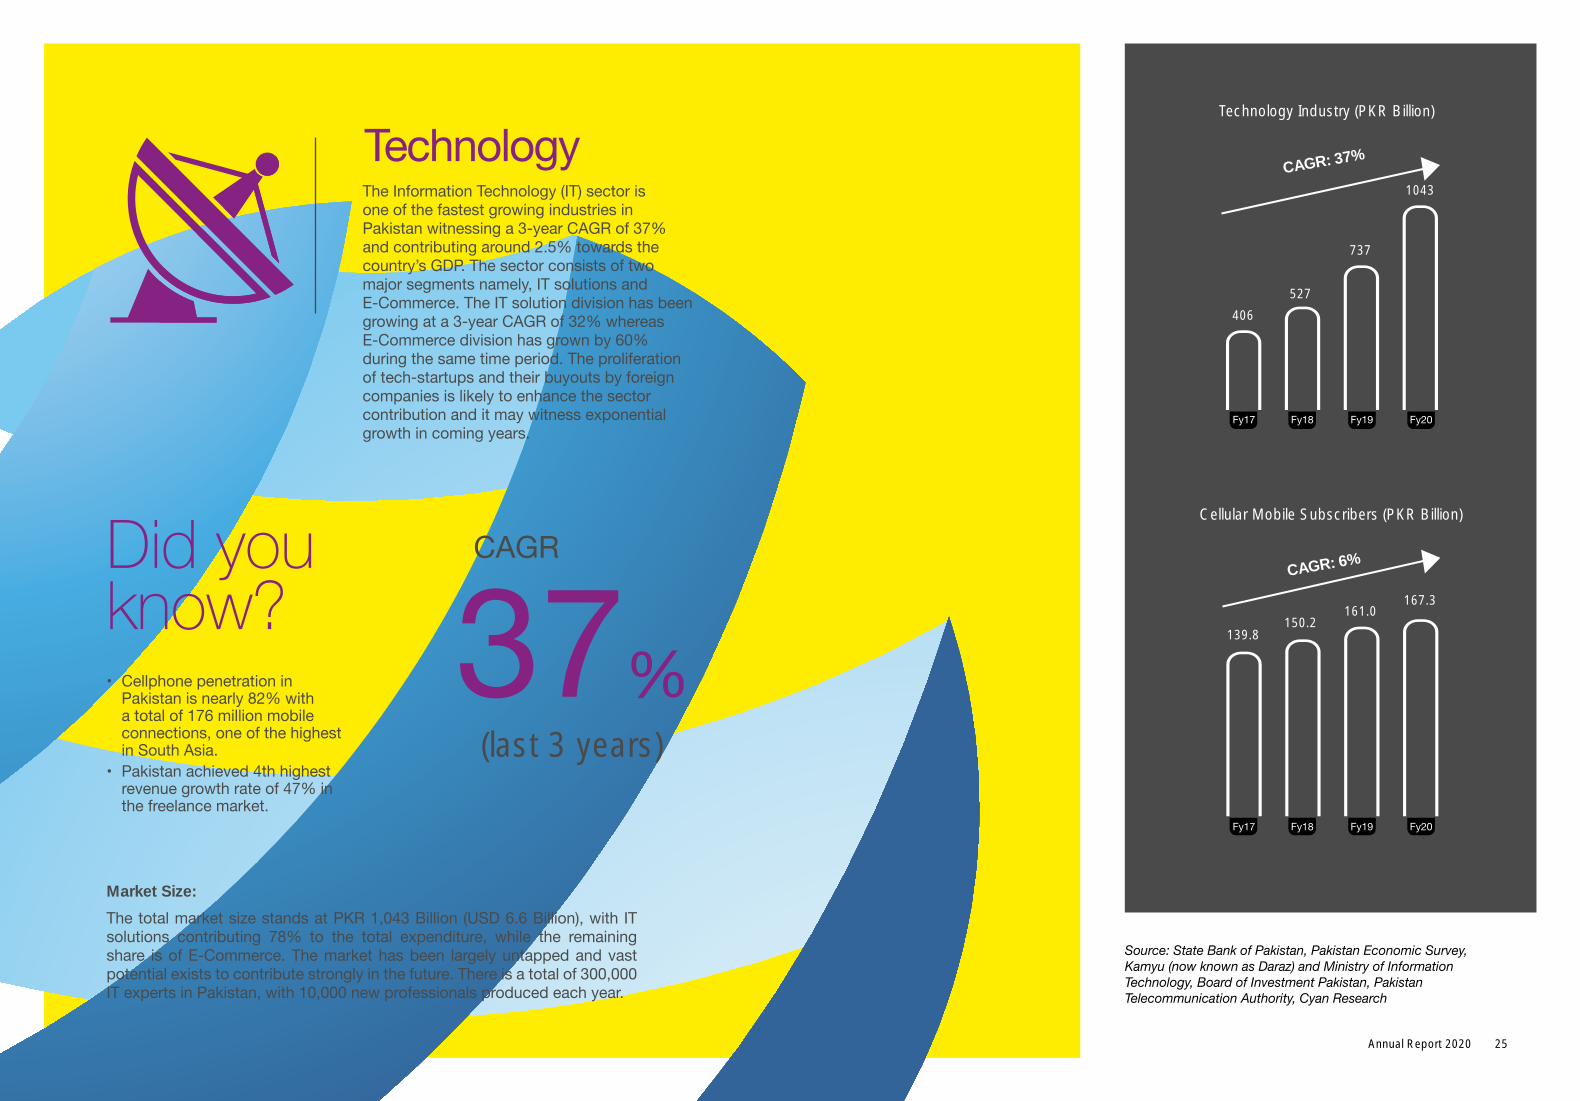
Technology Industry (PKR Billion)
Cellular Mobile Subscribers (PKR Billion)
Technology
Technology
CAGR: 37%
CAGR: 6%
406
139.8
527
150.2
737
161.0
1043
167.3
Fy17
Fy17
Fy18
Fy18
Fy19
Fy19
Fy20
Fy20
Source: State Bank of Pakistan, Pakistan Economic Survey, Kamyu (now known as Daraz) and Ministry of Information Technology, Board of Investment Pakistan, Pakistan Telecommunication Authority, Cyan Research
The Information Technology (IT) sector is one of the fastest growing industries in Pakistan witnessing a 3-year CAGR of 37% and contributing around 2.5% towards the country’s GDP. The sector consists of two major segments namely, IT solutions and E-Commerce. The IT solution division has been growing at a 3-year CAGR of 32% whereas E-Commerce division has grown by 60% during the same time period. The proliferation of tech-startups and their buyouts by foreign companies is likely to enhance the sector contribution and it may witness exponential growth in coming years.
Technology
• CellphonepenetrationinPakistan is nearly 82% with a total of 176 million mobile connections, one of the highest in South Asia.
• Pakistanachieved4thhighestrevenue growth rate of 47% in the freelance market.
Did you know?
The total market size stands at PKR 1,043 Billion (USD 6.6 Billion), with IT solutions contributing 78% to the total expenditure, while the remaining share is of E-Commerce. The market has been largely untapped and vast potential exists to contribute strongly in the future. There is a total of 300,000 IT experts in Pakistan, with 10,000 new professionals produced each year.
CAGR
37%(last 3 years)
Market Size:
25Annual Report 2020
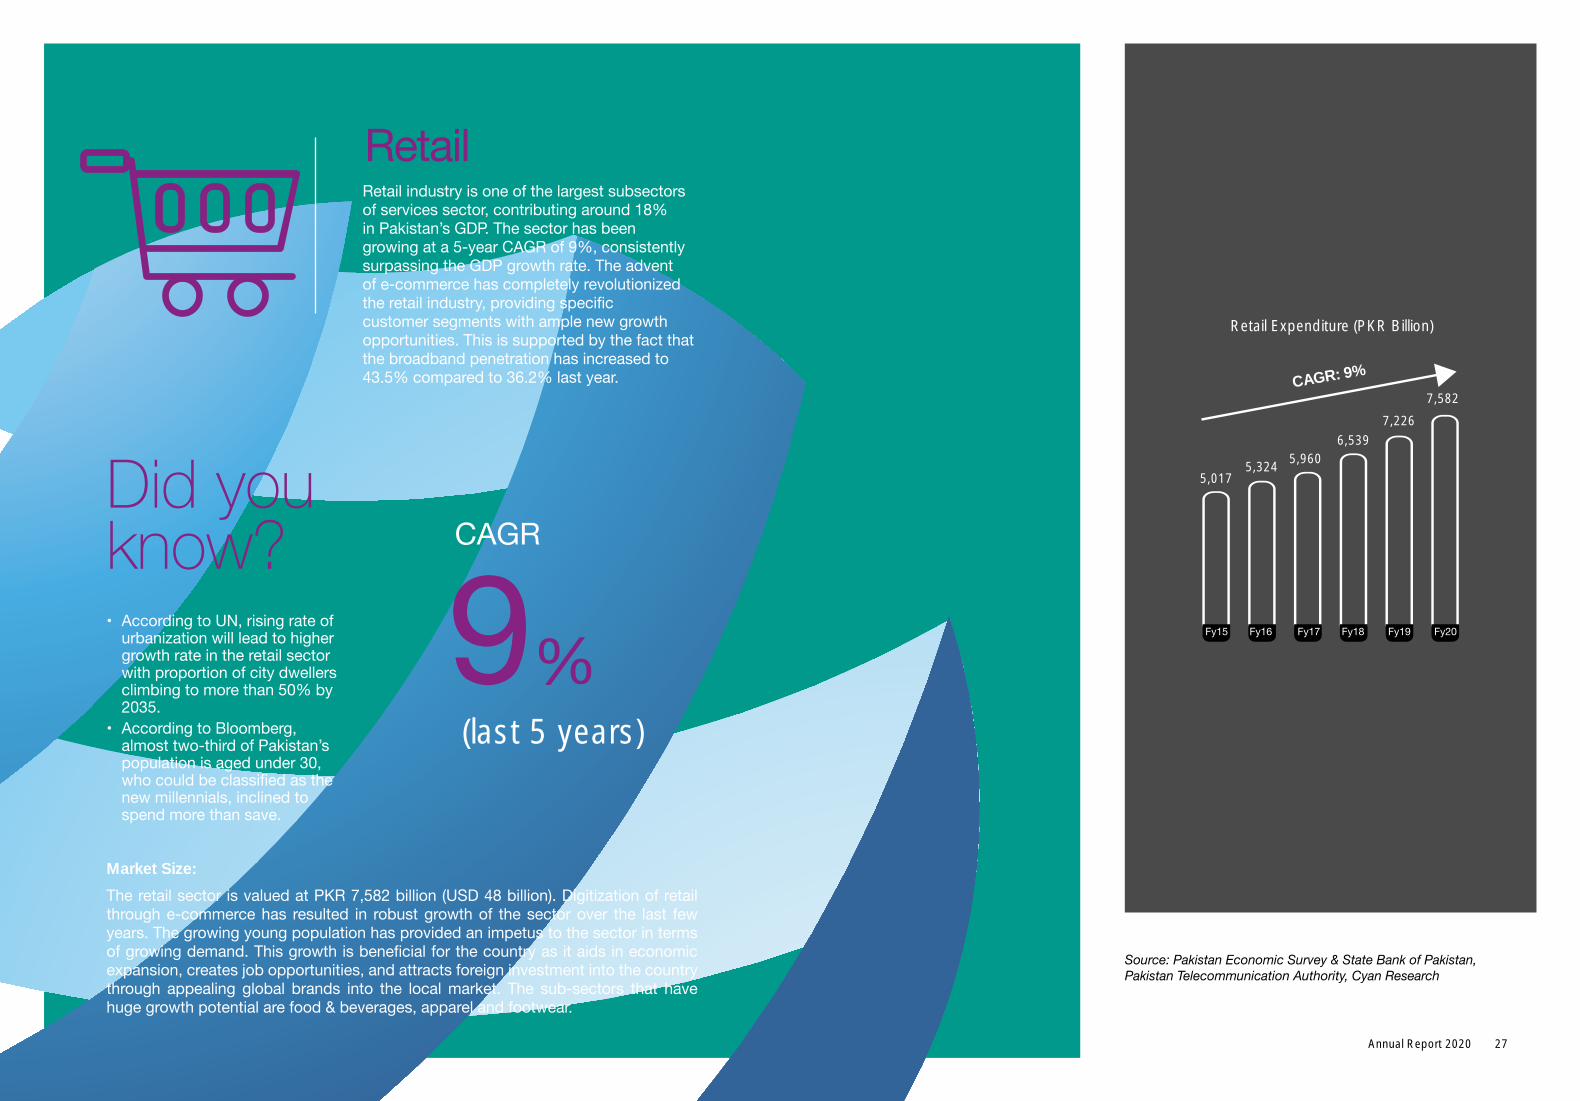
Retail Expenditure (PKR Billion)
Retail
CAGR: 9%
5,0175,324
5,9606,539
7,226
7,582
Fy17Fy15 Fy18Fy16 Fy19 Fy20
27Annual Report 2020
Source: Pakistan Economic Survey & State Bank of Pakistan, Pakistan Telecommunication Authority, Cyan Research
Retail industry is one of the largest subsectors of services sector, contributing around 18% in Pakistan’s GDP. The sector has been growing at a 5-year CAGR of 9%, consistently surpassing the GDP growth rate. The advent of e-commerce has completely revolutionized theretailindustry,providingspecificcustomer segments with ample new growth opportunities. This is supported by the fact that the broadband penetration has increased to 43.5% compared to 36.2% last year.
Retail
• AccordingtoUN,risingrateofurbanization will lead to higher growth rate in the retail sector with proportion of city dwellers climbing to more than 50% by 2035.
• AccordingtoBloomberg,almost two-third of Pakistan’s population is aged under 30, whocouldbeclassifiedasthenew millennials, inclined to spend more than save.
Did you know?
The retail sector is valued at PKR 7,582 billion (USD 48 billion). Digitization of retail through e-commerce has resulted in robust growth of the sector over the last few years. The growing young population has provided an impetus to the sector in terms ofgrowingdemand.Thisgrowthisbeneficialforthecountryasitaidsineconomicexpansion, creates job opportunities, and attracts foreign investment into the country through appealing global brands into the local market. The sub-sectors that have huge growth potential are food & beverages, apparel and footwear.
CAGR
9%(last 5 years)
Market Size:
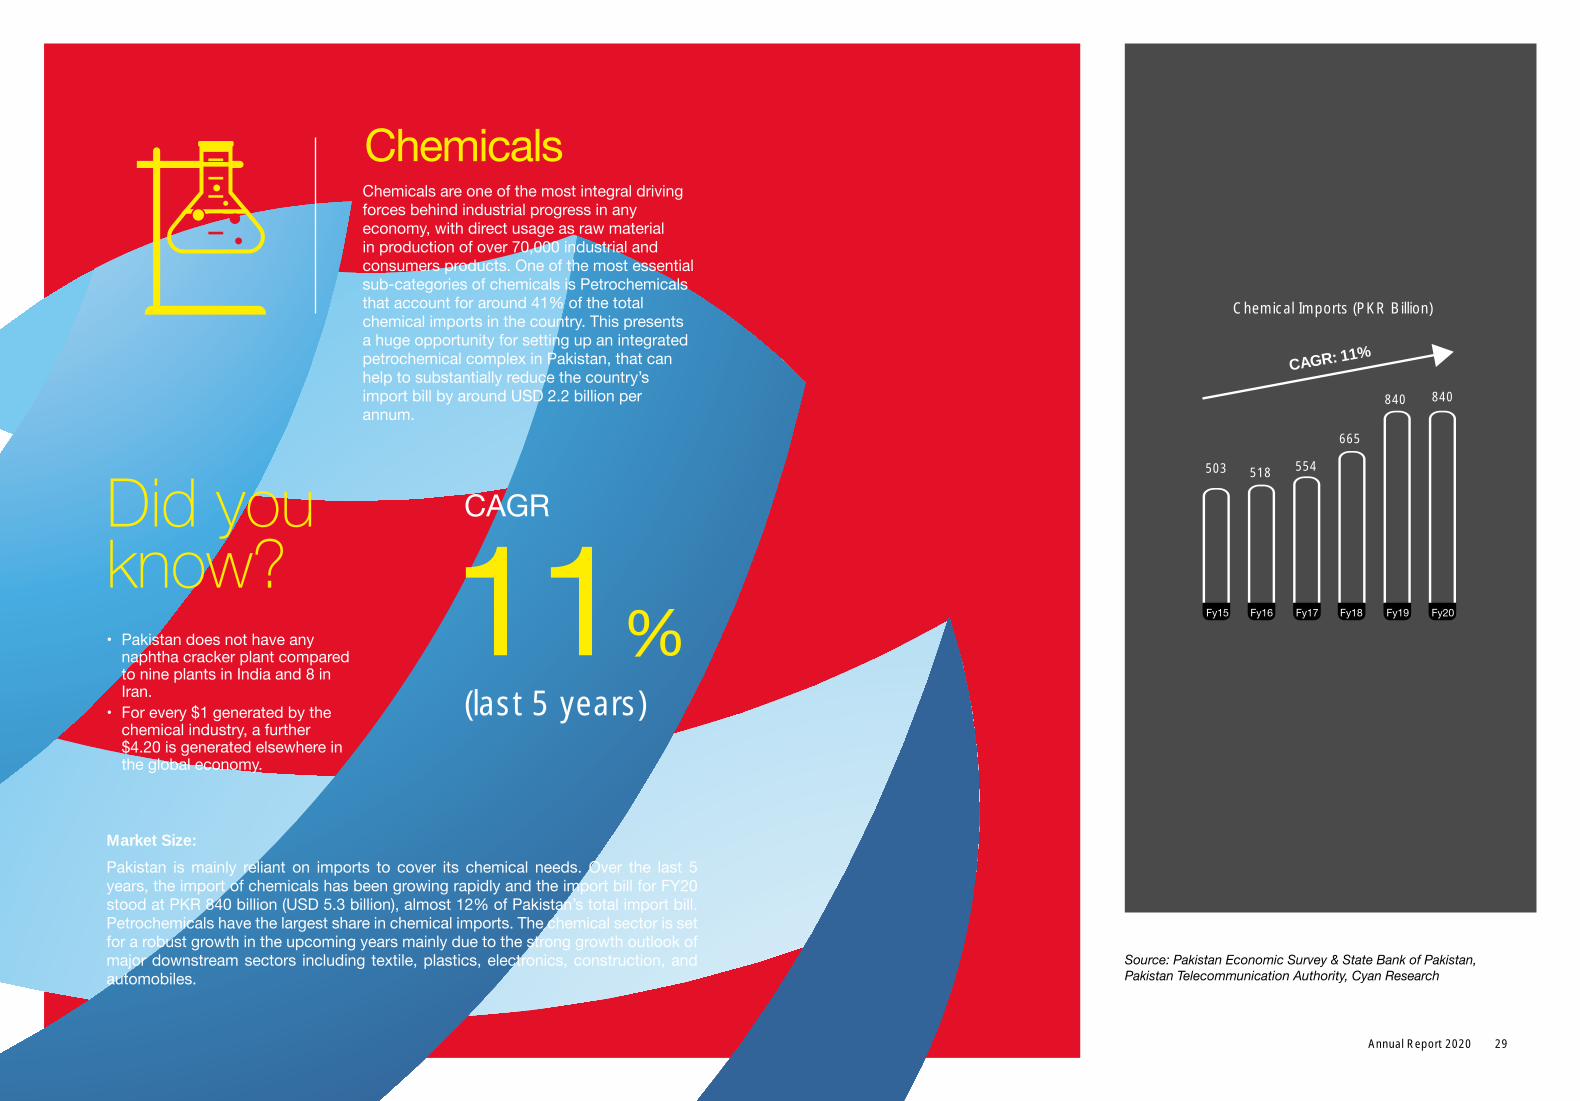
Chemical Imports (PKR Billion)
Chemicals
CAGR: 11%
503 518 554
665
840 840
Fy17Fy15 Fy18Fy16 Fy19 Fy20
29Annual Report 2020
Source: Pakistan Economic Survey & State Bank of Pakistan, Pakistan Telecommunication Authority, Cyan Research
Chemicals are one of the most integral driving forces behind industrial progress in any economy, with direct usage as raw material in production of over 70,000 industrial and consumers products. One of the most essential sub-categories of chemicals is Petrochemicals that account for around 41% of the total chemical imports in the country. This presents a huge opportunity for setting up an integrated petrochemical complex in Pakistan, that can help to substantially reduce the country’s import bill by around USD 2.2 billion per annum.
Chemicals
• Pakistandoesnothaveanynaphtha cracker plant compared to nine plants in India and 8 in Iran.
• Forevery$1generatedbythechemical industry, a further $4.20isgeneratedelsewhereinthe global economy.
Did you know?
Pakistan is mainly reliant on imports to cover its chemical needs. Over the last 5 years, the import of chemicals has been growing rapidly and the import bill for FY20 stood at PKR 840 billion (USD 5.3 billion), almost 12% of Pakistan’s total import bill. Petrochemicals have the largest share in chemical imports. The chemical sector is set for a robust growth in the upcoming years mainly due to the strong growth outlook of major downstream sectors including textile, plastics, electronics, construction, and automobiles.
CAGR
11%(last 5 years)
Market Size:
Notice of the 61st Annual General Meeting
Notice is hereby given that the sixty first (61st) Annual General Meeting (AGM) of Cyan Limited will be held at 11:30 a.m. on Wednesday the March 31, 2021 virtually via video link facility to transact the following businesses:
ORDINARY BUSINESS
1. To receive, consider and adopt the Audited Financial Statements of the Company for the year ended December 31, 2020 together with the Auditors’ and Directors’ Reports thereon and Chairman’s Review Report.
2. To approve the payment of final cash dividend at the rate of Rs. 5/- per share i.e. 50% for the year ended December 31, 2020 as recommended by the Board of Directors.
3. To appoint Auditors for the year ending December 31, 2021 and to fix their remuneration.
4. To transact any other business with the permission of the Chair.
By order of the Board
AHSAN IQBALKarachi, March 10, 2021 Company Secretary
NOTES:
CORONAVIRUSCONTINGENCYPLANNING
• In pursuance of SECP’s Circular No. 5 dated March 17, 2020, Circular No. 10 dated April 1, 2020, Circular No.33 dated November 05, 2020, Circular No. 4 of 2021 dated February 15, 2021 and Circular No. 6 of 2021 dated March 04, 2021 respectively pertaining to Regulatory Relief to dilute the impact of Corona Virus (COVID 19) for the Corporate Sector, Companies have been advised to modify their usual planning for annual general meetings for the well-being of the shareholders and avoid large gatherings by provision of video link facilities.
• Considering the restriction imposed by the Government on public gatherings and SECP’s directives, the Company intends to convene this AGM virtually via video link facilities
managed from the Registered Office of the Company, Dawood Centre, M.T. Khan Road, Karachi for the safety and well-being of the shareholders of the Company. The general meeting can be attended using smart phones/tablets/computers while ensuring compliance with the quorum requirements and requests the Members to consolidate their virtual attendance and voting at the AGM through proxies. We recognize that our shareholders value the AGM as an opportunity to engage with the Board; however, the Company must ensure to put safety first and protect all stakeholders in these exceptional circumstances.
• To attend the AGM through video-link, Members are required to register their particulars by sending an email at [email protected]. The Members registering to connect through video-link facility are required to mention their Name, Folio Number, valid email address and Number of Shares held in their name in the email with subject ‘Registration for CYAN’s AGM’. Video link and login credentials will be shared with those Members whose emails, containing all the required particulars, are received at the given email address before (5:00 p.m.) on March 22, 2021. Shareholders can also provide their comments and questions for the agenda items of the AGM on the same email address.
Notice of Closure of Share Transfer Books for Attending AGM and Dividend Entitlement
The Share transfer books of the Company will remain closed from Thursday March 25, 2021 to Wednesday March 31, 2021 (both days inclusive). Transfers received in order at the office of our Registrar, M/s. CDC Share Registrar Services Limited, CDC House-99B, Block ‘B’, S.M.C.H.S., main Shahrah–e-Faisal, Karachi-74000, by the close of business (5:00 p.m.) on Wednesday March 24, 2021 will be treated in time for the purpose of payment of final cash dividend to the transferees and to attend and vote at the AGM.
Participation in the Annual General Meeting
A member entitled to attend and vote at the meeting may appoint any other member as his/her proxy to attend and vote. A Corporation being a member may appoint any person, whether or not a member of the
Company, as its Proxy. A Proxy, duly appointed, shall have such rights as respects speaking and voting at the Meeting as are available to a member.
In order to be effective, Proxy Forms, duly filled and signed, must be received at the Registered Office of the Company, not less than forty-eight (48) working hours before the Meeting. A blank Proxy Form is attached at the end of the report.
CDC account holders will further have to follow the under-mentioned guidelines as laid down by the Securities and Exchange Commission of Pakistan:
A. For Attending the Meeting
i. In case of individuals, the account holders or sub-account holders whose registration details are uploaded as per the Regulations shall authenticate his/her original valid Computerized National Identity Card (CNIC) or the original passport at the time of attending the meeting.
ii. In case of corporate entity, the Board of Directors’ resolution /power of attorney with specimen signature of the nominee shall be produced (unless it has been provided earlier) at the time of the meeting.
B. For Appointing Proxies
i. In case of individuals, the account holders or sub-account holders whose registration details are uploaded as per the Regulations shall submit the proxy form as per the above requirement.
ii. Attested copies of valid CNIC or the passport of the beneficial owners and the Proxy shall be furnished with the Proxy Form.
iii. The proxy shall produce original valid CNIC or original passport at the time of the meeting.
iv. In case of corporate entity, the Board of Directors’ resolution /power of attorney with specimen signature shall be submitted (unless it has been provided earlier) along
with the proxy form to the Company.
v. Proxy form will be witnessed by two persons whose names, addresses and valid CNIC numbers shall be mentioned on the forms.
Deduction of Income Tax from Dividend under Section 150 of the Income Tax Ordinance, 2001 (“Income tax Ordinance”)
The rate of deduction of withholding tax is 15% for filers and non-filers as prescribed under:
a. For filers (persons whose names are appearing in Active Taxpayers List): 15%
a. For non-filer (persons whose names are not appearing in Active Taxpayers List): 30%
Deposit of Physical Shares into CDC Accounts
As per Section 72 of the Companies Act, 2017 every existing company shall be required to replace its physical shares with book-entry form in a manner as may be specified and from the date notified by the Commission, within a period not exceeding four years from the commencement of the Companies Act, 2017 i.e. May 30, 2017.
The shareholder having physical shareholding may open CDC sub-account with any of the brokers or investor’s account directly with the CDC to place their physical shares into scrip-less form. This will facilitate them in many ways including safe custody and sale of shares, anytime they want as the trading of physical shares is not permitted as per existing Regulations of the Pakistan Stock Exchange limited.
Postal Ballot and E-Voting
Pursuant to the Companies (Postal Ballot) Regulations, 2018 for the purpose of election of directors and for any other agenda item subject to the requirements of sections 143 and 144 of the Companies Act, 2017, members will be allowed to exercise their right of vote through postal ballot, that is voting by post or through any electronic mode, in accordance with the requirments and procedure contained in the aforesaid Regulations.
31Annual Report 202030 Cyan Limited
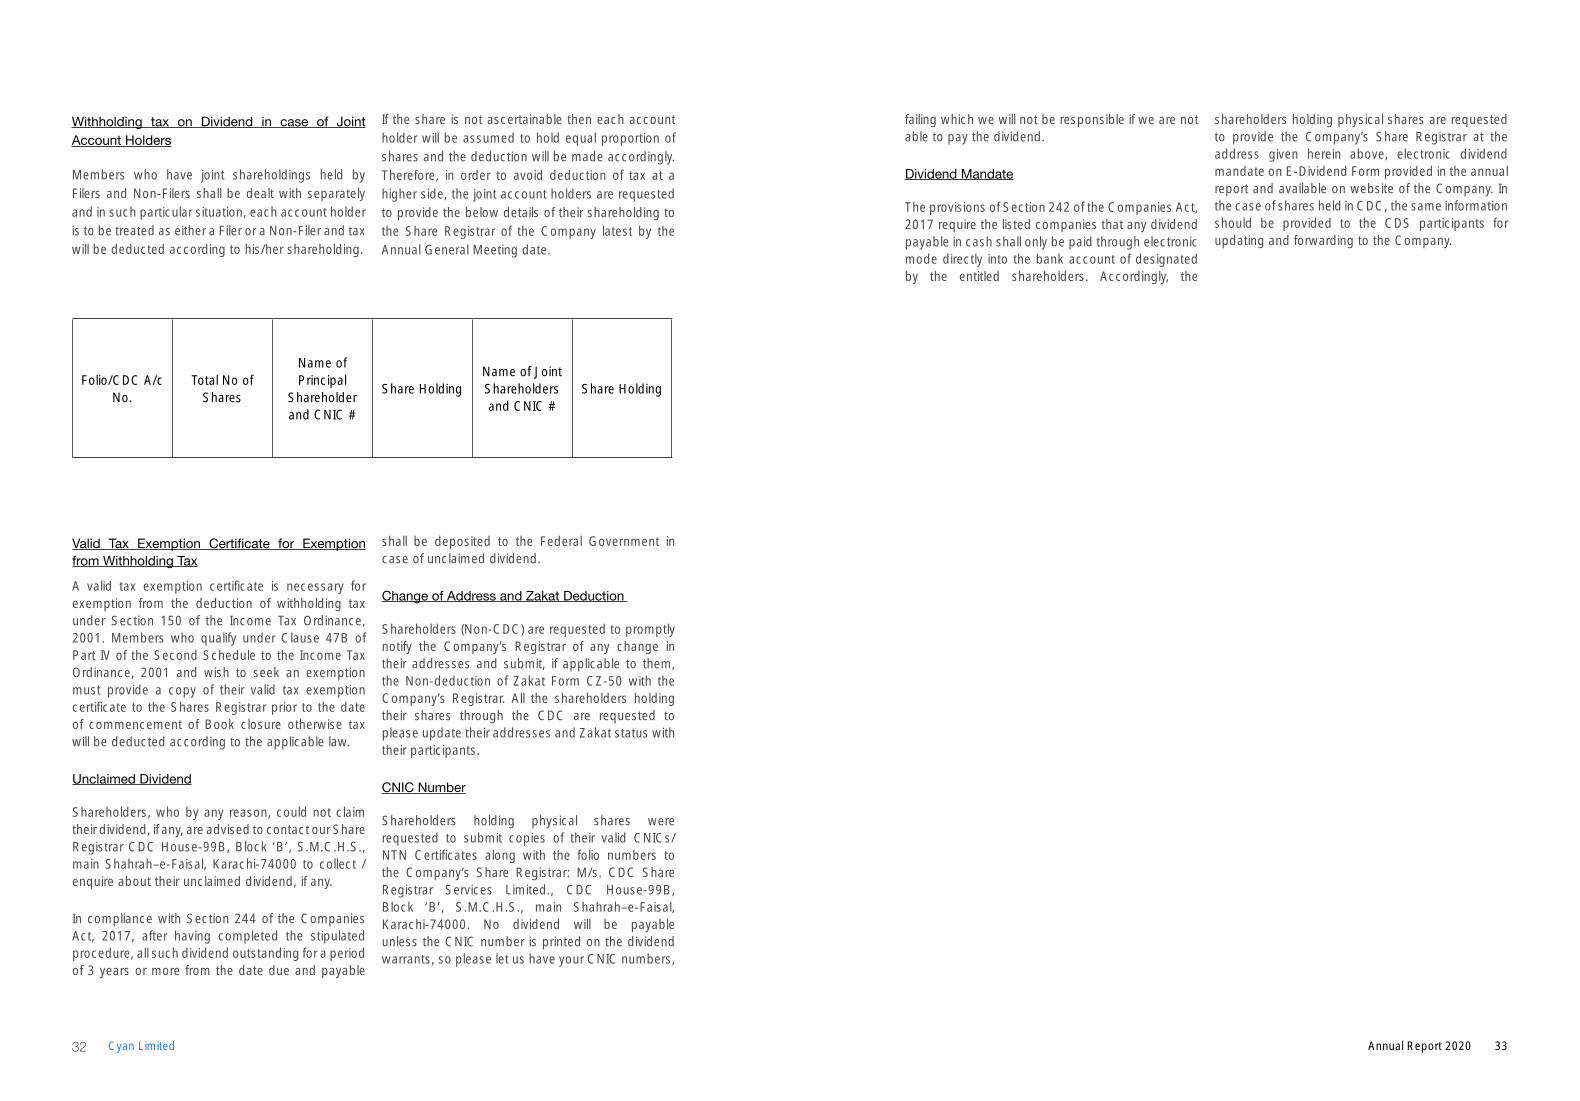
Folio/CDC A/c No.
Total No of Shares
Name of Principal
Shareholder and CNIC #
Share HoldingName of Joint Shareholders and CNIC #
Share Holding
Valid Tax Exemption Certificate for Exemptionfrom Withholding Tax
A valid tax exemption certificate is necessary for exemption from the deduction of withholding tax under Section 150 of the Income Tax Ordinance, 2001. Members who qualify under Clause 47B of Part IV of the Second Schedule to the Income Tax Ordinance, 2001 and wish to seek an exemption must provide a copy of their valid tax exemption certificate to the Shares Registrar prior to the date of commencement of Book closure otherwise tax will be deducted according to the applicable law.
Unclaimed Dividend
Shareholders, who by any reason, could not claim their dividend, if any, are advised to contact our Share Registrar CDC House-99B, Block ‘B’, S.M.C.H.S., main Shahrah–e-Faisal, Karachi-74000 to collect / enquire about their unclaimed dividend, if any.
In compliance with Section 244 of the Companies Act, 2017, after having completed the stipulated procedure, all such dividend outstanding for a period of 3 years or more from the date due and payable
shall be deposited to the Federal Government in case of unclaimed dividend.
Change of Address and Zakat Deduction
Shareholders (Non-CDC) are requested to promptly notify the Company’s Registrar of any change in their addresses and submit, if applicable to them, the Non-deduction of Zakat Form CZ-50 with the Company’s Registrar. All the shareholders holding their shares through the CDC are requested to please update their addresses and Zakat status with their participants.
CNIC Number
Shareholders holding physical shares were requested to submit copies of their valid CNICs/NTN Certificates along with the folio numbers to the Company’s Share Registrar: M/s. CDC Share Registrar Services Limited., CDC House-99B, Block ‘B’, S.M.C.H.S., main Shahrah–e-Faisal, Karachi-74000. No dividend will be payable unless the CNIC number is printed on the dividend warrants, so please let us have your CNIC numbers,
Withholding tax on Dividend in case of Joint Account Holders
Members who have joint shareholdings held by Filers and Non-Filers shall be dealt with separately and in such particular situation, each account holder is to be treated as either a Filer or a Non-Filer and tax will be deducted according to his/her shareholding.
If the share is not ascertainable then each account holder will be assumed to hold equal proportion of shares and the deduction will be made accordingly. Therefore, in order to avoid deduction of tax at a higher side, the joint account holders are requested to provide the below details of their shareholding to the Share Registrar of the Company latest by the Annual General Meeting date.
failing which we will not be responsible if we are not able to pay the dividend.
Dividend Mandate
The provisions of Section 242 of the Companies Act, 2017 require the listed companies that any dividend payable in cash shall only be paid through electronic mode directly into the bank account of designated by the entitled shareholders. Accordingly, the
shareholders holding physical shares are requested to provide the Company’s Share Registrar at the address given herein above, electronic dividend mandate on E-Dividend Form provided in the annual report and available on website of the Company. In the case of shares held in CDC, the same information should be provided to the CDS participants for updating and forwarding to the Company.
33Annual Report 202032 Cyan Limited
The Board of Directors is pleased to present the 61st Annual Report of the company together with the audited financial statements for the financial year ended December 31, 2020.
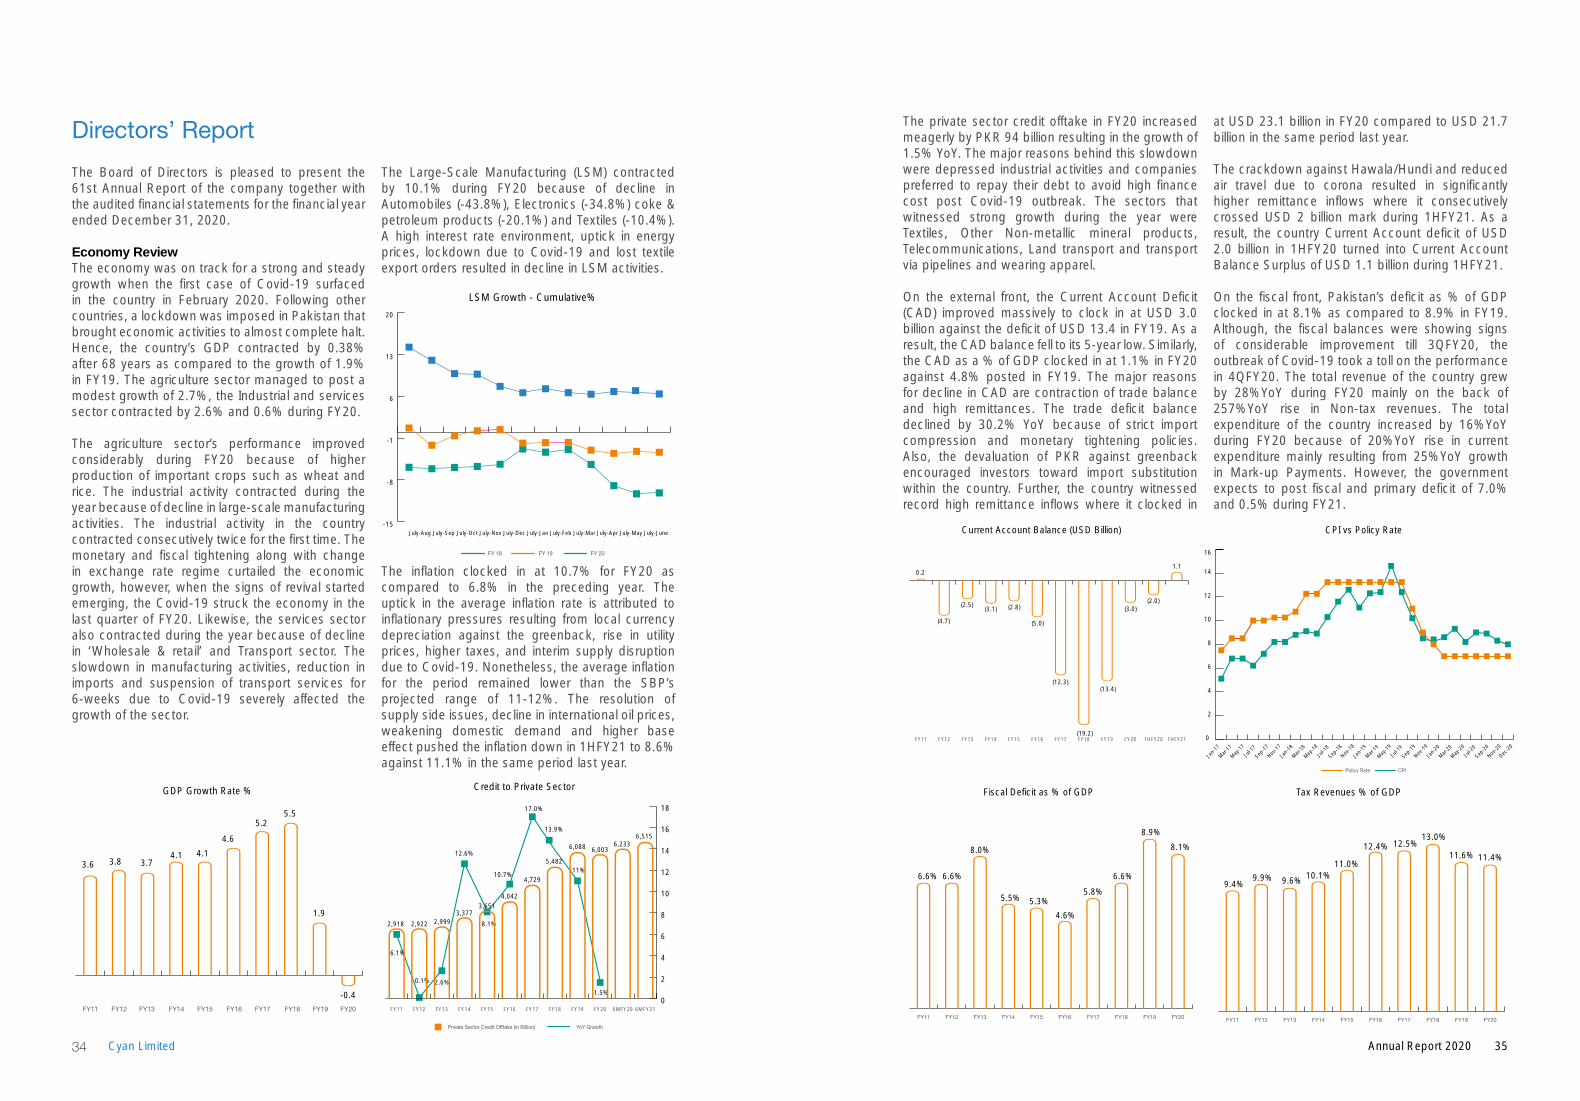
Economy ReviewThe economy was on track for a strong and steady growth when the first case of Covid-19 surfaced in the country in February 2020. Following other countries, a lockdown was imposed in Pakistan that brought economic activities to almost complete halt. Hence, the country’s GDP contracted by 0.38% after 68 years as compared to the growth of 1.9% in FY19. The agriculture sector managed to post a modest growth of 2.7%, the Industrial and services sector contracted by 2.6% and 0.6% during FY20.
The agriculture sector’s performance improved considerably during FY20 because of higher production of important crops such as wheat and rice. The industrial activity contracted during the year because of decline in large-scale manufacturing activities. The industrial activity in the country contracted consecutively twice for the first time. The monetary and fiscal tightening along with change in exchange rate regime curtailed the economic growth, however, when the signs of revival started emerging, the Covid-19 struck the economy in the last quarter of FY20. Likewise, the services sector also contracted during the year because of decline in ‘Wholesale & retail’ and Transport sector. The slowdown in manufacturing activities, reduction in imports and suspension of transport services for 6-weeks due to Covid-19 severely affected the growth of the sector.
The Large-Scale Manufacturing (LSM) contracted by 10.1% during FY20 because of decline in Automobiles (-43.8%), Electronics (-34.8%) coke & petroleum products (-20.1%) and Textiles (-10.4%). A high interest rate environment, uptick in energy prices, lockdown due to Covid-19 and lost textile export orders resulted in decline in LSM activities.
The inflation clocked in at 10.7% for FY20 as compared to 6.8% in the preceding year. The uptick in the average inflation rate is attributed to inflationary pressures resulting from local currency depreciation against the greenback, rise in utility prices, higher taxes, and interim supply disruption due to Covid-19. Nonetheless, the average inflation for the period remained lower than the SBP’s projected range of 11-12%. The resolution of supply side issues, decline in international oil prices, weakening domestic demand and higher base effect pushed the inflation down in 1HFY21 to 8.6% against 11.1% in the same period last year.
Directors’ Report
FY11 FY12 FY13 FY14 FY15 FY16 FY17 FY18 FY19 FY20
GDP Growth Rate %
3.6 3.8 3.74.1 4.1
4.6
5.25.5
1.9
-0.4
LSM Growth - Cumulative%
FY 19
-15
-8
-1
6
13
20
July - JuneJuly - MayJuly - AprJuly - MarJuly - FebJuly - JanJuly - DecJuly - NovJuly - OctJuly - SepJuly - AugJuly
FY 18 FY 20
July-Aug July-Sep July-Oct July-Nov July-Dec July-Jan July-Feb July-Mar July-Apr July-May July-June
Credit to Private Sector
0
2
4
6
8
10
12
14
16
18
6.1%
0.1% 2.6%
12.6%
8.1%
10.7%
17.0%
13.9%
11%
1.5%
2,918 2,922 2,9993,377
3,651
4,729
5,482
6MFY216MFY20FY20FY19FY18FY17FY16FY15FY14FY13FY12FY11
6,088 6,0036,233
6,515
4,042
Private Sector Credit Offtake (in Billion) YoY Growth
The private sector credit offtake in FY20 increased meagerly by PKR 94 billion resulting in the growth of 1.5% YoY. The major reasons behind this slowdown were depressed industrial activities and companies preferred to repay their debt to avoid high finance cost post Covid-19 outbreak. The sectors that witnessed strong growth during the year were Textiles, Other Non-metallic mineral products, Telecommunications, Land transport and transport via pipelines and wearing apparel.
On the external front, the Current Account Deficit (CAD) improved massively to clock in at USD 3.0 billion against the deficit of USD 13.4 in FY19. As a result, the CAD balance fell to its 5-year low. Similarly, the CAD as a % of GDP clocked in at 1.1% in FY20 against 4.8% posted in FY19. The major reasons for decline in CAD are contraction of trade balance and high remittances. The trade deficit balance declined by 30.2% YoY because of strict import compression and monetary tightening policies. Also, the devaluation of PKR against greenback encouraged investors toward import substitution within the country. Further, the country witnessed record high remittance inflows where it clocked in
at USD 23.1 billion in FY20 compared to USD 21.7 billion in the same period last year.
The crackdown against Hawala/Hundi and reduced air travel due to corona resulted in significantly higher remittance inflows where it consecutively crossed USD 2 billion mark during 1HFY21. As a result, the country Current Account deficit of USD 2.0 billion in 1HFY20 turned into Current Account Balance Surplus of USD 1.1 billion during 1HFY21.
On the fiscal front, Pakistan’s deficit as % of GDP clocked in at 8.1% as compared to 8.9% in FY19. Although, the fiscal balances were showing signs of considerable improvement till 3QFY20, the outbreak of Covid-19 took a toll on the performance in 4QFY20. The total revenue of the country grew by 28%YoY during FY20 mainly on the back of 257%YoY rise in Non-tax revenues. The total expenditure of the country increased by 16%YoY during FY20 because of 20%YoY rise in current expenditure mainly resulting from 25%YoY growth in Mark-up Payments. However, the government expects to post fiscal and primary deficit of 7.0% and 0.5% during FY21.
Current Account Balance (USD Billion)
1HFY211HFY20FY20FY19FY18FY17FY16FY15FY14FY13FY12FY11
(3.0) (2.0)
1.1 0.2
(4.7)
(2.5) (3.1) (2.8)
(5.0)
(12.3)
(19.2)
(13.4)
Fiscal Deficit as % of GDP
FY20FY19FY18FY17FY16FY15FY14FY13FY12FY11
6.6% 6.6%
8.0%
5.5% 5.3%
4.6%
5.8%
6.6%
8.9%
8.1%
CPI vs Policy Rate
0
2
4
6
8
10
12
14
16
Policy Rate CPI
May-2
0
Jul-2
0
Sep-2
0
Nov-2
0
Dec-2
0
Mar-20
Jan-
20
Nov-1
9
Sep-1
9
Jul-1
9
May-1
9
Mar-19
Jan-
19
Nov-1
8
Sep-1
8
Jul-1
8
May-1
8
Mar-18
Jan-
18
Nov-1
7
Sep-1
7
Jul-1
7
May-1
7
Mar-17
Jan-
17
Tax Revenues % of GDP
FY20FY19FY18FY17FY16FY15FY14FY13FY12FY11
9.4%9.9% 9.6% 10.1%
11.0%
12.4% 12.5%13.0%
11.6% 11.4%
35Annual Report 202034 Cyan Limited
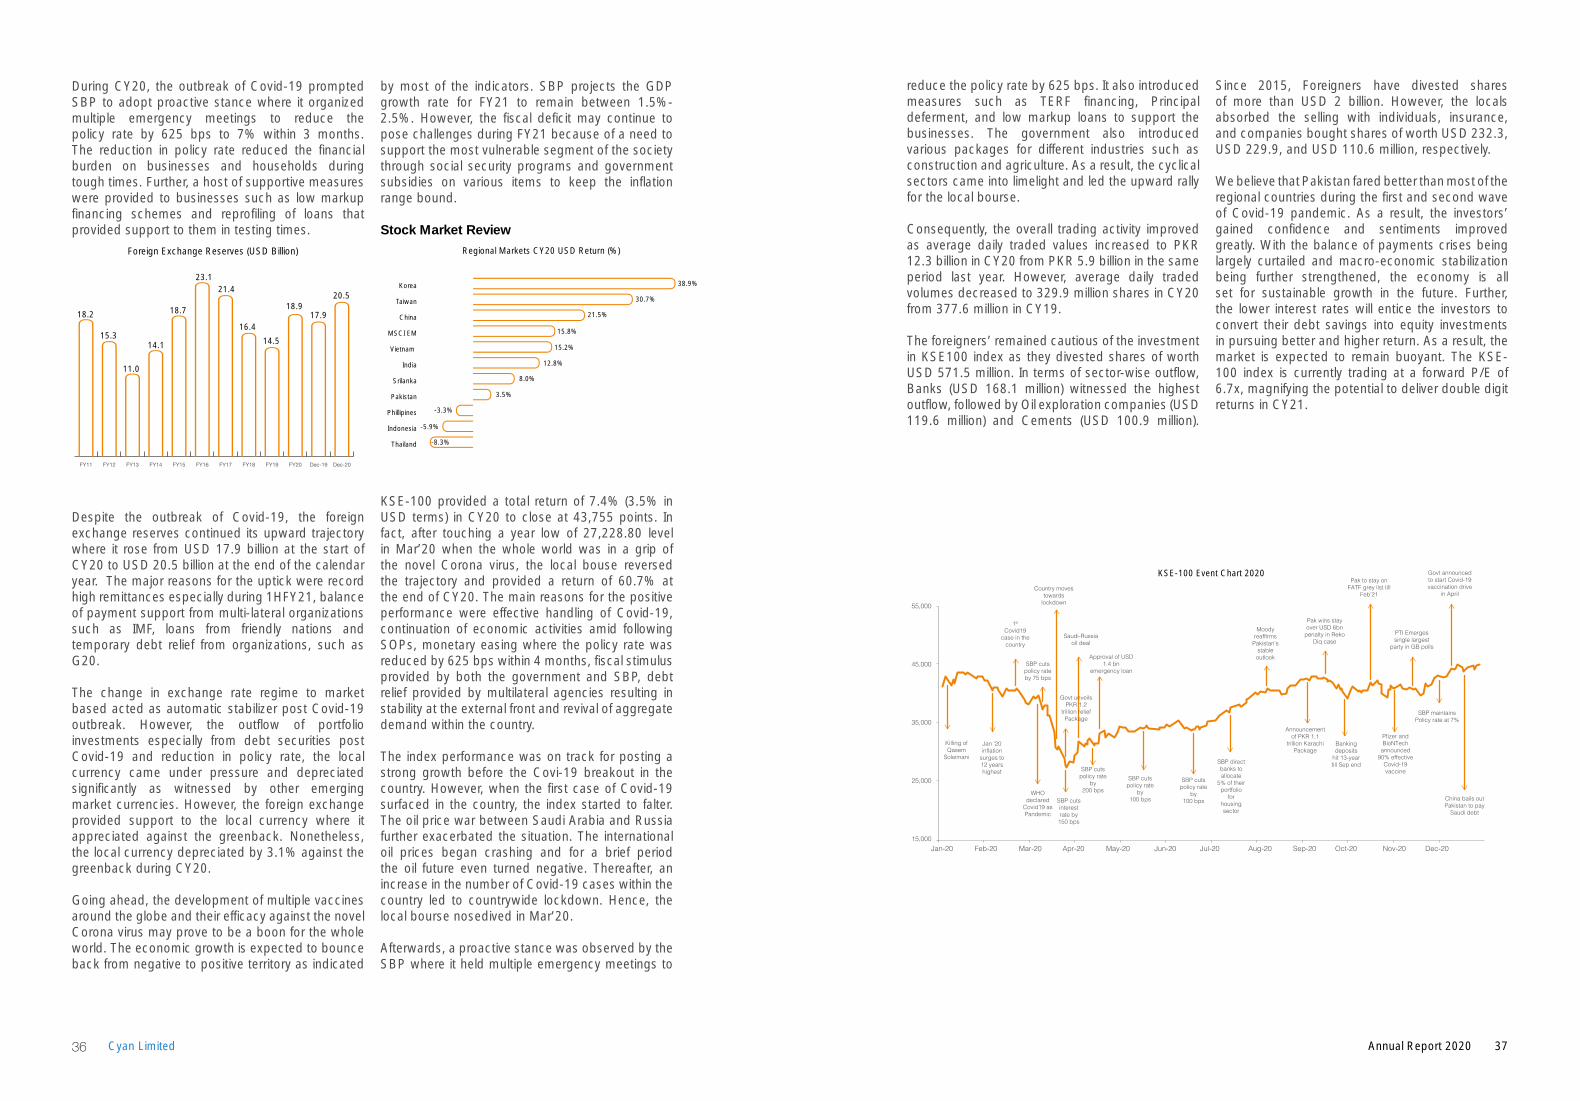
During CY20, the outbreak of Covid-19 prompted SBP to adopt proactive stance where it organized multiple emergency meetings to reduce the policy rate by 625 bps to 7% within 3 months. The reduction in policy rate reduced the financial burden on businesses and households during tough times. Further, a host of supportive measures were provided to businesses such as low markup financing schemes and reprofiling of loans that provided support to them in testing times.
Despite the outbreak of Covid-19, the foreign exchange reserves continued its upward trajectory where it rose from USD 17.9 billion at the start of CY20 to USD 20.5 billion at the end of the calendar year. The major reasons for the uptick were record high remittances especially during 1HFY21, balance of payment support from multi-lateral organizations such as IMF, loans from friendly nations and temporary debt relief from organizations, such as G20.
The change in exchange rate regime to market based acted as automatic stabilizer post Covid-19 outbreak. However, the outflow of portfolio investments especially from debt securities post Covid-19 and reduction in policy rate, the local currency came under pressure and depreciated significantly as witnessed by other emerging market currencies. However, the foreign exchange provided support to the local currency where it appreciated against the greenback. Nonetheless, the local currency depreciated by 3.1% against the greenback during CY20.
Going ahead, the development of multiple vaccines around the globe and their efficacy against the novel Corona virus may prove to be a boon for the whole world. The economic growth is expected to bounce back from negative to positive territory as indicated
by most of the indicators. SBP projects the GDP growth rate for FY21 to remain between 1.5%-2.5%. However, the fiscal deficit may continue to pose challenges during FY21 because of a need to support the most vulnerable segment of the society through social security programs and government subsidies on various items to keep the inflation range bound.
Stock Market Review
KSE-100 provided a total return of 7.4% (3.5% in USD terms) in CY20 to close at 43,755 points. In fact, after touching a year low of 27,228.80 level in Mar’20 when the whole world was in a grip of the novel Corona virus, the local bouse reversed the trajectory and provided a return of 60.7% at the end of CY20. The main reasons for the positive performance were effective handling of Covid-19, continuation of economic activities amid following SOPs, monetary easing where the policy rate was reduced by 625 bps within 4 months, fiscal stimulus provided by both the government and SBP, debt relief provided by multilateral agencies resulting in stability at the external front and revival of aggregate demand within the country.
The index performance was on track for posting a strong growth before the Covi-19 breakout in the country. However, when the first case of Covid-19 surfaced in the country, the index started to falter. The oil price war between Saudi Arabia and Russia further exacerbated the situation. The international oil prices began crashing and for a brief period the oil future even turned negative. Thereafter, an increase in the number of Covid-19 cases within the country led to countrywide lockdown. Hence, the local bourse nosedived in Mar’20.
Afterwards, a proactive stance was observed by the SBP where it held multiple emergency meetings to
reduce the policy rate by 625 bps. It also introduced measures such as TERF financing, Principal deferment, and low markup loans to support the businesses. The government also introduced various packages for different industries such as construction and agriculture. As a result, the cyclical sectors came into limelight and led the upward rally for the local bourse.
Consequently, the overall trading activity improved as average daily traded values increased to PKR 12.3 billion in CY20 from PKR 5.9 billion in the same period last year. However, average daily traded volumes decreased to 329.9 million shares in CY20 from 377.6 million in CY19.
The foreigners’ remained cautious of the investment in KSE100 index as they divested shares of worth USD 571.5 million. In terms of sector-wise outflow, Banks (USD 168.1 million) witnessed the highest outflow, followed by Oil exploration companies (USD 119.6 million) and Cements (USD 100.9 million).
Since 2015, Foreigners have divested shares of more than USD 2 billion. However, the locals absorbed the selling with individuals, insurance, and companies bought shares of worth USD 232.3, USD 229.9, and USD 110.6 million, respectively.
We believe that Pakistan fared better than most of the regional countries during the first and second wave of Covid-19 pandemic. As a result, the investors’ gained confidence and sentiments improved greatly. With the balance of payments crises being largely curtailed and macro-economic stabilization being further strengthened, the economy is all set for sustainable growth in the future. Further, the lower interest rates will entice the investors to convert their debt savings into equity investments in pursuing better and higher return. As a result, the market is expected to remain buoyant. The KSE-100 index is currently trading at a forward P/E of 6.7x, magnifying the potential to deliver double digit returns in CY21.
Foreign Exchange Reserves (USD Billion)
Dec-20Dec-19FY20FY19FY18FY17FY16FY15FY14FY13FY12FY11
18.917.9
20.5
18.2
15.3
11.0
14.1
18.7
23.121.4
16.4
14.5
Regional Markets CY20 USD Return (%)
Thailand
Indonesia
Phillipines
Pakistan
Srilanka
India
Vietnam
MSCI EM
China
Taiwan
Korea 38.9%
30.7%
21.5%
15.8%
15.2%
12.8%
8.0%
3.5%
-3.3%
-5.9%
-8.3%
Killing ofQasem
Soleimani
1st
Covid19case in the
country
Country movestowards
lockdown
Saudi-Russia oil deal
Approval of USD1.4 bn
emergency loan
Moodyreaffirms
Pakistan’sstableoutlook
Pak wins stayover USD 6bn
penalty in RekoDiq case
Pak to stay on FATF grey list till
Feb’21
PTI Emerges single largest
party in GB polls
SBP maintains Policy rate at 7%
Govt announced to start Covid-19 vaccination drive
in April
SBP cutspolicy rateby 75 bps
Jan ‘20inflation
surges to12 years highest
WHOdeclared
Covid19 asPandemic
SBP cutsinterestrate by150 bps
SBP cutspolicy rate
by200 bps
SBP cutspolicy rate
by100 bps
SBP cutspolicy rate
by100 bps
SBP directbanks toallocate
5% of theirportfolio
forhousingsector
Announcementof PKR 1.1
trillion KarachiPackage
Bankingdeposits
hit 13-yeartill Sep end
Pfizer andBioNTech
announced90% effective
Covid-19vaccine
China bails out Pakistan to pay
Saudi debt
Govt unveilsPKR 1.2
trillion reliefPackage
55,000
45,000
35,000
25,000
15,000Jan-20 Feb-20 Mar-20 Apr-20 May-20 Jun-20 Jul-20 Aug-20 Sep-20 Oct-20 Nov-20 Dec-20
KSE-100 Event Chart 2020
37Annual Report 202036 Cyan Limited
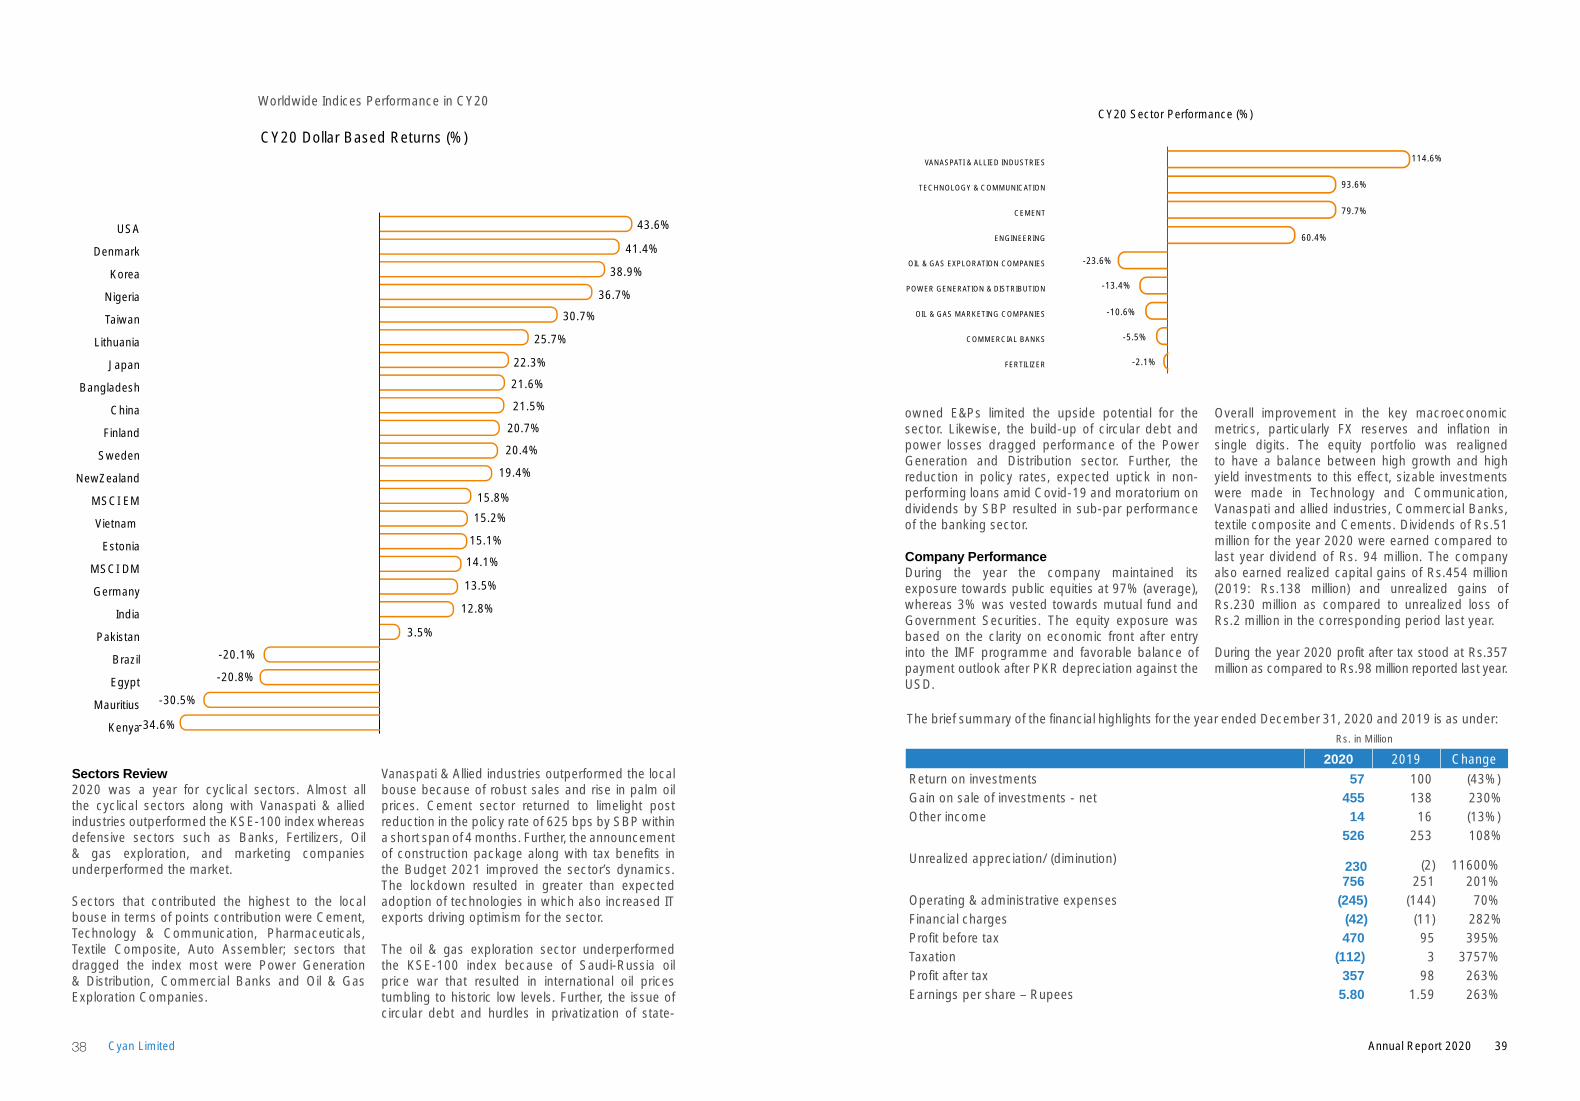
Sectors Review2020 was a year for cyclical sectors. Almost all the cyclical sectors along with Vanaspati & allied industries outperformed the KSE-100 index whereas defensive sectors such as Banks, Fertilizers, Oil & gas exploration, and marketing companies underperformed the market.
Sectors that contributed the highest to the local bouse in terms of points contribution were Cement, Technology & Communication, Pharmaceuticals, Textile Composite, Auto Assembler; sectors that dragged the index most were Power Generation & Distribution, Commercial Banks and Oil & Gas Exploration Companies.
Vanaspati & Allied industries outperformed the local bouse because of robust sales and rise in palm oil prices. Cement sector returned to limelight post reduction in the policy rate of 625 bps by SBP within a short span of 4 months. Further, the announcement of construction package along with tax benefits in the Budget 2021 improved the sector’s dynamics. The lockdown resulted in greater than expected adoption of technologies in which also increased IT exports driving optimism for the sector.
The oil & gas exploration sector underperformed the KSE-100 index because of Saudi-Russia oil price war that resulted in international oil prices tumbling to historic low levels. Further, the issue of circular debt and hurdles in privatization of state-
owned E&Ps limited the upside potential for the sector. Likewise, the build-up of circular debt and power losses dragged performance of the Power Generation and Distribution sector. Further, the reduction in policy rates, expected uptick in non-performing loans amid Covid-19 and moratorium on dividends by SBP resulted in sub-par performance of the banking sector.
Company PerformanceDuring the year the company maintained its exposure towards public equities at 97% (average), whereas 3% was vested towards mutual fund and Government Securities. The equity exposure was based on the clarity on economic front after entry into the IMF programme and favorable balance of payment outlook after PKR depreciation against the USD.
Overall improvement in the key macroeconomic metrics, particularly FX reserves and inflation in single digits. The equity portfolio was realigned to have a balance between high growth and high yield investments to this effect, sizable investments were made in Technology and Communication, Vanaspati and allied industries, Commercial Banks, textile composite and Cements. Dividends of Rs.51 million for the year 2020 were earned compared to last year dividend of Rs. 94 million. The company also earned realized capital gains of Rs.454 million (2019: Rs.138 million) and unrealized gains of Rs.230 million as compared to unrealized loss of Rs.2 million in the corresponding period last year.
During the year 2020 profit after tax stood at Rs.357 million as compared to Rs.98 million reported last year.
CY20 Sector Performance (%)
FERTILIZER
COMMERCIAL BANKS
OIL & GAS MARKETING COMPANIES
POWER GENERATION & DISTRIBUTION
OIL & GAS EXPLORATION COMPANIES
ENGINEERING
CEMENT
TECHNOLOGY & COMMUNICATION
VANASPATI & ALLIED INDUSTRIES 114.6%
93.6%
79.7%
60.4%
-23.6%
-13.4%
-10.6%
-5.5%
-2.1%
Rs. in Million
2020 2019 Change
Return on investments 57 100 (43%)Gain on sale of investments - net 455 138 230%Other income 14 16 (13%)
526 253 108%
Unrealized appreciation/ (diminution)
230 (2) 11600%756 251 201%
Operating & administrative expenses (245) (144) 70%Financial charges (42) (11) 282%Profit before tax 470 95 395%Taxation (112) 3 3757%Profit after tax 357 98 263%Earnings per share – Rupees 5.80 1.59 263%
CY20 Dollar Based Returns (%)
Kenya
Mauritius
Egypt
Brazil
Pakistan
India
Germany
MSCI DM
Estonia
Vietnam
MSCI EM
NewZealand
Sweden
Finland
China
Bangladesh
Japan
Lithuania
Taiwan
Nigeria
Korea
Denmark
USA 43.6%
41.4%
38.9%
36.7%
30.7%
25.7%
22.3%
21.6%
21.5%
20.7%
20.4%
19.4%
15.8%
15.2%
15.1%
14.1%
13.5%
12.8%
3.5%
-20.1%
-20.8%
-30.5%
-34.6% The brief summary of the financial highlights for the year ended December 31, 2020 and 2019 is as under:
Worldwide Indices Performance in CY20
39Annual Report 202038 Cyan Limited
Earnings per ShareDuring the year, the company posted earnings per share of Rs.5.80 compared to Rs.1.59 (restated) in 2019.
Appropriation and DividendThe Company’s profit after tax for the year ended December 31, 2020 stood at Rs.357 million compared to Rs.98 million last year.
The Board recommends the final cash dividend of 50% (Rs.5.00 per share) for the year ended December 31, 2020
Objectives and Corporate StrategyCompany’s sound and satisfactory performance for last five years as compared to KSE-100 Index is backed by achievement of our corporate objectives. We are committed to mounting good asset quality portfolio and continuously build the Company at sound footing with diversified pool of income stream.
The key elements of our corporate strategy have been to effectively employ available resources and maximize profitability while managing and mitigating related risks.
Liquidity, Cash Flows and financing arrangementThe Company has an effective cash management system, powered by a team of dedicated and competent employees, preparing forecasts and regularly monitoring Company’s cash needs. Inflows and outflows of cash and other liquid assets, including investments, are managed on net adjusted return basis. The Company has running finance facility of Rs.2,000 million which has been partially utilized during the year and will be used as and when any investment opportunity arises.
Capital StructureIn the past years the Company has issued bonus shares which increased paid-up capital of the Company to Rs. 615.591 million. Shareholders’ fund at the year-end totaled Rs.2452 million. The liquidity position of the Company remains strong
with a year-end current ratio of 6. Risk management & Strategy for Mitigating RisksCompany also manages a portfolio of short-term investments, made after thorough financial evaluation. The credit risk in short term investments is minimized through diversification in investments among Government Securities and highly rated money market mutual funds. Short term investments include public equities having good financial health and highly rated money market mutual funds.
Credit riskCredit risk represents the risk of a loss if the counterparties fail to perform as contracted. The Company’s credit risk mainly arises from deposits with banks, loan to employees, Investments in mutual funds and trade and other receivables. For banks and financial institutions, management keeps deposits with reputed institutions. For investment in mutual funds, management keeps surplus funds in high rated mutual funds. Credit risk on account of dividend receivable is minimal due to the statutory protection. All transactions in listed securities are settled / paid for upon delivery using the system of National Clearing Company of Pakistan Limited. The risk of default in these transactions is considered minimal due to inherent systematic measures taken therein. Further, risk of investment in mutual funds is also minimal as Company is exposed to high rated money market funds for liquidity management.
Market riskMarket risk is the risk of change in market prices, such as foreign exchange rates, interest rates and equity prices will affect the Company’s income or the value of its holdings of financial instruments. The objective of market risk management is to manage and control market risk exposures within acceptable parameters, while optimizing the return. However, the Company is exposed to interest rate risk and equity price risk.
The Company is exposed to market risk with respect to its investments, long term loans, short term deposits and bank balances. The Company limits market risk by maintaining a diversified portfolio and by continuous monitoring of developments in the equity market. The market risks associated with the Company’s business activities are interest rate risk and price risk. The Company is not exposed to material currency risk.
Interest rate riskInterest rate risk is the risk that the fair values of future cash flows of a financial instrument will fluctuate because of changes in market interest rates. Since the Company only consider exposure towards money market mutual funds therefore it is
exposed to interest rate risk, however the same is mitigated via investing in these funds with less than 90 days duration.
Equity price riskThe Company is exposed to equity price risk because of investments held by the Company and classified on the Statement of Financial Position as at fair value through profit or loss and Other Comprehensive Income. To manage its price risk arising from investments in equity securities, the Company diversifies its portfolio within the eligible stocks.
Foreign currency risk The Company is not exposed to risk from foreign currency exchange rate fluctuations.
Relationships with StakeholdersThe Company recognizes and respects the rights of each and every stakeholder including shareholders, employees, creditors, local communities and others. The Company encourages active participation of shareholders in all general meetings of the Company and values their views towards better governance and operational management. The Company is also aware of its legal and constructive obligations towards its stakeholders where it operates and takes proper actions to timely respond to their expectations after taking into account a realistic view of their interests associated with the Company. A detailed overview is made at all shareholders meeting for keeping them abreast with the overall performance of the Company.
Information TechnologyWe strongly believe that role of IT is very important for progress of any business. In order to achieve better market infrastructure and implementations of sound techniques for controls of risks, the role of IT is very important. The company implemented certain key applications, i.e. human resource management, enterprise general ledger and fixed assets module. Due to implementation of above modules, the operational capabilities of relevant department of the Company improved and these developments supported the improvement of internal controls and effective management information system.
Human Resources Development, Training & Succession Planning The Company has employed experienced and qualified human resources to meet the challenges ahead. Company also plans to strengthen its team, use employee performance evaluation methods and benchmark surveys to further strengthen organization structure and effectiveness. Staff training is carried out on a continuous basis throughout the year, based on the employee training need particularly in the area of knowledge
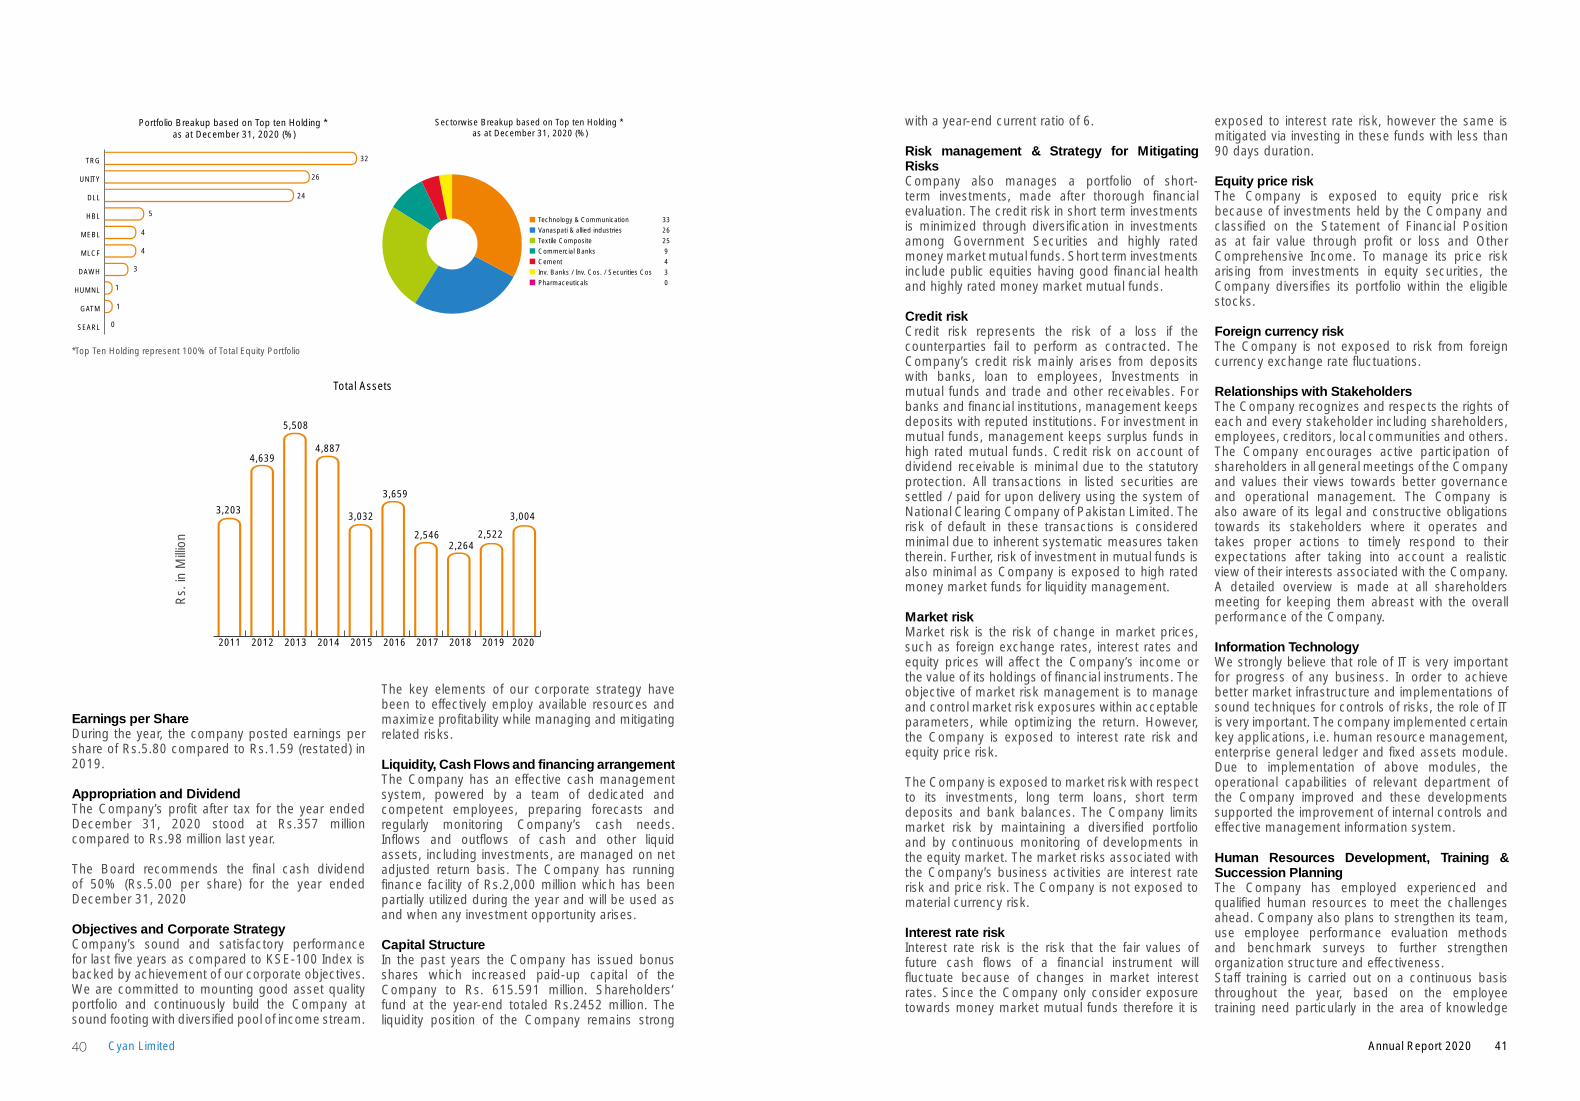
Portfolio Breakup based on Top ten Holding * as at December 31, 2020 (%)
SEARL
GATM
HUMNL
DAWH
MLCF
MEBL
HBL
DLL
UNITY
TRG 32
26
24
5
4
4
3
1
1
0
Sectorwise Breakup based on Top ten Holding * as at December 31, 2020 (%)
Technology & Communication 33
Vanaspati & allied industries 26
Textile Composite 25
Commercial Banks 9
Cement 4
Inv. Banks / Inv. Cos. / Securities Cos 3
Pharmaceuticals 0
Total Assets
2,2642,522
3,004
2011 2012 2013 2014 2015 2016 2017 2018 2019 2020
3,203
4,639
5,508
4,887
3,032
3,659
2,546
*Top Ten Holding represent 100% of Total Equity Portfolio
Rs.
in M
illion
41Annual Report 202040 Cyan Limited
enhancement and skills. Training and human resources development always remains very important for the Company. The Company HR Manual is designed in such a way that always gives proper reward, sense of encouragement and motivation amongst the staff members.
The Company not only attracts the best talent but also grooms and develops their abilities for future leadership roles. The Company believes in empowering employees by providing them with challenging opportunities to enhance their potential and develop their abilities. Clear roles and job descriptions are defined, based on which, succession plan is prepared for sensitive and critical positions in the Company.
Internal ControlThe internal control framework has been effectively implemented through an in-housed InternalAudit function established by the Board which is independent of the External Audit function. The Company’s system of internal control is sound in design and has been continually evaluated for effectiveness and adequacy. The Audit Committee has ensured the achievement of operational, compliance, risk management, financial reporting and control objectives, safeguarding of the assets of the Company and the shareholders’ wealth at all levels within the Company. The Internal Audit function has carried out its duties under the charter defined by the audit Committee. The Audit Committee has reviewed material Internal Audit findings, taking appropriate action or bringing the matters to the Board’s attention where required. Coordination between the External and Internal Auditors was facilitated to ensure efficiency and contribution to the Company’s objectives, including a reliable financial reporting system and compliance with laws and regulations.
Corporate Social Responsibility (CSR)Sustainable and responsible development is not only binding by local laws on corporate entities, but it is more about moral obligation which needs to be followed and practiced with the best spirit. Cyan strongly believes that improving its environmental and social performance is inevitable for its financial success. The management will spend at least 1% of profit before tax annually on CSR. The Company always emphasizes on culture of excellence, good governance, transparency, integrity and accountability. We continued with our CSR program with focus on:
• Education • Health Sector • Community Building � • Children Welfare� • Heritage Preservation� • Relief Activities
Energy ConservationThe Company’s energy conversation measures include usage of LEDs all around the Company areas and shutting down auxiliaries and equipment’s wherever possible.
Occupational Health, Safety & Environment ProtectionWe are committed to achieve excellence in health, safety and environment across our business. Cyan maintains a safe working environment and takes responsibility for the health and wellbeing of its staff and stakeholders. All new employees are required to go through a compulsory medical checkup at the time of appointment.
Community investment & welfare schemesSupport of community development continued to be a significant element of Cyan’s CSR policy. The Company is committed to work with community in a way that delivers positive and lasting change for people in need.
Corporate RelationsCorporate relations promote efficiency, productivity and decent work. Indeed, a participative and mutually respecting relations, advance cooperation, enhance productivity and promote trust thereby reducing dislike and exploitation. During the year recreational and motivational activities in the form of cricket matches were organized with other institutions.
Employment of special personsBeing a caring employer, Cyan takes special interest in creating employment opportunities for special persons.
Business Ethics and Anti-Corruption MeasuresIt is a fundamental policy of the Company to conduct its business with honesty, integrity and in accordance with the highest ethical and legal standards. Unethical practices of any sort are not to find their way into our business. All employees must act at all times in the interest of Company’s shareholders and no employee shall ever commit an illegal or an unethical act, or instruct and encourage another employee to do so.
The Company has communicated the Code of Conduct to all its directors and employees and has also placed it on its website.
Contribution to National ExchequerCyan made a sizeable contribution of Rs.9.213 million to the National Exchequer by way of taxes, during the year 2020.
Credit RatingOn January 01, 2021 JCR-VIS Credit Rating Company Limited has reaffirmed the entity ratings of ‘A/A-1’ (A /A-One) to Cyan Limited (CL). Outlook on ratings is ‘Negative’.
Related Party TransactionsDuring the year, all transactions made with associated companies/related parties were duly recommended by Board’s Audit Committee and approved by the Board of Directors of the Company. All transactions with related parties are on arm’s length basis.
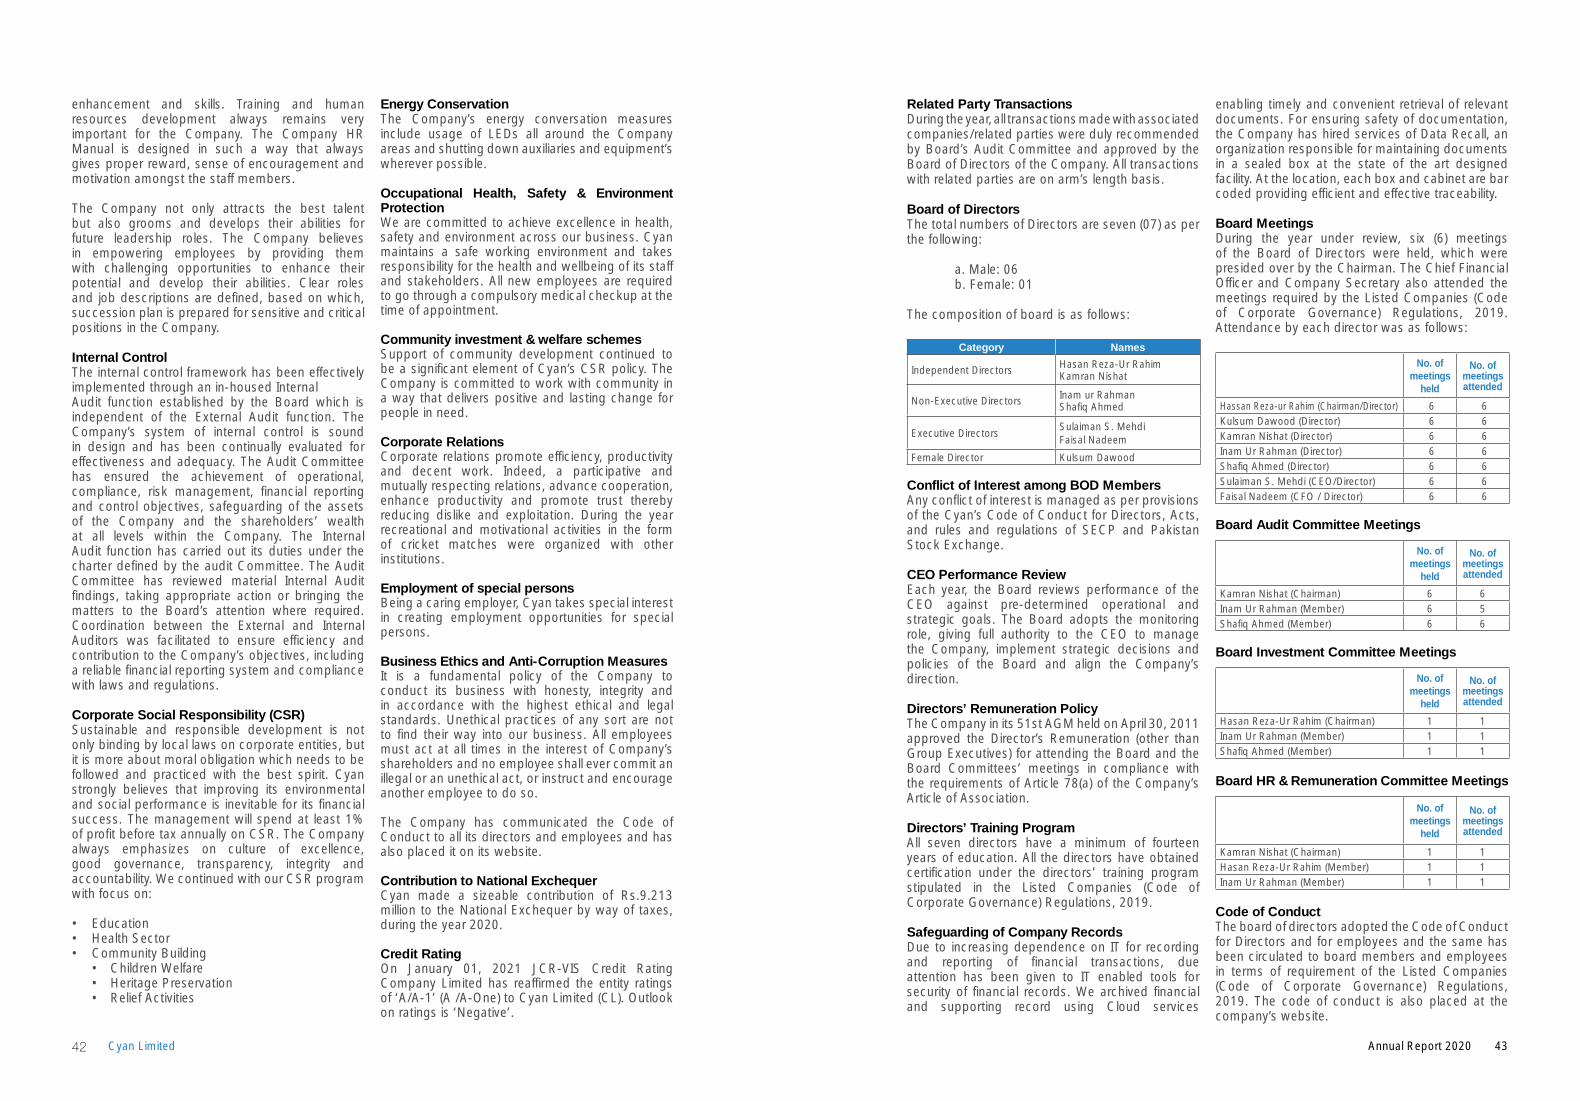
Board of DirectorsThe total numbers of Directors are seven (07) as per the following:
a. Male: 06 b. Female: 01
The composition of board is as follows:
Category Names
Independent Directors Hasan Reza-Ur RahimKamran Nishat
Non-Executive Directors Inam ur RahmanShafiq Ahmed
Executive DirectorsSulaiman S. MehdiFaisal Nadeem
Female Director Kulsum Dawood
Conflict of Interest among BOD MembersAny conflict of interest is managed as per provisions of the Cyan’s Code of Conduct for Directors, Acts, and rules and regulations of SECP and Pakistan Stock Exchange.
CEO Performance ReviewEach year, the Board reviews performance of the CEO against pre-determined operational and strategic goals. The Board adopts the monitoring role, giving full authority to the CEO to manage the Company, implement strategic decisions and policies of the Board and align the Company’s direction.
Directors’ Remuneration PolicyThe Company in its 51st AGM held on April 30, 2011 approved the Director’s Remuneration (other than Group Executives) for attending the Board and the Board Committees’ meetings in compliance with the requirements of Article 78(a) of the Company’s Article of Association.
Directors’ Training ProgramAll seven directors have a minimum of fourteen years of education. All the directors have obtained certification under the directors’ training program stipulated in the Listed Companies (Code of Corporate Governance) Regulations, 2019.
Safeguarding of Company RecordsDue to increasing dependence on IT for recording and reporting of financial transactions, due attention has been given to IT enabled tools for security of financial records. We archived financial and supporting record using Cloud services
enabling timely and convenient retrieval of relevant documents. For ensuring safety of documentation, the Company has hired services of Data Recall, an organization responsible for maintaining documents in a sealed box at the state of the art designed facility. At the location, each box and cabinet are bar coded providing efficient and effective traceability.
Board MeetingsDuring the year under review, six (6) meetings of the Board of Directors were held, which were presided over by the Chairman. The Chief Financial Officer and Company Secretary also attended the meetings required by the Listed Companies (Code of Corporate Governance) Regulations, 2019. Attendance by each director was as follows:
No. of meetings
held
No. of meetings attended
Hassan Reza-ur Rahim (Chairman/Director) 6 6Kulsum Dawood (Director) 6 6Kamran Nishat (Director) 6 6Inam Ur Rahman (Director) 6 6Shafiq Ahmed (Director) 6 6Sulaiman S. Mehdi (CEO/Director) 6 6Faisal Nadeem (CFO / Director) 6 6
Board Audit Committee Meetings
No. of meetings
held
No. of meetings attended
Kamran Nishat (Chairman) 6 6Inam Ur Rahman (Member) 6 5Shafiq Ahmed (Member) 6 6
Board Investment Committee Meetings
No. of meetings
held
No. of meetings attended
Hasan Reza-Ur Rahim (Chairman) 1 1Inam Ur Rahman (Member) 1 1Shafiq Ahmed (Member) 1 1
Board HR & Remuneration Committee Meetings
No. of meetings
held
No. of meetings attended
Kamran Nishat (Chairman) 1 1Hasan Reza-Ur Rahim (Member) 1 1Inam Ur Rahman (Member) 1 1
Code of ConductThe board of directors adopted the Code of Conduct for Directors and for employees and the same has been circulated to board members and employees in terms of requirement of the Listed Companies (Code of Corporate Governance) Regulations, 2019. The code of conduct is also placed at the company’s website.
43Annual Report 202042 Cyan Limited
Corporate and Financial Reporting Framework a) The financial statements prepared by the
management of the Company, present fairly its State of Affairs, the Results of its Operations, Cash Flows and Statement of Changes in Equity.
b) The Company has maintained proper books of accounts as required under the Companies Act, 2017.
c) The Company has followed consistent and appropriate accounting policies in the preparation of the financial statements. All changes, wherever made during the year have been adequately disclosed and accounting estimates are on the basis of prudent and reasonable judgment.
d) The International Financial Reporting Standards (IFRS), as applicable in Pakistan, have been followed in the preparation of financial statements and any departure there from has been adequately disclosed.
e) The system of internal control is sound in design and has been effectively implemented and monitored.
f) The fundamentals of the Company are strong and it has the ability to continue as a going concern free from uncertainties.
g) The Company has followed the best practices of the Corporate Governance as laid down in the Listed Companies (Code of Corporate Governance) Regulations, 2019 and there has been no material departure there from.
h) There are no statutory payments on account of taxes, duties, levies and charges which are outstanding except in the ordinary course of business and described in the financial statements.
i) The value of investments of the Provident Fund as maintained by the Company on the basis of audited accounts as on June 30, 2020 is Rs.57.03 million.
j) All of the company directors are Certified Directors under Directors’ Training Program from approved institutes as prescribed by SECP.
OwnershipAs at December 31, 2020, there were 1,654 shareholders on the record of the Company.
Pattern of ShareholdingThe pattern of Shareholding of the Company as at December 31, 2020, along with pattern of shareholding of certain classes of shareholders whose disclosure is required under the reporting framework and the statement of purchase and sale of shares by Directors, executives and their spouses including minor children during 2020 is shown in the shareholding section of this report.
AuditorsThe present auditors M/s. A.F. Fergusons & Co. (Chartered Accountants) being eligible, has provided their consent for appointment at the 61st annual general meeting. The Audit Committee has recommended the appointment of M/s. A.F. Ferguson & Co. as Statutory Auditors of the company for the year ending December 31, 2021. The Board has endorsed this recommendation.
Key operating and financial dataA Statement summarizing the key financial and operating data for the last nine years along with the current year is included in the report.
Forward Looking InformationPakistan’s economy is on track with CPEC turning from a dream to reality, Pakistan has attained serious attention from the world at large. There is optimism within the business community and overall improved economic activity. The Company is actively undertaking portfolio management business and corporate finance advisory business and the outlook is positive. The management team under its CEO is fully committed to deliver a superior risk adjusted return to the shareholders.
AcknowledgementWe would like to thank all our stakeholders, especially our valued investors, who have placed their confidence in us and also appreciate the efforts put in by the management team for their unswerving commitment and hard work. The Board would also like to place its appreciation for the Securities & Exchange Commission of Pakistan, State Bank of Pakistan and the management of the Pakistan Stock Exchange for their continued support and cooperation.
On behalf of the Board
Hasan Reza Ur Rahim Sulaiman S. Mehdi Chairman CEO
Karachi: February 23, 2021
CEO’s MessageThe CY20 remained a challenging year for the whole world. The outbreak of Covid-19 infected many people around the globe with few losing their battle against the virus. Further, the lockdown in the most parts of the world halted economic activities and resulted in a loss of employment for many. However, the story of Pakistan is a bit different. Although the country’s economic growth turned negative during FY20, Pakistan managed to deal much better than most of the developed countries to limit the virus spread and its economic effect. Thus, the KSE-100 index provided a positive return of 7.4% in CY20 against the return of 9.9% in CY19. In USD terms, the index provided a return of 3.5% during CY20 as compared to the negative return of -1.5% in CY19.
The monetary and fiscal packages during the year helped subside the devasting effects of Covid-19 on the economy. Therefore, the country resumed the track for strong economic growth as depicted by the improvements in most of the major economic fundamentals. Further, the resumption of IMF program will also restore the confidence of foreign investors as well as major multi-lateral agencies on the future economic prospects.
The foreigners remained prudent as they sold shares of worth USD 571.5 million during CY20. The crash in international oil prices, spread of Covid-19 around the globe and uncertainty regarding economic outlook forced foreigners to divest shares. Among sectors, the Banking sector witnessed the largest selling (USD 168.1 million) followed by Oil & Gas Exploration companies (USD 119.6 million) and Cements (USD 100.9 million).
Amongst the best performing sectors of the index, Vanaspati & Allied industries remained in limelight because of strong demand outlook and increased palm oil prices followed by Technology and Cements. The lockdown in the country spurred the need for technological propagation, hence, the sector remained prominent throughout the year. Further, the announcement of construction package and reduction in the policy rate stirred enthusiasm amongst all the construction and its related sectors. On the other hand, the reduction in the policy rate and ban on dividends for two consecutive quarters took the toll on the banking sector.
Cyan’s portfolio increased by 39.30% during the year against 7.41% return posted by the KSE-100 Index. Average exposure to equities during the year remained at 97%, whereas 3% was invested in cash and debt securities. The equity portfolio was aligned towards high growth investments and to this effect significant investments were made in Technology and Vanaspati & Allied industries.
Achieving MilestonesNine years ago, the market capitalization of the Company was PKR1.95 billion, which has increased to PKR 2.27 billion in 2020. During this period, the Company managed to pay a total dividend of PKR 5.6 billion providing the shareholders with a total return of 303% The benchmark KSE-100 Index provided a return of 286% during the same period reflecting Cyan’s outperformance of 17% points.
Engaging New OpportunitiesWe are also aggressively looking to explore corporate advisory services for adding new stream of revenue.
Economic OutlookAlthough the country’s GDP turned negative for the first time in sixty-eight years, the economic recovery on the back of pent-up demand after easing in lockdown has exceeded expectations. There is stark improvement in the external sector where the country managed to post Current Account surplus of USD 1.1 billion during 1HFY21 against the deficit balance of USD 2.0 billion in the corresponding period last year. The remittances for each month during the current fiscal year have remained above USD 2 billion mark.
The debt relief facilities provided by G20 countries and other institutional lenders have provided much needed relief to the balance of payment position. Further, the emergency lending programs offered by IMF bolstered the foreign exchange reserves. As a result, the country’s foreign exchange reserves increased to USD 20.5 billion at the end of CY20 as compared to USD 17.9 billion at the end of CY19.
The fruit of accommodative monetary policy stance has begun to offer its benefits. The large-scale manufacturing has increased by 8.16% during 1HFY21 as compared to the corresponding period last year. The auto sales observed an increase of 18% YoY during 1HYF20. The cement dispatches clocked in at 28.56 million metric tons during 1HFY21 as compared to 24.75 million metric tons in 1HFY20, depicting a growth of 15.4% YoY. Thus, the uplift in economic activities in all the major sectors is started to surface and is expected to continue in the foreseeable future.
AcknowledgmentsI would like to thank all our Shareholders and the Board of Directors for their immense support. The Company’s accomplishments and present standing could not have been possible without the commitment and efforts of our employees who deserve full compliment. I am confident that the team will continue to grow and constantly deliver on expectations of all stakeholders.
Sulaiman S. MehdiCheif Executive Officer
Karachi: February 23, 2021
45Annual Report 202044 Cyan Limited
Chairman's Review
At Cyan, we consider it our social responsibility to build a more enlightened and empowered society in Pakistan that can contribute towards the progress and growth of the country as a whole. Whilst we continue to make efforts to grow our business, we also recognize that our success in the long-term is defined by our ability to add value to all our stakeholders, which includes those involved in our business operations, as well as those who are part of the larger community in which we co-exist.
Since inception, Cyan’s Corporate Social Responsibility (CSR) efforts in Pakistan have been multi-pronged and have included a drive to protect our natural environment and to ensure that our businesses operate in an ethical, sound and responsible manner.
Over the past years we have continued supporting our beliefs by contributing with the renowned institutions who strive to generate maximum social value to build a better, more sustainable realm for all. They include;
• The Dawood Foundation
• The Citizen Foundation (TCF)
• Marie Adelaide Leprosy Centre (MALC)
• Fatimid Foundation
• Indus Hospital
• SIUT
• Patients Aid Foundation
• Make A Wish Foundation
• Education Trust Nasra School
• HANDS
• Layton Rahmatulla Benevolent Trust (LRBT)
• Patients Behbood Society
Cyan considers the following factors while shortlisting the project:
• Associating to a cause which is in-line with the identified sectors
• Credibility and repute of the charity organization seeking assistance
The focus of our endeavors includes following areas;
• Education
• Health Sector
• Community Building
• Children Welfare
• Sports Development
• Relief Activities
• Women Empowerment
• Heritage Preservation
Corporate Social ResponsibilityWe are pleased to present the Annual Report of Cyan Limited for the year ended December 31, 2020.
The economic indicators were showing some improvement until February 2020 when the novel Corona virus hit Pakistan. The country went into strict lockdown for almost six weeks which halted all economic activities and expectations of recovery by 2QCY20 were reversed as the pandemic impacted Pakistan’s overall aggregate demand. GDP growth contracted by 0.38% in FY 2020. This was the lowest in 68 years. Industrial and Services sectors witnessed negative growth rates of 2.6% and 0.6%, respectively whereas Agriculture sector posted a positive growth of 2.7%.
After much turbulence in the KSE-100 index due to Covid-19, it provided a total return of 7.4% in CY20. It is attributed to successfully containing cases of the corona virus, allowing industries to operate within SOPs, surge in demand after easing in lockdown, substantial cut in the policy rate (625 bps) and debt relief provided by multilateral agencies. Foreign Portfolio Investors remained net sellers in CY20 as they sold shares of worth USD 572 million though they were the net-buyers during CY19. Despite the depreciation of the PKR, market capitalization of the KSE-All share index remained intact at USD 50.3 billion.
Going ahead, the challenges to the economy due to Covid-19 may be lower on account of the development in vaccines. The economy is expected to recover from recession and GDP growth is expected to grow between 1.5% to 2% during FY21. Balance of payments is expected to remain stable owing to growing remittances and contained trade balances. Although the fiscal space may deteriorate due to weak tax collection and higher expenditures and disciplined spending will allow the government to implement pro-growth policies and bring economic stability.
During the year, the Board of Directors of Cyan Limited performed its duties diligently and in conformity with the Companies Act 2017, the Listed Companies (Code of Corporate Governance) Regulations, 2019 and the Rule Book of Pakistan Stock Exchange, where the Company is listed. It upheld the best interests for the shareholders and provided adequate advice and oversight to management. The key areas that were focused upon and assessed included, but were not limited to, the strategic process, key business drivers & performing milestones, impact of global & domestic economic environments, operational & reputational risks affecting business, Board dynamics, managerial capability and information flows. All significant issues throughout the year were presented before the Board or its committees to strengthen and formalize the corporate decision-making process, which led to a harmonious partnership with management.
I would like to conclude by extending my gratitude and thanks to the Directors, for their energy, knowledge, advice and earnest contributions towards the advancement of Cyan Limited. I am also thankful to you, the Shareholders for placing your trust in the Board and management’s ability to deliver results. Furthermore, the Board also thanks the entire management team for its selfless contributions as we look forward to future successes in the Company’s endeavors.
Hasan Reza Ur RahimChairman
Karachi: February 23, 2021
47Annual Report 202046 Cyan Limited

EDUCATIONDuring the past few years, Pakistan’s adult literacy rate has declined from 60% to 58%, clearly indicating decreasing penetration in the country. Education is a state responsibility as per the constitution; however, quality education remains accessible to only a few with the Net Primary Enrolment Ratio static at 57% since past five years. 65% of all primary school children do not end up studying further than 5th grade. 30% of the adult population has not received even a single year of schooling. And to accommodate new population, Pakistan needs ~3.3 schools per hour for the next 5 years.
At Cyan, we certainly believe that the way to uplift Pakistan is by investing in the education of our future generations.
HEALTHSECTORThe accessibility and quality of healthcare is a common metric to assess the developmental stage of a country. According to estimates provided by the Pakistan Bureau of Statistics, there are 1,283 hospitals, 5,438 labs & diagnostic centers, 196,000 clinics and over 7,300 pharmacies. However, the quality of healthcare infrastructure ranks low amongst peer countries. There are 2,000 people per hospital bed in Pakistan. On average, only 3,500 beds are added while ~4 million people are added to population each year. There are twice the numbers of doctors in the country than nurses.
Cyan is cognizant of the fact that healthcare system should exist as a fundamental element that assures life and high standards of living, and it should be available to everyone.
COMMUNITYBUILDINGCyan also encourages and participates in efforts to build and sustain the culture and community of Pakistani society. Our endeavors are aimed at sustaining values of society by preserving the richly diversified culture and heritage of Pakistan.
Calendar of Major Events
FEBRUARY 2020
OCTOBER 2020
Cyan Limited has been awarded “Certificate of Merit Award” for Best Corporate Reports Award 2019. The ICAP and ICMA Pakistan jointly organized the BCSR Awards every year with the objective to recognize excellence in corporate reporting, promote accountability & transparency, recognizing the responsible reporting by companies covering economic, environment and social performance of the business.
Cyan Board of Directors meeting was held to approve the Financial Statements for the nine months and quarter ended September 30, 2020.
Cyan Board of Directors meeting was held to approve the financial statements for the year ended December 31, 2019 and recommended 10% final cash dividend alongwith 5% bonus shares to the shareholders.
APRIL 2020
Cyan Board of Directors meeting was held to approve the first quarter accounts for the period ended March 31, 2020.
MAY 2020
60th Annual General Meeting of the shareholders of the Company was held on 21st May 2020 to adopt financial statements for the year ended December 31, 2019 and approved 10% final cash dividend alongwith 5% bonus issue to the shareholders.
Election of Director was also held in 60th AGM on 21st May 2020.
Cyan’s Board of Directors meeting was also held to constitute the Board Committees.
AUGUST 2020
Cyan Board of Directors meeting was held to approve the interim Financial Statements for the half year ended June 30, 2020.
DECEMBER 2020
Cyan Corporate briefing session was held where the Company’s senior management discuss the financial performance of the company and future outlook.
48 Cyan Limited 49Annual Report 2020
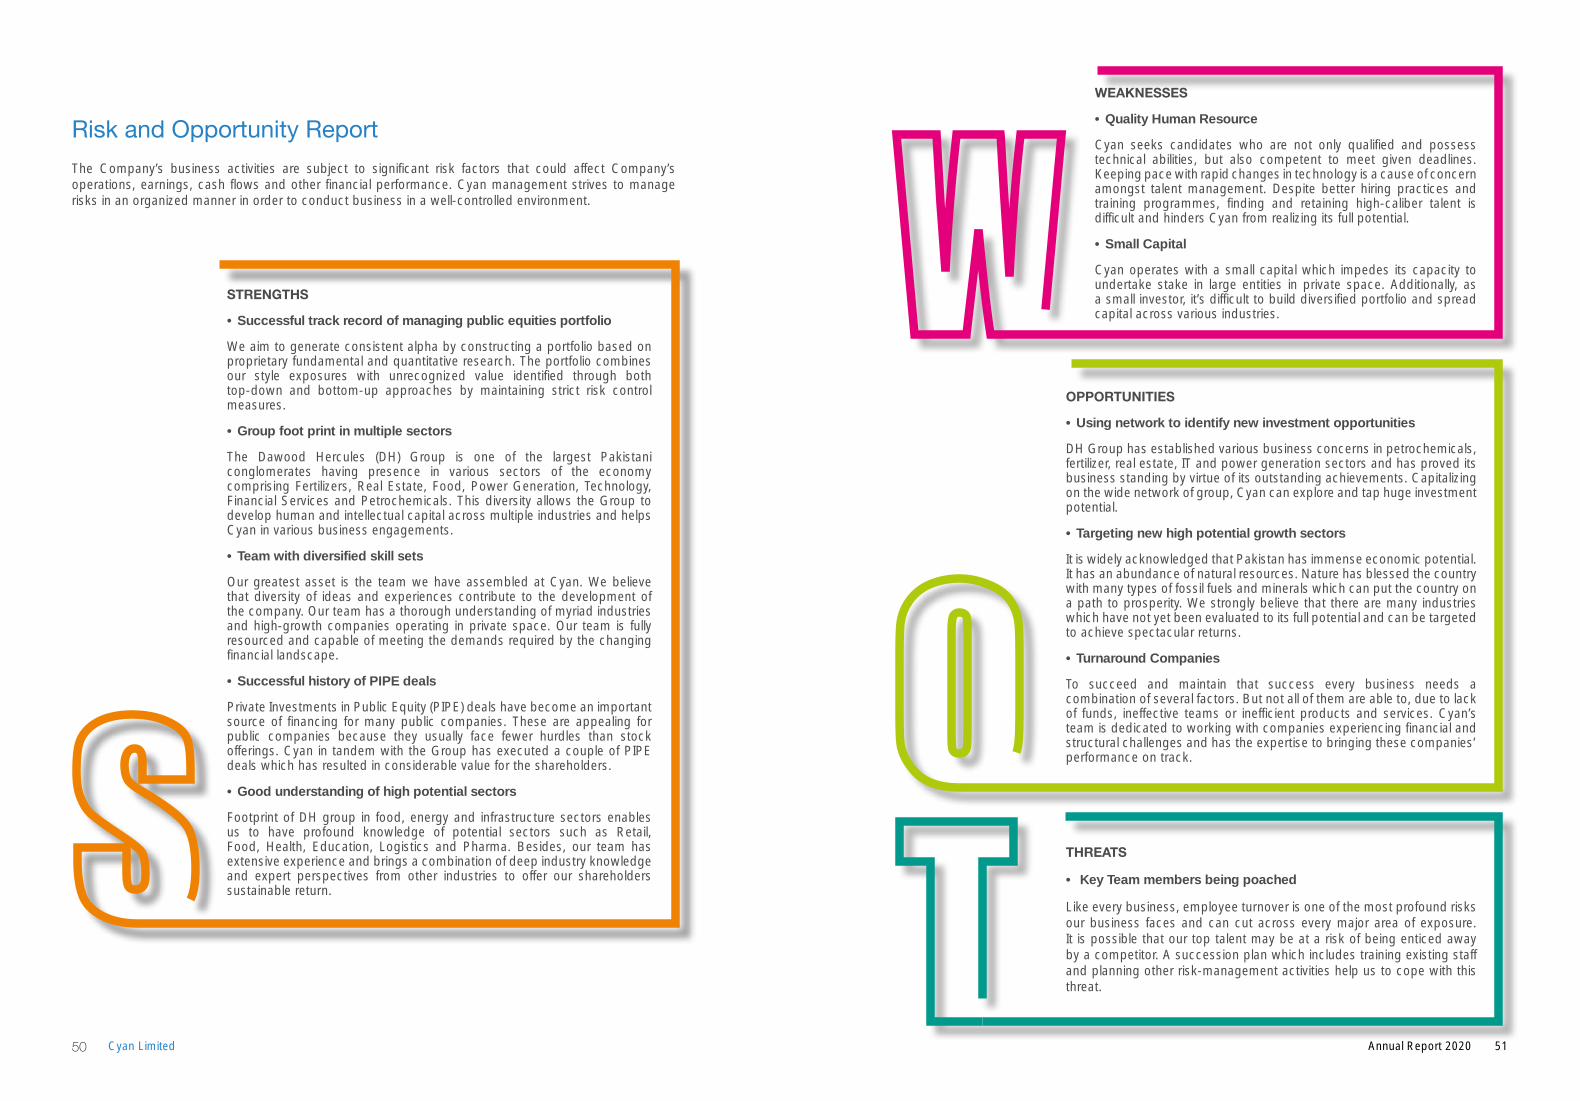
The Company’s business activities are subject to significant risk factors that could affect Company’s operations, earnings, cash flows and other financial performance. Cyan management strives to manage risks in an organized manner in order to conduct business in a well-controlled environment.
Risk and Opportunity Report
STRENGTHS
• Successful track record of managing public equities portfolio
We aim to generate consistent alpha by constructing a portfolio based on proprietary fundamental and quantitative research. The portfolio combines our style exposures with unrecognized value identified through both top-down and bottom-up approaches by maintaining strict risk control measures.
• Group foot print in multiple sectors
The Dawood Hercules (DH) Group is one of the largest Pakistani conglomerates having presence in various sectors of the economy comprising Fertilizers, Real Estate, Food, Power Generation, Technology, Financial Services and Petrochemicals. This diversity allows the Group to develop human and intellectual capital across multiple industries and helps Cyan in various business engagements.
• Team with diversified skill sets
Our greatest asset is the team we have assembled at Cyan. We believe that diversity of ideas and experiences contribute to the development of the company. Our team has a thorough understanding of myriad industries and high-growth companies operating in private space. Our team is fully resourced and capable of meeting the demands required by the changing financial landscape.
• Successful history of PIPE deals
Private Investments in Public Equity (PIPE) deals have become an important source of financing for many public companies. These are appealing for public companies because they usually face fewer hurdles than stock offerings. Cyan in tandem with the Group has executed a couple of PIPE deals which has resulted in considerable value for the shareholders.
• Good understanding of high potential sectors
Footprint of DH group in food, energy and infrastructure sectors enables us to have profound knowledge of potential sectors such as Retail, Food, Health, Education, Logistics and Pharma. Besides, our team has extensive experience and brings a combination of deep industry knowledge and expert perspectives from other industries to offer our shareholders sustainable return.
OPPORTUNITIES
• Using network to identify new investment opportunities
DH Group has established various business concerns in petrochemicals, fertilizer, real estate, IT and power generation sectors and has proved its business standing by virtue of its outstanding achievements. Capitalizing on the wide network of group, Cyan can explore and tap huge investment potential.
• Targeting new high potential growth sectors
It is widely acknowledged that Pakistan has immense economic potential. It has an abundance of natural resources. Nature has blessed the country with many types of fossil fuels and minerals which can put the country on a path to prosperity. We strongly believe that there are many industries which have not yet been evaluated to its full potential and can be targeted to achieve spectacular returns.
• Turnaround Companies
To succeed and maintain that success every business needs a combination of several factors. But not all of them are able to, due to lack of funds, ineffective teams or inefficient products and services. Cyan’s team is dedicated to working with companies experiencing financial and structural challenges and has the expertise to bringing these companies’ performance on track.
THREATS
• Key Team members being poached
Like every business, employee turnover is one of the most profound risks our business faces and can cut across every major area of exposure. It is possible that our top talent may be at a risk of being enticed away by a competitor. A succession plan which includes training existing staff and planning other risk-management activities help us to cope with this threat.
WEAKNESSES
• Quality Human Resource
Cyan seeks candidates who are not only qualified and possess technical abilities, but also competent to meet given deadlines. Keeping pace with rapid changes in technology is a cause of concern amongst talent management. Despite better hiring practices and training programmes, finding and retaining high-caliber talent is difficult and hinders Cyan from realizing its full potential.
• Small Capital
Cyan operates with a small capital which impedes its capacity to undertake stake in large entities in private space. Additionally, as a small investor, it’s difficult to build diversified portfolio and spread capital across various industries.
51Annual Report 202050 Cyan Limited
Corporate GovernanceShareholder’s Information
Registered Office Share Registrar OfficeCyan Limited CDC Share Registrar Services Limited 4th Floor, Dawood Centre, CDC House, 99 – B, Block ‘B’,M. T. Khan Road, S.M.C.H.S., Main Shahrah-e-FaisalKarachi. Karachi-74400 Tel # (92-21) 35634290-3 Tel # (92-21) 111-111-500Fax # (92-21) 35680218 Fax: (92-21) 34326053Web site: www.cyanlimited.com Website: www.cdcrsl.comEmail: [email protected] Email: [email protected]
Listing on Stock ExchangesCyan Limited equity shares are listed on Pakistan Stock Exchange (PSX).
Listing FeesThe annual listing fee for the financial year 2020-2021 has been paid to the stock exchange within the prescribed time limit.
Stock CodeThe stock code for dealing in equity shares of Cyan Limited at PSX is CYAN.
Investor Service CentreCyan Limited share department is operated by CDC Share Registrar Services Limited. It also functions as an Investor Service Centre and is managed by a well-experienced team of professionals and is equipped with the necessary infrastructure in terms of computer facilities and comprehensive set of systems and procedures for conducting the Registration function. The team is headed by Mr. Abdul Samad at Registrar Office and Company Secretary at Cyan Registered Office.
The share department undertakes activities pertaining to dematerialization of shares, shares transfer and transmission, issue of duplicate/ re-validated dividend warrants, issue of duplicate / replaced share certifi-cates, change of address and other related matters.
For assistance, shareholders may contact either the Registered Office or the Share Registrar Office.
Contact Person: Contact Person:Cyan Limited Registrar OfficeMr. Ahsan Iqbal Mr. Mohsin Rajab AliTel# (92-21) 35634290-3 Tel # (92-21) 111-111-500
Services StandardsCyan has always endeavored to provide investors with prompt services. Well reputed and experienced firm of the share registrar services has been entrusted with the responsibility of ensuring that services are rendered within the specified time limits.
Statutory ComplianceDuring the year, the Company has complied with all applicable provisions, filed all returns / forms and furnished all the relevant information as required under the Companies Act, 2017 and allied laws and rules, the Securities and Exchange Commission of Pakistan (SECP) Regulations and the Listing Regulations, wherever applicable.
Withholding of Tax on Dividend: The rates of deduction of withholding tax is 15% for filers and non-filers as prescribed under: (a) For filers (persons whose names are appearing in Active Taxpayers List): 15% (b) For non-filer (persons whose names are not appearing in Active Taxpayers List): 30%
General Meetings & Voting RightsPursuant to section 132 of The Companies Act, 2017, Cyan holds a General Meeting of Sharehold-ers atleast once a year. Every shareholder has a right to attend the General Meeting. The notice of such meeting is sent to all the shareholders at least 21 days before the meeting and also advertised in at least one English and one Urdu newspaper having circulation in Sindh, Punjab and FATA.
All shares issued by the Company carry equal voting rights. Generally, matters at the General Meetings are decided by a show of hands in the first instance. Voting by show of hands operates on the principle of “One Member-One Vote”. If majority of shareholders raise their hands in favor of a particular resolution, it is taken as passed, unless a poll is demanded.
ProxiesPursuant to Section 137 of the Companies Act, 2017 and according to the Memorandum and Articles of Association of the Company, every member of the Company who is entitled to attend and vote at a General Meeting of the Company, can appoint another member as his / her proxy to attend and vote instead of himself / herself.
The instrument appointing proxy duly signed by the shareholder appointing that proxy should be deposited at the office of the Company not less than forty-eight hours before the meeting.
Web PresenceThe website of the Company has been maintained in accordance with directives of SECP vide vari-ous SROs. Updated information regarding the Company can be accessed at Cyan web site, www.cyanlimited.com. The web site contains the latest financial results of the Company.
53Annual Report 202052 Cyan Limited
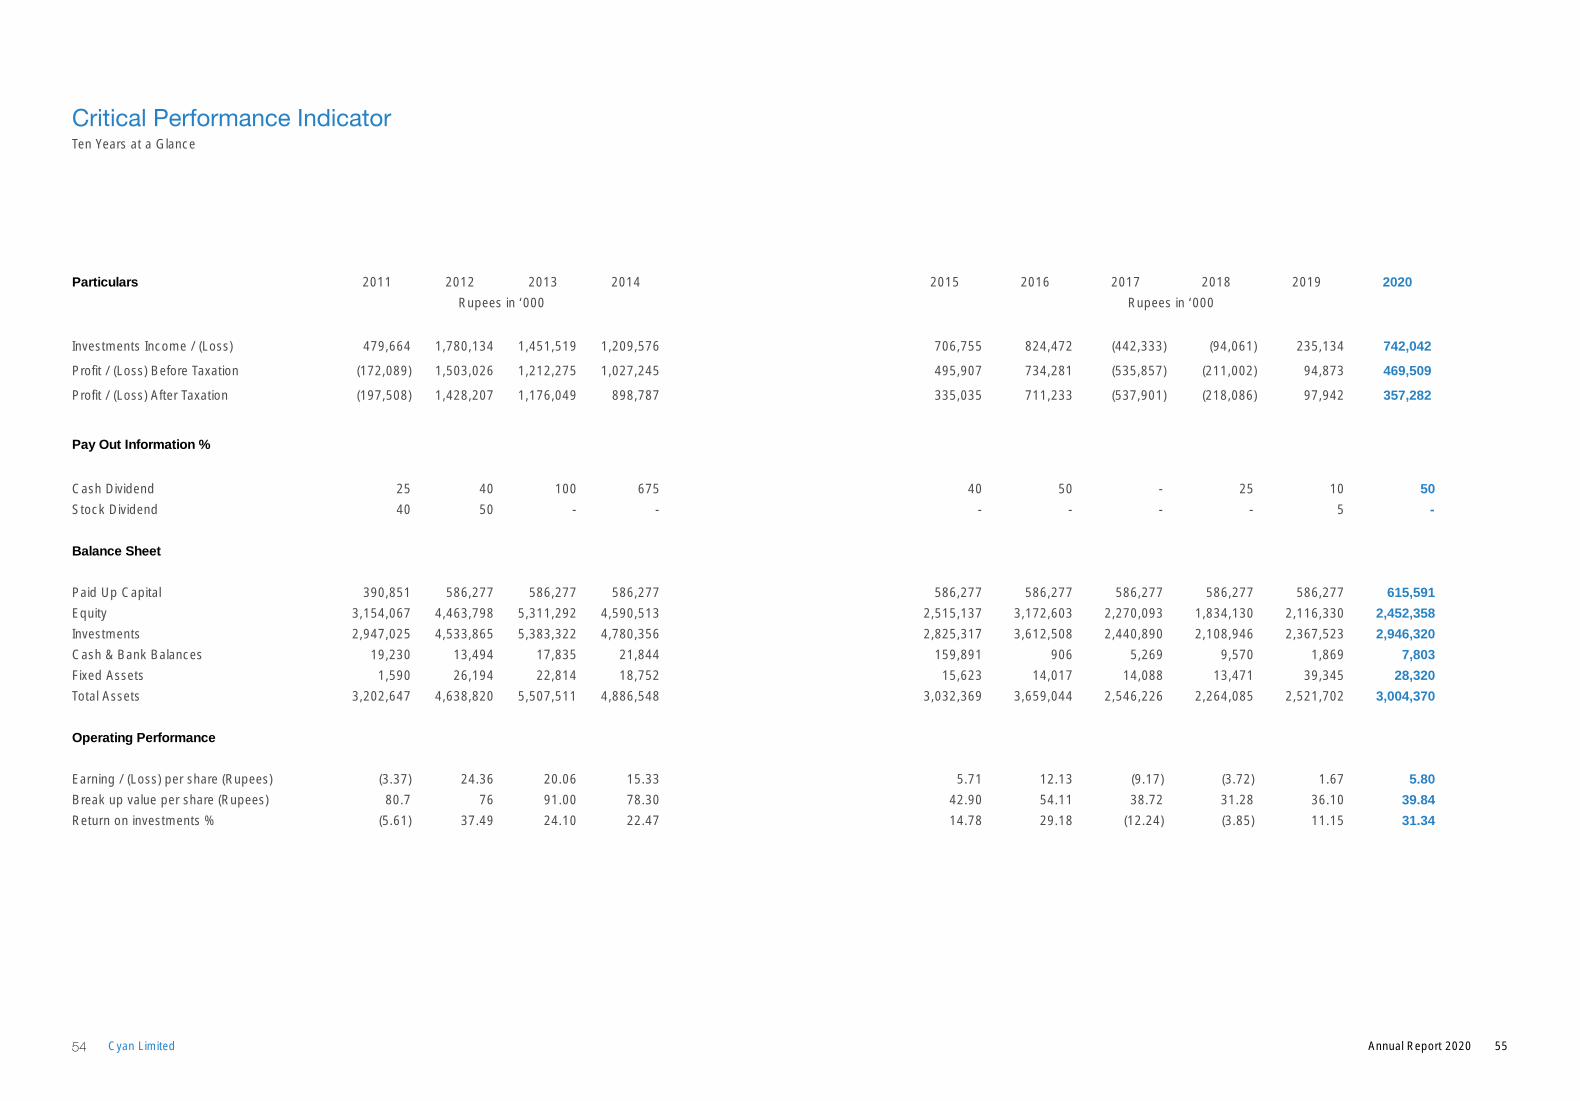
Ten Years at a Glance
Critical Performance Indicator
Particulars 2011 2012 2013 2014 2015 2016 2017 2018 2019 2020
Rupees in ‘000 Rupees in ‘000
Investments Income / (Loss) 479,664 1,780,134 1,451,519 1,209,576 706,755 824,472 (442,333) (94,061) 235,134 742,042
Profit / (Loss) Before Taxation (172,089) 1,503,026 1,212,275 1,027,245 495,907 734,281 (535,857) (211,002) 94,873 469,509
Profit / (Loss) After Taxation (197,508) 1,428,207 1,176,049 898,787 335,035 711,233 (537,901) (218,086) 97,942 357,282
Pay Out Information %
Cash Dividend 25 40 100 675 40 50 - 25 10 50
Stock Dividend 40 50 - - - - - - 5 -
Balance Sheet
Paid Up Capital 390,851 586,277 586,277 586,277 586,277 586,277 586,277 586,277 586,277 615,591
Equity 3,154,067 4,463,798 5,311,292 4,590,513 2,515,137 3,172,603 2,270,093 1,834,130 2,116,330 2,452,358
Investments 2,947,025 4,533,865 5,383,322 4,780,356 2,825,317 3,612,508 2,440,890 2,108,946 2,367,523 2,946,320
Cash & Bank Balances 19,230 13,494 17,835 21,844 159,891 906 5,269 9,570 1,869 7,803
Fixed Assets 1,590 26,194 22,814 18,752 15,623 14,017 14,088 13,471 39,345 28,320
Total Assets 3,202,647 4,638,820 5,507,511 4,886,548 3,032,369 3,659,044 2,546,226 2,264,085 2,521,702 3,004,370
Operating Performance
Earning / (Loss) per share (Rupees) (3.37) 24.36 20.06 15.33 5.71 12.13 (9.17) (3.72) 1.67 5.80
Break up value per share (Rupees) 80.7 76 91.00 78.30 42.90 54.11 38.72 31.28 36.10 39.84
Return on investments % (5.61) 37.49 24.10 22.47 14.78 29.18 (12.24) (3.85) 11.15 31.34
55Annual Report 202054 Cyan Limited
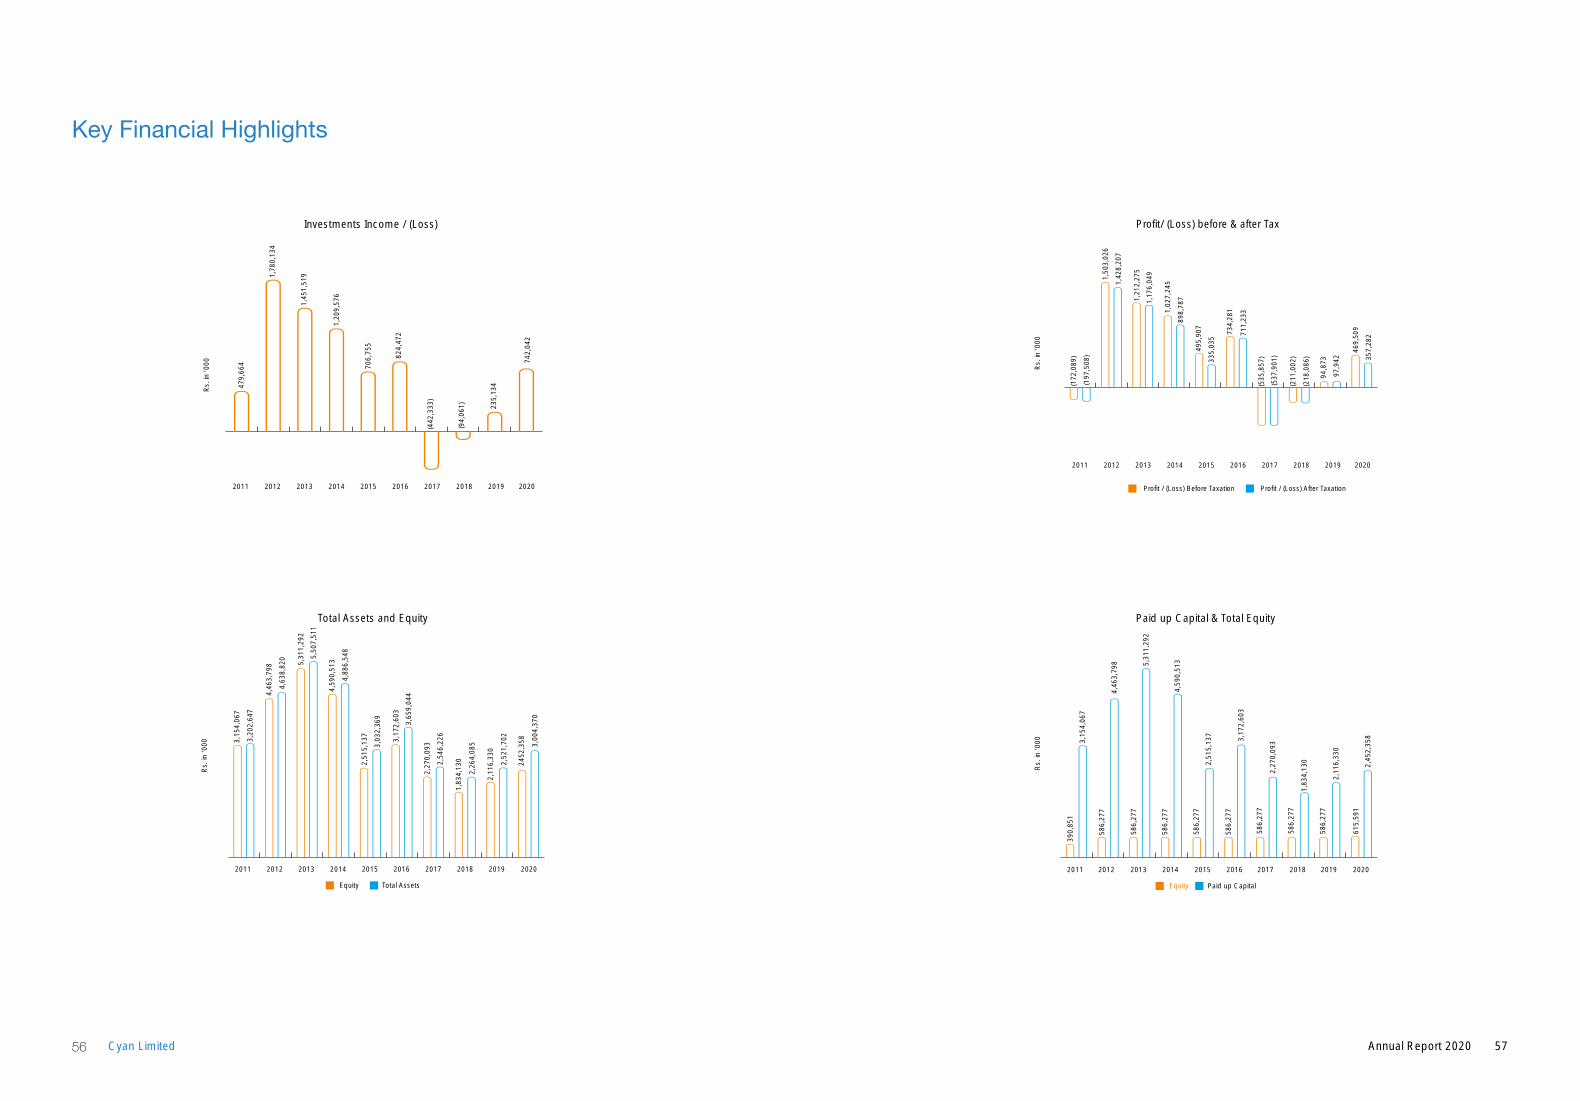
2019 20202011 2012 2013 2014 2015 2016 2017 2018
Investments Income / (Loss)47
9,66
4
1,78
0,13
4
Rs.
in ‘0
00
1,45
1,51
9
1,20
9,57
6
706,
755
824,
472
(442
,333
)
(94,
061) 23
5,13
4
742,
042
Rs.
in '0
00
2019 20202011 2012 2013 2014 2015 2016 2017 2018
Total Assets and Equity
3,15
4,06
7
3,20
2,64
7
4,46
3,79
8
4,63
8,82
0
5,31
1,29
2
5,50
7,51
1
4,59
0,51
3
4,88
6,54
8
2,51
5,13
7
3,03
2,36
9
3,17
2,60
3
3,65
9,04
4
2,27
0,09
3
2,54
6,22
6
1,83
4,13
0
2,26
4,08
5
2,11
6,33
0
2,52
1,70
2
2452
,358 3,00
4,37
0
Total AssetsEquity
Key Financial Highlights
Rs.
in '0
00
2019 20202011 2012 2013 2014 2015 2016 2017 2018
Profit/ (Loss) before & after Tax
(172
,089
)
(197
,508
)
1,50
3,02
6
1,42
8,20
7
1,21
2,27
5
1,1
76,0
49
1,02
7,24
5
898,
787
495,
907
335,
035
734,
281
711,
233
(535
,857
)
(537
,901
)
(211
,002
)
(218
,086
)
97,9
42
94,8
73 357,
282
469,
509
Profit / (Loss) Before Taxation Profit / (Loss) After Taxation
Rs.
in '0
00
2019 20202011 2012 2013 2014 2015 2016 2017 2018
Paid up Capital & Total Equity
390,
851
3,15
4,06
7
586,
277
4,46
3,79
8
586,
277
5,31
1,29
2
586,
277
4,59
0,51
3
586,
277
2,5
15,1
37
586,
277
3,1
72,6
03
586,
277
2,27
0,09
3
586,
277
586,
277
1,83
4,13
0
2,11
6,33
0
615,
591
2,45
2,35
8
Equity Paid up Capital
57Annual Report 202056 Cyan Limited
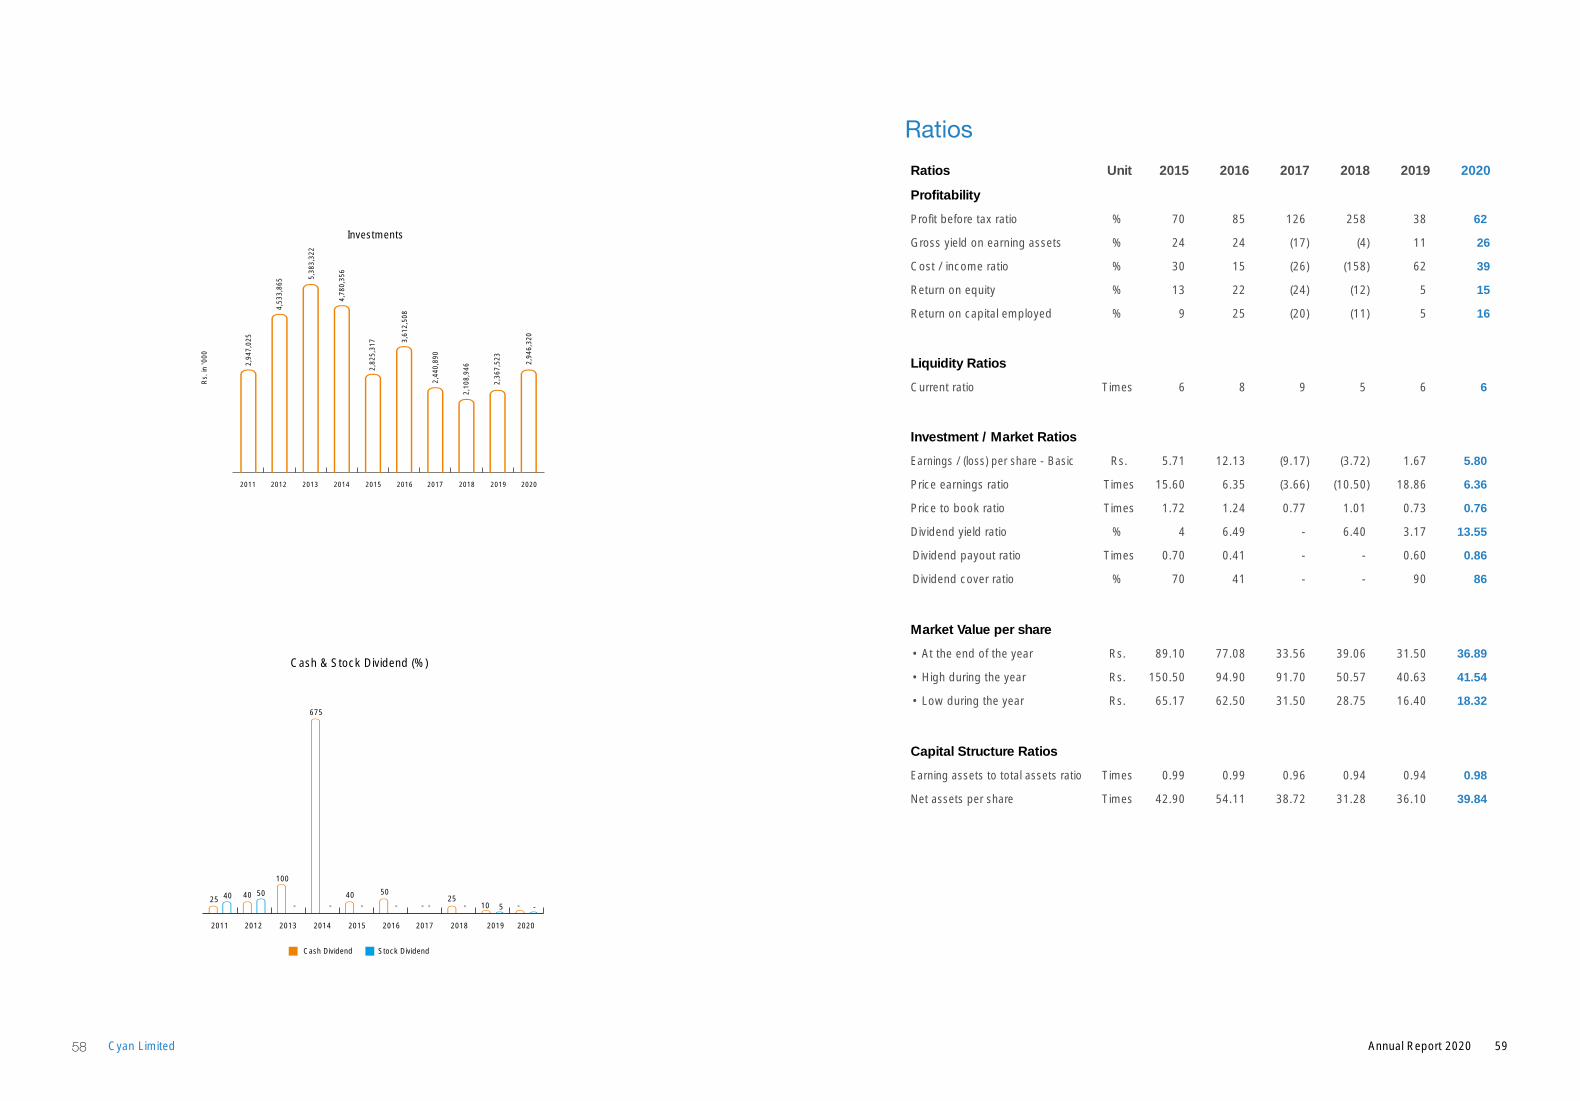
Rs.
in '0
00
2019 20202011 2012 2013 2014 2015 2016 2017 2018
Investments2,
947,
025
4,53
3,86
5 5,38
3,32
2
4,78
0,35
6
2,82
5,31
7 3,61
2,50
8
2,44
0,89
0
2,10
8,94
6
2,36
7,52
3
2,94
6,32
0
2019 20202011 2012 2013 2014 2015 2016 2017 2018
Cash & Stock Dividend (%)
25 40 40 50
100
675
40 50
-- -- - - 10 5 - --25
Stock DividendCash Dividend
Ratios Unit 2015 2016 2017 2018 2019 2020
Profitability
Profit before tax ratio % 70 85 126 258 38 62
Gross yield on earning assets % 24 24 (17) (4) 11 26
Cost / income ratio % 30 15 (26) (158) 62 39
Return on equity % 13 22 (24) (12) 5 15
Return on capital employed % 9 25 (20) (11) 5 16
Liquidity Ratios
Current ratio Times 6 8 9 5 6 6
Investment / Market Ratios
Earnings / (loss) per share - Basic Rs. 5.71 12.13 (9.17) (3.72) 1.67 5.80
Price earnings ratio Times 15.60 6.35 (3.66) (10.50) 18.86 6.36
Price to book ratio Times 1.72 1.24 0.77 1.01 0.73 0.76
Dividend yield ratio % 4 6.49 - 6.40 3.17 13.55
Dividend payout ratio Times 0.70 0.41 - - 0.60 0.86
Dividend cover ratio % 70 41 - - 90 86
Market Value per share
• At the end of the year Rs. 89.10 77.08 33.56 39.06 31.50 36.89
• High during the year Rs. 150.50 94.90 91.70 50.57 40.63 41.54
• Low during the year Rs. 65.17 62.50 31.50 28.75 16.40 18.32
Capital Structure Ratios
Earning assets to total assets ratio Times 0.99 0.99 0.96 0.94 0.94 0.98
Net assets per share Times 42.90 54.11 38.72 31.28 36.10 39.84
Ratios
59Annual Report 202058 Cyan Limited
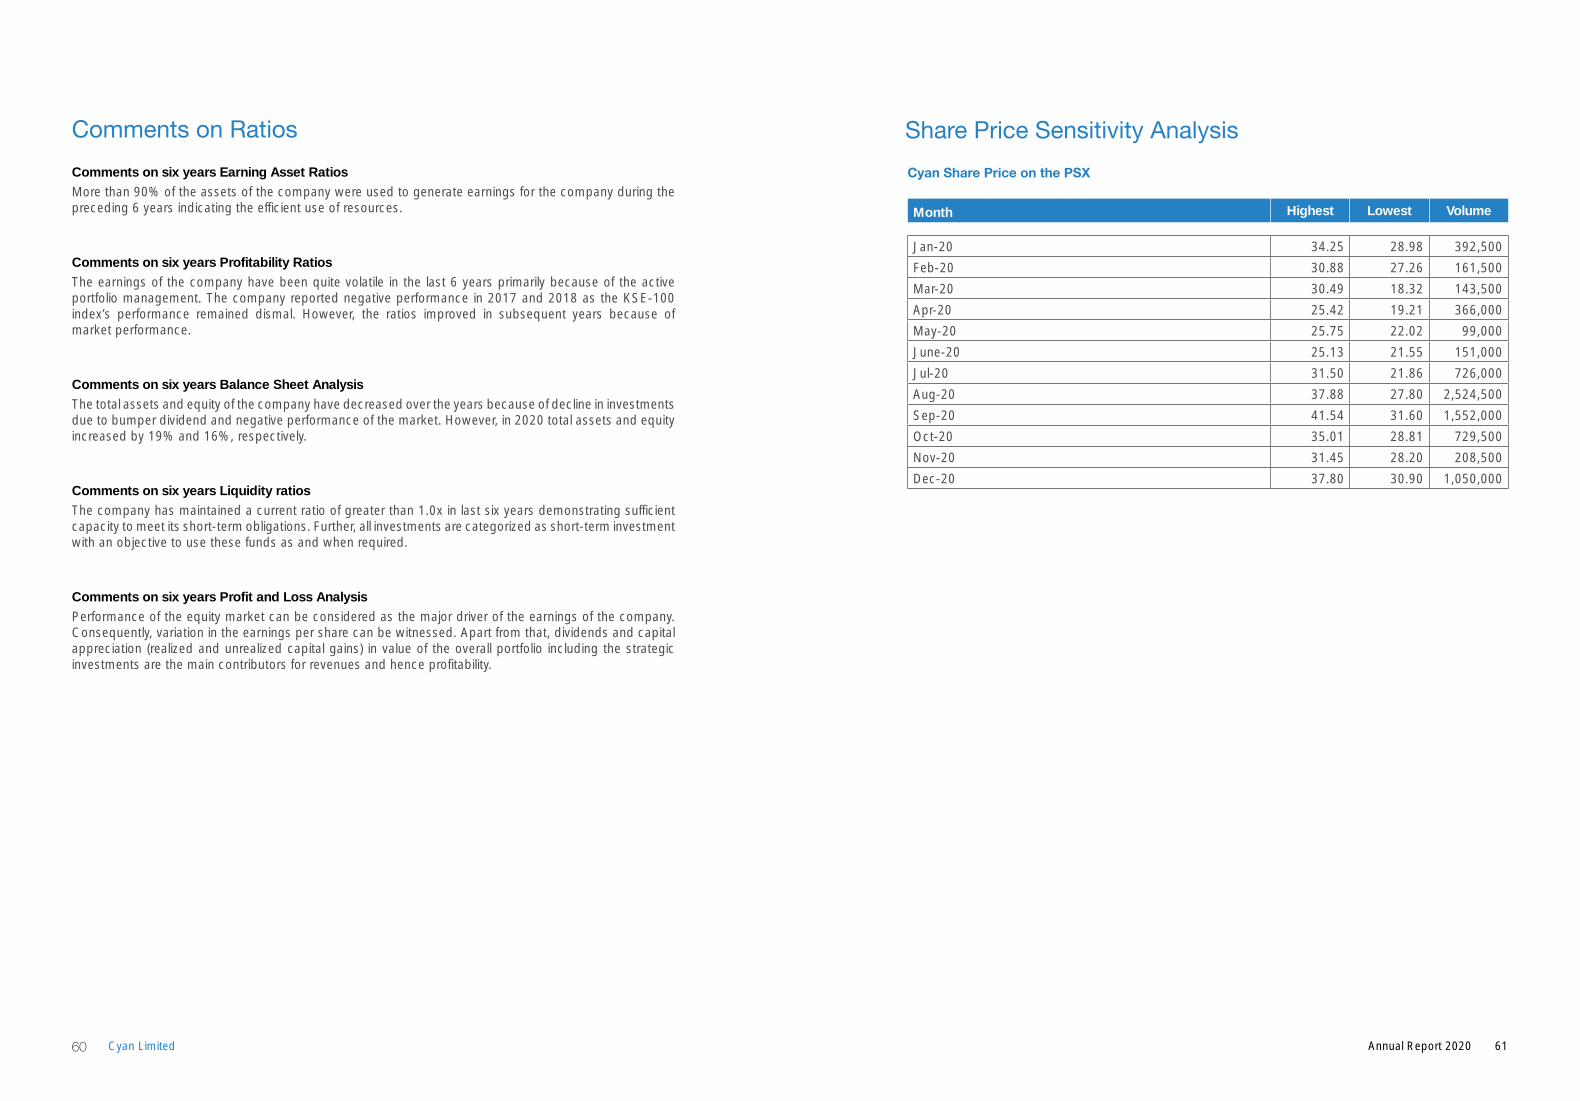
Comments on RatiosComments on six years Earning Asset Ratios
More than 90% of the assets of the company were used to generate earnings for the company during the preceding 6 years indicating the efficient use of resources.
Comments on six years Profitability Ratios
The earnings of the company have been quite volatile in the last 6 years primarily because of the active portfolio management. The company reported negative performance in 2017 and 2018 as the KSE-100 index’s performance remained dismal. However, the ratios improved in subsequent years because of market performance.
Comments on six years Balance Sheet Analysis
The total assets and equity of the company have decreased over the years because of decline in investments due to bumper dividend and negative performance of the market. However, in 2020 total assets and equity increased by 19% and 16%, respectively.
Comments on six years Liquidity ratios
The company has maintained a current ratio of greater than 1.0x in last six years demonstrating sufficient capacity to meet its short-term obligations. Further, all investments are categorized as short-term investment with an objective to use these funds as and when required.
Comments on six years Profit and Loss Analysis
Performance of the equity market can be considered as the major driver of the earnings of the company. Consequently, variation in the earnings per share can be witnessed. Apart from that, dividends and capital appreciation (realized and unrealized capital gains) in value of the overall portfolio including the strategic investments are the main contributors for revenues and hence profitability.
Share Price Sensitivity AnalysisCyan Share Price on the PSX
Month Highest Lowest Volume
Jan-20 34.25 28.98 392,500
Feb-20 30.88 27.26 161,500
Mar-20 30.49 18.32 143,500
Apr-20 25.42 19.21 366,000
May-20 25.75 22.02 99,000
June-20 25.13 21.55 151,000
Jul-20 31.50 21.86 726,000
Aug-20 37.88 27.80 2,524,500
Sep-20 41.54 31.60 1,552,000
Oct-20 35.01 28.81 729,500
Nov-20 31.45 28.20 208,500
Dec-20 37.80 30.90 1,050,000
61Annual Report 202060 Cyan Limited
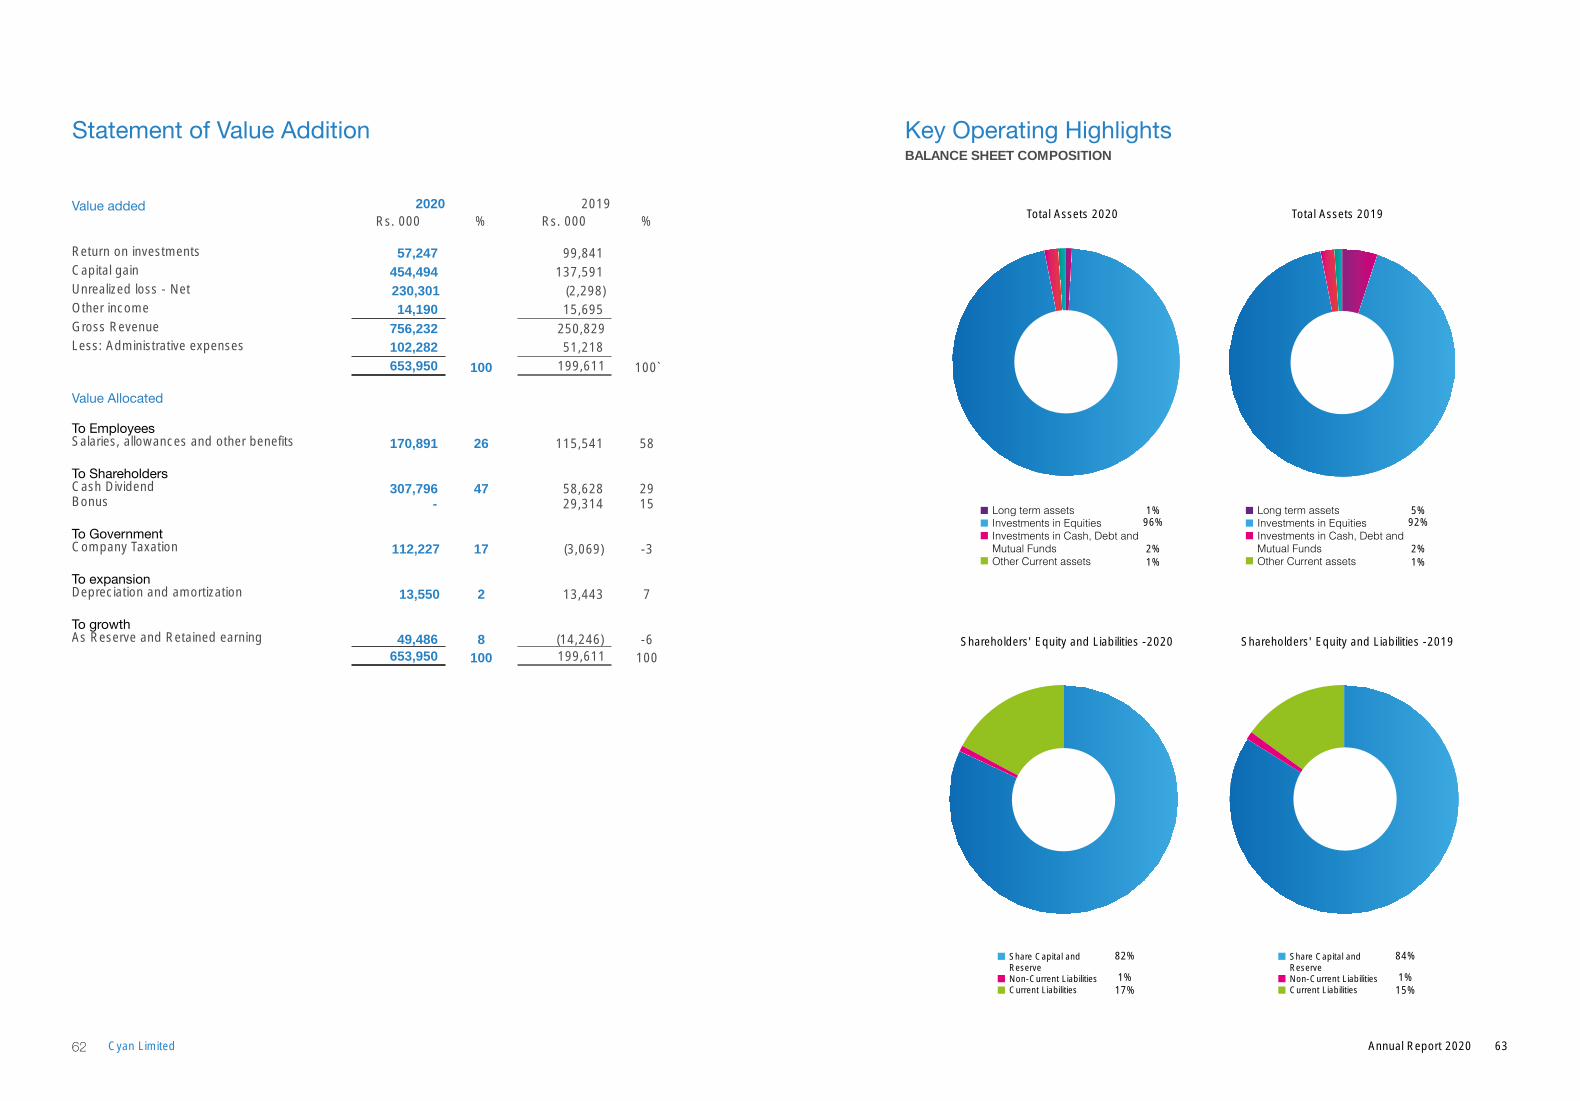
Statement of Value Addition
Value added 2020 2019Rs. 000 % Rs. 000 %
Return on investments 57,247 99,841 Capital gain 454,494 137,591 Unrealized loss - Net 230,301 (2,298)Other income 14,190 15,695 Gross Revenue 756,232 250,829 Less: Administrative expenses 102,282 51,218
653,950 100 199,611 100`
Value Allocated
To EmployeesSalaries, allowances and other benefits 170,891 26 115,541 58
To ShareholdersCash Dividend 307,796 47 58,628 29Bonus - 29,314 15
To GovernmentCompany Taxation 112,227 17 (3,069) -3
To expansionDepreciation and amortization 13,550 2 13,443 7
To growthAs Reserve and Retained earning 49,486 8 (14,246) -6
653,950 100 199,611 100
BALANCE SHEET COMPOSITION
Key Operating Highlights
Total Assets 2020
1%96%
2%1%
Long term assetsInvestments in EquitiesInvestments in Cash, Debt andMutual FundsOther Current assets
Total Assets 2019
5%92%
2%1%
Long term assetsInvestments in EquitiesInvestments in Cash, Debt andMutual FundsOther Current assets
Shareholders' Equity and Liabilities -2020
82%
1%17%
Share Capital andReserveNon-Current LiabilitiesCurrent Liabilities
Shareholders' Equity and Liabilities -2019
84%
1%15%
Share Capital andReserveNon-Current LiabilitiesCurrent Liabilities
63Annual Report 202062 Cyan Limited
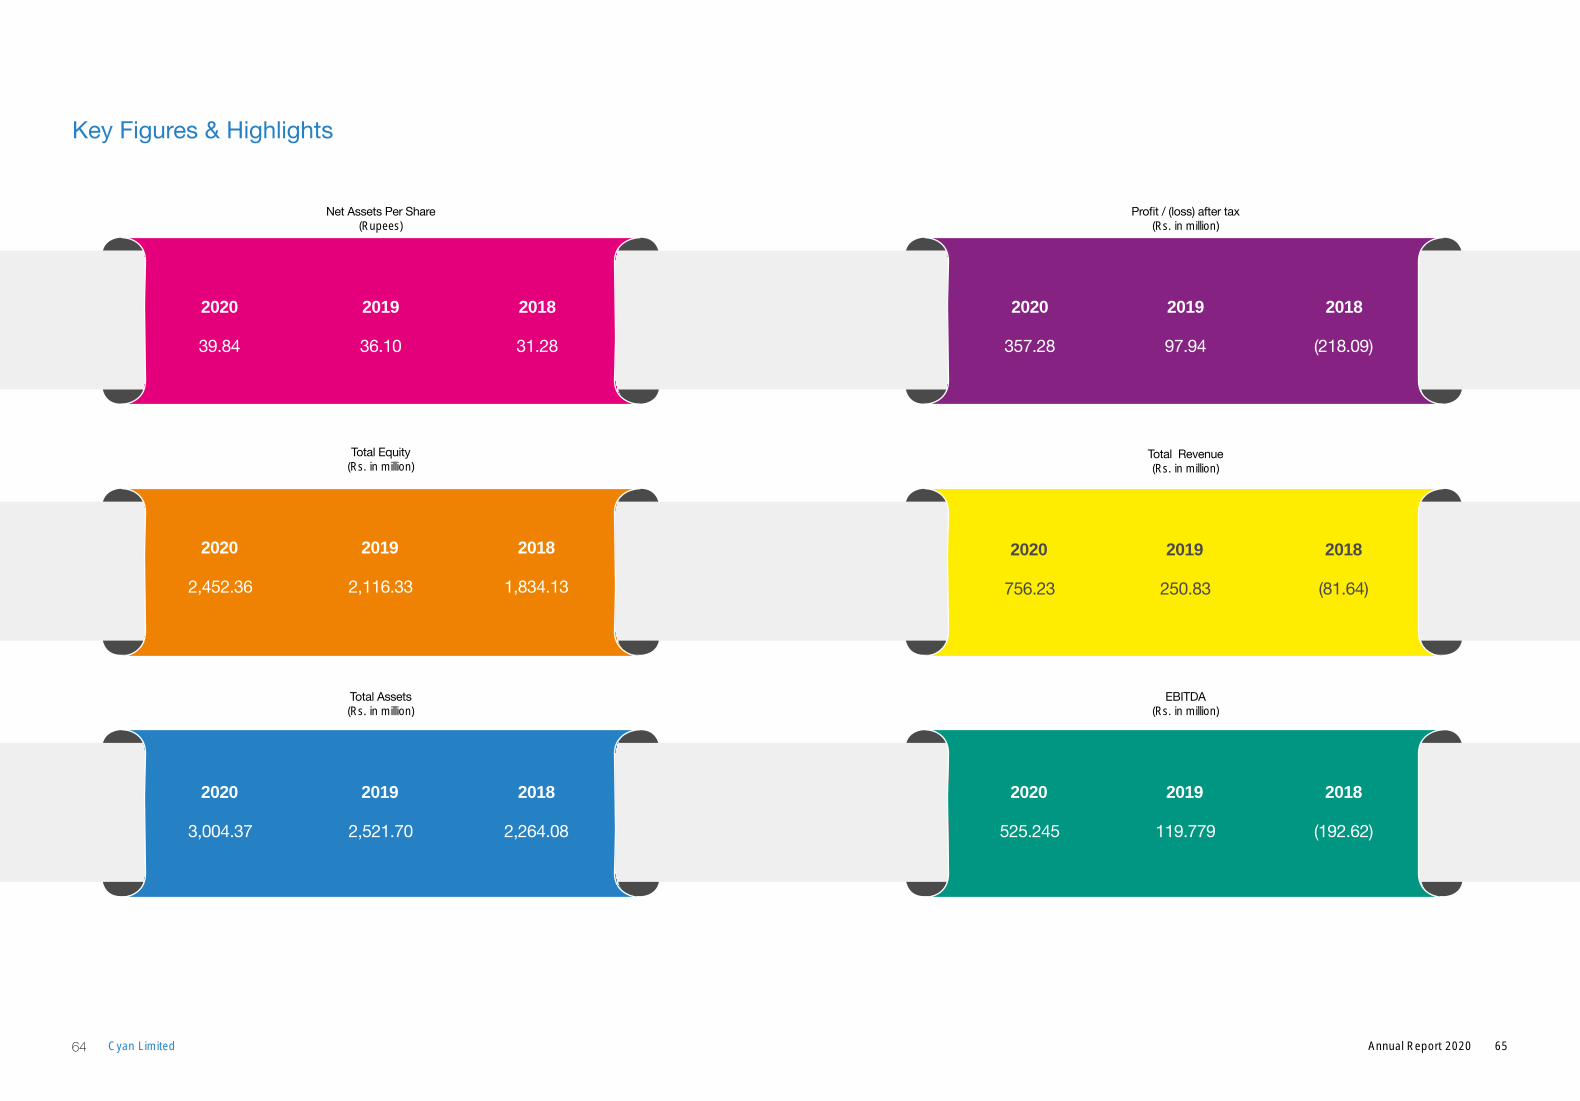
Key Figures & Highlights
Net Assets Per Share(Rupees)
2019
36.10
2020
39.84
2018
31.28
Total Equity(Rs. in million)
2019
2,116.33
2020
2,452.36
2018
1,834.13
Total Assets(Rs. in million)
2019
2,521.70
2020
3,004.37
2018
2,264.08
Profit/(loss)aftertax(Rs. in million)
2019
97.94
2020
357.28
2018
(218.09)
Total Revenue(Rs. in million)
2019
250.83
2020
756.23
2018
(81.64)
EBITDA(Rs. in million)
2019
119.779
2020
525.245
2018
(192.62)
65Annual Report 202064 Cyan Limited
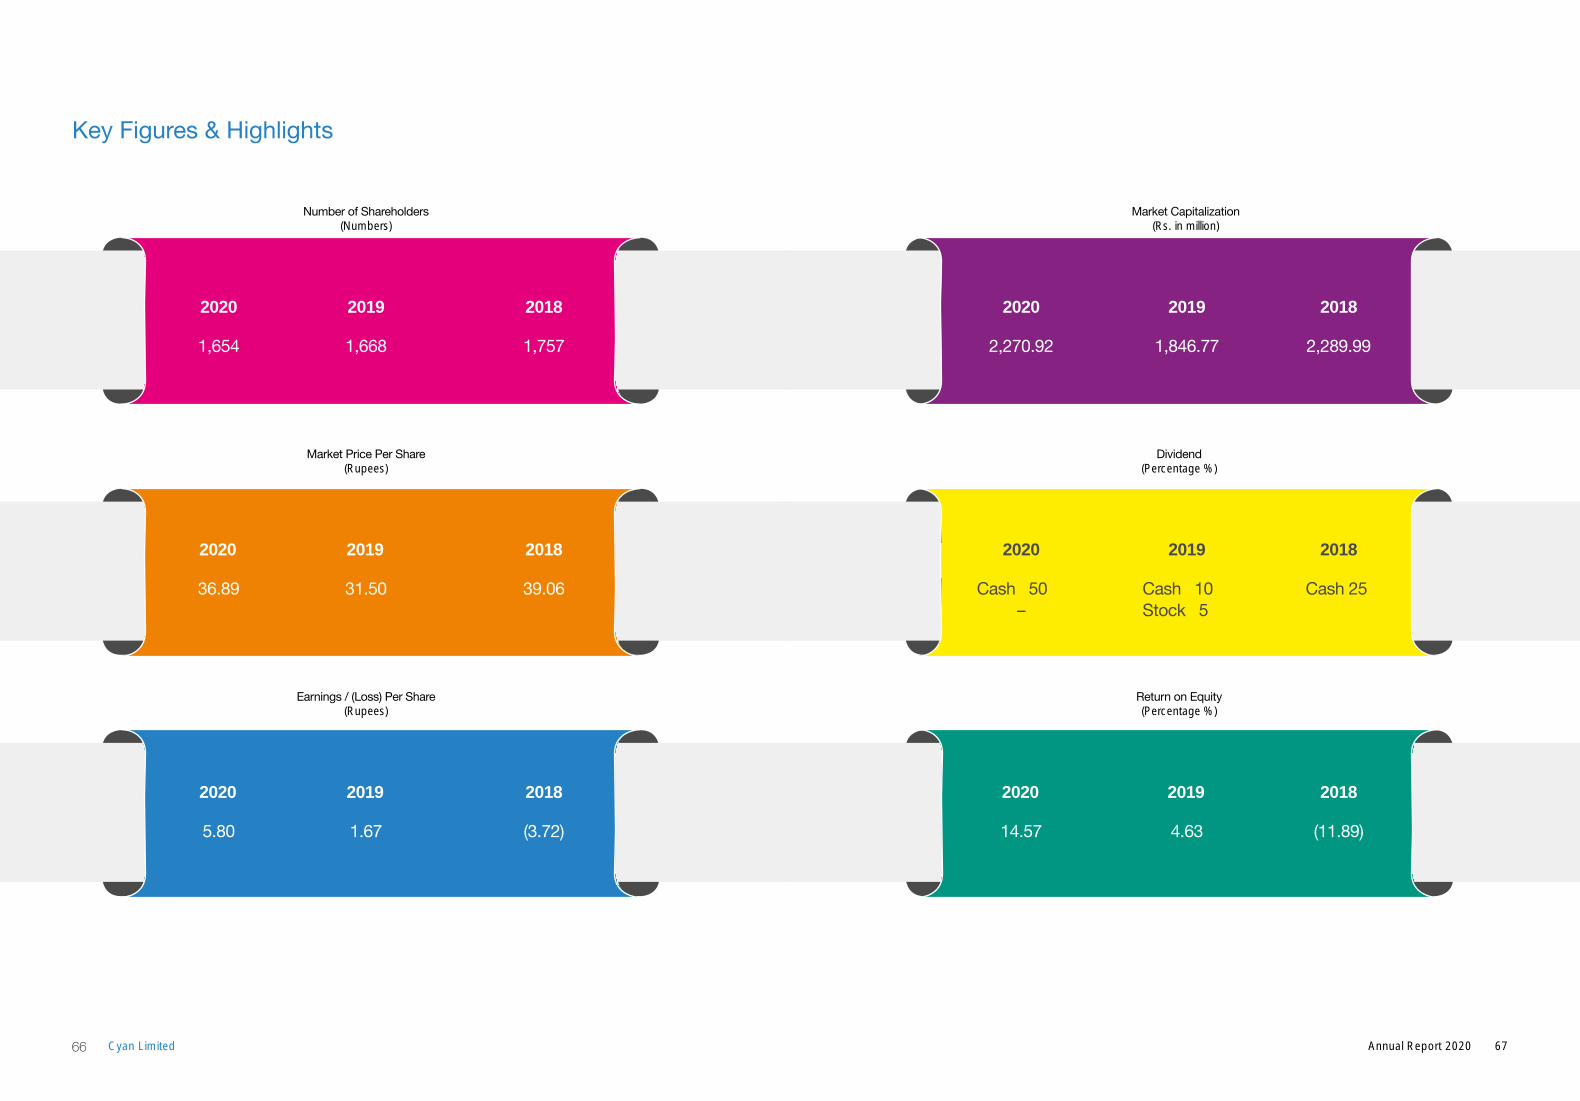
Key Figures & Highlights
Number of Shareholders(Numbers)
2019
1,668
2020
1,654
2018
1,757
Market Price Per Share(Rupees)
2019
31.50
2020
36.89
2018
39.06
Earnings/(Loss)PerShare(Rupees)
2019
1.67
2020
5.80
2018
(3.72)
Market Capitalization(Rs. in million)
20192020
1,846.772,270.92
2018
2,289.99
Dividend (Percentage %)
20192020
Cash 10Stock 5
Cash 50–
2018
Cash 25
Return on Equity(Percentage %)
2019
4.63
2020
14.57
2018
(11.89)
67Annual Report 202066 Cyan Limited
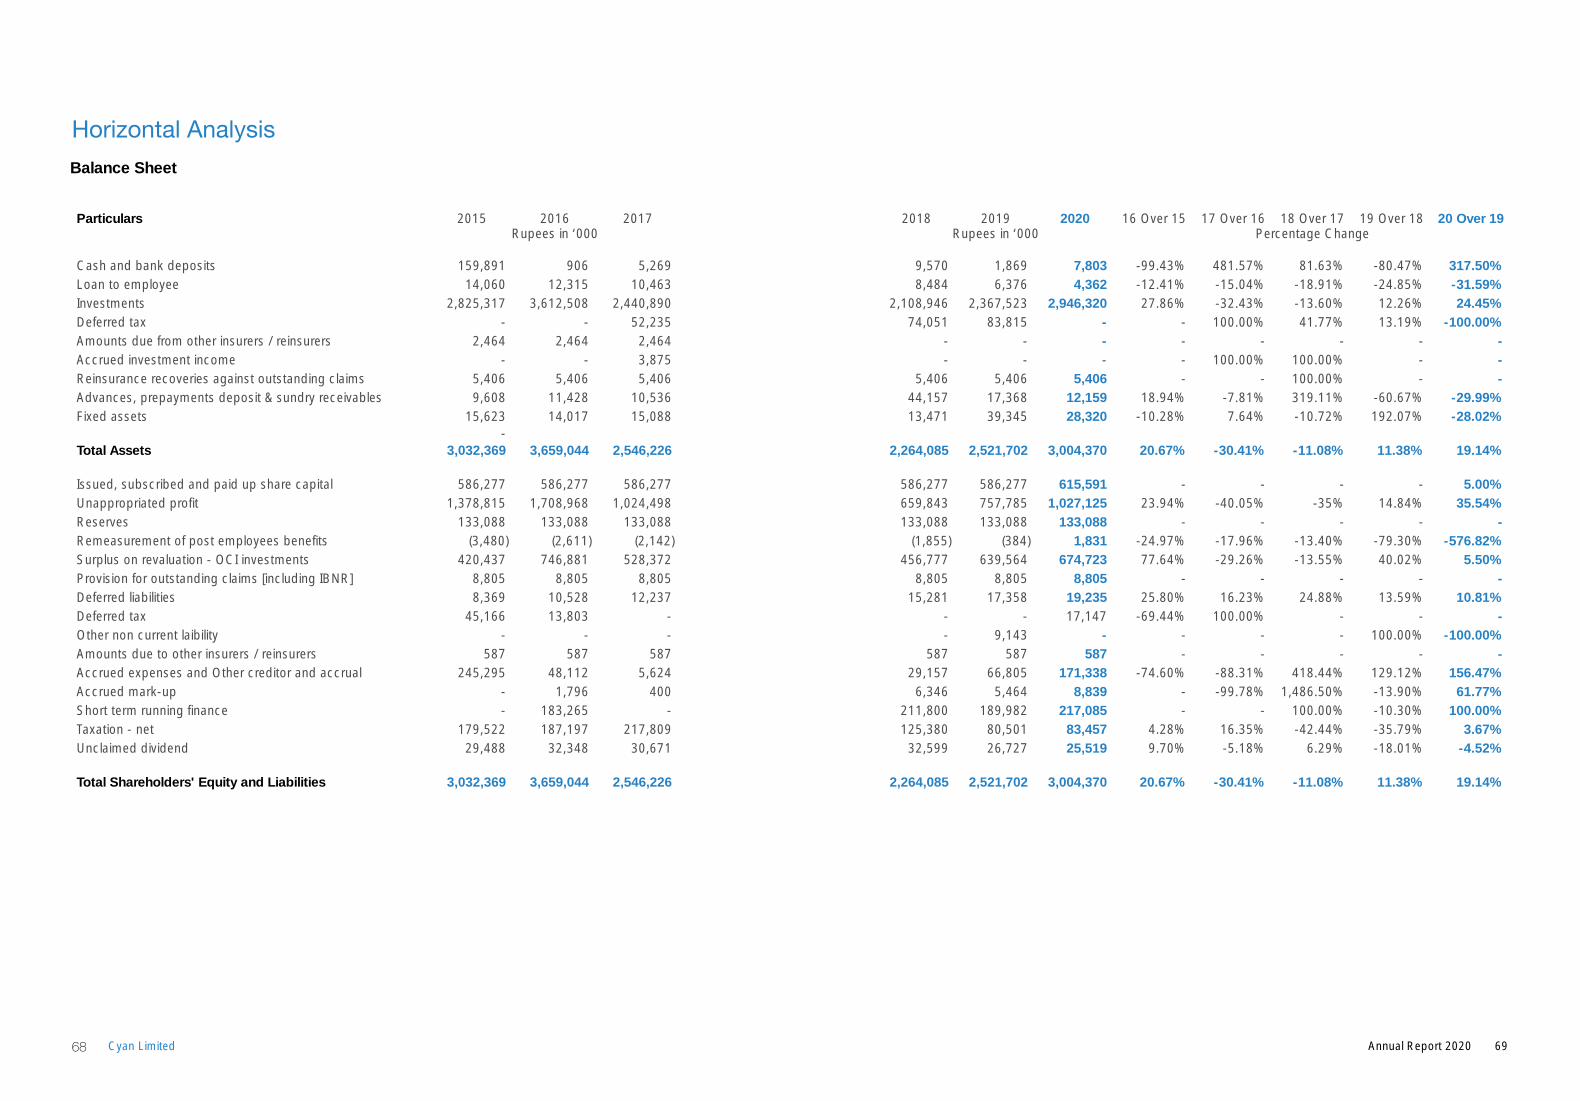
Horizontal AnalysisBalance Sheet
Particulars 2015 2016 2017 2018 2019 2020 16 Over 15 17 Over 16 18 Over 17 19 Over 18 20 Over 19Rupees in ‘000 Rupees in ‘000 Percentage Change
Cash and bank deposits 159,891 906 5,269 9,570 1,869 7,803 -99.43% 481.57% 81.63% -80.47% 317.50%Loan to employee 14,060 12,315 10,463 8,484 6,376 4,362 -12.41% -15.04% -18.91% -24.85% -31.59%Investments 2,825,317 3,612,508 2,440,890 2,108,946 2,367,523 2,946,320 27.86% -32.43% -13.60% 12.26% 24.45%Deferred tax - - 52,235 74,051 83,815 - - 100.00% 41.77% 13.19% -100.00%Amounts due from other insurers / reinsurers 2,464 2,464 2,464 - - - - - - - - Accrued investment income - - 3,875 - - - - 100.00% 100.00% - - Reinsurance recoveries against outstanding claims 5,406 5,406 5,406 5,406 5,406 5,406 - - 100.00% - -Advances, prepayments deposit & sundry receivables 9,608 11,428 10,536 44,157 17,368 12,159 18.94% -7.81% 319.11% -60.67% -29.99%Fixed assets 15,623 14,017 15,088 13,471 39,345 28,320 -10.28% 7.64% -10.72% 192.07% -28.02%
- Total Assets 3,032,369 3,659,044 2,546,226 2,264,085 2,521,702 3,004,370 20.67% -30.41% -11.08% 11.38% 19.14%
Issued, subscribed and paid up share capital 586,277 586,277 586,277 586,277 586,277 615,591 - - - - 5.00%Unappropriated profit 1,378,815 1,708,968 1,024,498 659,843 757,785 1,027,125 23.94% -40.05% -35% 14.84% 35.54%Reserves 133,088 133,088 133,088 133,088 133,088 133,088 - - - - - Remeasurement of post employees benefits (3,480) (2,611) (2,142) (1,855) (384) 1,831 -24.97% -17.96% -13.40% -79.30% -576.82%Surplus on revaluation - OCI investments 420,437 746,881 528,372 456,777 639,564 674,723 77.64% -29.26% -13.55% 40.02% 5.50%Provision for outstanding claims [including IBNR] 8,805 8,805 8,805 8,805 8,805 8,805 - - - - - Deferred liabilities 8,369 10,528 12,237 15,281 17,358 19,235 25.80% 16.23% 24.88% 13.59% 10.81%Deferred tax 45,166 13,803 - - - 17,147 -69.44% 100.00% - - - Other non current laibility - - - - 9,143 - - - - 100.00% -100.00%Amounts due to other insurers / reinsurers 587 587 587 587 587 587 - - - - - Accrued expenses and Other creditor and accrual 245,295 48,112 5,624 29,157 66,805 171,338 -74.60% -88.31% 418.44% 129.12% 156.47%Accrued mark-up - 1,796 400 6,346 5,464 8,839 - -99.78% 1,486.50% -13.90% 61.77%Short term running finance - 183,265 - 211,800 189,982 217,085 - - 100.00% -10.30% 100.00%Taxation - net 179,522 187,197 217,809 125,380 80,501 83,457 4.28% 16.35% -42.44% -35.79% 3.67%Unclaimed dividend 29,488 32,348 30,671 32,599 26,727 25,519 9.70% -5.18% 6.29% -18.01% -4.52%
Total Shareholders' Equity and Liabilities 3,032,369 3,659,044 2,546,226 2,264,085 2,521,702 3,004,370 20.67% -30.41% -11.08% 11.38% 19.14%
69Annual Report 202068 Cyan Limited
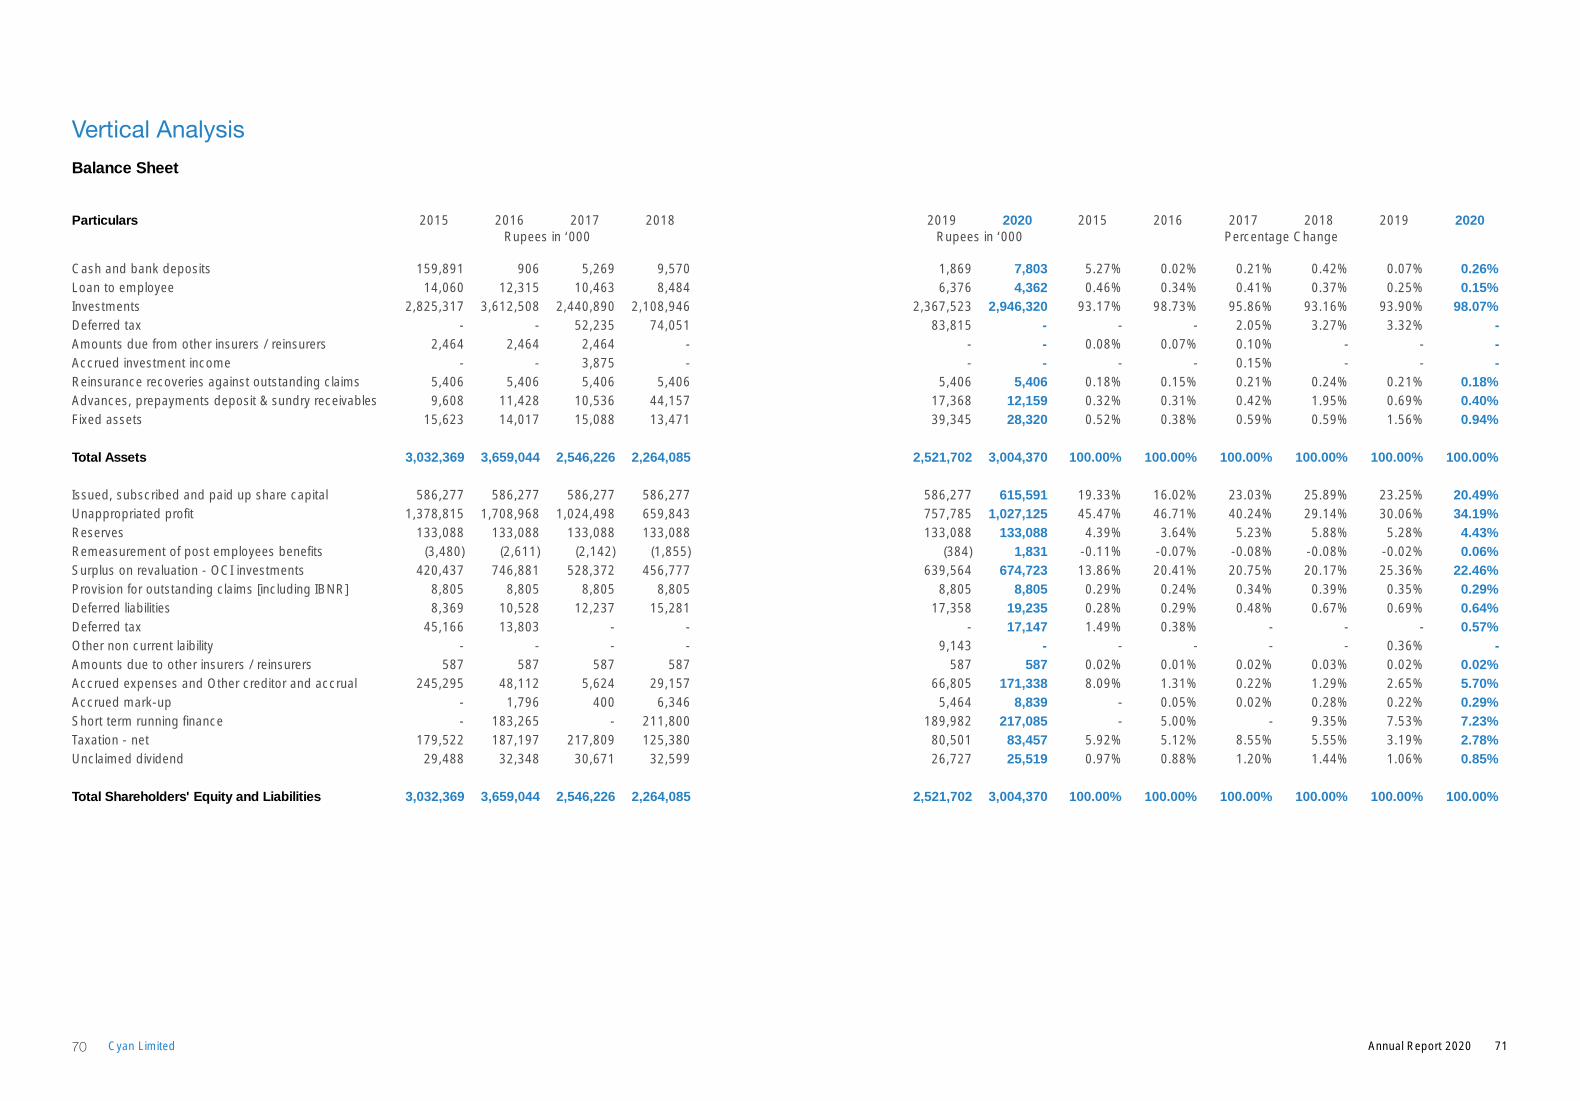
Balance Sheet
Vertical Analysis
Particulars 2015 2016 2017 2018 2019 2020 2015 2016 2017 2018 2019 2020Rupees in ‘000 Rupees in ‘000 Percentage Change
Cash and bank deposits 159,891 906 5,269 9,570 1,869 7,803 5.27% 0.02% 0.21% 0.42% 0.07% 0.26%Loan to employee 14,060 12,315 10,463 8,484 6,376 4,362 0.46% 0.34% 0.41% 0.37% 0.25% 0.15%Investments 2,825,317 3,612,508 2,440,890 2,108,946 2,367,523 2,946,320 93.17% 98.73% 95.86% 93.16% 93.90% 98.07%Deferred tax - - 52,235 74,051 83,815 - - - 2.05% 3.27% 3.32% -Amounts due from other insurers / reinsurers 2,464 2,464 2,464 - - - 0.08% 0.07% 0.10% - - -Accrued investment income - - 3,875 - - - - - 0.15% - - -Reinsurance recoveries against outstanding claims 5,406 5,406 5,406 5,406 5,406 5,406 0.18% 0.15% 0.21% 0.24% 0.21% 0.18%Advances, prepayments deposit & sundry receivables 9,608 11,428 10,536 44,157 17,368 12,159 0.32% 0.31% 0.42% 1.95% 0.69% 0.40%Fixed assets 15,623 14,017 15,088 13,471 39,345 28,320 0.52% 0.38% 0.59% 0.59% 1.56% 0.94%
Total Assets 3,032,369 3,659,044 2,546,226 2,264,085 2,521,702 3,004,370 100.00% 100.00% 100.00% 100.00% 100.00% 100.00%
Issued, subscribed and paid up share capital 586,277 586,277 586,277 586,277 586,277 615,591 19.33% 16.02% 23.03% 25.89% 23.25% 20.49%Unappropriated profit 1,378,815 1,708,968 1,024,498 659,843 757,785 1,027,125 45.47% 46.71% 40.24% 29.14% 30.06% 34.19%Reserves 133,088 133,088 133,088 133,088 133,088 133,088 4.39% 3.64% 5.23% 5.88% 5.28% 4.43%Remeasurement of post employees benefits (3,480) (2,611) (2,142) (1,855) (384) 1,831 -0.11% -0.07% -0.08% -0.08% -0.02% 0.06%Surplus on revaluation - OCI investments 420,437 746,881 528,372 456,777 639,564 674,723 13.86% 20.41% 20.75% 20.17% 25.36% 22.46%Provision for outstanding claims [including IBNR] 8,805 8,805 8,805 8,805 8,805 8,805 0.29% 0.24% 0.34% 0.39% 0.35% 0.29%Deferred liabilities 8,369 10,528 12,237 15,281 17,358 19,235 0.28% 0.29% 0.48% 0.67% 0.69% 0.64%Deferred tax 45,166 13,803 - - - 17,147 1.49% 0.38% - - - 0.57%Other non current laibility - - - - 9,143 - - - - - 0.36% -Amounts due to other insurers / reinsurers 587 587 587 587 587 587 0.02% 0.01% 0.02% 0.03% 0.02% 0.02%Accrued expenses and Other creditor and accrual 245,295 48,112 5,624 29,157 66,805 171,338 8.09% 1.31% 0.22% 1.29% 2.65% 5.70%Accrued mark-up - 1,796 400 6,346 5,464 8,839 - 0.05% 0.02% 0.28% 0.22% 0.29%Short term running finance - 183,265 - 211,800 189,982 217,085 - 5.00% - 9.35% 7.53% 7.23%Taxation - net 179,522 187,197 217,809 125,380 80,501 83,457 5.92% 5.12% 8.55% 5.55% 3.19% 2.78%Unclaimed dividend 29,488 32,348 30,671 32,599 26,727 25,519 0.97% 0.88% 1.20% 1.44% 1.06% 0.85%
Total Shareholders' Equity and Liabilities 3,032,369 3,659,044 2,546,226 2,264,085 2,521,702 3,004,370 100.00% 100.00% 100.00% 100.00% 100.00% 100.00%
71Annual Report 202070 Cyan Limited
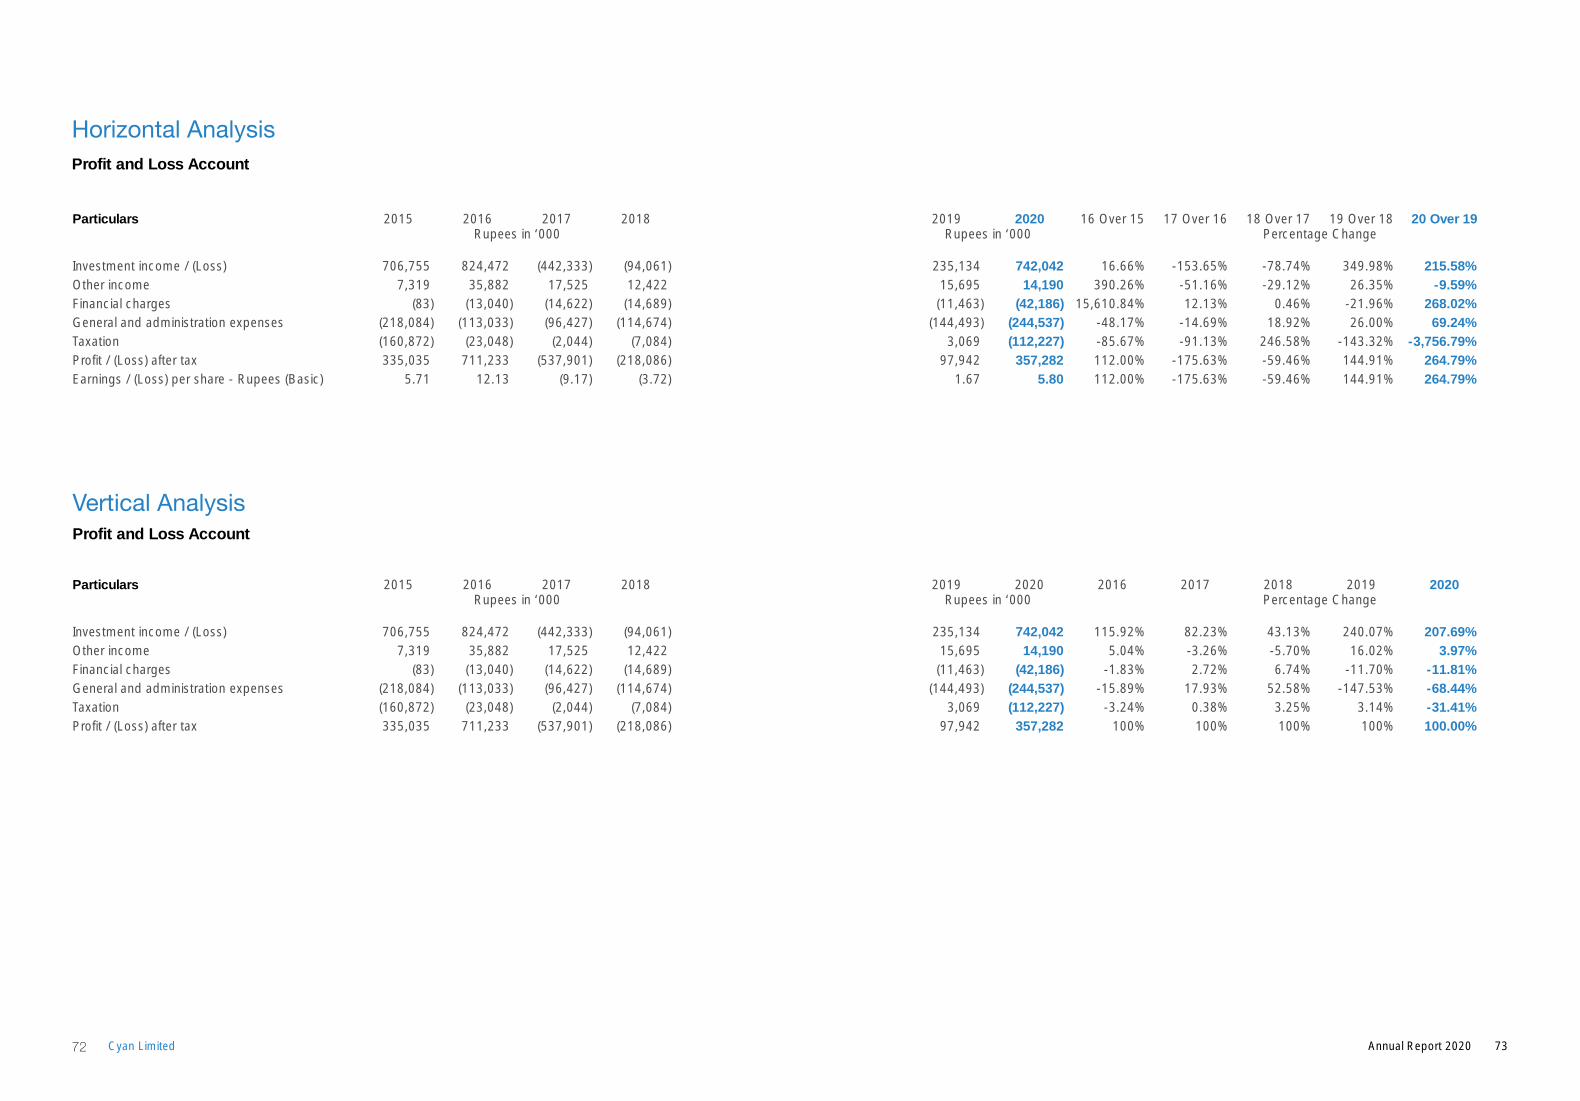
Horizontal Analysis
Particulars 2015 2016 2017 2018 2019 2020 16 Over 15 17 Over 16 18 Over 17 19 Over 18 20 Over 19Rupees in ‘000 Rupees in ‘000 Percentage Change
Investment income / (Loss) 706,755 824,472 (442,333) (94,061) 235,134 742,042 16.66% -153.65% -78.74% 349.98% 215.58%Other income 7,319 35,882 17,525 12,422 15,695 14,190 390.26% -51.16% -29.12% 26.35% -9.59%Financial charges (83) (13,040) (14,622) (14,689) (11,463) (42,186) 15,610.84% 12.13% 0.46% -21.96% 268.02%General and administration expenses (218,084) (113,033) (96,427) (114,674) (144,493) (244,537) -48.17% -14.69% 18.92% 26.00% 69.24%Taxation (160,872) (23,048) (2,044) (7,084) 3,069 (112,227) -85.67% -91.13% 246.58% -143.32% -3,756.79%Profit / (Loss) after tax 335,035 711,233 (537,901) (218,086) 97,942 357,282 112.00% -175.63% -59.46% 144.91% 264.79%Earnings / (Loss) per share - Rupees (Basic) 5.71 12.13 (9.17) (3.72) 1.67 5.80 112.00% -175.63% -59.46% 144.91% 264.79%
Vertical Analysis Profit and Loss Account
Particulars 2015 2016 2017 2018 2019 2020 2016 2017 2018 2019 2020Rupees in ‘000 Rupees in ‘000 Percentage Change
Investment income / (Loss) 706,755 824,472 (442,333) (94,061) 235,134 742,042 115.92% 82.23% 43.13% 240.07% 207.69%Other income 7,319 35,882 17,525 12,422 15,695 14,190 5.04% -3.26% -5.70% 16.02% 3.97%Financial charges (83) (13,040) (14,622) (14,689) (11,463) (42,186) -1.83% 2.72% 6.74% -11.70% -11.81%General and administration expenses (218,084) (113,033) (96,427) (114,674) (144,493) (244,537) -15.89% 17.93% 52.58% -147.53% -68.44%Taxation (160,872) (23,048) (2,044) (7,084) 3,069 (112,227) -3.24% 0.38% 3.25% 3.14% -31.41%Profit / (Loss) after tax 335,035 711,233 (537,901) (218,086) 97,942 357,282 100% 100% 100% 100% 100.00%
Profit and Loss Account
73Annual Report 202072 Cyan Limited
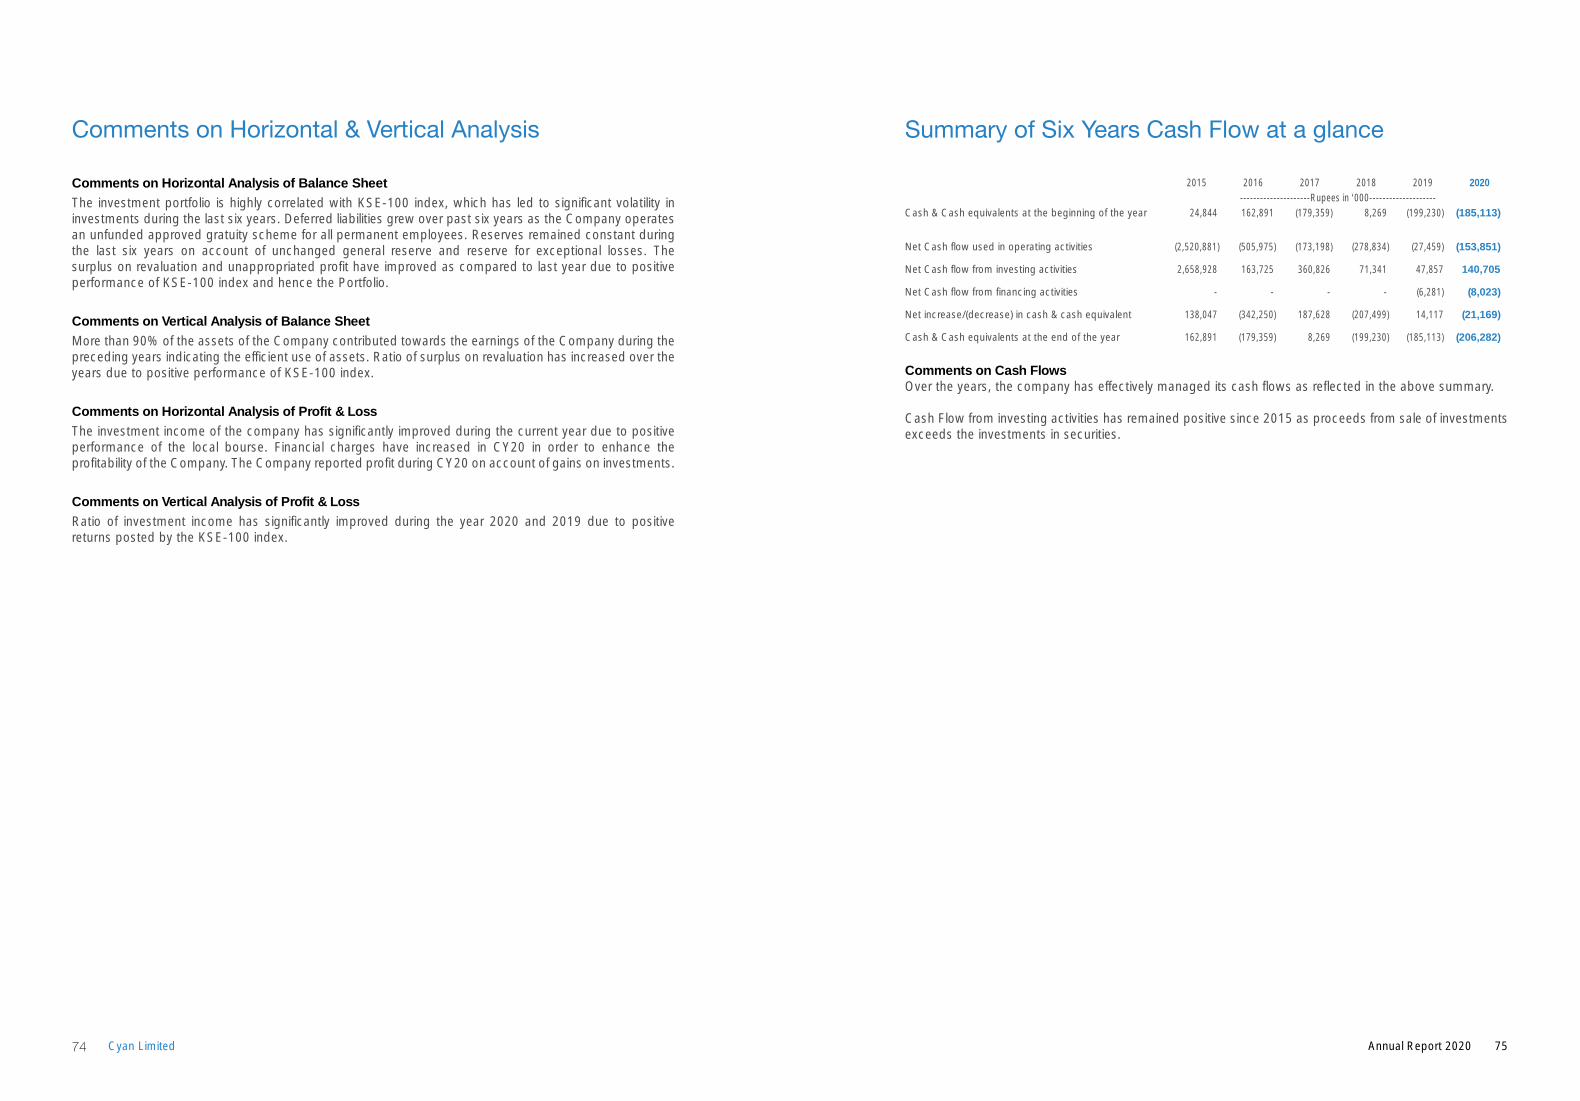
Comments on Horizontal Analysis of Balance Sheet
The investment portfolio is highly correlated with KSE-100 index, which has led to significant volatility in investments during the last six years. Deferred liabilities grew over past six years as the Company operates an unfunded approved gratuity scheme for all permanent employees. Reserves remained constant during the last six years on account of unchanged general reserve and reserve for exceptional losses. The surplus on revaluation and unappropriated profit have improved as compared to last year due to positive performance of KSE-100 index and hence the Portfolio.
Comments on Vertical Analysis of Balance Sheet
More than 90% of the assets of the Company contributed towards the earnings of the Company during the preceding years indicating the efficient use of assets. Ratio of surplus on revaluation has increased over the years due to positive performance of KSE-100 index.
Comments on Horizontal Analysis of Profit & Loss
The investment income of the company has significantly improved during the current year due to positive performance of the local bourse. Financial charges have increased in CY20 in order to enhance the profitability of the Company. The Company reported profit during CY20 on account of gains on investments.
Comments on Vertical Analysis of Profit & Loss
Ratio of investment income has significantly improved during the year 2020 and 2019 due to positive returns posted by the KSE-100 index.
Comments on Horizontal & Vertical Analysis Summary of Six Years Cash Flow at a glance
2015 2016 2017 2018 2019 2020---------------------Rupees in ‘000--------------------
Cash & Cash equivalents at the beginning of the year 24,844 162,891 (179,359) 8,269 (199,230) (185,113)
Net Cash flow used in operating activities (2,520,881) (505,975) (173,198) (278,834) (27,459) (153,851)
Net Cash flow from investing activities 2,658,928 163,725 360,826 71,341 47,857 140,705
Net Cash flow from financing activities - - - - (6,281) (8,023)
Net increase/(decrease) in cash & cash equivalent 138,047 (342,250) 187,628 (207,499) 14,117 (21,169)
Cash & Cash equivalents at the end of the year 162,891 (179,359) 8,269 (199,230) (185,113) (206,282)
Comments on Cash FlowsOver the years, the company has effectively managed its cash flows as reflected in the above summary.
Cash Flow from investing activities has remained positive since 2015 as proceeds from sale of investments exceeds the investments in securities.
75Annual Report 202074 Cyan Limited
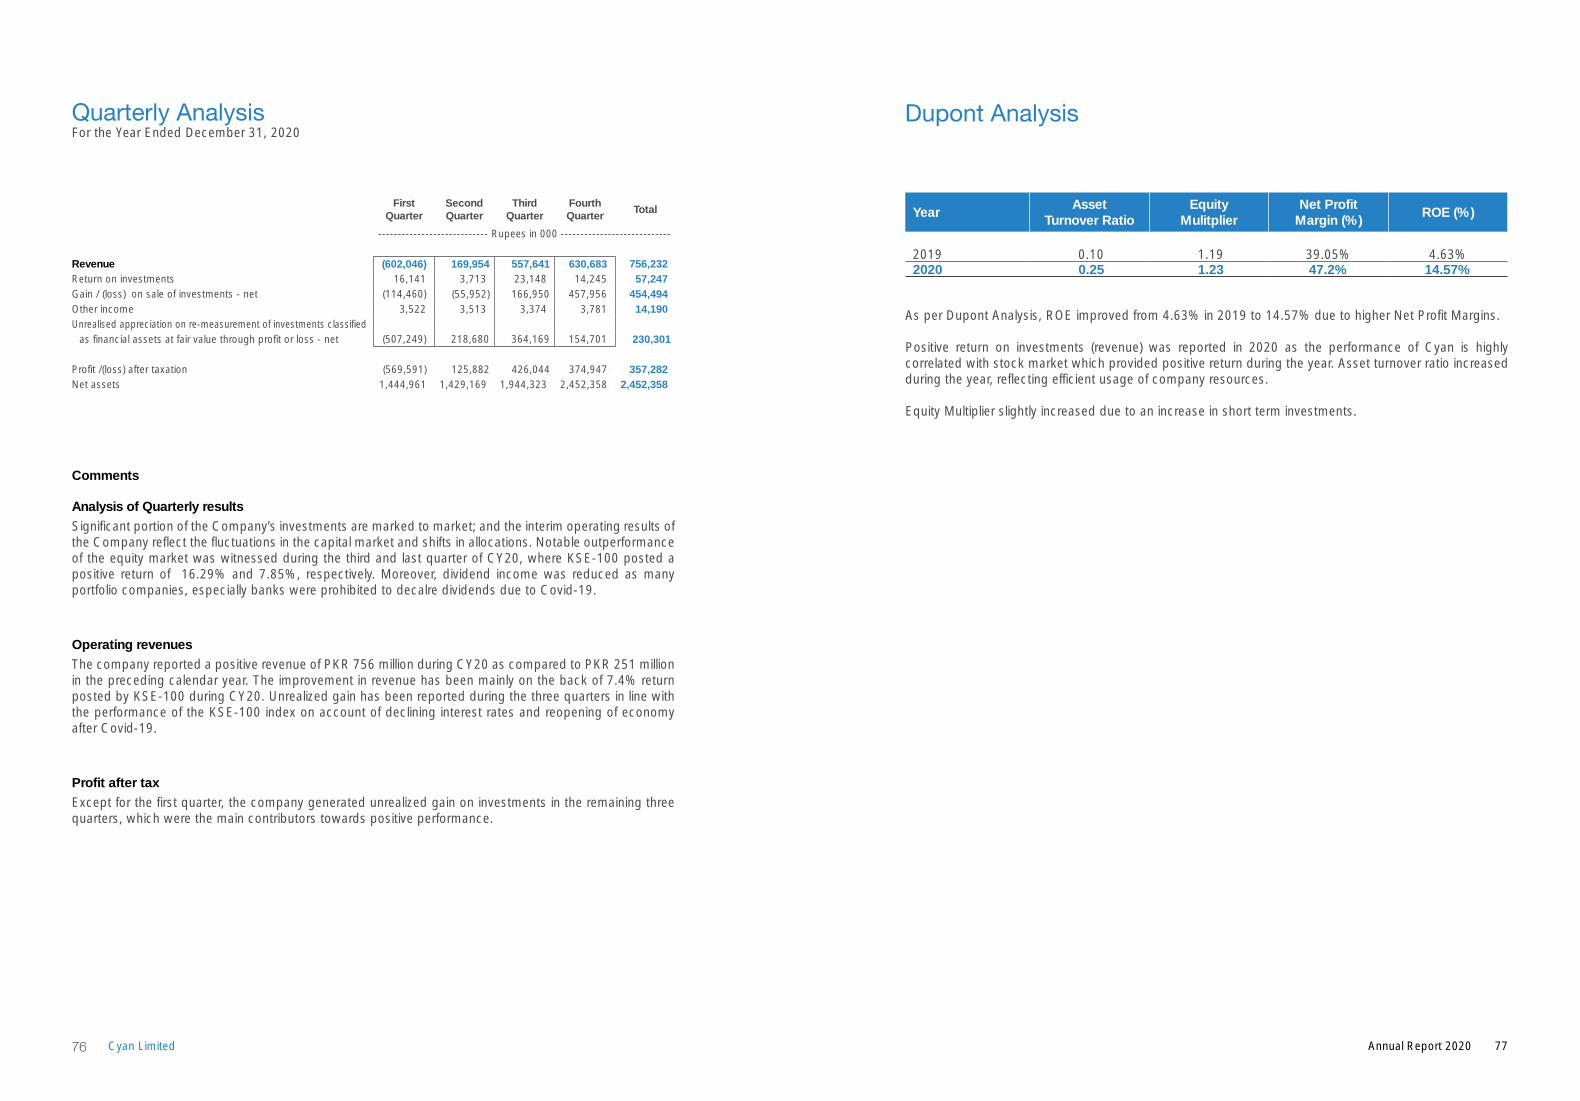
Quarterly AnalysisFor the Year Ended December 31, 2020
Comments
Analysis of Quarterly results
Significant portion of the Company’s investments are marked to market; and the interim operating results of the Company reflect the fluctuations in the capital market and shifts in allocations. Notable outperformance of the equity market was witnessed during the third and last quarter of CY20, where KSE-100 posted a positive return of 16.29% and 7.85%, respectively. Moreover, dividend income was reduced as many portfolio companies, especially banks were prohibited to decalre dividends due to Covid-19.
Operating revenues
The company reported a positive revenue of PKR 756 million during CY20 as compared to PKR 251 million in the preceding calendar year. The improvement in revenue has been mainly on the back of 7.4% return posted by KSE-100 during CY20. Unrealized gain has been reported during the three quarters in line with the performance of the KSE-100 index on account of declining interest rates and reopening of economy after Covid-19.
Profit after tax
Except for the first quarter, the company generated unrealized gain on investments in the remaining three quarters, which were the main contributors towards positive performance.
First Quarter
Second Quarter
Third Quarter
Fourth Quarter
Total
---------------------------- Rupees in 000 ----------------------------
Revenue (602,046) 169,954 557,641 630,683 756,232 Return on investments 16,141 3,713 23,148 14,245 57,247 Gain / (loss) on sale of investments - net (114,460) (55,952) 166,950 457,956 454,494 Other income 3,522 3,513 3,374 3,781 14,190 Unrealised appreciation on re-measurement of investments classified
as financial assets at fair value through profit or loss - net (507,249) 218,680 364,169 154,701 230,301
Profit /(loss) after taxation (569,591) 125,882 426,044 374,947 357,282 Net assets 1,444,961 1,429,169 1,944,323 2,452,358 2,452,358
Dupont Analysis
YearAsset
Turnover RatioEquity
MulitplierNet Profit
Margin (%)ROE (%)
2019 0.10 1.19 39.05% 4.63%2020 0.25 1.23 47.2% 14.57%
As per Dupont Analysis, ROE improved from 4.63% in 2019 to 14.57% due to higher Net Profit Margins.
Positive return on investments (revenue) was reported in 2020 as the performance of Cyan is highly correlated with stock market which provided positive return during the year. Asset turnover ratio increased during the year, reflecting efficient usage of company resources.
Equity Multiplier slightly increased due to an increase in short term investments.
77Annual Report 202076 Cyan Limited
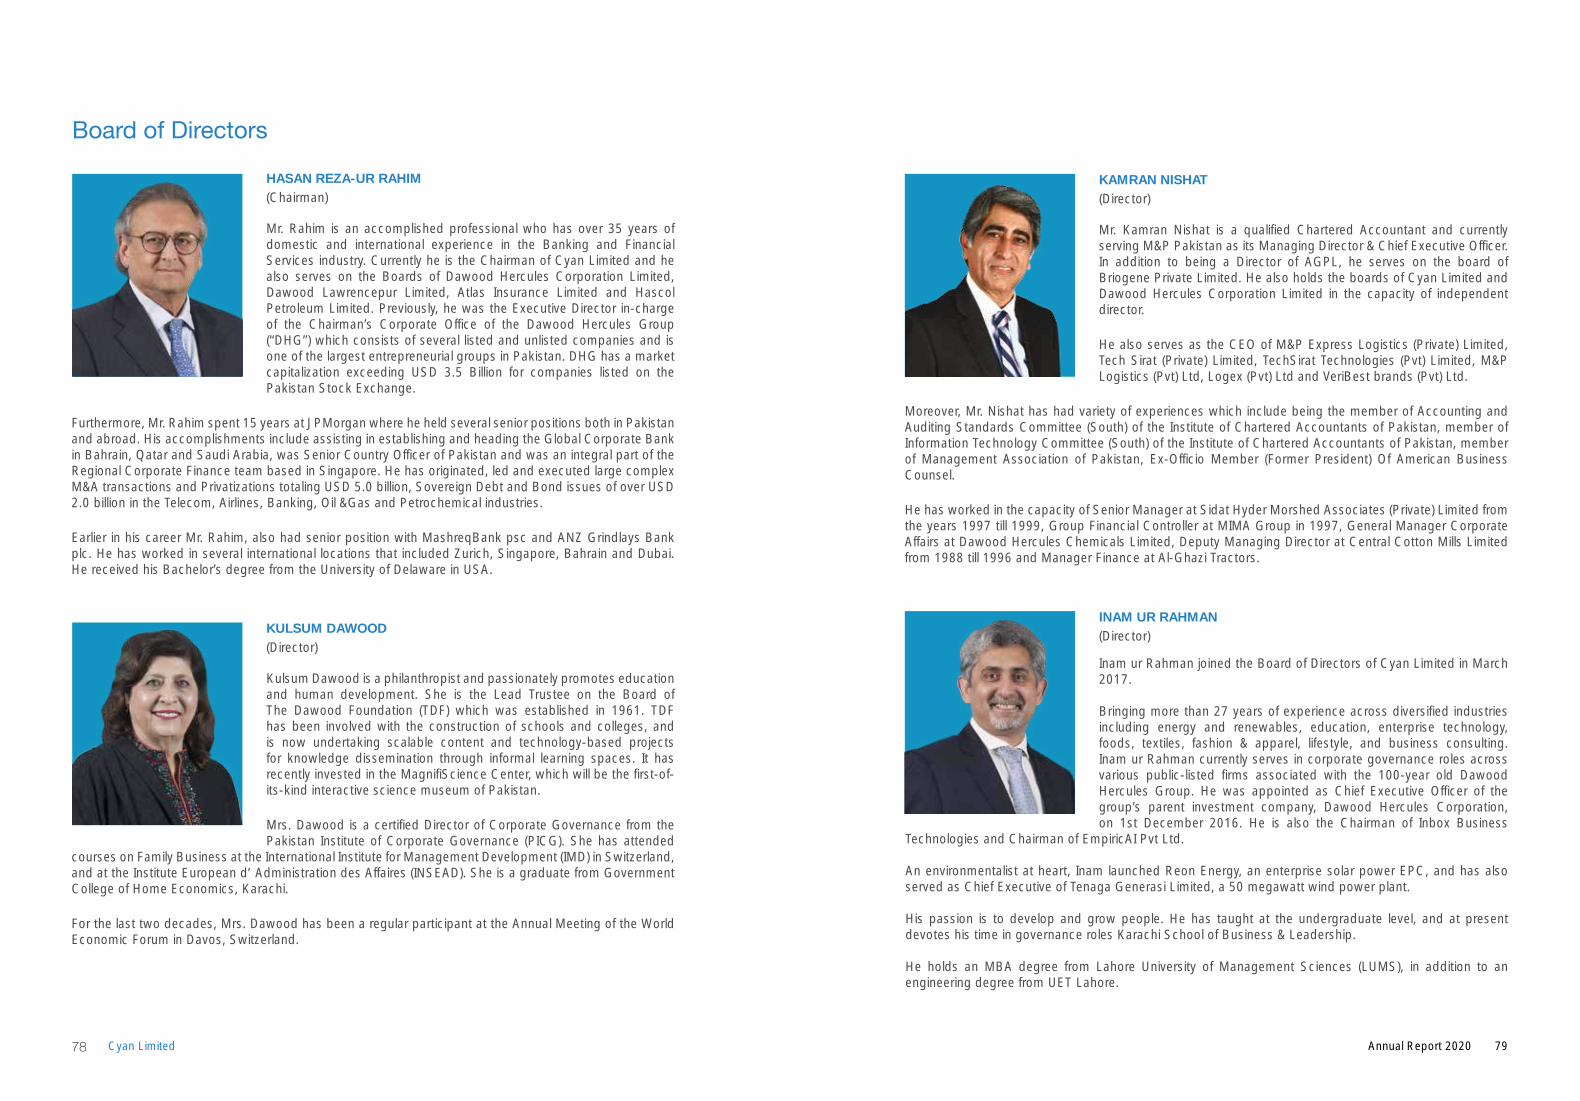
KAMRAN NISHAT (Director)
Mr. Kamran Nishat is a qualified Chartered Accountant and currently serving M&P Pakistan as its Managing Director & Chief Executive Officer. In addition to being a Director of AGPL, he serves on the board of Briogene Private Limited. He also holds the boards of Cyan Limited and Dawood Hercules Corporation Limited in the capacity of independent director.
He also serves as the CEO of M&P Express Logistics (Private) Limited, Tech Sirat (Private) Limited, TechSirat Technologies (Pvt) Limited, M&P Logistics (Pvt) Ltd, Logex (Pvt) Ltd and VeriBest brands (Pvt) Ltd.
Moreover, Mr. Nishat has had variety of experiences which include being the member of Accounting and Auditing Standards Committee (South) of the Institute of Chartered Accountants of Pakistan, member of Information Technology Committee (South) of the Institute of Chartered Accountants of Pakistan, member of Management Association of Pakistan, Ex-Officio Member (Former President) Of American Business Counsel.
He has worked in the capacity of Senior Manager at Sidat Hyder Morshed Associates (Private) Limited from the years 1997 till 1999, Group Financial Controller at MIMA Group in 1997, General Manager Corporate Affairs at Dawood Hercules Chemicals Limited, Deputy Managing Director at Central Cotton Mills Limited from 1988 till 1996 and Manager Finance at Al-Ghazi Tractors.
Board of Directors
HASAN REZA-UR RAHIM (Chairman)
Mr. Rahim is an accomplished professional who has over 35 years of domestic and international experience in the Banking and Financial Services industry. Currently he is the Chairman of Cyan Limited and he also serves on the Boards of Dawood Hercules Corporation Limited, Dawood Lawrencepur Limited, Atlas Insurance Limited and Hascol Petroleum Limited. Previously, he was the Executive Director in-charge of the Chairman’s Corporate Office of the Dawood Hercules Group (“DHG”) which consists of several listed and unlisted companies and is one of the largest entrepreneurial groups in Pakistan. DHG has a market capitalization exceeding USD 3.5 Billion for companies listed on the Pakistan Stock Exchange.
Furthermore, Mr. Rahim spent 15 years at JPMorgan where he held several senior positions both in Pakistan and abroad. His accomplishments include assisting in establishing and heading the Global Corporate Bank in Bahrain, Qatar and Saudi Arabia, was Senior Country Officer of Pakistan and was an integral part of the Regional Corporate Finance team based in Singapore. He has originated, led and executed large complex M&A transactions and Privatizations totaling USD 5.0 billion, Sovereign Debt and Bond issues of over USD 2.0 billion in the Telecom, Airlines, Banking, Oil &Gas and Petrochemical industries.
Earlier in his career Mr. Rahim, also had senior position with MashreqBank psc and ANZ Grindlays Bank plc. He has worked in several international locations that included Zurich, Singapore, Bahrain and Dubai. He received his Bachelor’s degree from the University of Delaware in USA.
KULSUM DAWOOD (Director)
Kulsum Dawood is a philanthropist and passionately promotes education and human development. She is the Lead Trustee on the Board of The Dawood Foundation (TDF) which was established in 1961. TDF has been involved with the construction of schools and colleges, and is now undertaking scalable content and technology-based projects for knowledge dissemination through informal learning spaces. It has recently invested in the MagnifiScience Center, which will be the first-of-its-kind interactive science museum of Pakistan.
Mrs. Dawood is a certified Director of Corporate Governance from the Pakistan Institute of Corporate Governance (PICG). She has attended
courses on Family Business at the International Institute for Management Development (IMD) in Switzerland, and at the Institute European d’ Administration des Affaires (INSEAD). She is a graduate from Government College of Home Economics, Karachi.
For the last two decades, Mrs. Dawood has been a regular participant at the Annual Meeting of the World Economic Forum in Davos, Switzerland.
INAM UR RAHMAN (Director)
Inam ur Rahman joined the Board of Directors of Cyan Limited in March 2017.
Bringing more than 27 years of experience across diversified industries including energy and renewables, education, enterprise technology, foods, textiles, fashion & apparel, lifestyle, and business consulting. Inam ur Rahman currently serves in corporate governance roles across various public-listed firms associated with the 100-year old Dawood Hercules Group. He was appointed as Chief Executive Officer of the group’s parent investment company, Dawood Hercules Corporation, on 1st December 2016. He is also the Chairman of Inbox Business
Technologies and Chairman of EmpiricAI Pvt Ltd.
An environmentalist at heart, Inam launched Reon Energy, an enterprise solar power EPC, and has also served as Chief Executive of Tenaga Generasi Limited, a 50 megawatt wind power plant.
His passion is to develop and grow people. He has taught at the undergraduate level, and at present devotes his time in governance roles Karachi School of Business & Leadership.
He holds an MBA degree from Lahore University of Management Sciences (LUMS), in addition to an engineering degree from UET Lahore.
79Annual Report 202078 Cyan Limited
SHAFIQ AHMED (Director)
Mr. Shafiq Ahmed joined The Dawood Group in 2007 and has worked for several Group concerns in different senior positions, including the Chief Executive Officer of Dawood Lawrencepur Limited and Tenaga Generasi Limited and currently looking after the Group’s private companies comprising of Patek (Private) Limited, Dawood Corporation (Private) Limited and Towershare (Private) Limited as Chief Executive Officer. He is also serving on the Board of Directors of Dawood Lawrencepur Limited, Tenaga Generasi Limited, Reon Alpha Limited, Patek (Private) Limited, Dawood Corporation (Private) Limited, Towershare (Private) Limited and Inbox Business Technologies Limited.
Prior to joining Dawood Group, he served in senior management position in Pakistan National Shipping Corporation and has also been associated with Ernst & Young Ford Rhodes Sidat Hyder & Co., Chartered Accountants for nine years. Having a flair for textiles, energy and accounting, his career spans over 25 years working with industry leaders and pioneers in these fields.
He is a Chartered Accountant from the Institute of Chartered Accountants of Pakistan and a degree in Law from University of Karachi. Shafiq is also a certified director from Pakistan Institute of Corporate Governance.
SULAIMAN S. MEHDI (Director / Chief Executive Officer)
Sulaiman is the CEO Cyan Limited, formerly Central Insurance Company Limited (CICL). In 2011, Sulaiman orchestrated the business restructuring of CICL (insurance) to Cyan (investments), a landmark transaction, and the first of its kind in Pakistan.
Before Cyan, he has served PICIC DFI, PICIC Asset Management Company Ltd., Allied Bank (ABL) and ABL Asset Management Company Limited. He has had the privilege of establishing two leading AMCs of this country.
As a senior executive, he has been working on strategy, organization, mergers and acquisitions. He is a proven business leader with a track
record of delivering sustainable change and superior results in Pakistan. Sulaiman’s experience spans over 19 years in multiple areas of financial services including investments, operations, marketing, legal and corporate affairs.
Amongst his prominent achievements have been the acquisition of HUBCO from National Power in June 2012. The acquisition value was PKR 6bn and was sold in March 2018 for PKR 22bn resulting in gains of app. PKR 23bn (incl dividends) in less than 6 years. He also had the privilege of leading the election process of HUBCO for DH Group twice in 2012 and 2015 and managed 8 out of 11 seats with just 17.5% shareholding.
He is the youngest Chairman of the Pakistan Stock Exchange Limited. He is also Chairman of Pebbles (Pvt.) Limited. - the real estate arm of Dawood Hercules (DH) Group and is spearheading all real estate initiatives of the Group. He is an independent director on the Board of Bank Islami Pakistan Limited and serves on
Board of Directors
the Board of Governors of The Institute of Business Management (IOBM). He is the Founding member of the Presidential Initiative for Artificial Intelligence and Computing (PIAIC) and a Member of the Committee on Emerging Technologies of MOIT. He represents Sindh as an Independent Member on Private Power and Infrastructure Board (PPIB) and is also an Independent Director on Sind Energy Holding Company Pvt Ltd.
He has also served on the Board of Dawood Lawrencepur Limited, FOCUS Pakistan (an Aga Khan Foundation backed NGO), lnbox Business Technologies (Pvt.) Ltd., lnbox Consulting (Pvt.) Ltd., lnbox Corporation (Pvt.) Ltd. and Sach International (Pvt.) Ltd.
He holds a master’s degree and is also a fellow member of The Institute of Corporate Secretaries of Pakistan (FCIS). He is also a Certified Director from the Pakistan Institute of Corporate Governance (PICG).
FAISAL NADEEM (Director / Chief Financial Officer)
Mr. Faisal is a Fellow member of the Institute of Chartered Accountants of Pakistan (ICAP) and Qualified Chartered Management Accountant from Chartered Institute of Management Accountants (CIMA-UK). He worked at the senior executive level in the leading financial institutions where he was involved in the areas of financial management, core finance, risk management and internal control. He is a Certified Director of Corporate Governance from the Pakistan Institute of Corporate Governance (PICG) and presently on the Board of Cyan Limited and Pebbles Pvt. Ltd. – the real estate arm of Dawood Hercules (DH) Group.
Before joining Cyan, he served as the Chief Financial Officer and Company Secretary at ABL Asset Management Company Limited, a subsidiary of Allied Bank Limited.
81Annual Report 202080 Cyan Limited
Management Team
M. HASSAAN KHAN
(Investment Analyst)
Mr. Hassaan is working as an Investment Analyst at Cyan Limited. He joined Cyan in March 2018 and has been the core member of the investment team. He started his career in 2017 and has gained considerable experience of Capital Markets. He brings expertise in investment analysis, financial modelling, portfolio management and investment advisory. Prior to joining Cyan, he was associated with Alfalah GHP where he was part of their investment advisory and portfolio management department.
Mr. Hassaan holds bachelor’s degree in Accounting & Finance from Lahore University of Management Sciences (LUMS). He was placed on
Dean’s Honor List at the end of the program and graduated with Distinction. Presently, he is also a CFA level III candidate.
NARESH KUMAR
(Investment Associate)
Mr. Kumar joined Cyan in August 2017. He is a CFA Charter holder and a fellow member of Association of Chartered Certified Accountants (ACCA). He has more than eleven years of diversified experience of investment analysis, private equity, portfolio management and investment advisory.
Prior to joining Cyan, he was working with ABL Asset Management Company Limited (ABL AMC) as the Equity Fund Manager, where he managed equity funds of worth USD 120 million. Before ABL AMC, he was associated with Magnus Investment Advisors Limited where he spearheaded various departments including the Portfolio Management and Wealth Management Departments.
FAISAL IRFAN
(Investment Analyst)
Faisal joined Cyan as an investment analyst in November 2020. He does not only cover Commercial Banking and Automobiles sectors in public space, but also assists senior management in evaluating private projects. Prior to joining Cyan, Faisal was working with KASB Securities as a Research Analyst. Faisal has a Bachelor’s degree in Accounting & Finance from Lahore University of Management Sciences (LUMS) and a CFA level 3 candidate.
ASJAD HUSSAIN
(Investment Analyst)
Asjad started off his career in June 2018 as a Management Trainee at Bank Alfalah Limited. After working with Taurus Securities Limited as a sell-side Equity Analyst, he joined Cyan as an Investment Analyst in December 2020. He covers the Cement and Oil Marketing Companies sectors and also assist the senior management in analyzing private projects. He holds a Bachelor’s degree in Accounting and Finance from Lahore University of Management Sciences (LUMS) and a candidate for CFA level III.
AHSAN IQBAL(Company Secretary)
Mr. Ahsan started his career with Cyan in January 2016. He is an ACCA member. He has more than ten years of diversified experience of Financial Reporting, Taxation and corporate statues & compliance services applicable on a Public Listed Company.
Previously, he was associated with A.F. Ferguson & Co., Chartered Accountants and Ernst & Young Ford Rhodes.
KIRAN HASSAN(Head of Internal Audit)
Ms. Kiran Hassan is the Head of Internal Audit of Cyan. She began her profession with Cyan in July 2019. She is a Fellow Cost and Management Accountants (FCMA) and has more than 11 years of diversified experience in the field of Finance, Internal Audit, Controls & Risk Management in local and multinational companies.
Prior to joining Cyan, she was associated with Orix Leasing, Alkaram Textile, First Women Bank Limited and Griffin Nagda (UAE).
83Annual Report 202082 Cyan Limited
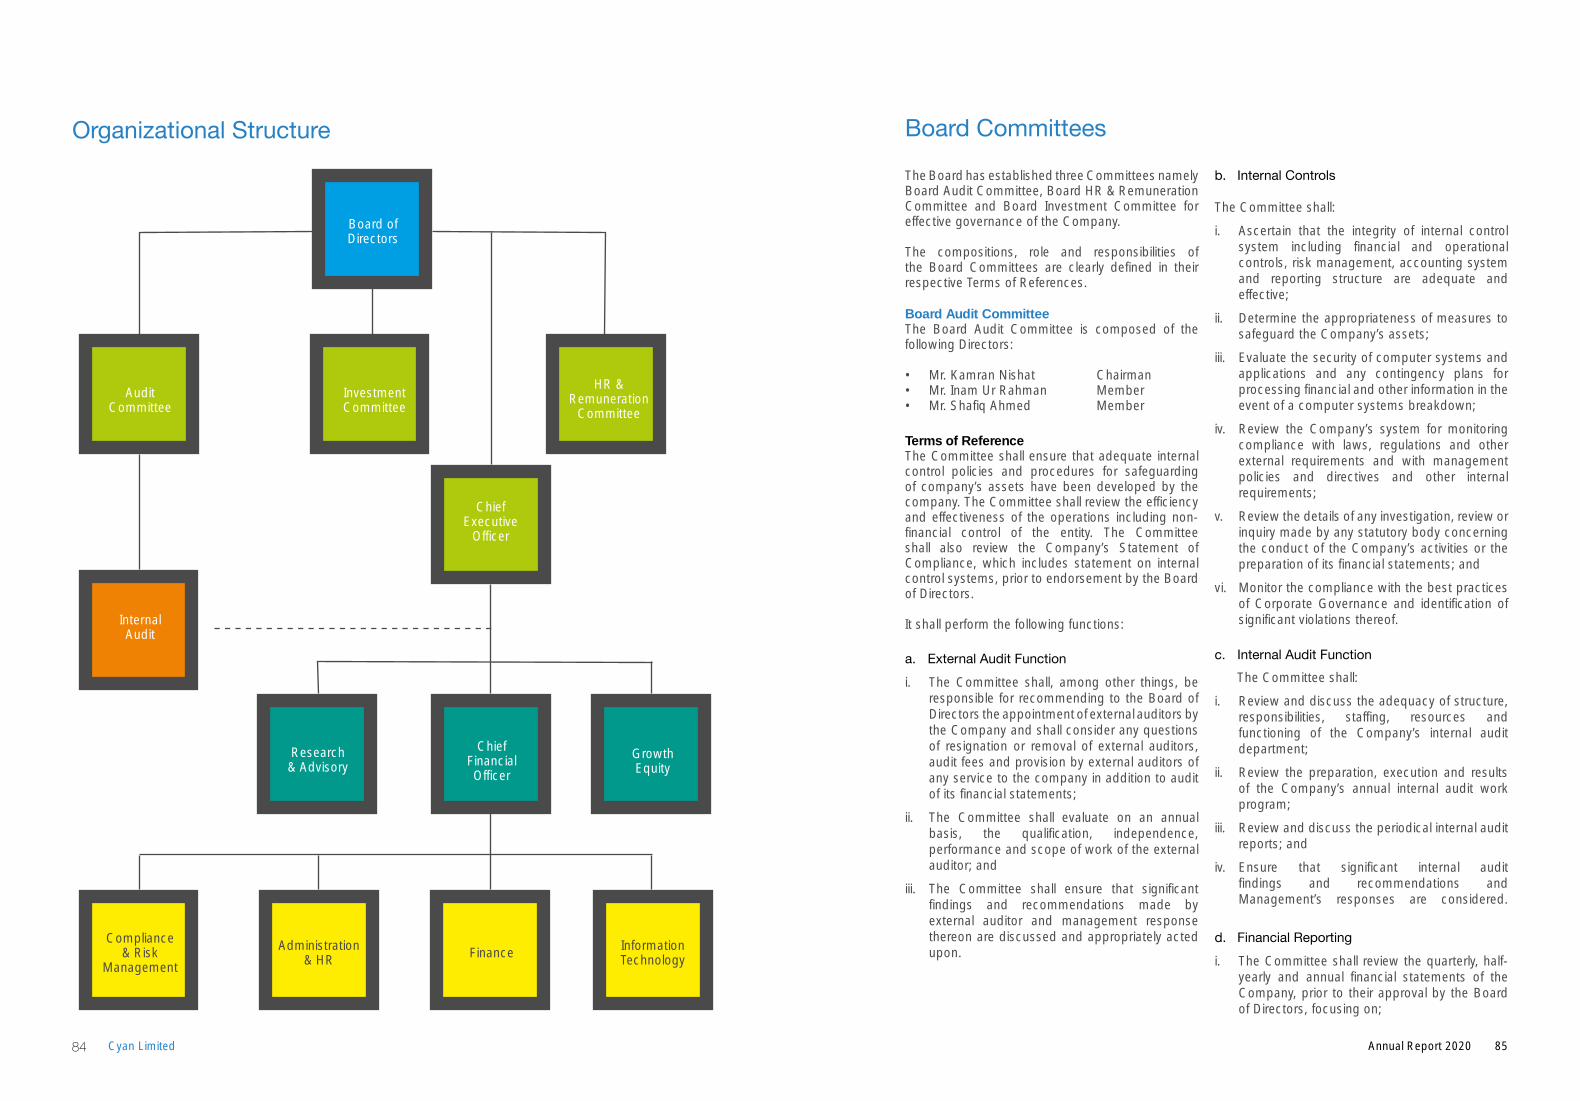
Organizational Structure Board Committees
The Board has established three Committees namely Board Audit Committee, Board HR & Remuneration Committee and Board Investment Committee for effective governance of the Company.
The compositions, role and responsibilities of the Board Committees are clearly defined in their respective Terms of References.
Board Audit CommitteeThe Board Audit Committee is composed of the following Directors:
• Mr. Kamran Nishat Chairman• Mr. Inam Ur Rahman Member• Mr. Shafiq Ahmed Member
Terms of ReferenceThe Committee shall ensure that adequate internal control policies and procedures for safeguarding of company’s assets have been developed by the company. The Committee shall review the efficiency and effectiveness of the operations including non-financial control of the entity. The Committee shall also review the Company’s Statement of Compliance, which includes statement on internal control systems, prior to endorsement by the Board of Directors.
It shall perform the following functions:
a. External Audit Functioni. The Committee shall, among other things, be
responsible for recommending to the Board of Directors the appointment of external auditors by the Company and shall consider any questions of resignation or removal of external auditors, audit fees and provision by external auditors of any service to the company in addition to audit of its financial statements;
ii. The Committee shall evaluate on an annual basis, the qualification, independence, performance and scope of work of the external auditor; and
iii. The Committee shall ensure that significant findings and recommendations made by external auditor and management response thereon are discussed and appropriately acted upon.
b. Internal Controls
The Committee shall:
i. Ascertain that the integrity of internal control system including financial and operational controls, risk management, accounting system and reporting structure are adequate and effective;
ii. Determine the appropriateness of measures to safeguard the Company’s assets;
iii. Evaluate the security of computer systems and applications and any contingency plans for processing financial and other information in the event of a computer systems breakdown;
iv. Review the Company’s system for monitoring compliance with laws, regulations and other external requirements and with management policies and directives and other internal requirements;
v. Review the details of any investigation, review or inquiry made by any statutory body concerning the conduct of the Company’s activities or the preparation of its financial statements; and
vi. Monitor the compliance with the best practices of Corporate Governance and identification of significant violations thereof.
c. Internal Audit FunctionThe Committee shall:
i. Review and discuss the adequacy of structure, responsibilities, staffing, resources and functioning of the Company’s internal audit department;
ii. Review the preparation, execution and results of the Company’s annual internal audit work program;
iii. Review and discuss the periodical internal audit reports; and
iv. Ensure that significant internal audit findings and recommendations and Management’s responses are considered.
d. Financial Reportingi. The Committee shall review the quarterly, half-
yearly and annual financial statements of the Company, prior to their approval by the Board of Directors, focusing on;
Board of Directors
Audit Committee
Internal Audit
Investment Committee
HR & Remuneration
Committee
ChiefFinancialOfficer
Research& Advisory
Compliance & Risk
Management
Administration & HR Finance Information
Technology
Growth Equity
ChiefExecutive
Officer
85Annual Report 202084 Cyan Limited
ii. Significant accounting and reporting issues, including professional and regulatory pronouncements and assess their impact on the Company’s financial statements;
iii. Legal matters which could significantly impact the financial statements;
iv. Annual financial statements and assess whether the financial statements reflect appropriate accounting principles;
v. The judgments made in preparing the Company’s financial statements, including any valuation of assets and liabilities, litigation, and other commitments and contingencies;
vi. Significant or unusual events or transactions or adjustments resulting from the audit;
vii. The going-concern assumption; and
viii. Changes in accounting policies & practices and compliance with applicable accounting standards.
e. Other responsibilitiesOther responsibilities of the Committee shall also include:
i. Review of preliminary announcements of results prior to publication;
ii. Facilitating the external audit and discussion with external auditors of major observations arising from interim and final audits and any matter that the auditors may wish to highlight (in the absence of management, where necessary);
iii. Review of management letter issued by external auditors and management’s response thereto;
iv. Ensuring coordination between the internal and external auditors of the Company;
v. Review of arrangement for staff and management to report to audit committee in confidence, concerns, if any, about actual or potential improprieties in financial and other matters and recommend instituting remedial and mitigating measures;
vi. Instituting special projects, value for money studies or other investigations on any matter specified by the Board of Directors, in consultation with the Chief Executive and to consider remittance of any matter to the external
auditors or to any other external body;
vii. Consideration of any other issue or matter as may be assigned by the Board of Directors;
viii. Appointment of the Head of Internal Audit shall be made by the BOD subject to recommendation of the Committee; and
ix. Details of all related party transactions shall be placed before the Audit Committee of the Company for review and recommendation to the Board of Directors. The related party transactions which are not executed at arm’s length price will also be placed separately at each Board meeting along with necessary justification for consideration and approval of the Board after clearance from the Audit Committee of the Company.
Board HR & Remuneration Committee
The Board HR & Remuneration Committee is composed of the following Directors:
• Mr. Kamran Nishat Chairman• Mr. Inam Ur Rahman Member• Mr. Hasan Reza-ur Rahim Member
Terms of Reference
The general duties and responsibilities of the Committee shall be as follows:
(i) To develop the compensation philosophy for Executive Management and present the recommendations to the Board for approval;
(ii) To meet with Executive Management to establish Corporate objectives and, subsequently, to meet independently of Executive Management to assess progress in relation to these objectives;
(iii) To undertake the performance evaluation of the CEO and review for each member of the Executive Management in consultation with the Chair of the Board;
(iv) To review, establish and recommend to the Board, approval of the compensation of each member of the Executive Management;
(v) To recommend to the Board for consideration, approval and establishment of stock option plans, incentive plans or employee benefit plans to be granted to, Executive Management and other key employees of the Company and guidelines with respect thereto. The Committee may suggest amendments to any stock option
plans or incentive plans, provided that all amendments to such plans shall be subject to consideration and approval of the Board;
(vi) To review and recommend compensation packages for the Executive Directors that realistically reflect the responsibilities and risks involved in being an Executive Director;
(vii) To consider and make recommendations to the Board for its approval on all matters concerning perquisites and benefits to be granted to Executive Management, including levels and types of benefits, within guidelines, if any, established by the Board with respect thereto;
(viii) To review and recommend compensation packages for the non-executive directors and the Chair of the Board that realistically reflect the responsibilities and risks involved in being a non-executive director;
(ix) To regularly review the organization structure and report any significant organization changes to the Board;
(x) To review succession plans for Executive Management, including specific development plans, methods of achieving recommended action, and career planning for potential successors; and
(xi) To engage, through its Chair and in appropriate circumstances, at the expense of the Company, independent counsel and advisors; and to fulfill such other powers and duties as delegated to it by the Board.
Board Investment Committee
The Board Investment Committee is composed of the following Directors:
• Mr. Hasan Reza-ur Rahim Chairman• Mr. Inam Ur Rahman Member• Mr. Shafiq Ahmed Member
Terms of Reference
The Board Investment Committee shall:
(i) Recommend asset allocation strategy for liquid and illiquid investments to the Board;
(ii) Review and monitor business development activities for illiquid investments;
(iii) Recommend sector focus for illiquid investments;
(iv) Recommend all illiquid transactions to the Board for approval;
(v) Recommend Employees Trading Policy for approval of the Board;
(vi) Recommend Investment Policy for approval of the Board;
(vii) Continually review the Investment Policy, Employee Trading Policy and approve changes (if necessary) subject to ratification of the BOD;
(viii) Consider any other issue or matter as may be assigned by the BOD; and
The BIC will periodically review the performance of the MIC for company’s liquid investments in purview of the various classes of assets and on overall basis, based on the following factors:
(i) Achievement of budgetary revenues;
(ii) Adherence to investment policy objectives;
(iii) Compliance with laws and regulations;
(iv) Performance relative to hurdles / benchmarks approved by the BOD; and
(v) Performance vis-a-vis industry performance.
87Annual Report 202086 Cyan Limited
Criteria to Evaluate Board’s Performance
A Company’s success is ultimately reflective of the capacity of its directors to provide direction which is in line with the vision in order to expand and flourish. The Company, hence, endeavors to develop the capacity of its Board of Directors to improve both their personal and collective contributions to the overall development of the Company.
A quality Board that really adds value is not just a panel of high performing individuals but a balanced team with harmonizing skill sets and a culture that allows them to function as a single unit to make the most effective decisions for the Company. While the guidance from the Chair is the key, the participation of every Board member is also vital for its effectiveness.
One of the most significant responsibilities of the Board of Directors is to ensure that the company has a strong leadership and an effective executive management. The Board establishes company policies and then delegates authority and responsibility to the CEO for the organization’s smooth operations.
Performance evaluation continues to gain profile and momentum within Boardrooms. Regulators and institutional investors increasingly endorse performance evaluation as a prerequisite for good corporate governance. The Board of Directors acts as a guardian of the shareholders money and translates the same into the Company’s mission and goals. In order to uphold the trust of stakeholders, the Board of Directors’ performance warrants assessment.
The evaluation of the performance will examine those key areas where the Board requires clarity in order to provide high level oversight, including: the strategic process; key business drivers and performance milestones; the global economic environment
and competitive context in which the Company operates; the risks faced by the business; Board dynamics; capability and alignment; reputation; and information flows.
The Board of Directors has set the following evaluation criteria to judge its performance;
• Compliance with the legislative system in which Company operates, including Companies Act 2017, Regulations of Pakistan Stock Exchange; and the Memorandum and Articles of Association of the Company;
• Active participation in strategic planning process, enterprise risk management system, policy development, financial structure, monitoring and approval;
• Hiring, evaluating, compensating and supporting the Executive Directors and other key positions including Chief Executive.
• Appropriate constitution of Board Committees with members possessing adequate technical know-how and experience;
• Establishing adequate system of internal controls in the Company and its regular assessment through self-assessment mechanism or/and internal audit activities;
• Ensuring presence of required quorum in Board and Committees’ meeting; and
• Ensuring orientation and training of Board of Directors to enable them to perform their duties in an effective manner
Roles and Responsibilities of ChairmanThe Chairman is responsible for leadership of the Board. In particular, he will:
1. Manage the business of the Board and preside over its meetings and all general body meetings.
2. Ensure that minutes of the meetings of the Board of Directors and all general body meetings are appropriately recorded and circulated within the prescribed time.
3. Set the agenda, style and tone of Board discussions (taking full account of the issues and the concerns of all Board members) to promote constructive debate and effective decision-making.
4. Ensure that members of the Board receive accurate, timely and clear information, in particular about the Company’s performance, to enable effective performance of their duties.
5. Manage the Board’s time to ensure that sufficient time is allowed for discussion of complex or contentious matters.
6. Build an effective and complementary Board, initiating change and planning succession on Board and executive appointments.
7. Ensure that all Board committees are properly established, composed and operated.
8. Ensure effective operation of the Board and its committees in conformity with the highest standards of corporate governance.
9. Facilitate the effective contribution of non- executive directors and ensure constructive relationships and open communication, both between non- executive directors and executive directors and between the Board and investors.
10. Ensure comprehensive induction programs for new directors and updates for all directors as and when necessary.
11. Monitor and address the development needs of individual directors and of the Board as a whole and ensure that the performance of individual directors and of the Board and its committees are formally evaluated at least once a year.
12. Monitor progress towards the timely and effective achievement and implementation of the objectives, policies and strategies set by the Board and of other decisions taken by or on behalf of the Board.
13. Ensure effective communication with shareholders and other relevant constituencies and that the views of these groups are understood by the Board.
14. Establish a constructive, harmonious and open relationship with the Chief Executive Officer and support him in the development of strategy and, more broadly advise the Chief Executive.
15. Lead the ongoing monitoring and annual evaluation of the performance of the Chief Executive Officer.
16. Maintain access to senior management as is necessary and useful, but not intrude on the Chief Executive’s responsibilities.
89Annual Report 202088 Cyan Limited
Roles and Responsibilities of CEO
The Chief Executive is responsible for leadership of the business and managing it within the authorities delegated by the Board. In particular, he will:
1. Manage the day to day business of the Company, taking account of the policies and directions of the Board and its Committees.
2. Develop strategy proposals for recommendation to the Board and ensure that agreed strategies are reflected in the business.
3. Develop annual plans, consistent with agreed strategies, for presentation to the Board for support.
4. Plan human resourcing to ensure that the Company has the capabilities and resources required to achieve its plans.
5. Develop an organizational structure and establish processes and systems to ensure the efficient organization of resources.
6. Ensure that such actions are taken as are necessary to secure the timely and effective implementation of the objectives, policies and strategies set by the Board and of other decisions taken by the Board or by its Committees on its behalf and be responsible to the Board for the performance of the business consistent with agreed plans, strategies and policies.
7. Act as Chairman of the Management Committee(s), set agendas, taking full account of the issues and concerns of members of the Committee(s), and ensure that Management Committee members receive clear and timely information.
8. Lead the executive team; monitor and address the development needs of the team and ensure
that the performance of individuals is evaluated at least once a year.
9. Ensure that the financial results, business strategies and, where appropriate, targets and milestones are communicated to the investment community.
10. Develop and promote effective communication with shareholders and other relevant constituencies.
11. Ensure that business performance is consistent with the Business Principles.
12. Ensure that robust management succession and management development plans are in place and presented to the Board from time to time.
13. Develop processes and structures to ensure that capital investment proposals are reviewed thoroughly, that associated risks are identified and appropriate steps taken to manage the risks.
14. Develop and maintain an effective framework of internal controls over risk in relation to all business activities.
15. Ensure that the flow of information to the Board is accurate, timely and clear. Ensure an effective dialogue between the executives and the Board and in particular ensure that the Chairman and the Board are regularly updated on matters affecting the Company’s performance, competitive position and risk profile;
16. Establish a close relationship of trust with the Chairman, reporting key developments to him in a timely manner and seeking advice and support as appropriate.
CEO’s Performance ReviewThe Board of Directors of Cyan Limited regularly evaluates the performance of the CEO based on the financial and non-financial KPIs presented by him and agreed by the Board at the start of the year. The Board has reviewed the performance of the CEO for the current financial year and is truly content with the achievements for the year. The Board wishes to further report that Mr. Sulaiman S. Mehdi is committed to following best practices and the Code of Corporate Governance in true spirit. All Board meetings are attended by Mr. Sulaiman S. Mehdi, where he provides details and explanations for each agenda item. The Board has full confidence in his abilities to manage the affairs of the Company in the most professional and competent manner. He is also responsible for setting the corporate objectives and its alignment with the KPIs for his management team and regularly updates the Board about the performance of the management team in achieving the desired results. The Board ensures that the vision and mission sets the direction for the overall corporate strategy and Cyan’s future endeavors in making investments in organizations with realized high growth potential as well as to remain committed in maximizing the wealth of its shareholders. The Board is pleased to note that Mr. Sulaiman Mehdi‘s endeavors result from following and applying the corporate strategy that is conceived with the aid of the Company’s vision and mission. The entire organization is connected and driven by this purpose and it serves as the main decision making criterion.
91Annual Report 202090 Cyan Limited
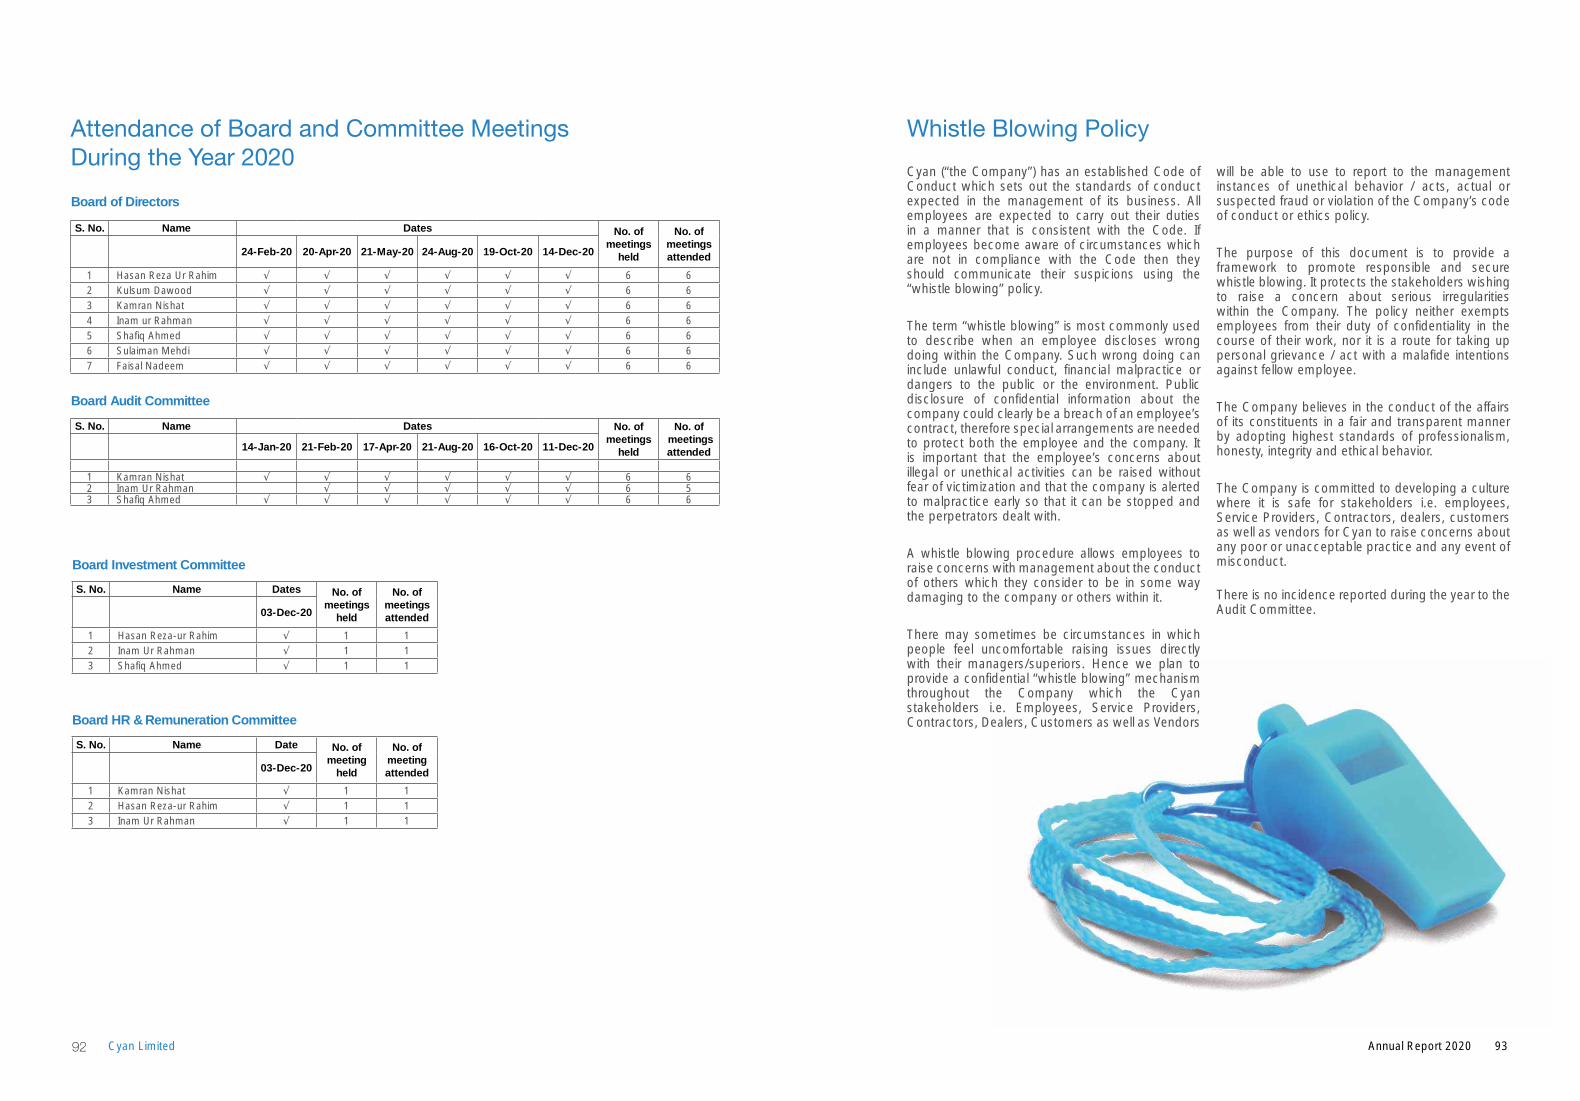
Attendance of Board and Committee Meetings During the Year 2020Board of Directors
S. No. Name Dates No. of meetings
held
No. of meetingsattended24-Feb-20 20-Apr-20 21-May-20 24-Aug-20 19-Oct-20 14-Dec-20
1 Hasan Reza Ur Rahim √ √ √ √ √ √ 6 62 Kulsum Dawood √ √ √ √ √ √ 6 63 Kamran Nishat √ √ √ √ √ √ 6 64 Inam ur Rahman √ √ √ √ √ √ 6 65 Shafiq Ahmed √ √ √ √ √ √ 6 66 Sulaiman Mehdi √ √ √ √ √ √ 6 67 Faisal Nadeem √ √ √ √ √ √ 6 6
Board Audit Committee
S. No. Name Dates No. of meetings
held
No. of meetingsattended14-Jan-20 21-Feb-20 17-Apr-20 21-Aug-20 16-Oct-20 11-Dec-20
1 Kamran Nishat √ √ √ √ √ √ 6 62 Inam Ur Rahman √ √ √ √ √ 6 53 Shafiq Ahmed √ √ √ √ √ √ 6 6
Board Investment Committee
S. No. Name Dates No. of meetings
held
No. of meetingsattended03-Dec-20
1 Hasan Reza-ur Rahim √ 1 12 Inam Ur Rahman √ 1 13 Shafiq Ahmed √ 1 1
Cyan (“the Company”) has an established Code of Conduct which sets out the standards of conduct expected in the management of its business. All employees are expected to carry out their duties in a manner that is consistent with the Code. If employees become aware of circumstances which are not in compliance with the Code then they should communicate their suspicions using the “whistle blowing” policy.
The term “whistle blowing” is most commonly used to describe when an employee discloses wrong doing within the Company. Such wrong doing can include unlawful conduct, financial malpractice or dangers to the public or the environment. Public disclosure of confidential information about the company could clearly be a breach of an employee’s contract, therefore special arrangements are needed to protect both the employee and the company. It is important that the employee’s concerns about illegal or unethical activities can be raised without fear of victimization and that the company is alerted to malpractice early so that it can be stopped and the perpetrators dealt with.
A whistle blowing procedure allows employees to raise concerns with management about the conduct of others which they consider to be in some way damaging to the company or others within it.
There may sometimes be circumstances in which people feel uncomfortable raising issues directly with their managers/superiors. Hence we plan to provide a confidential “whistle blowing” mechanism throughout the Company which the Cyan stakeholders i.e. Employees, Service Providers, Contractors, Dealers, Customers as well as Vendors
will be able to use to report to the management instances of unethical behavior / acts, actual or suspected fraud or violation of the Company’s code of conduct or ethics policy.
The purpose of this document is to provide a framework to promote responsible and secure whistle blowing. It protects the stakeholders wishing to raise a concern about serious irregularities within the Company. The policy neither exempts employees from their duty of confidentiality in the course of their work, nor it is a route for taking up personal grievance / act with a malafide intentions against fellow employee.
The Company believes in the conduct of the affairs of its constituents in a fair and transparent manner by adopting highest standards of professionalism, honesty, integrity and ethical behavior.
The Company is committed to developing a culture where it is safe for stakeholders i.e. employees, Service Providers, Contractors, dealers, customers as well as vendors for Cyan to raise concerns about any poor or unacceptable practice and any event of misconduct.
There is no incidence reported during the year to the Audit Committee.
Whistle Blowing Policy
Board HR & Remuneration Committee
S. No. Name Date No. of meeting
held
No. of meeting attended03-Dec-20
1 Kamran Nishat √ 1 12 Hasan Reza-ur Rahim √ 1 13 Inam Ur Rahman √ 1 1
93Annual Report 202092 Cyan Limited
IT Governance Policy
Cyan Limited has a well conceived and implemented IT Governance Policy which seeks to ensure that IT is aligned with Cyan’s organizational goals and strategies and delivers value to the organization. The policy is designed to promote effective, efficient, timely, and informed decision-making concerning Cyan’s IT investments and operations. Specifically the policy aims to establish the IT governance structure and its associated procedures, roles, and responsibilities, as a critical component of the overall IT Management (ITM) Framework, which guides the management, implementation, and monitoring of IT investments for Cyan Limited. Cyan’s IT Governance Policy is mainly charged with:
• Establishing a shared vision of how information technology can add value to the organization;
• Establishing information technology goals, and the strategies for achieving those goals;
• Establishing principles and guidelines for making information technology decisions and managing initiatives;
• Overseeing the management of institutional information technology initiatives;
• Establishing and communicating organizational information technology priorities;
• Determining information technology priorities in resource allocation;
• Establishing, amending and retiring, as necessary, organizational information technology and other technology related policies, and
• Determining the distribution of responsibility between the IT Department and end users.
LevelofMateriality
The board of directors shall define the level of materiality, keeping in view the specific circumstances of the company and the recommendations of any technical or executive subcommittee of the board that may be set up for the purpose.
International Standard on Auditing (UK and Ireland) 320 “Materiality in planning and performing an audit” (ISA 320) explains that misstatements and omissions, are considered to be material if they, individually or in aggregate, could reasonably be expected to influence the economic decisions of users of the financial statements. The users are considered as a group of users of the financial statements rather than as individual users.
Judgment comes into play when deciding whether a misstatement or omission is immaterial, as although it may be below the calculated materiality level, by its very nature it is material to the users of the financial statements and should therefore be adjusted and/or disclosed in the financial statements e.g. related party transactions.
The first consideration when calculating materiality is the assessed risk associated with the business. There is an inverse relationship between risk and materiality. The higher the assessed risk of material misstatement within the financial statements, the lower the materiality and vice versa. This means that
larger samples will be selected in response to the higher assessed risk and as such low materiality results in larger samples, higher materiality levels result in smaller sample sizes.
There are a number of benchmarks which can be selected to help calculate materiality and a range of materiality percentages that could be used when calculating materiality. ISA 320 doesn’t specifically mention the ranges of percentages that can be used as again this is left to the auditor’s judgment, however, common percentages used are shown below. Ideally the one selected by the auditor should be the benchmark that most represents the needs of the users of the financial statements. Examples of the more common benchmarks and percentages are as follows:
• Revenue (0.5% to 1%)
• Total Assets (1% to 2%)
• Net assets (2% to 5%)
• Profit after tax (5% to10%)
Keeping in view that Cyan limited is a company mainly involved in investing in public and private equities, therefore the appropriate materiality level should be calculated based on percentage of Net Assets. The Board has recommended minimum percentage allocation of 0.5% of Net Assets as Material level. However, this level does not include the related party transactions.
95Annual Report 202094 Cyan Limited
Investors’ Relations Policy
• Policy Statement The Investors’ Relations policy has been
developed to define broad parameters on how Cyan Limited (“the Company”) shall deal with the investors in context of general awareness, complaints and communications.
• Broad Parameters This Investor Relations Policy (IRP) will:
- Serve as a statement to the shareholders and other stakeholders of how Cyan intends to keep them informed of material developments, and maintain effective communications with them.
- Provide a framework of processes and procedures upon which Cyan can successfully implement its Investor Relations program. This Policy is meant to serve the company’s shareholders and stakeholders.
• General Principles Cyan strives to maintain its corporate credibility
and instill investor confidence by practicing a structured approach to the communication of price sensitive information. The Investor Relations program, which is designed to be both proactive and interactive, will be based on Cyan’s commitment to:
- always report its financial results and material developments to the Exchange, its shareholders and other stakeholders in a timely, open and comprehensive manner.
- communicate only through its Company Secretary or CEO.
- proactively address reports and rumors, so
as to avoid unnecessary volatility in the stock price - use its website as an additional
communications channel.
The company has setup an Investor Service Centre for the facilitation of shareholders.
• Communications Cyan will make every effort to ensure that all
price sensitive information concerning the company is made accessible. The company’s communication will be characterized by the following attributes:
- Transparency: price sensitive information will be released, whether it is favorable or not, in a balanced and fair manner that is not misleading.
- Consistency: all stakeholders will receive the same information, only formats may differ depending on the audience and forum.
- Accuracy: information shall be complete and accurate when released and material errors will be immediately corrected and clarified, if any.
- Timeliness: price sensitive information will be released as soon as it is known, unless there are exceptional legitimate reasons to withhold, which will be no longer than absolutely necessary.
- Non-selective: equality of access to price sensitive information will be achieved through broad public dissemination; no stakeholder will be given undisclosed price sensitive information in any form.
• Spokesperson Cyan has a well-defined structure for
governance and management which provides specific authority and responsibility for policy implementation. The Company shall designate Head of Compliance / Manager Compliance or in their absence any other senior management officer whose name shall be available in the Annual Report and on the website to handle
investor complaints, grievances. The Company Secretary shall also be responsible for communication to the shareholders regarding announcements of general meetings, dividends, and any other price sensitive information.
• Price Sensitive Information The Company will always fully comply with its
disclosure obligations in line with regulatory requirements Information shall be considered price sensitive if it falls in the definition of price sensitive information as provided in Section 96 of the Securities Act, 2015 or any superseding Act/Ordinance together with taking into account all the circulars or notifications by the Exchange or Commission.
• Confidentiality In general, all information regarding the
Company, its operations, financial condition and future prospects, should be regarded as material and price sensitive, and must be treated as confidential unless it is already in the public domain.
Employees and third parties, such as the Company’s auditors, bankers, lawyers or other professional advisors who require such information to properly execute their duties, are to protect the confidentiality of such information.
• Major Corporate Developments The Company will strictly enforce its procedures
for the protection of confidentiality until such time as the development of any major corporate development, such as a merger or acquisition or the launch of a significant new business, has received all requisite approvals. Thereafter, special attention will be paid to ensure the widest and most complete dissemination of information concerning the development, in line with the provisions of this Policy, Companies Act and the Listing Regulations of the Exchange.
• Amendment The BOD may on its own motion or on
recommendation of the BAC, if it considers that it would be in the interest of the Company to do so, alter, amend, modify or relax any restriction or terms and conditions of the IRP as it may deem fit.
Any provision(s) of this IRP in contravention of any applicable rules and regulation and any guidelines or circulars issued from time to time by the Securities and Exchange Commission of Pakistan (SECP)/Regulators, the latter shall supersede and prevail over the provisions contained in the IRP.
97Annual Report 202096 Cyan Limited
In order to improve job satisfaction of the workforce, ensuring a safe and secure environment for employees is always considered important for any organization. To improve the safety and health conditions on an on-going basis, it is necessary to continuously monitor the health and safety issues in the environment and update the current procedures accordingly.
Commonsense and basic good housekeeping are the predominant factors influencing the maintenance of high standards of health and safety in offices and staff should always be conscious of dangers to themselves and their colleagues, presented by their working environment and activities.
Any unsafe conditions, e.g. faulty lifts, faulty fire doors, missing fire extinguishers, missing Fire Notices, defective equipment (particularly defective gas connections), poor lighting, damaged floor coverings, unsafe furniture and so on, should be
reported at once to immediate supervisor, admin officer or safety officer so that necessary remedial action can be taken.
Recognizing the importance of employee health and safety, the Company is committed to ensure that employees must know and follow all health and safety requirements of their specific job requirement.
The following items are considered for incorporation of Health & Safety Policy:
• Health and safety are to be given equal consideration with all other business functions.
• Health and safety are everyone’s responsibility. Employees shall actively participate in all elements of the Health & Safety program.
• The organization is committed to comply with all corporate policies, procedures and applicable legislation.
• Health and safety are among our highest values and a key indicator of organizational excellence.
• All work-related injuries and illness are preventable by identifying and controlling risks.
• Hazard identification, risk assessment and risk control represent the foundation of a successful Health & Safety management system.
• Our Health & Safety management system is based on continuous improvement.
Health & Safety Policy
• Cyan recognizes that we must integrate our business values and operations to meet the expectations of our stakeholders. They include customers, employees, suppliers, the community and the environment.
• We recognize that our social, economic and environmental responsibilities to these stakeholders are integral to business. We aim to demonstrate these responsibilities through our actions and within our corporate policies.
• We take seriously all feedback, complaints and compliments that we receive from our stakeholders and, where possible maintain open dialogue to ensure that we fulfill the requirements outlined within this policy.
• We shall be open and honest in communicating our policies, strategies, targets, performance and governance to our stakeholders in our continual commitment to sustainable development.
• Cyan will, where reasonable, make the necessary resources available to realize our corporate responsibilities. The responsibility for delivery lies with all employees.
• In relation to community involvement, Cyan will identify a charity each year and staff will work together to raise funds and aid the charity as and when possible in a practical way.
• In selecting either a charity for this support or working with a charity in a team building scenario, Cyan will only support programs which are inclusive in nature and reach across all social and community backgrounds. Support will not be given to individuals or groups with political or sectarian connections.
• The management will spend at least 1% of profit before tax annually on CSR.
Cyan CSR activities will be focused on the following areas:
• Education
• Health Sector
• Community Building
√ Children Welfare
√ Women Empowerment
√ Sports Development
√ Heritage Preservation
√ Relief Activities
Cyan considers the following factors while shortlisting the project:
• Associating to a cause which is in-line with the identified sectors
• Credibility and repute of the charity organization seeking assistance
Corporate Social Responsibility Policy
99Annual Report 202098 Cyan Limited
Cyan Limited has taken definitive steps in ensuring that all employees, officers, members of the Board and all such relevant persons follow strict guidelines while trading in the shares of the Company. The Insider Trading Policy codifies the Company’s standards on trading and enabling the trading of securities of the Company or other publicly-traded companies while in possession of material non-public information.
The general guidelines within the policy state that:
i. No trading in the securities of the Company is permitted for directors and all employees who are “Executives” as defined in the PSX Regulations, within the Closed Periods announced by the Company.
ii. No insider may purchase or sell any Company’s security while in possession of material non-public information about the Company, its customers, suppliers, consultants or other companies with which the Company has contractual relationships or may be negotiating transactions.
iii. No insider who knows of any material non-public information about the Company may communicate that information to any other person, including family and friends.
iv. In addition, no insider may purchase or sell any security of any other company, whether or not issued by the Company, while in possession of material non-public information about that company that was obtained in the course of his or her involvement with the Company in the way of conducting official business. No insider who knows of any such material non-public information may communicate that information to any other person, including family and friends.
The Company’s Responsibility to Disclose Inside Information
The Company’s responsibility, in case of inside information made known to a third party, shall be to ensure that in such case the knowledge is given full public disclosure or if such information still needs to be kept non-public then the Company must ensure that the third party, is placed under legal obligation to maintain confidentiality.
Insider Trading Policy
Cyan Limited (the “Company”) aims to develop strong governance practices across the spectrum of the Company’s activities along with a risk management framework to ensure that risks across the business are monitored and managed effectively.
GovernanceThe CEO is responsible to ensure that the governance procedures are in place. The CFO and department heads are responsible for the implementation of necessary controls to ensure that the strategies, directions and instructions allocated to the departments and employees are carried out systematically and effectively. Detailed governance procedures are covered in the Code of Corporate Governance, Code of Conduct, Chairman and Chief Executive Responsibilities and the Authority Policy. Risk Management
Board’s Role in the Oversight of the RiskAs per the SECP Code of Corporate Governance, the Board must ensure that a risk management policy is in place and that all risk issues are reviewed and discussed by the Boards of Directors. This also includes reputational risk. Further the Board is required to address risk analysis, risk management and risk communication including any uncertainties surrounding the listed company in its annual report. The Board’s role will comprise the following with the objective to oversee the risks:
• Review the process that management has put in place and ensure that it is as per risk appetite approved by the Board and meets the risk tolerances established by them
• Discuss key issues and confirm the risk strategies implemented by management
• Ensure that the risk is communicated to the shareholders, stakeholders, regulators, stock exchange and other external parties in a timely manner
Risk ManagementRisk management is the logical and systematic method of identifying, analyzing, evaluating, treating and monitoring risks in a way that will enable the organization to meet its objectives and minimize losses and maximize opportunities. While the CEO will be accountable for risk management, the Department heads will be responsible for the identification, assessment and prioritization of risks. The methods and goals will be determined by the objectives of the department i.e. financial, public health and safety, environmental, security etc. Risk will be managed by having controls in place or by transferring the risk to another party or by avoiding the risk. Risk register
will be maintained by each department and the risk mitigation plan will be approved by the appropriate level of authority. Risk Management PlanDepartment Heads will be responsible for setting the appropriate controls or counter measures for each risk. Hence the department heads need to ensure that:
• Business processes have adequate built-in risk control and containment measures
• Risk is transferred to an external agency (e.g. an insurance company) where this is possible and appropriate
• Risks are avoided altogether (e.g. by closing down a particular high-risk business area)
Leadership and Commitment The responsibility of the CEO and CFO will comprise the following:
1. Develop and maintain a risk management system
2. Create general risk awareness within the company
3. Review and monitor risk
4. Nominate risk owners
5. Oversee the operations of risk management policy
Governance, Risk Management and Compliance Policy
101Annual Report 2020100 Cyan Limited
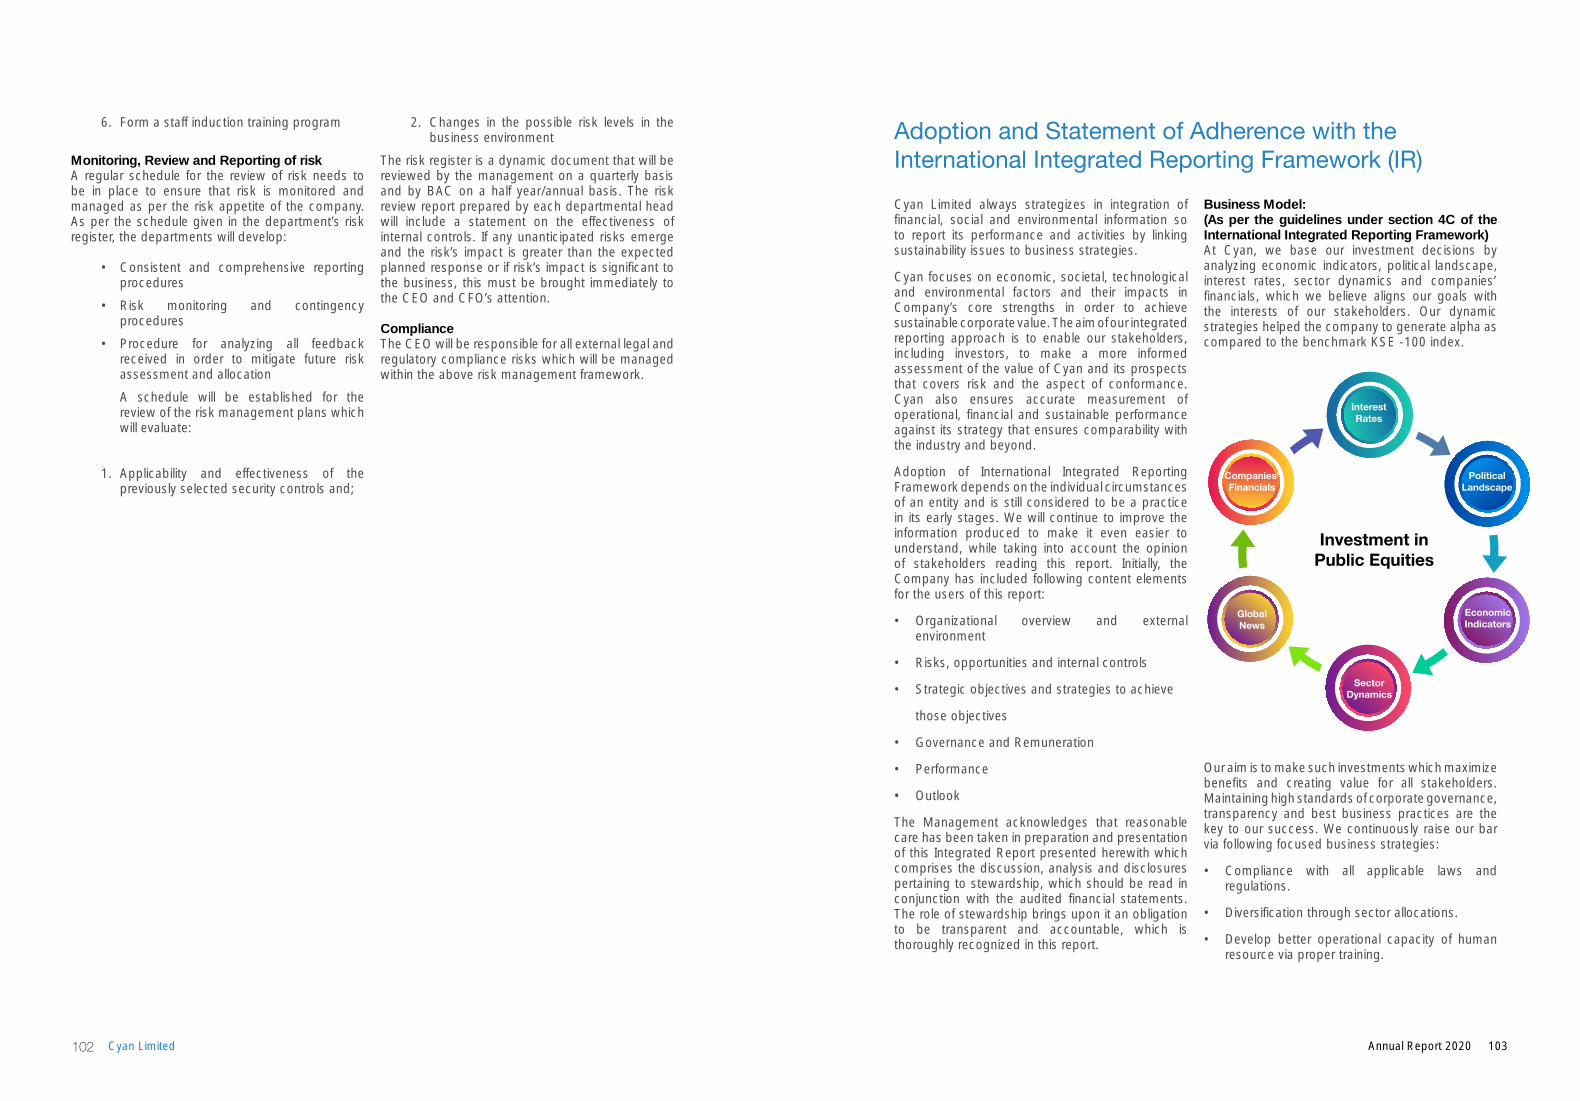
6. Form a staff induction training program
Monitoring, Review and Reporting of risk A regular schedule for the review of risk needs to be in place to ensure that risk is monitored and managed as per the risk appetite of the company. As per the schedule given in the department’s risk register, the departments will develop:
• Consistent and comprehensive reporting procedures
• Risk monitoring and contingency procedures
• Procedure for analyzing all feedback received in order to mitigate future risk assessment and allocation
A schedule will be established for the review of the risk management plans which will evaluate:
1. Applicability and effectiveness of the previously selected security controls and;
2. Changes in the possible risk levels in the business environment
The risk register is a dynamic document that will be reviewed by the management on a quarterly basis and by BAC on a half year/annual basis. The risk review report prepared by each departmental head will include a statement on the effectiveness of internal controls. If any unanticipated risks emerge and the risk’s impact is greater than the expected planned response or if risk’s impact is significant to the business, this must be brought immediately to the CEO and CFO’s attention. ComplianceThe CEO will be responsible for all external legal and regulatory compliance risks which will be managed within the above risk management framework.
Cyan Limited always strategizes in integration of financial, social and environmental information so to report its performance and activities by linking sustainability issues to business strategies.
Cyan focuses on economic, societal, technological and environmental factors and their impacts in Company’s core strengths in order to achieve sustainable corporate value. The aim of our integrated reporting approach is to enable our stakeholders, including investors, to make a more informed assessment of the value of Cyan and its prospects that covers risk and the aspect of conformance. Cyan also ensures accurate measurement of operational, financial and sustainable performance against its strategy that ensures comparability with the industry and beyond.
Adoption of International Integrated Reporting Framework depends on the individual circumstances of an entity and is still considered to be a practice in its early stages. We will continue to improve the information produced to make it even easier to understand, while taking into account the opinion of stakeholders reading this report. Initially, the Company has included following content elements for the users of this report:
• Organizational overview and external environment
• Risks, opportunities and internal controls
• Strategic objectives and strategies to achieve
those objectives
• Governance and Remuneration
• Performance
• Outlook
The Management acknowledges that reasonable care has been taken in preparation and presentation of this Integrated Report presented herewith which comprises the discussion, analysis and disclosures pertaining to stewardship, which should be read in conjunction with the audited financial statements. The role of stewardship brings upon it an obligation to be transparent and accountable, which is thoroughly recognized in this report.
Business Model:(As per the guidelines under section 4C of the International Integrated Reporting Framework)At Cyan, we base our investment decisions by analyzing economic indicators, political landscape, interest rates, sector dynamics and companies’ financials, which we believe aligns our goals with the interests of our stakeholders. Our dynamic strategies helped the company to generate alpha as compared to the benchmark KSE -100 index.
Our aim is to make such investments which maximize benefits and creating value for all stakeholders. Maintaining high standards of corporate governance, transparency and best business practices are the key to our success. We continuously raise our bar via following focused business strategies:
• Compliance with all applicable laws and regulations.
• Diversification through sector allocations.
• Develop better operational capacity of human resource via proper training.
Adoption and Statement of Adherence with the International Integrated Reporting Framework (IR)
Interest Rates
Companies'Financials
Global News
EconomicIndicators
PoliticalLandscape
Investment inPublic Equities
Sector Dynamics
103Annual Report 2020102 Cyan Limited
Directors’ Orientation and TrainingAll the Directors of the Company are well experienced and have diverse backgrounds. At the time of induction of any new director, he or she is given proper orientation about the operations of the Company and his or her fiduciary responsibilities. The Company is compliant in respect of certification of all directors under the directors’ training program offered by institutions that meet criteria specified by SECP.
Policy on Directors’ RemunerationThe Directors’ Remuneration policy has been developed to remunerate Directors in line with the market norms in the largest interest of Cyan Limited (“the Company”). The objective of the remuneration policy is to create a remuneration structure that will allow the Company to attract, reward and retain qualified Directors who will lead the Company in achieving its strategic objectives. The Company in its 51st AGM held on April 30, 2011 approved the Director’s Remuneration (other than Group Executives) for attending the Board and the Board Committees’ meetings in compliance with the requirements of Article 78(a) of the Company’s Article of Association.
The Board of Directors may on its own motion or on recommendation of the BHR & RC, if it considers that it would be in the interest of the Company to do so, alter, amend, modify or relax any restriction or terms and conditions of the Directors’ Remuneration Policy as it may deem fit subject to approval of Shareholders in the general meeting. Any provision(s) of this Directors’ Remuneration Policy in contravention of any applicable rules and regulation and any guidelines or circulars issued from time to time by the Securities and Exchange Commission of Pakistan (SECP)/Regulators, the latter shall supersede and prevail over the provisions contained in the Directors’ Remuneration Policy.
Matters Delegated to the ManagementResponsibility for implementing the strategies, conducting the routine business operations of the Company in accordance with the strategies and goals as approved by the Board of Directors is the primary responsibility of the Management. Management is also concerned in keeping the Board members updated regarding any changes in the operating environment. It is also the responsibility of management, with the oversight of the Board and its Audit Committee, to prepare financial statements that fairly present the financial position of the
Company in accordance with applicable accounting standards and legal requirements.
Governance Practices Exceeding Legal RequirementsCyan Limited is proud to have successfully adapted practices to reflect the changing standards of evolving governance regulations. Today we meet, and often exceed, all mandatory legal compliances under the Listed Companies (Code of Corporate Governance) Regulations, 2019, the Companies Act 2017 and other applicable rules, regulations and standards. In addition, we have also carried out the following activities in addition to the legal requirements;
• Voluntary adoption of best reporting practices as prescribed by ICAP/ICMAP/SAFA with view to make Company’s financials more transparent.
• Cyan has developed and implemented health and safety standards to ensure to ensure proper safety of its people and equipment.
Related PartiesDisclosure requirements of the 4th Schedule to the Companies Act, 2017 and applicable International Financial Reporting Standards have been complied and presented in note 26 to the financial statements presented afterwards in this annual report.
POLICY ON TRANSACTIONS/CONTRACTS WITH ASSOCIATED COMPANIES / RELATED PARTIESCYAN Limited shall ensure that all transactions/contracts with related parties/subsidiary and associated companies are carried out on arm’s length basis and in line with the market norm for all commercial transactions. No undue favors shall be accorded to any related party/subsidiary and associated company while entering into any transactions. All transactions with related parties/subsidiary and associated companies shall be duly declared as per prescribed Regulations of SECP.
Statement of Managements Responsibility Towards the Preparation and Presentation of Financial Statements and Directors Compliance StatementsThe Company, its Board of Directors and the management have always been keen to follow the standards set down by governing institutions. In lights of the same strict compliance of all standards
set out by ICAP, the Companies Act, the international Accounting Reporting Standards have been adhered to and otherwise good and responsible reporting has been our general practice.
Conflict of Interest PolicyCyan Limited provides a code of conduct for all directors of the Company to avoid any conflicts of Interest between the director and the Company. Any situation that involves, or may reasonably be expected to involve, a conflict of interest with the Company, should be disclosed promptly to the Board of Directors.
This policy provides guidance on what constitutes a conflict of interest and how it will be managed and monitored by the Company.
Directors should communicate any suspected violations of the above policy promptly to the Chairman of the Audit Committee. Violations will be investigated by the Board or by persons designated by the Board, and appropriate action will be taken in the event of any violations of the Code.
Human Resource PoliciesThe primary goal of our human resource department is to ensure that we have the right people at the right time in the right position. Our HR department, through continuous consultation with other departments, determines our future HR requirement. We then aim to meet such requirements through talent acquisition, talent development and succession planning.
Our objective always remains to recruit dynamic people whose caliber and capabilities are best suited for the job, which we conform to through our recruitment and selection process. In addition to recruiting employees externally, we seek to meet our HR requirements through job rotations. This enables us to create more career opportunities for our people and enhances both lateral and upward mobility in our organization.
Our employees are reviewed against their job objectives annually depending on their job roles. Our performance appraisal process enables us to emphasize on the growth of our employees as well as identify their learning and career development needs. As a part of this process, through constructive dialogue, our employees are also encouraged to work on areas where there is scope of improvement. We also get to identify our high-
potential employees for our succession-planning program. This process also helps us to ensure that the contributions of our employees are properly recognized and appropriately rewarded.
Succession planning is critical to us, as it enables us to ensure leadership continuity and avoid extended and costly leadership vacuum. We prefer to promote from within the organization so that we can create greater career opportunities for our people.
The Company has a complete set of other HR policies referred as HR Manual for appointment and commencement of service, Salary and other perquisites, Medical and Life Insurance facilities, Training and development, Performance evaluation etc.
Diversity PolicyCyan is committed to fostering, cultivating and preserving a culture of diversity and inclusion.
Our human capital is the most valuable asset we have. The collective sum of the individual differences, life experiences, knowledge, inventiveness, innovation, self-expression, unique capabilities and talent that our employees invest in their work represents a significant part of not only our culture, but our reputation and company’s achievement as well.
We embrace and encourage our employees’ differences in age, color, disability, ethnicity, family or marital status, gender identity or expression, language, national origin, physical and mental ability, political affiliation, race, religion, sexual orientation, socio-economic status, veteran status, and other characteristics that make our employees unique.
Cyan’s diversity initiatives are applicable but not limited to our practices and policies on recruitment and selection; compensation and benefits; professional development and training; promotions; transfers; social and recreational programs; layoffs; terminations; and the ongoing development of a work environment built on the premise of gender and diversity equity that encourages and enforces:
• Respectful communication and cooperation between all employees.
• Teamwork and employee participation, permitting the representation of all groups and employee perspectives.
105Annual Report 2020104 Cyan Limited
• Work/life balance through flexible work schedules to accommodate employees’ varying needs.
• Employer and employee contributions to the communities we serve to promote a greater understanding and respect for the diversity.
Statement of Unreserved Compliance of International FinancialReporting Standards (IFRSs) issued by International Accounting Standards Board (IASB)Cyan Limited is preparing statutory financial statements in accordance with the IFRS issued by IASB as notified under the Companies Act 2017 including the disclosure requirements of fourth schedule.
In addition to this, note 3 to the financial statement specify few standards and interpretations which are yet to be effective in Pakistan. The Company believes that that the impact of the above standards does not have any material impact to the financial statements.
Presence of the Chairman Audit Committee at the AGM Honoring the trust reposed in the Company by our shareholders, we strive to enforce a transparent relationship in all our dealings. To address any concerns and queries raised by our esteemed shareholders, all members of the Board including the Chairman Audit Committee, Chief Executive and other senior management personnel were present at the General Meeting held during the year.
Quarterly and Annual Financial Statements Quarterly and Annual Financial statements of the Company are duly endorsed by Chief Executive and Chief Financial Officer for circulation to the Directors. The financial statements are then approved, published, and circulated to shareholders within one month of the closing date in case of quarterly financial statements and within permitted limit in case of half yearly financial statements. The half yearly financial statements of the Company were duly reviewed by the external auditors. Annual financial statements are audited by the External Auditors and recommended by the Board for shareholders’ approval within permitted limit after the closing date and presented to the shareholders in the Annual General Meeting for approval. Other non-financial information to be circulated to other stakeholders is also delivered in
an accurate and timely manner in accordance with the applicable regulatory requirements
Compliance with the Best Practices of Code of Corporate Governance: The Company adheres to the best practices of governance. The Statement of Compliance with the Code of Corporate Governance along with Auditor’s review report thereon also form part of the Annual Report.
Code of Conduct Cyan Limited continues robust corporate governance practices help the Company to create sustainable and long-term value. Our commitment to good corporate behavior is reflected in our standards of business conduct, which ensure that business objectives are met in a transparent and accountable manner. In order to apprise employees of the Code of Conduct, all employees upon joining the Company are required to read and understand the Code of Conduct and sign a declaration of compliance with it. As a refresher on the Code, renewal of the declaration to directors and employees is also carried out electronically on annual basis.
Roles and Responsibilities of the Board of Directors: The Board of Directors is responsible for corporate governance and is committed to creating enduring value for all stakeholders of the Company. The Board performs its functions in conformity with applicable statutes including the Companies Act, 2017. Some of the key functions of the Board include approval of Company’s vision and mission, yearly budgets, strategies, policies of the Company, financial statements, appointment of key management positions, sanction of major capital expenditures and investments, periodic review of the risks facing the business and periodic review of the Company’s operational performance. The Board is also assisted by a number of subcommittees composed of independent and non-executive Directors.
Companies Where Executive Directors are Serving as Non-Executive Directors of the Companies:The Company has two executive Directors, Mr. Sulaiman S. Mehdi (CEO) and Mr. Faisal Nadeem (CFO). The details of their directorships on the Board of other companies are mentioned in their respective profiles in this Report.
Role of External Search Agency in the Appointment of the Chairman or Non-Executive Director:The Directors were elected unopposed in the Annual General Meeting (AGM) held on May 21, 2020. The justification regarding independent Directors has stated in statement under section 166(3) of the Companies Act, 2017 accompanying the notice of AGM. No search or consultancy firm was involved.
Investor Relations Section on WebsiteCyan’s Board has approved the Investor Relations Policy to provide accurate, transparent and timely information to shareholders. The Company has provided a dedicated section on its website (http://www.cyanlimited.com) in order to facilitate the stakeholders and in compliance with the regulatory requirements. The website is being maintained in English and Urdu. The website is regularly updated to ensure that the Company meets its regulatory requirements and provides all information relevant to all stakeholders.
Issues Raised in Last Annual General Meeting: Annual General Meeting (AGM) of the Company was held on May 21, 2020, where queries regarding the operational and financial performance including the future profitability were raised by the shareholders and the same were answered to their satisfaction.
Steps Taken by the Management to Encourage Minority Shareholders: The Company encourages all shareholders including minority shareholders to attend the Annual General Meeting (AGM). The Company complies with all the regulatory requirements to facilitate the shareholders to attend the AGM. Notice is sent to all shareholders within the regulatory timeframe. Besides that, the notice is also published on PUCAR Portal and also printed in English and Urdu Newspaper having nationwide circulation. The notices are also placed on Company’s corporate website as soon as the same are announced.
Stakeholders Engagement Process: Company believes in providing fair and timely information to its stakeholders. Stakeholders’ Engagement ensures management communication with all stakeholders across the wide spectrum of its activities. Continuous feedback is also sought to bring the plan in line with global best practices.
The Company’s financial and other information is also available in the Annual Report and on the Company’s corporate website (www.cyanlimited.com). A dedicated email ID has also been provided on
the corporate website to encourage all stakeholders to share their queries and feedback. The Company regularly interacts with the shareholders through PSX announcements, corporate briefings, notices to shareholders and its website. Further the Company also maintains a dedicated section on the corporate website for investor relations to facilitate shareholder queries. The Company also arranged a corporate briefing session on December 16, 2020 which was attended by shareholders and analysts.
Policy for Safety Records of the Company: In compliance with the regulatory requirements, the Company maintains relevant records both in physical and electronic form. In addition to that, IT Disaster Recovery Plan has also been prepared and implemented by the Company to ensure smooth functioning of the business in case of any disaster.
Business Continuity Plan/ Disaster Recovery Plan: The Company has a detailed disaster recovery plan and business continuity plan for each business. CYAN Limited too has made substantial investment in IT and is using different IT systems and services including the Local Area Network (“LAN”), Wide Area Network (“WAN”), database, servers & storage, Internet, Communication Services, email system and different business applications for the efficient running of its daily business operations.
CYAN has established IT setup and has subscriptions & agreements with external hosting and service providers to fulfill the data processing needs for different business functions. The plan outlines the strategies and processes to ensure timely restoration and smooth functioning of the business in case of any catastrophe or calamity. The plan aims to ensure that all critical Business functions continue to operate during a calamity on an interim basis without disruption. The plan is reviewed by the Board and changes are suggested, if any.
Evaluation of the Chief Executive’s PerformanceThe performance of the CEO is reviewed on annual basis as per assigned targets. This also includes assessment of his roles and responsibilities as prescribed under the regulatory framework.
Risk ManagementThe Company conducts regular assessments of its risk landscape to effectively identify emerging risks that could affect its performance, stability or business model.
107Annual Report 2020106 Cyan Limited
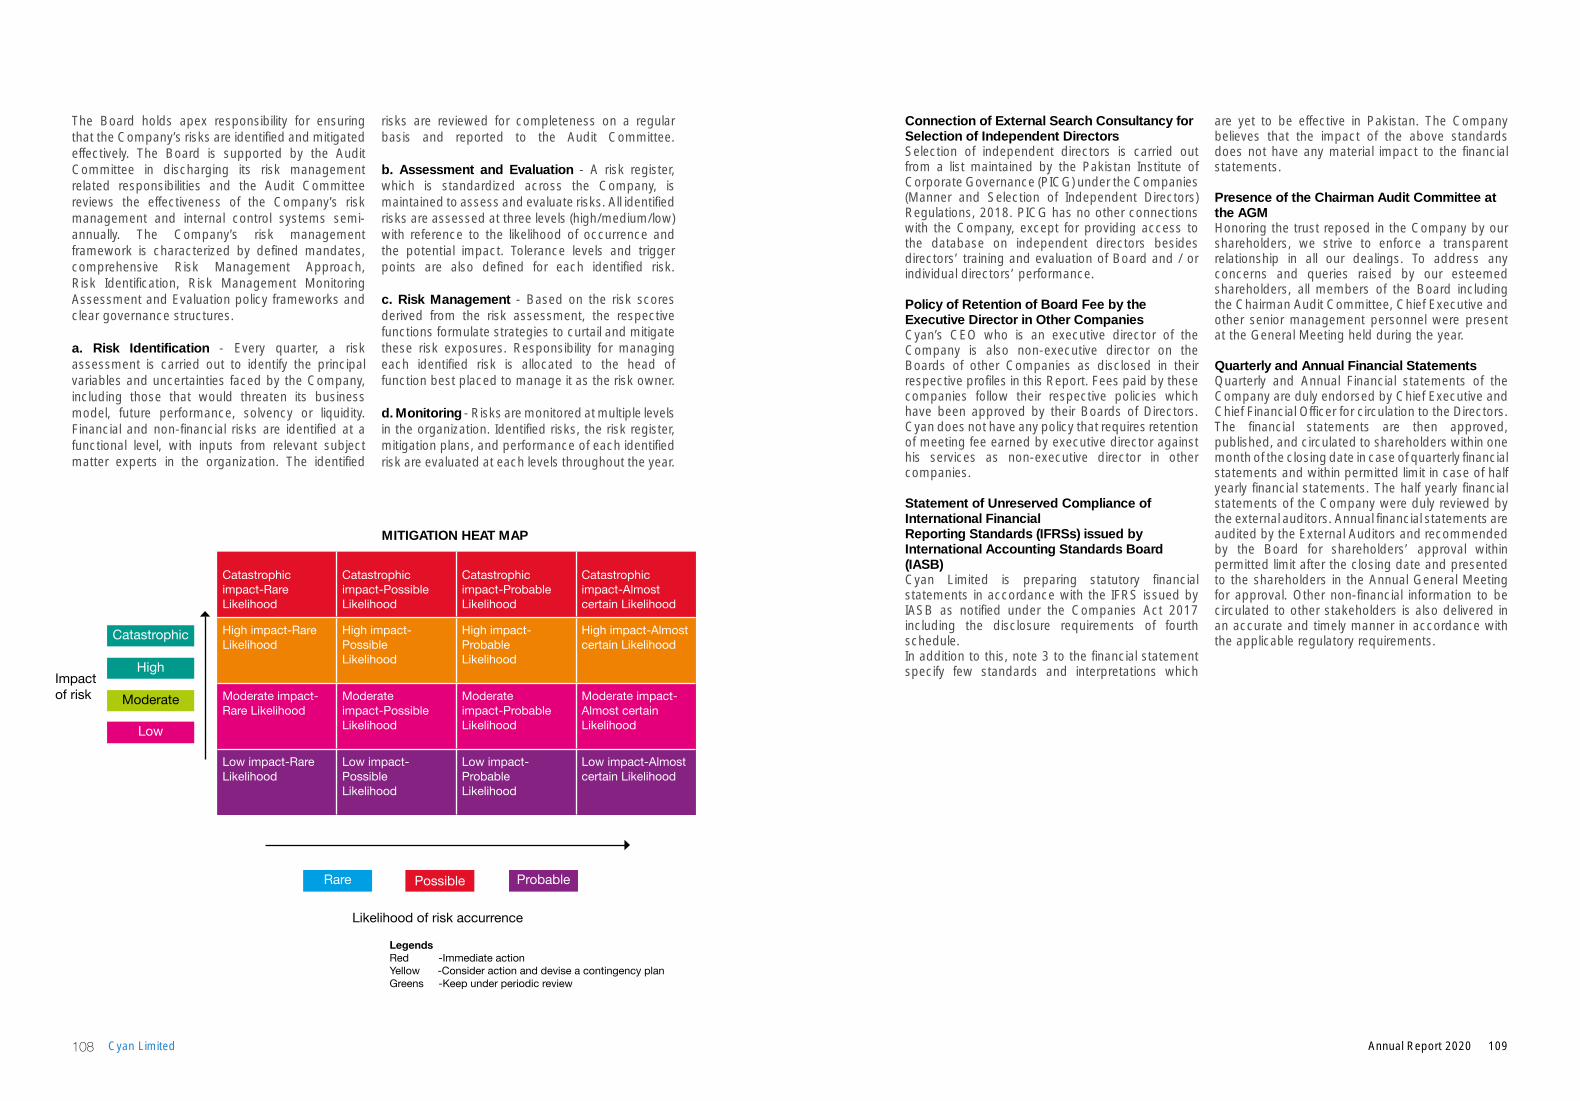
The Board holds apex responsibility for ensuring that the Company’s risks are identified and mitigated effectively. The Board is supported by the Audit Committee in discharging its risk management related responsibilities and the Audit Committee reviews the effectiveness of the Company’s risk management and internal control systems semi-annually. The Company’s risk management framework is characterized by defined mandates, comprehensive Risk Management Approach, Risk Identification, Risk Management Monitoring Assessment and Evaluation policy frameworks and clear governance structures.
a. Risk Identification - Every quarter, a risk assessment is carried out to identify the principal variables and uncertainties faced by the Company, including those that would threaten its business model, future performance, solvency or liquidity. Financial and non-financial risks are identified at a functional level, with inputs from relevant subject matter experts in the organization. The identified
risks are reviewed for completeness on a regular basis and reported to the Audit Committee.
b. Assessment and Evaluation - A risk register, which is standardized across the Company, is maintained to assess and evaluate risks. All identified risks are assessed at three levels (high/medium/low) with reference to the likelihood of occurrence and the potential impact. Tolerance levels and trigger points are also defined for each identified risk.
c. Risk Management - Based on the risk scores derived from the risk assessment, the respective functions formulate strategies to curtail and mitigate these risk exposures. Responsibility for managing each identified risk is allocated to the head of function best placed to manage it as the risk owner.
d. Monitoring - Risks are monitored at multiple levels in the organization. Identified risks, the risk register, mitigation plans, and performance of each identified risk are evaluated at each levels throughout the year.
Connection of External Search Consultancy for Selection of Independent Directors Selection of independent directors is carried out from a list maintained by the Pakistan Institute of Corporate Governance (PICG) under the Companies (Manner and Selection of Independent Directors) Regulations, 2018. PICG has no other connections with the Company, except for providing access to the database on independent directors besides directors’ training and evaluation of Board and / or individual directors’ performance.
Policy of Retention of Board Fee by the Executive Director in Other Companies Cyan’s CEO who is an executive director of the Company is also non-executive director on the Boards of other Companies as disclosed in their respective profiles in this Report. Fees paid by these companies follow their respective policies which have been approved by their Boards of Directors. Cyan does not have any policy that requires retention of meeting fee earned by executive director against his services as non-executive director in other companies.
Statement of Unreserved Compliance of International FinancialReporting Standards (IFRSs) issued by International Accounting Standards Board (IASB)Cyan Limited is preparing statutory financial statements in accordance with the IFRS issued by IASB as notified under the Companies Act 2017 including the disclosure requirements of fourth schedule.In addition to this, note 3 to the financial statement specify few standards and interpretations which
are yet to be effective in Pakistan. The Company believes that the impact of the above standards does not have any material impact to the financial statements.
Presence of the Chairman Audit Committee at the AGM Honoring the trust reposed in the Company by our shareholders, we strive to enforce a transparent relationship in all our dealings. To address any concerns and queries raised by our esteemed shareholders, all members of the Board including the Chairman Audit Committee, Chief Executive and other senior management personnel were present at the General Meeting held during the year.
Quarterly and Annual Financial Statements Quarterly and Annual Financial statements of the Company are duly endorsed by Chief Executive and Chief Financial Officer for circulation to the Directors. The financial statements are then approved, published, and circulated to shareholders within one month of the closing date in case of quarterly financial statements and within permitted limit in case of half yearly financial statements. The half yearly financial statements of the Company were duly reviewed by the external auditors. Annual financial statements are audited by the External Auditors and recommended by the Board for shareholders’ approval within permitted limit after the closing date and presented to the shareholders in the Annual General Meeting for approval. Other non-financial information to be circulated to other stakeholders is also delivered in an accurate and timely manner in accordance with the applicable regulatory requirements.
Catastrophicimpact-Rare Likelihood
Catastrophicimpact-Possible Likelihood
Catastrophicimpact-Probable Likelihood
Catastrophicimpact-AlmostcertainLikelihood
High impact-Rare Likelihood
High impact-Possible Likelihood
High impact-Probable Likelihood
High impact-Almost certainLikelihood
Moderate impact-RareLikelihood
Moderate impact-Possible Likelihood
Moderate impact-Probable Likelihood
Moderate impact-Almost certain Likelihood
Lowimpact-RareLikelihood
Lowimpact-Possible Likelihood
Lowimpact-Probable Likelihood
Lowimpact-AlmostcertainLikelihood
Impact of risk
High
Catastrophic
Moderate
Low
Rare
Likelihoodofriskaccurrence
Possible Probable
LegendsRed -Immediate actionYellow -Consider action and devise a contingency planGreens -Keep under periodic review
MITIGATION HEAT MAP
109Annual Report 2020108 Cyan Limited
The Audit Committee has concluded its annual review of the conduct and operations of the Company during 2020, and reports that:
• The Company has issued a “Statement of Compliance with the Code of Corporate Governance” as stipulated in listed Companies (Code of Corporate Governance) Regulations 2019, which has also been reviewed and certified by the Auditors of the Company.
• Understanding and compliance with Company codes and policies has been affirmed by the members of the Board, the Management, and employees of the Company individually. Equitable treatment of shareholders has also been ensured.
• Appropriate accounting policies have been consistently applied except for the changes, if any, which have been appropriately disclosed in the Annual Financial Statement for the year ended December 31, 2020. All cores & other applicable International Accounting Standards were followed in preparation of financial statements of the Company on a going concern basis, for the financial year ended December 31, 2020, which present fairly the State of Affairs, Results of Operations, Profits, Cash Flows and Changes in Equities of the Company.
• The Chief Executive and the Chief Financial Officer have reviewed the Financial Statements of the Company and the Directors’ Report. They acknowledge their responsibility for true and fair presentation of the Company’s financial condition and results, compliance with regulations and applicable accounting standards and establishment and maintenance of internal controls and systems of the Company.
• Accounting estimates are based on reasonable and prudent judgments. Proper and adequate accounting records have been maintained by the Company in accordance with Companies Act, 2017 and the external reporting is consistent with Management processes and adequate for shareholder needs.
• Closed periods were duly determined and announced by the Company, limiting the Directors, the Chief Executive and Executives of the Company from dealing in Company shares, prior to each Board meeting involving announcement of interim /final results or distribution to shareholders or any other business decision, which could materially affect the share market price of Company.
RISK MANAGEMENT
• The Board of Directors have established a robust framework of Enterprise Risk Management-ERM with a clearly documented policy and detailed procedures defining therein the roles & responsibilities of the Board, senior management as well as individual managers of the Company. The framework defines a formal and uniform process for risk identification, capturing relevant details, categorization, assessment of likelihood and impact, prioritization based on risk exposure, appropriate assignment of ownership and the pertinent action plan. The ERM process is diligently established in the organization and is reviewed and monitored annually by the Board Audit Committee for further recommendation to the Board.
INTERNAL AUDIT
• The internal control framework has been effectively implemented; the Board has established an effective internal audit function within the Company.
• The Company’s system of internal control is sound in design and has been continually evaluated for effectiveness and adequacy.
Report of the Audit Committee• The Audit Committee has ensured the achievement of operational, compliance, risk management,
financial reporting and control objectives, safeguarding of the assets of the Company and the shareholders wealth at all levels within the Company.
• The Internal Audit function has carried out its duties under the charter approved by the Committee. The Committee has reviewed material Internal Audit findings and taken appropriate action and also brought the matters to the Board’s attention where required.
• The Head of Internal Audit has direct access to the Chairman of the Audit Committee and the function has all necessary access to Management and the right to seek information and explanations.
EXTERNAL AUDITORS
• The statutory Auditors of the Company, A. F. Ferguson & Company, Chartered Accountants, have completed their Audit assignment of the “Company’s Financial Statements” and the “Statement of Compliance with the Code of Corporate Governance” for the financial year ended December 31, 2020 and shall retire on the conclusion of the 61st Annual General Meeting.
• The Audit Committee has reviewed and discussed Audit Report with the External Auditors.
• The Auditors have been allowed direct access to the Committee and the effectiveness, independence and objectivity of the Auditors has thereby been ensured. The Auditors attended the Annual General Meetings of the Company during the year and have confirmed attendance of the 61st Annual General Meeting scheduled to be held on March 31, 2021 and have indicated their willingness to continue as Auditors.
• The Audit Committee has recommended the appointment of A.F. Ferguson & Co. Chartered Accountants as External Auditors of the Company for the year ending December 31, 2021.
Kamran Nishat Karachi: February 22, 2021 Chairman - Audit Committee
111Annual Report 2020110 Cyan Limited
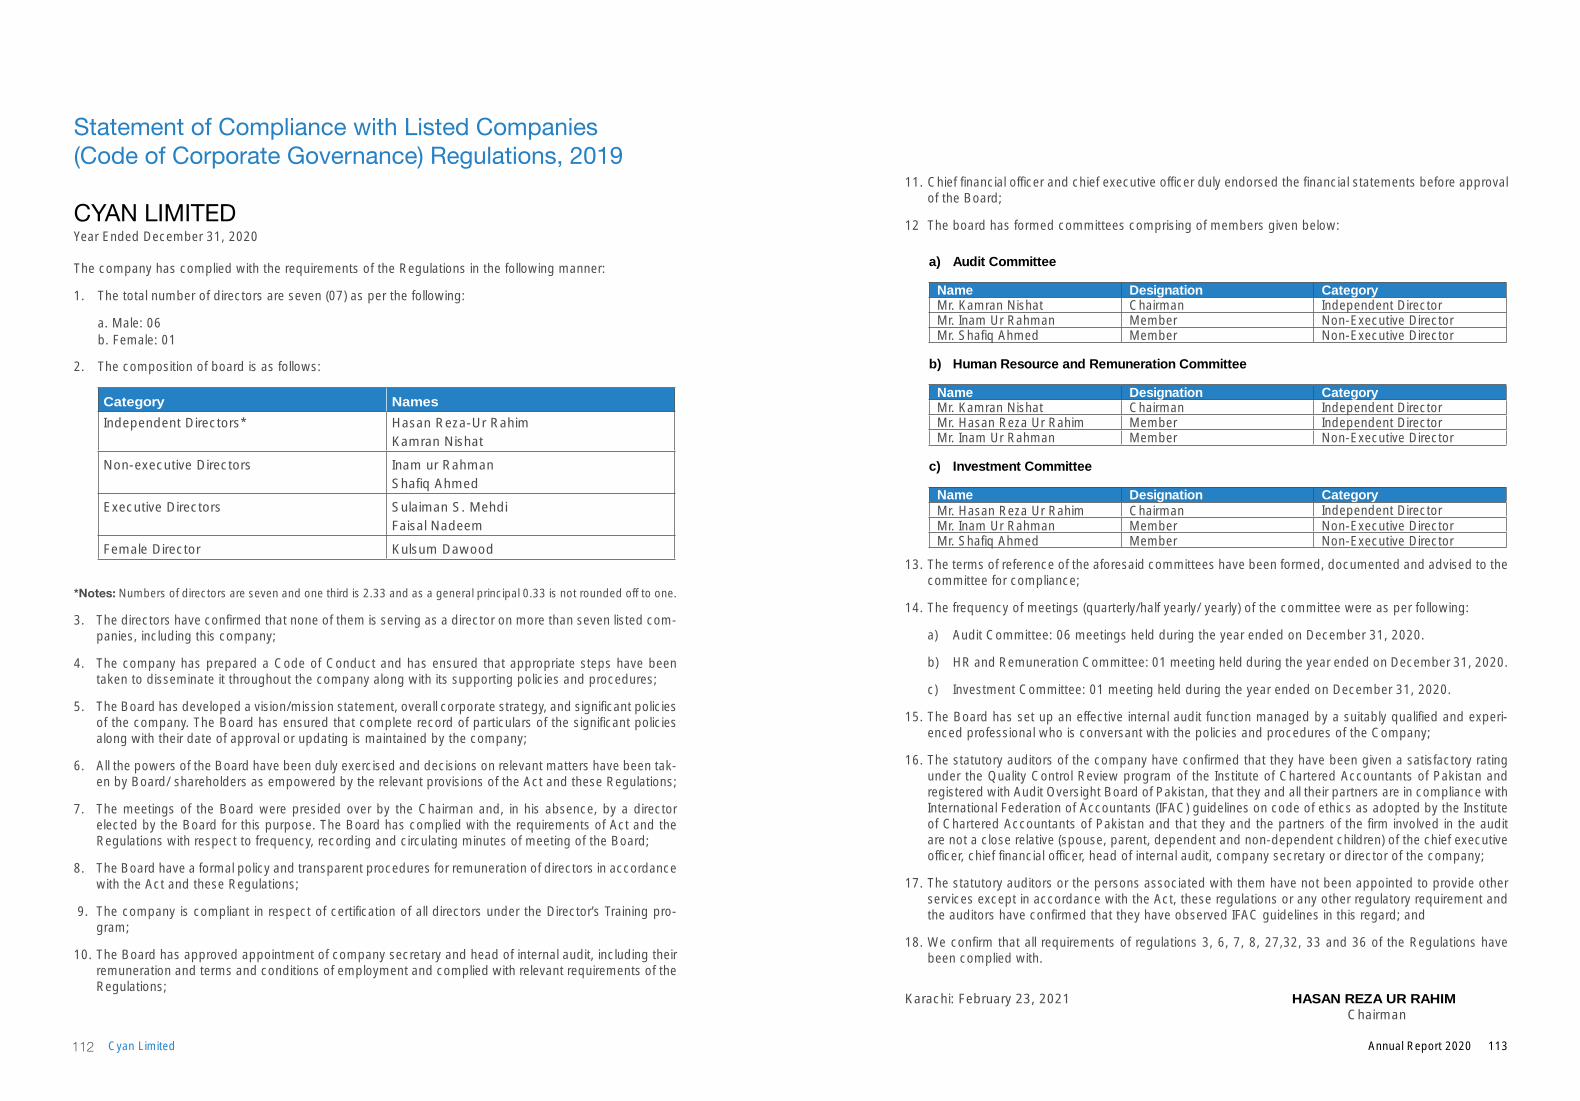
StatementofCompliancewithListedCompanies(Code of Corporate Governance) Regulations, 2019
CYANLIMITEDYear Ended December 31, 2020
The company has complied with the requirements of the Regulations in the following manner:
1. The total number of directors are seven (07) as per the following:
a. Male: 06b. Female: 01
2. The composition of board is as follows:
Category Names
Independent Directors* Hasan Reza-Ur RahimKamran Nishat
Non-executive Directors Inam ur RahmanShafiq Ahmed
Executive Directors Sulaiman S. MehdiFaisal Nadeem
Female Director Kulsum Dawood
*Notes: Numbers of directors are seven and one third is 2.33 and as a general principal 0.33 is not rounded off to one.
3. The directors have confirmed that none of them is serving as a director on more than seven listed com-panies, including this company;
4. The company has prepared a Code of Conduct and has ensured that appropriate steps have been taken to disseminate it throughout the company along with its supporting policies and procedures;
5. The Board has developed a vision/mission statement, overall corporate strategy, and significant policies of the company. The Board has ensured that complete record of particulars of the significant policies along with their date of approval or updating is maintained by the company;
6. All the powers of the Board have been duly exercised and decisions on relevant matters have been tak-en by Board/ shareholders as empowered by the relevant provisions of the Act and these Regulations;
7. The meetings of the Board were presided over by the Chairman and, in his absence, by a director elected by the Board for this purpose. The Board has complied with the requirements of Act and the Regulations with respect to frequency, recording and circulating minutes of meeting of the Board;
8. The Board have a formal policy and transparent procedures for remuneration of directors in accordance with the Act and these Regulations;
9. The company is compliant in respect of certification of all directors under the Director’s Training pro-gram;
10. The Board has approved appointment of company secretary and head of internal audit, including their remuneration and terms and conditions of employment and complied with relevant requirements of the Regulations;
11. Chief financial officer and chief executive officer duly endorsed the financial statements before approval of the Board;
12 The board has formed committees comprising of members given below:
a) Audit Committee
Name Designation CategoryMr. Kamran Nishat Chairman Independent DirectorMr. Inam Ur Rahman Member Non-Executive DirectorMr. Shafiq Ahmed Member Non-Executive Director
b) Human Resource and Remuneration Committee
Name Designation CategoryMr. Kamran Nishat Chairman Independent DirectorMr. Hasan Reza Ur Rahim Member Independent DirectorMr. Inam Ur Rahman Member Non-Executive Director
c) Investment Committee
Name Designation CategoryMr. Hasan Reza Ur Rahim Chairman Independent DirectorMr. Inam Ur Rahman Member Non-Executive DirectorMr. Shafiq Ahmed Member Non-Executive Director
13. The terms of reference of the aforesaid committees have been formed, documented and advised to the committee for compliance;
14. The frequency of meetings (quarterly/half yearly/ yearly) of the committee were as per following:
a) Audit Committee: 06 meetings held during the year ended on December 31, 2020.
b) HR and Remuneration Committee: 01 meeting held during the year ended on December 31, 2020.
c) Investment Committee: 01 meeting held during the year ended on December 31, 2020.
15. The Board has set up an effective internal audit function managed by a suitably qualified and experi-enced professional who is conversant with the policies and procedures of the Company;
16. The statutory auditors of the company have confirmed that they have been given a satisfactory rating under the Quality Control Review program of the Institute of Chartered Accountants of Pakistan and registered with Audit Oversight Board of Pakistan, that they and all their partners are in compliance with International Federation of Accountants (IFAC) guidelines on code of ethics as adopted by the Institute of Chartered Accountants of Pakistan and that they and the partners of the firm involved in the audit are not a close relative (spouse, parent, dependent and non-dependent children) of the chief executive officer, chief financial officer, head of internal audit, company secretary or director of the company;
17. The statutory auditors or the persons associated with them have not been appointed to provide other services except in accordance with the Act, these regulations or any other regulatory requirement and the auditors have confirmed that they have observed IFAC guidelines in this regard; and
18. We confirm that all requirements of regulations 3, 6, 7, 8, 27,32, 33 and 36 of the Regulations have been complied with.
Karachi: February 23, 2021 HASAN REZA UR RAHIM Chairman
113Annual Report 2020112 Cyan Limited
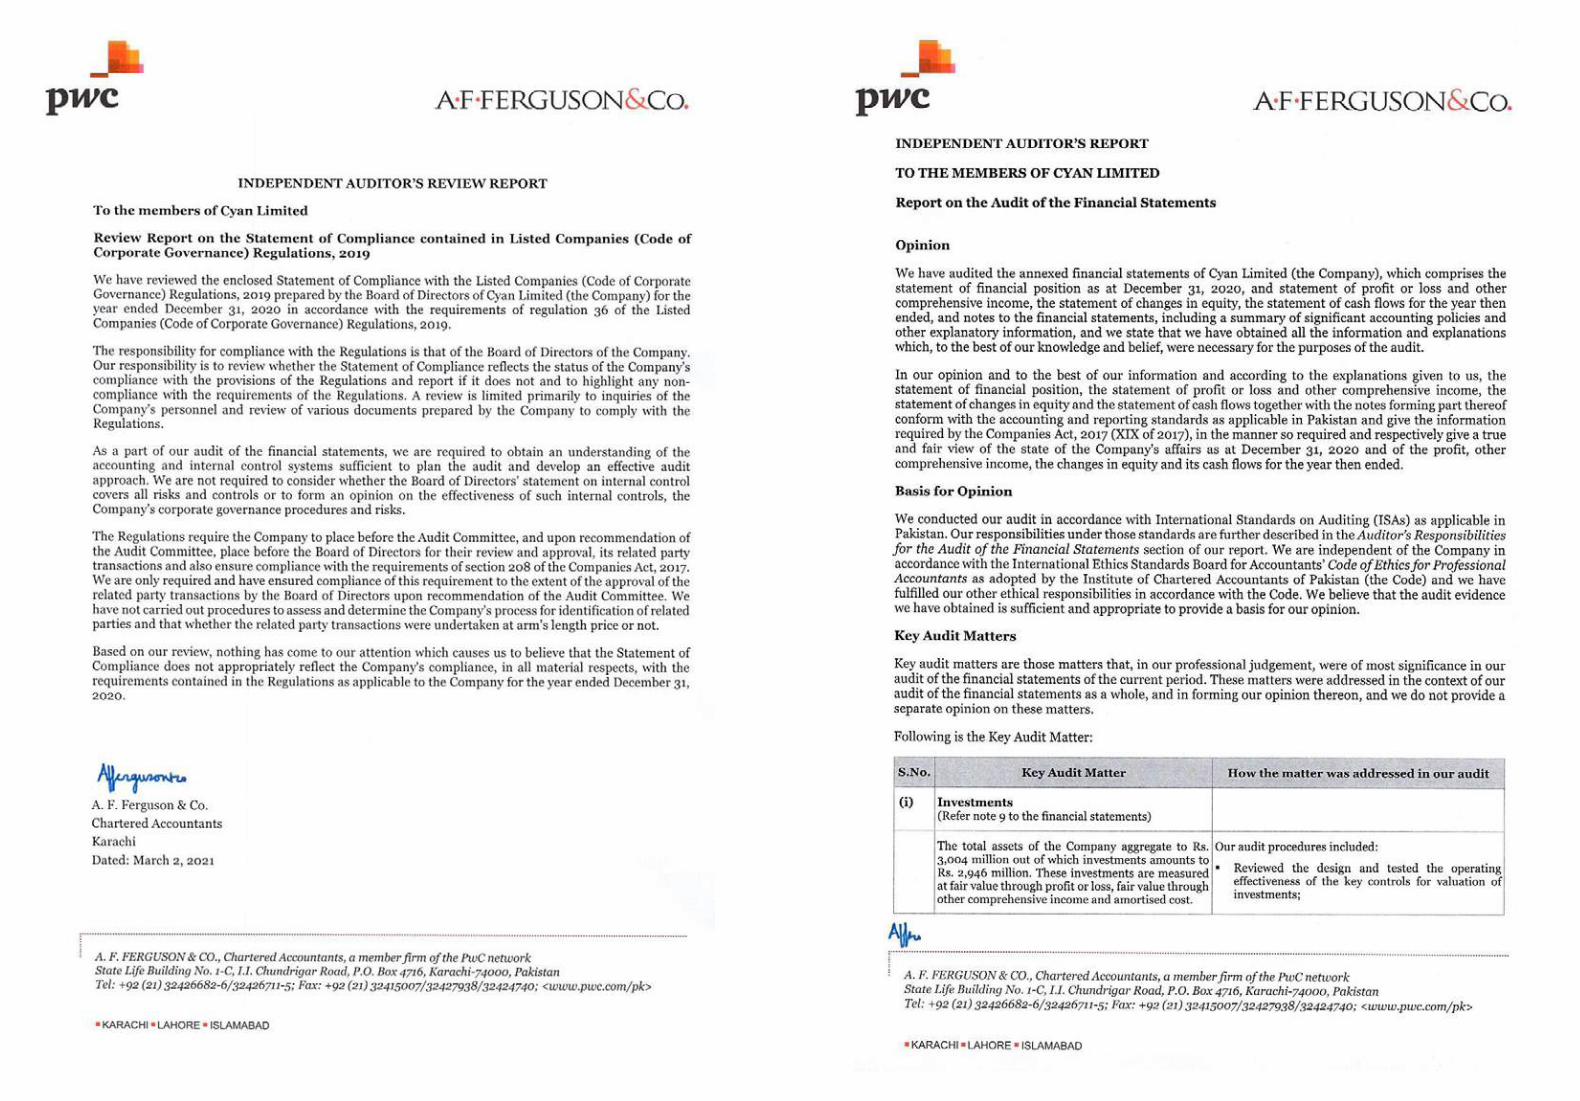
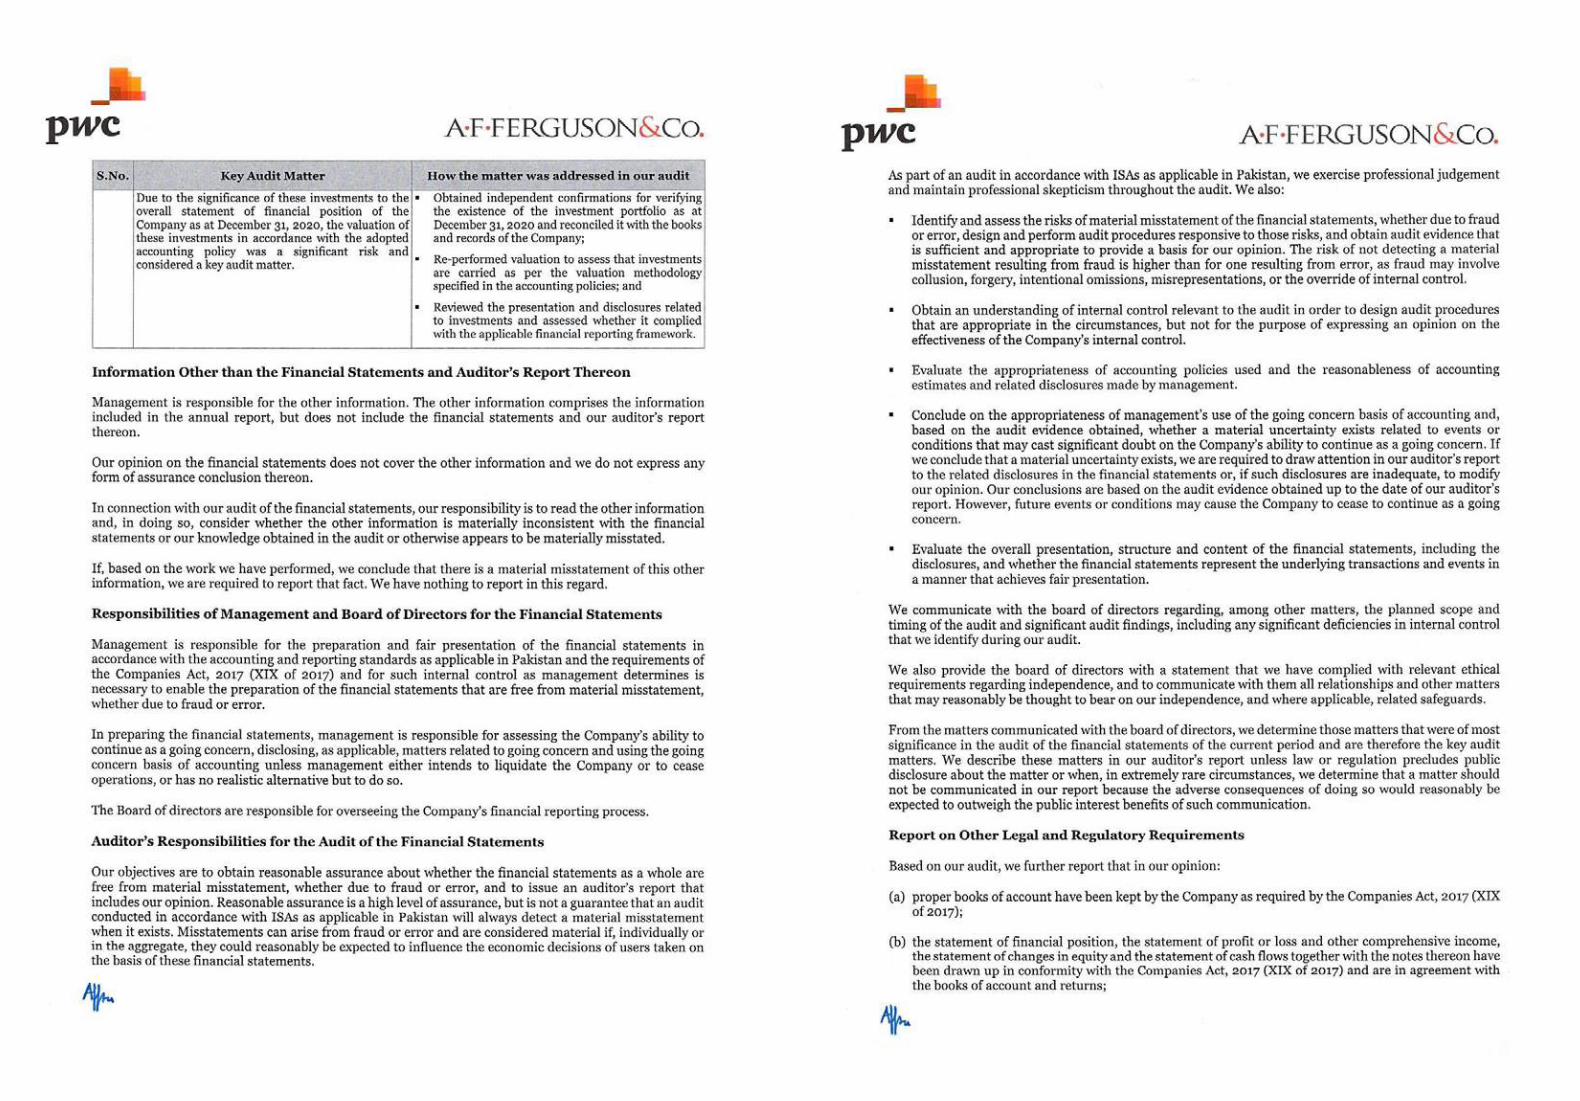
Financial Statements

117Annual Report 2020
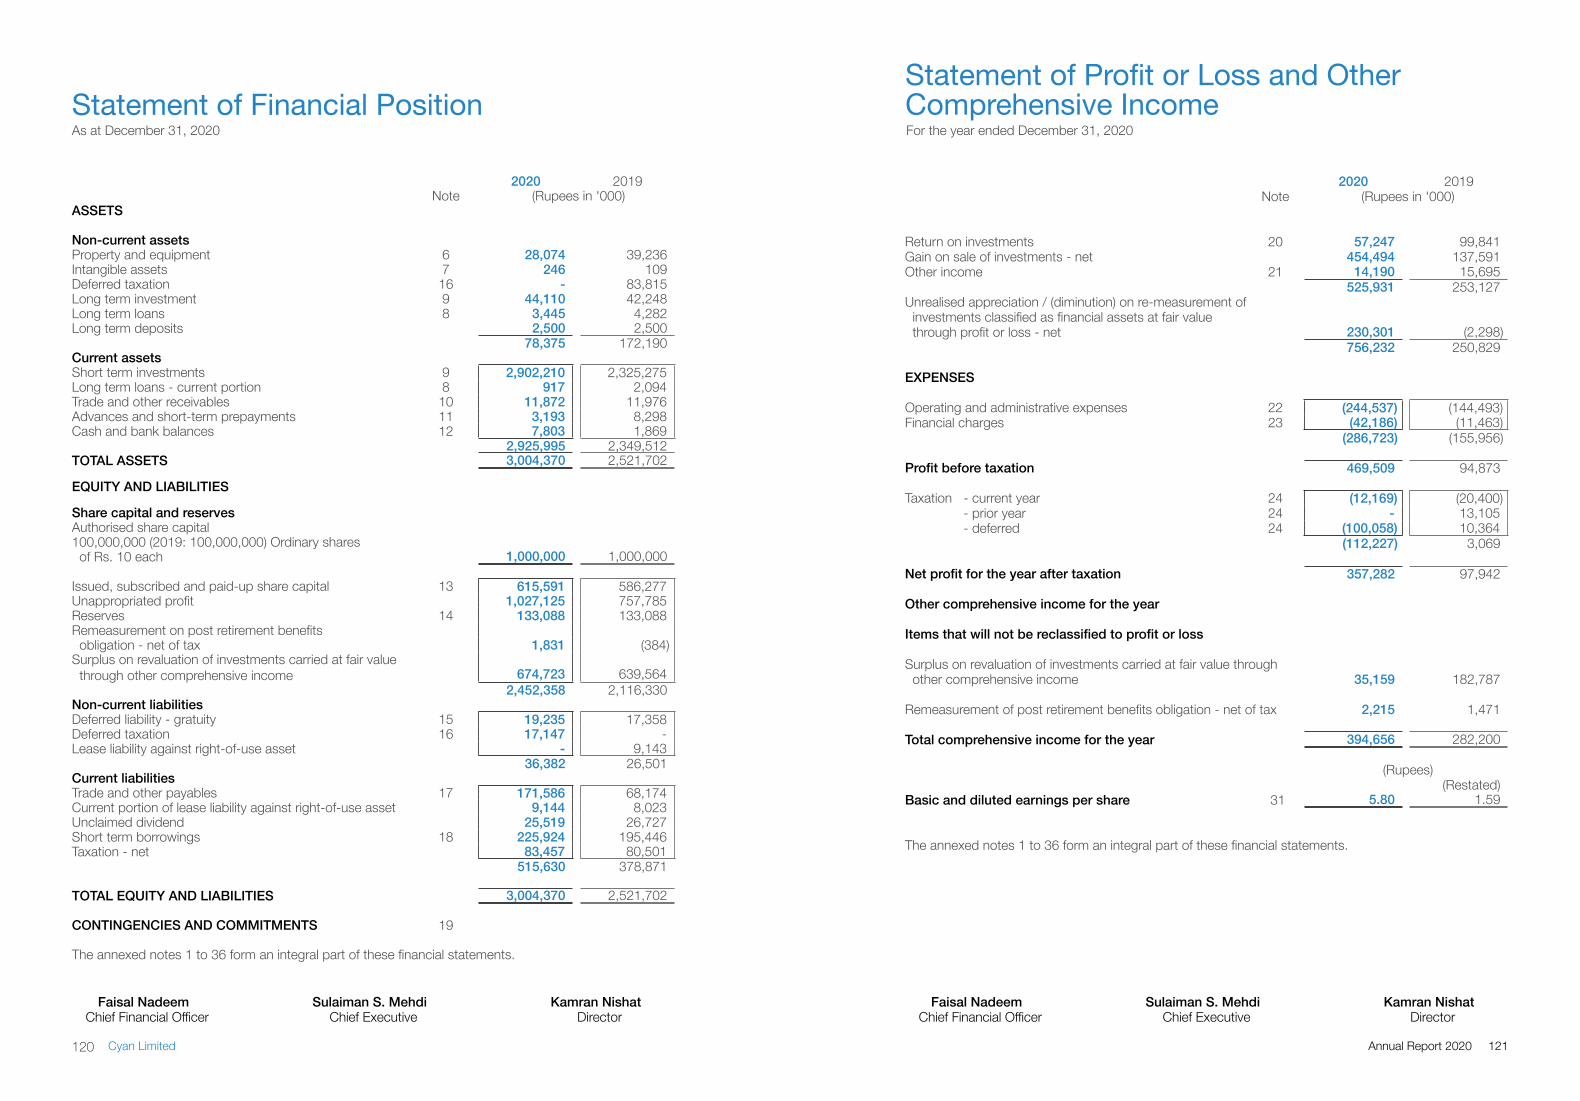
As at December 31, 2020
Statement of Profit or Loss and Other Comprehensive IncomeFor the year ended December 31, 2020
2020 2019Note (Rupees in '000)
Return on investments 20 57,247 99,841 Gain on sale of investments - net 454,494 137,591 Other income 21 14,190 15,695
525,931 253,127 Unrealised appreciation / (diminution) on re-measurement of
investments classified as financial assets at fair valuethrough profit or loss - net 230,301 (2,298)
756,232 250,829
EXPENSES
Operating and administrative expenses 22 (244,537) (144,493)Financial charges 23 (42,186) (11,463)
(286,723) (155,956)
Profit before taxation 469,509 94,873
Taxation - current year 24 (12,169) (20,400)- prior year 24 - 13,105 - deferred 24 (100,058) 10,364
(112,227) 3,069
Faisal Nadeem Sulaiman S. Mehdi Kamran NishatChief Financial Officer Chief Executive Director
Faisal Nadeem Sulaiman S. Mehdi Kamran NishatChief Financial Officer Chief Executive Director
2020 2019Note (Rupees in '000)
ASSETS
Non-current assetsProperty and equipment 6 28,074 39,236 Intangible assets 7 246 109 Deferred taxation 16 - 83,815 Long term investment 9 44,110 42,248 Long term loans 8 3,445 4,282 Long term deposits 2,500 2,500
78,375 172,190 Current assetsShort term investments 9 2,902,210 2,325,275 Long term loans - current portion 8 917 2,094 Trade and other receivables 10 11,872 11,976 Advances and short-term prepayments 11 3,193 8,298 Cash and bank balances 12 7,803 1,869
2,925,995 2,349,512 TOTAL ASSETS 3,004,370 2,521,702
EQUITY AND LIABILITIES
Share capital and reservesAuthorised share capital100,000,000 (2019: 100,000,000) Ordinary shares
of Rs. 10 each 1,000,000 1,000,000
Issued, subscribed and paid-up share capital 13 615,591 586,277 Unappropriated profit 1,027,125 757,785 Reserves 14 133,088 133,088 Remeasurement on post retirement benefits
obligation - net of tax 1,831 (384)Surplus on revaluation of investments carried at fair value
through other comprehensive income 674,723 639,564 2,452,358 2,116,330
Non-current liabilitiesDeferred liability - gratuity 15 19,235 17,358 Deferred taxation 16 17,147 - Lease liability against right-of-use asset - 9,143
36,382 26,501 Current liabilitiesTrade and other payables 17 171,586 68,174 Current portion of lease liability against right-of-use asset 9,144 8,023 Unclaimed dividend 25,519 26,727 Short term borrowings 18 225,924 195,446 Taxation - net 83,457 80,501
515,630 378,871
TOTAL EQUITY AND LIABILITIES 3,004,370 2,521,702
CONTINGENCIES AND COMMITMENTS 19
The annexed notes 1 to 36 form an integral part of these financial statements.
Statement of Financial Position
Net profit for the year after taxation 357,282 97,942
Other comprehensive income for the year
Items that will not be reclassified to profit or loss
Surplus on revaluation of investments carried at fair value through other comprehensive income 35,159 182,787
Remeasurement of post retirement benefits obligation - net of tax 2,215 1,471
Total comprehensive income for the year 394,656 282,200
(Rupees) (Restated)
Basic and diluted earnings per share 31 5.80 1.59
The annexed notes 1 to 36 form an integral part of these financial statements.
121Annual Report 2020120 Cyan Limited
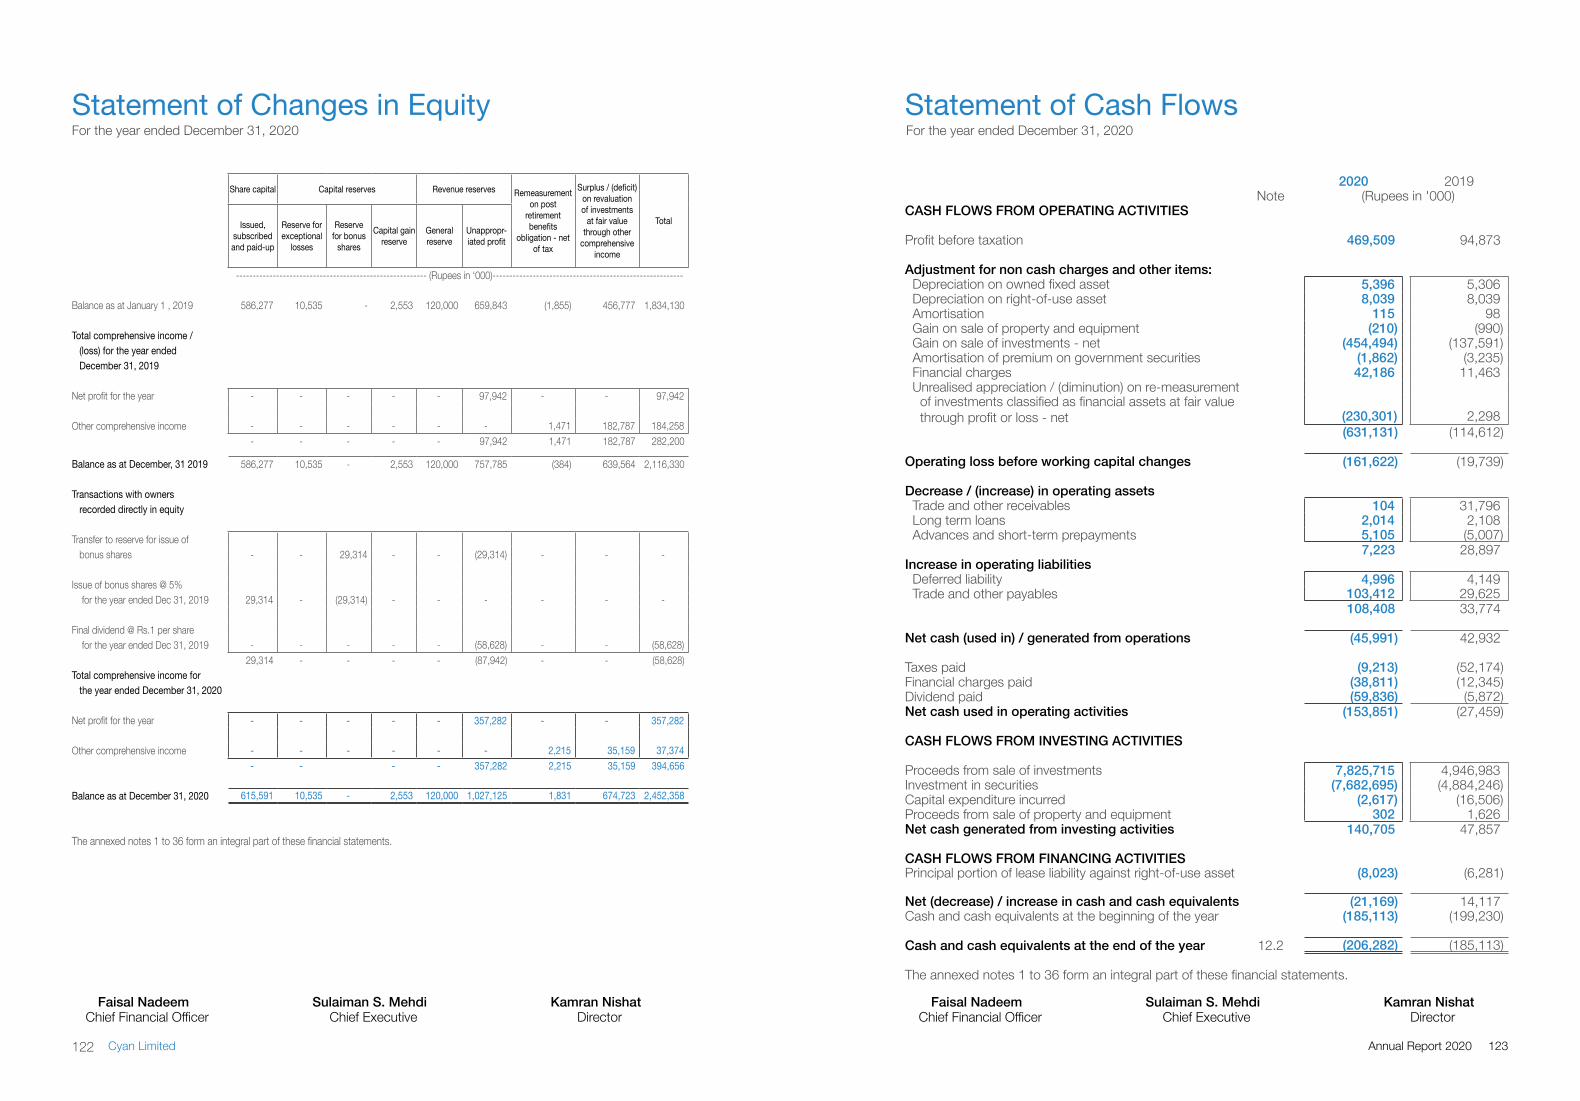
Faisal Nadeem Sulaiman S. Mehdi Kamran NishatChief Financial Officer Chief Executive Director
Faisal Nadeem Sulaiman S. Mehdi Kamran NishatChief Financial Officer Chief Executive Director
For the year ended December 31, 2020Statement of Changes in Equity Statement of Cash Flows
For the year ended December 31, 2020
2020 2019Note (Rupees in '000)
CASH FLOWS FROM OPERATING ACTIVITIES
Profit before taxation 469,509 94,873
Adjustment for non cash charges and other items:Depreciation on owned fixed asset 5,396 5,306 Depreciation on right-of-use asset 8,039 8,039 Amortisation 115 98 Gain on sale of property and equipment (210) (990)Gain on sale of investments - net (454,494) (137,591)Amortisation of premium on government securities (1,862) (3,235)Financial charges 42,186 11,463 Unrealised appreciation / (diminution) on re-measurement
of investments classified as financial assets at fair value through profit or loss - net (230,301) 2,298
(631,131) (114,612)
Operating loss before working capital changes (161,622) (19,739)
Decrease / (increase) in operating assets Trade and other receivables 104 31,796 Long term loans 2,014 2,108 Advances and short-term prepayments 5,105 (5,007)
7,223 28,897 Increase in operating liabilities
Deferred liability 4,996 4,149 Trade and other payables 103,412 29,625
108,408 33,774
Net cash (used in) / generated from operations (45,991) 42,932
Taxes paid (9,213) (52,174)Financial charges paid (38,811) (12,345)Dividend paid (59,836) (5,872)Net cash used in operating activities (153,851) (27,459)
CASH FLOWS FROM INVESTING ACTIVITIES
Proceeds from sale of investments 7,825,715 4,946,983 Investment in securities (7,682,695) (4,884,246)Capital expenditure incurred (2,617) (16,506)Proceeds from sale of property and equipment 302 1,626 Net cash generated from investing activities 140,705 47,857
CASH FLOWS FROM FINANCING ACTIVITIES Principal portion of lease liability against right-of-use asset (8,023) (6,281)
Net (decrease) / increase in cash and cash equivalents (21,169) 14,117Cash and cash equivalents at the beginning of the year (185,113) (199,230)
Cash and cash equivalents at the end of the year 12.2 (206,282) (185,113)
The annexed notes 1 to 36 form an integral part of these financial statements.
Share capital Capital reserves Revenue reserves Remeasurement on post
retirement benefits
obligation - net of tax
Surplus / (deficit) on revaluation of investments
at fair value through other
comprehensive income
TotalIssued, subscribed and paid-up
Reserve for exceptional
losses
Reserve for bonus
shares
Capital gain reserve
General reserve
Unappropr-iated profit
--------------------------------------------------------- (Rupees in ‘000)---------------------------------------------------------
Balance as at January 1 , 2019 586,277 10,535 - 2,553 120,000 659,843 (1,855) 456,777 1,834,130
Total comprehensive income /(loss) for the year endedDecember 31, 2019
Net profit for the year - - - - - 97,942 - - 97,942
Other comprehensive income - - - - - - 1,471 182,787 184,258 - - - - - 97,942 1,471 182,787 282,200
Balance as at December, 31 2019 586,277 10,535 - 2,553 120,000 757,785 (384) 639,564 2,116,330
Transactions with ownersrecorded directly in equity
Transfer to reserve for issue ofbonus shares - - 29,314 - - (29,314) - - -
Issue of bonus shares @ 5% for the year ended Dec 31, 2019 29,314 - (29,314) - - - - - -
Final dividend @ Rs.1 per share for the year ended Dec 31, 2019 - - - - - (58,628) - - (58,628)
29,314 - - - - (87,942) - - (58,628)Total comprehensive income for
the year ended December 31, 2020
Net profit for the year - - - - - 357,282 - - 357,282
Other comprehensive income - - - - - - 2,215 35,159 37,374 - - - - 357,282 2,215 35,159 394,656
Balance as at December 31, 2020 615,591 10,535 - 2,553 120,000 1,027,125 1,831 674,723 2,452,358
The annexed notes 1 to 36 form an integral part of these financial statements.
123Annual Report 2020122 Cyan Limited
For the year ended December 31, 2020
Notes to and Forming Part of the Financial Statements
1 LEGAL STATUS AND NATURE OF BUSINESS
Cyan Limited (“the Company”), a DH Group Company, is a Public Limited Company incorporated in Pakistan on April 23, 1960 under the Companies Act, 1913 (now Companies Act, 2017). The Company is listed on the Pakistan Stock Exchange. The registered office of the Company is situated at 4th Floor Dawood Centre, Molvi Tamizuddin Khan Road, Karachi. The Company is a subsidiary of Dawood Corporation (Private) Limited (the Parent Company).
The Company is engaged in making equity investments in companies with high growth potential.
2 BASIS OF PREPARATION
2.1 Statement of compliance
These financial statements have been prepared in accordance with the accounting and reporting standards as applicable in Pakistan. The accounting and reporting standards applicable in Pakistan comprise of:
- International Financial Reporting Standards (IFRS Standards) issued by the International Accounting Standards Board (lASB) as notified under the Companies Act, 2017;
- Provisions of and directives issued under the Companies Act, 2017.
Where provisions of and directives issued under the Companies Act, 2017 differ from the IFRS Standards, the provisions of and directives issued under the Companies Act, 2017 have been followed.
2.2 Basis of measurement
These financial statements have been prepared on the historical cost basis, except for certain investments which are measured at fair value as described in note 4.5 and certain staff retirement benefits which are carried at present value as described in note 4.12.
2.3 Functional and presentation currency
These financial statements are presented in Pakistan Rupees, which is the Company’s functional and presentation currency and have been rounded off to the nearest thousand rupees.
2.4 Use of estimates and judgments
The preparation of financial statements in conformity with the approved accounting and reporting standards as applicable in Pakistan requires the management to make estimates, judgments and assumptions that affect the reported amounts of assets and liabilities, income and expenses. It also requires the management to exercise judgment in application of its accounting policies. The estimates, judgments and associated assumptions are based on the management’s experience and various other factors that are believed to be reasonable under the circumstances. These estimates and assumptions are reviewed on an ongoing basis. Revisions to accounting estimates are recognised in the period in which the estimate is revised if the revision affects only that period, or in the period of revision and future periods if the revision affects both current and future periods. The areas where various assumptions and estimates are significant to the Company’s financial statements or where judgment was exercised in application of accounting policies are as follows:
(a) Classification of investments (note 4.5 and 9). (b) Accounting for defined benefit plan (note 4.12 and 15).
(c) Depreciation / amortisation of operating fixed assets and intangible assets (note 4.1, 4.6, 6 and 7) (d) Provision for taxation (current and prior years) and deferred taxation (note 4.3, 16 and 24)
Estimates and judgments are continually evaluated and are based on historical experience and other factors, including expectation of future events that are believed to be reasonable under the circumstances. Actual results may differ from these estimates.
3 NEW STANDARDS, INTERPRETATIONS AND AMENDMENTS TO PUBLISHED ACCOUNTING AND REPORTING STANDARDS
3.1 Standards, interpretations and amendments to published accounting and reporting standards that are effective in the current year
There are certain new standards and interpretations of and amendments to existing accounting and reporting standards that have become applicable to the Company for accounting periods beginning on or after January 1, 2020. These are considered either to not be relevant or do not have any significant impact on the Company’s financial statements and are therefore not detailed in these financial statements.
3.2 Standards, interpretations and amendments to published accounting and reporting standards that are not yet effective
The following new standards and interpretations of and amendments to existing published accounting and reporting standards will be effective from the dates mentioned below against the respective standard, interpretation or amendment:
Effective date (accounting
period beginning on or after) Amendments
- IFRS 16 - ‘Leases’ (amendments) June 01, 2020- IAS 1 - ‘Presentation of financial statements’ (Amendments) July 01, 2022- IAS 16, - ‘Property, plant and equipment’ (amendments) July 01, 2022- IAS 37, - ‘Provision, contingent liabilities and contingent assets’ (amendments) July 01, 2022
The management is in the process of assessing the impact of these standards on the financial statements of the Company.
There are certain new standards, amendments to the published accounting and reporting standards and new interpretations that are mandatory for the Company’s accounting periods beginning on or after January 1, 2021. However, these will not have any significant impact on the Company`s financial reporting and therefore have not been detailed in these financial statements.
4 SUMMARY OF SIGNIFICANT ACCOUNTING POLICIES
The principal accounting policies applied in the preparation of these financial statements are set out below. These policies have been consistently applied to all the years presented.
125Annual Report 2020124 Cyan Limited
For the year ended December 31, 2020
Notes to and Forming Part of the Financial Statements
4.1 Property and Equipment
4.1.1 Tangible
Fixed assets are stated at cost less accumulated depreciation and accumulated impairment losses, if any. Maintenance and normal repairs are charged to the profit or loss as and when incurred. Subsequent costs are included in the assets’ carrying amount or recognised as a separate asset, as appropriate, only when it is possible that the future economic benefits associated with the items will flow to the Company and the cost of the item can be measured reliably.
Depreciation on tangible fixed assets is charged to the profit or loss by applying the reducing balance method except in the case of cell phones in which case the straight line method is applied, whereby the depreciable amount of an asset is written-off over its estimated useful life at the rates specified in note 6. Depreciation is charged on additions from the date the asset is available for use whereas depreciation on disposals is charged till the date of disposal.
An item of fixed asset is derecognised upon disposal or when no future economic benefits are expected from its use or disposal.
The assets’ residual values, useful lives and methods are reviewed and adjusted, if appropriate at each financial year end. Gain or loss on disposal of fixed assets is charged to the profit or loss.
4.1.2 Intangibles
Intangible assets comprise software license, and are stated at cost less accumulated amortisation and accumulated impairment losses, if any. Amortisation is charged over the useful life of the asset on a systematic basis to profit or loss by applying the straight line method at the rates specified in note 7 to the financial statements.
4.2 Lease liability and right-of-use asset
At inception of a contract, the Company assesses whether a contract is, or contains, a lease based on whether the contract conveys the right to control the use of an identified asset for a period of time in exchange for consideration. Lease terms are negotiated on an individual basis and contain a wide range of different terms and conditions.
Leases are recognised as a right-of-use asset and a corresponding liability at the date at which the leased asset is available for use by the Company.
The lease liability is initially measured at the present value of the lease payments that are not paid at the commencement date, discounted using the interest rate implicit in the lease, or if that rate cannot be readily determined, the Company’s incremental borrowing rate.
Lease payments include fixed payments, variable lease payment that are based on an index or a rate amounts expected to be payable by the lessee under residual value guarantees, the exercise price of a purchase option if the lessee is reasonably certain to exercise that option, payments of penalties for terminating the lease, if the lease term reflects the lessee exercising that option, less any lease incentives receivable. The extension and termination options are incorporated in determination of lease term only when the Company is reasonably certain to exercise these options.
The lease liability is subsequently measured at amortised cost using the effective interest rate method. It is remeasured when there is a change in future lease payments arising from a change in fixed lease payments or an index or rate, change in the Company’s estimate of the amount expected to be
payable under a residual value guarantee, or if the Company changes its assessment of whether it will exercise a purchase, extension or termination option. The corresponding adjustment is made to the carrying amount of the right-to-use asset, or is recorded in profit and loss if the carrying amount of right-to-use asset has been reduced to zero.
The right-of-use asset is initially measured based on the initial amount of the lease liability adjusted for any lease payments made at or before the commencement date, plus any initial direct costs incurred and an estimate of costs to dismantle and remove the underlying asset or to restore the underlying asset or the site on which it is located, less any lease incentive received. The right-of-use asset is depreciated on a straight line method over the lease term as this method most closely reflects the expected pattern of consumption of future economic benefits. The right-of-use asset is reduced by impairment losses, if any, and adjusted for certain remeasurements of the lease liability.
4.3 Taxation
Income tax expense comprises current and deferred tax. Income tax expense is recognised in the profit or loss, except to the extent that it relates to items recognised directly in other comprehensive income or equity, in which case it is recognised in other comprehensive income or equity respectively.
4.3.1 Current
Provision for current taxation is based on taxable income at the enacted or substantively enacted rates of taxation after taking into account available tax credits and rebates, if any. The charge for current tax includes adjustments to charge for prior years, if any.
4.3.2 Deferred
Deferred tax is recognised using the balance sheet method, providing for temporary differences between the carrying amounts of assets and liabilities for financial reporting purposes and the amounts used for taxation purposes. The amount of deferred tax provided is based on the expected manner of realisation or settlement of the carrying amount of assets and liabilities, using the enacted or substantively enacted rates of taxation.
The Company recognises a deferred tax asset to the extent that it is probable that taxable profits for the foreseeable future will be available against which the asset can be utilized. Deferred tax assets are reduced to the extent that it is no longer probable that the related tax benefit will be realised.
4.4 Cash and cash equivalents
Cash and cash equivalents consist of cash in hand and at banks, stamps in hand, deposits, short term placements with banks and short term borrowings which form an integral part of the Company’s cash management and are included as a component of cash and cash equivalents for the purpose of the statement of cash flows.
4.5 Investments
The management of the Company determines the appropriate classification of its investments at the time of purchase and classifies its investments as at fair value through profit or loss, fair value through other comprehensive income and amortised cost. The classification depends on the purpose for which the investments were acquired.
127Annual Report 2020126 Cyan Limited
For the year ended December 31, 2020
Notes to and Forming Part of the Financial Statements
4.5.1 Financial assets at fair value through profit or loss
Financial assets at fair value through profit or loss are those financial assets which are either designated in this category or not classified in any of the other categories. A gain or loss on investment that is subsequently measured at fair value through profit or loss is recognised in profit or loss in the period in which it arises.
4.5.2 Financial assets at fair value through other comprehensive income
Financial assets at fair value through other comprehensive income are held within a business model whose objective is achieved by both collecting contractual cash flows and selling financial assets and the contractual terms of the financial asset give rise on specified dates to cash flows that are solely payments of principal and interest on the principal amount outstanding.
On adoption of IFRS-9, the Company has made an irrevocable election in respect of equity securities categorized under Available for sale, to present changes in fair value in other comprehensive income rather than profit or loss. When this election is used, fair value gains and losses recognised in other comprehensive income are not subsequently reclassified to profit or loss, including on disposal.
4.5.3 Financial assets at amortised cost
Financial assets at amortised cost are held within a business model whose objective is to hold financial assets in order to collect contractual cash flows and the contractual terms of the financial assets give rise on specified dates to cash flows that are solely payments of principal and interest on the principal amount outstanding. Interest income from these financial assets, impairment losses and gain or loss arising on derecognition are recognised directly in profit or loss.
4.6 Impairment
4.6.1 Financial assets
The Company assesses on a forward looking basis the expected credit losses associated with its financial assets carried at amortised cost and fair value through other comprehensive income. The impairment methodology applied depends on whether there has been a significant increase in credit risk.
4.6.2 Non-financial assets
Assets are reviewed for impairment whenever events or changes in circumstances indicate that the carrying amount may not be recoverable. An impairment loss is recognised for the amount by which the asset’s carrying amount exceeds its recoverable amount. The recoverable amount is the higher of an asset’s fair value less costs to sell and value in use. Non-financial assets that suffer an impairment are reviewed for possible reversal of the impairment at each reporting date.
4.7 Financial instruments
Financial instruments carried on the statement of financial position include investments, deposits, loans, advances, cash and bank, sundry receivables, loans to employees, accrued expenses, other creditors and accruals, unclaimed dividends and short term borrowings.
Financial assets are recognised at the time the Company becomes a party to the contractual
provisions of the instruments. These are initially recognised at fair value plus transaction costs except for financial assets carried ‘at fair value through profit or loss’. Financial assets carried ‘at fair value through profit or loss’ are initially recognised at fair value and transactions costs are recognised in the profit or loss.
Financial assets are derecognised when the rights to receive cash flows from the financial assets have expired or have been transferred and the Company has transferred substantially all risks and rewards of ownership. Any gain or loss on derecognition of financial assets is taken to the profit or loss except for investment in equity securities classified as fair value through other comprehensive income.
Financial liabilities are recognised at the time when the Company becomes a party to the contractual provisions of the instruments. These are initially recognised at fair values and subsequently stated at amortised cost.
A financial liability is derecognised when the obligation under the liability is discharged, cancelled or expired. Any gain or loss on derecognition of financial liabilities is taken to the profit or loss.
4.8 Off-setting of financial assets and liabilities
Financial assets and liabilities are offset and the net amount is reported in the financial statements only when there is a legally enforceable right to set off the recognised amount and the Company intends either to settle on a net basis, or to realize the assets and to settle the liabilities simultaneously.
4.9 Trade and other payables
Liabilities for creditors and other amounts payable are carried at cost which is the fair value of the consideration to be paid in the future for goods or services received, whether or not billed to the Company.
4.10 Provisions
Provisions are recognised when the Company has a present legal or constructive obligation as a result of past events, it is probable that an outflow of resources embodying economic benefits will be required to settle the obligation and a reliable estimate of the amount can be made. Provisions are reviewed at each statement of financial position date and adjusted to reflect the current best estimate.
4.11 Revenue recognition
Return on Investments
i) Dividend income on equity securities is recognised in the profit or loss when the right to receive the dividend is established.
ii) Realised capital gain / (losses) arising on sale of investments classified as financial assets ‘at fair value through profit or loss’ are recognised in the profit or loss on the date at which the transaction takes place.
iii) Unrealised capital gains / (losses) arising on mark to market of investments classified as ‘Financial assets at fair value through profit or loss’ and at ‘fair value through other comprehensive income’ are recognised in the profit or loss and other comprehensive income in the period in which they arise.
129Annual Report 2020128 Cyan Limited
For the year ended December 31, 2020
Notes to and Forming Part of the Financial Statements
iv) Income on government securities is recognised on time proportion basis using the effective yield method.
Other income
v) Income on long term loans, bank deposits and placements is recognised on accrual basis.
vi) Income on advisory services is recognised on delivery of services
4.12 Employee Benefits
4.12.1 Defined contribution plan
The Company operates a recognised contributory provident fund scheme for all its eligible employees. Equal contributions are made by the Company and the employees at the rate of 15% of the basic salary.
4.12.2 Defined benefit plan
The Company operates an unfunded approved gratuity scheme for all permanent employees who have completed the minimum qualifying period of service. Contributions to the scheme are made in accordance with an independent actuarial valuation using the Projected Unit Credit Method. Amounts arising as a result of remeasurements, representing actuarial gains and losses are recognised directly in equity through ‘other comprehensive income’ as they occur. The latest actuarial valuation of the scheme has been carried out as at December 31, 2020.
4.12.3 Employees’ compensated absences
The Company accounts for the liability in respect of employees compensated absences in the period in which they are earned.
4.13 Regular way contracts
Regular purchases and sale of financial assets are recognised on the trade date, the date on which the Company commits to purchase or sell the asset.
4.14 Earnings per share (EPS)
The Company presents basic and diluted earnings per share (EPS) data for its ordinary shares. Basic EPS is calculated by dividing the profit or loss attributable to ordinary shareholders of the Company by the weighted average number of ordinary shares outstanding during the period, adjusted for own shares held. Diluted EPS is determined by adjusting the profit or loss attributable to ordinary shareholders and the weighted average number of ordinary shares outstanding, adjusted for own shares held, for the effects of all dilutive potential ordinary shares, which comprise convertible notes and share options granted to employees.
4.15 Foreign currencies
Transactions in foreign currencies are recorded at the rates prevailing on the date of the transactions. Monetary assets and liabilities in foreign currencies are translated at the rates of exchange prevailing on the reporting date. Exchange gains or losses, if any, are taken to the profit or loss.
4.16 Dividend declaration and reserve appropriations
Dividend distribution and reserve appropriations are recorded in the period in which the distribution and appropriations are approved.
4.17 Segment Reporting
An operating segment is a component of the Company that engages in business activities from which it may earn revenues and incurs expenses that relates to transactions with any of the other components of the entity.
The Board of Directors and Chief executive have been identified as the Chief operating decision makers who are responsible for allocating resources and assessing the performance of the operating segments. Currently the Company is functioning as single operating segment .
4.18 Discontinued operations
A discontinued operation is a separate major line of business, which is a distinct part of the business both operationally and for financial reporting purposes and which is in the process of being discontinued by the entity. When an operation is classified as a discontinued operation, the comparative income statement is re-presented as if the operation had been discontinued from the start of the comparative period.
5 DISCONTINUED OPERATIONS
In 2011, the Board of Directors and shareholders of the Company in their respective meetings held on January 27, 2011 and March 10, 2011 had approved a business restructuring plan (BRP), by virtue of which the Company discontinued its insurance business and continues to undertake only strategic and portfolio investment business and investments in other financial instruments. On November 30, 2011, the Securities and Exchange Commission of Pakistan (SECP), in exercise of its powers under section 9 (2) of the Insurance Ordinance, 2000, de-registered the Company as an insurer and revoked its insurance license to carry on insurance business.
131Annual Report 2020130 Cyan Limited
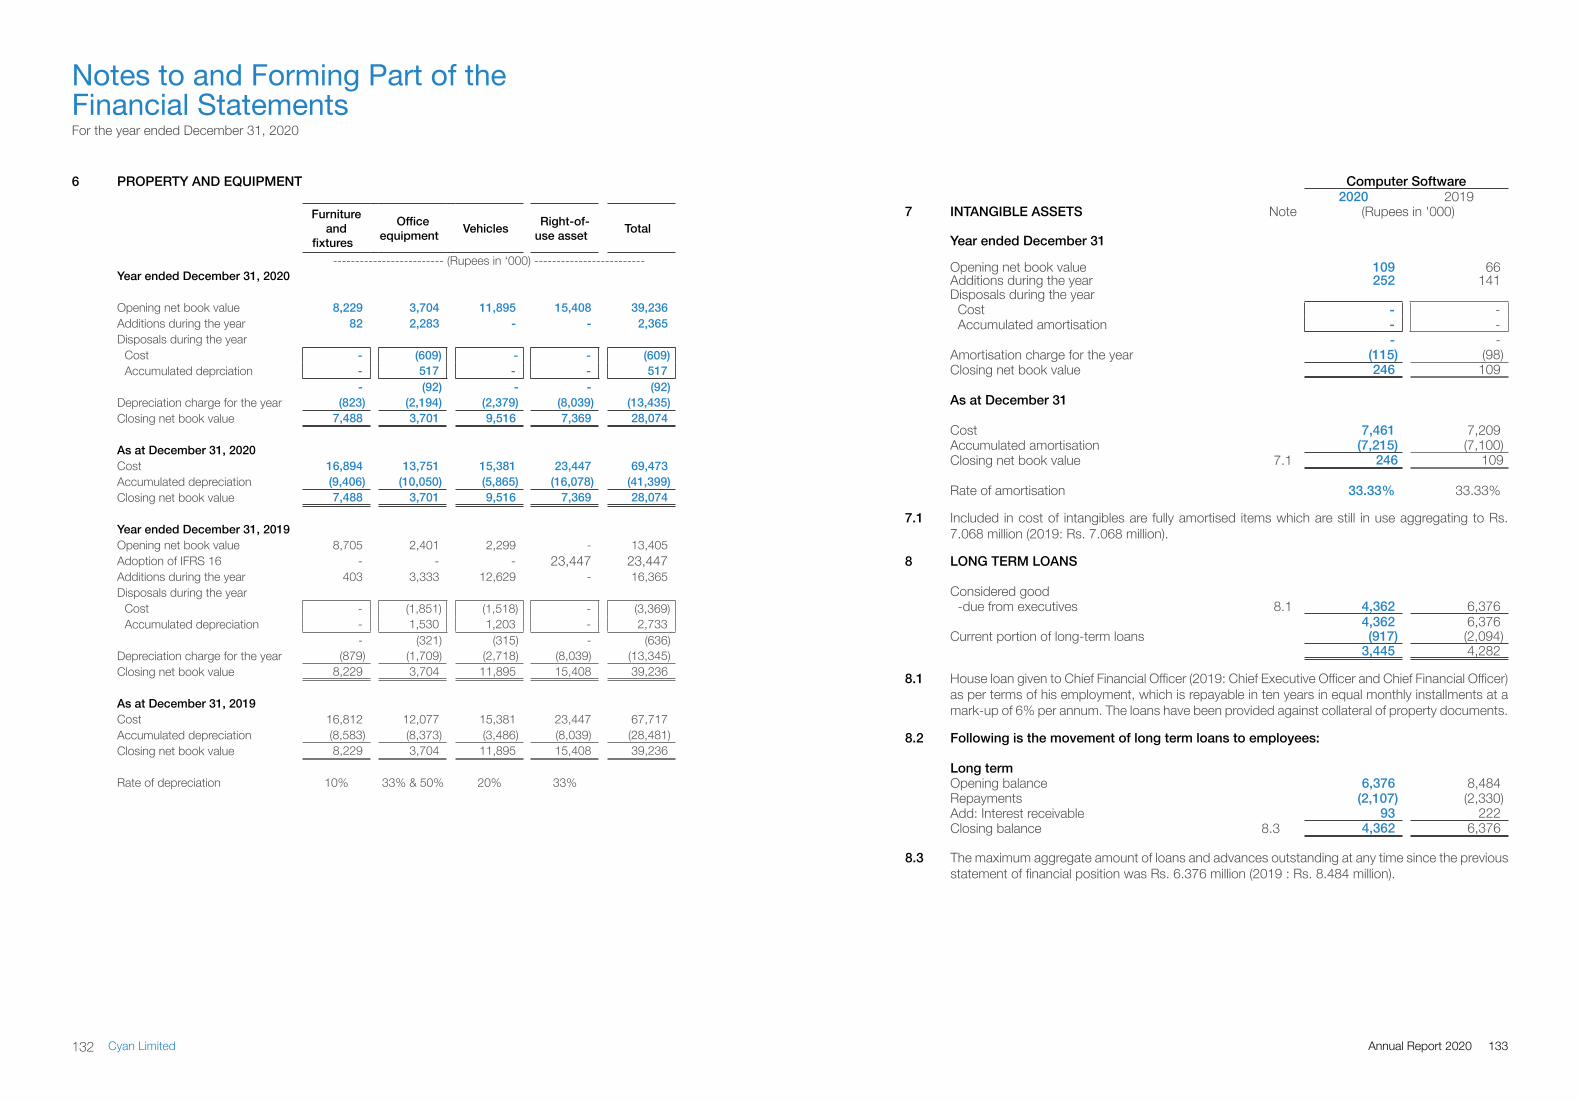
6 PROPERTY AND EQUIPMENT
Furniture and
fixtures
Office equipment Vehicles Right-of-
use asset Total
------------------------- (Rupees in ‘000) -------------------------Year ended December 31, 2020
Opening net book value 8,229 3,704 11,895 15,408 39,236 Additions during the year 82 2,283 - - 2,365 Disposals during the year
Cost - (609) - - (609)Accumulated deprciation - 517 - - 517
- (92) - - (92)Depreciation charge for the year (823) (2,194) (2,379) (8,039) (13,435)Closing net book value 7,488 3,701 9,516 7,369 28,074
As at December 31, 2020Cost 16,894 13,751 15,381 23,447 69,473 Accumulated depreciation (9,406) (10,050) (5,865) (16,078) (41,399)Closing net book value 7,488 3,701 9,516 7,369 28,074
Year ended December 31, 2019Opening net book value 8,705 2,401 2,299 - 13,405 Adoption of IFRS 16 - - - 23,447 23,447 Additions during the year 403 3,333 12,629 - 16,365 Disposals during the year
Cost - (1,851) (1,518) - (3,369)Accumulated depreciation - 1,530 1,203 - 2,733
- (321) (315) - (636)Depreciation charge for the year (879) (1,709) (2,718) (8,039) (13,345)Closing net book value 8,229 3,704 11,895 15,408 39,236
As at December 31, 2019Cost 16,812 12,077 15,381 23,447 67,717 Accumulated depreciation (8,583) (8,373) (3,486) (8,039) (28,481)Closing net book value 8,229 3,704 11,895 15,408 39,236
Rate of depreciation 10% 33% & 50% 20% 33%
Computer Software2020 2019
7 INTANGIBLE ASSETS Note (Rupees in '000)
Year ended December 31
Opening net book value 109 66 Additions during the year 252 141 Disposals during the year
Cost - - Accumulated amortisation - -
- - Amortisation charge for the year (115) (98)Closing net book value 246 109
As at December 31
Cost 7,461 7,209 Accumulated amortisation (7,215) (7,100) Closing net book value 7.1 246 109
Rate of amortisation 33.33% 33.33%
7.1 Included in cost of intangibles are fully amortised items which are still in use aggregating to Rs. 7.068 million (2019: Rs. 7.068 million).
8 LONG TERM LOANS
Considered good-due from executives 8.1 4,362 6,376
4,362 6,376 Current portion of long-term loans (917) (2,094)
3,445 4,282
8.1 House loan given to Chief Financial Officer (2019: Chief Executive Officer and Chief Financial Officer) as per terms of his employment, which is repayable in ten years in equal monthly installments at a mark-up of 6% per annum. The loans have been provided against collateral of property documents.
8.2 Following is the movement of long term loans to employees:
Long termOpening balance 6,376 8,484 Repayments (2,107) (2,330)Add: Interest receivable 93 222 Closing balance 8.3 4,362 6,376
8.3 The maximum aggregate amount of loans and advances outstanding at any time since the previous statement of financial position was Rs. 6.376 million (2019 : Rs. 8.484 million).
For the year ended December 31, 2020
Notes to and Forming Part of the Financial Statements
133Annual Report 2020132 Cyan Limited
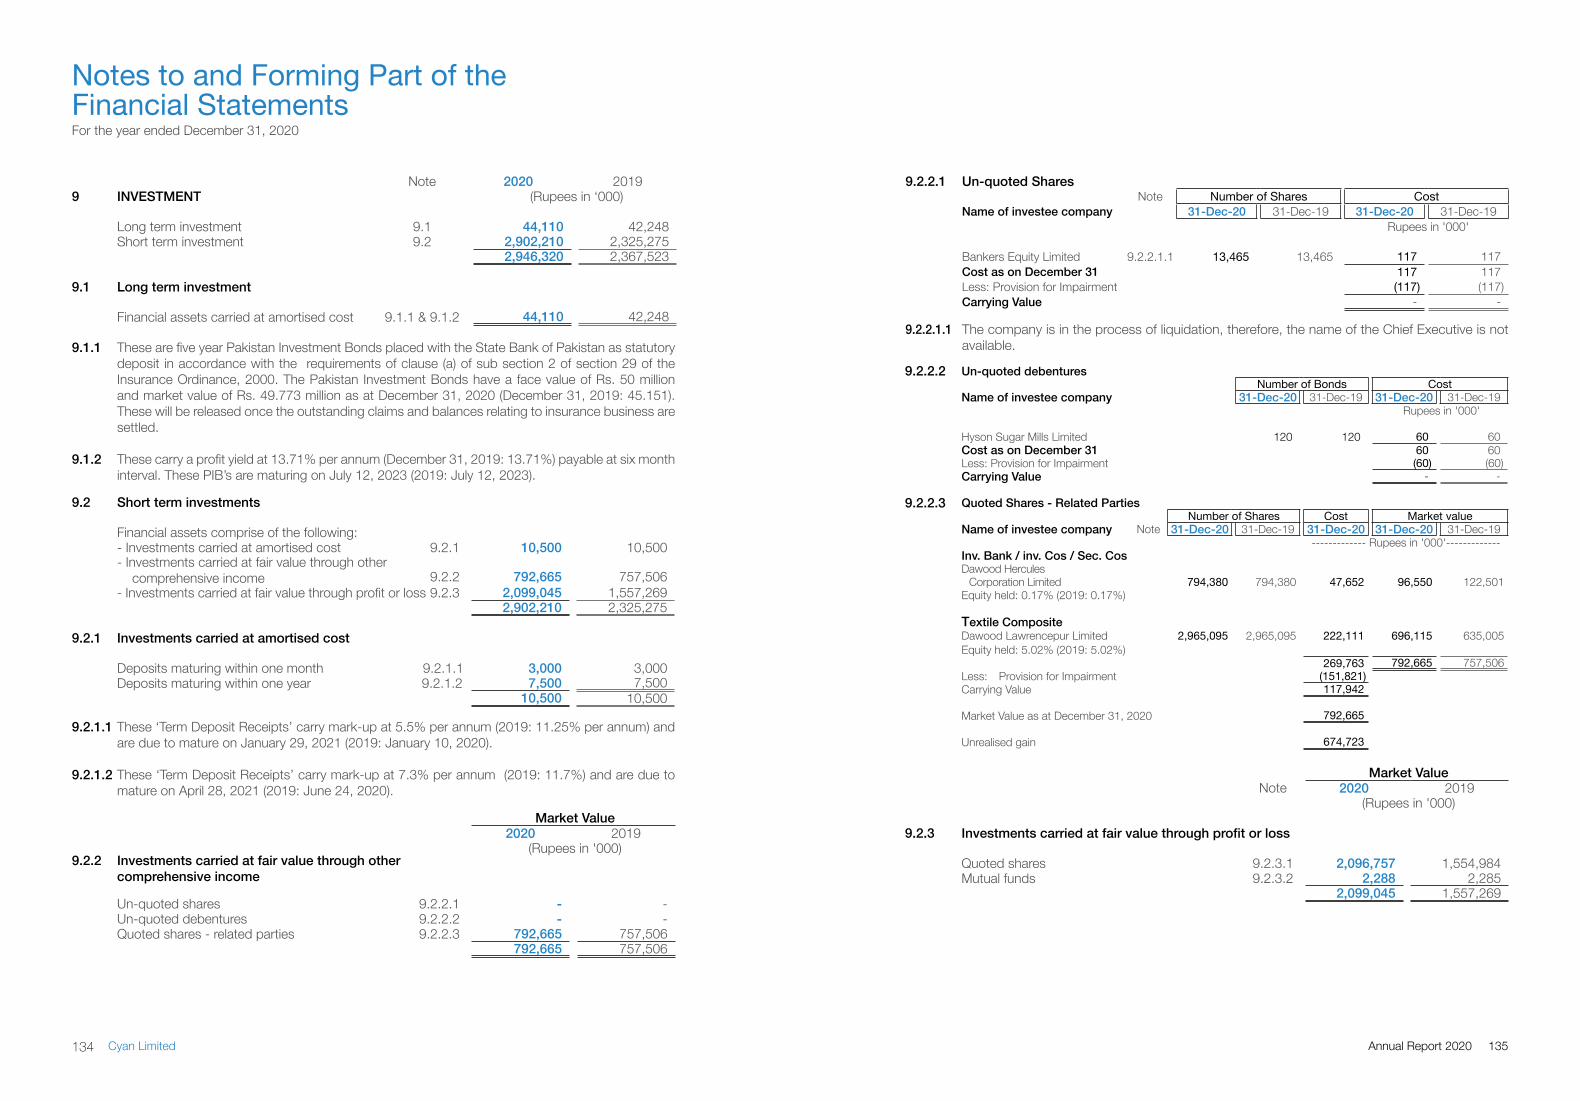
Note 2020 20199 INVESTMENT (Rupees in ‘000)
Long term investment 9.1 44,110 42,248 Short term investment 9.2 2,902,210 2,325,275
2,946,320 2,367,523
9.1 Long term investment
Financial assets carried at amortised cost 9.1.1 & 9.1.2 44,110 42,248
9.1.1 These are five year Pakistan Investment Bonds placed with the State Bank of Pakistan as statutory deposit in accordance with the requirements of clause (a) of sub section 2 of section 29 of the Insurance Ordinance, 2000. The Pakistan Investment Bonds have a face value of Rs. 50 million and market value of Rs. 49.773 million as at December 31, 2020 (December 31, 2019: 45.151). These will be released once the outstanding claims and balances relating to insurance business are settled.
9.1.2 These carry a profit yield at 13.71% per annum (December 31, 2019: 13.71%) payable at six month interval. These PIB’s are maturing on July 12, 2023 (2019: July 12, 2023).
9.2 Short term investments
Financial assets comprise of the following:- Investments carried at amortised cost 9.2.1 10,500 10,500 - Investments carried at fair value through other
comprehensive income 9.2.2 792,665 757,506 - Investments carried at fair value through profit or loss 9.2.3 2,099,045 1,557,269
2,902,210 2,325,275
9.2.1 Investments carried at amortised cost
Deposits maturing within one month 9.2.1.1 3,000 3,000 Deposits maturing within one year 9.2.1.2 7,500 7,500
10,500 10,500
9.2.1.1 These ‘Term Deposit Receipts’ carry mark-up at 5.5% per annum (2019: 11.25% per annum) and are due to mature on January 29, 2021 (2019: January 10, 2020).
9.2.1.2 These ‘Term Deposit Receipts’ carry mark-up at 7.3% per annum (2019: 11.7%) and are due to
mature on April 28, 2021 (2019: June 24, 2020).
9.2.2.1 Un-quoted SharesNote Number of Shares Cost
Name of investee company 31-Dec-20 31-Dec-19 31-Dec-20 31-Dec-19 Rupees in '000'
Bankers Equity Limited 9.2.2.1.1 13,465 13,465 117 117 Cost as on December 31 117 117 Less: Provision for Impairment (117) (117)Carrying Value - -
9.2.2.1.1 The company is in the process of liquidation, therefore, the name of the Chief Executive is not available.
Market Value 2020 2019
(Rupees in '000) 9.2.2 Investments carried at fair value through other
comprehensive income
Un-quoted shares 9.2.2.1 - - Un-quoted debentures 9.2.2.2 - - Quoted shares - related parties 9.2.2.3 792,665 757,506
792,665 757,506
Market Value Note 2020 2019
(Rupees in '000)
9.2.3 Investments carried at fair value through profit or loss
Quoted shares 9.2.3.1 2,096,757 1,554,984 Mutual funds 9.2.3.2 2,288 2,285
2,099,045 1,557,269
9.2.2.2 Un-quoted debentures Number of Bonds Cost
Name of investee company 31-Dec-20 31-Dec-19 31-Dec-20 31-Dec-19 Rupees in '000'
Hyson Sugar Mills Limited 120 120 60 60 Cost as on December 31 60 60 Less: Provision for Impairment (60) (60)Carrying Value - -
9.2.2.3 Quoted Shares - Related PartiesNumber of Shares Cost Market value
Name of investee company Note 31-Dec-20 31-Dec-19 31-Dec-20 31-Dec-20 31-Dec-19------------- Rupees in '000'-------------
Inv. Bank / inv. Cos / Sec. CosDawood Hercules
Corporation Limited 794,380 794,380 47,652 96,550 122,501 Equity held: 0.17% (2019: 0.17%)
Textile CompositeDawood Lawrencepur Limited 2,965,095 2,965,095 222,111 696,115 635,005 Equity held: 5.02% (2019: 5.02%)
269,763 792,665 757,506 Less: Provision for Impairment (151,821)Carrying Value 117,942
Market Value as at December 31, 2020 792,665
Unrealised gain 674,723
For the year ended December 31, 2020
Notes to and Forming Part of the Financial Statements
135Annual Report 2020134 Cyan Limited
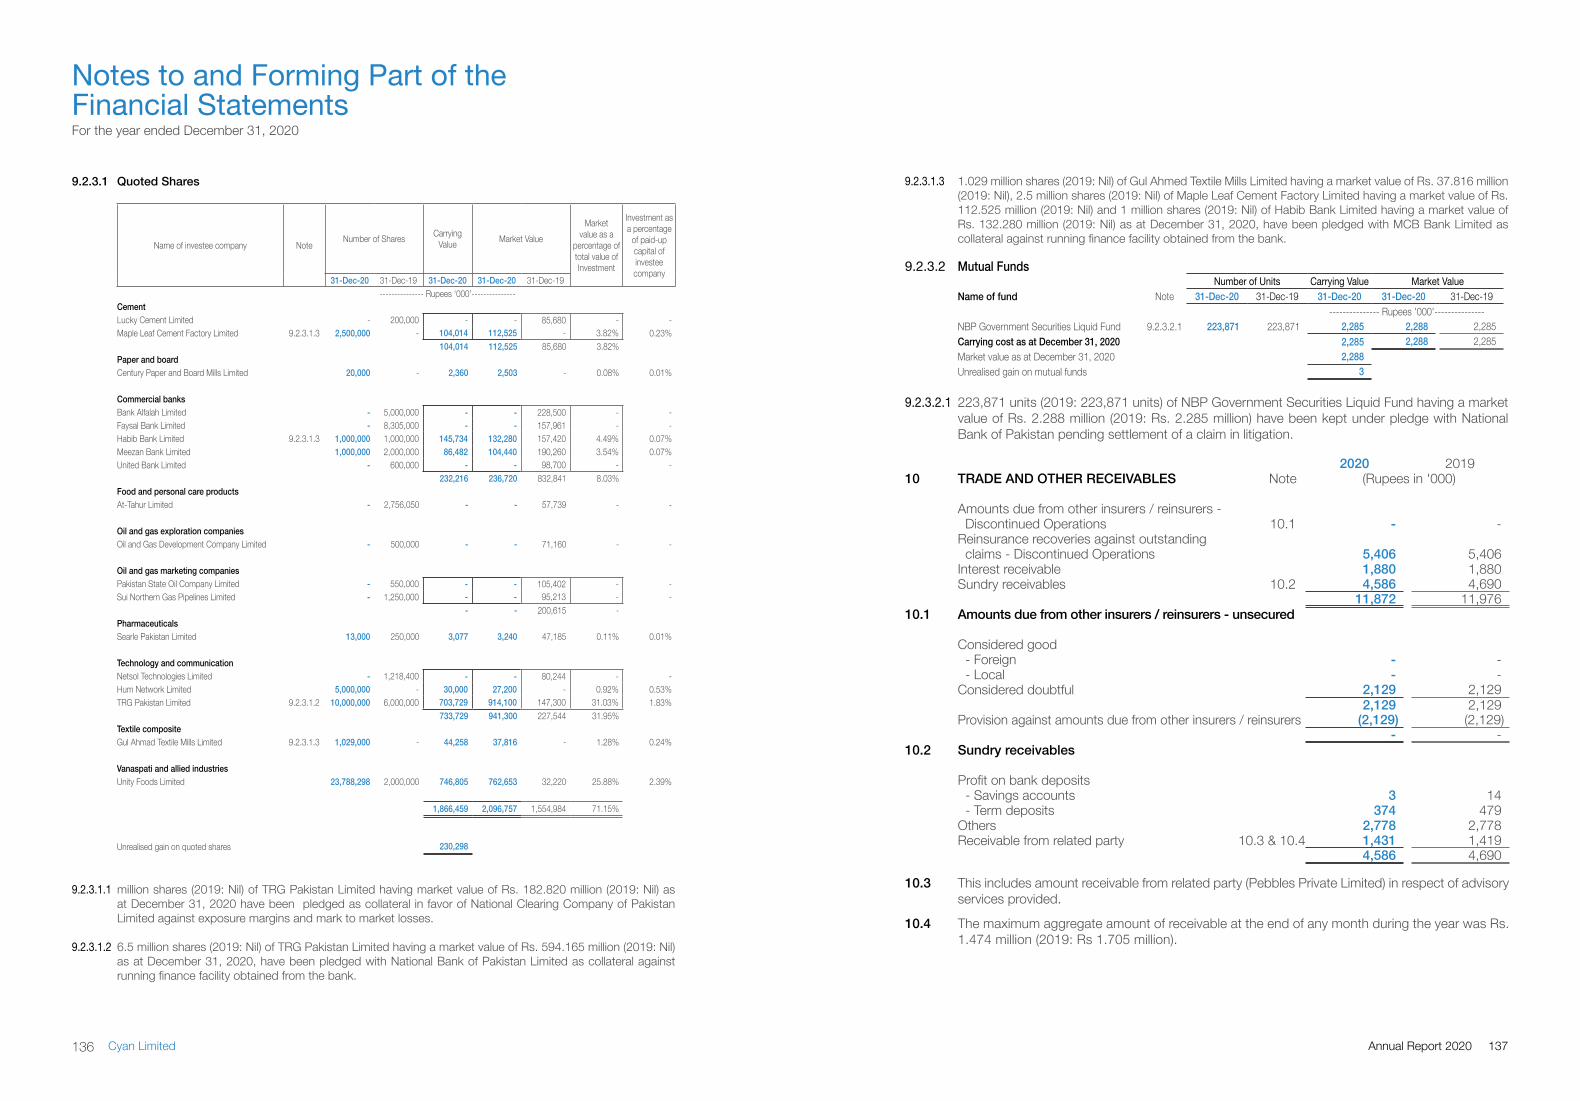
9.2.3.2 Mutual FundsNumber of Units Carrying Value Market Value
Name of fund Note 31-Dec-20 31-Dec-19 31-Dec-20 31-Dec-20 31-Dec-19 --------------- Rupees '000'---------------
NBP Government Securities Liquid Fund 9.2.3.2.1 223,871 223,871 2,285 2,288 2,285Carrying cost as at December 31, 2020 2,285 2,288 2,285Market value as at December 31, 2020 2,288 Unrealised gain on mutual funds 3
9.2.3.2.1 223,871 units (2019: 223,871 units) of NBP Government Securities Liquid Fund having a market value of Rs. 2.288 million (2019: Rs. 2.285 million) have been kept under pledge with National Bank of Pakistan pending settlement of a claim in litigation.
2020 201910 TRADE AND OTHER RECEIVABLES Note (Rupees in '000)
Amounts due from other insurers / reinsurers -Discontinued Operations 10.1 - -
Reinsurance recoveries against outstandingclaims - Discontinued Operations 5,406 5,406
Interest receivable 1,880 1,880 Sundry receivables 10.2 4,586 4,690
11,872 11,976 10.1 Amounts due from other insurers / reinsurers - unsecured
Considered good- Foreign - - - Local - -
Considered doubtful 2,129 2,129 2,129 2,129
Provision against amounts due from other insurers / reinsurers (2,129) (2,129) - -
10.2 Sundry receivables
Profit on bank deposits- Savings accounts 3 14 - Term deposits 374 479
Others 2,778 2,778 Receivable from related party 10.3 & 10.4 1,431 1,419
4,586 4,690
10.3 This includes amount receivable from related party (Pebbles Private Limited) in respect of advisory services provided.
10.4 The maximum aggregate amount of receivable at the end of any month during the year was Rs. 1.474 million (2019: Rs 1.705 million).
9.2.3.1.1 million shares (2019: Nil) of TRG Pakistan Limited having market value of Rs. 182.820 million (2019: Nil) as at December 31, 2020 have been pledged as collateral in favor of National Clearing Company of Pakistan Limited against exposure margins and mark to market losses.
9.2.3.1.2 6.5 million shares (2019: Nil) of TRG Pakistan Limited having a market value of Rs. 594.165 million (2019: Nil) as at December 31, 2020, have been pledged with National Bank of Pakistan Limited as collateral against running finance facility obtained from the bank.
For the year ended December 31, 2020
Notes to and Forming Part of the Financial Statements
9.2.3.1 Quoted Shares
Name of investee company Note Number of Shares Carrying Value Market Value
Market value as a
percentage of total value of Investment
Investment as a percentage
of paid-up capital of investee company
31-Dec-20 31-Dec-19 31-Dec-20 31-Dec-20 31-Dec-19--------------- Rupees ‘000’---------------
CementLucky Cement Limited - 200,000 - - 85,680 - - Maple Leaf Cement Factory Limited 9.2.3.1.3 2,500,000 - 104,014 112,525 - 3.82% 0.23%
104,014 112,525 85,680 3.82%Paper and boardCentury Paper and Board Mills Limited 20,000 - 2,360 2,503 - 0.08% 0.01%
Commercial banksBank Alfalah Limited - 5,000,000 - - 228,500 - - Faysal Bank Limited - 8,305,000 - - 157,961 - - Habib Bank Limited 9.2.3.1.3 1,000,000 1,000,000 145,734 132,280 157,420 4.49% 0.07%Meezan Bank Limited 1,000,000 2,000,000 86,482 104,440 190,260 3.54% 0.07%United Bank Limited - 600,000 - - 98,700 - -
232,216 236,720 832,841 8.03%Food and personal care productsAt-Tahur Limited - 2,756,050 - - 57,739 - -
Oil and gas exploration companiesOil and Gas Development Company Limited - 500,000 - - 71,160 - -
Oil and gas marketing companiesPakistan State Oil Company Limited - 550,000 - - 105,402 - - Sui Northern Gas Pipelines Limited - 1,250,000 - - 95,213 - -
- - 200,615 - PharmaceuticalsSearle Pakistan Limited 13,000 250,000 3,077 3,240 47,185 0.11% 0.01%
Technology and communicationNetsol Technologies Limited - 1,218,400 - - 80,244 - - Hum Network Limited 5,000,000 - 30,000 27,200 - 0.92% 0.53%TRG Pakistan Limited 9.2.3.1.2 10,000,000 6,000,000 703,729 914,100 147,300 31.03% 1.83%
733,729 941,300 227,544 31.95%Textile compositeGul Ahmad Textile Mills Limited 9.2.3.1.3 1,029,000 - 44,258 37,816 - 1.28% 0.24%
Vanaspati and allied industriesUnity Foods Limited 23,788,298 2,000,000 746,805 762,653 32,220 25.88% 2.39%
1,866,459 2,096,757 1,554,984 71.15%
Unrealised gain on quoted shares 230,298
9.2.3.1.3 1.029 million shares (2019: Nil) of Gul Ahmed Textile Mills Limited having a market value of Rs. 37.816 million (2019: Nil), 2.5 million shares (2019: Nil) of Maple Leaf Cement Factory Limited having a market value of Rs. 112.525 million (2019: Nil) and 1 million shares (2019: Nil) of Habib Bank Limited having a market value of Rs. 132.280 million (2019: Nil) as at December 31, 2020, have been pledged with MCB Bank Limited as collateral against running finance facility obtained from the bank.
137Annual Report 2020136 Cyan Limited
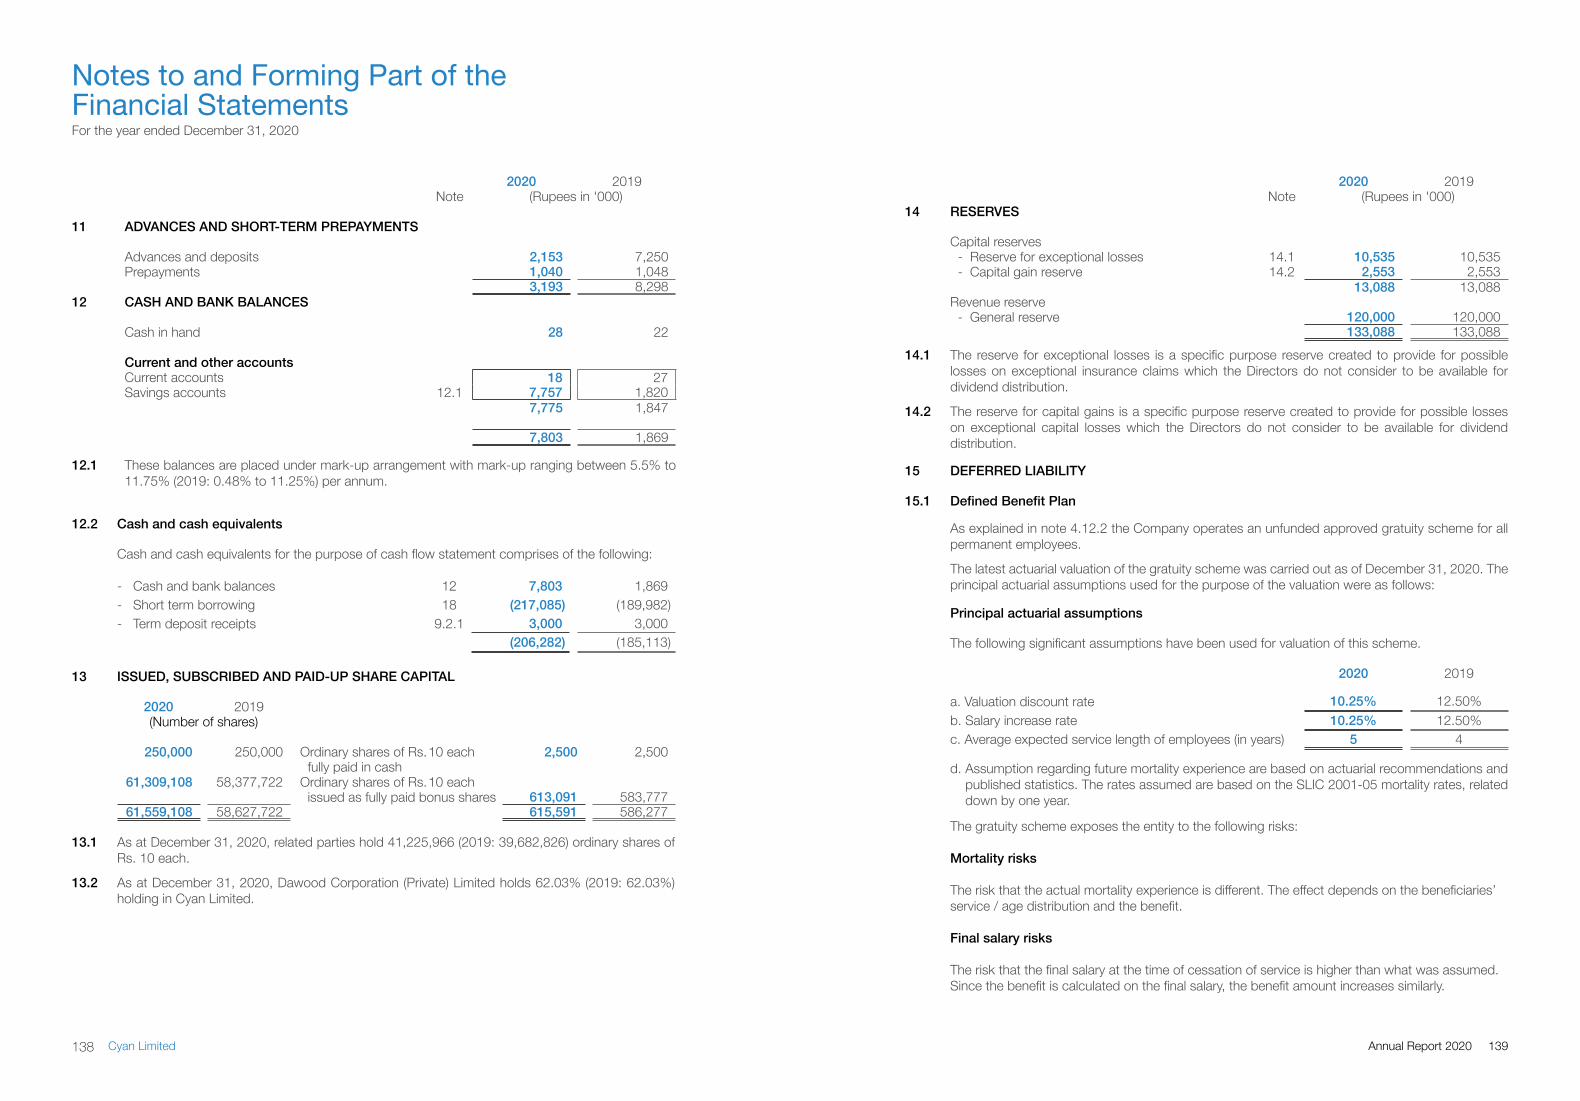
2020 2019Note (Rupees in '000)
11 ADVANCES AND SHORT-TERM PREPAYMENTS
Advances and deposits 2,153 7,250 Prepayments 1,040 1,048
3,193 8,298 12 CASH AND BANK BALANCES
Cash in hand 28 22
Current and other accountsCurrent accounts 18 27 Savings accounts 12.1 7,757 1,820
7,775 1,847
7,803 1,869
12.1 These balances are placed under mark-up arrangement with mark-up ranging between 5.5% to 11.75% (2019: 0.48% to 11.25%) per annum.
12.2 Cash and cash equivalents
Cash and cash equivalents for the purpose of cash flow statement comprises of the following:
- Cash and bank balances 12 7,803 1,869 - Short term borrowing 18 (217,085) (189,982)- Term deposit receipts 9.2.1 3,000 3,000
(206,282) (185,113)
13 ISSUED, SUBSCRIBED AND PAID-UP SHARE CAPITAL
2020 2019(Number of shares)
250,000 250,000 Ordinary shares of Rs.10 each 2,500 2,500 fully paid in cash
61,309,108 58,377,722 Ordinary shares of Rs.10 eachissued as fully paid bonus shares 613,091 583,777
61,559,108 58,627,722 615,591 586,277
2020 2019Note (Rupees in '000)
14 RESERVES
Capital reserves- Reserve for exceptional losses 14.1 10,535 10,535 - Capital gain reserve 14.2 2,553 2,553
13,088 13,088 Revenue reserve
- General reserve 120,000 120,000 133,088 133,088
14.1 The reserve for exceptional losses is a specific purpose reserve created to provide for possible losses on exceptional insurance claims which the Directors do not consider to be available for dividend distribution.
14.2 The reserve for capital gains is a specific purpose reserve created to provide for possible losses on exceptional capital losses which the Directors do not consider to be available for dividend distribution.
15 DEFERRED LIABILITY
15.1 Defined Benefit Plan
As explained in note 4.12.2 the Company operates an unfunded approved gratuity scheme for all permanent employees.
The latest actuarial valuation of the gratuity scheme was carried out as of December 31, 2020. The principal actuarial assumptions used for the purpose of the valuation were as follows:
Principal actuarial assumptions
The following significant assumptions have been used for valuation of this scheme.
2020 2019
a. Valuation discount rate 10.25% 12.50%b. Salary increase rate 10.25% 12.50%c. Average expected service length of employees (in years) 5 4
d. Assumption regarding future mortality experience are based on actuarial recommendations and published statistics. The rates assumed are based on the SLIC 2001-05 mortality rates, related down by one year.
The gratuity scheme exposes the entity to the following risks:
Mortality risks
The risk that the actual mortality experience is different. The effect depends on the beneficiaries’ service / age distribution and the benefit.
Final salary risks
The risk that the final salary at the time of cessation of service is higher than what was assumed. Since the benefit is calculated on the final salary, the benefit amount increases similarly.
13.1 As at December 31, 2020, related parties hold 41,225,966 (2019: 39,682,826) ordinary shares of Rs. 10 each.
13.2 As at December 31, 2020, Dawood Corporation (Private) Limited holds 62.03% (2019: 62.03%) holding in Cyan Limited.
For the year ended December 31, 2020
Notes to and Forming Part of the Financial Statements
139Annual Report 2020138 Cyan Limited
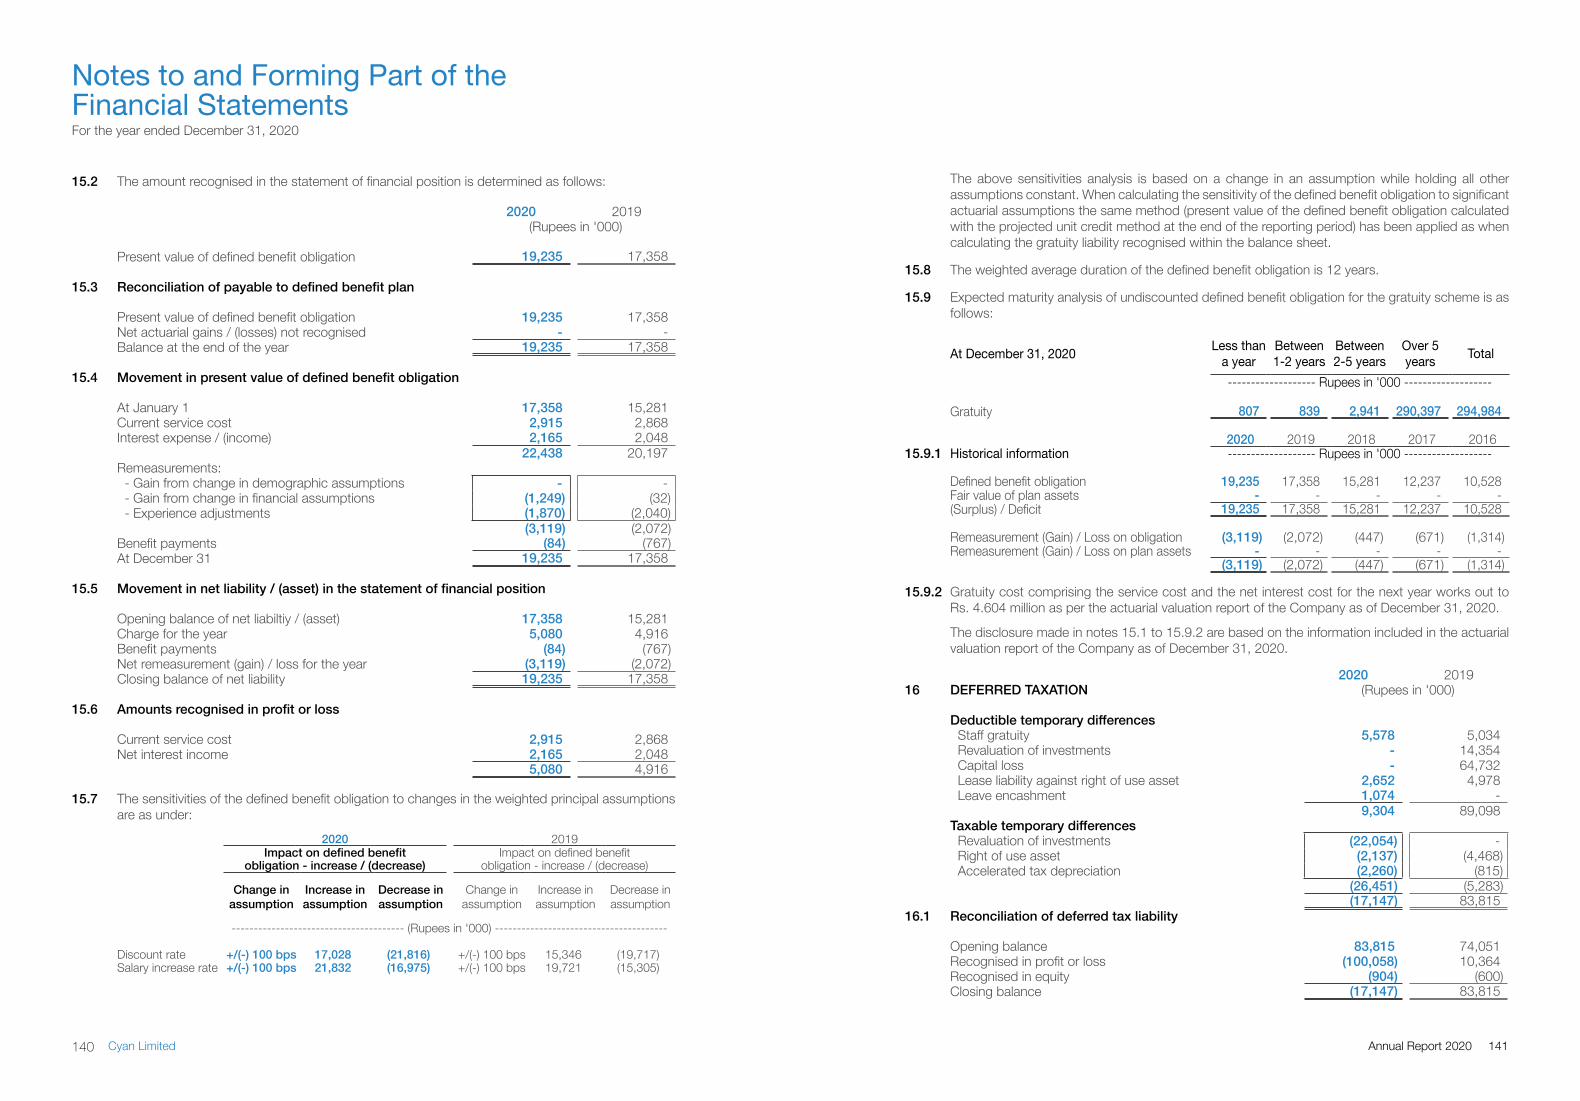
2020 201916 DEFERRED TAXATION (Rupees in '000)
Deductible temporary differencesStaff gratuity 5,578 5,034 Revaluation of investments - 14,354 Capital loss - 64,732 Lease liability against right of use asset 2,652 4,978 Leave encashment 1,074 -
9,304 89,098 Taxable temporary differences
Revaluation of investments (22,054) - Right of use asset (2,137) (4,468)Accelerated tax depreciation (2,260) (815)
(26,451) (5,283) (17,147) 83,815
16.1 Reconciliation of deferred tax liability
Opening balance 83,815 74,051 Recognised in profit or loss (100,058) 10,364 Recognised in equity (904) (600)Closing balance (17,147) 83,815
15.2 The amount recognised in the statement of financial position is determined as follows:
2020 2019 (Rupees in '000)
Present value of defined benefit obligation 19,235 17,358
15.3 Reconciliation of payable to defined benefit plan
Present value of defined benefit obligation 19,235 17,358 Net actuarial gains / (losses) not recognised - - Balance at the end of the year 19,235 17,358
15.4 Movement in present value of defined benefit obligation
At January 1 17,358 15,281 Current service cost 2,915 2,868 Interest expense / (income) 2,165 2,048
22,438 20,197 Remeasurements:
- Gain from change in demographic assumptions - - - Gain from change in financial assumptions (1,249) (32)- Experience adjustments (1,870) (2,040)
(3,119) (2,072)Benefit payments (84) (767)At December 31 19,235 17,358
15.5 Movement in net liability / (asset) in the statement of financial position
Opening balance of net liabiltiy / (asset) 17,358 15,281 Charge for the year 5,080 4,916 Benefit payments (84) (767)Net remeasurement (gain) / loss for the year (3,119) (2,072)Closing balance of net liability 19,235 17,358
15.6 Amounts recognised in profit or loss
Current service cost 2,915 2,868 Net interest income 2,165 2,048
5,080 4,916
15.7 The sensitivities of the defined benefit obligation to changes in the weighted principal assumptions are as under:
2020 2019Impact on defined benefit Impact on defined benefit
obligation - increase / (decrease) obligation - increase / (decrease)
Change in assumption
Increase in assumption
Decrease in assumption
Change in assumption
Increase in assumption
Decrease in assumption
--------------------------------------- (Rupees in '000) ---------------------------------------
Discount rate +/(-) 100 bps 17,028 (21,816) +/(-) 100 bps 15,346 (19,717)Salary increase rate +/(-) 100 bps 21,832 (16,975) +/(-) 100 bps 19,721 (15,305)
The above sensitivities analysis is based on a change in an assumption while holding all other assumptions constant. When calculating the sensitivity of the defined benefit obligation to significant actuarial assumptions the same method (present value of the defined benefit obligation calculated with the projected unit credit method at the end of the reporting period) has been applied as when calculating the gratuity liability recognised within the balance sheet.
15.8 The weighted average duration of the defined benefit obligation is 12 years.
15.9 Expected maturity analysis of undiscounted defined benefit obligation for the gratuity scheme is as follows:
At December 31, 2020 Less than a year
Between 1-2 years
Between 2-5 years
Over 5 years Total
------------------- Rupees in '000 -------------------
Gratuity 807 839 2,941 290,397 294,984
2020 2019 2018 2017 2016 15.9.1 Historical information ------------------- Rupees in '000 -------------------
Defined benefit obligation 19,235 17,358 15,281 12,237 10,528 Fair value of plan assets - - - - - (Surplus) / Deficit 19,235 17,358 15,281 12,237 10,528
Remeasurement (Gain) / Loss on obligation (3,119) (2,072) (447) (671) (1,314)Remeasurement (Gain) / Loss on plan assets - - - - -
(3,119) (2,072) (447) (671) (1,314)
15.9.2 Gratuity cost comprising the service cost and the net interest cost for the next year works out to Rs. 4.604 million as per the actuarial valuation report of the Company as of December 31, 2020.
The disclosure made in notes 15.1 to 15.9.2 are based on the information included in the actuarial valuation report of the Company as of December 31, 2020.
For the year ended December 31, 2020
Notes to and Forming Part of the Financial Statements
141Annual Report 2020140 Cyan Limited
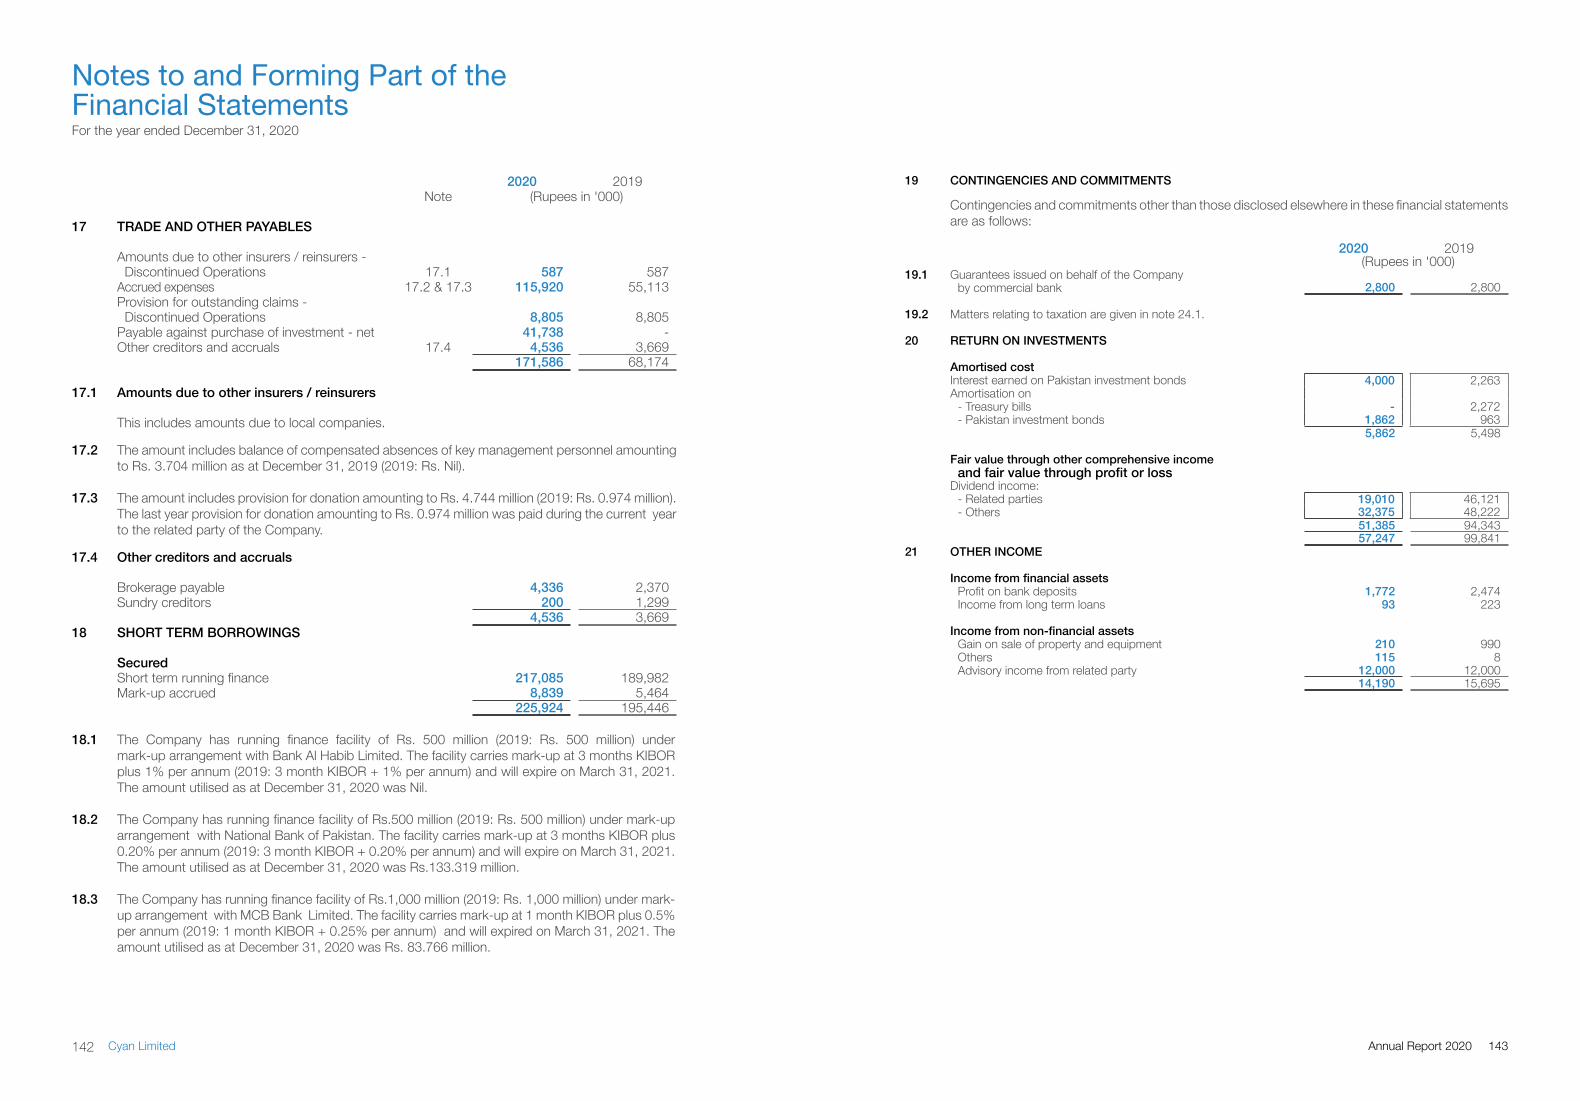
19 CONTINGENCIES AND COMMITMENTS
Contingencies and commitments other than those disclosed elsewhere in these financial statements are as follows:
2020 2019 (Rupees in '000)
19.1 Guarantees issued on behalf of the Companyby commercial bank 2,800 2,800
19.2 Matters relating to taxation are given in note 24.1.
20 RETURN ON INVESTMENTS
Amortised costInterest earned on Pakistan investment bonds 4,000 2,263 Amortisation on
- Treasury bills - 2,272 - Pakistan investment bonds 1,862 963
5,862 5,498
Fair value through other comprehensive incomeand fair value through profit or loss
Dividend income:- Related parties 19,010 46,121 - Others 32,375 48,222
51,385 94,343 57,247 99,841
21 OTHER INCOME
Income from financial assetsProfit on bank deposits 1,772 2,474Income from long term loans 93 223
Income from non-financial assetsGain on sale of property and equipment 210 990Others 115 8 Advisory income from related party 12,000 12,000
14,190 15,695
2020 2019Note (Rupees in '000)
17 TRADE AND OTHER PAYABLES
Amounts due to other insurers / reinsurers -Discontinued Operations 17.1 587 587
Accrued expenses 17.2 & 17.3 115,920 55,113 Provision for outstanding claims -
Discontinued Operations 8,805 8,805 Payable against purchase of investment - net 41,738 - Other creditors and accruals 17.4 4,536 3,669
171,586 68,174
17.1 Amounts due to other insurers / reinsurers
This includes amounts due to local companies.
17.2
17.3
The amount includes balance of compensated absences of key management personnel amounting to Rs. 3.704 million as at December 31, 2019 (2019: Rs. Nil).
The amount includes provision for donation amounting to Rs. 4.744 million (2019: Rs. 0.974 million). The last year provision for donation amounting to Rs. 0.974 million was paid during the current year to the related party of the Company.
17.4 Other creditors and accruals
Brokerage payable 4,336 2,370 Sundry creditors 200 1,299
4,536 3,669 18 SHORT TERM BORROWINGS
SecuredShort term running finance 217,085 189,982 Mark-up accrued 8,839 5,464
225,924 195,446
18.1 The Company has running finance facility of Rs. 500 million (2019: Rs. 500 million) under mark-up arrangement with Bank Al Habib Limited. The facility carries mark-up at 3 months KIBOR plus 1% per annum (2019: 3 month KIBOR + 1% per annum) and will expire on March 31, 2021. The amount utilised as at December 31, 2020 was Nil.
18.2 The Company has running finance facility of Rs.500 million (2019: Rs. 500 million) under mark-up arrangement with National Bank of Pakistan. The facility carries mark-up at 3 months KIBOR plus 0.20% per annum (2019: 3 month KIBOR + 0.20% per annum) and will expire on March 31, 2021. The amount utilised as at December 31, 2020 was Rs.133.319 million.
18.3 The Company has running finance facility of Rs.1,000 million (2019: Rs. 1,000 million) under mark-up arrangement with MCB Bank Limited. The facility carries mark-up at 1 month KIBOR plus 0.5% per annum (2019: 1 month KIBOR + 0.25% per annum) and will expired on March 31, 2021. The amount utilised as at December 31, 2020 was Rs. 83.766 million.
For the year ended December 31, 2020
Notes to and Forming Part of the Financial Statements
143Annual Report 2020142 Cyan Limited
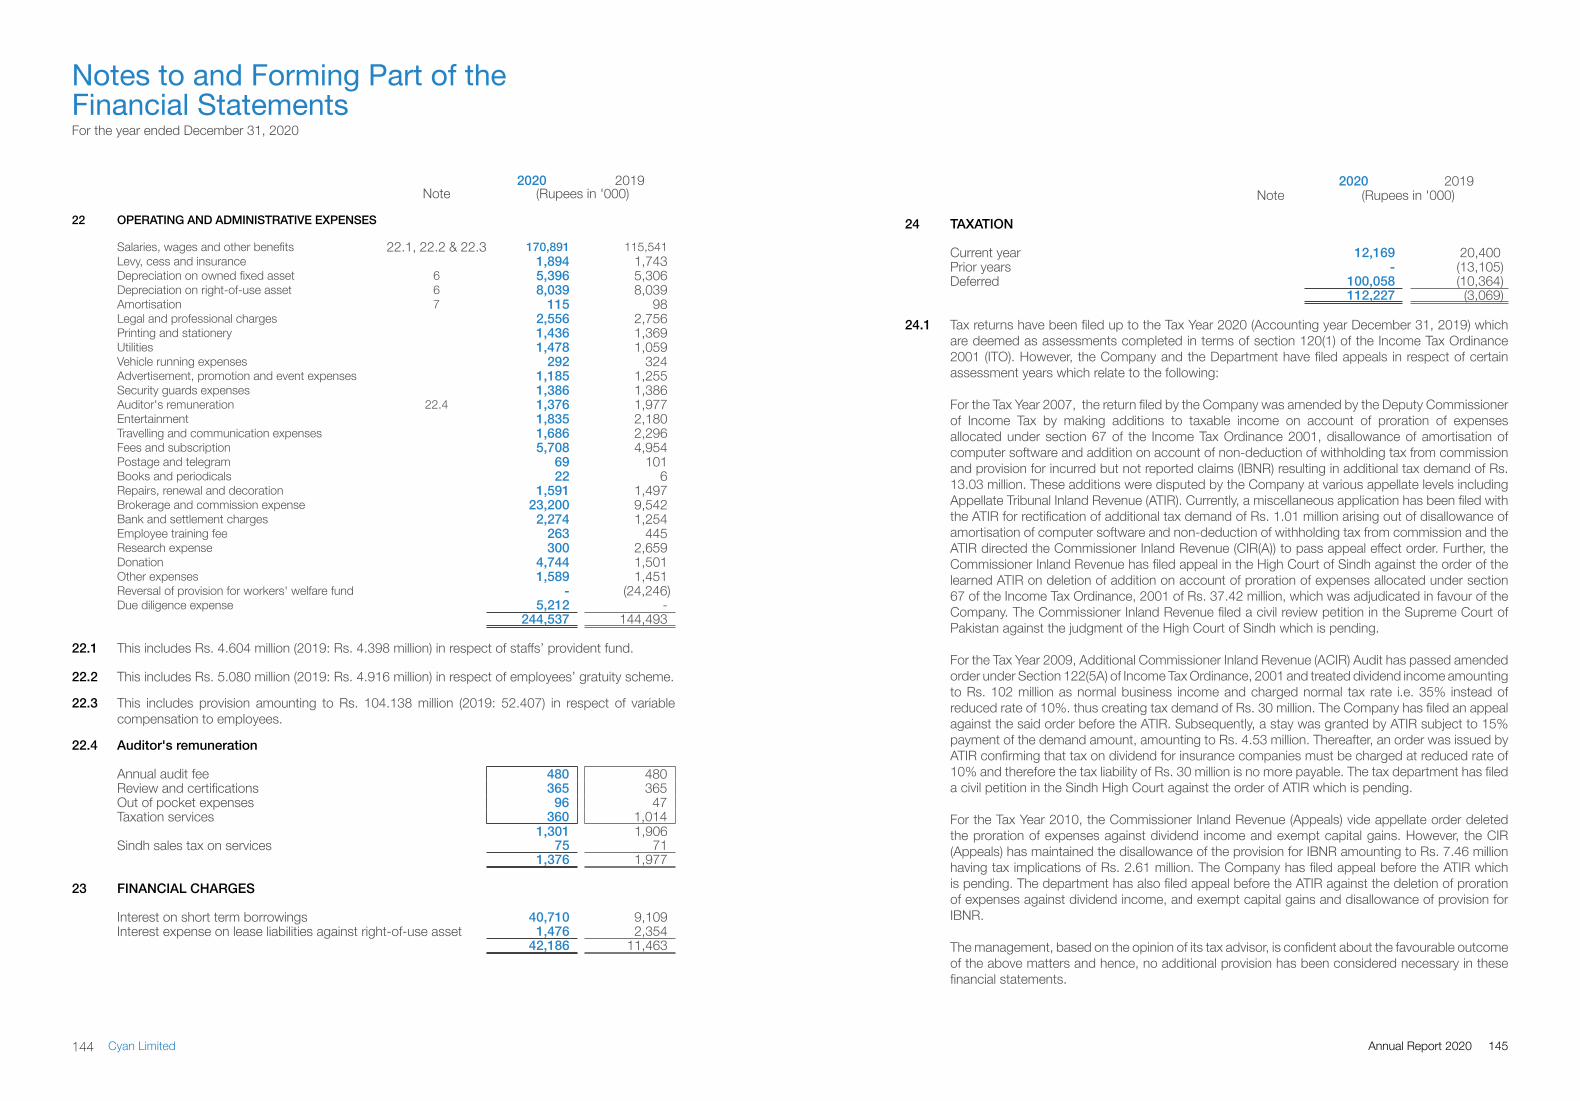
2020 2019Note (Rupees in '000)
22 OPERATING AND ADMINISTRATIVE EXPENSES
Salaries, wages and other benefits 22.1, 22.2 & 22.3 170,891 115,541 Levy, cess and insurance 1,894 1,743 Depreciation on owned fixed asset 6 5,396 5,306 Depreciation on right-of-use asset 6 8,039 8,039 Amortisation 7 115 98 Legal and professional charges 2,556 2,756 Printing and stationery 1,436 1,369 Utilities 1,478 1,059 Vehicle running expenses 292 324 Advertisement, promotion and event expenses 1,185 1,255 Security guards expenses 1,386 1,386 Auditor's remuneration 22.4 1,376 1,977 Entertainment 1,835 2,180 Travelling and communication expenses 1,686 2,296 Fees and subscription 5,708 4,954 Postage and telegram 69 101 Books and periodicals 22 6 Repairs, renewal and decoration 1,591 1,497 Brokerage and commission expense 23,200 9,542 Bank and settlement charges 2,274 1,254 Employee training fee 263 445 Research expense 300 2,659 Donation 4,744 1,501 Other expenses 1,589 1,451 Reversal of provision for workers' welfare fund - (24,246)Due diligence expense 5,212 -
244,537 144,493
22.1 This includes Rs. 4.604 million (2019: Rs. 4.398 million) in respect of staffs’ provident fund.
22.2 This includes Rs. 5.080 million (2019: Rs. 4.916 million) in respect of employees’ gratuity scheme.
22.3 This includes provision amounting to Rs. 104.138 million (2019: 52.407) in respect of variable compensation to employees.
22.4 Auditor's remuneration
Annual audit fee 480 480 Review and certifications 365 365 Out of pocket expenses 96 47 Taxation services 360 1,014
1,301 1,906 Sindh sales tax on services 75 71
1,376 1,977
23 FINANCIAL CHARGES
Interest on short term borrowings 40,710 9,109 Interest expense on lease liabilities against right-of-use asset 1,476 2,354
42,186 11,463
2020 2019Note (Rupees in '000)
24 TAXATION
Current year 12,169 20,400 Prior years - (13,105)Deferred 100,058 (10,364)
112,227 (3,069)
24.1 Tax returns have been filed up to the Tax Year 2020 (Accounting year December 31, 2019) which are deemed as assessments completed in terms of section 120(1) of the Income Tax Ordinance 2001 (ITO). However, the Company and the Department have filed appeals in respect of certain assessment years which relate to the following:
For the Tax Year 2007, the return filed by the Company was amended by the Deputy Commissioner of Income Tax by making additions to taxable income on account of proration of expenses allocated under section 67 of the Income Tax Ordinance 2001, disallowance of amortisation of computer software and addition on account of non-deduction of withholding tax from commission and provision for incurred but not reported claims (IBNR) resulting in additional tax demand of Rs. 13.03 million. These additions were disputed by the Company at various appellate levels including Appellate Tribunal Inland Revenue (ATIR). Currently, a miscellaneous application has been filed with the ATIR for rectification of additional tax demand of Rs. 1.01 million arising out of disallowance of amortisation of computer software and non-deduction of withholding tax from commission and the ATIR directed the Commissioner Inland Revenue (CIR(A)) to pass appeal effect order. Further, the Commissioner Inland Revenue has filed appeal in the High Court of Sindh against the order of the learned ATIR on deletion of addition on account of proration of expenses allocated under section 67 of the Income Tax Ordinance, 2001 of Rs. 37.42 million, which was adjudicated in favour of the Company. The Commissioner Inland Revenue filed a civil review petition in the Supreme Court of Pakistan against the judgment of the High Court of Sindh which is pending.
For the Tax Year 2009, Additional Commissioner Inland Revenue (ACIR) Audit has passed amended order under Section 122(5A) of Income Tax Ordinance, 2001 and treated dividend income amounting to Rs. 102 million as normal business income and charged normal tax rate i.e. 35% instead of reduced rate of 10%. thus creating tax demand of Rs. 30 million. The Company has filed an appeal against the said order before the ATIR. Subsequently, a stay was granted by ATIR subject to 15% payment of the demand amount, amounting to Rs. 4.53 million. Thereafter, an order was issued by ATIR confirming that tax on dividend for insurance companies must be charged at reduced rate of 10% and therefore the tax liability of Rs. 30 million is no more payable. The tax department has filed a civil petition in the Sindh High Court against the order of ATIR which is pending.
For the Tax Year 2010, the Commissioner Inland Revenue (Appeals) vide appellate order deleted the proration of expenses against dividend income and exempt capital gains. However, the CIR (Appeals) has maintained the disallowance of the provision for IBNR amounting to Rs. 7.46 million having tax implications of Rs. 2.61 million. The Company has filed appeal before the ATIR which is pending. The department has also filed appeal before the ATIR against the deletion of proration of expenses against dividend income, and exempt capital gains and disallowance of provision for IBNR.
The management, based on the opinion of its tax advisor, is confident about the favourable outcome of the above matters and hence, no additional provision has been considered necessary in these financial statements.
For the year ended December 31, 2020
Notes to and Forming Part of the Financial Statements
145Annual Report 2020144 Cyan Limited
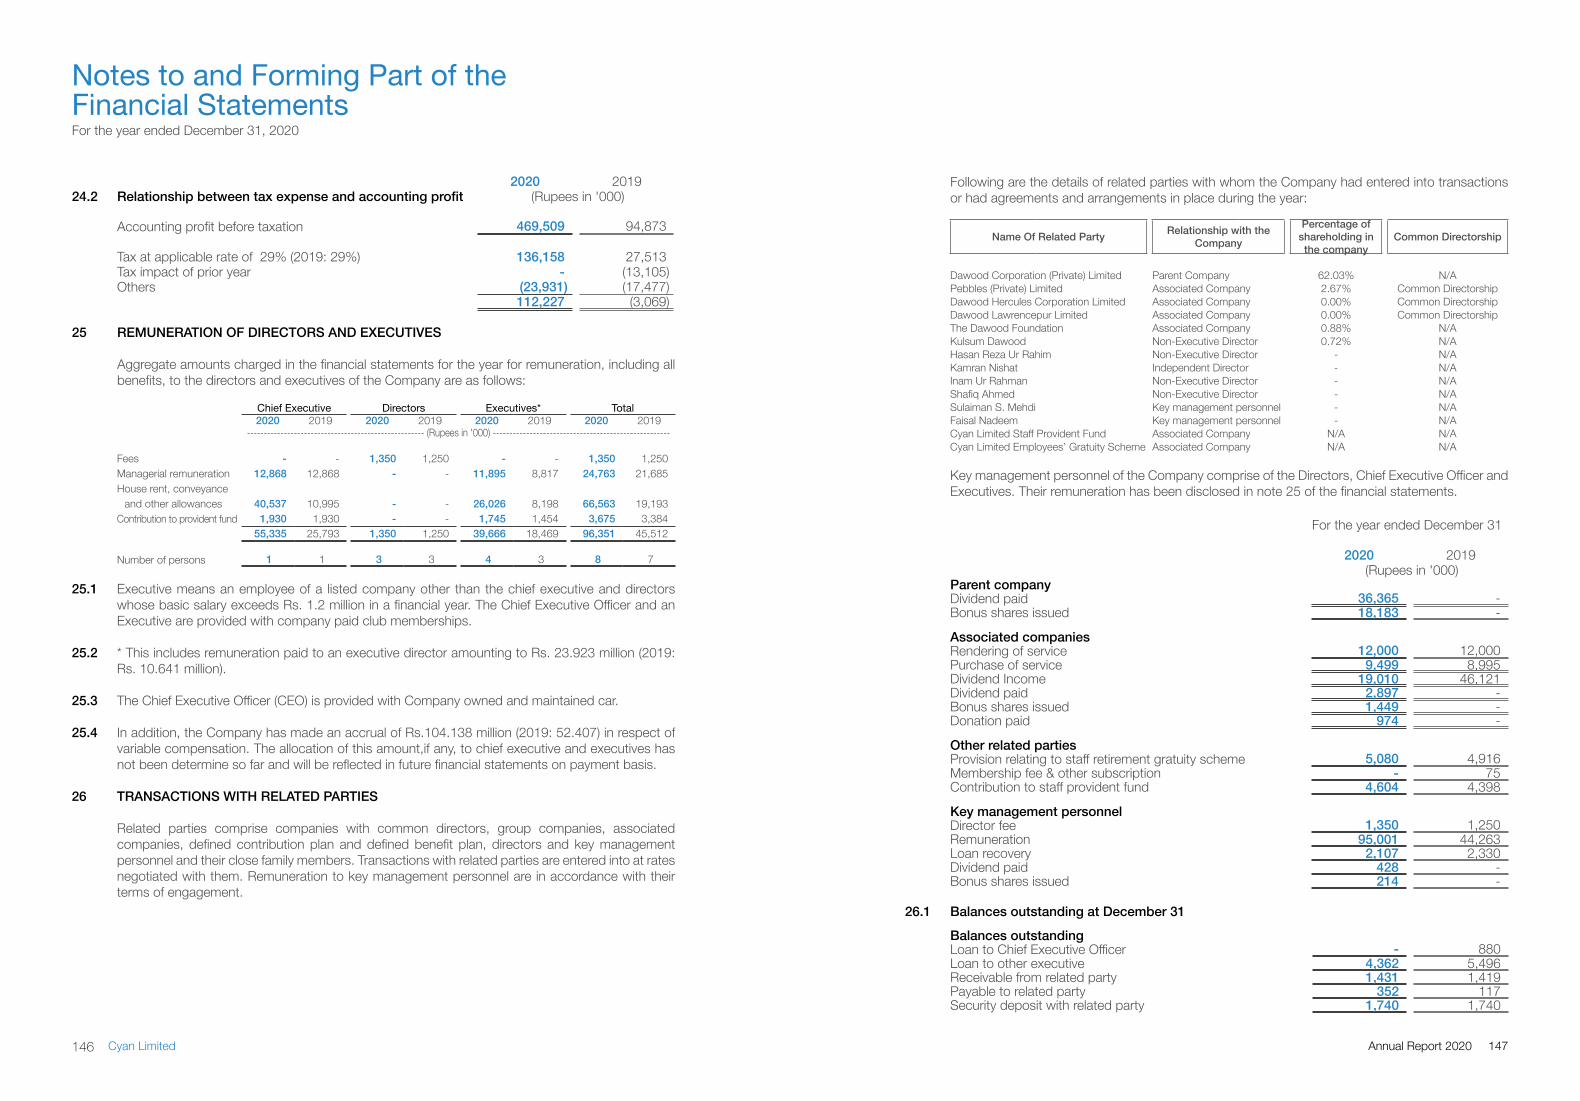
2020 201924.2 Relationship between tax expense and accounting profit (Rupees in '000)
Accounting profit before taxation 469,509 94,873
Tax at applicable rate of 29% (2019: 29%) 136,158 27,513 Tax impact of prior year - (13,105)Others (23,931) (17,477)
112,227 (3,069)
25 REMUNERATION OF DIRECTORS AND EXECUTIVES
Aggregate amounts charged in the financial statements for the year for remuneration, including all benefits, to the directors and executives of the Company are as follows:
Chief Executive Directors Executives* Total2020 2019 2020 2019 2020 2019 2020 2019
----------------------------------------------------- (Rupees in '000) -----------------------------------------------------
Fees - - 1,350 1,250 - - 1,350 1,250 Managerial remuneration 12,868 12,868 - - 11,895 8,817 24,763 21,685 House rent, conveyance
and other allowances 40,537 10,995 - - 26,026 8,198 66,563 19,193 Contribution to provident fund 1,930 1,930 - - 1,745 1,454 3,675 3,384
55,335 25,793 1,350 1,250 39,666 18,469 96,351 45,512
Number of persons 1 1 3 3 4 3 8 7
25.1 Executive means an employee of a listed company other than the chief executive and directors whose basic salary exceeds Rs. 1.2 million in a financial year. The Chief Executive Officer and an Executive are provided with company paid club memberships.
25.2 * This includes remuneration paid to an executive director amounting to Rs. 23.923 million (2019: Rs. 10.641 million).
25.3 The Chief Executive Officer (CEO) is provided with Company owned and maintained car.
25.4 In addition, the Company has made an accrual of Rs.104.138 million (2019: 52.407) in respect of variable compensation. The allocation of this amount,if any, to chief executive and executives has not been determine so far and will be reflected in future financial statements on payment basis.
26 TRANSACTIONS WITH RELATED PARTIES
Related parties comprise companies with common directors, group companies, associated companies, defined contribution plan and defined benefit plan, directors and key management personnel and their close family members. Transactions with related parties are entered into at rates negotiated with them. Remuneration to key management personnel are in accordance with their terms of engagement.
Name Of Related Party Relationship with the Company
Percentage of shareholding in the company
Common Directorship
Dawood Corporation (Private) Limited Parent Company 62.03% N/APebbles (Private) Limited Associated Company 2.67% Common DirectorshipDawood Hercules Corporation Limited Associated Company 0.00% Common DirectorshipDawood Lawrencepur Limited Associated Company 0.00% Common DirectorshipThe Dawood Foundation Associated Company 0.88% N/AKulsum Dawood Non-Executive Director 0.72% N/AHasan Reza Ur Rahim Non-Executive Director - N/AKamran Nishat Independent Director - N/AInam Ur Rahman Non-Executive Director - N/AShafiq Ahmed Non-Executive Director - N/ASulaiman S. Mehdi Key management personnel - N/AFaisal Nadeem Key management personnel - N/ACyan Limited Staff Provident Fund Associated Company N/A N/ACyan Limited Employees’ Gratuity Scheme Associated Company N/A N/A
Key management personnel of the Company comprise of the Directors, Chief Executive Officer and Executives. Their remuneration has been disclosed in note 25 of the financial statements.
For the year ended December 31
2020 2019 (Rupees in '000)
Parent companyDividend paid 36,365 - Bonus shares issued 18,183 -
Associated companiesRendering of service 12,000 12,000 Purchase of service 9,499 8,995 Dividend Income 19,010 46,121 Dividend paid 2,897 - Bonus shares issued 1,449 - Donation paid 974 -
Other related partiesProvision relating to staff retirement gratuity scheme 5,080 4,916 Membership fee & other subscription - 75 Contribution to staff provident fund 4,604 4,398
Key management personnelDirector fee 1,350 1,250 Remuneration 95,001 44,263 Loan recovery 2,107 2,330 Dividend paid 428 - Bonus shares issued 214 -
26.1 Balances outstanding at December 31
Balances outstandingLoan to Chief Executive Officer - 880 Loan to other executive 4,362 5,496 Receivable from related party 1,431 1,419 Payable to related party 352 117 Security deposit with related party 1,740 1,740
Following are the details of related parties with whom the Company had entered into transactions or had agreements and arrangements in place during the year:
For the year ended December 31, 2020
Notes to and Forming Part of the Financial Statements
147Annual Report 2020146 Cyan Limited
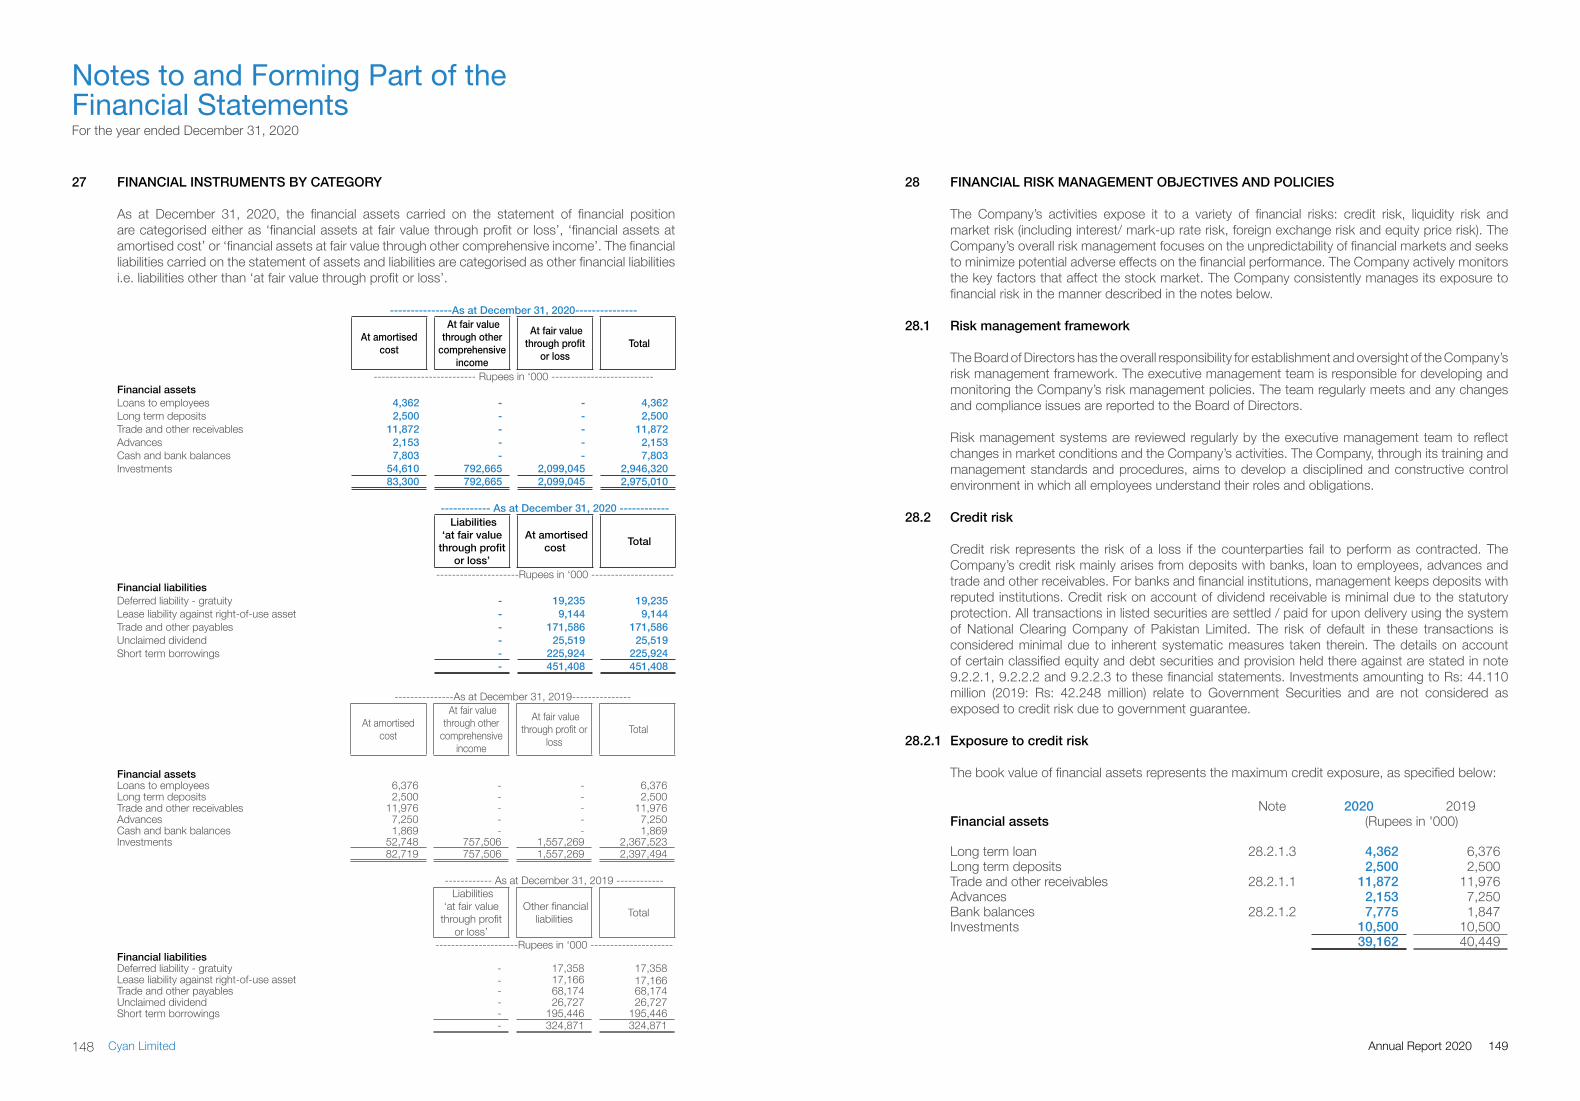
27 FINANCIAL INSTRUMENTS BY CATEGORY
As at December 31, 2020, the financial assets carried on the statement of financial position are categorised either as ‘financial assets at fair value through profit or loss’, ‘financial assets at amortised cost’ or ‘financial assets at fair value through other comprehensive income’. The financial liabilities carried on the statement of assets and liabilities are categorised as other financial liabilities i.e. liabilities other than ‘at fair value through profit or loss’.
---------------As at December 31, 2020---------------
At amortised cost
At fair value through other
comprehensive income
At fair value through profit
or loss Total
-------------------------- Rupees in ‘000 --------------------------Financial assetsLoans to employees 4,362 - - 4,362 Long term deposits 2,500 - - 2,500 Trade and other receivables 11,872 - - 11,872 Advances 2,153 - - 2,153 Cash and bank balances 7,803 - - 7,803 Investments 54,610 792,665 2,099,045 2,946,320
83,300 792,665 2,099,045 2,975,010
------------ As at December 31, 2020 ------------ Liabilities
‘at fair value through profit
or loss’
At amortised cost Total
---------------------Rupees in ‘000 ---------------------Financial liabilities Deferred liability - gratuity - 19,235 19,235 Lease liability against right-of-use asset - 9,144 9,144 Trade and other payables - 171,586 171,586 Unclaimed dividend - 25,519 25,519 Short term borrowings - 225,924 225,924
- 451,408 451,408
---------------As at December 31, 2019---------------
At amortised cost
At fair value through other
comprehensive income
At fair value through profit or
loss Total
Financial assetsLoans to employees 6,376 - - 6,376 Long term deposits 2,500 - - 2,500 Trade and other receivables 11,976 - - 11,976 Advances 7,250 - - 7,250 Cash and bank balances 1,869 - - 1,869 Investments 52,748 757,506 1,557,269 2,367,523
82,719 757,506 1,557,269 2,397,494
------------ As at December 31, 2019 ------------ Liabilities
‘at fair value through profit
or loss’
Other financial liabilities Total
---------------------Rupees in ‘000 ---------------------Financial liabilities Deferred liability - gratuity - 17,358 17,358 Lease liability against right-of-use asset - 17,166 17,166 Trade and other payables - 68,174 68,174 Unclaimed dividend - 26,727 26,727 Short term borrowings - 195,446 195,446
- 324,871 324,871
28 FINANCIAL RISK MANAGEMENT OBJECTIVES AND POLICIES
The Company’s activities expose it to a variety of financial risks: credit risk, liquidity risk and market risk (including interest/ mark-up rate risk, foreign exchange risk and equity price risk). The Company’s overall risk management focuses on the unpredictability of financial markets and seeks to minimize potential adverse effects on the financial performance. The Company actively monitors the key factors that affect the stock market. The Company consistently manages its exposure to financial risk in the manner described in the notes below.
28.1 Risk management framework
The Board of Directors has the overall responsibility for establishment and oversight of the Company’s risk management framework. The executive management team is responsible for developing and monitoring the Company’s risk management policies. The team regularly meets and any changes and compliance issues are reported to the Board of Directors.
Risk management systems are reviewed regularly by the executive management team to reflect changes in market conditions and the Company’s activities. The Company, through its training and management standards and procedures, aims to develop a disciplined and constructive control environment in which all employees understand their roles and obligations.
28.2 Credit risk
Credit risk represents the risk of a loss if the counterparties fail to perform as contracted. The Company’s credit risk mainly arises from deposits with banks, loan to employees, advances and trade and other receivables. For banks and financial institutions, management keeps deposits with reputed institutions. Credit risk on account of dividend receivable is minimal due to the statutory protection. All transactions in listed securities are settled / paid for upon delivery using the system of National Clearing Company of Pakistan Limited. The risk of default in these transactions is considered minimal due to inherent systematic measures taken therein. The details on account of certain classified equity and debt securities and provision held there against are stated in note 9.2.2.1, 9.2.2.2 and 9.2.2.3 to these financial statements. Investments amounting to Rs: 44.110 million (2019: Rs: 42.248 million) relate to Government Securities and are not considered as exposed to credit risk due to government guarantee.
28.2.1 Exposure to credit risk
The book value of financial assets represents the maximum credit exposure, as specified below:
Note 2020 2019Financial assets (Rupees in '000)
Long term loan 28.2.1.3 4,362 6,376 Long term deposits 2,500 2,500 Trade and other receivables 28.2.1.1 11,872 11,976 Advances 2,153 7,250 Bank balances 28.2.1.2 7,775 1,847 Investments 10,500 10,500
39,162 40,449
For the year ended December 31, 2020
Notes to and Forming Part of the Financial Statements
149Annual Report 2020148 Cyan Limited
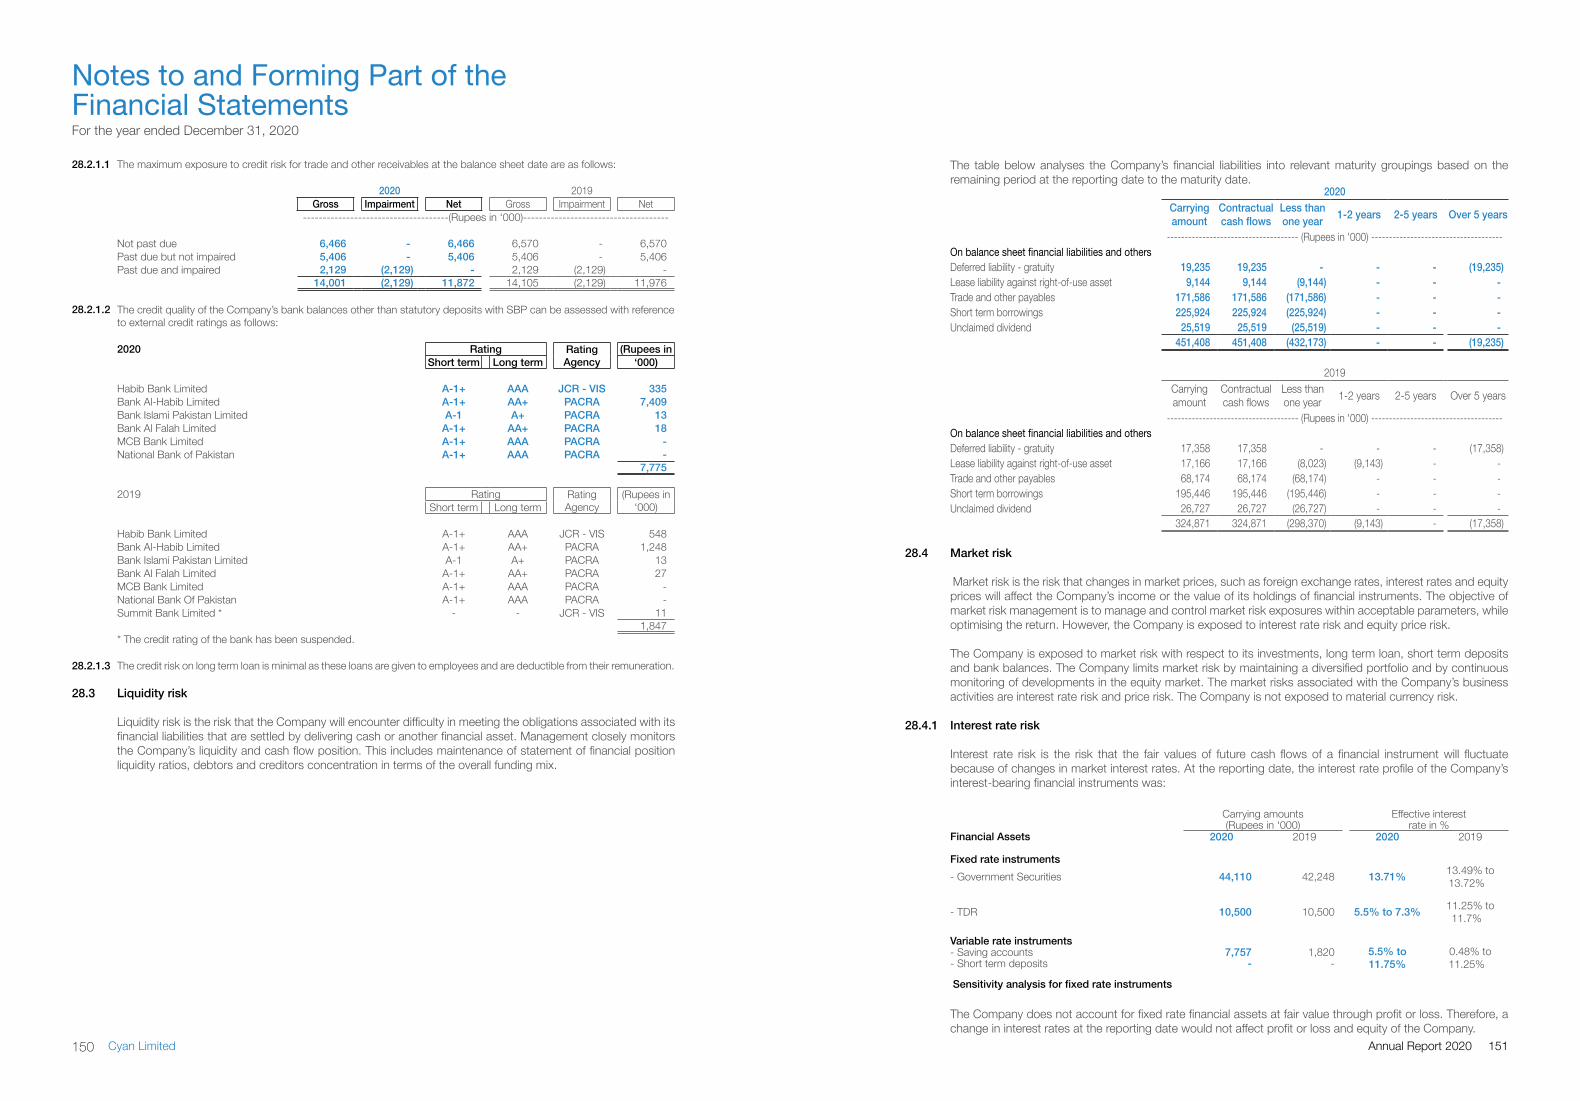
28.2.1.1 The maximum exposure to credit risk for trade and other receivables at the balance sheet date are as follows:
2020 2019Gross Impairment Net Gross Impairment Net
-------------------------------------(Rupees in ‘000)-------------------------------------
Not past due 6,466 - 6,466 6,570 - 6,570 Past due but not impaired 5,406 - 5,406 5,406 - 5,406 Past due and impaired 2,129 (2,129) - 2,129 (2,129) -
14,001 (2,129) 11,872 14,105 (2,129) 11,976
28.2.1.2 The credit quality of the Company’s bank balances other than statutory deposits with SBP can be assessed with reference to external credit ratings as follows:
2020 Rating Rating Agency
(Rupees inShort term Long term ‘000)
Habib Bank Limited A-1+ AAA JCR - VIS 335 Bank Al-Habib Limited A-1+ AA+ PACRA 7,409 Bank Islami Pakistan Limited A-1 A+ PACRA 13 Bank Al Falah Limited A-1+ AA+ PACRA 18 MCB Bank Limited A-1+ AAA PACRA - National Bank of Pakistan A-1+ AAA PACRA -
7,775
2019 Rating Rating Agency
(Rupees in‘000)Short term Long term
Habib Bank Limited A-1+ AAA JCR - VIS 548 Bank Al-Habib Limited A-1+ AA+ PACRA 1,248 Bank Islami Pakistan Limited A-1 A+ PACRA 13 Bank Al Falah Limited A-1+ AA+ PACRA 27 MCB Bank Limited A-1+ AAA PACRA - National Bank Of Pakistan A-1+ AAA PACRA - Summit Bank Limited * - - JCR - VIS 11
1,847 * The credit rating of the bank has been suspended.
28.2.1.3 The credit risk on long term loan is minimal as these loans are given to employees and are deductible from their remuneration.
28.3 Liquidity risk
Liquidity risk is the risk that the Company will encounter difficulty in meeting the obligations associated with its financial liabilities that are settled by delivering cash or another financial asset. Management closely monitors the Company’s liquidity and cash flow position. This includes maintenance of statement of financial position liquidity ratios, debtors and creditors concentration in terms of the overall funding mix.
2020Carryingamount
Contractualcash flows
Less than one year 1-2 years 2-5 years Over 5 years
------------------------------------- (Rupees in '000) -------------------------------------On balance sheet financial liabilities and othersDeferred liability - gratuity 19,235 19,235 - - - (19,235)Lease liability against right-of-use asset 9,144 9,144 (9,144) - - - Trade and other payables 171,586 171,586 (171,586) - - - Short term borrowings 225,924 225,924 (225,924) - - - Unclaimed dividend 25,519 25,519 (25,519) - - -
451,408 451,408 (432,173) - - (19,235)
2019Carryingamount
Contractualcash flows
Less than one year 1-2 years 2-5 years Over 5 years
------------------------------------- (Rupees in '000) -------------------------------------On balance sheet financial liabilities and othersDeferred liability - gratuity 17,358 17,358 - - - (17,358)Lease liability against right-of-use asset 17,166 17,166 (8,023) (9,143) - - Trade and other payables 68,174 68,174 (68,174) - - - Short term borrowings 195,446 195,446 (195,446) - - - Unclaimed dividend 26,727 26,727 (26,727) - - -
324,871 324,871 (298,370) (9,143) - (17,358)
28.4 Market risk
Market risk is the risk that changes in market prices, such as foreign exchange rates, interest rates and equity prices will affect the Company’s income or the value of its holdings of financial instruments. The objective of market risk management is to manage and control market risk exposures within acceptable parameters, while optimising the return. However, the Company is exposed to interest rate risk and equity price risk.
The Company is exposed to market risk with respect to its investments, long term loan, short term deposits and bank balances. The Company limits market risk by maintaining a diversified portfolio and by continuous monitoring of developments in the equity market. The market risks associated with the Company’s business activities are interest rate risk and price risk. The Company is not exposed to material currency risk.
28.4.1 Interest rate risk
Interest rate risk is the risk that the fair values of future cash flows of a financial instrument will fluctuate because of changes in market interest rates. At the reporting date, the interest rate profile of the Company’s interest-bearing financial instruments was:
Carrying amounts Effective interest (Rupees in ‘000) rate in %
Financial Assets 2020 2019 2020 2019
Fixed rate instruments- Government Securities 44,110 42,248 13.71% 13.49% to
13.72%
- TDR 10,500 10,500 5.5% to 7.3% 11.25% to 11.7%
Variable rate instruments- Saving accounts 7,757 1,820 5.5% to
11.75%0.48% to 11.25%- Short term deposits - -
Sensitivity analysis for fixed rate instruments
The Company does not account for fixed rate financial assets at fair value through profit or loss. Therefore, a change in interest rates at the reporting date would not affect profit or loss and equity of the Company.
For the year ended December 31, 2020
Notes to and Forming Part of the Financial Statements
The table below analyses the Company’s financial liabilities into relevant maturity groupings based on the remaining period at the reporting date to the maturity date.
151Annual Report 2020150 Cyan Limited
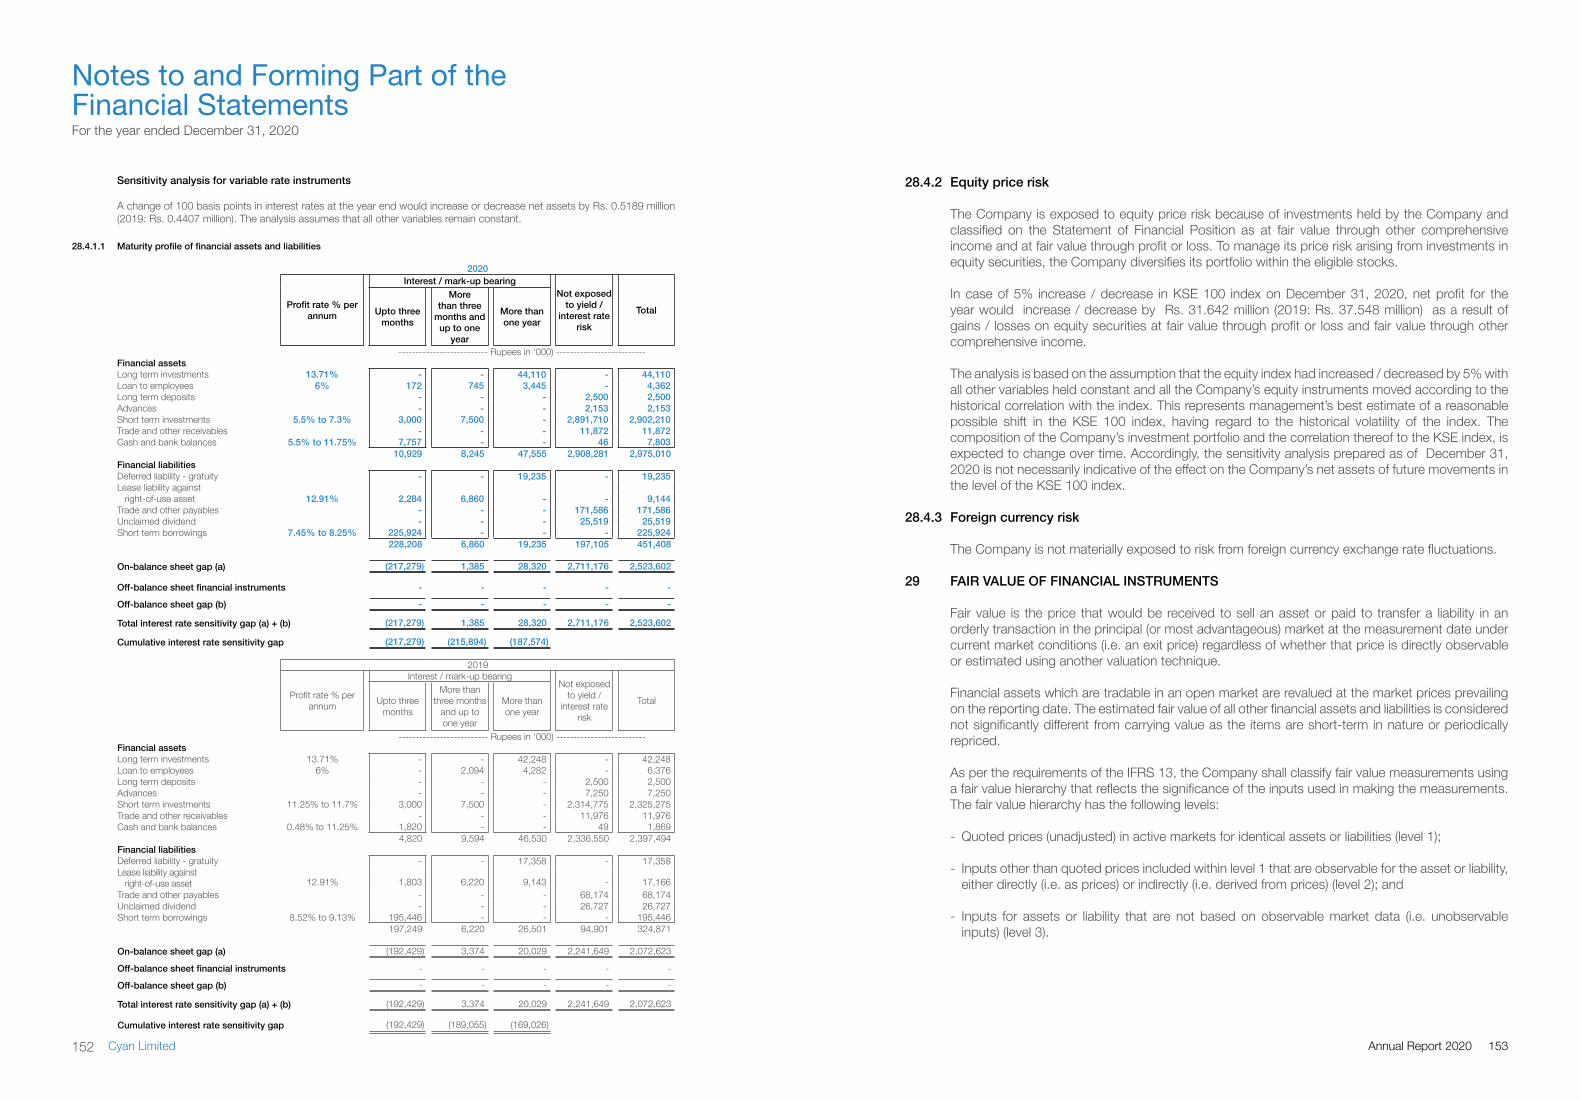
Sensitivity analysis for variable rate instruments
A change of 100 basis points in interest rates at the year end would increase or decrease net assets by Rs. 0.5189 million (2019: Rs. 0.4407 million). The analysis assumes that all other variables remain constant.
28.4.1.1 Maturity profile of financial assets and liabilities
2020
Profit rate % per annum
Interest / mark-up bearingNot exposed
to yield / interest rate
risk
TotalUpto three months
More than three
months and up to one
year
More than one year
-------------------------- Rupees in ‘000) --------------------------Financial assetsLong term investments 13.71% - - 44,110 - 44,110 Loan to employees 6% 172 745 3,445 - 4,362 Long term deposits - - - 2,500 2,500 Advances - - - 2,153 2,153 Short term investments 5.5% to 7.3% 3,000 7,500 - 2,891,710 2,902,210 Trade and other receivables - - - 11,872 11,872 Cash and bank balances 5.5% to 11.75% 7,757 - - 46 7,803
10,929 8,245 47,555 2,908,281 2,975,010 Financial liabilitiesDeferred liability - gratuity - - 19,235 - 19,235 Lease liability against
right-of-use asset 12.91% 2,284 6,860 - - 9,144 Trade and other payables - - - 171,586 171,586 Unclaimed dividend - - - 25,519 25,519 Short term borrowings 7.45% to 8.25% 225,924 - - - 225,924
228,208 6,860 19,235 197,105 451,408
On-balance sheet gap (a) (217,279) 1,385 28,320 2,711,176 2,523,602
Off-balance sheet financial instruments - - - - -
Off-balance sheet gap (b) - - - - -
Total interest rate sensitivity gap (a) + (b) (217,279) 1,385 28,320 2,711,176 2,523,602
Cumulative interest rate sensitivity gap (217,279) (215,894) (187,574)
2019
Profit rate % per annum
Interest / mark-up bearingNot exposed
to yield / interest rate
risk
TotalUpto three months
More than three months
and up to one year
More than one year
-------------------------- Rupees in ‘000) --------------------------Financial assetsLong term investments 13.71% - - 42,248 - 42,248 Loan to employees 6% - 2,094 4,282 - 6,376 Long term deposits - - - 2,500 2,500 Advances - - - 7,250 7,250 Short term investments 11.25% to 11.7% 3,000 7,500 - 2,314,775 2,325,275 Trade and other receivables - - - 11,976 11,976 Cash and bank balances 0.48% to 11.25% 1,820 - - 49 1,869
4,820 9,594 46,530 2,336,550 2,397,494 Financial liabilitiesDeferred liability - gratuity - - 17,358 - 17,358 Lease liability against
right-of-use asset 12.91% 1,803 6,220 9,143 - 17,166 Trade and other payables - - - 68,174 68,174 Unclaimed dividend - - - 26,727 26,727 Short term borrowings 8.52% to 9.13% 195,446 - - - 195,446
197,249 6,220 26,501 94,901 324,871
On-balance sheet gap (a) (192,429) 3,374 20,029 2,241,649 2,072,623
Off-balance sheet financial instruments - - - - -
Off-balance sheet gap (b) - - - - -
Total interest rate sensitivity gap (a) + (b) (192,429) 3,374 20,029 2,241,649 2,072,623
Cumulative interest rate sensitivity gap (192,429) (189,055) (169,026)
28.4.2 Equity price risk
The Company is exposed to equity price risk because of investments held by the Company and classified on the Statement of Financial Position as at fair value through other comprehensive income and at fair value through profit or loss. To manage its price risk arising from investments in equity securities, the Company diversifies its portfolio within the eligible stocks.
In case of 5% increase / decrease in KSE 100 index on December 31, 2020, net profit for the year would increase / decrease by Rs. 31.642 million (2019: Rs. 37.548 million) as a result of gains / losses on equity securities at fair value through profit or loss and fair value through other comprehensive income.
The analysis is based on the assumption that the equity index had increased / decreased by 5% with all other variables held constant and all the Company’s equity instruments moved according to the historical correlation with the index. This represents management’s best estimate of a reasonable possible shift in the KSE 100 index, having regard to the historical volatility of the index. The composition of the Company’s investment portfolio and the correlation thereof to the KSE index, is expected to change over time. Accordingly, the sensitivity analysis prepared as of December 31, 2020 is not necessarily indicative of the effect on the Company’s net assets of future movements in the level of the KSE 100 index.
28.4.3 Foreign currency risk
The Company is not materially exposed to risk from foreign currency exchange rate fluctuations.
29 FAIR VALUE OF FINANCIAL INSTRUMENTS
Fair value is the price that would be received to sell an asset or paid to transfer a liability in an orderly transaction in the principal (or most advantageous) market at the measurement date under current market conditions (i.e. an exit price) regardless of whether that price is directly observable or estimated using another valuation technique.
Financial assets which are tradable in an open market are revalued at the market prices prevailing on the reporting date. The estimated fair value of all other financial assets and liabilities is considered not significantly different from carrying value as the items are short-term in nature or periodically repriced.
As per the requirements of the IFRS 13, the Company shall classify fair value measurements using a fair value hierarchy that reflects the significance of the inputs used in making the measurements. The fair value hierarchy has the following levels:
- Quoted prices (unadjusted) in active markets for identical assets or liabilities (level 1);
- Inputs other than quoted prices included within level 1 that are observable for the asset or liability, either directly (i.e. as prices) or indirectly (i.e. derived from prices) (level 2); and
- Inputs for assets or liability that are not based on observable market data (i.e. unobservable inputs) (level 3).
For the year ended December 31, 2020
Notes to and Forming Part of the Financial Statements
153Annual Report 2020152 Cyan Limited
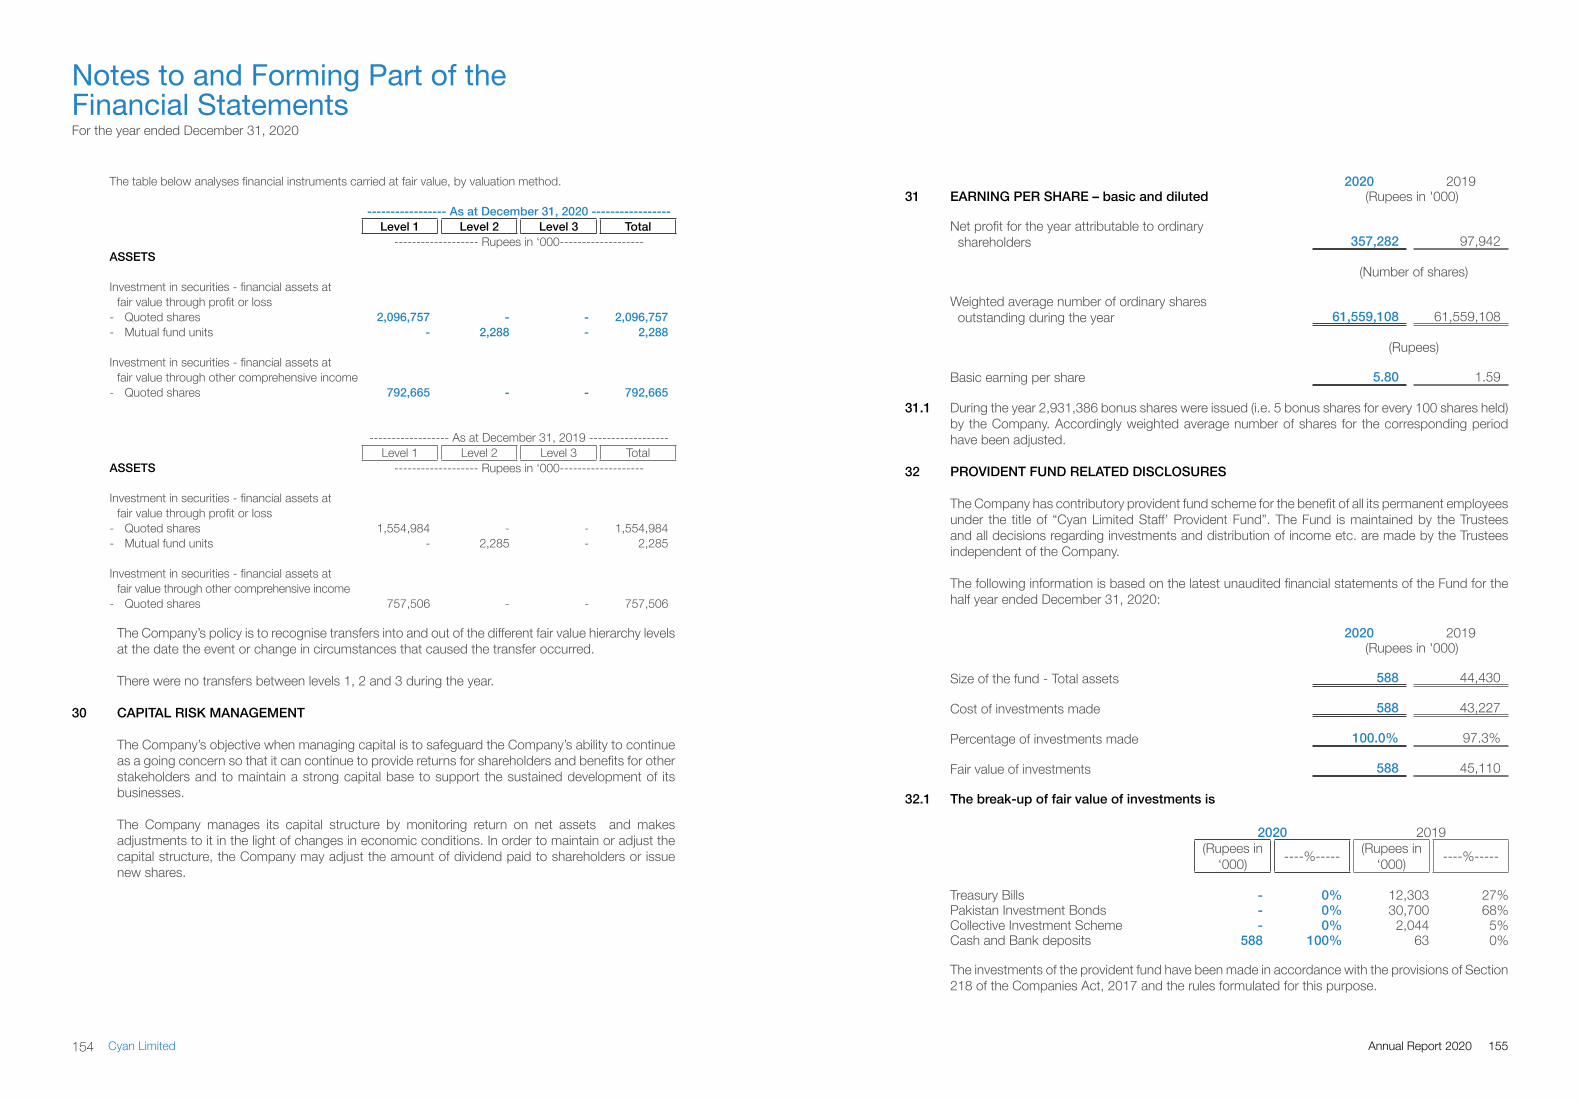
The table below analyses financial instruments carried at fair value, by valuation method.
----------------- As at December 31, 2020 ----------------- Level 1 Level 2 Level 3 Total
------------------- Rupees in ‘000-------------------ASSETS
Investment in securities - financial assets atfair value through profit or loss
- Quoted shares 2,096,757 - - 2,096,757 - Mutual fund units - 2,288 - 2,288
Investment in securities - financial assets atfair value through other comprehensive income
- Quoted shares 792,665 - - 792,665
------------------ As at December 31, 2019 ------------------Level 1 Level 2 Level 3 Total
ASSETS ------------------- Rupees in ‘000-------------------
Investment in securities - financial assets atfair value through profit or loss
- Quoted shares 1,554,984 - - 1,554,984 - Mutual fund units - 2,285 - 2,285
Investment in securities - financial assets atfair value through other comprehensive income
- Quoted shares 757,506 - - 757,506
The Company’s policy is to recognise transfers into and out of the different fair value hierarchy levels at the date the event or change in circumstances that caused the transfer occurred.
There were no transfers between levels 1, 2 and 3 during the year.
30 CAPITAL RISK MANAGEMENT
The Company’s objective when managing capital is to safeguard the Company’s ability to continue as a going concern so that it can continue to provide returns for shareholders and benefits for other stakeholders and to maintain a strong capital base to support the sustained development of its businesses.
The Company manages its capital structure by monitoring return on net assets and makes adjustments to it in the light of changes in economic conditions. In order to maintain or adjust the capital structure, the Company may adjust the amount of dividend paid to shareholders or issue new shares.
2020 201931 EARNING PER SHARE – basic and diluted (Rupees in '000)
Net profit for the year attributable to ordinary shareholders 357,282 97,942
(Number of shares)
Weighted average number of ordinary shares outstanding during the year 61,559,108 61,559,108
(Rupees)
Basic earning per share 5.80 1.59
31.1 During the year 2,931,386 bonus shares were issued (i.e. 5 bonus shares for every 100 shares held) by the Company. Accordingly weighted average number of shares for the corresponding period have been adjusted.
32 PROVIDENT FUND RELATED DISCLOSURES
The Company has contributory provident fund scheme for the benefit of all its permanent employees under the title of “Cyan Limited Staff’ Provident Fund”. The Fund is maintained by the Trustees and all decisions regarding investments and distribution of income etc. are made by the Trustees independent of the Company.
The following information is based on the latest unaudited financial statements of the Fund for the half year ended December 31, 2020:
2020 2019 (Rupees in '000)
Size of the fund - Total assets 588 44,430
Cost of investments made 588 43,227
Percentage of investments made 100.0% 97.3%
Fair value of investments 588 45,110
32.1 The break-up of fair value of investments is
2020 2019(Rupees in
‘000) ----%----- (Rupees in ‘000) ----%-----
Treasury Bills - 0% 12,303 27%Pakistan Investment Bonds - 0% 30,700 68%Collective Investment Scheme - 0% 2,044 5%Cash and Bank deposits 588 100% 63 0%
The investments of the provident fund have been made in accordance with the provisions of Section 218 of the Companies Act, 2017 and the rules formulated for this purpose.
For the year ended December 31, 2020
Notes to and Forming Part of the Financial Statements
155Annual Report 2020154 Cyan Limited
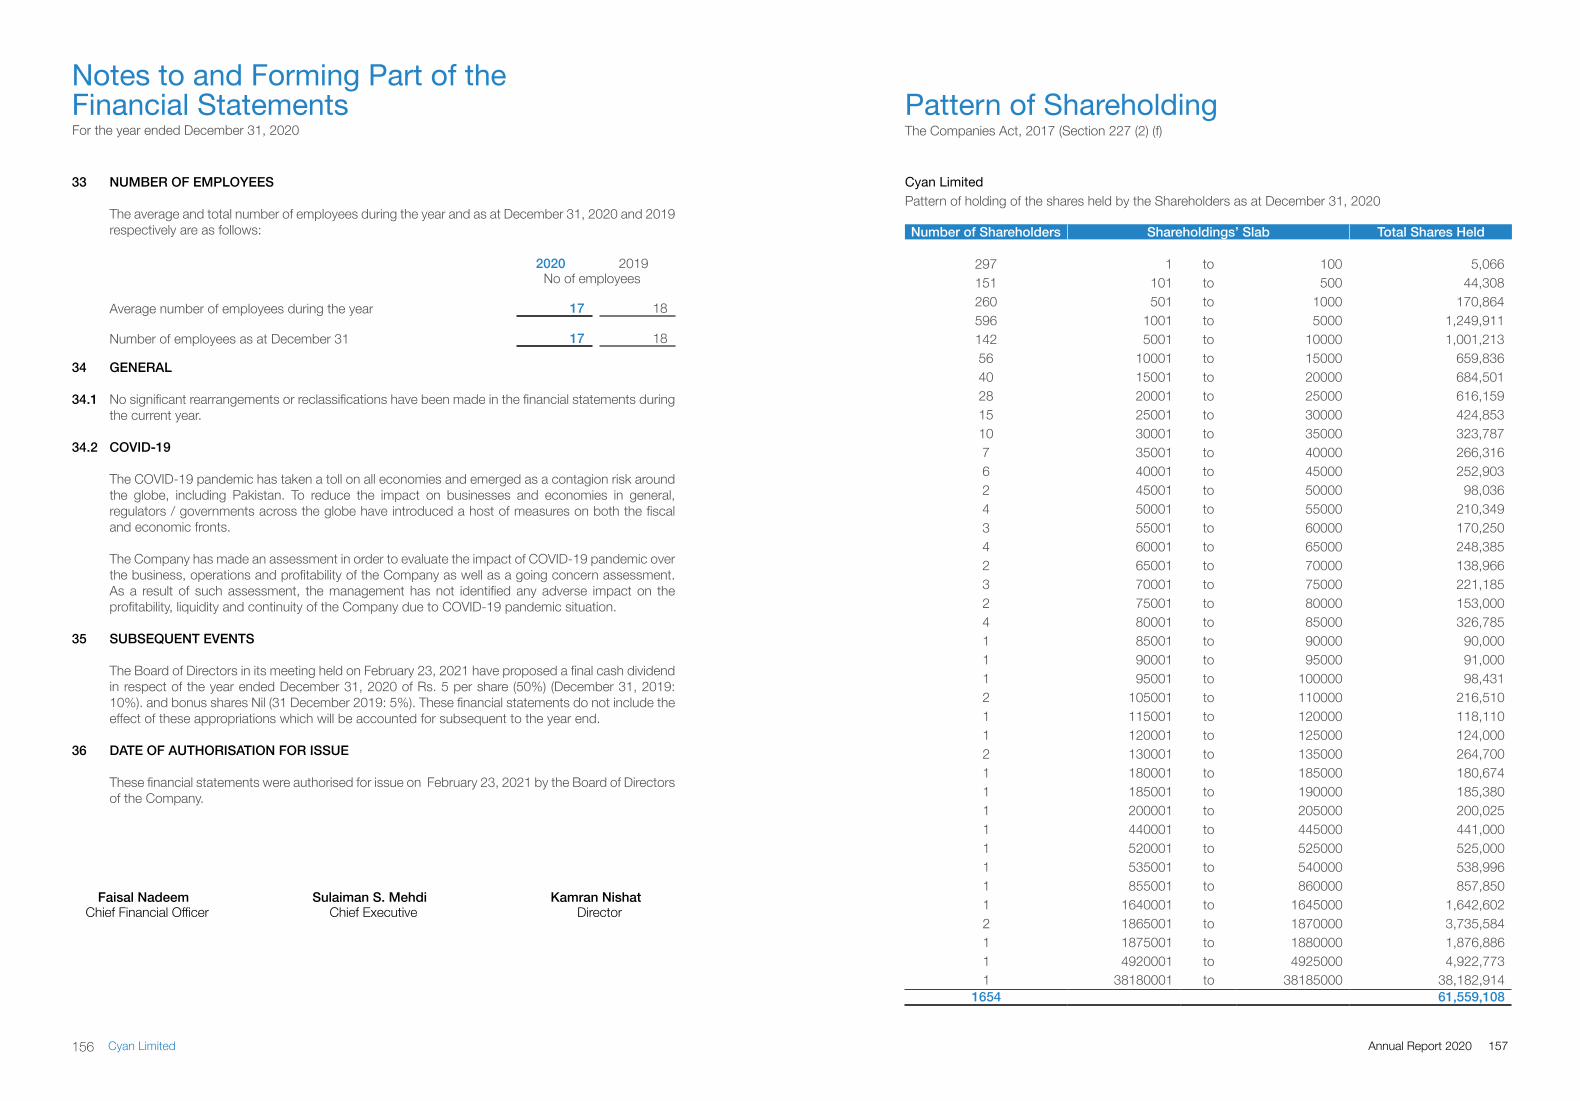
33 NUMBER OF EMPLOYEES
The average and total number of employees during the year and as at December 31, 2020 and 2019 respectively are as follows:
2020 2019No of employees
Average number of employees during the year 17 18
Number of employees as at December 31 17 18
34 GENERAL
34.1 No significant rearrangements or reclassifications have been made in the financial statements during the current year.
34.2 COVID-19
The COVID-19 pandemic has taken a toll on all economies and emerged as a contagion risk around the globe, including Pakistan. To reduce the impact on businesses and economies in general, regulators / governments across the globe have introduced a host of measures on both the fiscal and economic fronts.
The Company has made an assessment in order to evaluate the impact of COVID-19 pandemic over the business, operations and profitability of the Company as well as a going concern assessment. As a result of such assessment, the management has not identified any adverse impact on the profitability, liquidity and continuity of the Company due to COVID-19 pandemic situation.
35 SUBSEQUENT EVENTS
The Board of Directors in its meeting held on February 23, 2021 have proposed a final cash dividend in respect of the year ended December 31, 2020 of Rs. 5 per share (50%) (December 31, 2019: 10%). and bonus shares Nil (31 December 2019: 5%). These financial statements do not include the effect of these appropriations which will be accounted for subsequent to the year end.
36 DATE OF AUTHORISATION FOR ISSUE
These financial statements were authorised for issue on February 23, 2021 by the Board of Directors of the Company.
Faisal Nadeem Sulaiman S. Mehdi Kamran NishatChief Financial Officer Chief Executive Director
Cyan LimitedPattern of holding of the shares held by the Shareholders as at December 31, 2020
Pattern of ShareholdingThe Companies Act, 2017 (Section 227 (2) (f)
Number of Shareholders Shareholdings’ Slab Total Shares Held
297 1 to 100 5,066151 101 to 500 44,308260 501 to 1000 170,864596 1001 to 5000 1,249,911142 5001 to 10000 1,001,21356 10001 to 15000 659,83640 15001 to 20000 684,50128 20001 to 25000 616,15915 25001 to 30000 424,85310 30001 to 35000 323,7877 35001 to 40000 266,3166 40001 to 45000 252,9032 45001 to 50000 98,0364 50001 to 55000 210,3493 55001 to 60000 170,2504 60001 to 65000 248,3852 65001 to 70000 138,9663 70001 to 75000 221,1852 75001 to 80000 153,0004 80001 to 85000 326,7851 85001 to 90000 90,0001 90001 to 95000 91,0001 95001 to 100000 98,4312 105001 to 110000 216,5101 115001 to 120000 118,1101 120001 to 125000 124,0002 130001 to 135000 264,7001 180001 to 185000 180,6741 185001 to 190000 185,3801 200001 to 205000 200,0251 440001 to 445000 441,0001 520001 to 525000 525,0001 535001 to 540000 538,9961 855001 to 860000 857,8501 1640001 to 1645000 1,642,6022 1865001 to 1870000 3,735,5841 1875001 to 1880000 1,876,8861 4920001 to 4925000 4,922,7731 38180001 to 38185000 38,182,914
1654 61,559,108
For the year ended December 31, 2020
Notes to and Forming Part of the Financial Statements
157Annual Report 2020156 Cyan Limited
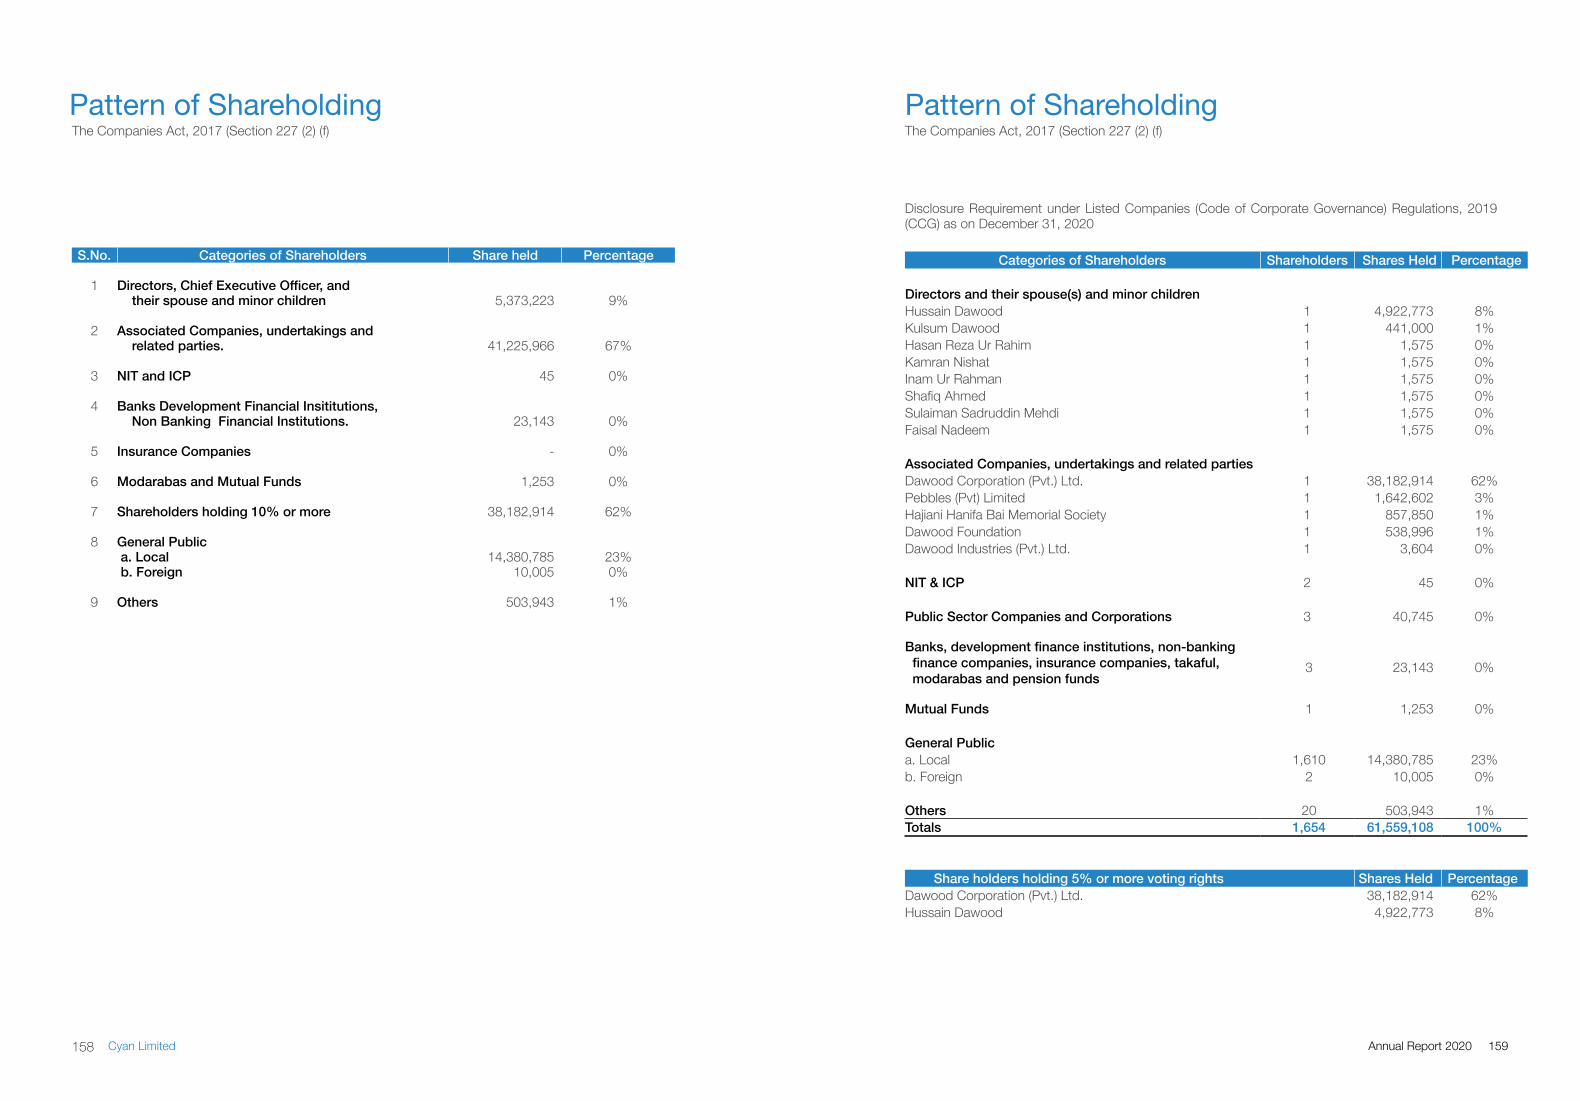
Pattern of ShareholdingThe Companies Act, 2017 (Section 227 (2) (f)
S.No. Categories of Shareholders Share held Percentage
1 Directors, Chief Executive Officer, and their spouse and minor children 5,373,223 9%
2 Associated Companies, undertakings and related parties. 41,225,966 67%
3 NIT and ICP 45 0%
4 Banks Development Financial Insititutions, Non Banking Financial Institutions. 23,143 0%
5 Insurance Companies - 0%
6 Modarabas and Mutual Funds 1,253 0%
7 Shareholders holding 10% or more 38,182,914 62%
8 General Public a. Local 14,380,785 23% b. Foreign 10,005 0%
9 Others 503,943 1%
Disclosure Requirement under Listed Companies (Code of Corporate Governance) Regulations, 2019 (CCG) as on December 31, 2020
Pattern of ShareholdingThe Companies Act, 2017 (Section 227 (2) (f)
Categories of Shareholders Shareholders Shares Held Percentage
Directors and their spouse(s) and minor childrenHussain Dawood 1 4,922,773 8%Kulsum Dawood 1 441,000 1%Hasan Reza Ur Rahim 1 1,575 0%Kamran Nishat 1 1,575 0%Inam Ur Rahman 1 1,575 0%Shafiq Ahmed 1 1,575 0%Sulaiman Sadruddin Mehdi 1 1,575 0%Faisal Nadeem 1 1,575 0%
Associated Companies, undertakings and related partiesDawood Corporation (Pvt.) Ltd. 1 38,182,914 62%Pebbles (Pvt) Limited 1 1,642,602 3%Hajiani Hanifa Bai Memorial Society 1 857,850 1%Dawood Foundation 1 538,996 1%Dawood Industries (Pvt.) Ltd. 1 3,604 0%
NIT & ICP 2 45 0%
Public Sector Companies and Corporations 3 40,745 0%
Banks, development finance institutions, non-banking finance companies, insurance companies, takaful, modarabas and pension funds
3 23,143 0%
Mutual Funds 1 1,253 0%
General Publica. Local 1,610 14,380,785 23%b. Foreign 2 10,005 0%
Others 20 503,943 1%Totals 1,654 61,559,108 100%
Share holders holding 5% or more voting rights Shares Held Percentage Dawood Corporation (Pvt.) Ltd. 38,182,914 62%Hussain Dawood 4,922,773 8%
159Annual Report 2020158 Cyan Limited
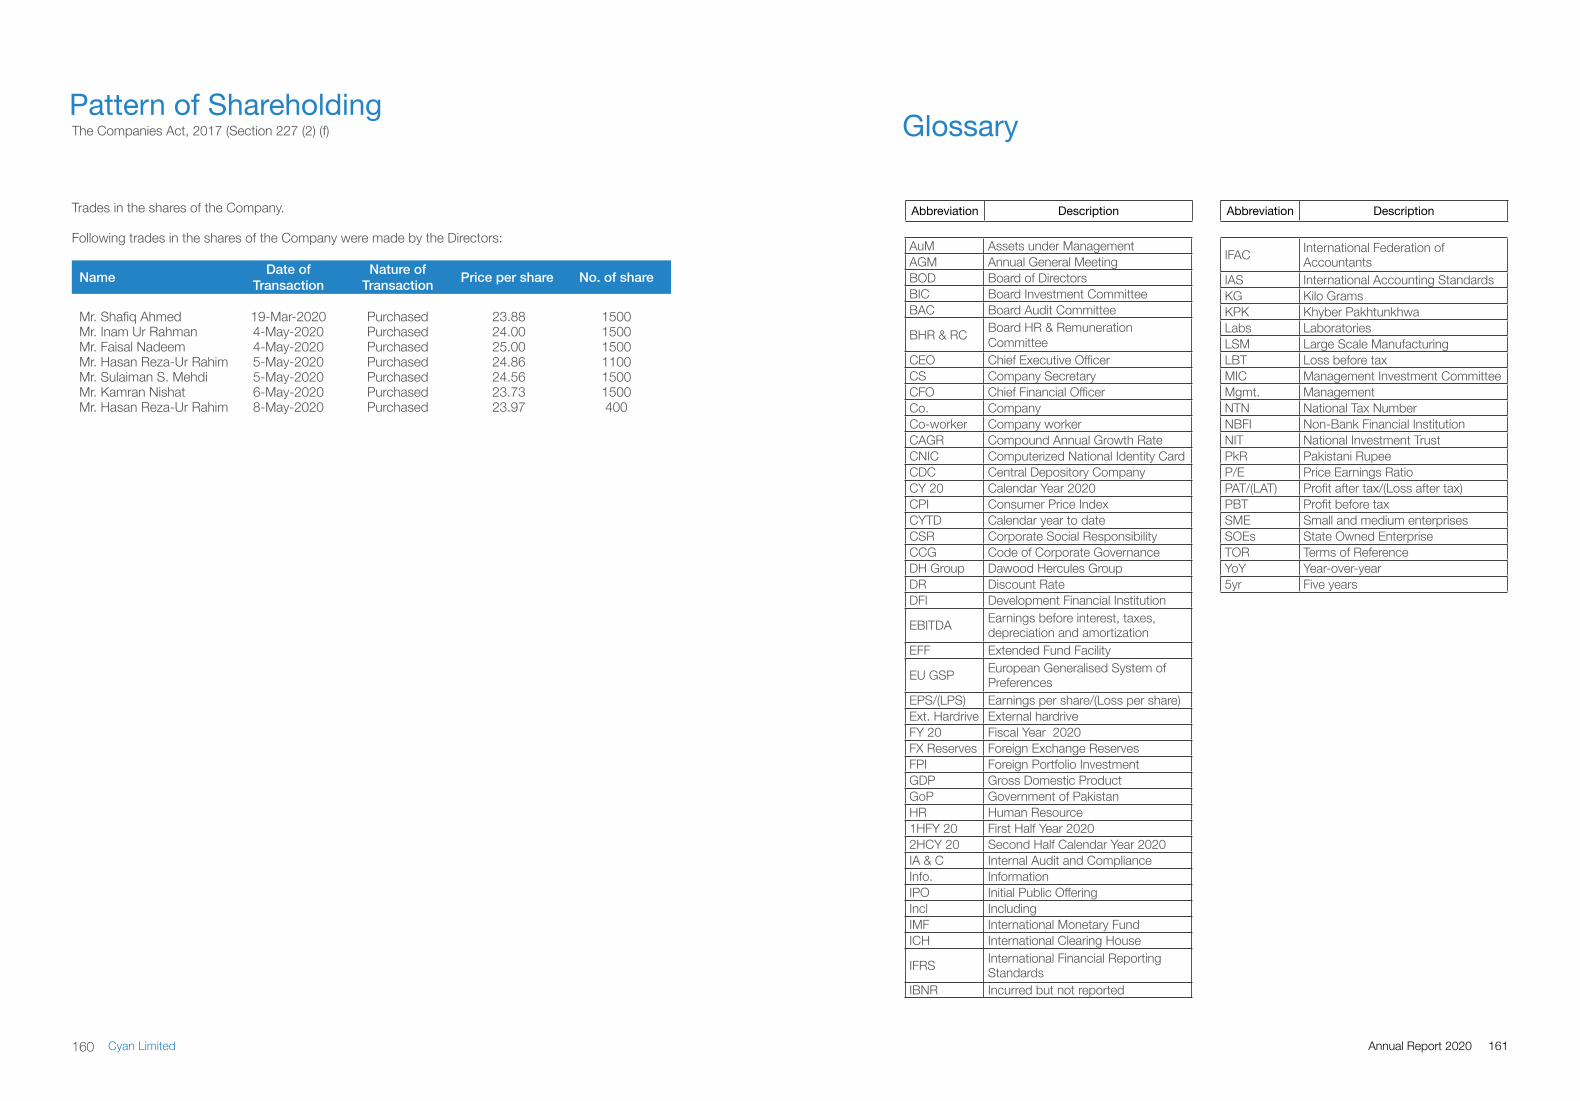
Glossary
AuM Assets under ManagementAGM Annual General MeetingBOD Board of DirectorsBIC Board Investment CommitteeBAC Board Audit Committee
BHR & RC Board HR & Remuneration Committee
CEO Chief Executive OfficerCS Company SecretaryCFO Chief Financial OfficerCo. CompanyCo-worker Company workerCAGR Compound Annual Growth RateCNIC Computerized National Identity CardCDC Central Depository CompanyCY 20 Calendar Year 2020CPI Consumer Price IndexCYTD Calendar year to dateCSR Corporate Social ResponsibilityCCG Code of Corporate GovernanceDH Group Dawood Hercules GroupDR Discount RateDFI Development Financial Institution
EBITDA Earnings before interest, taxes, depreciation and amortization
EFF Extended Fund Facility
EU GSP European Generalised System of Preferences
EPS/(LPS) Earnings per share/(Loss per share)Ext. Hardrive External hardriveFY 20 Fiscal Year 2020FX Reserves Foreign Exchange ReservesFPI Foreign Portfolio InvestmentGDP Gross Domestic ProductGoP Government of PakistanHR Human Resource1HFY 20 First Half Year 20202HCY 20 Second Half Calendar Year 2020IA & C Internal Audit and ComplianceInfo. InformationIPO Initial Public OfferingIncl IncludingIMF International Monetary FundICH International Clearing House
IFRS International Financial Reporting Standards
IBNR Incurred but not reported
IFAC International Federation of Accountants
IAS International Accounting StandardsKG Kilo GramsKPK Khyber PakhtunkhwaLabs LaboratoriesLSM Large Scale ManufacturingLBT Loss before taxMIC Management Investment CommitteeMgmt. ManagementNTN National Tax NumberNBFI Non-Bank Financial InstitutionNIT National Investment TrustPkR Pakistani RupeeP/E Price Earnings RatioPAT/(LAT) Profit after tax/(Loss after tax)PBT Profit before taxSME Small and medium enterprisesSOEs State Owned EnterpriseTOR Terms of ReferenceYoY Year-over-year5yr Five years
Abbreviation Description Abbreviation Description
Pattern of ShareholdingThe Companies Act, 2017 (Section 227 (2) (f)
Trades in the shares of the Company.
Following trades in the shares of the Company were made by the Directors:
Name Date of Transaction
Nature of Transaction Price per share No. of share
Mr. Shafiq Ahmed 19-Mar-2020 Purchased 23.88 1500Mr. Inam Ur Rahman 4-May-2020 Purchased 24.00 1500Mr. Faisal Nadeem 4-May-2020 Purchased 25.00 1500Mr. Hasan Reza-Ur Rahim 5-May-2020 Purchased 24.86 1100Mr. Sulaiman S. Mehdi 5-May-2020 Purchased 24.56 1500Mr. Kamran Nishat 6-May-2020 Purchased 23.73 1500Mr. Hasan Reza-Ur Rahim 8-May-2020 Purchased 23.97 400
161Annual Report 2020160 Cyan Limited

163Annual Report 2020162 Cyan Limited
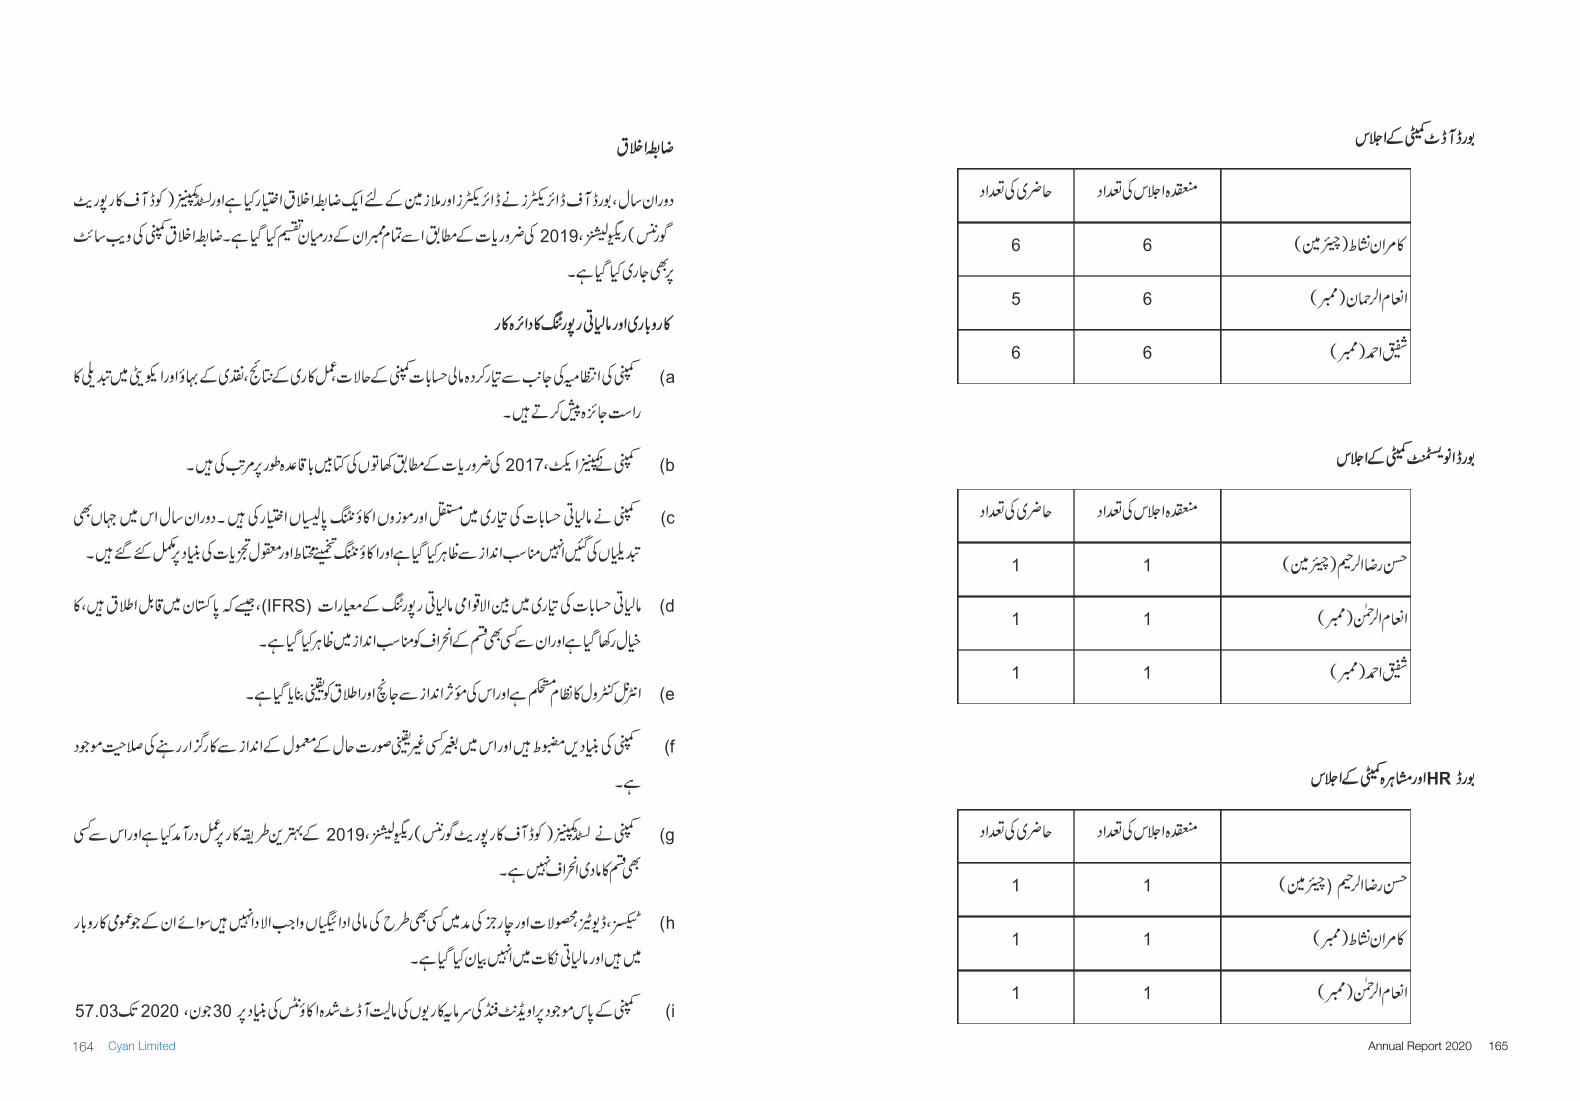
165Annual Report 2020164 Cyan Limited
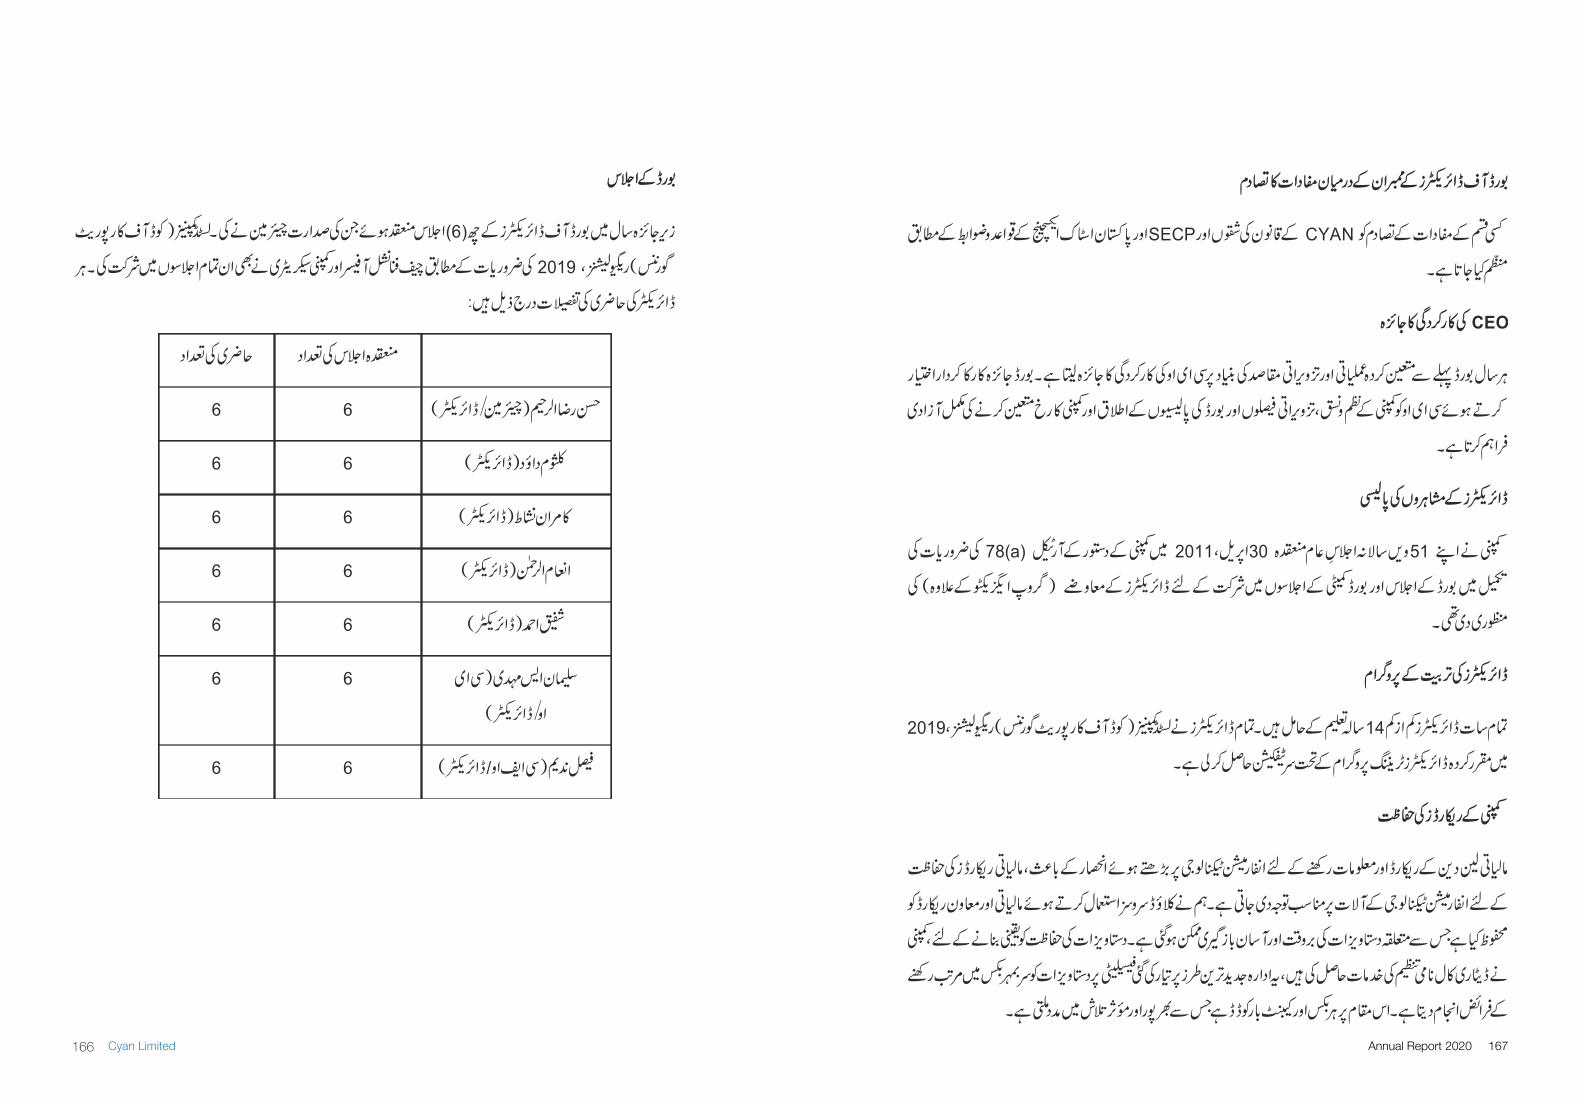
167Annual Report 2020166 Cyan Limited
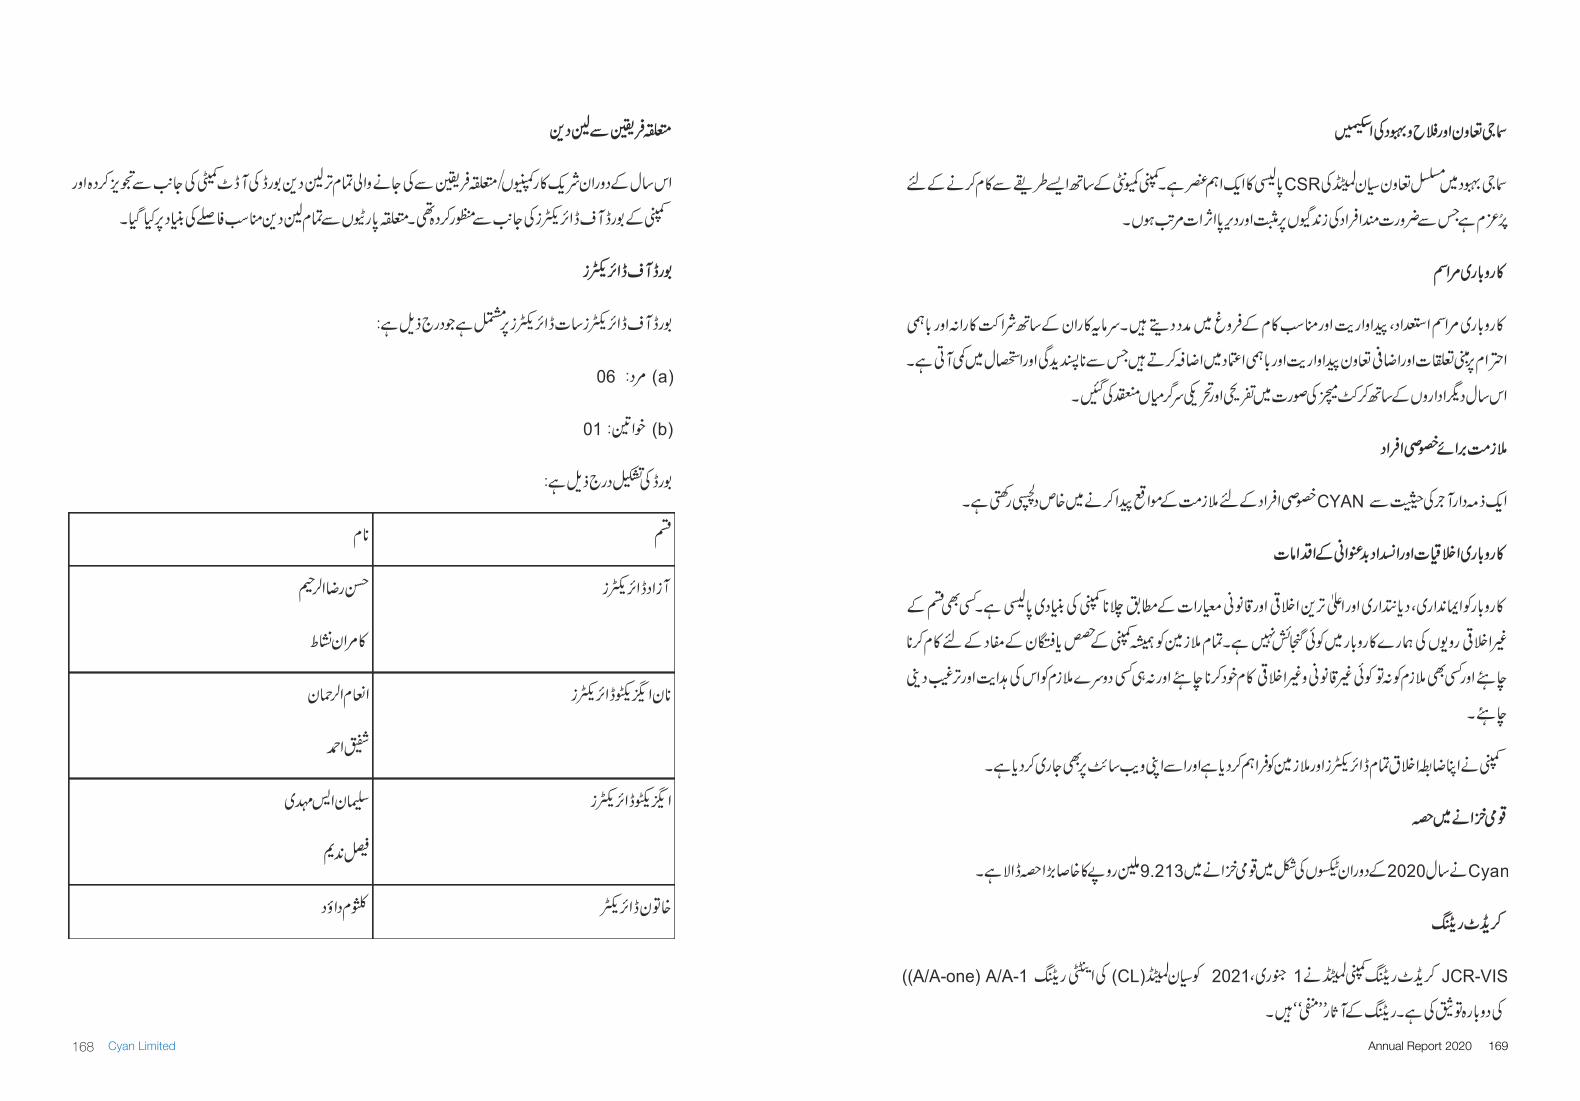
169Annual Report 2020168 Cyan Limited
171Annual Report 2020170 Cyan Limited

173Annual Report 2020172 Cyan Limited
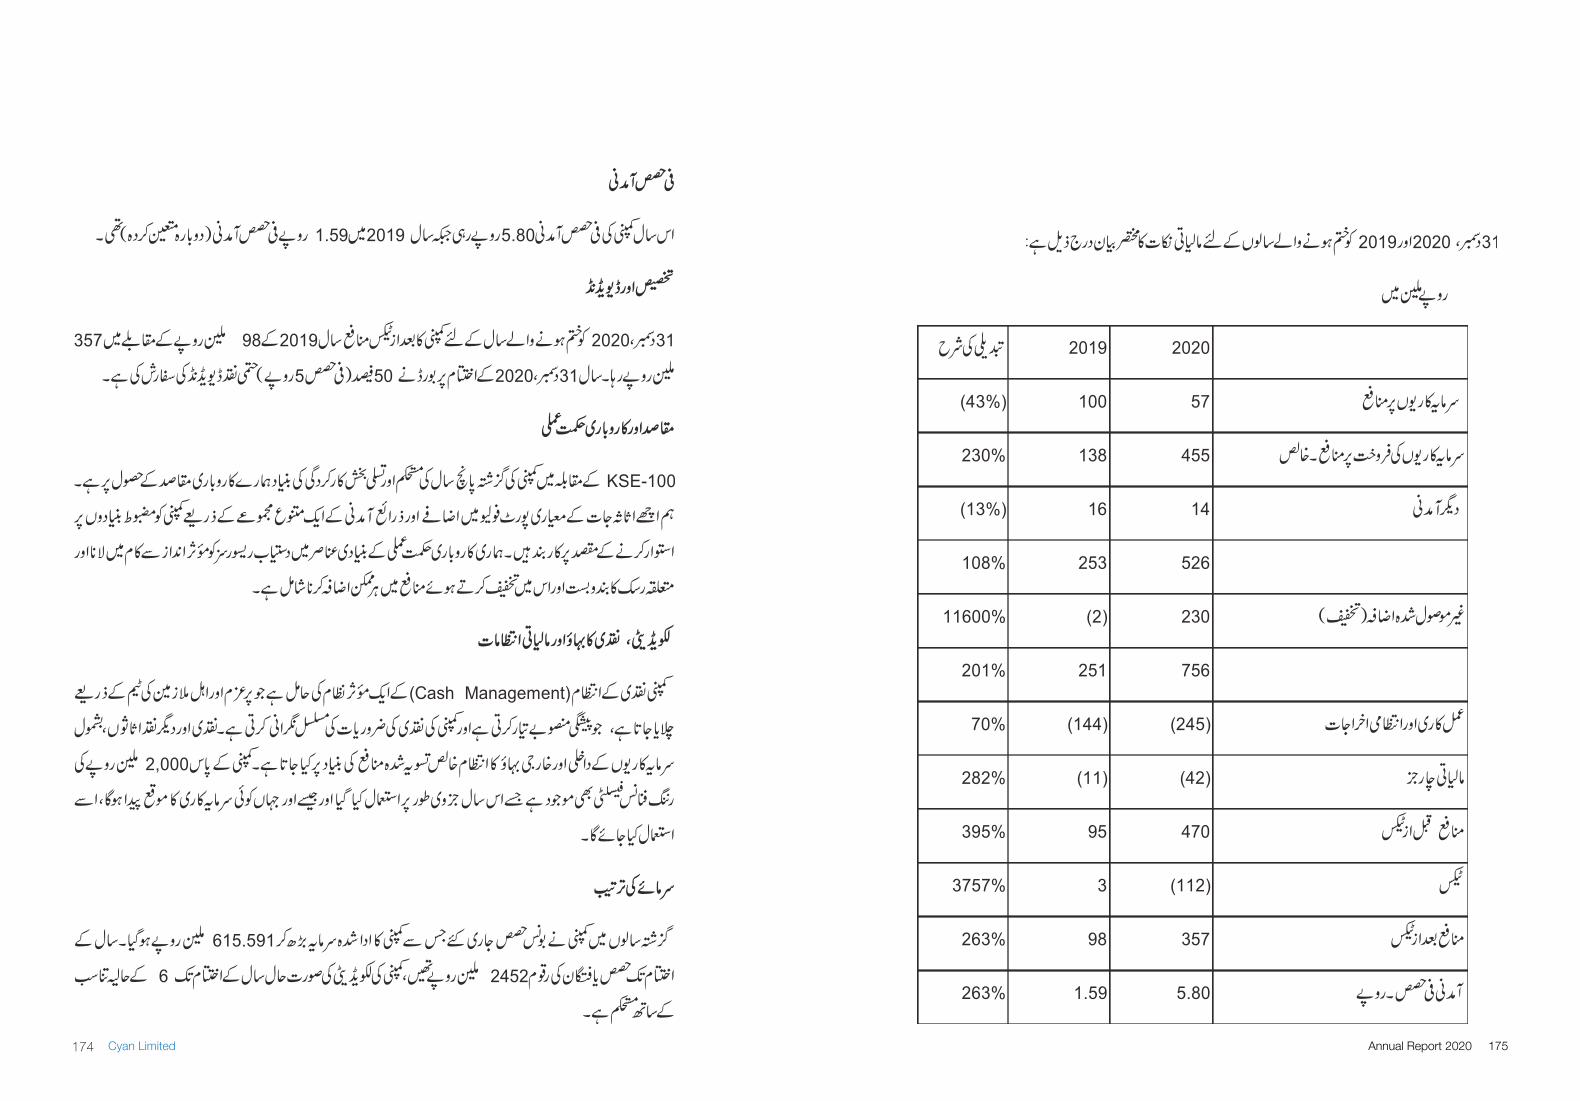
175Annual Report 2020174 Cyan Limited
177Annual Report 2020176 Cyan Limited
179Annual Report 2020178 Cyan Limited
181Annual Report 2020180 Cyan Limited
In accordance with the provisions of section 242 of the Companies Act, 2017, dividend payable in cash shall only be paid through electronic mode directly into the bank account designated by the entitled shareholders. SECP vide Circular No. 18 of 2017 dated August 01, 2017, has presently waived this condition till October 31, 2017. Any dividend payable after this due date shall be paid in the manner prescribed only.
Shareholders are requested to send the attached Form duly filled and signed, along with attested copy of their CNIC to the Company’s Share Registrar, M/s. CDC Share Registrar Services Limited, CDC House, 99-B, Block-B, SMCHS, Main Shahrah-e-Faisal, Karachi. CDC shareholders are requested to submit their Dividend Mandate Form and attested copy of CNIC directly to their broker (participant)/CDC.
I hereby communicate to receive my future dividends directly in my Bank account as detailed below:
Name of shareholder : ------------------------------------------------------------------------------- Folio Number/CDC Account No. : ---------------------------------------------------------- of Cyan Limited. Contact number of shareholder : ------------------------------------------------------------------------------- Title of Account : ------------------------------------------------------------------------------- IBAN (*) : ------------------------------------------------------------------------------- Name of Bank : ------------------------------------------------------------------------------- Bank branch : ------------------------------------------------------------------------------- Mailing Address of Branch : ------------------------------------------------------------------------------- CNIC No. (attach attested copy) : ------------------------------------------------------------------------------- NTN (in case of corporate entity) : -------------------------------------------------------------------------------
It is stated that the above particulars given by me are correct and to the best of my knowledge; I shall keep the Company informed in case of any changes in the said particulars in future.
______________________ ___________________ Shareholder’s Signature Date
NOTES:
*Please provide complete IBAN (International Bank Account Number), after checking with your concerned Bank branch to enable electronic credit directly into your bank account.
Electronic Dividend Mandate Form Cyan Limited
182 Cyan Limited
I/We_________________________________________________ of ____________________ being a member of CYAN LIMITED and holder of _______________ Ordinary Shares as per Share Register Folio No.____________ and/or CDC participant ID No. __________ and Account / Sub Account No.________________ hereby appoint ___________________________________________ of ________________________________________________or failing him/her ________________________ of __________________ as my proxy to vote for me and on my/our behalf at the Annual General Meeting (AGM) of the company to be held Virtually Via Video Link Facility on March 31, 2021 at 11:30 a.m. and at any adjournment thereof.
Signed this ________ day of___________ 2021
Witness 1Signature _________________________Name _________________________CNIC No. or _________________________Passport No. _________________________Address _________________________
Witness 2Signature _________________________Name _________________________CNIC No. or _________________________Passport No. _________________________Address _________________________
Notes:• A member entitled to attend and vote at the meeting may appoint any member as his/her proxy to attend
the meeting and vote.
• If a member is unable to attend the meeting, they may complete and sign this form and send it to the Company Secretary, Cyan Limited at the registered office 4th floor, Dawood Centre, M.T Khan Road, Karachi so as to reach not less than 48 hours before the time appointed for holding the Meeting.
• For CDC Account Holders / Corporate Entities In addition to the above the following requirements have to be met.
(i) The proxy form shall be witnessed by two persons whose names, addresses and CNIC numbers shall be stated on the form.
(ii) Attested copies of CNIC or the passport of the beneficial owners and the proxy shall be provided with the proxy form.
(iii) The proxy shall produce his original CNIC or original passport at the time of the meeting. In case of a corporate entity, the Board of Director resolution / power of attorney with the specimen signature shall be submitted (unless it has been provided earlier) along with the proxy form to the company.
Signature on Revenue Stamps of Rupees Five
Signature should agree with specimen signature with the Company.
Proxy Form
The Company Secretary,Cyan Limited4th Floor, Dawood CentreM.T. Khan RoadKarachi
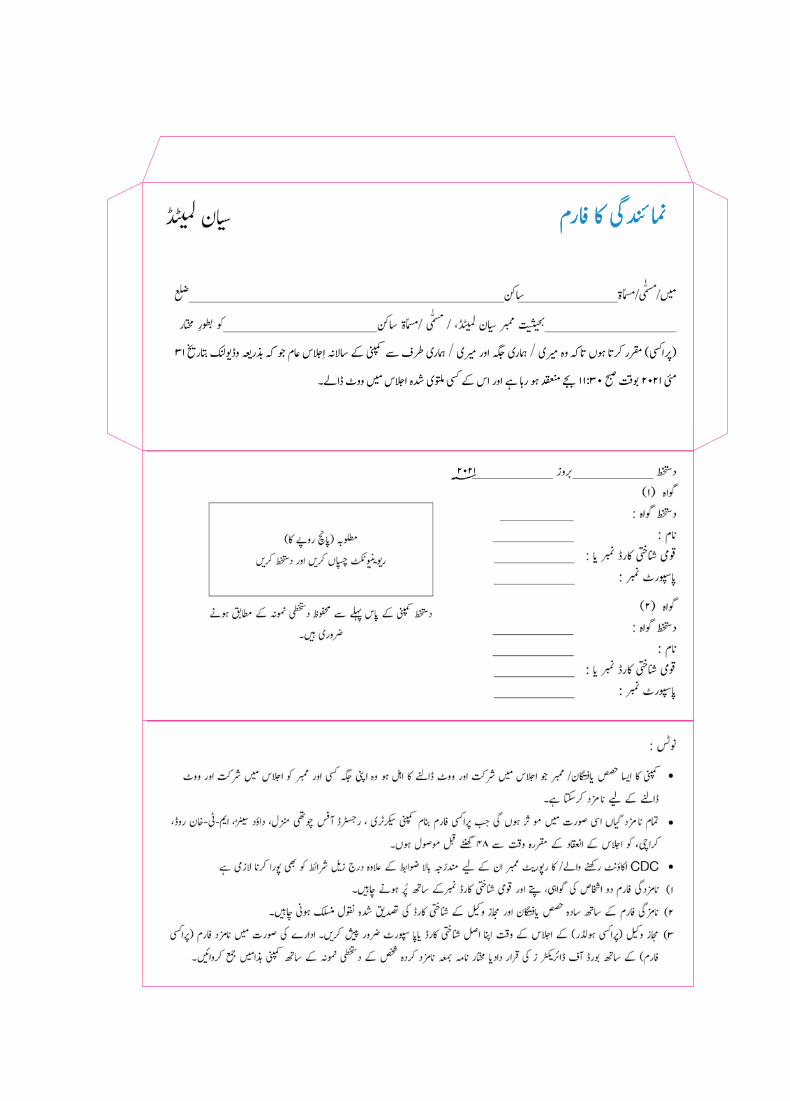
فارم کا نمائندگی
۲۰۲۱
۳۱ خ ی
بتار� ولنک وڈ�ی بذر�ی کہ جو عام اجِلاس سالانہ کے کمپنی سے طرف ری / ہماری می اور جگہ ری / ہماری می وہ تاکہ ہوں کرتا )پراکسی( مقرر
ڈالے۔ ووٹ می اجلاس شدہ ملتوی کسی کے اس اور ہے رہا ہو منعقد ۱ بجے ۱ : ۳ ۰ صبح مئی ۲۰۲۱ بوقت
The Company Secretary,Cyan Limited4th Floor, Dawood CentreM.T. Khan RoadKarachi