Embed Size (px)
Citation preview
Challenge the future
DelftUniversity ofTechnology
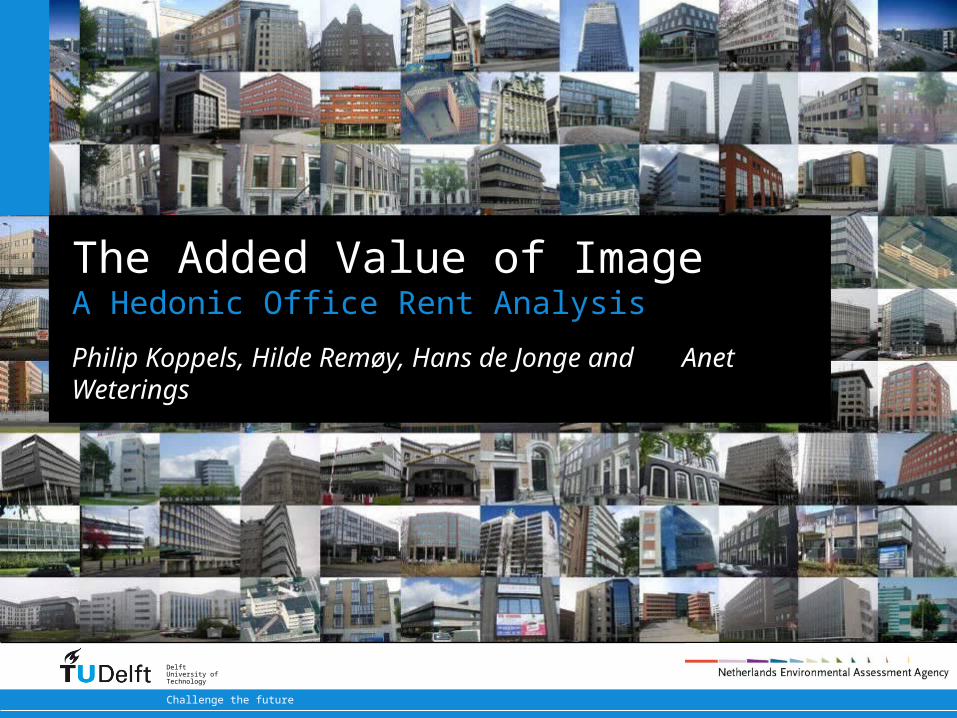
The Added Value of ImageA Hedonic Office Rent Analysis
Philip Koppels, Hilde Remøy, Hans de Jonge and Anet Weterings
2/18
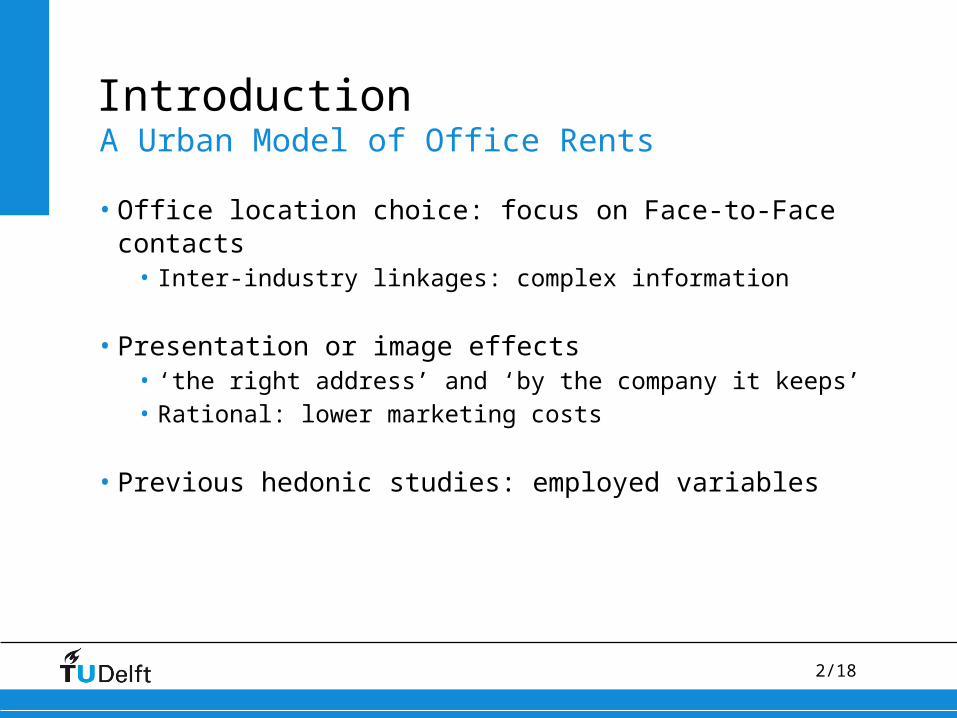
Introduction
• Office location choice: focus on Face-to-Face contacts• Inter-industry linkages: complex information
• Presentation or image effects• ‘the right address’ and ‘by the company it keeps’ • Rational: lower marketing costs
• Previous hedonic studies: employed variables
A Urban Model of Office Rents
3/18
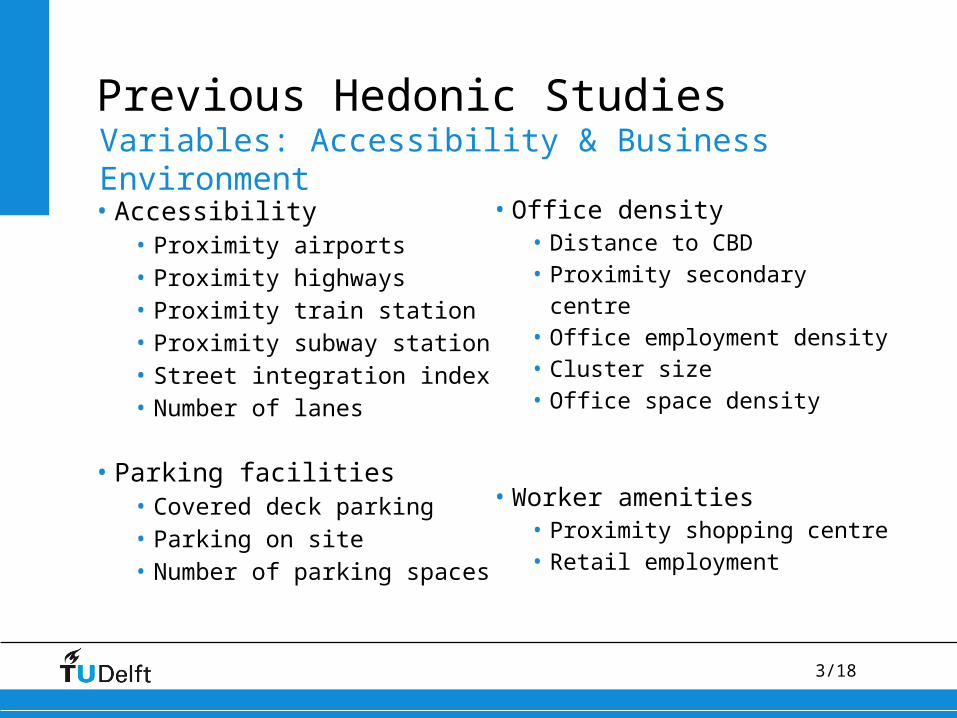
Previous Hedonic StudiesVariables: Accessibility & Business Environment
• Accessibility• Proximity airports• Proximity highways• Proximity train station• Proximity subway station• Street integration index• Number of lanes
• Parking facilities• Covered deck parking• Parking on site• Number of parking spaces
• Office density• Distance to CBD• Proximity secondary centre• Office employment density• Cluster size• Office space density
• Worker amenities• Proximity shopping centre• Retail employment
4/18
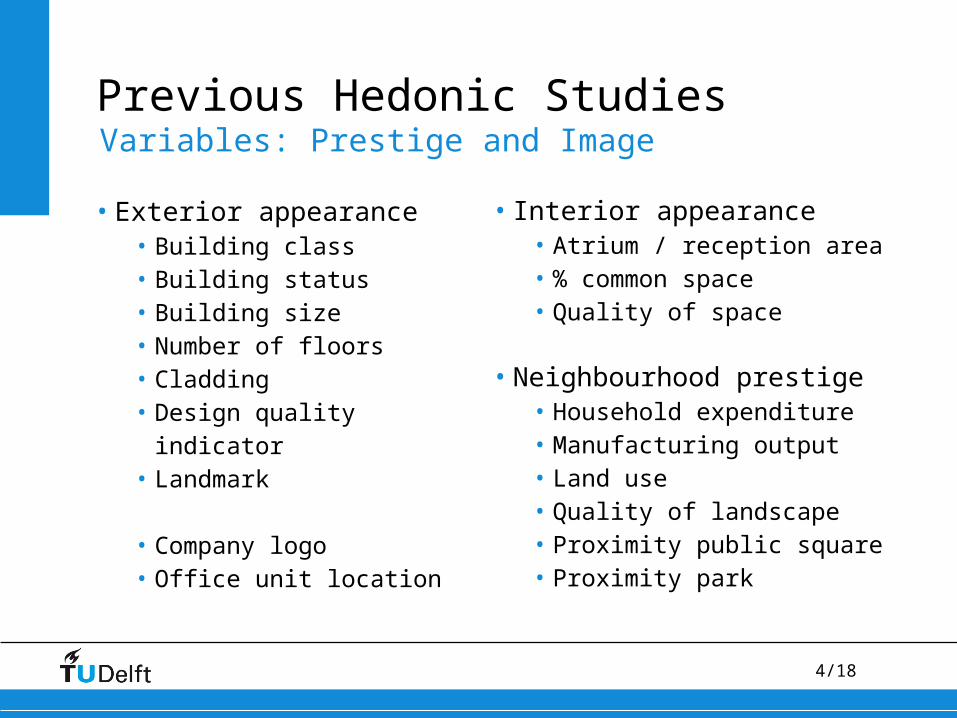
Previous Hedonic StudiesVariables: Prestige and Image
• Exterior appearance• Building class• Building status• Building size• Number of floors• Cladding• Design quality indicator• Landmark
• Company logo• Office unit location
• Interior appearance• Atrium / reception area• % common space• Quality of space
• Neighbourhood prestige• Household expenditure• Manufacturing output• Land use• Quality of landscape• Proximity public square• Proximity park

5/18
Delphi-Expert panel
6/18
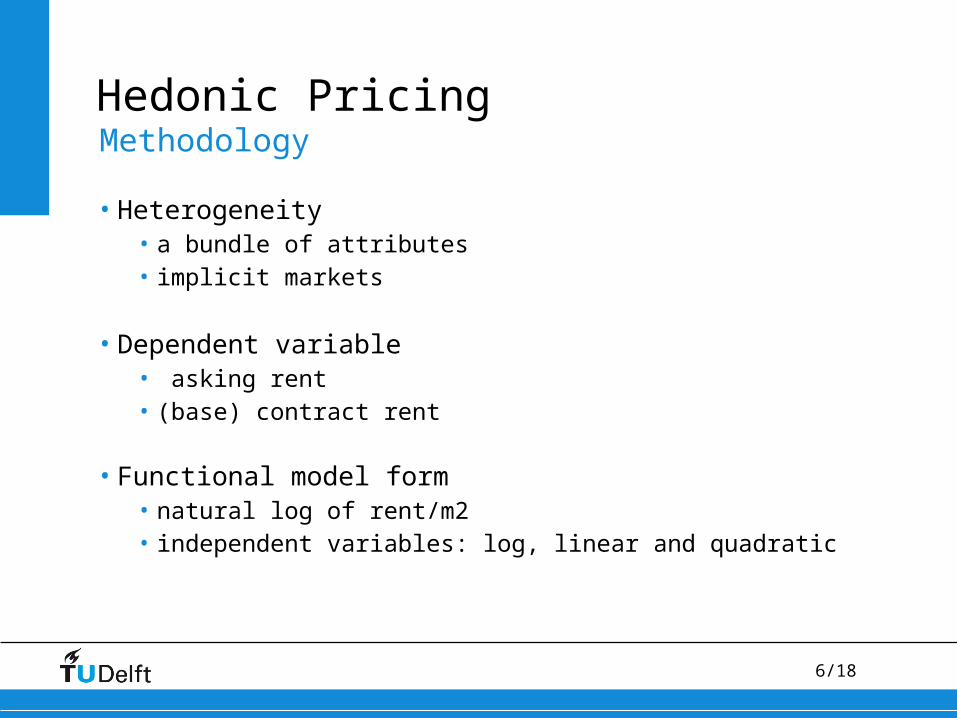
Hedonic Pricing
• Heterogeneity • a bundle of attributes• implicit markets
• Dependent variable• asking rent• (base) contract rent
• Functional model form• natural log of rent/m2• independent variables: log, linear and quadratic
Methodology
7/18
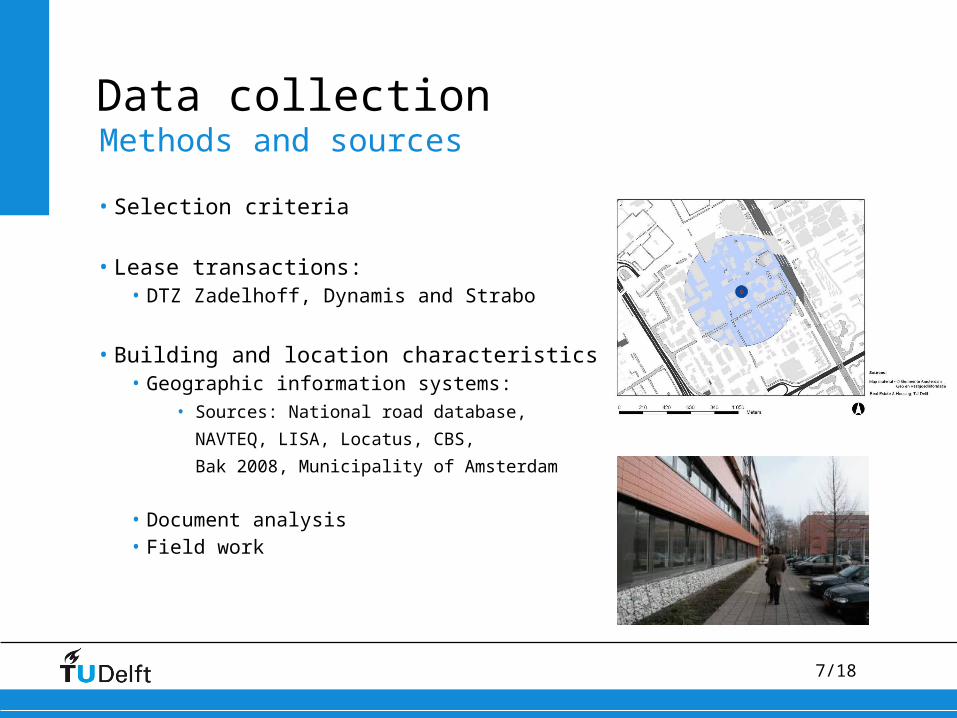
Data collection
• Selection criteria
• Lease transactions:• DTZ Zadelhoff, Dynamis and Strabo
• Building and location characteristics• Geographic information systems:
• Sources: National road database,
NAVTEQ, LISA, Locatus, CBS,
Bak 2008, Municipality of Amsterdam
• Document analysis• Field work
Methods and sources
8/18
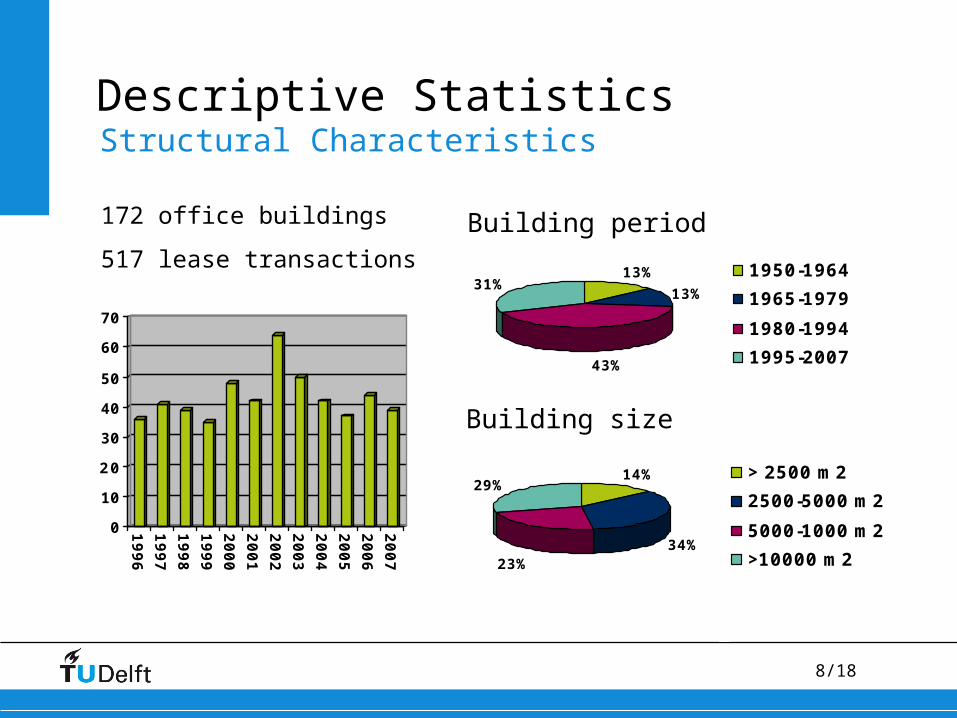
Descriptive Statistics
13%
13%
43%
31%1950-1964
1965-1979
1980-1994
1995-2007
14%
34%23%
29%> 2500 m2
2500-5000 m2
5000-1000 m2
>10000 m2
Building size
Building period
Structural Characteristics
0
10
20
30
40
50
60
70
1996
1997
1998
1999
2000
2001
2002
2003
2004
2005
2006
2007
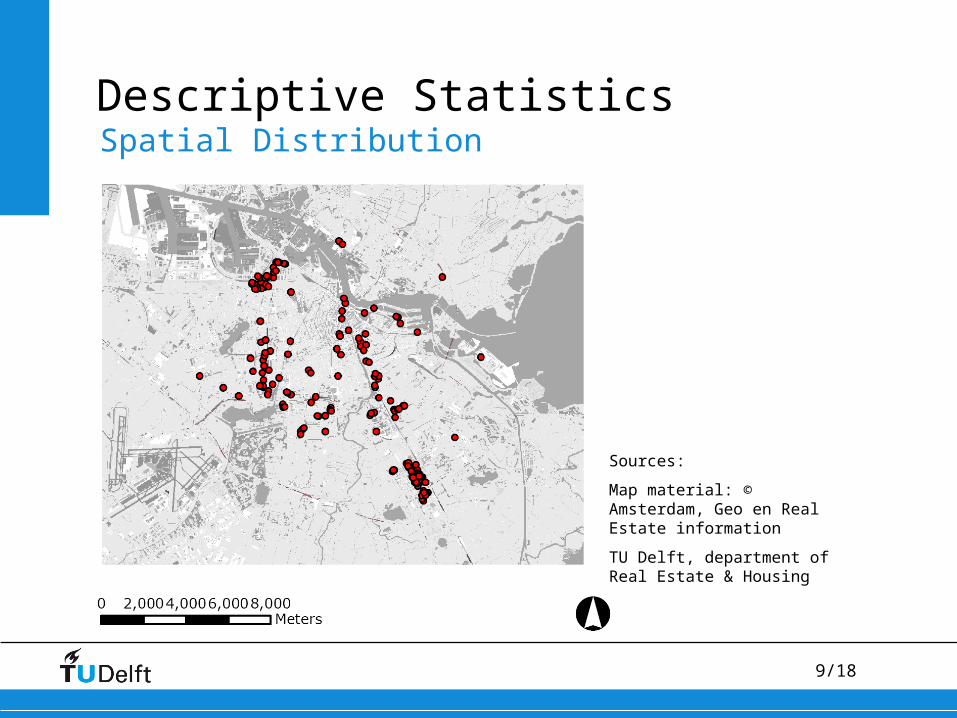
172 office buildings
517 lease transactions
9/18
Descriptive StatisticsSpatial Distribution
Sources:
Map material: © Amsterdam, Geo en Real Estate information
TU Delft, department of Real Estate & Housing
10/18
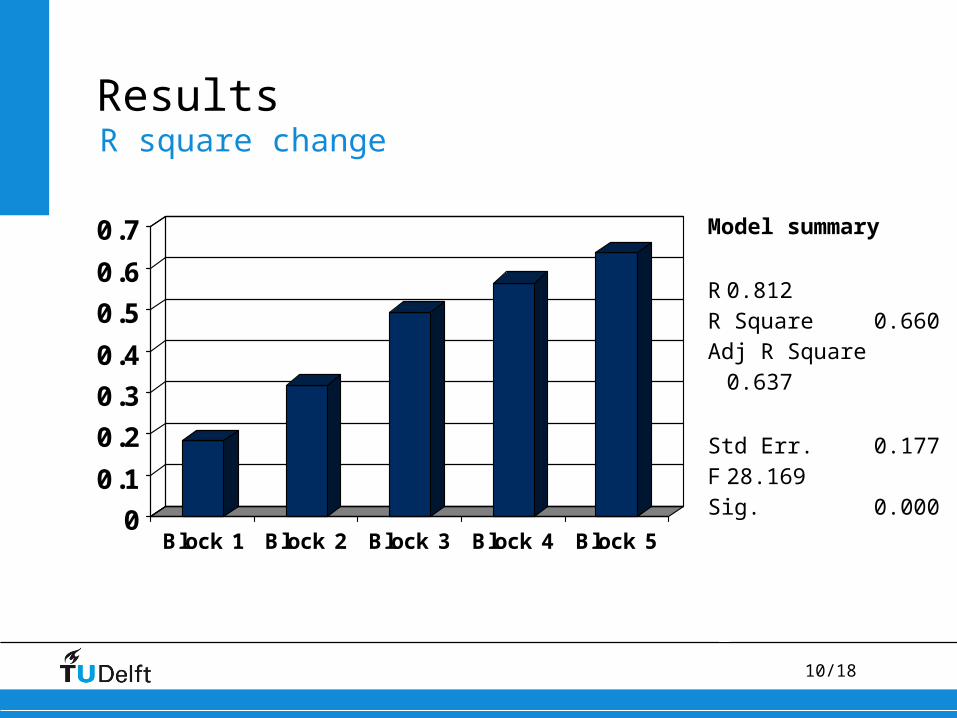
ResultsR square change
0
0.1
0.2
0.3
0.4
0.5
0.6
0.7
Block 1 Block 2 Block 3 Block 4 Block 5
Model summary
R 0.812R Square 0.660Adj R Square 0.637
Std Err. 0.177F
28.169Sig. 0.000
11/18
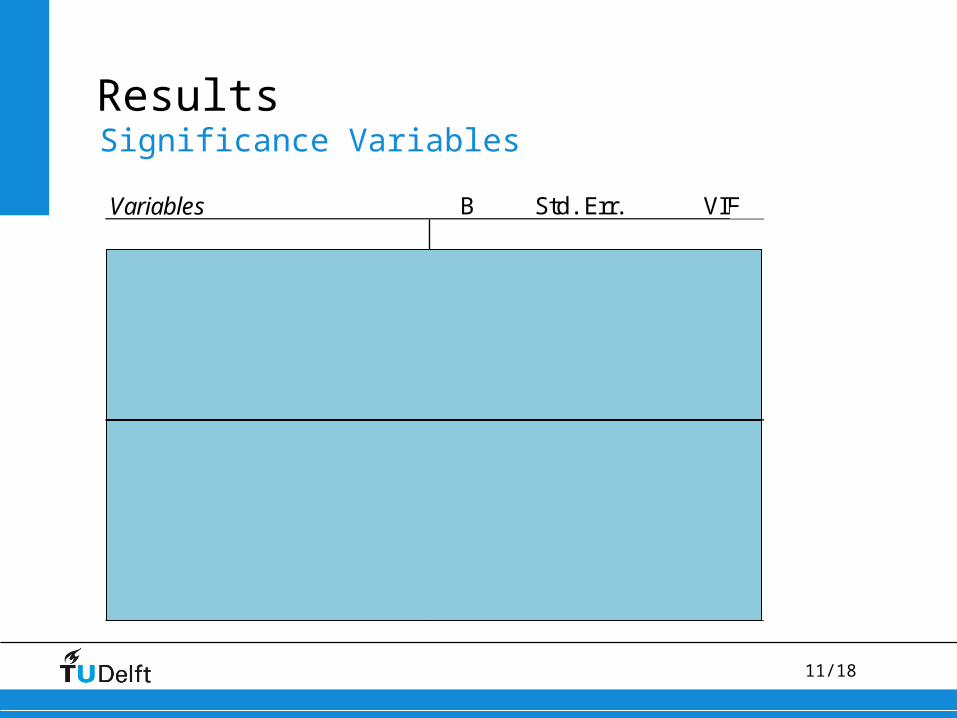
Variables B Std. Err. VIF
(Constant) 5.324 .234 ***IC Station -.020 .018 3.619Highway -.035 .015 ** 2.121Metro -.045 .014 *** 1.747Employment F&B .063 .015 *** 2.843Employment logistic -.054 .011 *** 2.231Employment manufacturing -.039 .008 *** 1.821Water .009 .004 ** 1.838Squares .001 .003 1.885Green .002 .002 1.657Facilities .017 .004 *** 1.803
ResultsSignificance Variables
12/18
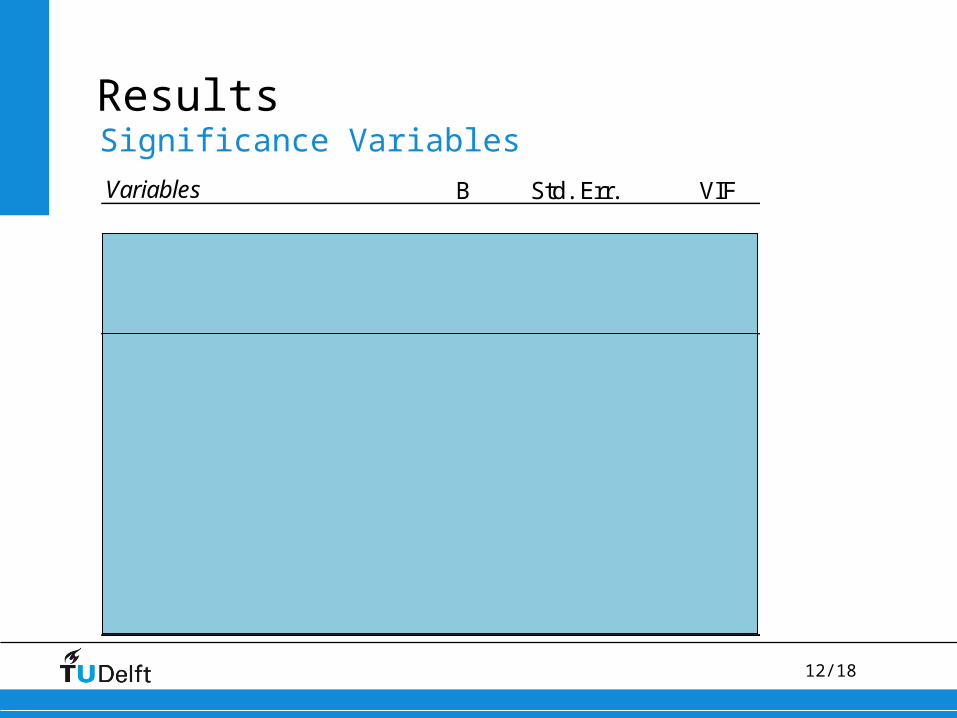
Variables B Std. Err. VIF
Garage .094 .021 *** 1.640Parking lots .038 .012 *** 1.575Age -.031 .010 *** 1.530Cladding Natural .132 .028 *** 2.168Cladding Glass .079 .030 *** 1.861Cladding Metal .064 .029 ** 1.985Cladding Brick -.016 .028 2.156Floors -.002 .005 14.535Sq. Floors .000 .000 ** 13.342Logo .085 .018 *** 1.284Reception Area % .038 .015 *** 2.509Reception Spatial dimensions -.023 .016 2.532
ResultsSignificance Variables
13/18
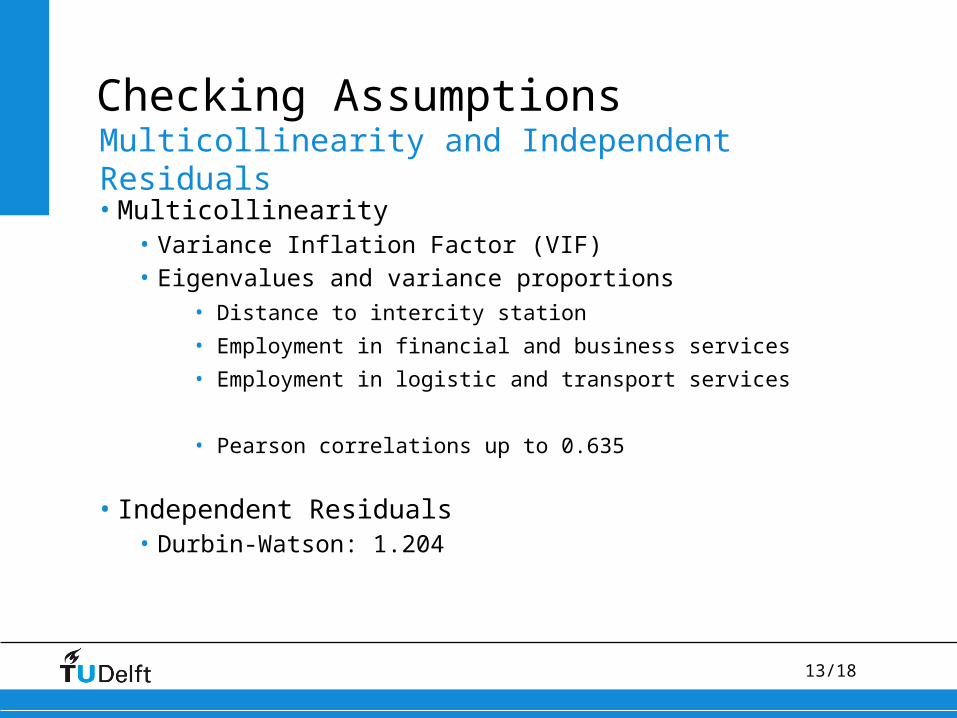
Checking Assumptions
• Multicollinearity• Variance Inflation Factor (VIF)• Eigenvalues and variance proportions
• Distance to intercity station
• Employment in financial and business services
• Employment in logistic and transport services
• Pearson correlations up to 0.635
• Independent Residuals• Durbin-Watson: 1.204
Multicollinearity and Independent Residuals
14/18
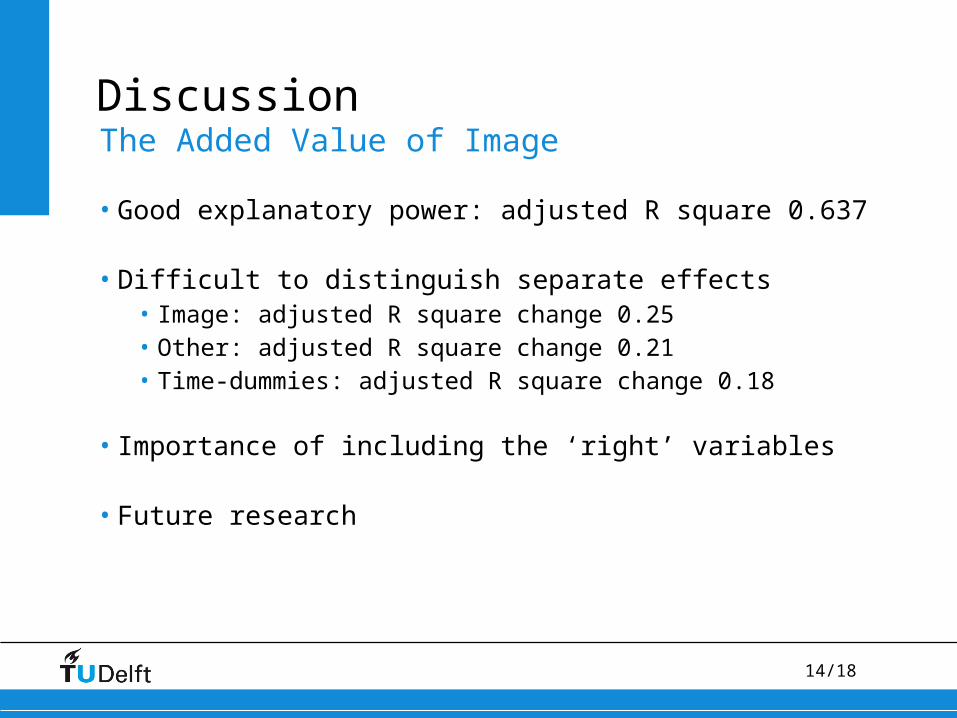
DiscussionThe Added Value of Image
• Good explanatory power: adjusted R square 0.637
• Difficult to distinguish separate effects• Image: adjusted R square change 0.25• Other: adjusted R square change 0.21• Time-dummies: adjusted R square change 0.18
• Importance of including the ‘right’ variables
• Future research
16/18
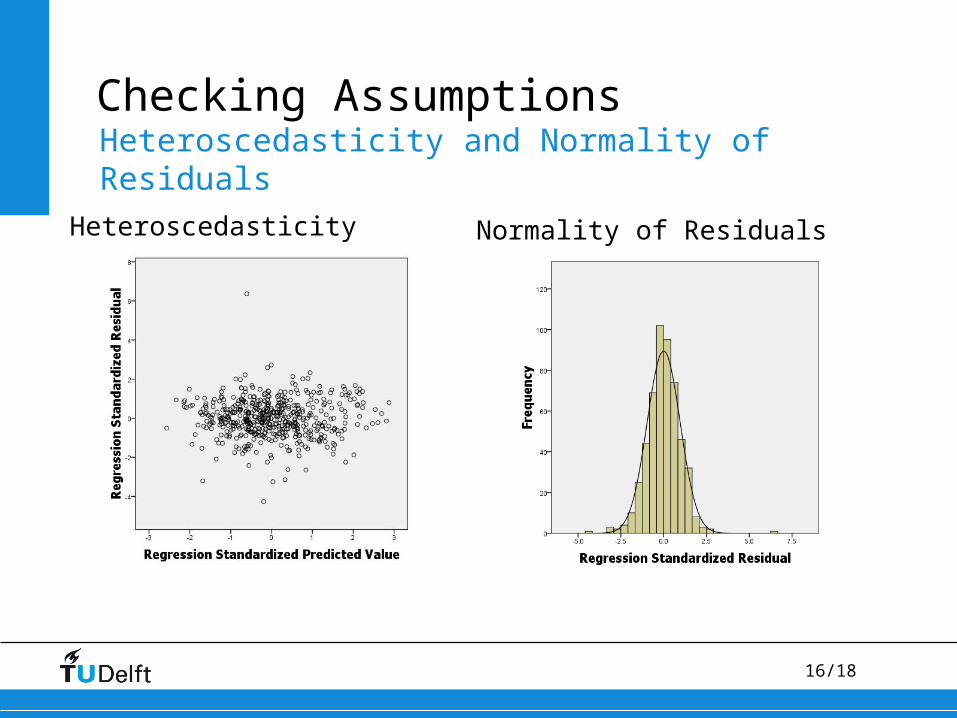
Checking AssumptionsHeteroscedasticity and Normality of Residuals
Heteroscedasticity Normality of Residuals
17/18
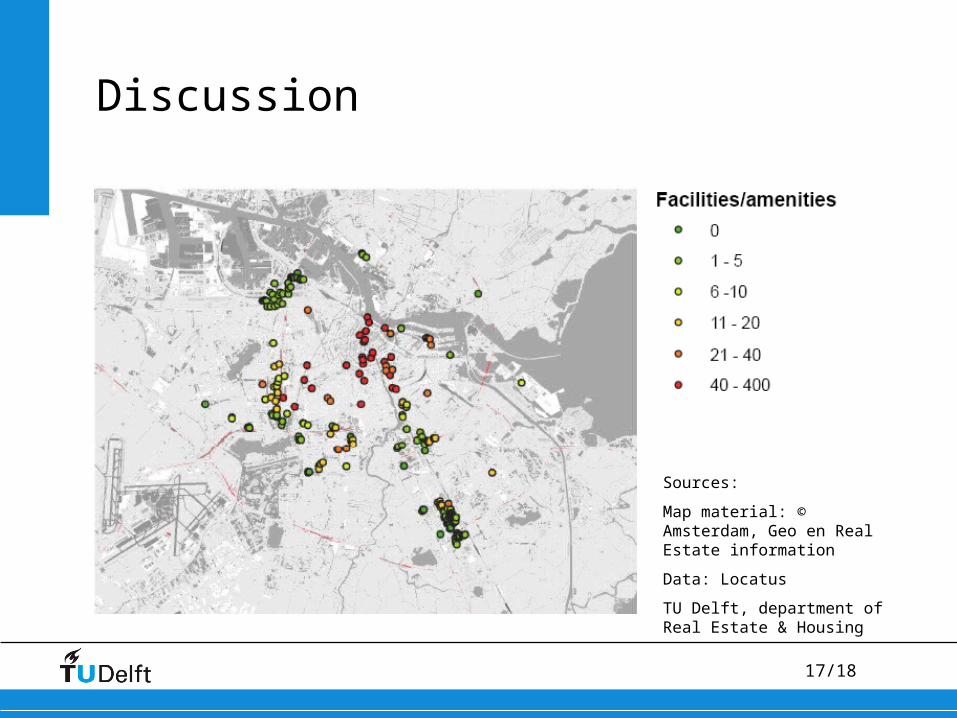
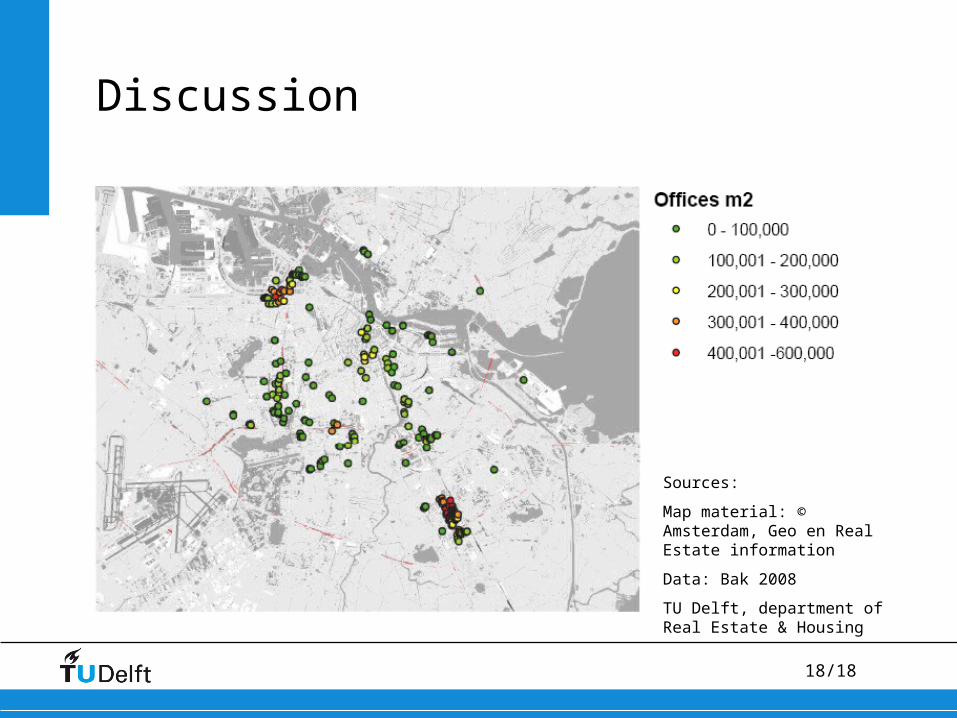
Discussion
Sources:
Map material: © Amsterdam, Geo en Real Estate information
Data: Locatus
TU Delft, department of Real Estate & Housing
18/18
Discussion
Sources:
Map material: © Amsterdam, Geo en Real Estate information
Data: Bak 2008
TU Delft, department of Real Estate & Housing