Embed Size (px)
Citation preview
1
1
Challenges and New Opportunities in Challenges and New Opportunities in Industrialising Raman Spectroscopy Industrialising Raman Spectroscopy
for PAT Applicationsfor PAT Applications
Pavel MatousekCentral Laser FacilityRutherford Appleton LaboratoryOxfordshireEngland
2
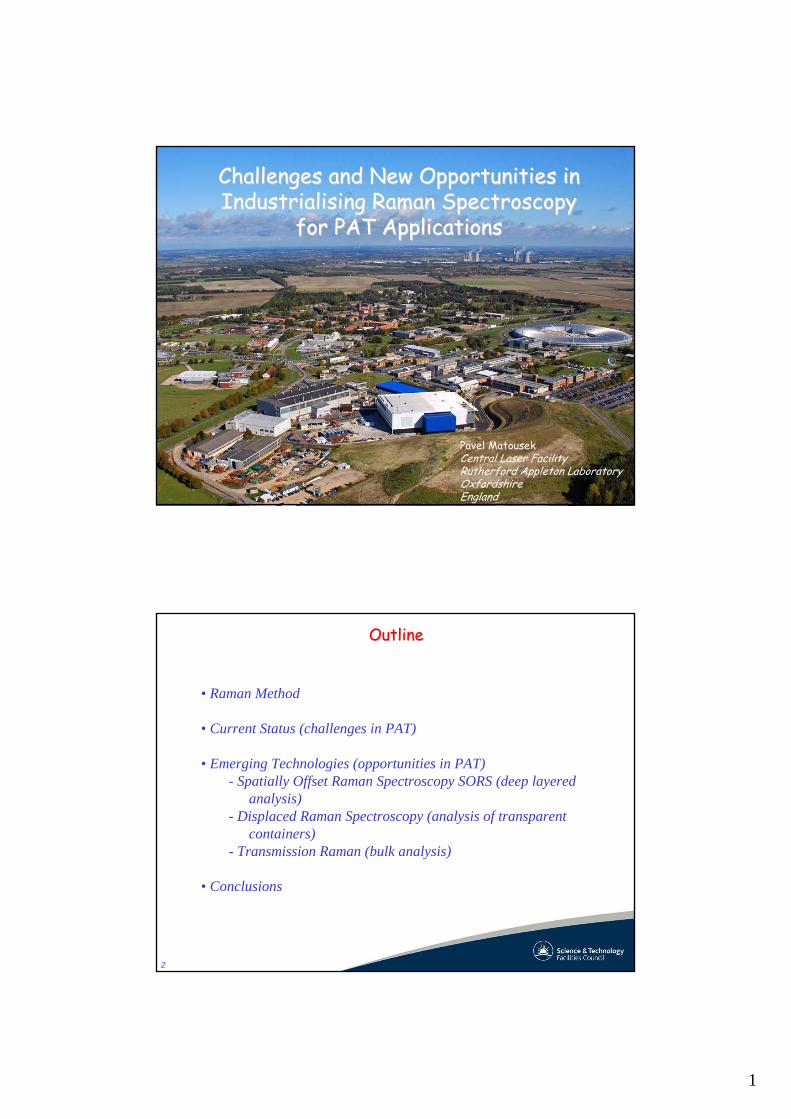
OutlineOutline
• Raman Method
• Current Status (challenges in PAT)
• Emerging Technologies (opportunities in PAT)- Spatially Offset Raman Spectroscopy SORS (deep layered
analysis)- Displaced Raman Spectroscopy (analysis of transparent
containers)- Transmission Raman (bulk analysis)
• Conclusions
2
3
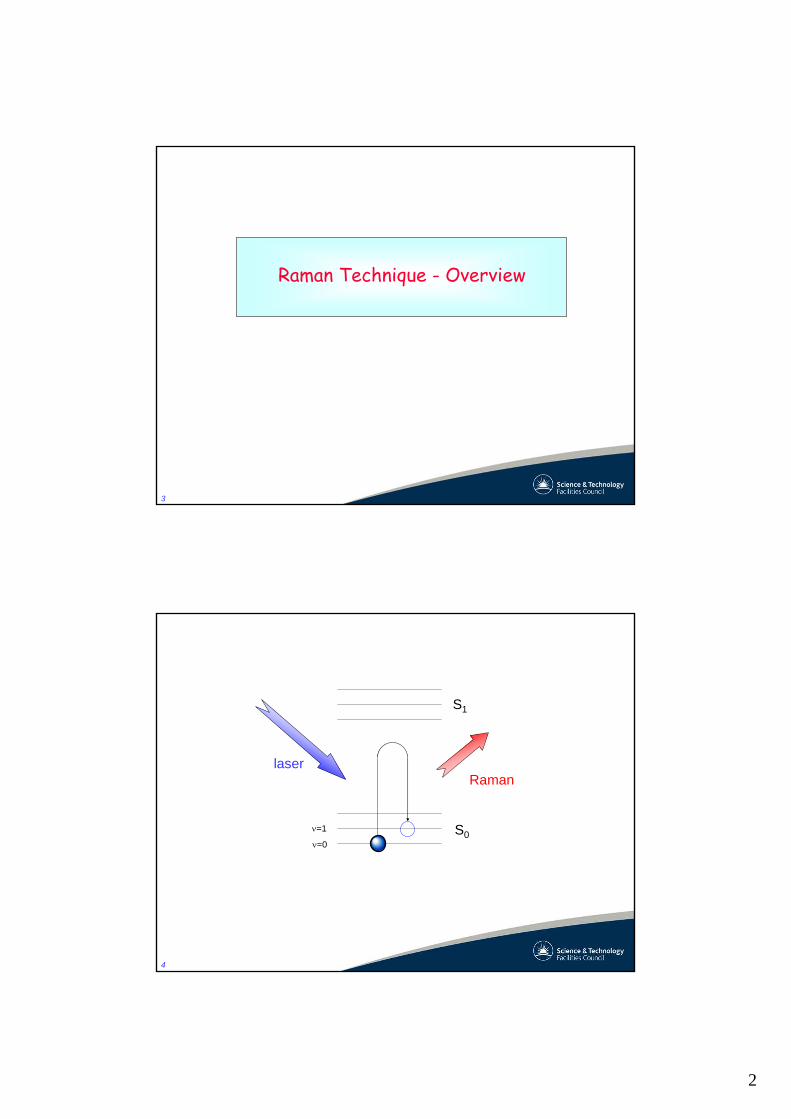
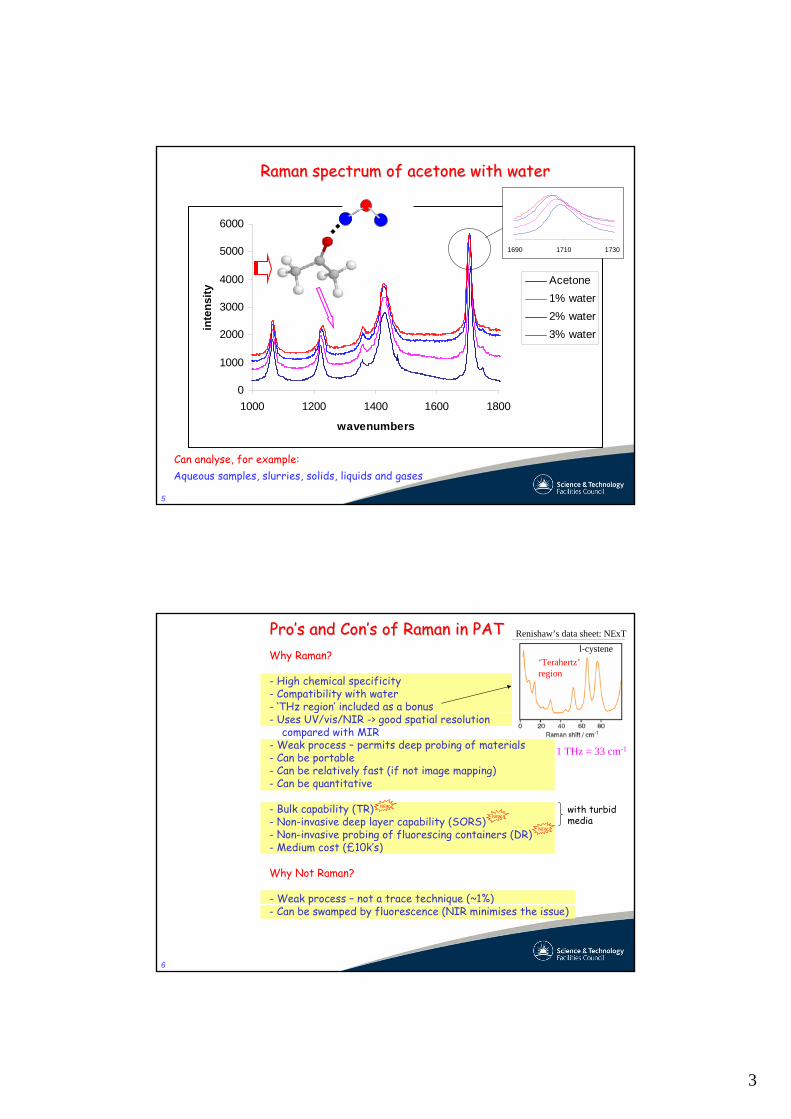
Raman Technique - Overview
4
S1
ν=0
ν=1
Ramanlaser
S0
3
5
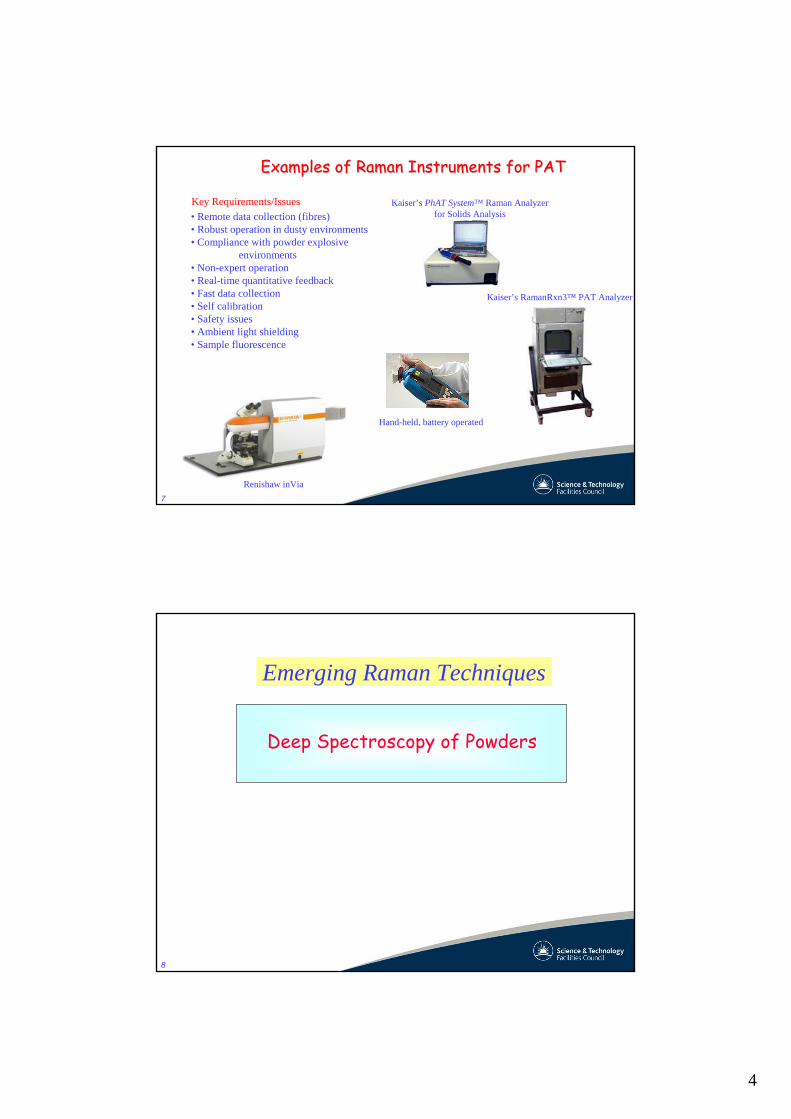
Raman spectrum of acetone with waterRaman spectrum of acetone with water
0
1000
2000
3000
4000
5000
6000
1000 1200 1400 1600 1800
wavenumbers
inte
nsity
Acetone1% water2% water3% water
0
1000
2000
3000
4000
5000
6000
1690 1710 1730
Aqueous samples, slurries, solids, liquids and gases Can analyse, for example:
6
Why Raman?
- High chemical specificity- Compatibility with water- ‘THz region’ included as a bonus- Uses UV/vis/NIR -> good spatial resolution
compared with MIR- Weak process – permits deep probing of materials- Can be portable- Can be relatively fast (if not image mapping)- Can be quantitative
- Bulk capability (TR)- Non-invasive deep layer capability (SORS)- Non-invasive probing of fluorescing containers (DR)- Medium cost (£10k’s)
Why Not Raman?
- Weak process – not a trace technique (~1%)- Can be swamped by fluorescence (NIR minimises the issue)
NEWNEW
NEWNEW
NEWNEW
IR
☺
☺☺☺
☺
☺☺
NIR
☺
☺☺☺☺
☺☺☺☺
☺
THz
☺
☺
☺☺☺☺
☺☺☺
☺
Raman
☺☺☺☺
☺☺☺☺
☺☺☺☺
ProPro’’s and Cons and Con’’s of Raman in PATs of Raman in PAT Renishaw’s data sheet: NExTl-cystene
‘Terahertz’region
1 THz = 33 cm-1
with turbid media
4
7
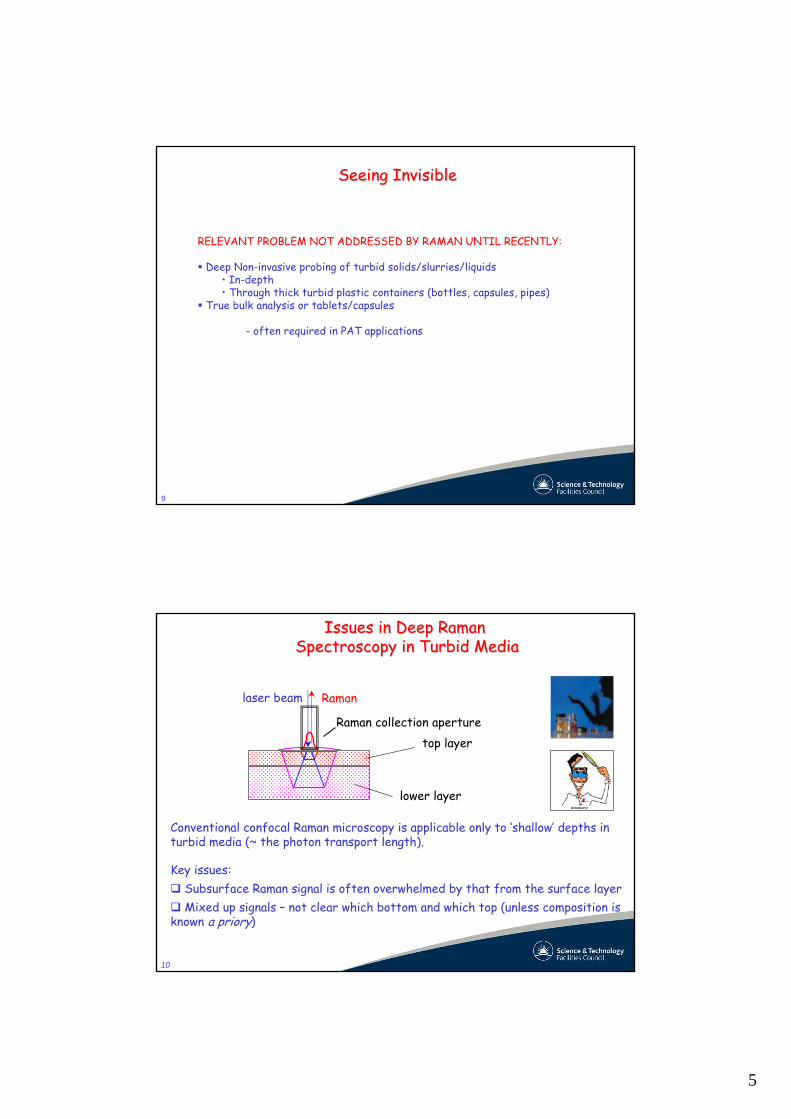
Ahura Truscan
Hand-held, battery operated
Examples of Raman Instruments for PAT Examples of Raman Instruments for PAT
Kaiser’s RamanRxn3™ PAT Analyzer
Kaiser’s PhAT System™ Raman Analyzerfor Solids Analysis
Renishaw inVia
• Remote data collection (fibres) • Robust operation in dusty environments• Compliance with powder explosive
environments• Non-expert operation• Real-time quantitative feedback • Fast data collection• Self calibration• Safety issues• Ambient light shielding• Sample fluorescence
Key Requirements/Issues
8
Deep Spectroscopy of Powders
Emerging Raman Techniques
5
9
RELEVANT PROBLEM NOT ADDRESSED BY RAMAN UNTIL RECENTLY:
Deep Non-invasive probing of turbid solids/slurries/liquids • In-depth• Through thick turbid plastic containers (bottles, capsules, pipes)
True bulk analysis or tablets/capsules
- often required in PAT applications
Seeing InvisibleSeeing Invisible
10
Issues in Deep Raman Issues in Deep Raman Spectroscopy in Turbid MediaSpectroscopy in Turbid Media
Conventional confocal Raman microscopy is applicable only to ‘shallow’ depths in turbid media (~ the photon transport length).
Key issues:Subsurface Raman signal is often overwhelmed by that from the surface layerMixed up signals – not clear which bottom and which top (unless composition is
known a priory)
top layer
lower layer
laser beam Raman
Raman collection aperture
6
11
laser Raman
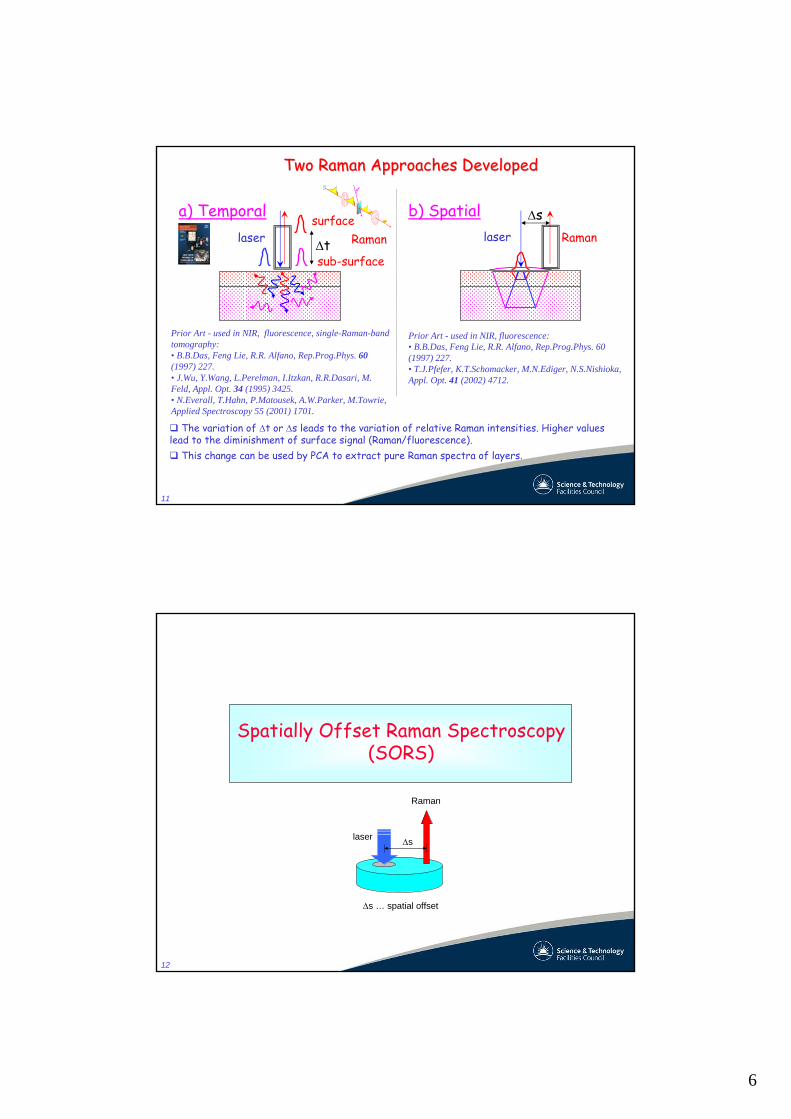
Two Raman Approaches DevelopedTwo Raman Approaches Developed
a) Temporal b) Spatial
The variation of Δt or Δs leads to the variation of relative Raman intensities. Higher values lead to the diminishment of surface signal (Raman/fluorescence).
This change can be used by PCA to extract pure Raman spectra of layers.
Δt
surface
sub-surface
Prior Art - used in NIR, fluorescence, single-Raman-band tomography: • B.B.Das, Feng Lie, R.R. Alfano, Rep.Prog.Phys. 60(1997) 227.• J.Wu, Y.Wang, L.Perelman, I.Itzkan, R.R.Dasari, M. Feld, Appl. Opt. 34 (1995) 3425. • N.Everall, T.Hahn, P.Matousek, A.W.Parker, M.Towrie, Applied Spectroscopy 55 (2001) 1701.
Prior Art - used in NIR, fluorescence: • B.B.Das, Feng Lie, R.R. Alfano, Rep.Prog.Phys. 60 (1997) 227.• T.J.Pfefer, K.T.Schomacker, M.N.Ediger, N.S.Nishioka, Appl. Opt. 41 (2002) 4712.
ΔsRamanlaser
12
Spatially Offset Raman Spectroscopy (SORS)
laser
Raman
Δs
Δs … spatial offset
7
13
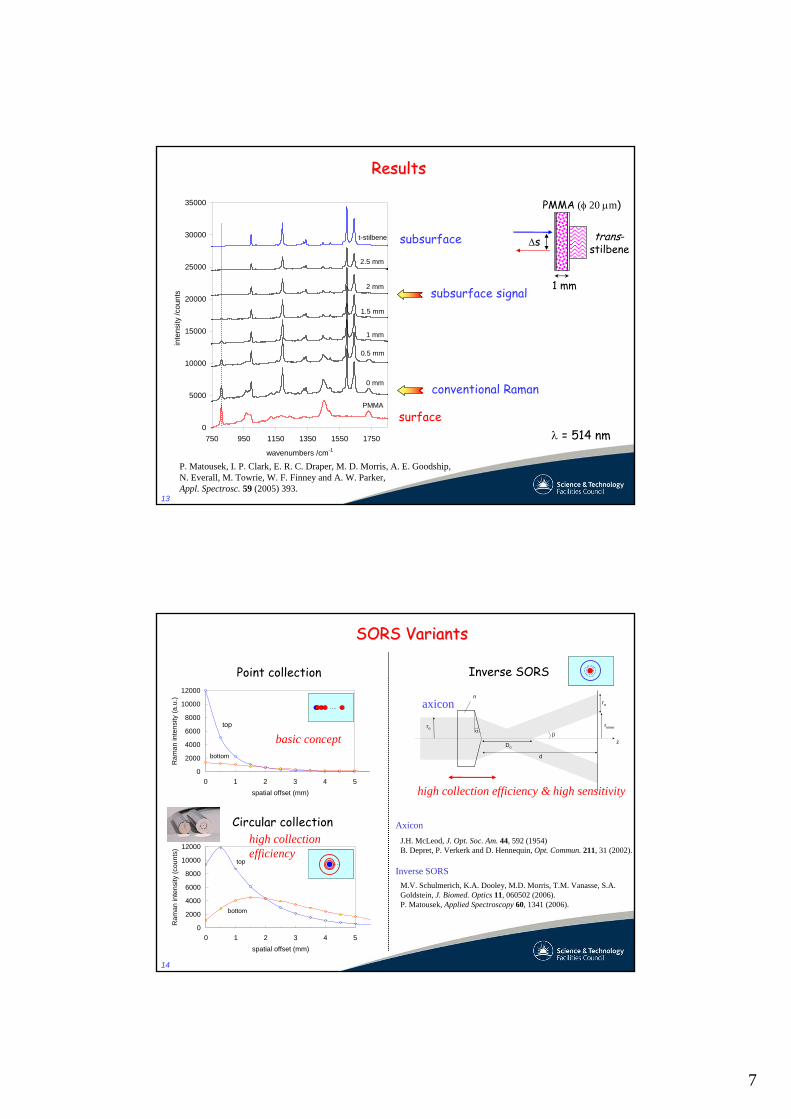
ResultsResults
0
5000
10000
15000
20000
25000
30000
35000
750 950 1150 1350 1550 1750
wavenumbers /cm-1
inte
nsity
/cou
nts
x
PMMA
0 mm
0.5 mm
1 mm
1.5 mm
2 mm
2.5 mm
t-stilbene
subsurface signal
conventional Raman
λ = 514 nmsurface
subsurface
P. Matousek, I. P. Clark, E. R. C. Draper, M. D. Morris, A. E. Goodship, N. Everall, M. Towrie, W. F. Finney and A. W. Parker, Appl. Spectrosc. 59 (2005) 393.
1 mm
PMMA (φ 20 μm)
trans-stilbeneΔs
14
SORS VariantsSORS Variants
0
2000
4000
6000
8000
10000
12000
0 1 2 3 4 5spatial offset (mm)
Ram
an in
tens
ity (c
ount
s)
top
bottom
0
2000
4000
6000
8000
10000
12000
0 1 2 3 4 5spatial offset (mm)
Ram
an in
tens
ity (a
.u.)
top
bottom
Point collection
Circular collection
……
….….
Inverse SORS …
z
α
Do
d
βro
rinner
ro
n
axicon
basic concept
high collectionefficiency
high collection efficiency & high sensitivity
J.H. McLeod, J. Opt. Soc. Am. 44, 592 (1954)B. Depret, P. Verkerk and D. Hennequin, Opt. Commun. 211, 31 (2002).
Axicon
Inverse SORSM.V. Schulmerich, K.A. Dooley, M.D. Morris, T.M. Vanasse, S.A. Goldstein, J. Biomed. Optics 11, 060502 (2006). P. Matousek, Applied Spectroscopy 60, 1341 (2006).
8
15
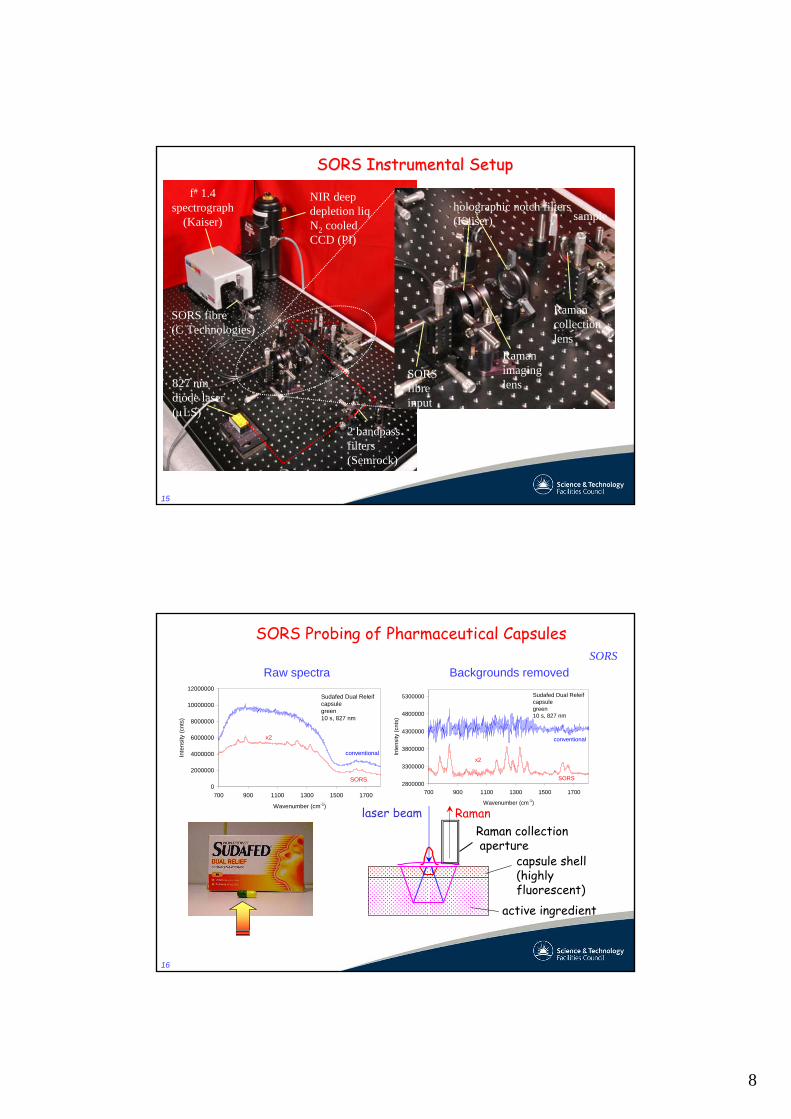
f# 1.4 spectrograph
(Kaiser)
827 nm diode laser (μLS)
SORS fibre (C Technologies)
NIR deep depletion liqN2 cooled CCD (PI)
SORS fibre input
Raman collection lens
Raman imaging lens
holographic notch filters(Kaiser) sample
SORS Instrumental SetupSORS Instrumental Setup
2 bandpassfilters (Semrock)
16
0
2000000
4000000
6000000
8000000
10000000
12000000
700 900 1100 1300 1500 1700
Wavenumber (cm-1)
Inte
nsity
(cnt
s)
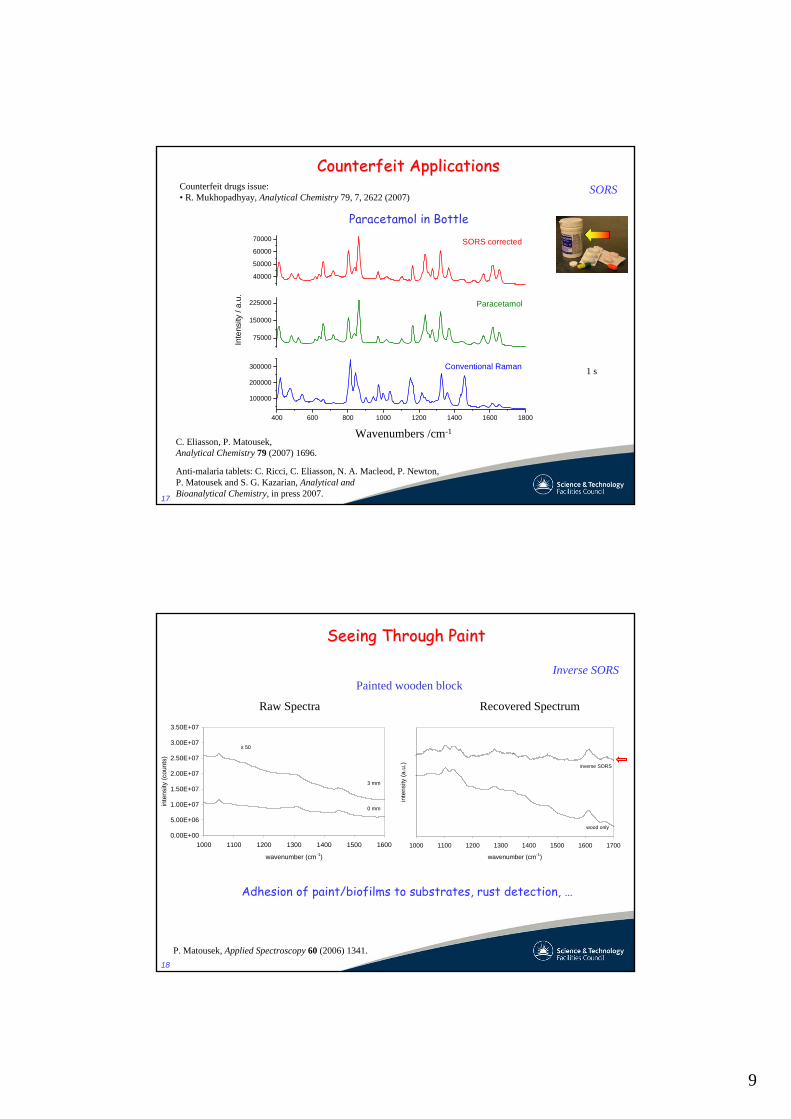
SORS
conventional
Sudafed Dual Releifcapsulegreen10 s, 827 nm
x2
2800000
3300000
3800000
4300000
4800000
5300000
700 900 1100 1300 1500 1700
Wavenumber (cm-1)
Inte
nsity
(cnt
s)
SORS
conventional
Sudafed Dual Releifcapsulegreen10 s, 827 nm
x2
SORS Probing of Pharmaceutical Capsules
Raw spectra Backgrounds removed
capsule shell(highlyfluorescent)
active ingredient
laser beam RamanRaman collectionaperture
SORS
9
17
Counterfeit ApplicationsCounterfeit Applications
400 600 800 1000 1200 1400 1600 1800
100000
200000
300000 Conventional Raman
Wave numbers / cm-1
75000
150000
225000 Paracetamol
Inte
nsity
/ a.
u.
40000
50000
60000
70000 SORS corrected
Paracetamol in Bottle
C. Eliasson, P. Matousek, Analytical Chemistry 79 (2007) 1696.
Anti-malaria tablets: C. Ricci, C. Eliasson, N. A. Macleod, P. Newton, P. Matousek and S. G. Kazarian, Analytical and Bioanalytical Chemistry, in press 2007.
Wavenumbers /cm-1
SORSCounterfeit drugs issue: • R. Mukhopadhyay, Analytical Chemistry 79, 7, 2622 (2007)
1 s
18
Seeing Through PaintSeeing Through Paint
Raw Spectra Recovered Spectrum
0.00E+00
5.00E+06
1.00E+07
1.50E+07
2.00E+07
2.50E+07
3.00E+07
3.50E+07
1000 1100 1200 1300 1400 1500 1600
wavenumber (cm-1)
inte
nsity
(cou
nts)
a)
0 mm
3 mm
x 50
Inverse SORS
1000 1100 1200 1300 1400 1500 1600 1700
wavenumber (cm-1)
inte
nsity
(a.u
.)
b)
wood only
inverse SORS
Adhesion of paint/biofilms to substrates, rust detection, …
Painted wooden block
P. Matousek, Applied Spectroscopy 60 (2006) 1341.
10
19
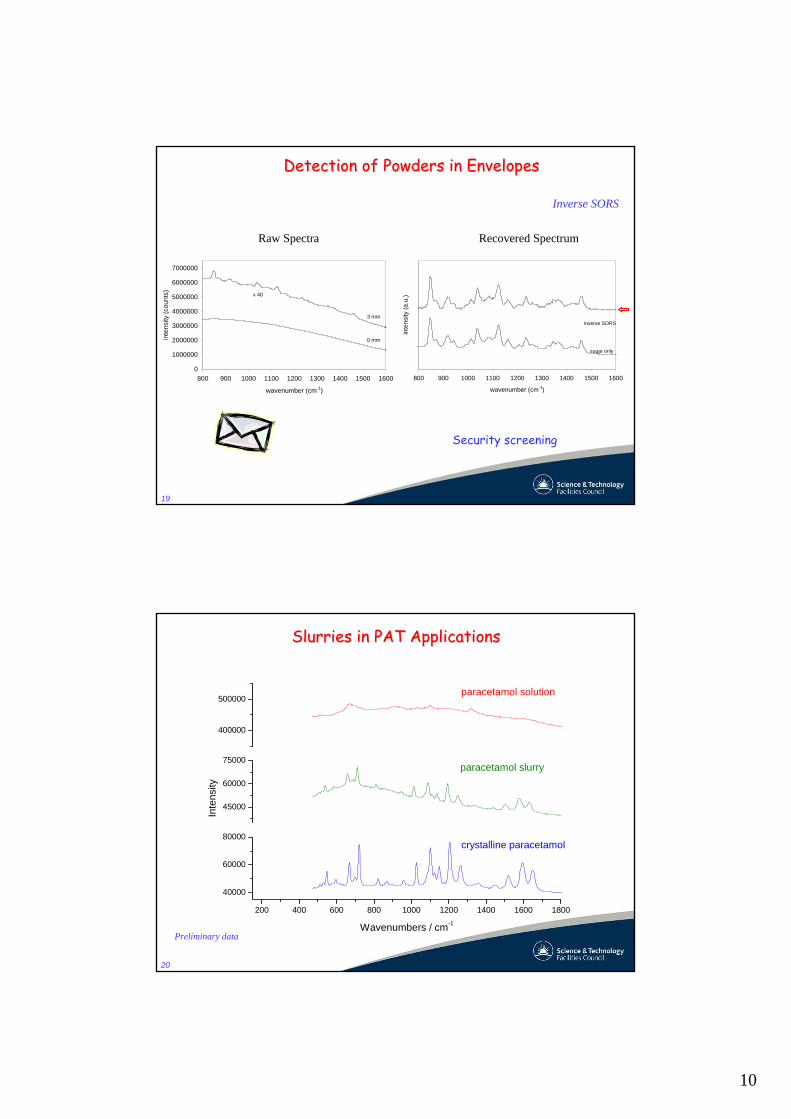
Detection of Powders in EnvelopesDetection of Powders in Envelopes
Raw Spectra Recovered Spectrum
0
1000000
2000000
3000000
4000000
5000000
6000000
7000000
800 900 1000 1100 1200 1300 1400 1500 1600
wavenumber (cm-1)
inte
nsity
(cou
nts)
a)
0 mm
3 mm
x 40
Inverse SORS
800 900 1000 1100 1200 1300 1400 1500 1600
wavenumber (cm-1)
inte
nsity
(a.u
.)
b)
sugar only
inverse SORS
Security screening
20
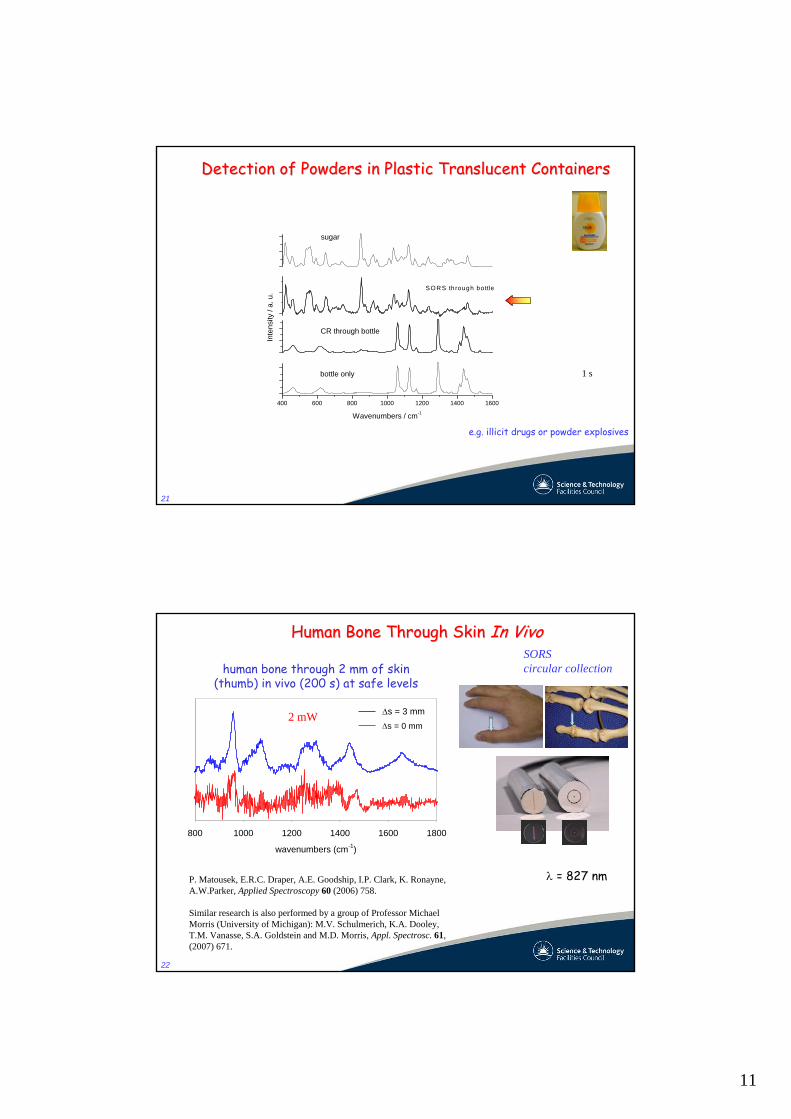
Slurries in PAT ApplicationsSlurries in PAT Applications
200 400 600 800 1000 1200 1400 1600 1800
40000
60000
80000
Wavenumbers / cm-1
45000
60000
75000
Inte
nsity
400000
500000
paracetamol slurry
paracetamol solution
crystalline paracetamol
Preliminary data
11
21
Detection of Powders in Plastic Translucent ContainersDetection of Powders in Plastic Translucent Containers
400 600 800 1000 1200 1400 1600
Wavenumbers / cm-1
bottle only
Inte
nsity
/ a.
u.
CR through bottle
SORS through bottle
sugar
SORS through bottle
e.g. illicit drugs or powder explosives
1 s
22
800 1000 1200 1400 1600 1800
wavenumbers (cm-1)
Δs = 3 mmΔs = 0 mm
human bone through 2 mm of skin (thumb) in vivo (200 s) at safe levels
2 mW
Human Bone Through Skin Human Bone Through Skin In VivoIn Vivo
P. Matousek, E.R.C. Draper, A.E. Goodship, I.P. Clark, K. Ronayne, A.W.Parker, Applied Spectroscopy 60 (2006) 758.
Similar research is also performed by a group of Professor Michael Morris (University of Michigan): M.V. Schulmerich, K.A. Dooley, T.M. Vanasse, S.A. Goldstein and M.D. Morris, Appl. Spectrosc. 61, (2007) 671.
λ = 827 nm
SORS circular collection
12
23
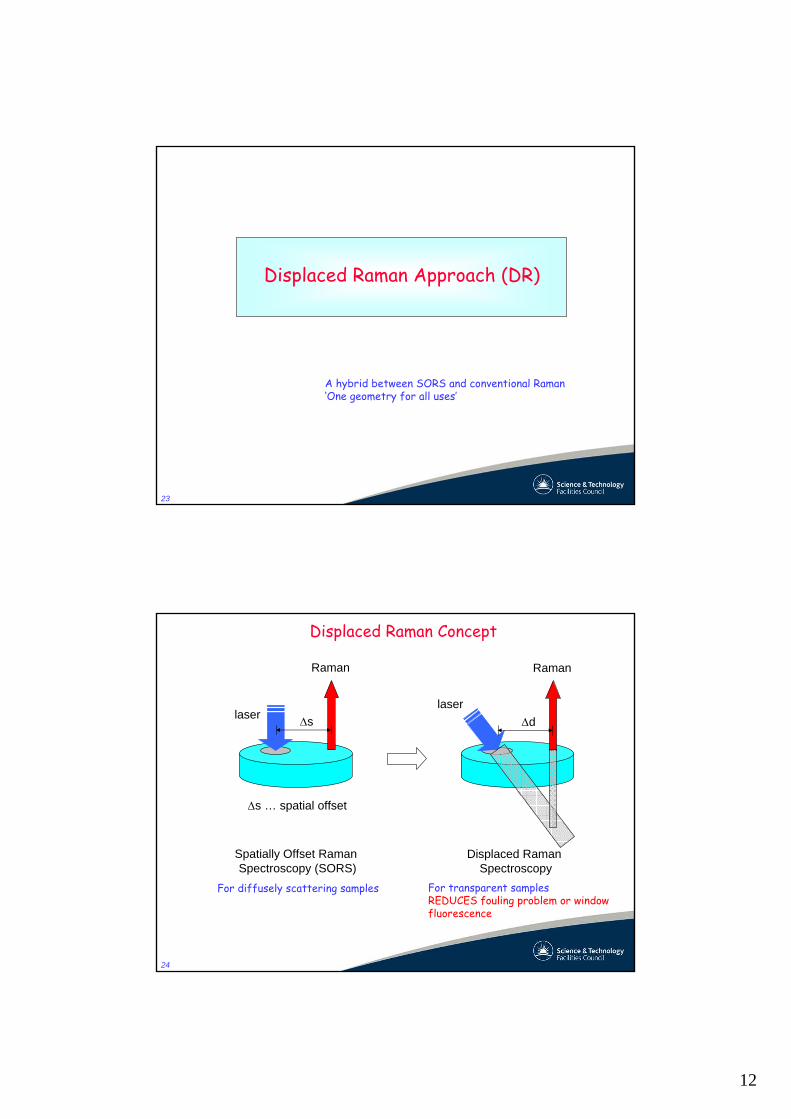
Displaced Raman Approach (DR)
A hybrid between SORS and conventional Raman‘One geometry for all uses’
24
laser
Raman
Δdlaser
Raman
Spatially Offset Raman Spectroscopy (SORS)
Δs
Δs … spatial offset
For diffusely scattering samples For transparent samplesREDUCES fouling problem or window fluorescence
Displaced Raman Spectroscopy
Displaced Raman Concept
13
25
Raman collectionsystem
spectrometer
CCD
laser
fibre bundle
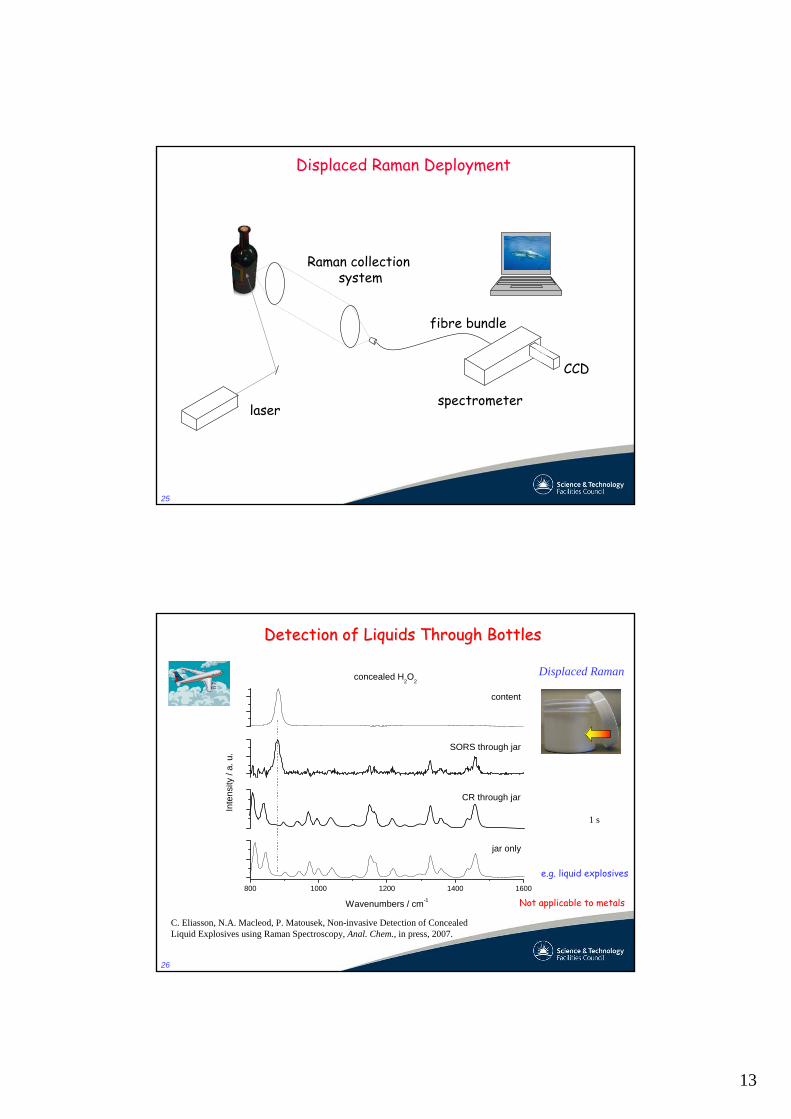
Displaced Raman Deployment
26
Detection of Liquids Through BottlesDetection of Liquids Through Bottles
Displaced Raman
800 1000 1200 1400 1600
Wavenumbers / cm-1
jar only
Inte
nsity
/ a.
u.
concealed H2O
2
SORS through jar
CR through jar
content
e.g. liquid explosives
Not applicable to metals
C. Eliasson, N.A. Macleod, P. Matousek, Non-invasive Detection of Concealed Liquid Explosives using Raman Spectroscopy, Anal. Chem., in press, 2007.
1 s
14
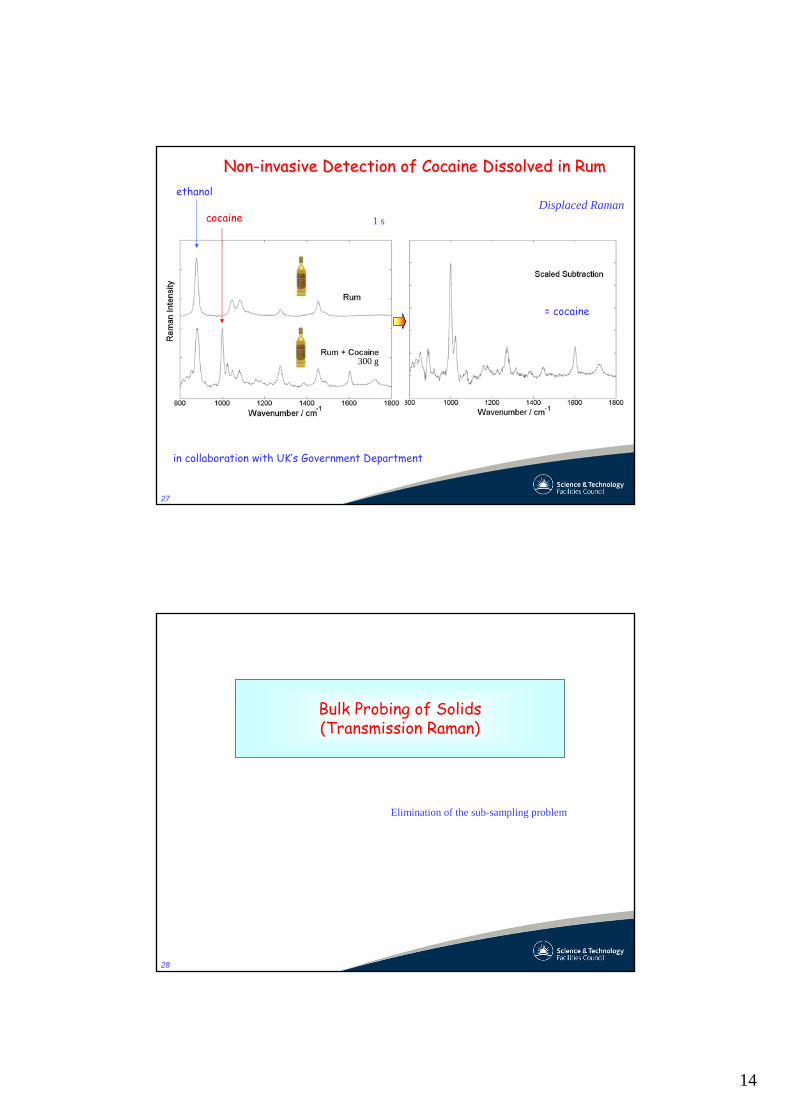
27
NonNon--invasive Detection of Cocaine Dissolved in Ruminvasive Detection of Cocaine Dissolved in Rumethanol
cocaine
300 g
Displaced Raman
in collaboration with UK’s Government Department
1 s
= cocaine
28
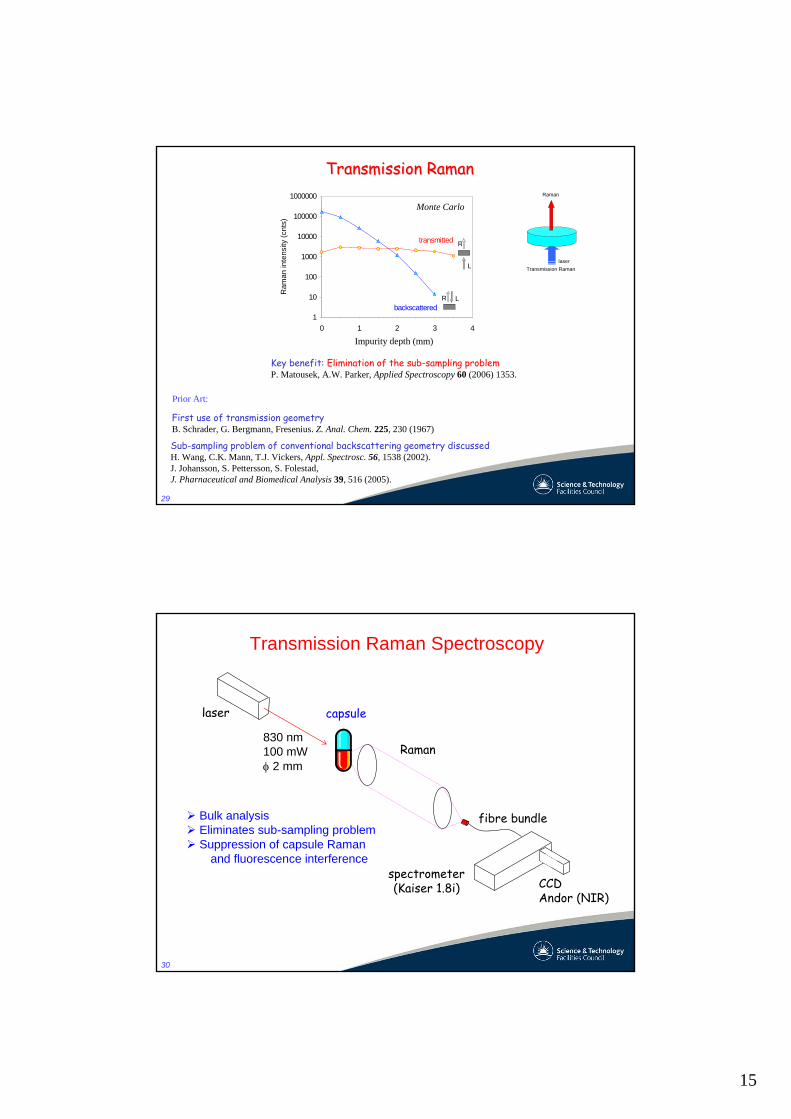
Bulk Probing of Solids(Transmission Raman)
Elimination of the sub-sampling problem
15
29
Transmission RamanTransmission Raman
First use of transmission geometryB. Schrader, G. Bergmann, Fresenius. Z. Anal. Chem. 225, 230 (1967)
Sub-sampling problem of conventional backscattering geometry discussedH. Wang, C.K. Mann, T.J. Vickers, Appl. Spectrosc. 56, 1538 (2002).J. Johansson, S. Pettersson, S. Folestad, J. Pharnaceutical and Biomedical Analysis 39, 516 (2005).
Key benefit: Elimination of the sub-sampling problemP. Matousek, A.W. Parker, Applied Spectroscopy 60 (2006) 1353.
1
10
100
1000
10000
100000
1000000
0 1 2 3 4d1 (mm)
Ram
an in
tens
ity (c
nts)
transmitted
backscatteredR L
L
R
Impurity depth (mm)
Monte Carlo
laser
Raman
Transmission Raman
Prior Art:
30
capsule
Raman
spectrometer(Kaiser 1.8i) CCD
Andor (NIR)
laser
fibre bundle
Transmission Raman Spectroscopy
Bulk analysisEliminates sub-sampling problemSuppression of capsule Raman
and fluorescence interference
830 nm100 mWφ 2 mm
16
31
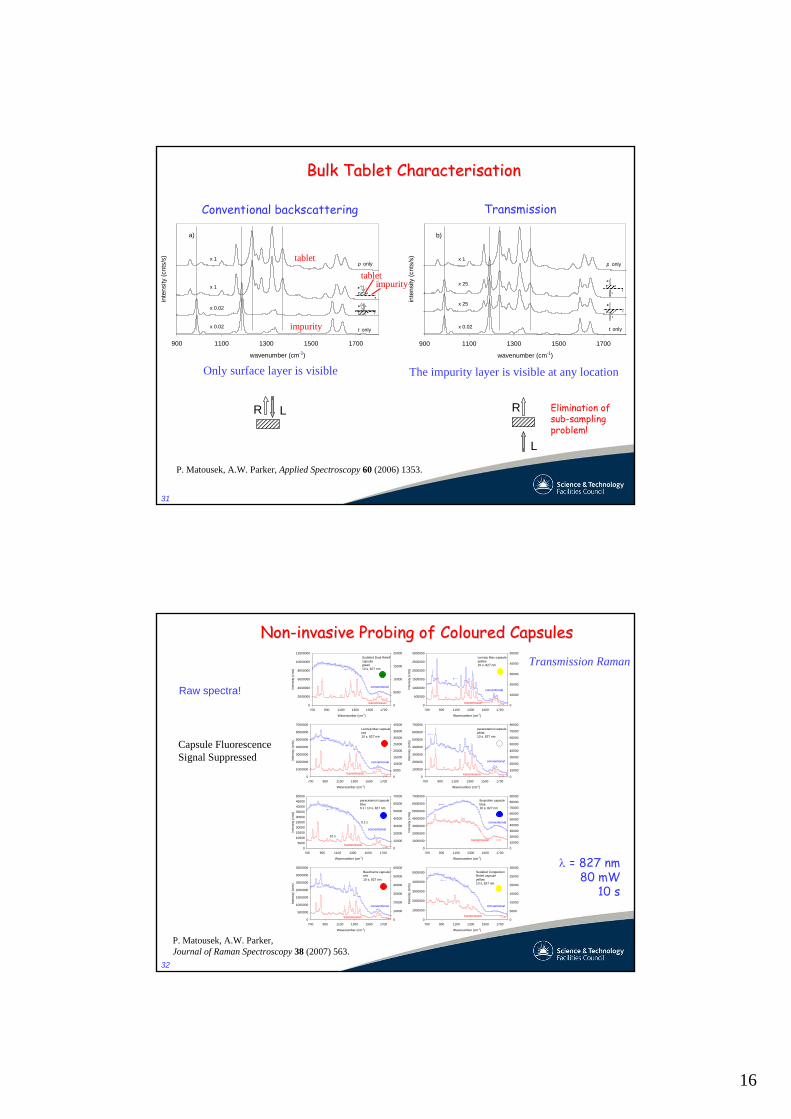
Bulk Tablet CharacterisationBulk Tablet Characterisation
P. Matousek, A.W. Parker, Applied Spectroscopy 60 (2006) 1353.
900 1100 1300 1500 1700
wavenumber (cm-1)
inte
nsity
(cnt
s/s)
b
a)
p only
t only
x 1
x 0.02
x 0.02
x 1 R L
P
T
R L
P
T
LR
P T
LR
P T
900 1100 1300 1500 1700
wavenumber (cm-1)
inte
nsity
(cnt
s/s)
b)
p only
t only
x 1
x 0.02
x 25
x 25L
R
P
TL
R
P
T
L
R
P T
L
R
P T
Conventional backscattering Transmission
The impurity layer is visible at any locationOnly surface layer is visible
R L
L
R
tablet impurity
tablet
impurity
Elimination of sub-sampling problem!
32
Raw spectra!0
2000000
4000000
6000000
8000000
10000000
12000000
700 900 1100 1300 1500 1700
Wavenumber (cm-1)
Inte
nsity
(cnt
s)
0
5000
10000
15000
20000
transmission
conventional
Sudafed Dual Releifcapsulegreen10 s, 827 nm
0
500000
1000000
1500000
2000000
2500000
3000000
700 900 1100 1300 1500 1700
Wavenumber (cm-1)
Inte
nsity
(cnt
s)
0
10000
20000
30000
40000
50000
conventional
Lemsip Max capsuleyellow10 s, 827 nm
transmission
0
1000000
2000000
3000000
4000000
5000000
6000000
7000000
700 900 1100 1300 1500 1700
Wavenumber (cm-1)
Inte
nsity
(cnt
s)
0
5000
10000
15000
20000
25000
30000
35000
40000
conventional
Lemsip Max capsulered10 s, 827 nm
transmission0
100000
200000
300000
400000
500000
600000
700000
700 900 1100 1300 1500 1700
Wavenumber (cm-1)
Inte
nsity
(cnt
s)
0
10000
20000
30000
40000
50000
60000
70000
80000
conventional
paracetamol capsulewhite10 s, 827 nm
transmission
05000
100001500020000250003000035000400004500050000
700 900 1100 1300 1500 1700
Wavenumber (cm-1)
Inte
nsity
(cnt
s)
0
10000
20000
30000
40000
50000
60000
70000
conventional
paracetamol capsuleblue0.1 / 10 s, 827 nm
0.1 s
10 s *
transmission0
1000000
2000000
3000000
4000000
5000000
6000000
7000000
700 900 1100 1300 1500 1700
Wavenumber (cm-1)
Inte
nsity
(cnt
s)
0
10000
20000
30000
40000
50000
60000
70000
80000
90000
conventional
Ibuprofen capsuleblue10 s, 827 nm
transmission
0
500000
1000000
1500000
2000000
2500000
3000000
3500000
700 900 1100 1300 1500 1700
Wavenumber (cm-1)
Inte
nsity
(cnt
s)
0
10000
20000
30000
40000
50000
60000
conventional
Beechams capsulered10 s, 827 nm
transmission0
1000000
2000000
3000000
4000000
5000000
700 900 1100 1300 1500 1700
Wavenumber (cm-1)
Inte
nsity
(cnt
s)
0
5000
10000
15000
20000
25000
30000
conventional
Sudafed CongestionRelief capsuleyellow10 s, 827 nm
transmission
λ = 827 nm80 mW
10 s
NonNon--invasive Probing of Coloured Capsulesinvasive Probing of Coloured Capsules
P. Matousek, A.W. Parker, Journal of Raman Spectroscopy 38 (2007) 563.
Transmission Raman
Capsule Fluorescence Signal Suppressed
17
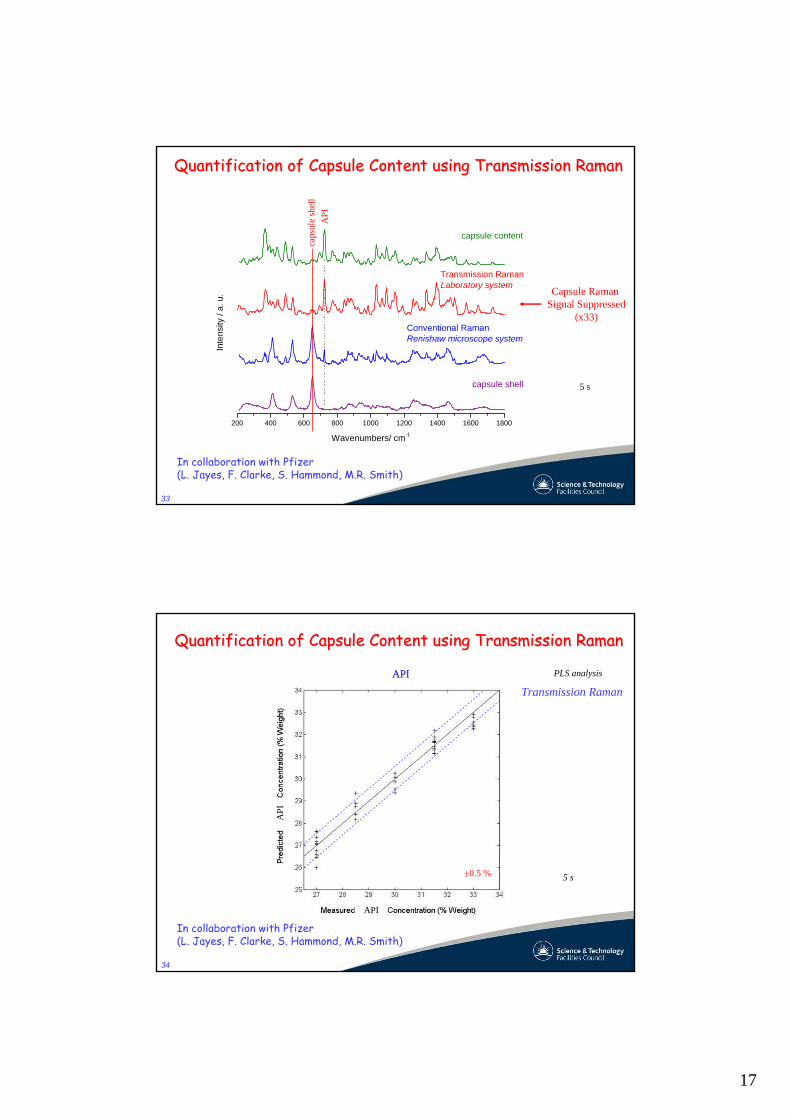
33
Quantification of Capsule Content using Transmission RamanQuantification of Capsule Content using Transmission Raman
200 400 600 800 1000 1200 1400 1600 1800
Inte
nsity
/ a.
u.
Wavenumbers/ cm-1
capsule shell
Conventional RamanRenishaw microscope system
Transmission RamanLaboratory system
capsule content
API
caps
ule
shel
l
Capsule Raman Signal Suppressed
(x33)
In collaboration with Pfizer(L. Jayes, F. Clarke, S. Hammond, M.R. Smith)
5 s
34
Quantification of Capsule Content using Transmission RamanQuantification of Capsule Content using Transmission Raman
PLS analysis
5 s
API
±0.5 %
API
API
API
±0.5 %
API
API
Transmission Raman
In collaboration with Pfizer(L. Jayes, F. Clarke, S. Hammond, M.R. Smith)
18
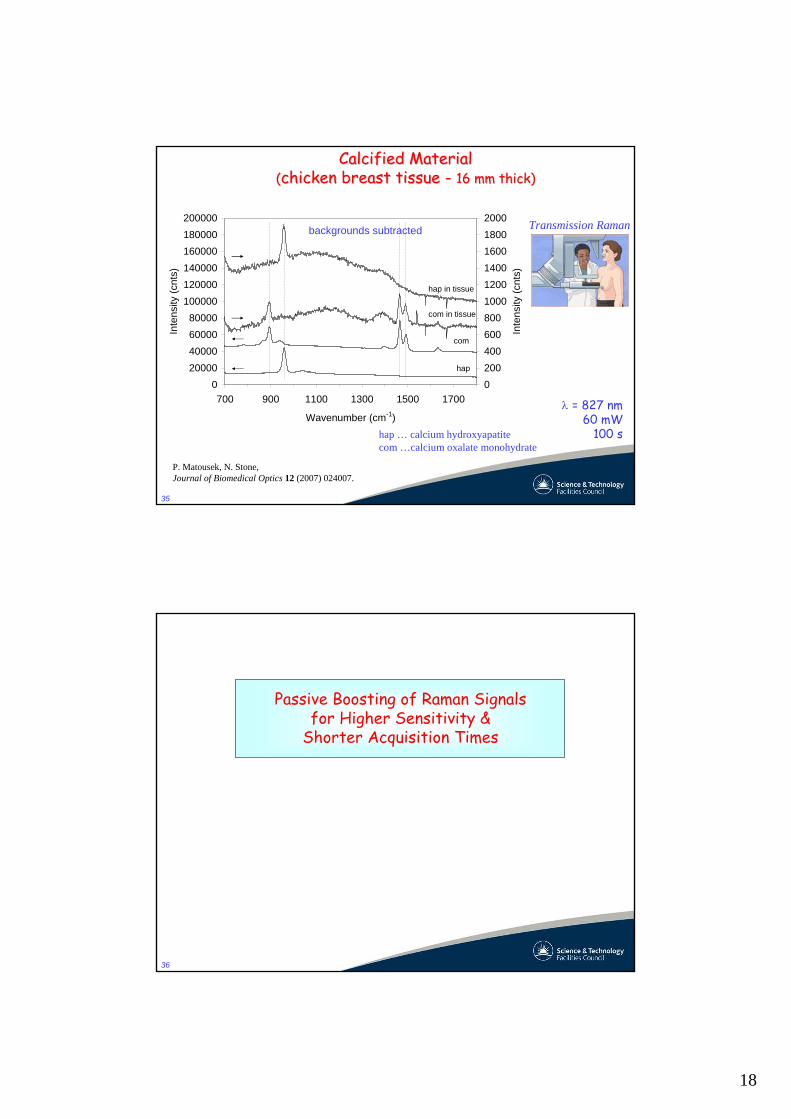
35
Calcified MaterialCalcified Material((chicken breast tissue chicken breast tissue -- 16 mm thick)16 mm thick)
backgrounds subtracted
020000400006000080000
100000120000140000160000180000200000
700 900 1100 1300 1500 1700
Wavenumber (cm-1)
Inte
nsity
(cnt
s)
0200400600800100012001400160018002000
Inte
nsity
(cnt
s)
hap
com
hap in tissue
com in tissue
b)
P. Matousek, N. Stone, Journal of Biomedical Optics 12 (2007) 024007.
hap … calcium hydroxyapatitecom …calcium oxalate monohydrate
λ = 827 nm60 mW
100 s
Transmission Raman
36
Passive Boosting of Raman Signals for Higher Sensitivity &
Shorter Acquisition Times
19
37
In most applications involving deep layer probing weak Raman signals are present with noise limiting the sensitivity and penetration depth.
For maximum sensitivity and penetration depth it is desirable toimprove S/N which can be accomplished by enhancing Raman signals.
Adjustable parameterseg acquisition timelaser powercollection efficiency (Kathryn Dooley, Talk #381, Wednesday)by other means ?????
Penetration Depth and Sensitivity are Typically Noise Limited.
Issues in Deep SpectroscopyIssues in Deep Spectroscopy
38
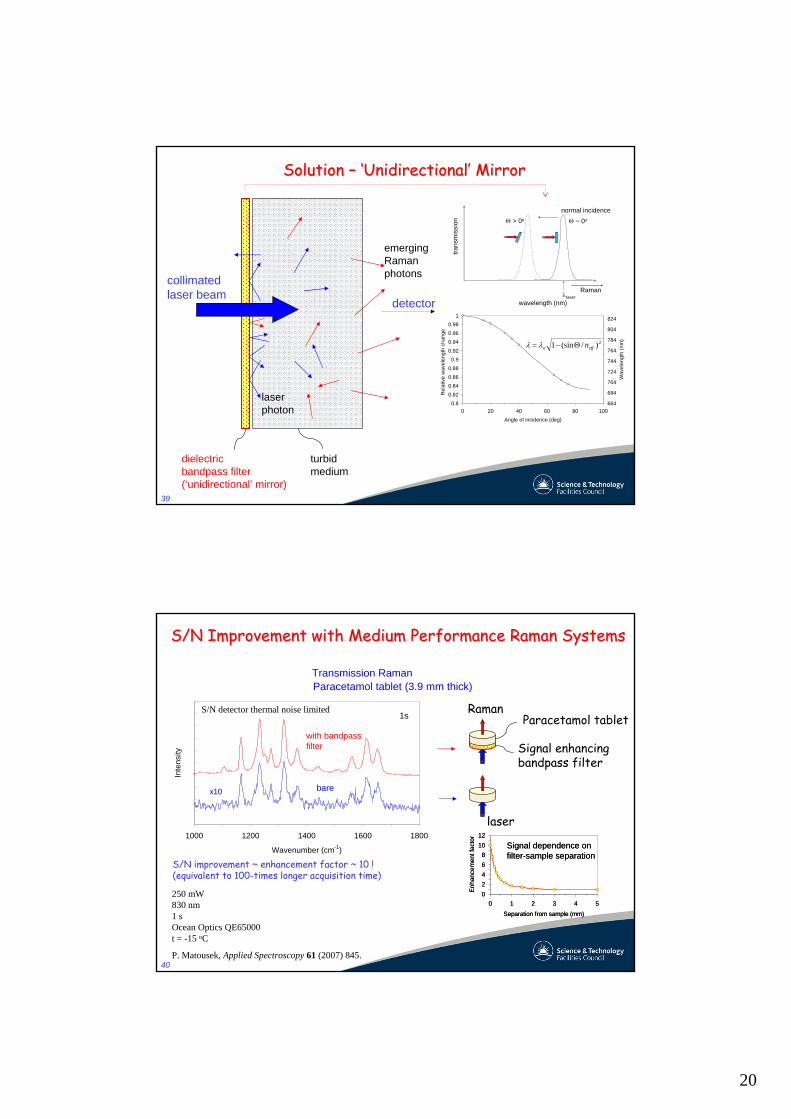
Problem of Coupling Laser Radiation into Turbid MediumProblem of Coupling Laser Radiation into Turbid Medium
kdkkdrakII oP coshsinh)( ++
=kdkkdra
kdrIJ oP coshsinh)(sinh
++=
11+
≈rd
II oP
rd
IJ oP 11
1
+≈
P. Kubelka, F. Munk, Z. Tech. Phys. 12, 593-601 (1931).B. Schrader, G. Bergmann, Fresenius. Z. Anal. Chem. 225 (1967) 230.
Loss of radiation at the coupling interface
r … scattering coefficient
Io
IpJP
0
0.2
0.4
0.6
0.8
1
0 20 40 60 80 100r.d
fract
ion
of in
cide
nt in
tens
ity re-radiated backwards
transmitted
J p
I p
Reflective enclosure solution:B. Schrader, G. Bergmann, Fresenius. Z. Anal. Chem. 225 (1967) 230.J.C. Henderson, Q. Su, R. Grobe, Laser Physics 14 (2004) 515.
d
20
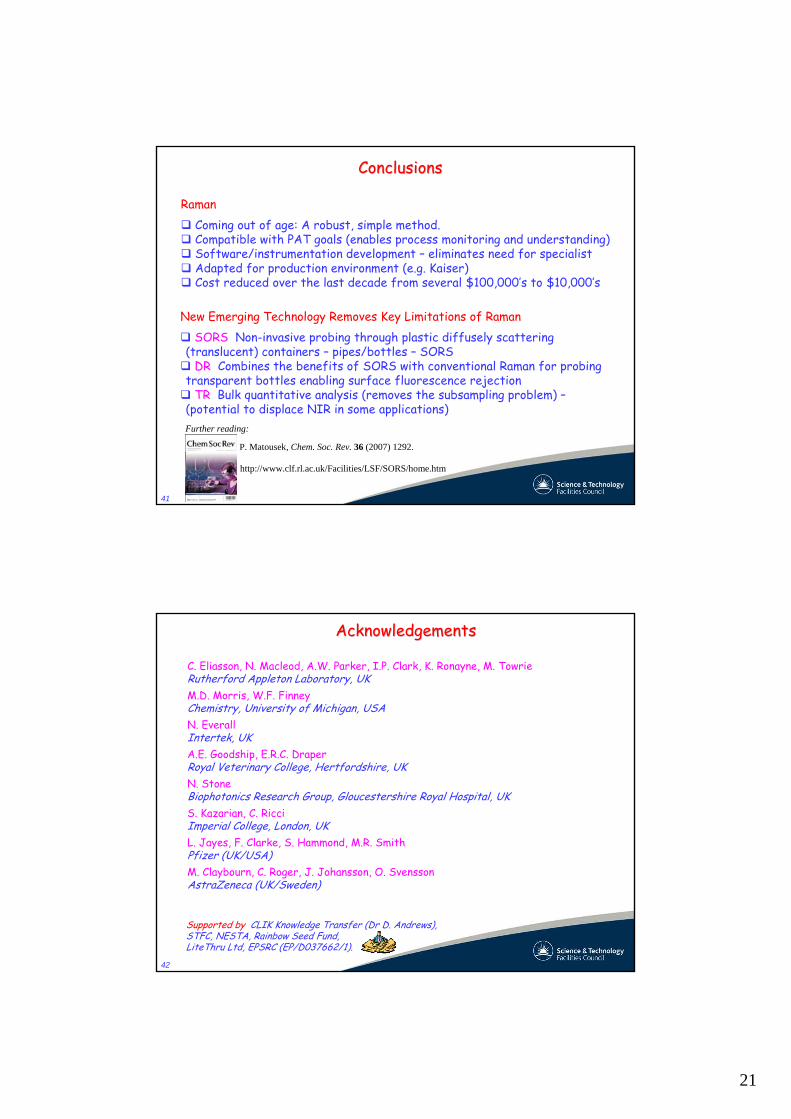
39
turbid medium
collimatedlaser beam
dielectricbandpass filter(‘unidirectional’ mirror)
laserphoton
emerging Raman photons
detector
Solution Solution –– ‘‘UnidirectionalUnidirectional’’ MirrorMirror
0.80.820.840.860.88
0.90.920.940.960.98
1
0 20 40 60 80 100Angle of incidence (deg)
Rel
ativ
e w
avel
engt
h ch
ange
S
664
684
704
724
744
764
784
804
824
Wav
elen
gth
(nm
)
trans
mis
sion
normal incidence
wavelength (nm)
Θ > 0o Θ ~ 0o
λlaserRaman
2)/(sin1 effo nΘ−= λλ
40
S/N Improvement with Medium Performance Raman SystemsS/N Improvement with Medium Performance Raman Systems
Signal enhancing bandpass filter
laser
RamanParacetamol tablet
Transmission RamanParacetamol tablet (3.9 mm thick)
S/N improvement ~ enhancement factor ~ 10 ! (equivalent to 100-times longer acquisition time)
S/N detector thermal noise limited
250 mW830 nm1 sOcean Optics QE65000t = -15 oC
1000 1200 1400 1600 1800
Wavenumber (cm-1)
Inte
nsity
x10 bare
with bandpass filter
1s
P. Matousek, Applied Spectroscopy 61 (2007) 845.
02468
1012
0 1 2 3 4 5Separation from sample (mm)
Enh
ance
men
t fac
tor
Signal dependence on filter-sample separation
02468
1012
0 1 2 3 4 5Separation from sample (mm)
Enh
ance
men
t fac
tor
Signal dependence on filter-sample separation
21
41
ConclusionsConclusions
RamanComing out of age: A robust, simple method.Compatible with PAT goals (enables process monitoring and understanding)Software/instrumentation development – eliminates need for specialistAdapted for production environment (e.g. Kaiser)Cost reduced over the last decade from several $100,000’s to $10,000’s
New Emerging Technology Removes Key Limitations of RamanSORS Non-invasive probing through plastic diffusely scattering
(translucent) containers – pipes/bottles – SORSDR Combines the benefits of SORS with conventional Raman for probing
transparent bottles enabling surface fluorescence rejection TR Bulk quantitative analysis (removes the subsampling problem) –
(potential to displace NIR in some applications)
P. Matousek, Chem. Soc. Rev. 36 (2007) 1292.
http://www.clf.rl.ac.uk/Facilities/LSF/SORS/home.htm
Further reading:
42
AcknowledgementsAcknowledgements
Supported by CLIK Knowledge Transfer (Dr D. Andrews), STFC, NESTA, Rainbow Seed Fund, LiteThru Ltd, EPSRC (EP/D037662/1).
C. Eliasson, N. Macleod, A.W. Parker, I.P. Clark, K. Ronayne, M. Towrie Rutherford Appleton Laboratory, UKM.D. Morris, W.F. FinneyChemistry, University of Michigan, USAN. EverallIntertek, UKA.E. Goodship, E.R.C. Draper Royal Veterinary College, Hertfordshire, UKN. StoneBiophotonics Research Group, Gloucestershire Royal Hospital, UKS. Kazarian, C. RicciImperial College, London, UKL. Jayes, F. Clarke, S. Hammond, M.R. SmithPfizer (UK/USA) M. Claybourn, C. Roger, J. Johansson, O. SvenssonAstraZeneca (UK/Sweden)