Embed Size (px)
Citation preview
Challenges and Opportunities in
Improving Cloud Service Reliability
and Availability
C. Qiao
(Computer Science and Engineering)
R. Ramesh and S. Smith
(Management Science and Systems)
Prior research funded in part by Google’s Faculty Research Award and by HDTRA1-09-1-0032
Cloud Technologies
• Basic infrastructure components: Physical servers (and virtual machines, aka VMs), racks, clusters
Power distribution units (PDUs) and cooling infrastructures
Switches, routers and datacenter networks
• Increasing adoption/reliance Providers: Amazon, Google, Microsoft, Rackspace, SaleForce…
Clients: individuals, and small to large companies/institutions
• Availability/reliability is a top concern cited by 67%, followed by device based security (66%) and cloud
application performance (60%).
Cisco Global Cloud Networking Survey, 2012.

Failures are all too common
• Frequent small-scale failures and infrequent large-scale failures • Typical first year for a new cluster (Jeff Dean, Google)
~0.5 overheating (power down most machines in <5 mins, ~1-2 days to
recover) ~1 PDU failure (~500-1000 machines suddenly disappear, ~6 hours to
come back) ~20 rack failures (40-80 machines instantly disappear, 1-6 hours to get
back) ~5 racks go wonky (40-80 machines see 50% packetloss) ~3 router failures (have to immediately pull traffic for an hour) ~dozens of minor 30-second blips for DNS ~1000 individual machine failures ~thousands of hard drive failures
3

Failures cost too much
http://www.emersonnetworkpower.com/en-US/About/NewsRoom/Pages/2011DataCenterState.aspx
Why Current Cloud Services Are Flawed
• Current Service Level Agreement (SLA) is loosely defined in terms of availability/reliability measurements.
• Penalty term is not user-friendly. The refund is usually issued in the form of credit with a lot of exclusions.
Amazon EC2 will refund the user in the form of credit if fail to meet the SLA.
Rackspace will credit the user 5% month fee for each 30 mins network/infrastructure downtime, up to 100% monthly fee of the affected server.
• Lack of high availability/reliability guarantee for critical services
Cannot guarantee 3-9’s, let alone 5-9’s as in Telco networks.
Amazon EC2 will refund the user in the form of credit if fail to meet the SLA. Rackspace will credit the user 5% month fee for each 30 mins network/infrastructure downtime, up to 100% monthly fee of the affected server.
Key Challenges and Solutions
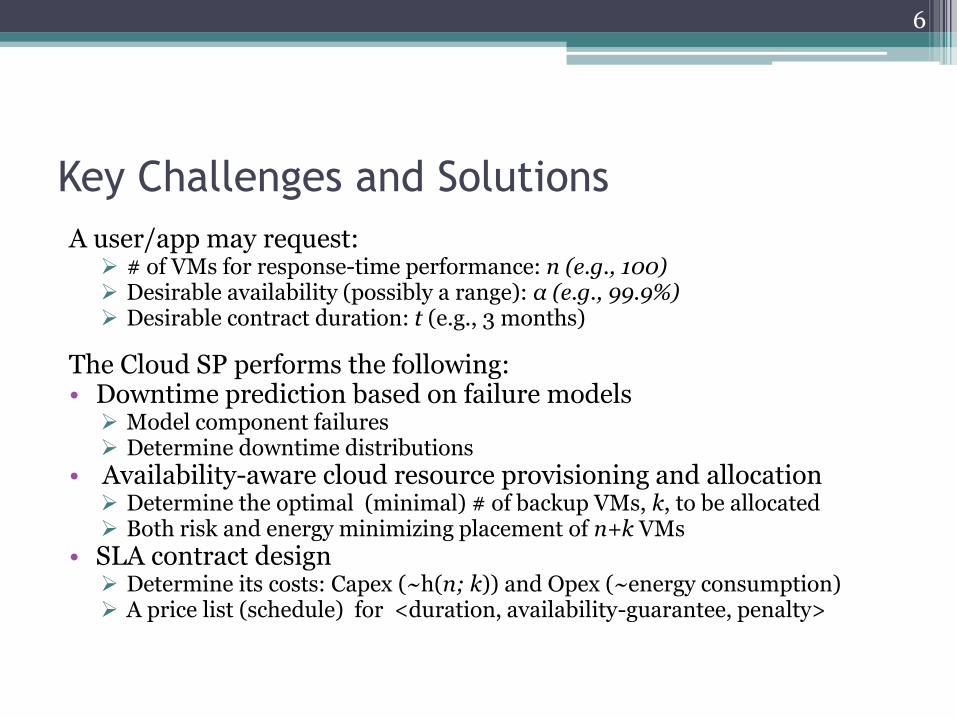
A user/app may request: # of VMs for response-time performance: n (e.g., 100) Desirable availability (possibly a range): α (e.g., 99.9%) Desirable contract duration: t (e.g., 3 months)
The Cloud SP performs the following: • Downtime prediction based on failure models
Model component failures Determine downtime distributions
• Availability-aware cloud resource provisioning and allocation Determine the optimal (minimal) # of backup VMs, k, to be allocated Both risk and energy minimizing placement of n+k VMs
• SLA contract design Determine its costs: Capex (~h(n; k)) and Opex (~energy consumption) A price list (schedule) for <duration, availability-guarantee, penalty>
6
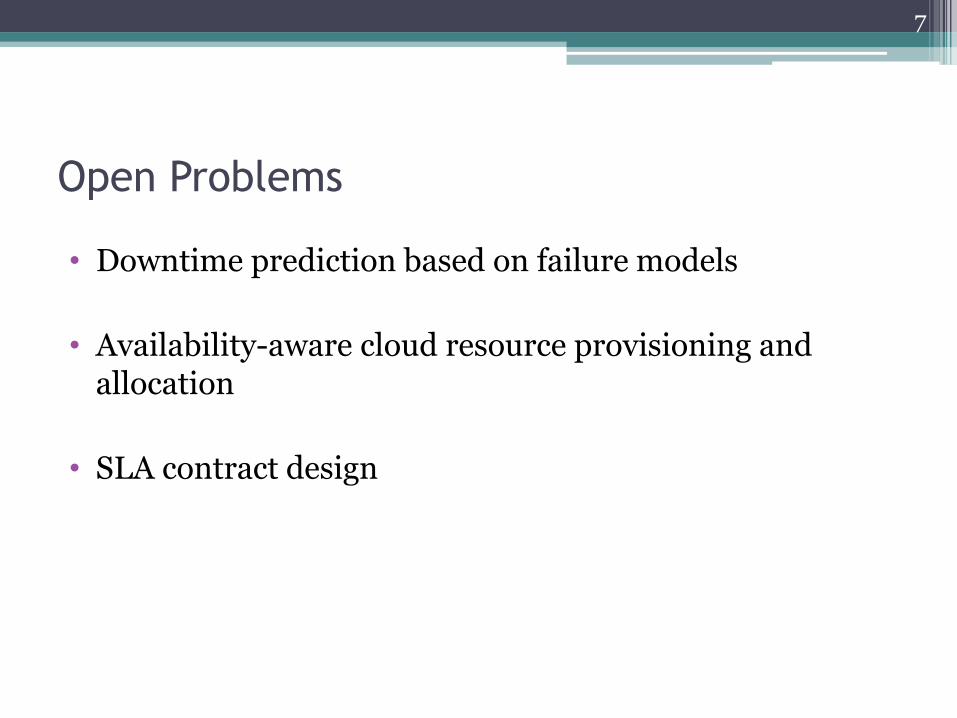
Open Problems
• Downtime prediction based on failure models
• Availability-aware cloud resource provisioning and allocation
• SLA contract design
7
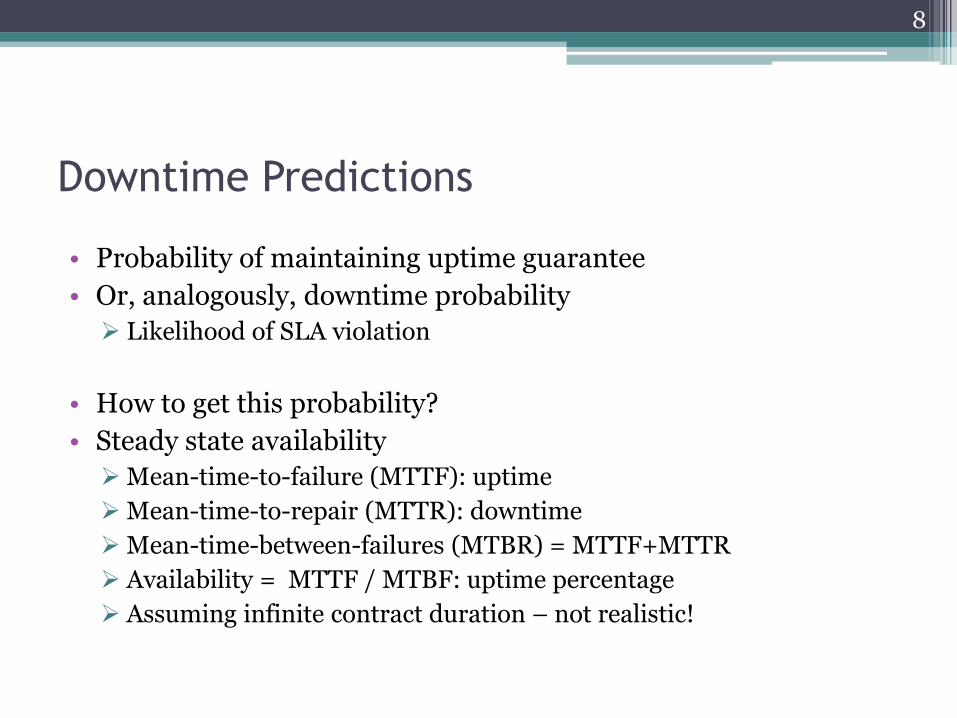
Downtime Predictions
• Probability of maintaining uptime guarantee
• Or, analogously, downtime probability
Likelihood of SLA violation
• How to get this probability?
• Steady state availability
Mean-time-to-failure (MTTF): uptime
Mean-time-to-repair (MTTR): downtime
Mean-time-between-failures (MTBR) = MTTF+MTTR
Availability = MTTF / MTBF: uptime percentage
Assuming infinite contract duration – not realistic!
8

Our Research Contributions
• Closed-form analytical solution of downtime probability density function (or pdf)
Existing work requires one to iteratively compute an estimated pdf (de Souza de Silva and Mello 1986)
• Two distinct estimation methods using sample path analysis
Computational method utilizing the limiting behavior of birth-death process - extremely time-consuming
Statistical sampling approach – our approach
9
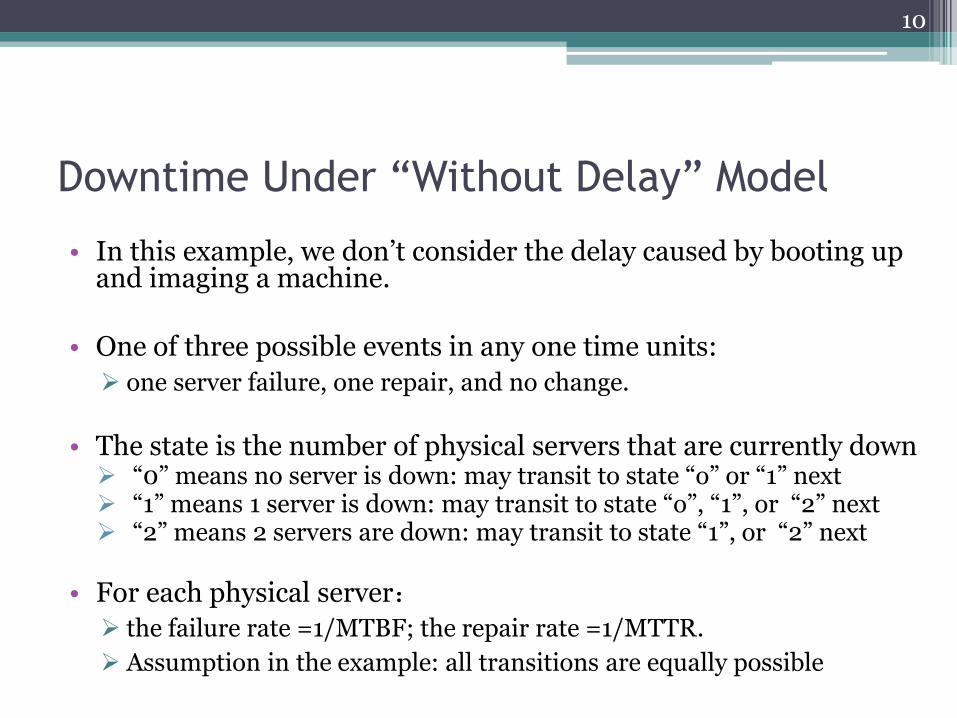
Downtime Under “Without Delay” Model
• In this example, we don’t consider the delay caused by booting up and imaging a machine.
• One of three possible events in any one time units:
one server failure, one repair, and no change.
• The state is the number of physical servers that are currently down “0” means no server is down: may transit to state “o” or “1” next “1” means 1 server is down: may transit to state “o”, “1”, or “2” next “2” means 2 servers are down: may transit to state “1”, or “2” next
• For each physical server:
the failure rate =1/MTBF; the repair rate =1/MTTR.
Assumption in the example: all transitions are equally possible
10
11
0
0 1
0 1
0 1 0 2 1
1 2 0
0 1 0 2 1 1 2
1
2
1
3
Dt
2Dt
3Dt
4Dt1
8
1
8
1
12
1
12
1
12
1
12
1
12
1
18
1
18
1
18
1
12
1
12time
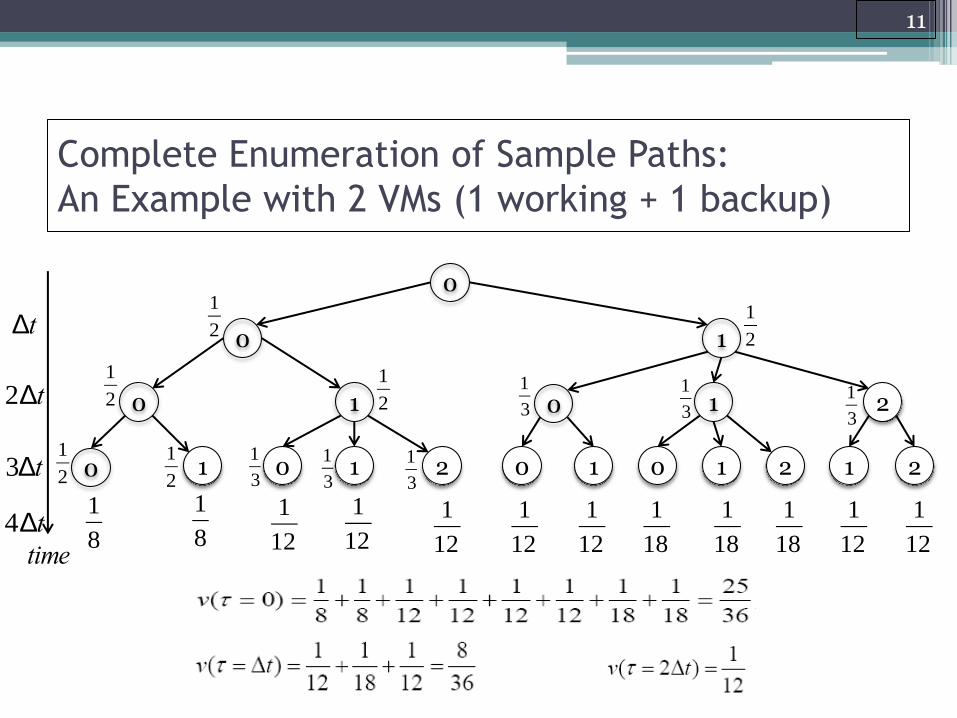
Complete Enumeration of Sample Paths:
An Example with 2 VMs (1 working + 1 backup)
1
2
1
2
1
2
1
2
1
2
1
3
1
3
1
3
1
31
3
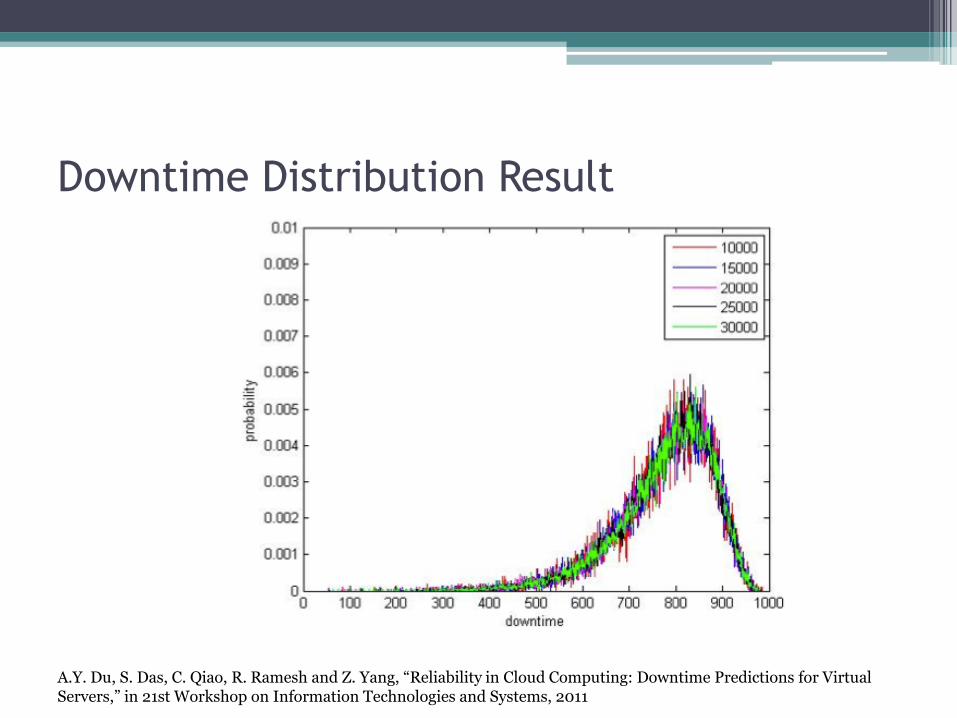
Downtime Distribution Result
A.Y. Du, S. Das, C. Qiao, R. Ramesh and Z. Yang, “Reliability in Cloud Computing: Downtime Predictions for Virtual Servers,” in 21st Workshop on Information Technologies and Systems, 2011
Availability-aware cloud resource
provisioning and allocation
• Provider strategy
Allocate additional backup VMs
If a client demands n VMs but is allocated k additional VMs, downtime occurs only if at least k+1 VMs are down.
• How many backup VMs to provide?
Over-provisioning ? (increases cots and reduced profit) or
Under-provisioning? (violate SLA and pays a penalty)
• How/where to place these n+k VMs?
Same server, or same rack (saves energy, reduces costs) or
Different servers/racks (more failure/risk tolerant)
13
Optimal Backup Provisioning Model
• Expected Total Cost = Provisioning Cost ℎ 𝑛; 𝑘 * t + Expected Penalty 𝜋 ∗ (expected penalizable downtime)
h is an increasing function of k, while downtime is a decreasing function of k.
Can reduce penalty by providing more backup VMs, however this entails a larger provisioning cost
Trade-offs between provisioning cost and the expected penalty
• To find a closed form solution, we need a differentiable functional form of the downtime distribution.
No good fitting on actual downtime distributions (using e.g. Exponential, Gamma, Weibull, log normal distributions)
Derived a piece-wise linear approximation of the downtime distribution using a method developed by Wang and Chaovalitwongse
14
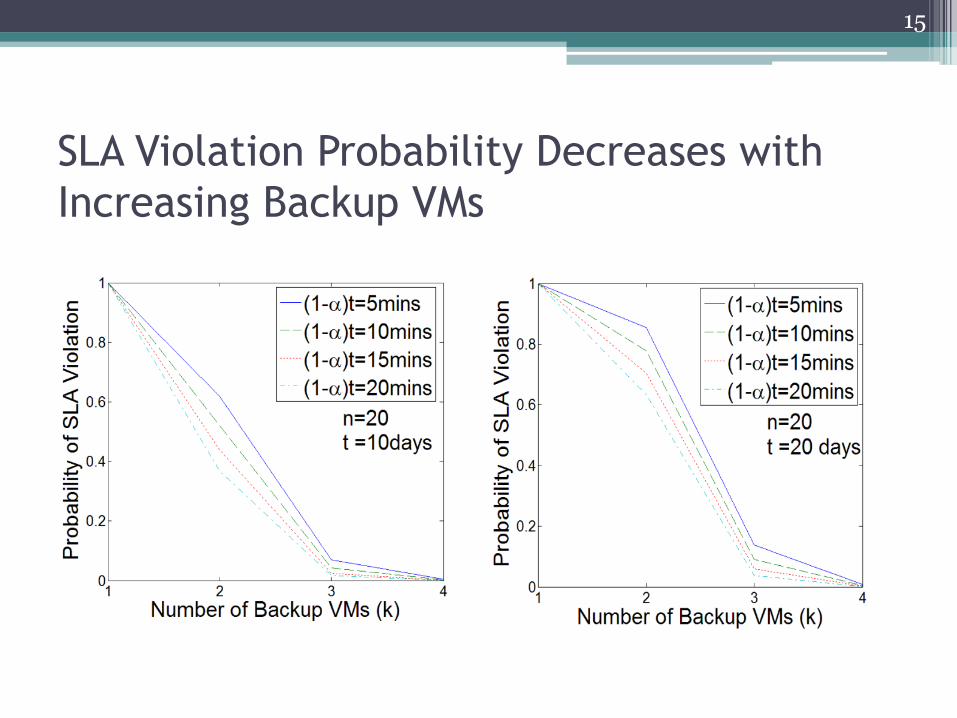
SLA Violation Probability Decreases with
Increasing Backup VMs
15

Risk-Energy-Minimizing (REM) VM Placement
• Cost of a typical datacenter is dominated by server cost and energy cost.
• Distributing the VMs among different servers/racks can lower the risk of SLA violation due to failures of servers and Top-of-Rack (ToR) switches
the risk can be characterized by the normalized deviation of the number of available/accessible VMs.
• However, it will increase the energy cost as one need to power up more servers and racks.
Two Extreme VM Placement Strategies
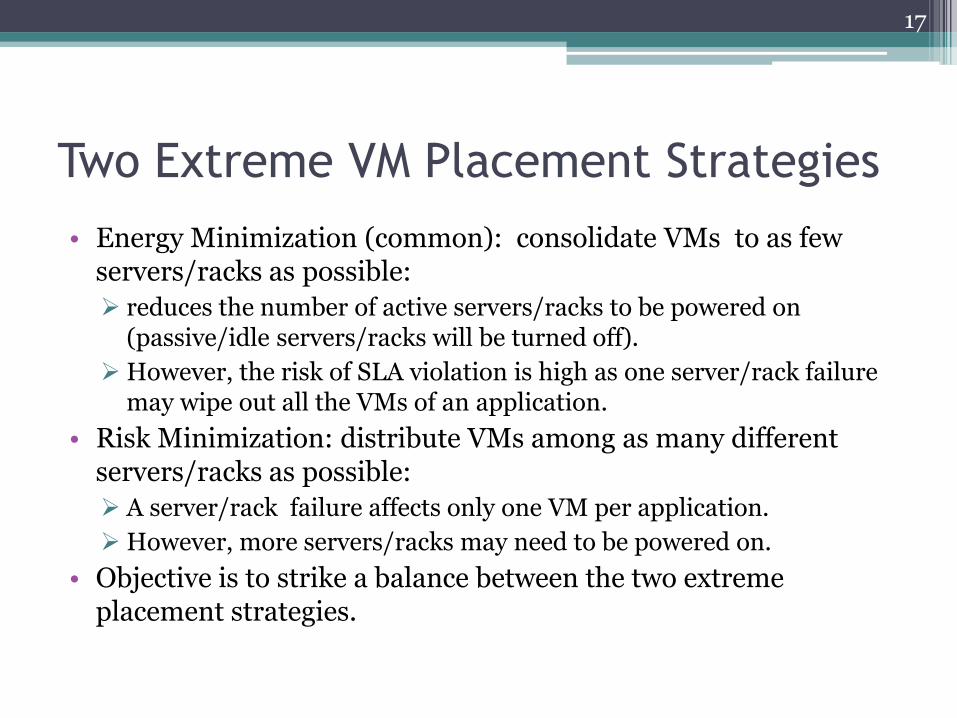
• Energy Minimization (common): consolidate VMs to as few servers/racks as possible:
reduces the number of active servers/racks to be powered on (passive/idle servers/racks will be turned off).
However, the risk of SLA violation is high as one server/rack failure may wipe out all the VMs of an application.
• Risk Minimization: distribute VMs among as many different servers/racks as possible:
A server/rack failure affects only one VM per application.
However, more servers/racks may need to be powered on.
• Objective is to strike a balance between the two extreme placement strategies.
17
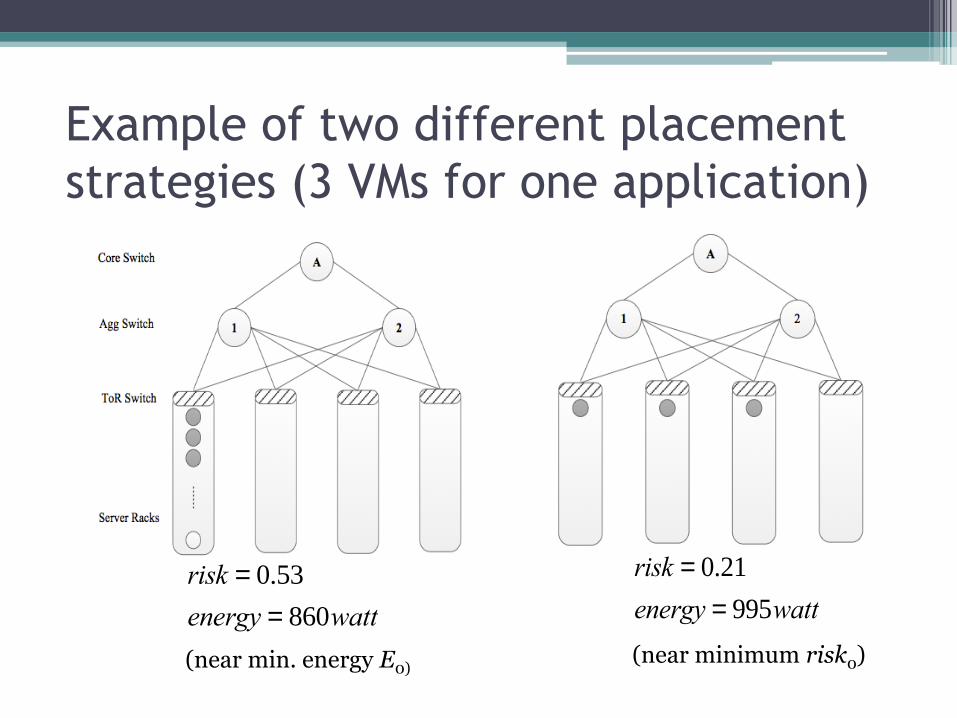
Example of two different placement
strategies (3 VMs for one application)
risk = 0.53
energy = 860watt
risk = 0.21
energy = 995watt
(near min. energy E0) (near minimum risk0)

Optimization Objective Function
• Characterize the risk of violating the availability requirement for application i
• Objective function and constraints
subject to:
θ is the weight parameter assigned to energy
server capacity limitation
each VM mapped to exactly one server

Heuristic Algorithms (Offline & Online)
• Offline (Batch) Algorithm: Pack-Then-Distribute (PTD) Consolidate VMs as much as possible first to obtain minimum energy
consumption E0.
Then move select VMs to different servers/racks to reduce risk, and
the overall objective function value.
• Online (Per Request) Algorithm: mimics PTD Tries to “learn” the number of servers/racks needed for a given
request for n VMs from PTD.
Then map the VMs to that many servers/racks in an energy-efficient
manner.
• Both compare favorably with existing approaches.
20
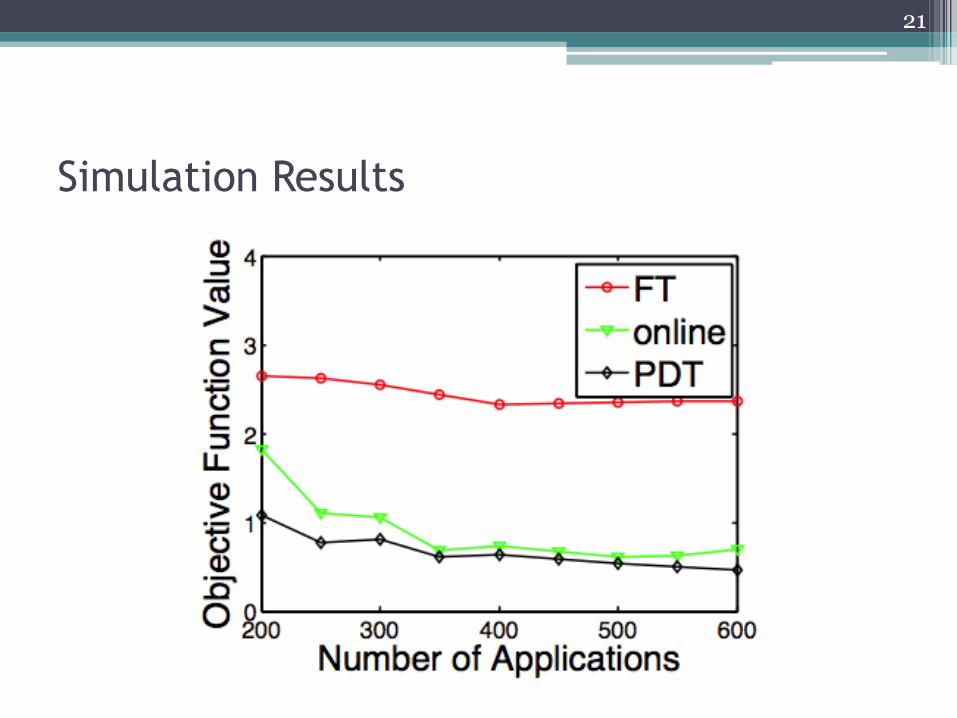
Simulation Results
21
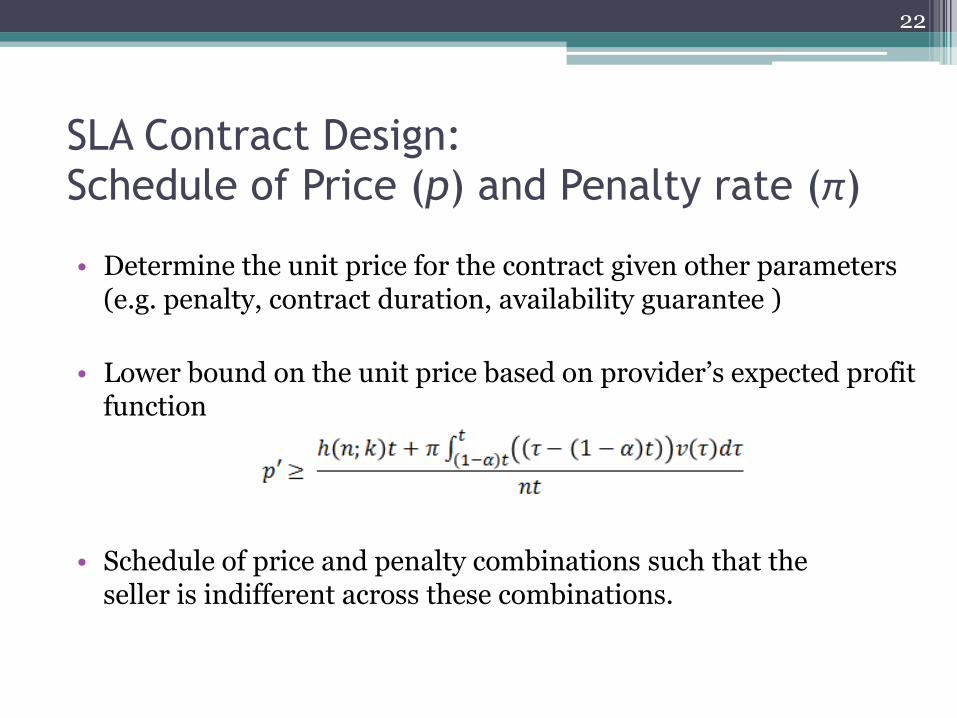
SLA Contract Design: Schedule of Price (p) and Penalty rate (π)
• Determine the unit price for the contract given other parameters (e.g. penalty, contract duration, availability guarantee )
• Lower bound on the unit price based on provider’s expected profit function
22
• Schedule of price and penalty combinations such that the seller is indifferent across these combinations.
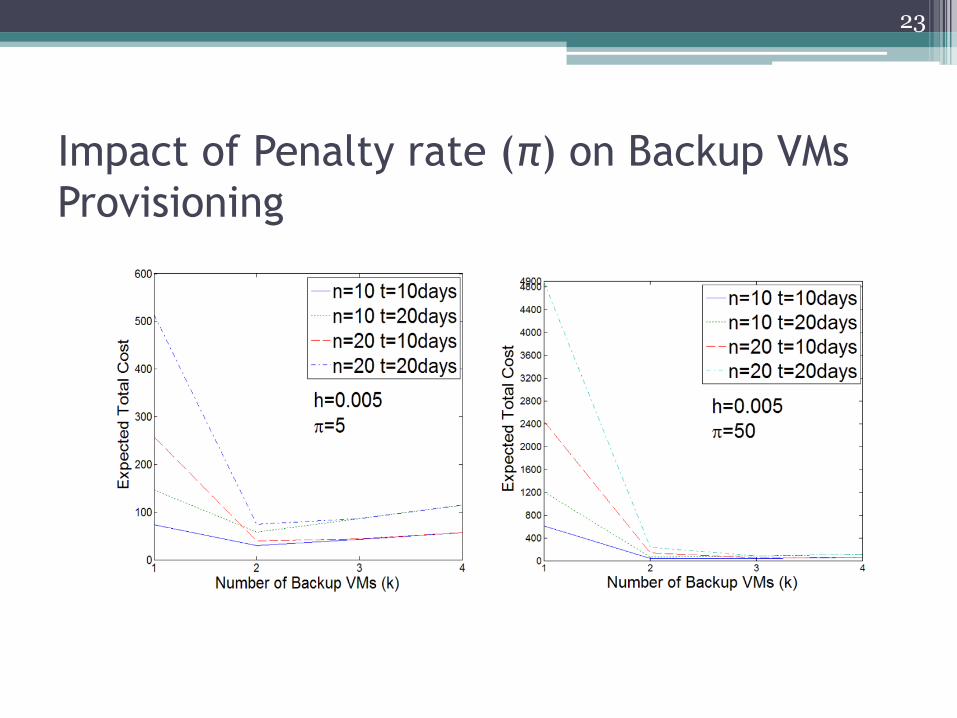
Impact of Penalty rate (π) on Backup VMs
Provisioning
23
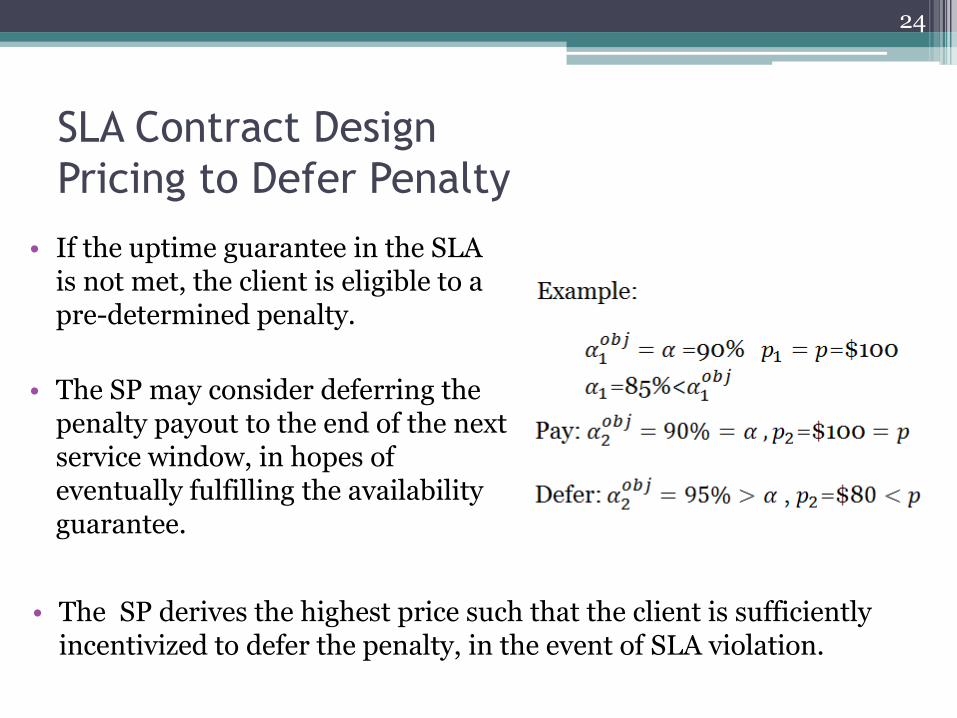
SLA Contract Design
Pricing to Defer Penalty
24
• The SP derives the highest price such that the client is sufficiently incentivized to defer the penalty, in the event of SLA violation.
• If the uptime guarantee in the SLA is not met, the client is eligible to a pre-determined penalty.
• The SP may consider deferring the penalty payout to the end of the next service window, in hopes of eventually fulfilling the availability guarantee.
Concluding Remarks
• Availability in cloud computing very important
Has not received sufficient attention
Existing approaches not effective and need overhaul
Impedes many applications / business opportunities
• Key challenges and promising solutions Downtime prediction based on failure models
Availability-aware VM provisioning and placement
SLA contract design for pricing, availability guarantee, penalty and duration
• Need multidisciplinary and university-industry collaboration
25

More Information • Our Publications
A.Y. Du, S. Das, C. Qiao, R. Ramesh and Z. Yang, “Reliability in Cloud Computing:
Downtime Predictions for Virtual Servers,” in 21st Workshop on Information Technologies and Systems (WITS), 2011.
A.Y. Du, S. Das, C. Qiao, R. Ramesh and Z. Yang, “Downtime Predictions for Virtual Servers: A Study under Two Checkpointing Scenarios,” in Conf. on Info. Systems and Technology (CIST), 2012.
Yuan, S., Das, S., Du, A.Y., Ramesh, R. and Qiao, C., “Cloud Resource Provisioning and Contract Adjustment in the Backdrop of SLA Violation Risk Mitigation”, Conference on Information Systems and Technology (CIST 2013), Minneapolis, MN.
• Contact: Chunming Qiao
CSE Department, SUNY Buffalo [email protected]
26