Embed Size (px)
Citation preview

Challenges and Opportunities of the North American Petroleum Renaissance
Trisha Curtis, Director of Research, Upstream and Midstream Lou Pugliaresi, President Energy Policy Research Foundation, Inc. (EPRINC) Imperial College November 21st, 2013
Justin Kringstad Trisha Curtis

EPRINC Overview
• Established in 1944
• Publishes original research on oil and gas developments
• Routinely testifies before Congress, consults with U.S. and other Gov’t officials
• Brief policymakers, Hill staff on relevant energy topics
• Presents finding through industry and public forums, universities and think tanks
• Engagement with Washington Diplomatic Community – EPRINC Embassy Series
EPRINC’s PRIMARY MISSION IS TO EVALUATE THE INTERACTION OF PETROLEUM ECONOMICS AND PUBLIC POLICY
2

EPRINC Embassy Series
3
Photo by Yulan Guo

4
0
2
4
6
8
10
12
14
16
18
20
2013 2015 2017 2019 2021 2023
Mill
ion
Bar
rels
p
er
Day
Importance of the North American Lens
Saudi Arabia
Russia
USA
Iraq
Canada
N. America
Source: Wood Mackenzie (includes NGLs)

5
Source: EIA, EPRINC Calculations
U.S. Imports of Crude Oil and Petroleum Products as a Percent of GNP

6
Major Global Challenge: Managing OPEC Spare Capacity millions of barrels/day
Tight oil and Iraq are wild cards
here Regional Rivalries
and Downside Price Risk

Outline
7
Source: EIA
1. Breakdown of U.S. and Canadian Oil Production
2. Infrastructure Challenges in Moving Rising Volumes of North American Crude Oil
3. Regulatory Concerns and Conclusions

North American Oil Production
8
Source: EIA
0
2000
4000
6000
8000
10000
12000
Tho
usa
nd
Bar
rels
Pe
r D
ay
CanadianProduction ofCrude Oil
U.S. FieldProduction ofCrude Oil
August U.S. Oil Production 7.5 mbd
June Canadian Oil Production 3.7 mbd

0
1
2
3
4
5
6
2008 2009 2010 2011 2012 2013 2014 2015 2016 2017 2018 2019 2020 2021 2022
Mill
ion
Bar
rels
Per
Day
Periphery
Permian
Eagle Ford
Bakken
EPRINC’s Forecast for Major U.S. Shale Plays
Source: HPDI data with EPRINC forecast estimates
EPRINC forecasts an additional 1.5 mbd by 2022
9

CAPP 2013 Updated Production Forecast
10
Source: CAPP
0
1,000
2,000
3,000
4,000
5,000
6,000
7,000
8,000
Tho
usa
nd
s o
f B
arre
ls p
er
Day
Mining
In Situ
Conventional Light
Conventional Heavy
Over 3 mbd increase by 2030

0
2000
4000
6000
8000
10000
12000
Tho
usa
nd
Bar
rels
Pe
r D
ay
U.S. Importsfrom Canada ofCrude Oil
U.S. FieldProduction ofCrude Oil
U.S. Imports ofCrude Oil
11
U.S. Total Imports, U.S. Production, U.S. Canadian Imports
Source: EIA
U.S. Imports 7.8 mbd U.S. Production 7.5 mbd
Canadian Imports 2.6 mbd
12
U.S. Activity

Source: HPDI September 2013, Past 90 Days
Williston
Basin
Powder River
Basin
Uinta
Basin
DJ Basin (Niobrara Reservoir)
Anadarko Basin
(Mississippian, Granite
Wash, Mississippi Lime
and other stacked plays)
Permian
Basin
Eagle Ford
Reservoir
Utica
Permit Activity
13

14
Drilling Then and Now
Source: From PIECE Course Workbook, Mark J Kaiser, Houston, July 2008, “Introduction to USA Petroleum Industry”
Source Rocks
14

15
North American Potential…Shale Oil Plays
15

16
So how much oil is there…?
Source: EPRINC
16

State Production Trends
17
Source: EIA
0
500
1000
1500
2000
2500
3000
Jan
-81
Ap
r-8
2
Jul-
83
Oct
-84
Jan
-86
Ap
r-8
7
Jul-
88
Oct
-89
Jan
-91
Ap
r-9
2
Jul-
93
Oct
-94
Jan
-96
Ap
r-9
7
Jul-
98
Oct
-99
Jan
-01
Ap
r-0
2
Jul-
03
Oct
-04
Jan
-06
Ap
r-0
7
Jul-
08
Oct
-09
Jan
-11
Ap
r-1
2
Jul-
13
Tho
usa
nd
Bar
rels
Per
Day
North Dakota FieldProduction of CrudeOil Mbbl/d
Alaska FieldProduction of CrudeOil Mbbl/d
Colorado FieldProduction of CrudeOil Mbbl/d
California FieldProduction of CrudeOil Mbbl/d
New Mexico FieldProduction of CrudeOil Mbbl/d
Texas FieldProduction of CrudeOil Mbbl/d

Source: Baker Hughes
18
U.S. Rig Count
0
500
1000
1500
2000
2500
# o
f R
igs
Oil
Gas
Total

U.S. Rig Activity by Drill Type
19
Source: HPDI Nov 2013 – Not 100% Complete
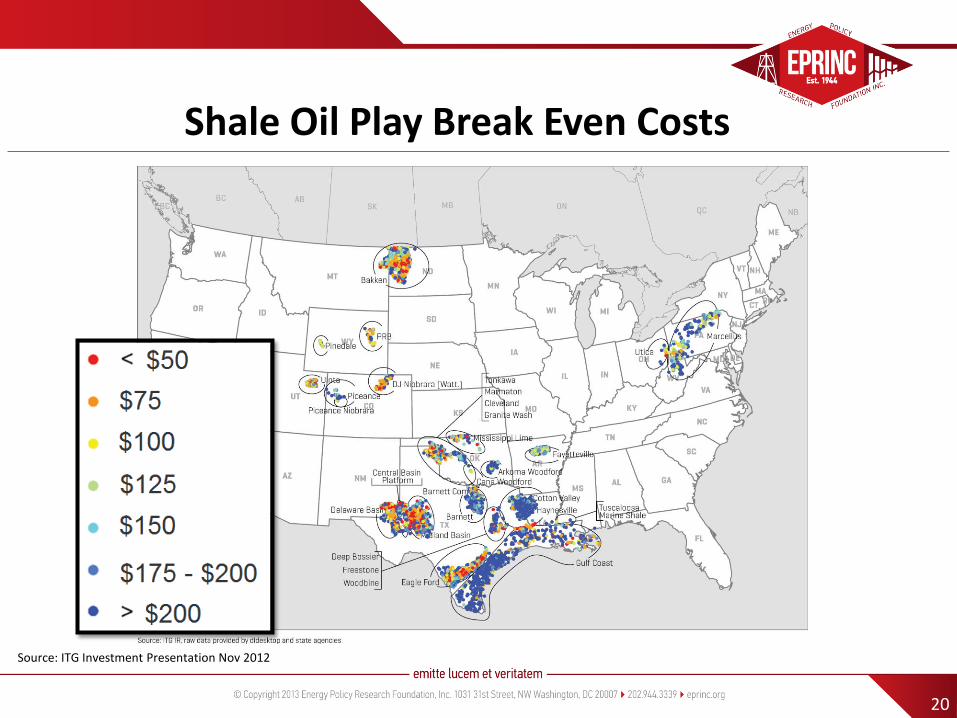
20
Source: ITG Investment Presentation Nov 2012
Shale Oil Play Break Even Costs
20

Source: NationalAtlas.gov
21
U.S. Federal Land Map

22
The Soaring Eagle Ford

23
Geology of the Eagle Ford
Source: Momentum Oil and Gas LLC, DUG Eagle Ford Conference Presentation Oct 2011

24
Source: HPDI Nov 2013
Eagle Ford Wells

25
Eagle Ford Production
Source: HPDI Nov 2013
0
500000
1000000
1500000
2000000
2500000
3000000
3500000
4000000
4500000
0
200000
400000
600000
800000
1000000
1200000
12
/1/1
999
7/1
/20
00
2/1
/20
01
9/1
/20
01
4/1
/20
02
11
/1/2
002
6/1
/20
03
1/1
/20
04
8/1
/20
04
3/1
/20
05
10
/1/2
005
5/1
/20
06
12
/1/2
006
7/1
/20
07
2/1
/20
08
9/1
/20
08
4/1
/20
09
11
/1/2
009
6/1
/20
10
1/1
/20
11
8/1
/20
11
3/1
/20
12
10
/1/2
012
5/1
/20
13
Bar
rels
Per
Day
LIQ
GAS

26
The Prolific Permian Basin

27
Breakdown of the Permian Basin Province
Source: Permian Basin. Map. Encyclopædia Britannica Online. Web. 17 Jan. 2012. <http://www.britannica.com/EBchecked/media/94328/Map-of-the-
basins-reefs-and-platforms-that-make-up>.

Permian Basin Stratigraphy
28
Source: Concho Resources 2nd Quarter 2013 Investor Presentation

Permian Basin Production 1.3 mbd
29
Source: HPDI Oct 2013
0
1000000
2000000
3000000
4000000
5000000
6000000
7000000
8000000
0
200000
400000
600000
800000
1000000
1200000
1400000
1600000
1800000
2000000
1/1
/19
80
1/1
/19
81
1/1
/19
82
1/1
/19
83
1/1
/19
84
1/1
/19
85
1/1
/19
86
1/1
/19
87
1/1
/19
88
1/1
/19
89
1/1
/19
90
1/1
/19
91
1/1
/19
92
1/1
/19
93
1/1
/19
94
1/1
/19
95
1/1
/19
96
1/1
/19
97
1/1
/19
98
1/1
/19
99
1/1
/20
00
1/1
/20
01
1/1
/20
02
1/1
/20
03
1/1
/20
04
1/1
/20
05
1/1
/20
06
1/1
/20
07
1/1
/20
08
1/1
/20
09
1/1
/20
10
1/1
/20
11
1/1
/20
12
1/1
/20
13
mcf
/day
Bar
rels
Pe
r D
ay
LIQ
GAS
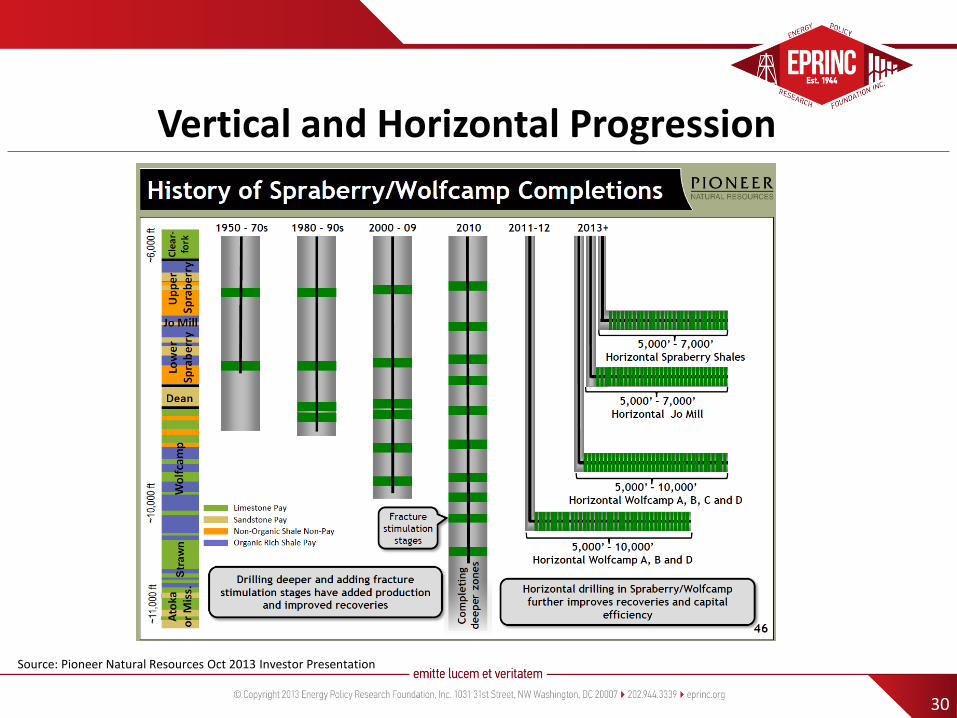
Vertical and Horizontal Progression
30
Source: Pioneer Natural Resources Oct 2013 Investor Presentation

EPRINC November Revised Permian Forecast
31
Source: EPRINC

32
Bakken: The Case Study

33
Long History of the Williston Basin
Source: Time Magazine 1952

34
Bakken Basics
Source: EPRINC Diagram
Source: Julie LeFever Presentation

35
Bakken Geology

36
Bakken Drilling
Source: Triangle Petroleum Corporation, Presentation Bakken Product Markets and Take-Away Denver Jan 31-Feb 1 2012

37
Williston Basin Production
Source: NDIC
North Dakota accounts for almost 10% of US Production Almost all new production is from the Bakken/Three Forks
0
100,000
200,000
300,000
400,000
500,000
600,000
700,000
800,000
900,000
1,000,000
Jan
-07
May
-07
Sep
-07
Jan
-08
May
-08
Sep
-08
Jan
-09
May
-09
Sep
-09
Jan
-10
May
-10
Sep
-10
Jan
-11
May
-11
Sep
-11
Jan
-12
May
-12
Sep
-12
Jan
-13
May
-13
Tho
usa
nd
Bar
rels
Per
Day
North Dakota
Eastern Montana
South Dakota
TOTAL

38
Possible Production Figures
Source: NDPA

39
Decline Rates
Source: Lynn Helms, ND Dept. of Mineral Resources, NDPC Meeting Sept. 2011 Medora ND

40
Unlocking the Rocks
Source: Brigham Exploration via World Oil
Combining longer laterals with an increasing number of frac stages yields higher EURs is a short time period.

41
Infrastructure Challenges

Pipeline Choke Points
Source: EPRINC Choke Point Map using Hart ArcGIS Mapping software
42

All Canadian Pipeline Export Options are Full
Source: Canadian Energy Pipeline Association
43

Market Saturation
Source: CAPP Crude Oil Forecast June 2013
44

0
10
20
30
40
50
60
-
1,000,000
2,000,000
3,000,000
4,000,000
5,000,000
6,000,000
7,000,000
8,000,000
9,000,000
10,000,000
PADD 1East Coast
PADD 2Midwest
PADD 3Gulf Coast
PADD 4Rockies
PADD 5West Coast
Nu
mb
er
of
Re
fin
eri
es
Bar
rels
Pe
r C
ale
nd
ar D
ay
OperableAtmosphericCrude OilDistillationCapacity
ThermalCrackingCokingDownstreamChargeCapacity
OperatingRefineries
Where light sweet Bakken and heavy (blended bitumen) needs to go…
Source: AFPM map, EIA data for graph
Total Coking Capacity vs. Atmospheric Crude Distillation Capacity by PADD
Cokers = Heavy refining capability
45

Regional Pricing Disparities
Source: Flint Hills, EIA, CME Group, and estimates
• Western Canadian Select -$41 to WTI
46
$0.00
$20.00
$40.00
$60.00
$80.00
$100.00
$120.00
$140.00
$160.00
Jan
-08
Jun
-08
No
v-0
8
Ap
r-0
9
Sep
-09
Feb
-10
Jul-
10
De
c-1
0
May
-11
Oct
-11
Mar
-12
Au
g-1
2
Jan
-13
Jun
-13
WTI
Bakken (NorthDakota LightSweet Flint Hills)
WCS (WesternCanadian Select)
Brent

47
The Rise of Rail

48
North Dakota Crude Oil Transport
Source: North Dakota Pipeline Authority
August 2013 Estimates January 2012 Estimates

49
Daily Crude by Rail Shipment in U.S. and Canada
Source: AAR; Crude and petroleum product includes liquefied gases, asphalt, fuel oil, lubricating oil, jet fuel, etc. U.S. operations exclude U.S. operations of CN and CP. Canadian operations include CN and CP and their U.S. operations. One carload holds 30,000 gallons (or 714.3 barrels).
0
200,000
400,000
600,000
800,000
1,000,000
1,200,000
1,400,000
1,600,000
Jan
08
Ap
r 0
8
Jul 0
8
Oct
08
Jan
09
Ap
r 0
9
Jul 0
9
Oct
09
Jan
10
Ap
r 1
0
Jul 1
0
Oct
10
Jan
11
Ap
r 1
1
Jul 1
1
Oct
11
Jan
12
Ap
r 1
2
Jul 1
2
Oct
12
Jan
13
Ap
r 1
3
Jul 1
3
Bar
rels
Per
Day
U.S. Average BarrelsPer Day of Petroleumand Petroleum Product
Canadian AverageBarrels Per Day ofPetroleum andPetroleum Product
EPRINC's U.S. DailyCrude by Rail Estimate- 770,000 b/d
EPRINC's Canada DailyCrude by Rail Estimate- 130,000 b/d

50
Pipeline and Rail
Source: EPRINC Maps using Hart Energy data and ArcGIS Mapping software
• Severely limited due to lack of Keystone XL and lack of historical build out to the coasts – system designed to import into the Gulf and move up
50
• New markets • Diversification • Neat Barrels • Nimble - Quickly adjustable • Optionality for Canadian and U.S. crude, NGLS,
and other petroleum products

51
Refineries Benefit

Refinery Acquisition Cost of Crude Oil
Source: EIA
52
$0
$20
$40
$60
$80
$100
$120
$140
$160
Jan
-08
Mar
-08
May
-08
Jul-
08
Sep
-08
No
v-0
8
Jan
-09
Mar
-09
May
-09
Jul-
09
Sep
-09
No
v-0
9
Jan
-10
Mar
-10
May
-10
Jul-
10
Sep
-10
No
v-1
0
Jan
-11
Mar
-11
May
-11
Jul-
11
Sep
-11
No
v-1
1
Jan
-12
Mar
-12
May
-12
Jul-
12
Sep
-12
No
v-1
2
Jan
-13
Mar
-13
May
-13
Jul-
13
East Coast (PADD 1) Crude OilComposite Acquisition Cost by Refiners$/bbl
Midwest (PADD 2) Crude Oil CompositeAcquisition Cost by Refiners $/bbl
Rocky Mountain (PADD 4) Crude OilComposite Acquisition Cost by Refiners$/bbl
West Coast (PADD 5) Crude OilComposite Acquisition Cost by Refiners$/bbl
Gulf Coast (PADD 3) Crude OilComposite Acquisition Cost by Refiners$/bbl
Brent
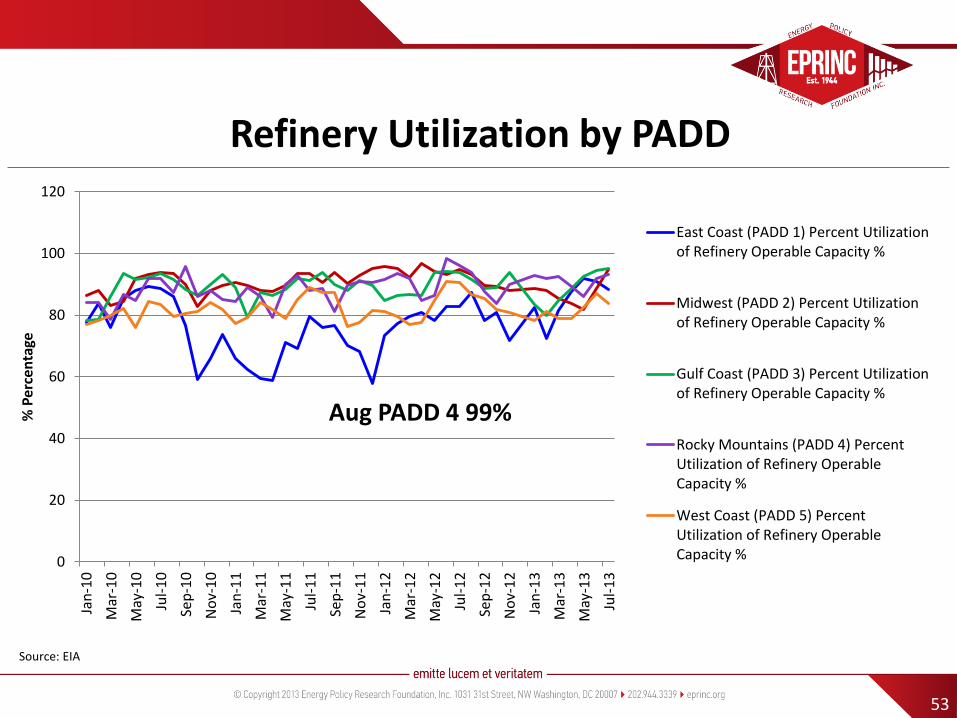
Refinery Utilization by PADD
Source: EIA
53
0
20
40
60
80
100
120
Jan
-10
Mar
-10
May
-10
Jul-
10
Sep
-10
No
v-1
0
Jan
-11
Mar
-11
May
-11
Jul-
11
Sep
-11
No
v-1
1
Jan
-12
Mar
-12
May
-12
Jul-
12
Sep
-12
No
v-1
2
Jan
-13
Mar
-13
May
-13
Jul-
13
% P
erce
nta
ge
East Coast (PADD 1) Percent Utilizationof Refinery Operable Capacity %
Midwest (PADD 2) Percent Utilizationof Refinery Operable Capacity %
Gulf Coast (PADD 3) Percent Utilizationof Refinery Operable Capacity %
Rocky Mountains (PADD 4) PercentUtilization of Refinery OperableCapacity %
West Coast (PADD 5) PercentUtilization of Refinery OperableCapacity %
Aug PADD 4 99%

54
Regulatory Concerns and Conclusions

Potential Issues, Hurdles, and Regulatory Concerns
• Oil prices • Water Usage – Fracking and
Recycling • Oil spills (rail and pipeline) • Environmental Concerns • Regs on Federal Land-Fracking • Infrastructure Delays-PERMITTING • Lack of prudent policy making:
failing to connect what is happening on the ground to what is understood in Washington
• Costs incurred
55

Conclusions • Since 2008 the U.S. and Canada have added over 3 mbd of crude to global production,
helping offset issues in Libya and the Middle East. • Pipelines are being built, but right now their is tightness in the system and an
increasing need for Gateway, XL, and other Coastal options for US and Canadian crude. • Bakken crude has to get to the U.S. East and West Coasts (via rail) and heavy Canadian
needs to get to the Gulf and West Coast (via pipeline and rail). • Roughly 7.7 mbd of new capacity (as estimated by EPRINC) is comprised of pipeline
reversals, expansions, twinning, repurposing, and retrofitting. There are serious regulatory and permitting hurdles which deserve consideration.
• Even with a narrowing spread, rail is a serious option for US producers distanced from refining centers, especially Bakken and Canadian crude—markets exist where pipelines do not (especially with XL delay and Gateway uncertainty).
• Market has changes for producers and refiners with optionality, market and regulatory uncertainty
• Rail will be here in the long term, the question is simply how much and where. • Refineries are going to play a vital role in this renaissance as they adapt to high
volumes of light sweet and heavy crude oils.
56

57
APPENDIX

58
Source: NDPA
Natural Gas Flaring

59
Source: NDPA
Why?

60
Value of an Oil Well in North Dakota
Typical 2012 North Dakota Bakken well will produce for 29 years (enhanced oil recovery efforts could extend the life of the well) In those 29 years the average Bakken well: • Produces approximately 580,000 barrels of oil • Generates over $22 million net profit • Cost $8,500,000 to drill and complete (up from 7.3 last year)
• Pays approximately $4,610,000 in taxes
• $2,200,000 gross production taxes • $2,000,000 extraction tax • $410,000 sales tax • Pays royalties of $7,925,000 to mineral owners • Pays salaries and wages of $1,500,000 • Pays operating expenses of $2,300,000
Source: ND Department of Mineral Resources 2012 Presentation

61
Source: PacWest Consulting
Cost of Oil Sands Production
Source: “Canada’s Energy Future: Energy Supply and Demand Projections to 2035.” Nov 2011. NEB
61