Embed Size (px)
Citation preview
5/16/2013 1
Challenges facing the Lebanese SME Sector
Zeina El Khoury
Head of Enterprise Team
Ministry of Economy and Trade
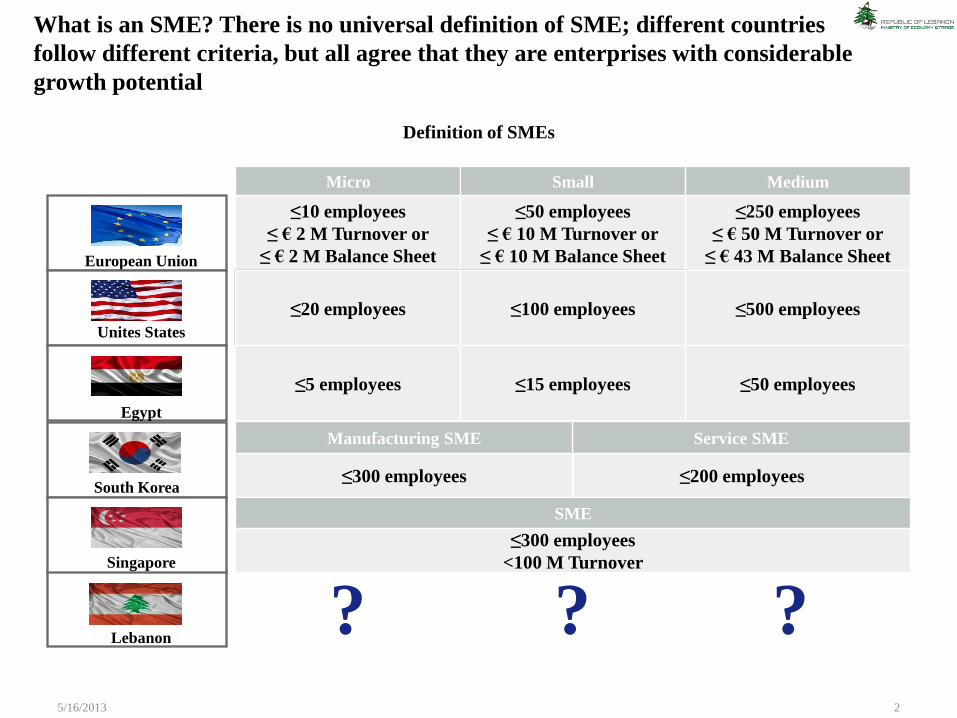
What is an SME? There is no universal definition of SME; different countries
follow different criteria, but all agree that they are enterprises with considerable
growth potential
5/16/2013 2
Definition of SMEs
Lebanon
European Union
Egypt
South Korea
Singapore
Micro Small Medium
?
≤10 employees
≤ € 2 M Turnover or
≤ € 2 M Balance Sheet
≤50 employees
≤ € 10 M Turnover or
≤ € 10 M Balance Sheet
≤250 employees
≤ € 50 M Turnover or
≤ € 43 M Balance Sheet
≤20 employees ≤100 employees ≤500 employees
≤5 employees ≤15 employees ≤50 employees
Service SME
Manufacturing SME
≤200 employees ≤300 employees
SME
≤300 employees
<100 M Turnover
? ?
Unites States
5/16/2013 3
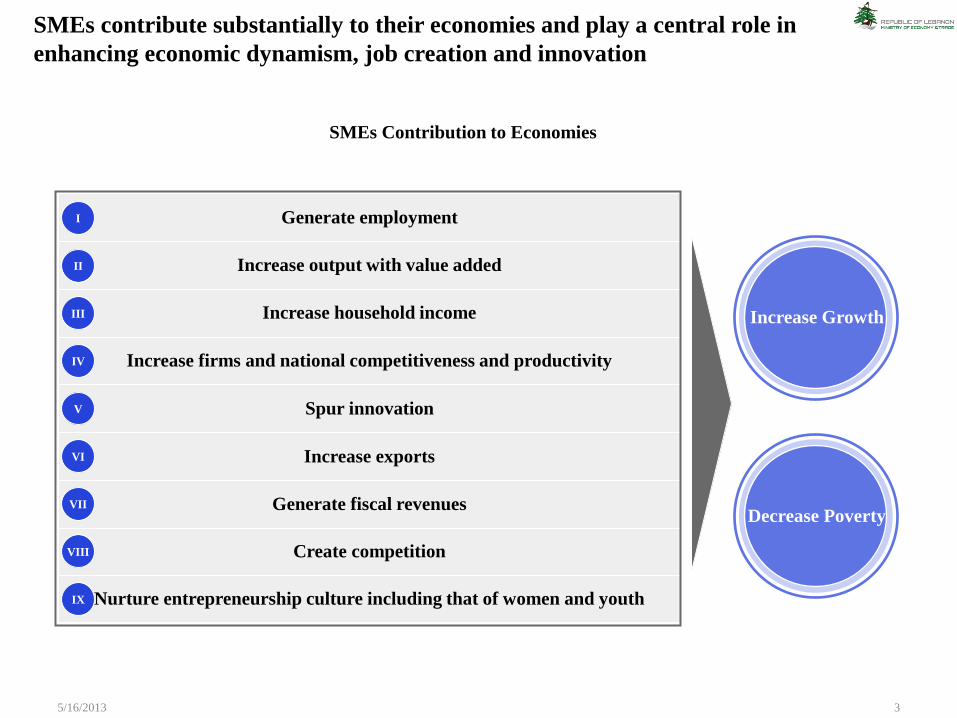
Increase Growth
Decrease Poverty
Generate employment
Increase output with value added
Increase household income
Increase firms and national competitiveness and productivity
Spur innovation
Increase exports
Generate fiscal revenues
Create competition
Nurture entrepreneurship culture including that of women and youth
I
II
III
IV
V
VI
VII
VIII
IX
SMEs contribute substantially to their economies and play a central role in
enhancing economic dynamism, job creation and innovation
SMEs Contribution to Economies
5/16/2013 4 UNESCSAP, OECD, SBA country factsheets, CAS 1996
25%
38%
42%
51%
52%
54%
56%
59%
61%
70%
75%
79%
79%
88%
KSA
Egypt
UAE
Lebanon
Singapore
UK
USA
Malaysia
France
Japan
China
Spain
Germany
Korea
68%
Developed Countries
SMEs share of Total Workforce SMEs share of Exports
6%
16%
19%
22%
39%
42%
46%
56%
69%
69%
Japan
Singapore
Malaysia
USA
Korea
France
UK
Germany
Spain
China
37%
Developed Countries
SMEs contribution to GDP
25%
30%
32%
33%
40%
50%
51%
52%
53%
54%
57%
58%
64%
KSA
UAE
Malaysia
Egypt
Singapore
Korea
UK
USA
Germany
France
Japan
China
Spain
53%
Developed Countries
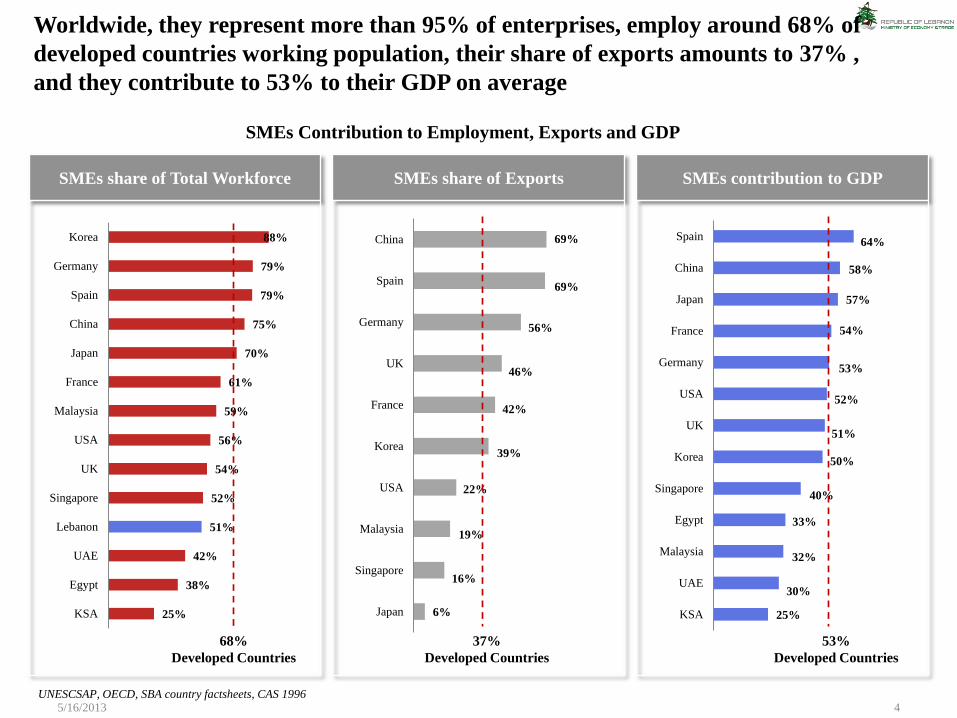
Worldwide, they represent more than 95% of enterprises, employ around 68% of
developed countries working population, their share of exports amounts to 37% ,
and they contribute to 53% to their GDP on average
SMEs Contribution to Employment, Exports and GDP
5/16/2013 5
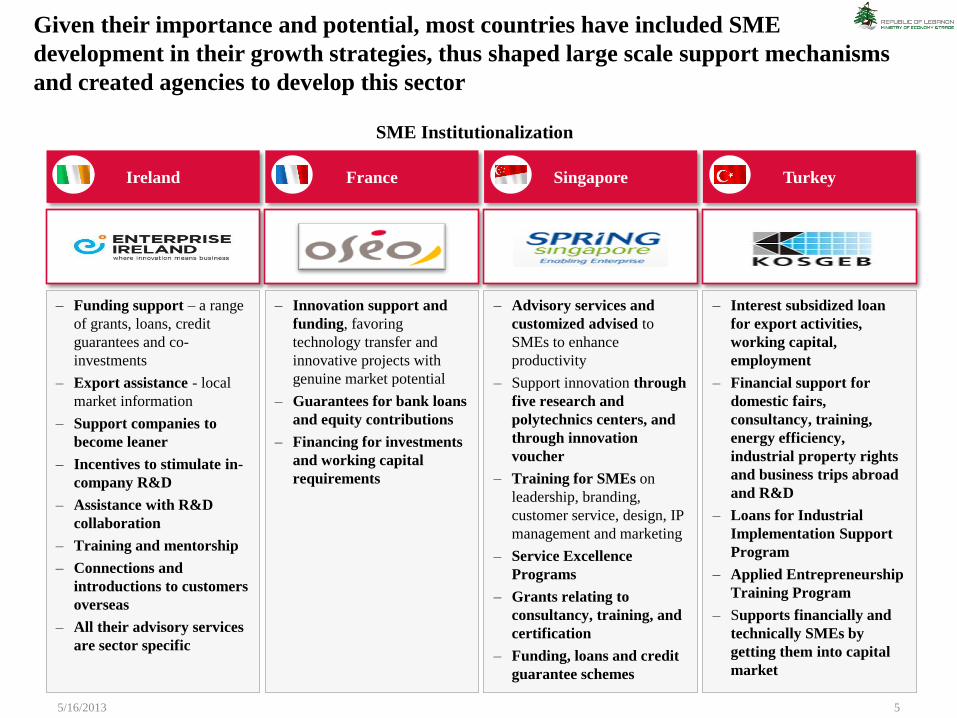
– Funding support – a range
of grants, loans, credit
guarantees and co-
investments
– Export assistance - local
market information
– Support companies to
become leaner
– Incentives to stimulate in-
company R&D
– Assistance with R&D
collaboration
– Training and mentorship
– Connections and
introductions to customers
overseas
– All their advisory services
are sector specific
– Innovation support and
funding, favoring
technology transfer and
innovative projects with
genuine market potential
– Guarantees for bank loans
and equity contributions
– Financing for investments
and working capital
requirements
– Advisory services and
customized advised to
SMEs to enhance
productivity
– Support innovation through
five research and
polytechnics centers, and
through innovation
voucher
– Training for SMEs on
leadership, branding,
customer service, design, IP
management and marketing
– Service Excellence
Programs
– Grants relating to
consultancy, training, and
certification
– Funding, loans and credit
guarantee schemes
Ireland France Singapore Turkey
– Interest subsidized loan
for export activities,
working capital,
employment
– Financial support for
domestic fairs,
consultancy, training,
energy efficiency,
industrial property rights
and business trips abroad
and R&D
– Loans for Industrial
Implementation Support
Program
– Applied Entrepreneurship
Training Program
– Supports financially and
technically SMEs by
getting them into capital
market
Given their importance and potential, most countries have included SME
development in their growth strategies, thus shaped large scale support mechanisms
and created agencies to develop this sector
SME Institutionalization
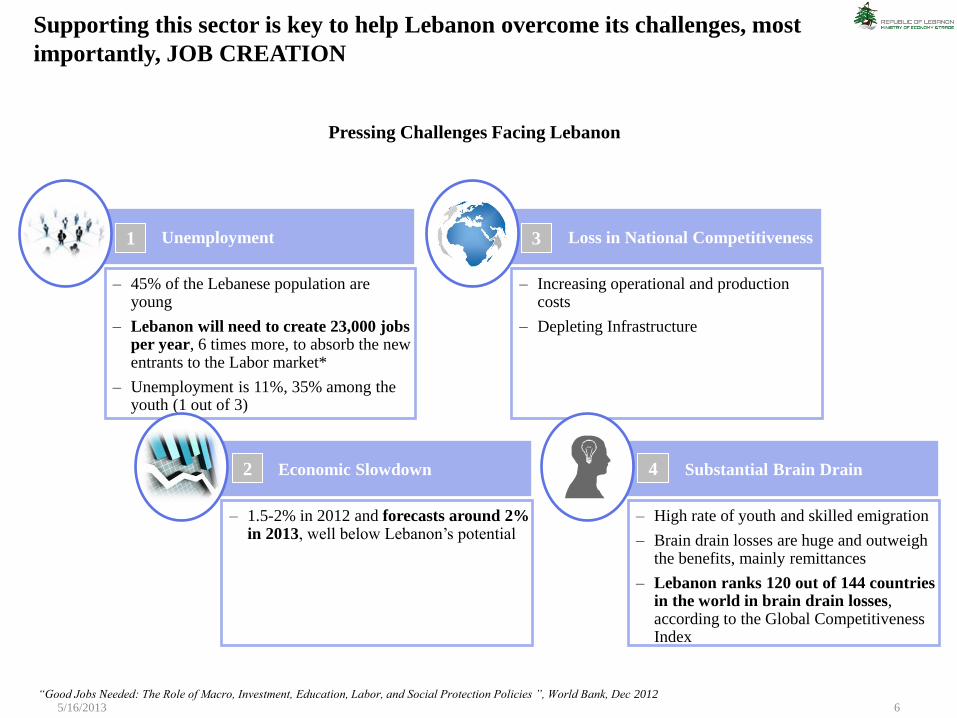
– 45% of the Lebanese population are young
– Lebanon will need to create 23,000 jobs per year, 6 times more, to absorb the new entrants to the Labor market*
– Unemployment is 11%, 35% among the youth (1 out of 3)
– High rate of youth and skilled emigration
– Brain drain losses are huge and outweigh the benefits, mainly remittances
– Lebanon ranks 120 out of 144 countries in the world in brain drain losses, according to the Global Competitiveness Index
5/16/2013 6 “Good Jobs Needed: The Role of Macro, Investment, Education, Labor, and Social Protection Policies ”, World Bank, Dec 2012
Unemployment
Economic Slowdown
– 1.5-2% in 2012 and forecasts around 2% in 2013, well below Lebanon’s potential
Loss in National Competitiveness
– Increasing operational and production costs
– Depleting Infrastructure
Substantial Brain Drain
3
2 4
1
Supporting this sector is key to help Lebanon overcome its challenges, most
importantly, JOB CREATION
Pressing Challenges Facing Lebanon
5/16/2013 7
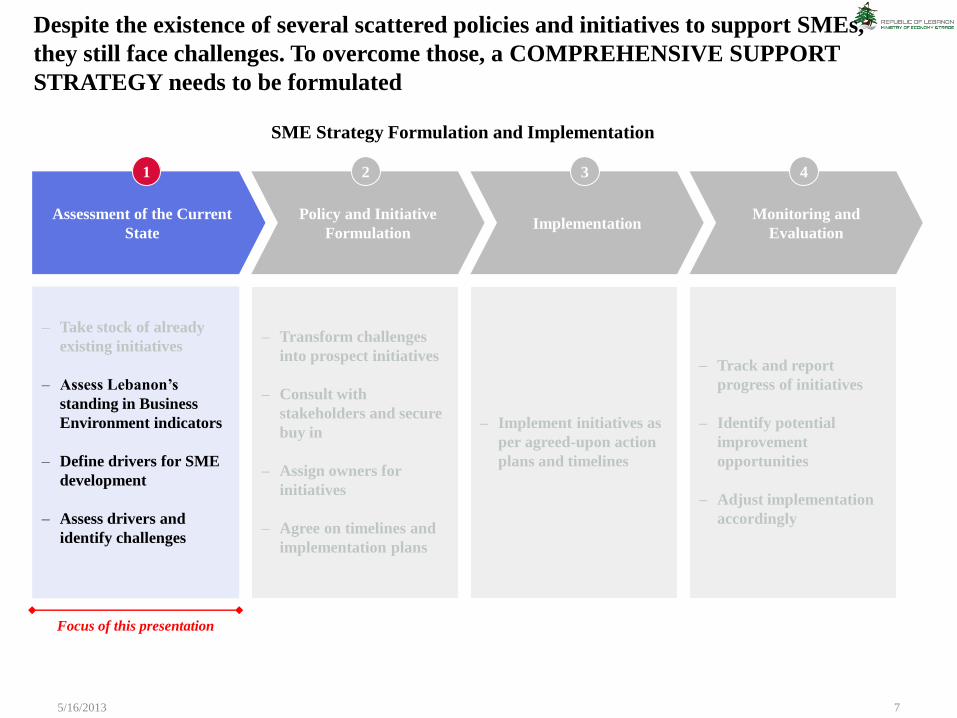
– Take stock of already
existing initiatives
– Assess Lebanon’s
standing in Business
Environment indicators
– Define drivers for SME
development
– Assess drivers and
identify challenges
– Transform challenges
into prospect initiatives
– Consult with
stakeholders and secure
buy in
– Assign owners for
initiatives
– Agree on timelines and
implementation plans
Assessment of the Current
State
Policy and Initiative
Formulation Implementation
Monitoring and
Evaluation
1 2 3 4
Focus of this presentation
– Implement initiatives as
per agreed-upon action
plans and timelines
– Track and report
progress of initiatives
– Identify potential
improvement
opportunities
– Adjust implementation
accordingly
Despite the existence of several scattered policies and initiatives to support SMEs,
they still face challenges. To overcome those, a COMPREHENSIVE SUPPORT
STRATEGY needs to be formulated
SME Strategy Formulation and Implementation
5/16/2013 8
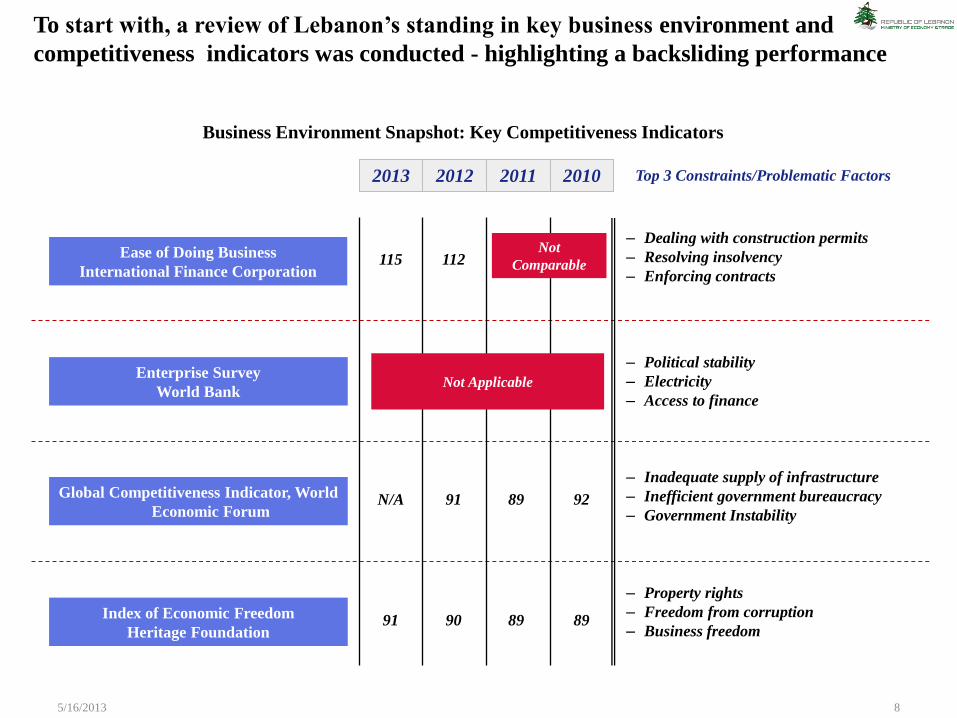
Ease of Doing Business
International Finance Corporation
Index of Economic Freedom
Heritage Foundation 91
115
90
112
89 89
– Dealing with construction permits
– Resolving insolvency
– Enforcing contracts
Top 3 Constraints/Problematic Factors
– Property rights
– Freedom from corruption
– Business freedom
Global Competitiveness Indicator, World
Economic Forum N/A 91 89
– Inadequate supply of infrastructure
– Inefficient government bureaucracy
– Government Instability 92
Enterprise Survey
World Bank
– Political stability
– Electricity
– Access to finance
Not Applicable
Not
Comparable
2013 2012 2011 2010
To start with, a review of Lebanon’s standing in key business environment and
competitiveness indicators was conducted - highlighting a backsliding performance
Business Environment Snapshot: Key Competitiveness Indicators
5/16/2013 9
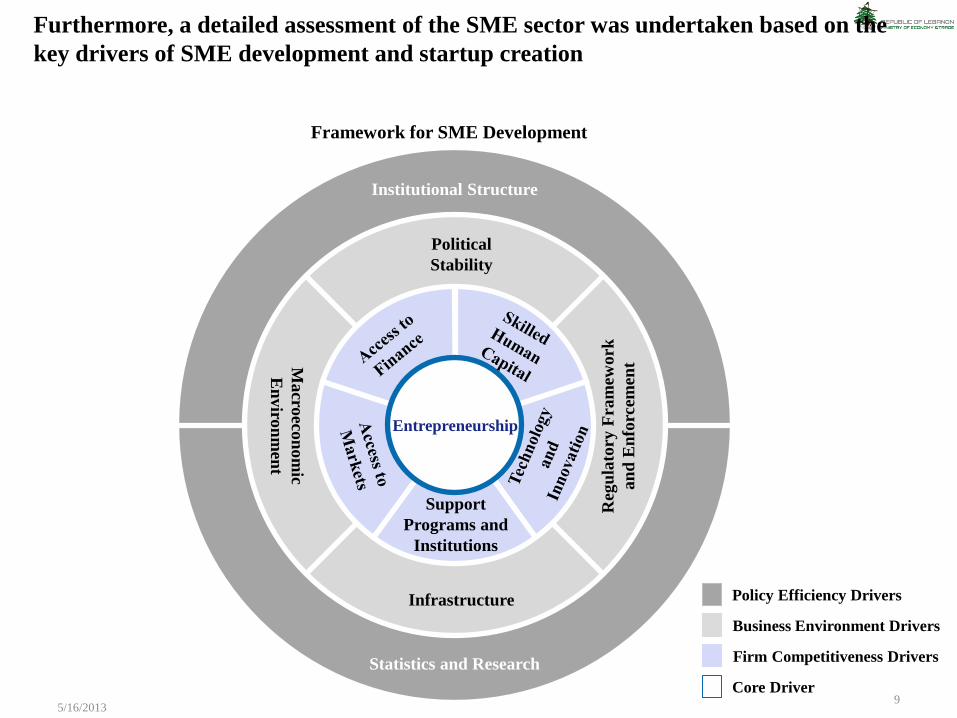
Business Environment Drivers
Firm Competitiveness Drivers
Core Driver
Policy Efficiency Drivers
Furthermore, a detailed assessment of the SME sector was undertaken based on the
key drivers of SME development and startup creation
Framework for SME Development
Regular and Consistent Data
and Research
Entrepreneurship
Support
Programs and
Institutions
Political
Stability
Infrastructure
Macro
econ
om
ic
En
viro
nm
ent
Reg
ula
tory
Fra
mew
ork
an
d E
nfo
rcem
ent
Institutional Structure
Statistics and Research
5/16/2013 10
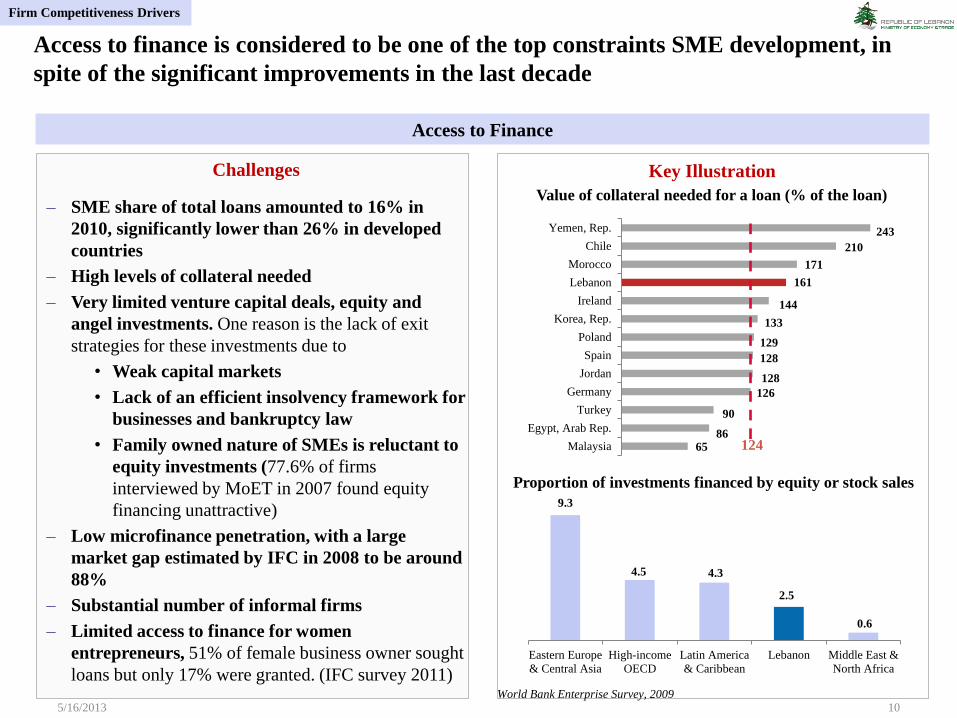
Challenges
– SME share of total loans amounted to 16% in
2010, significantly lower than 26% in developed
countries
– High levels of collateral needed
– Very limited venture capital deals, equity and
angel investments. One reason is the lack of exit
strategies for these investments due to
• Weak capital markets
• Lack of an efficient insolvency framework for
businesses and bankruptcy law
• Family owned nature of SMEs is reluctant to
equity investments (77.6% of firms
interviewed by MoET in 2007 found equity
financing unattractive)
– Low microfinance penetration, with a large
market gap estimated by IFC in 2008 to be around
88%
– Substantial number of informal firms
– Limited access to finance for women
entrepreneurs, 51% of female business owner sought
loans but only 17% were granted. (IFC survey 2011)
Key Illustration
65 86
90
126
128
128
129
133
144
161
171
210
243
Malaysia
Egypt, Arab Rep.
Turkey
Germany
Jordan
Spain
Poland
Korea, Rep.
Ireland
Lebanon
Morocco
Chile
Yemen, Rep.
Value of collateral needed for a loan (% of the loan)
124
9.3
4.5 4.3
2.5
0.6
Eastern Europe
& Central Asia
High-income
OECD
Latin America
& Caribbean
Lebanon Middle East &
North Africa
Proportion of investments financed by equity or stock sales
World Bank Enterprise Survey, 2009
Access to finance is considered to be one of the top constraints SME development, in
spite of the significant improvements in the last decade
Access to Finance
Firm Competitiveness Drivers
5/16/2013 11
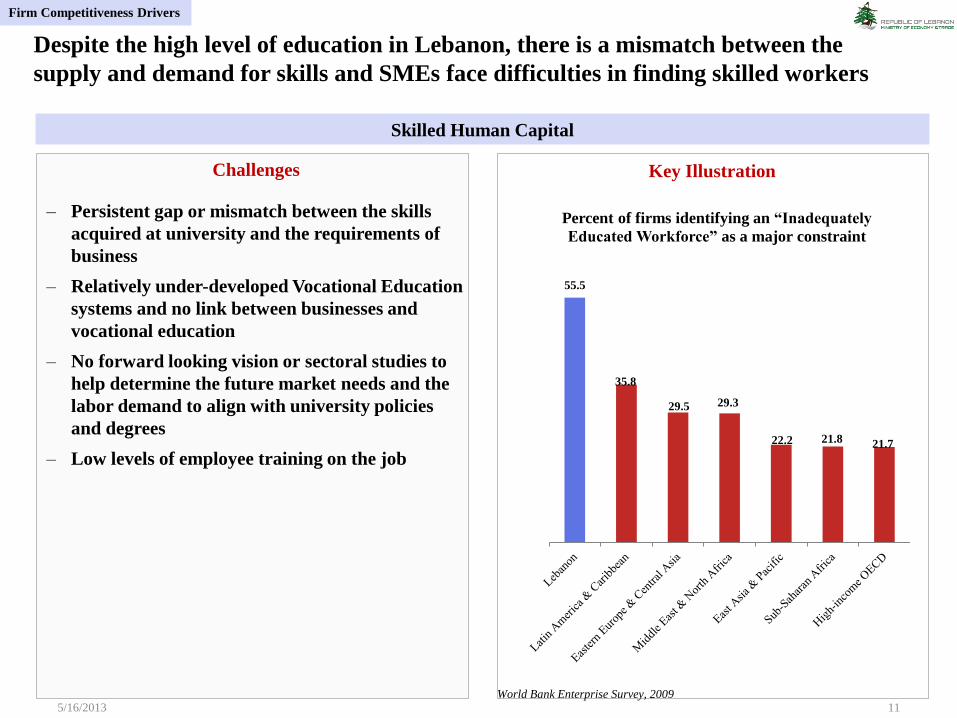
Challenges
– Persistent gap or mismatch between the skills
acquired at university and the requirements of
business
– Relatively under-developed Vocational Education
systems and no link between businesses and
vocational education
– No forward looking vision or sectoral studies to
help determine the future market needs and the
labor demand to align with university policies
and degrees
– Low levels of employee training on the job
Key Illustration
55.5
35.8
29.5 29.3
22.2 21.8 21.7
Percent of firms identifying an “Inadequately
Educated Workforce” as a major constraint
World Bank Enterprise Survey, 2009
Despite the high level of education in Lebanon, there is a mismatch between the
supply and demand for skills and SMEs face difficulties in finding skilled workers
Skilled Human Capital
Firm Competitiveness Drivers
5/16/2013 12
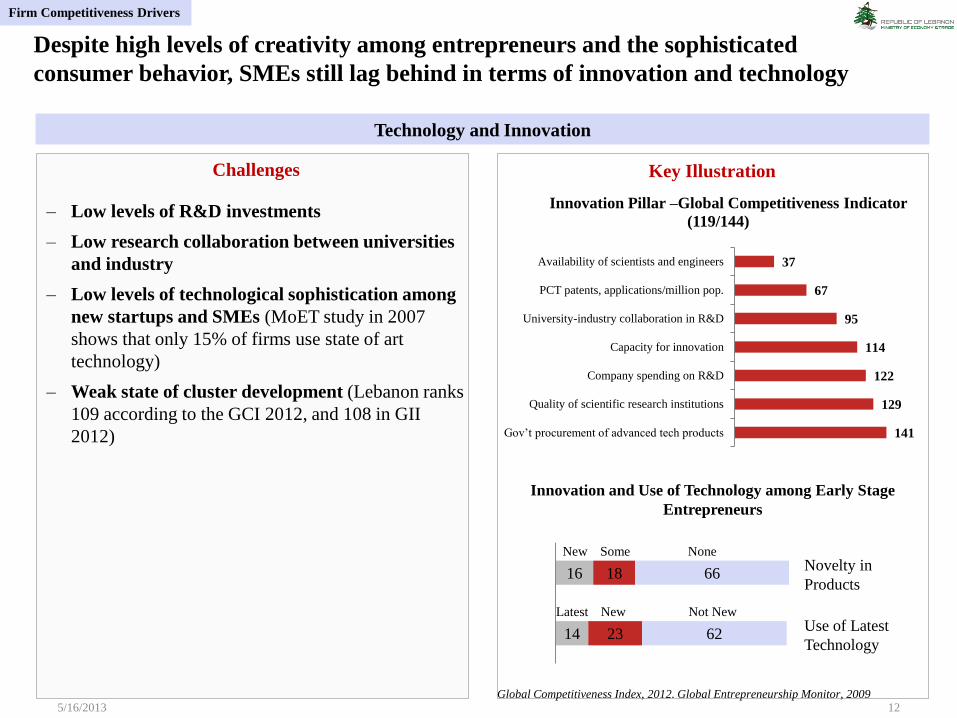
Challenges
– Low levels of R&D investments
– Low research collaboration between universities
and industry
– Low levels of technological sophistication among
new startups and SMEs (MoET study in 2007
shows that only 15% of firms use state of art
technology)
– Weak state of cluster development (Lebanon ranks
109 according to the GCI 2012, and 108 in GII
2012)
Key Illustration
141
129
122
114
95
67
37
Gov’t procurement of advanced tech products
Quality of scientific research institutions
Company spending on R&D
Capacity for innovation
University-industry collaboration in R&D
PCT patents, applications/million pop.
Availability of scientists and engineers
Innovation Pillar –Global Competitiveness Indicator
(119/144)
Global Competitiveness Index, 2012. Global Entrepreneurship Monitor, 2009
Innovation and Use of Technology among Early Stage
Entrepreneurs
14
16
23
18
62
66 Novelty in
Products
Use of Latest
Technology
New Some None
Latest New Not New
Despite high levels of creativity among entrepreneurs and the sophisticated
consumer behavior, SMEs still lag behind in terms of innovation and technology
Technology and Innovation
Firm Competitiveness Drivers
Key Illustration
5/16/2013 13
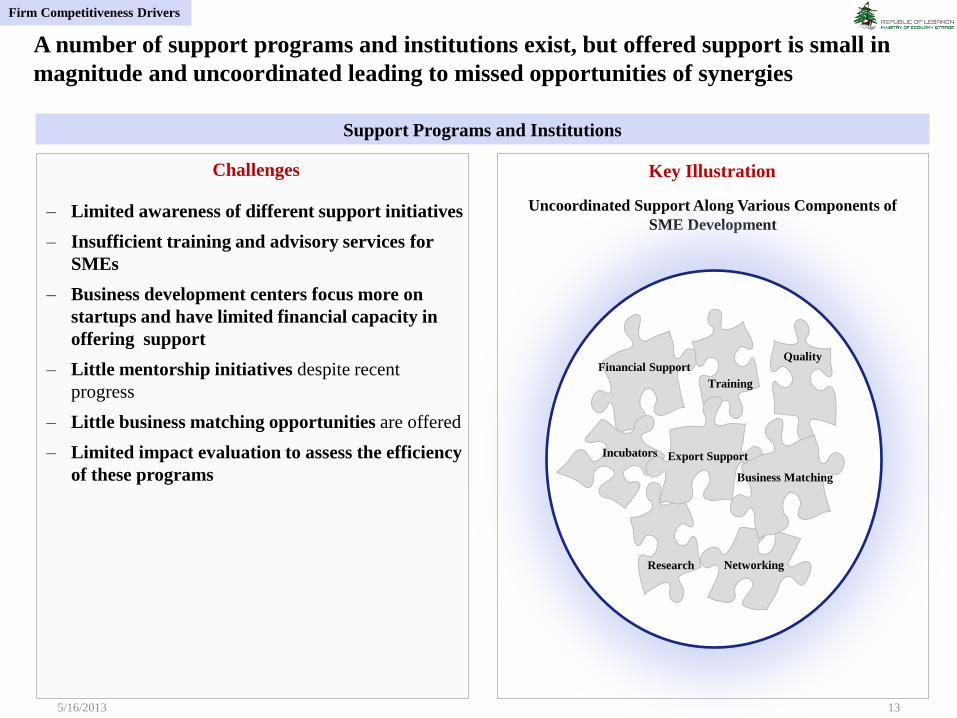
Challenges
– Limited awareness of different support initiatives
– Insufficient training and advisory services for
SMEs
– Business development centers focus more on
startups and have limited financial capacity in
offering support
– Little mentorship initiatives despite recent
progress
– Little business matching opportunities are offered
– Limited impact evaluation to assess the efficiency
of these programs
Uncoordinated Support Along Various Components of
SME Development
Financial Support
Training
Quality
Incubators Export Support
Research Networking
Business Matching
A number of support programs and institutions exist, but offered support is small in
magnitude and uncoordinated leading to missed opportunities of synergies
Support Programs and Institutions
Firm Competitiveness Drivers
5/16/2013 14
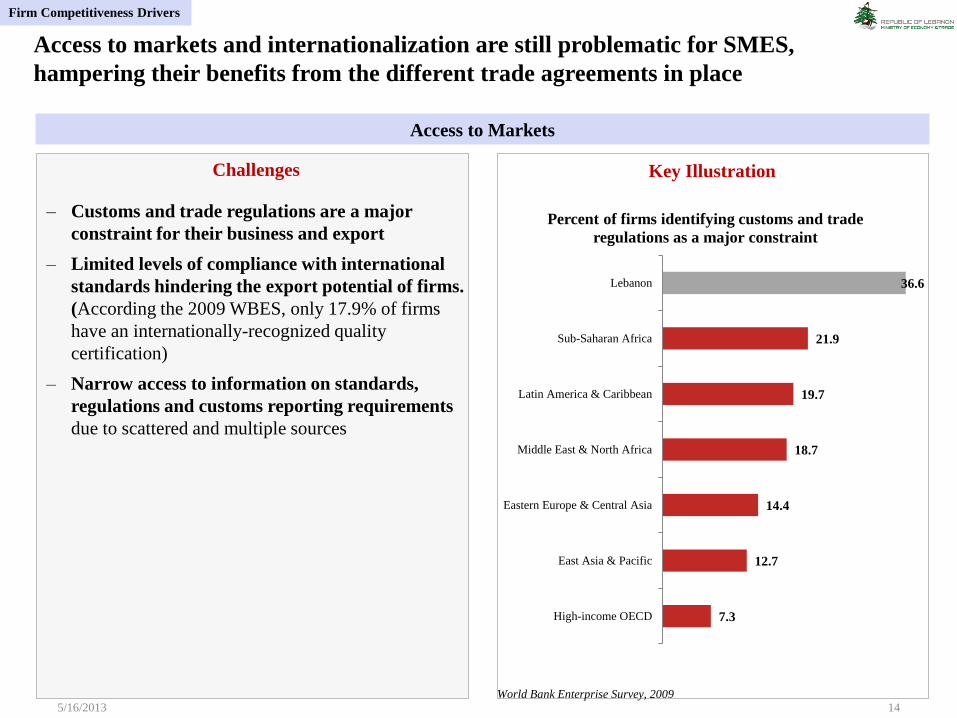
Challenges
– Customs and trade regulations are a major
constraint for their business and export
– Limited levels of compliance with international
standards hindering the export potential of firms.
(According the 2009 WBES, only 17.9% of firms
have an internationally-recognized quality
certification)
– Narrow access to information on standards,
regulations and customs reporting requirements
due to scattered and multiple sources
Key Illustration
7.3
12.7
14.4
18.7
19.7
21.9
36.6
High-income OECD
East Asia & Pacific
Eastern Europe & Central Asia
Middle East & North Africa
Latin America & Caribbean
Sub-Saharan Africa
Lebanon
Percent of firms identifying customs and trade
regulations as a major constraint
World Bank Enterprise Survey, 2009
Access to markets and internationalization are still problematic for SMES,
hampering their benefits from the different trade agreements in place
Access to Markets
Firm Competitiveness Drivers
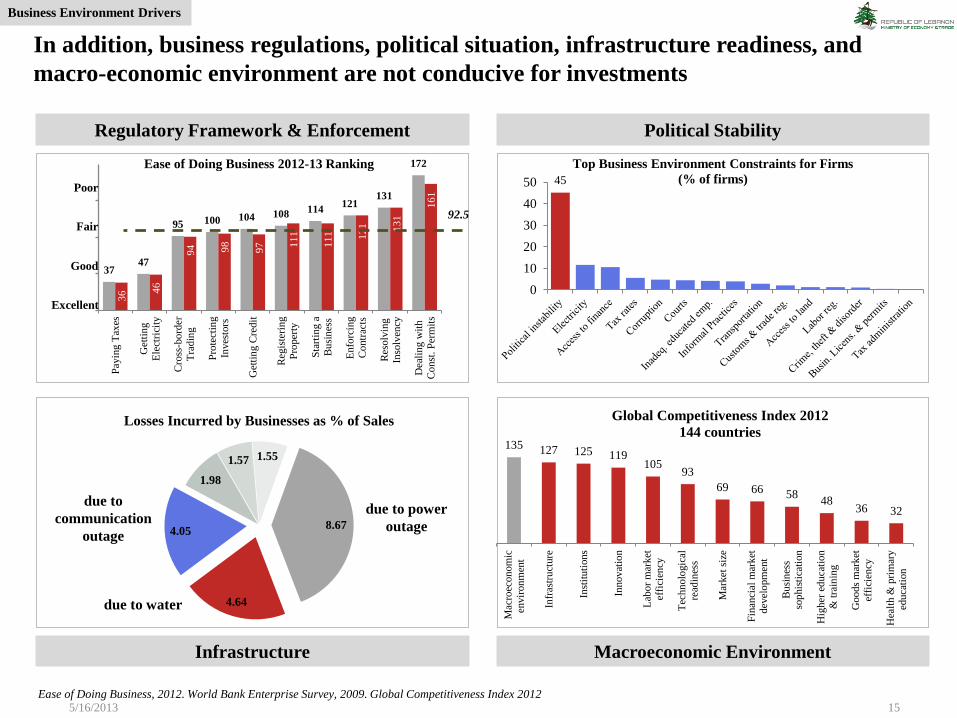
37 47
95 100 104 108 114 121
131
172
36
46
94
98
97
11
1
11
1
12
1
13
1
16
1
Pay
ing T
axes
Get
tin
g
Ele
ctri
city
Cro
ss-b
ord
er
Tra
din
g
Pro
tect
ing
Inves
tors
Get
tin
g C
redit
Reg
iste
ring
Pro
per
ty
Sta
rtin
g a
Bu
sin
ess
Enfo
rcin
g
Co
ntr
acts
Res
olv
ing
Inso
lven
cy
Dea
lin
g w
ith
Co
nst
. P
erm
its
Ease of Doing Business 2012-13 Ranking
92.5
Excellent
Good
Fair
Poor
5/16/2013 15
45
0
10
20
30
40
50
Top Business Environment Constraints for Firms
(% of firms)
Political Stability
Macroeconomic Environment
Regulatory Framework & Enforcement
Infrastructure
Ease of Doing Business, 2012. World Bank Enterprise Survey, 2009. Global Competitiveness Index 2012
In addition, business regulations, political situation, infrastructure readiness, and
macro-economic environment are not conducive for investments
8.67
4.64
4.05
1.98
1.57 1.55
Losses Incurred by Businesses as % of Sales
due to power
outage
due to water
due to
communication
outage
135 127 125 119 105
93
69 66 58 48
36 32 M
acro
econ
om
ic
envir
on
men
t
Infr
astr
uct
ure
Inst
ituti
ons
Innov
atio
n
Lab
or
mar
ket
effi
cien
cy
Tec
hn
olo
gic
al
read
ines
s
Mar
ket
siz
e
Fin
anci
al m
ark
et
dev
elo
pm
ent
Bu
sin
ess
sop
his
tica
tion
Hig
her
ed
uca
tio
n
& t
rain
ing
Goo
ds
mar
ket
effi
cien
cy
Hea
lth &
pri
mar
y
educa
tion
Global Competitiveness Index 2012
144 countries
Business Environment Drivers
5/16/2013 16
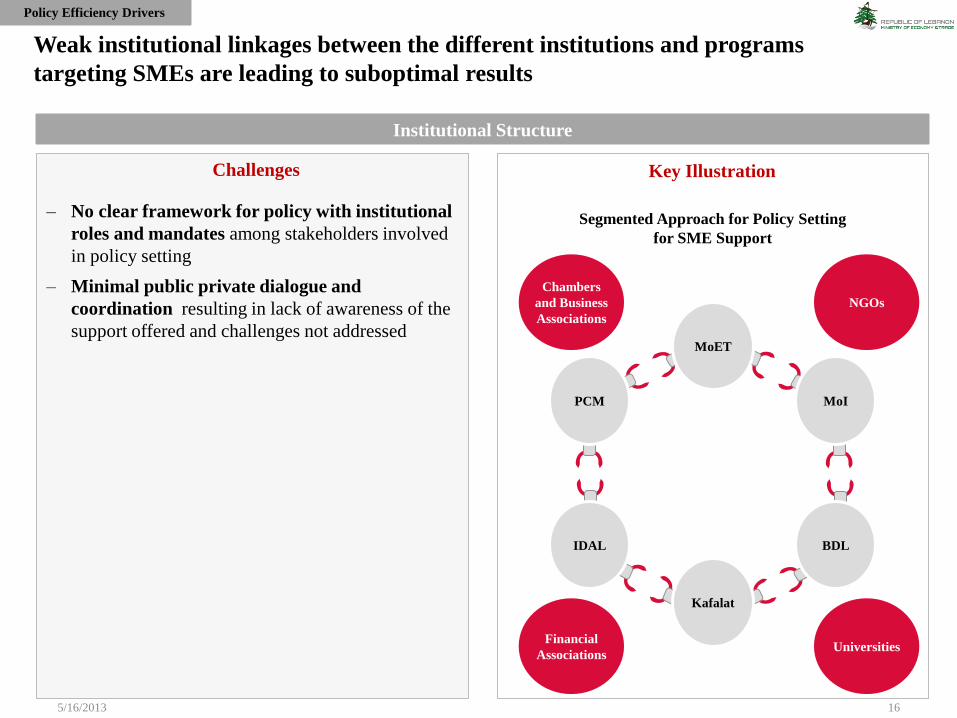
Challenges
– No clear framework for policy with institutional
roles and mandates among stakeholders involved
in policy setting
– Minimal public private dialogue and
coordination resulting in lack of awareness of the
support offered and challenges not addressed
Key Illustration
MoET
PCM
IDAL
MoI
BDL
Kafalat
Segmented Approach for Policy Setting
for SME Support
Weak institutional linkages between the different institutions and programs
targeting SMEs are leading to suboptimal results
Institutional Structure
NGOs
Chambers
and Business
Associations
Financial
Associations Universities
Policy Efficiency Drivers
5/16/2013 17
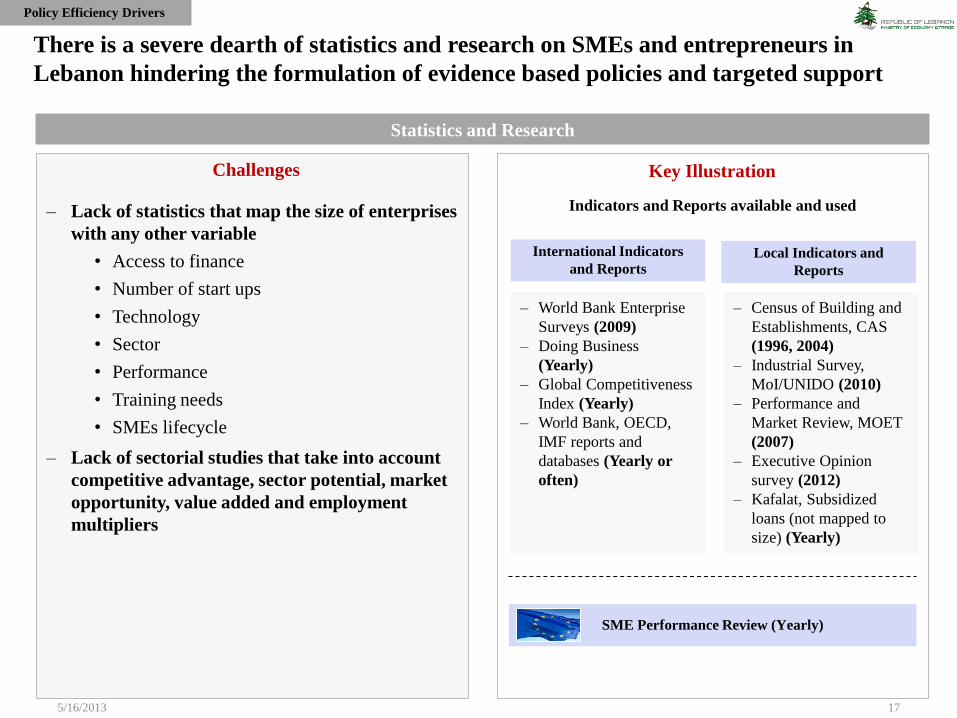
Challenges
– Lack of statistics that map the size of enterprises
with any other variable
• Access to finance
• Number of start ups
• Technology
• Sector
• Performance
• Training needs
• SMEs lifecycle
– Lack of sectorial studies that take into account
competitive advantage, sector potential, market
opportunity, value added and employment
multipliers
Key Illustration
International Indicators
and Reports Local Indicators and
Reports
– World Bank Enterprise
Surveys (2009)
– Doing Business
(Yearly)
– Global Competitiveness
Index (Yearly)
– World Bank, OECD,
IMF reports and
databases (Yearly or
often)
– Census of Building and
Establishments, CAS
(1996, 2004)
– Industrial Survey,
MoI/UNIDO (2010)
– Performance and
Market Review, MOET
(2007)
– Executive Opinion
survey (2012)
– Kafalat, Subsidized
loans (not mapped to
size) (Yearly)
SME Performance Review (Yearly)
Indicators and Reports available and used
There is a severe dearth of statistics and research on SMEs and entrepreneurs in
Lebanon hindering the formulation of evidence based policies and targeted support
Statistics and Research
Policy Efficiency Drivers
SMEs are the key to unlock the vast potential of the Lebanese economy!
5/16/2013 18
A CALL FOR COLLECTIVE ACTION!
Thank you for your attention!
Given that we have identified the challenges facing SMEs, what is most important
now is to transform these challenges into initiatives and this is the purpose of our
next presentation.