Embed Size (px)
Citation preview
Challenges in
International Large-Scale Assessments
Higher School of Economics, Moscow, Russia, May 16, 2013
Challenges
1. Using information to improve quality2. Measuring beyond the academics3. Reaching out of school population4. What to measure5. Difficulty level of the tests
Challenge 1: Using Assessment information to
improve education quality
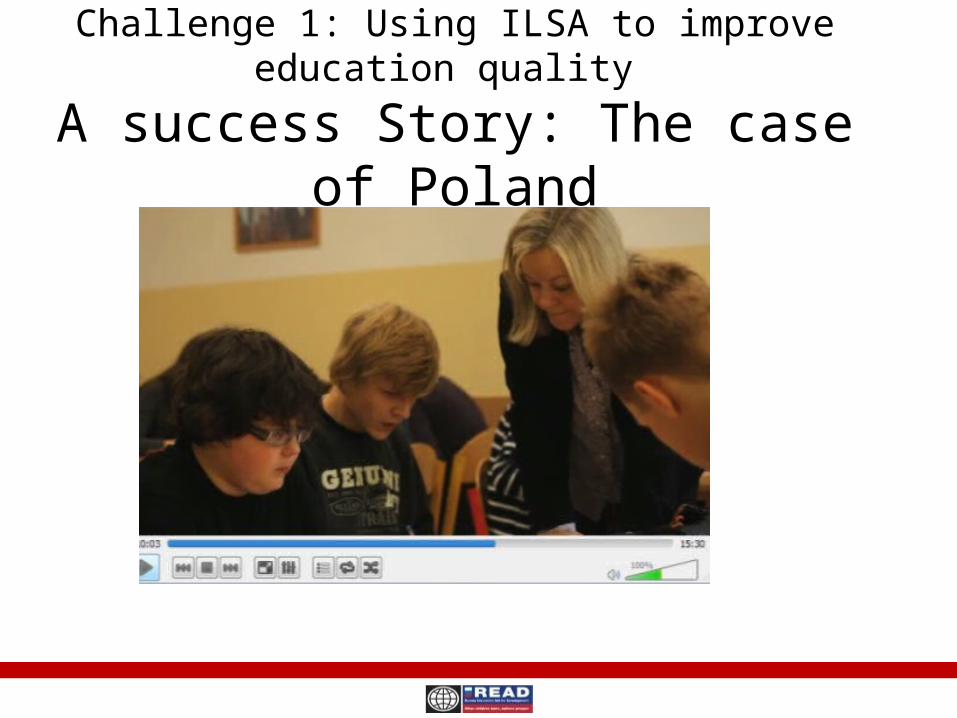
Challenge 1: Using ILSA to improve education quality
A success Story: The case of Poland
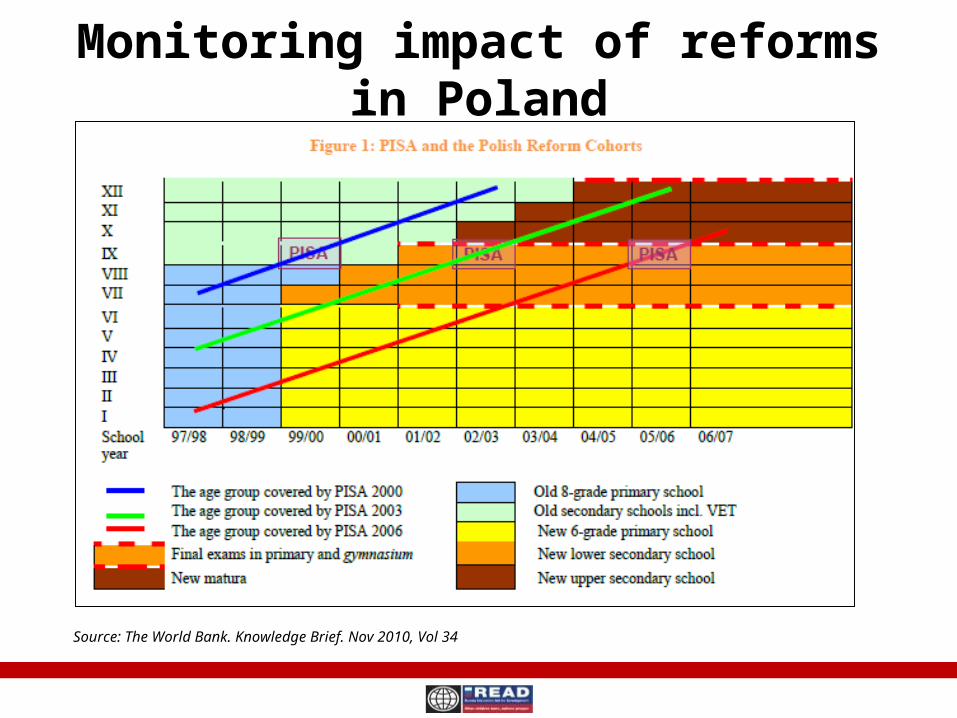
Monitoring impact of reforms in Poland
Source: The World Bank. Knowledge Brief. Nov 2010, Vol 34
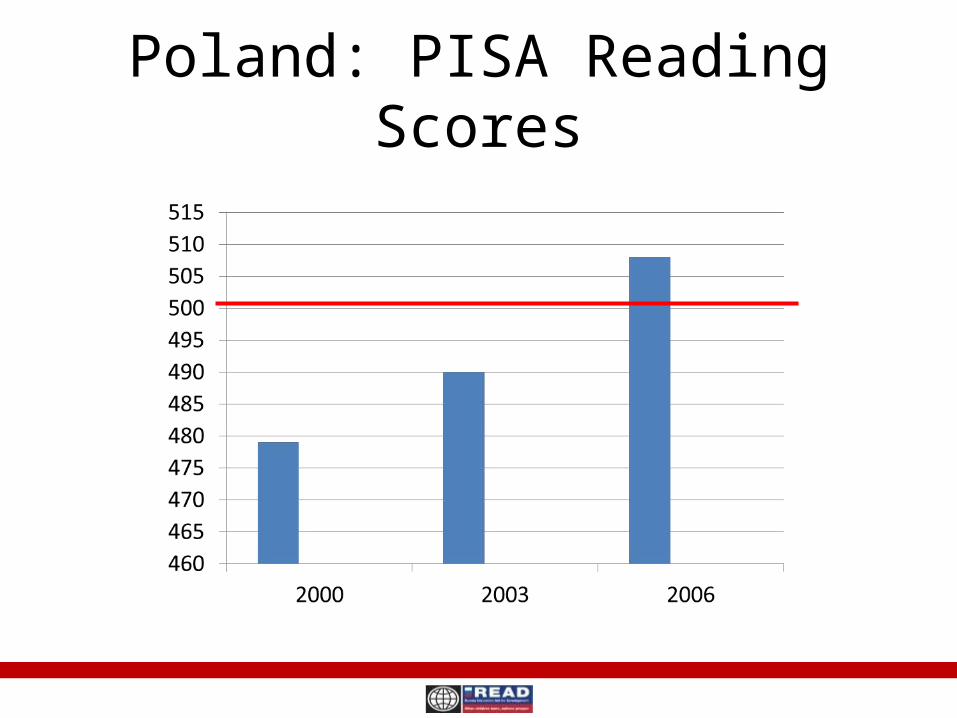
Poland: PISA Reading Scores
Challenges for effective use of assessments
• Political environment• Dissemination• Local capacity• Assessment culture
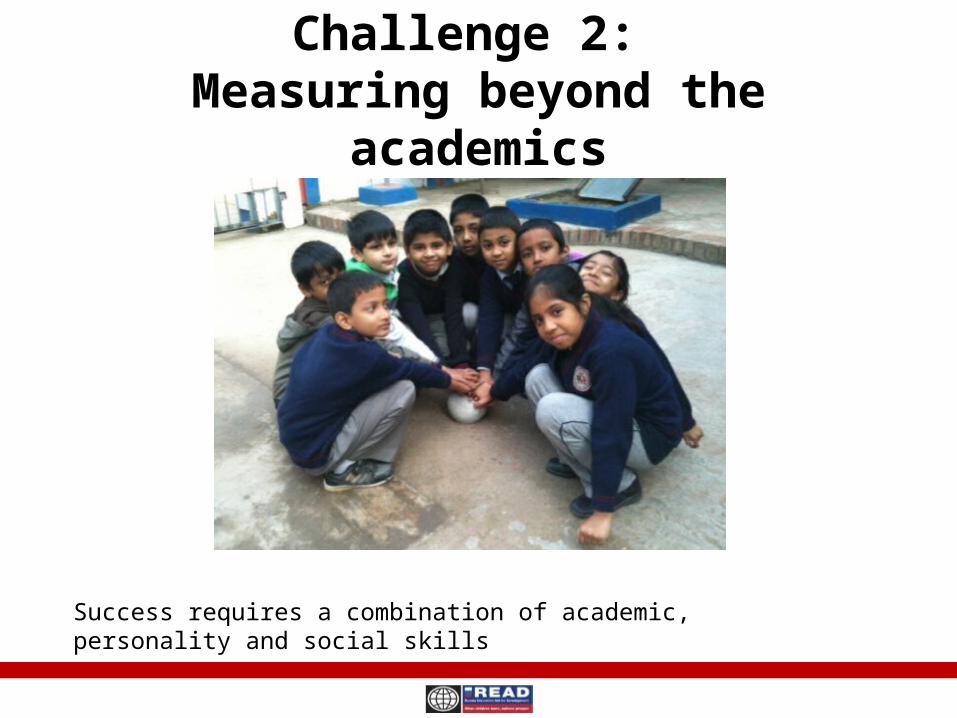
Challenge 2: Measuring beyond the academics
Success requires a combination of academic, personality and social skills
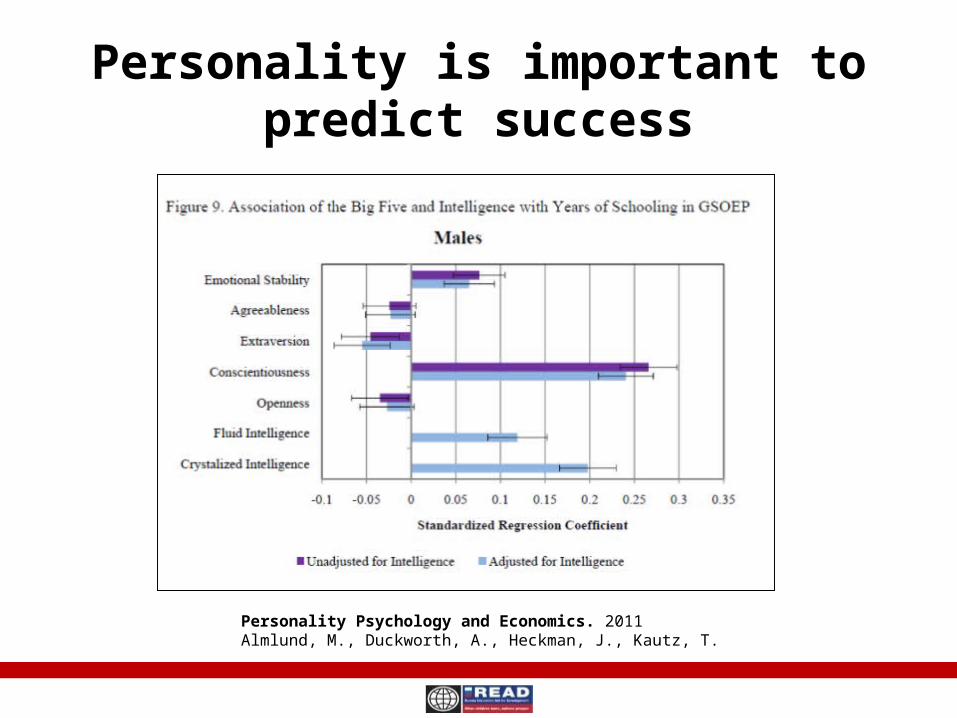
Personality is important to predict success
Personality Psychology and Economics. 2011Almlund, M., Duckworth, A., Heckman, J., Kautz, T.
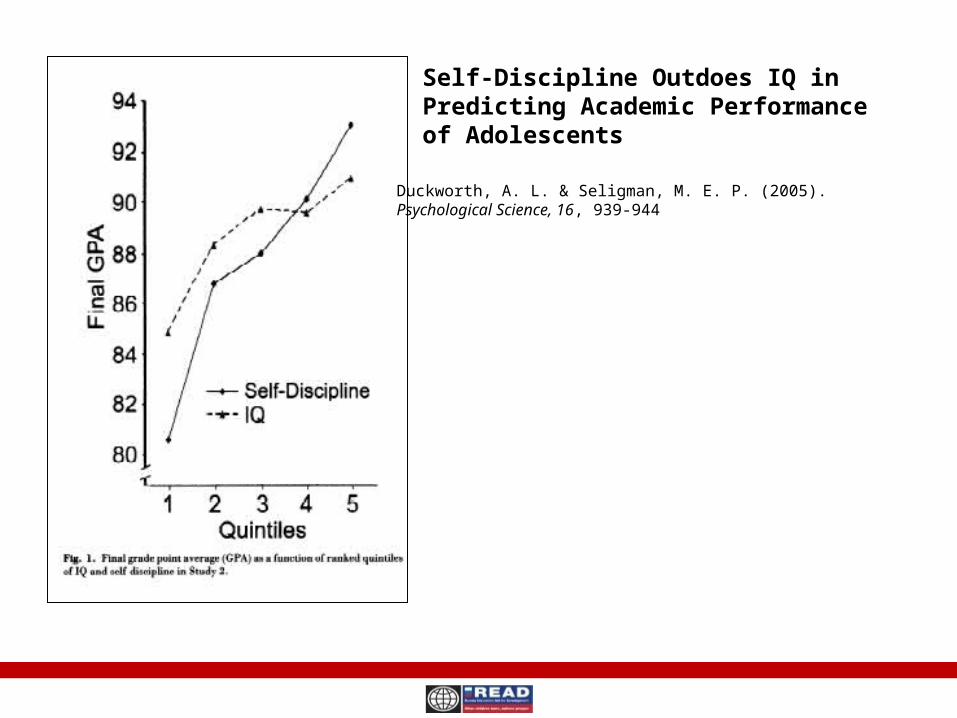
Self-Discipline Outdoes IQ in Predicting Academic Performance of Adolescents
Duckworth, A. L. & Seligman, M. E. P. (2005). Psychological Science, 16, 939-944
Grit Scale
GRIT: Perseverance for achieving long-term goals
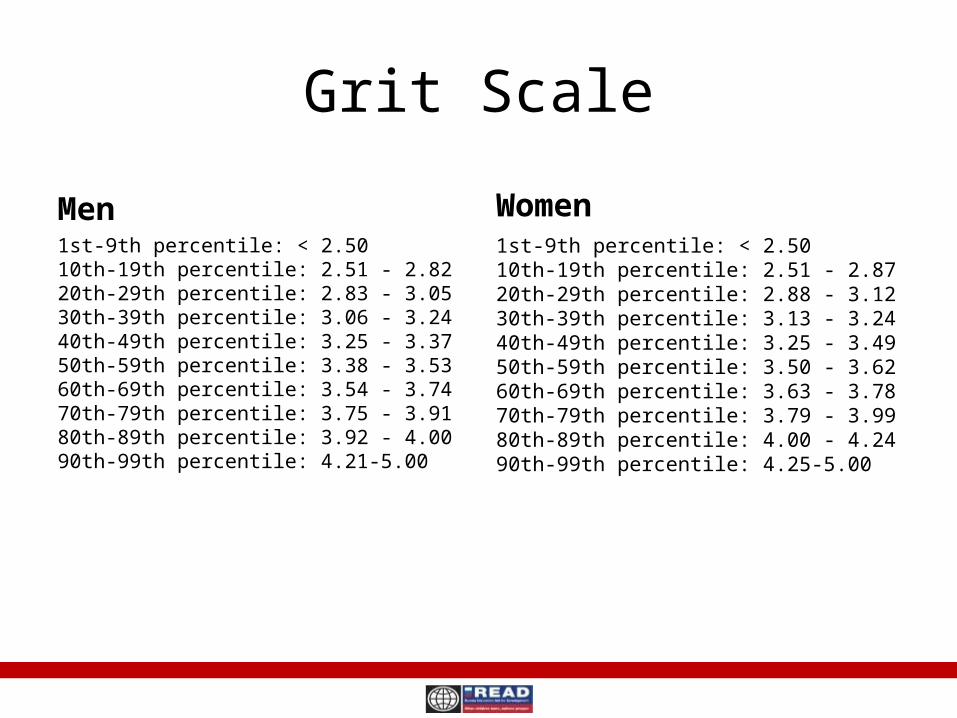
Grit Scale
Men1st-9th percentile: < 2.5010th-19th percentile: 2.51 - 2.8220th-29th percentile: 2.83 - 3.0530th-39th percentile: 3.06 - 3.2440th-49th percentile: 3.25 - 3.3750th-59th percentile: 3.38 - 3.5360th-69th percentile: 3.54 - 3.7470th-79th percentile: 3.75 - 3.9180th-89th percentile: 3.92 - 4.0090th-99th percentile: 4.21-5.00
Women1st-9th percentile: < 2.5010th-19th percentile: 2.51 - 2.8720th-29th percentile: 2.88 - 3.1230th-39th percentile: 3.13 - 3.2440th-49th percentile: 3.25 - 3.4950th-59th percentile: 3.50 - 3.6260th-69th percentile: 3.63 - 3.7870th-79th percentile: 3.79 - 3.9980th-89th percentile: 4.00 - 4.2490th-99th percentile: 4.25-5.00
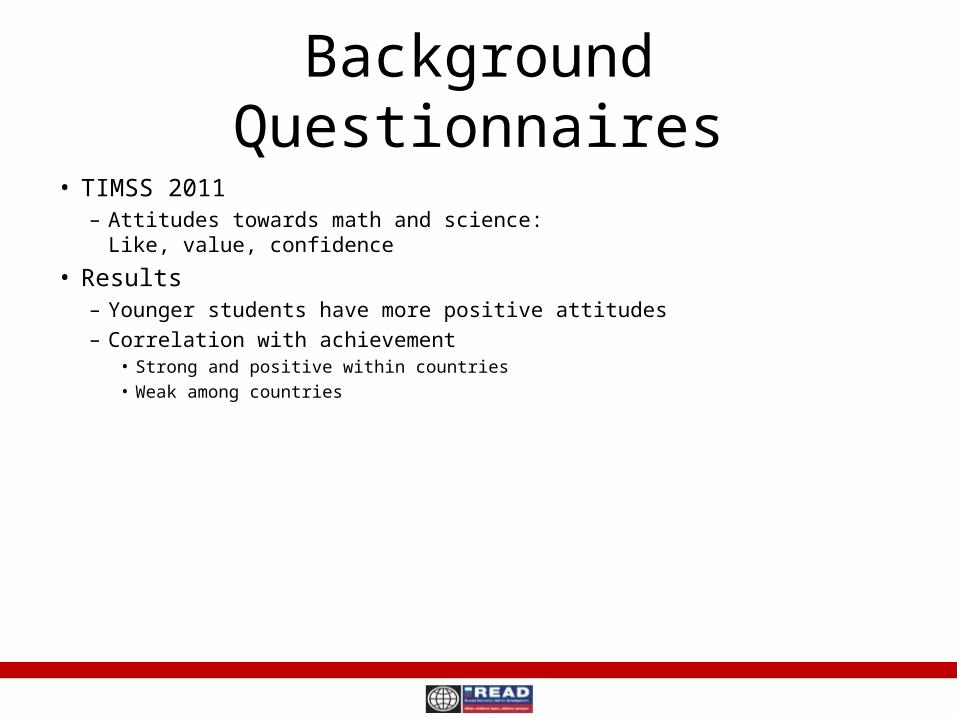
Background Questionnaires• TIMSS 2011
– Attitudes towards math and science: Like, value, confidence
• Results– Younger students have more positive attitudes– Correlation with achievement
• Strong and positive within countries• Weak among countries
Discussion
• Should we move towards measuring personality traits? How?
Challenge 3:Reaching out of school population
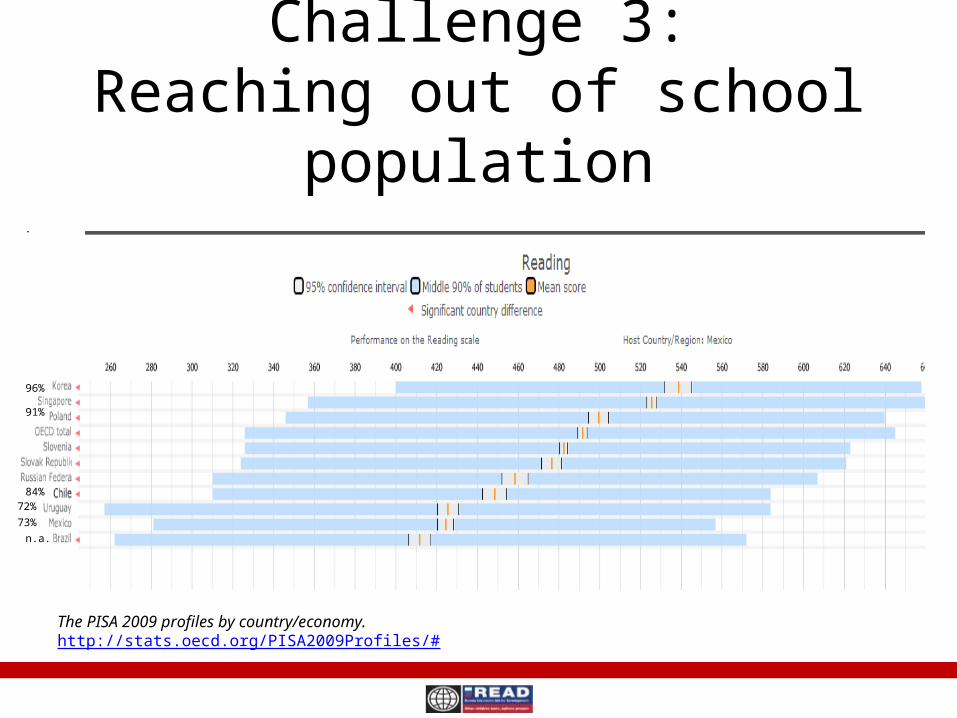
Challenge 3:Reaching out of school population
73%
72%84%
91%
96%
n.a.
The PISA 2009 profiles by country/economy.http://stats.oecd.org/PISA2009Profiles/#
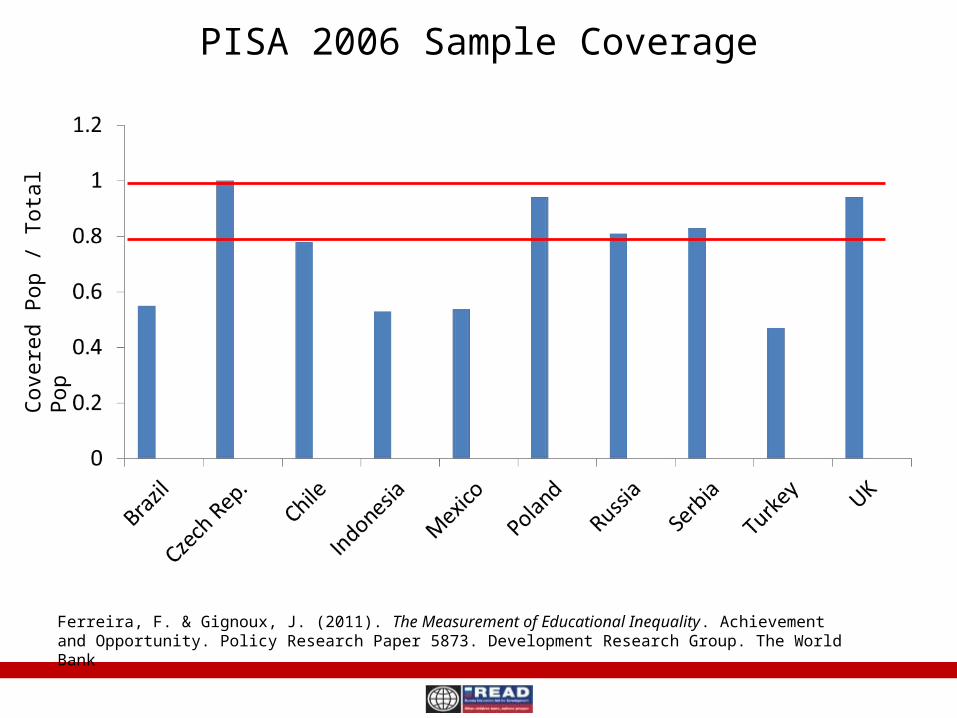
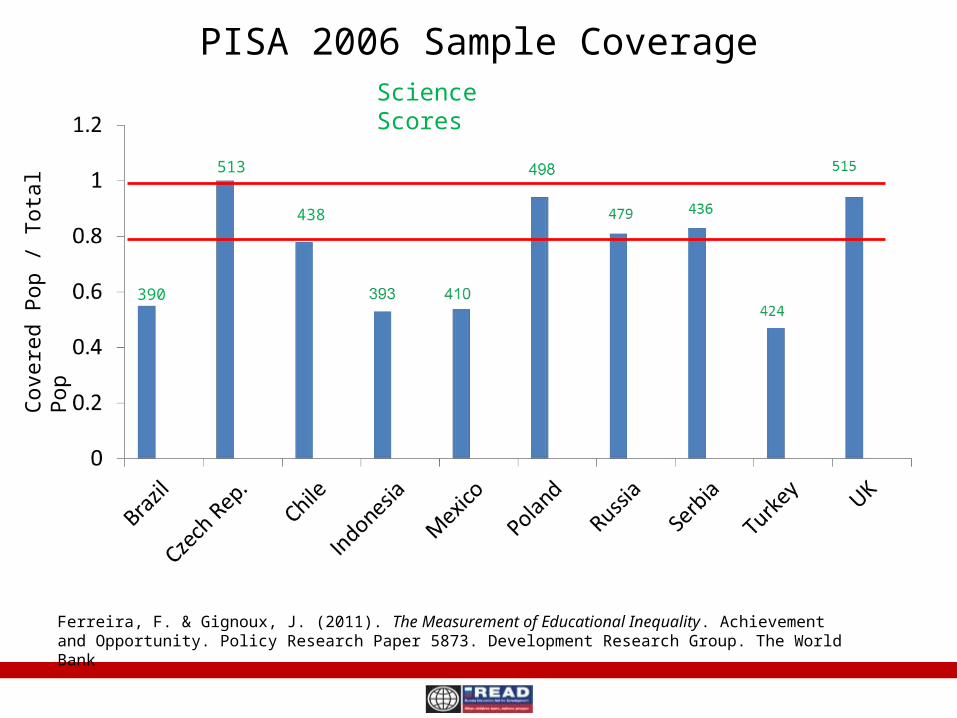
PISA 2006 Sample Coverage
Ferreira, F. & Gignoux, J. (2011). The Measurement of Educational Inequality. Achievement and Opportunity. Policy Research Paper 5873. Development Research Group. The World Bank
Cov
ered
Pop
/ T
otal
Pop
PISA 2006 Sample Coverage
Ferreira, F. & Gignoux, J. (2011). The Measurement of Educational Inequality. Achievement and Opportunity. Policy Research Paper 5873. Development Research Group. The World Bank
Cov
ered
Pop
/ T
otal
Pop
390
513
438
Science Scores
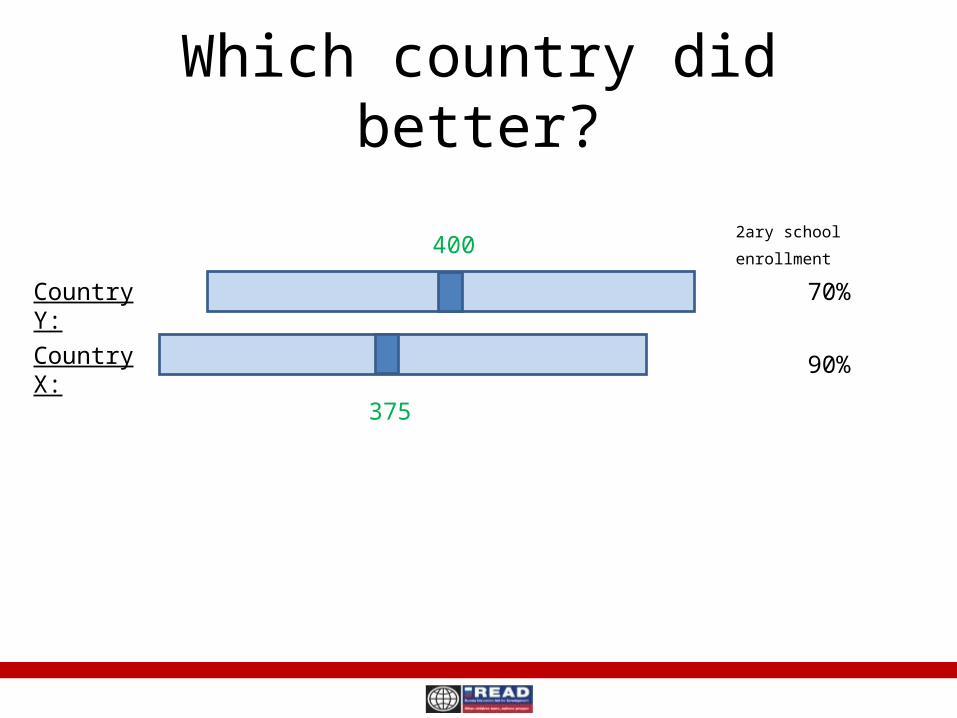
Which country did better?
Country Y:
Country X:
70%
90%
2ary school enrollment 400
375
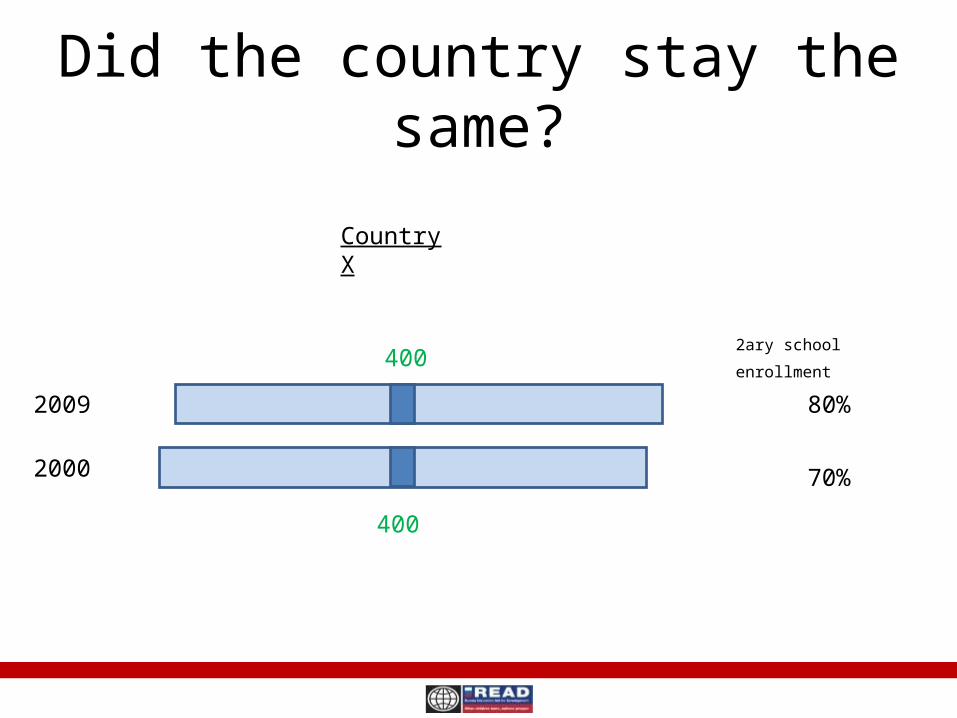
Did the country stay the same?
2009
2000
80%
70%
2ary school enrollment 400
400
Country X
Discussion
• Should we compare countries with different proportions of out-of-school population?
Challenge 4: What to measure?
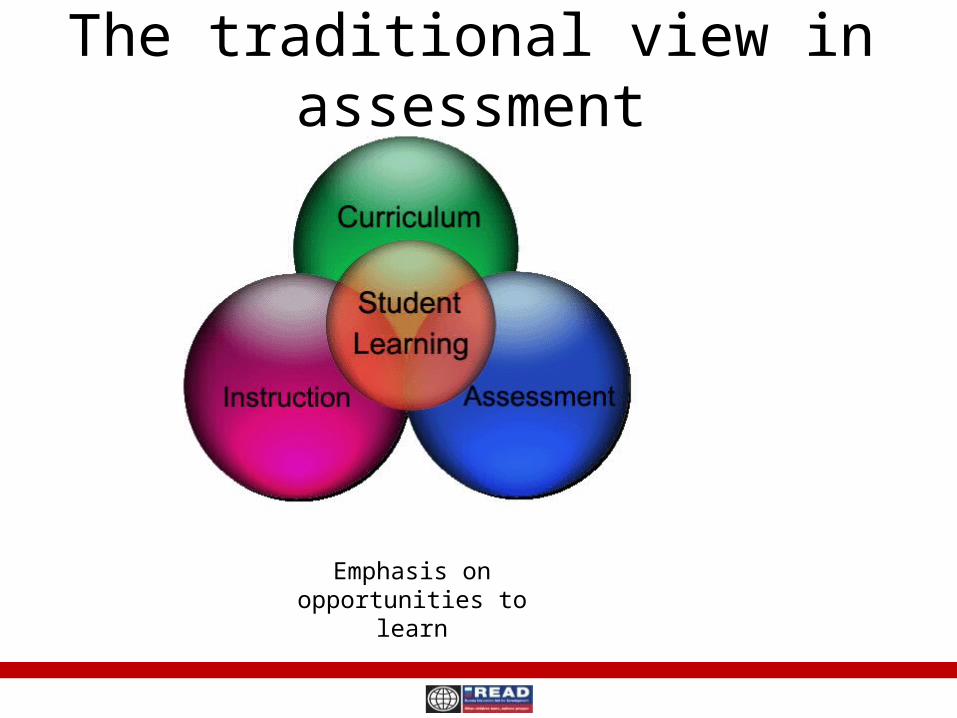
The traditional view in assessment
Emphasis on opportunities to learn
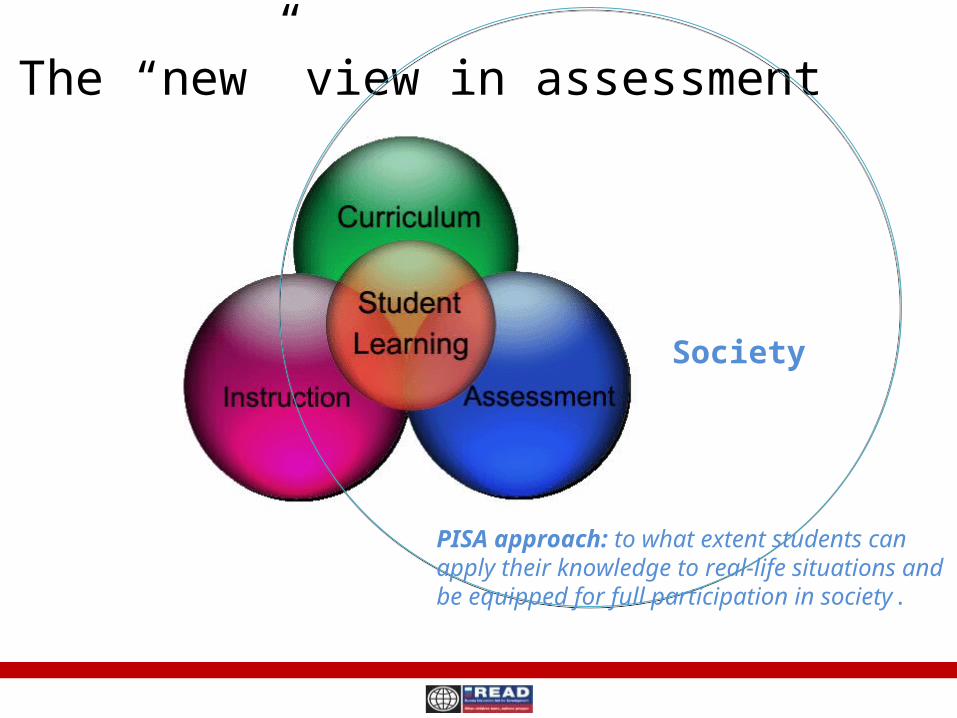
The “new” view in assessment
Society
PISA approach: to what extent students can apply their knowledge to real-life situations and be equipped for full participation in society.
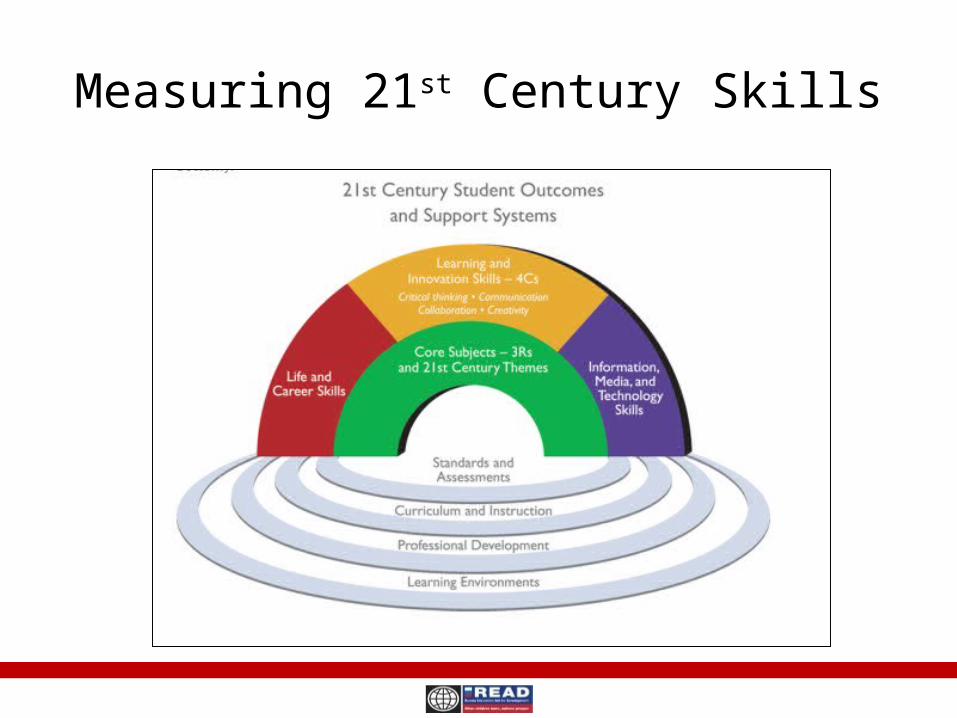
Measuring 21st Century Skills
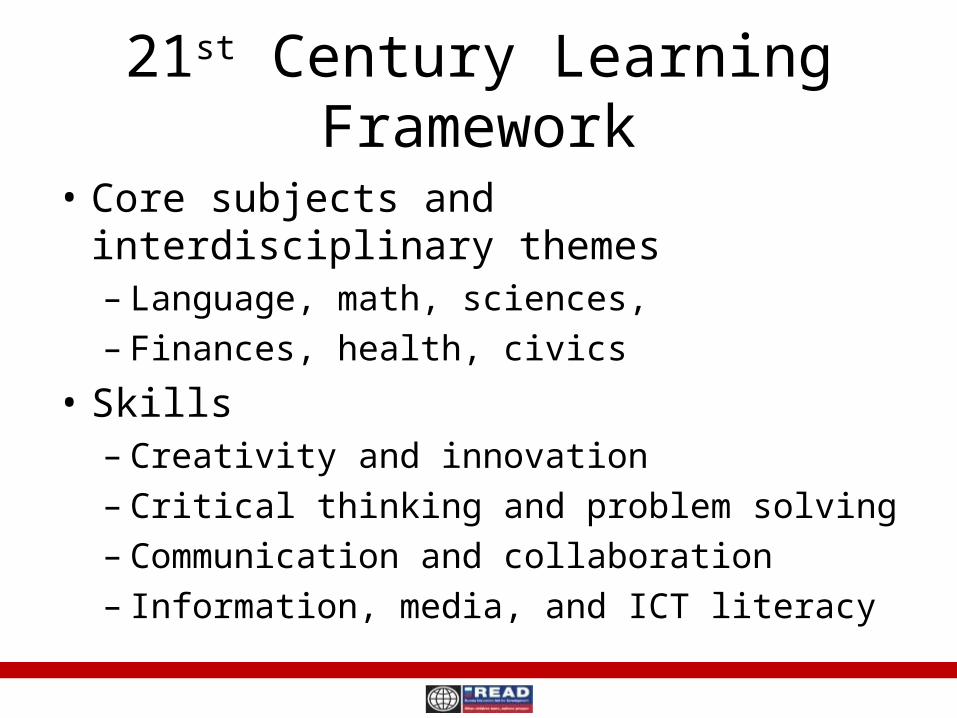
21st Century Learning Framework
• Core subjects and interdisciplinary themes– Language, math, sciences, – Finances, health, civics
• Skills– Creativity and innovation– Critical thinking and problem solving– Communication and collaboration– Information, media, and ICT literacy
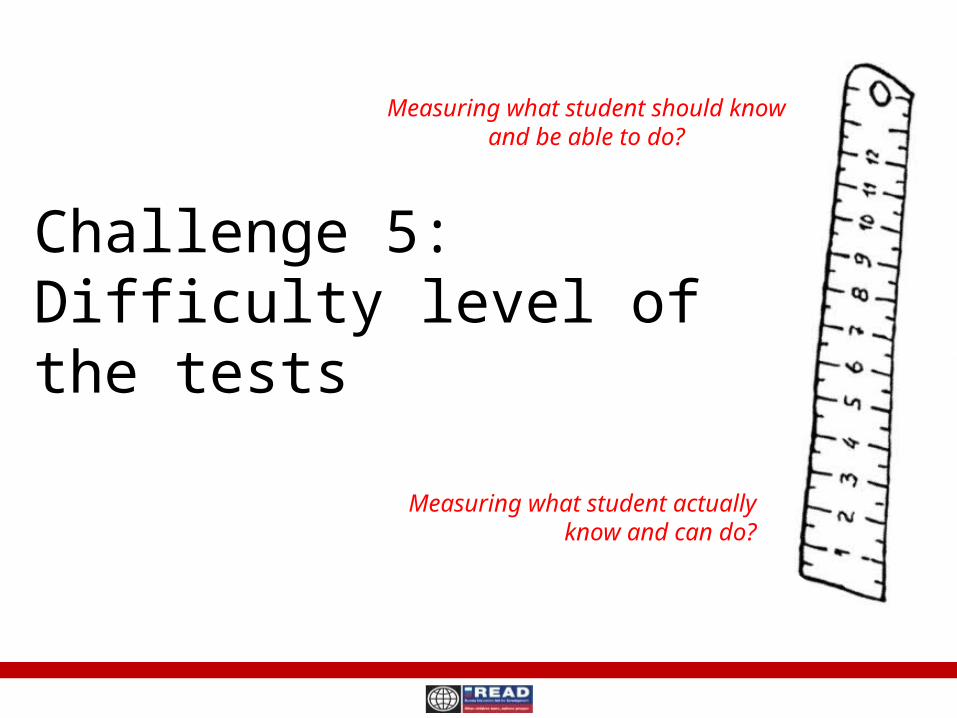
Challenge 5:Difficulty level of the tests
Measuring what student should know and be able to do?
Measuring what student actually know and can do?
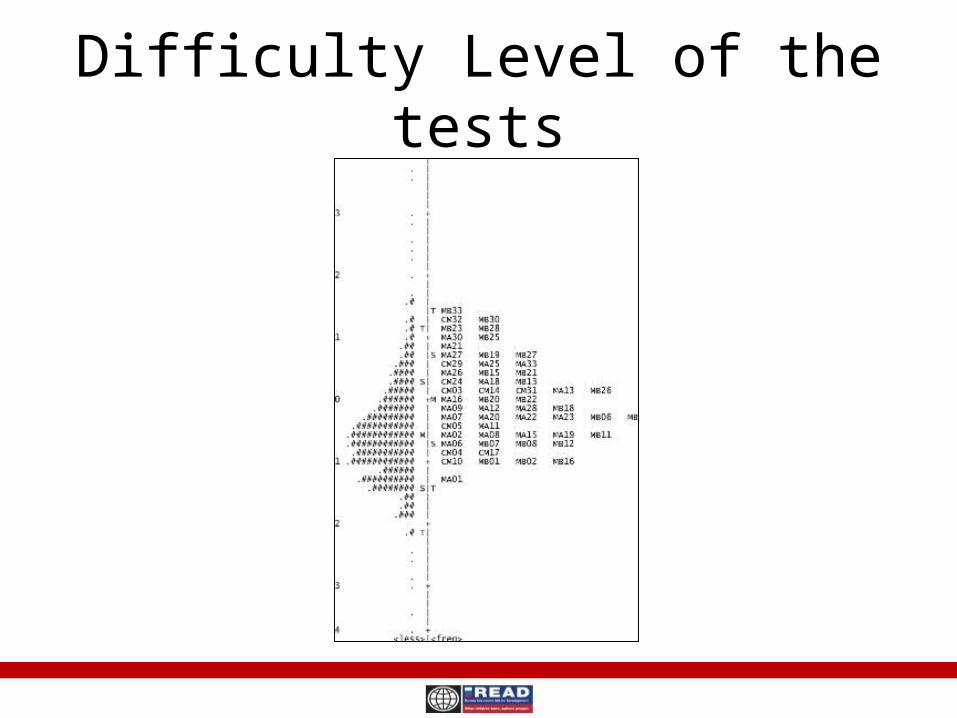
Difficulty Level of the tests
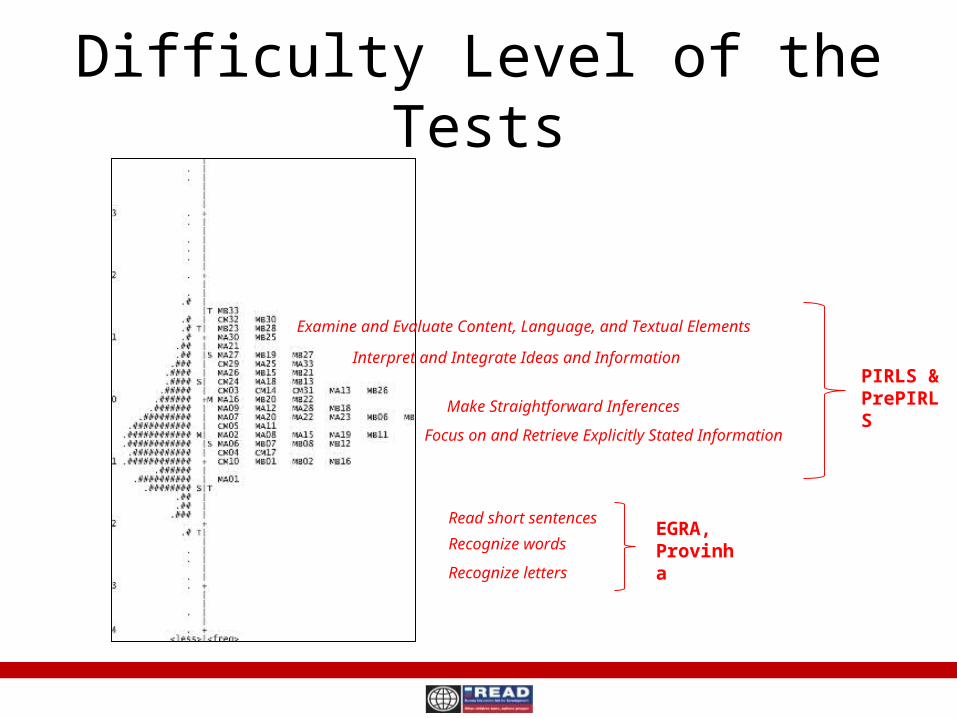
Difficulty Level of the Tests
Focus on and Retrieve Explicitly Stated Information
Make Straightforward Inferences
Interpret and Integrate Ideas and Information
Examine and Evaluate Content, Language, and Textual Elements
Recognize letters
Recognize words
Read short sentences
PIRLS & PrePIRLS
EGRA, Provinha
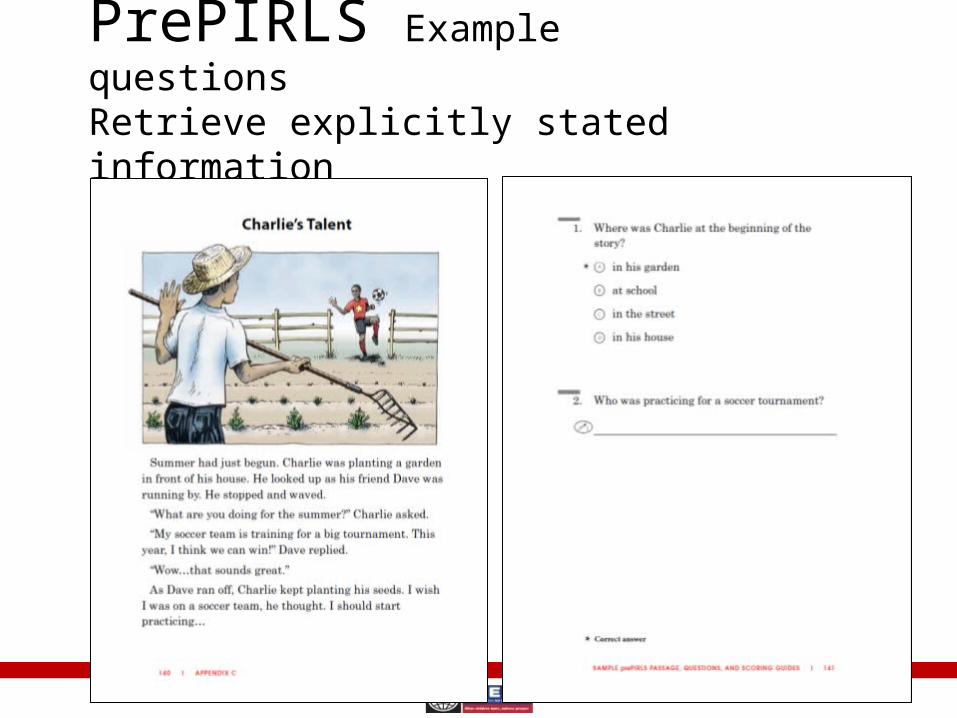
PrePIRLS Example questionsRetrieve explicitly stated information
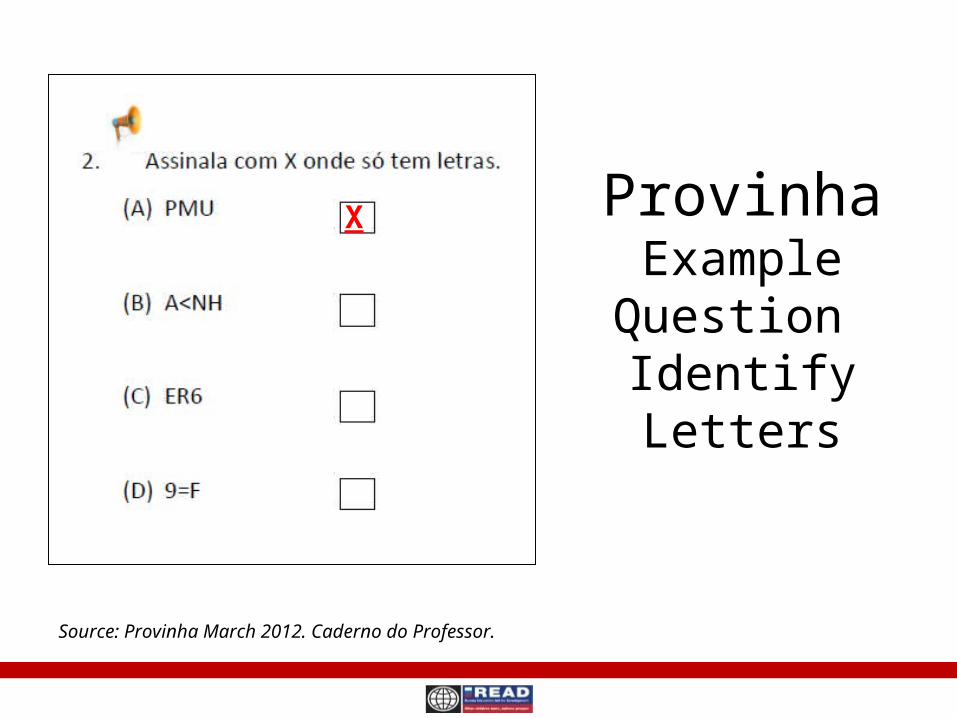
ProvinhaExample Question
Identify Letters
Source: Provinha March 2012. Caderno do Professor.
X
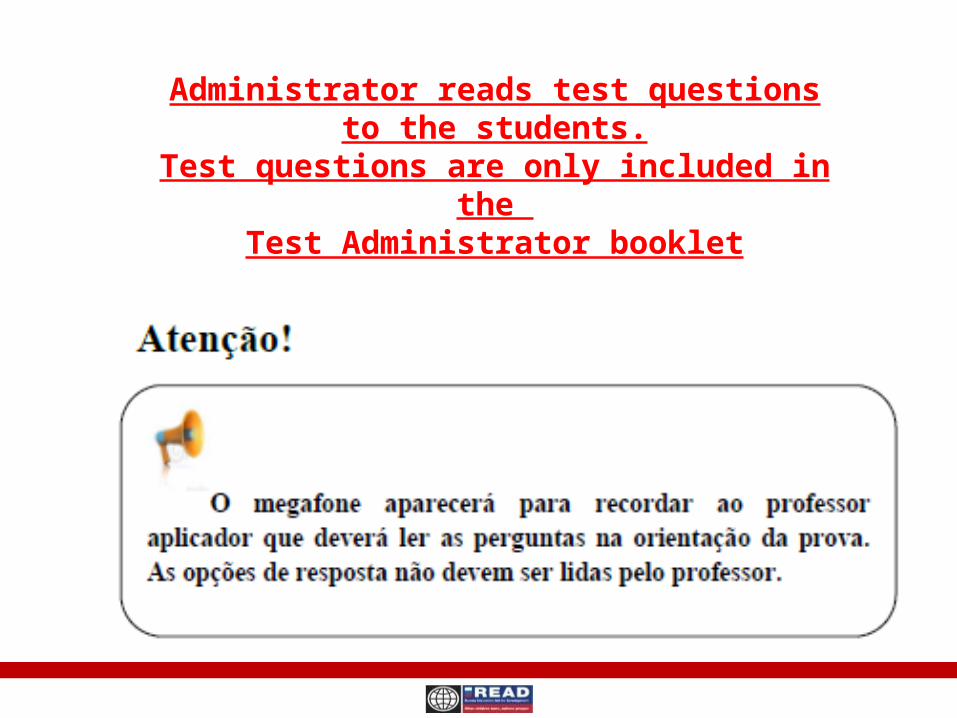
Administrator reads test questions to the students.
Test questions are only included in the Test Administrator booklet
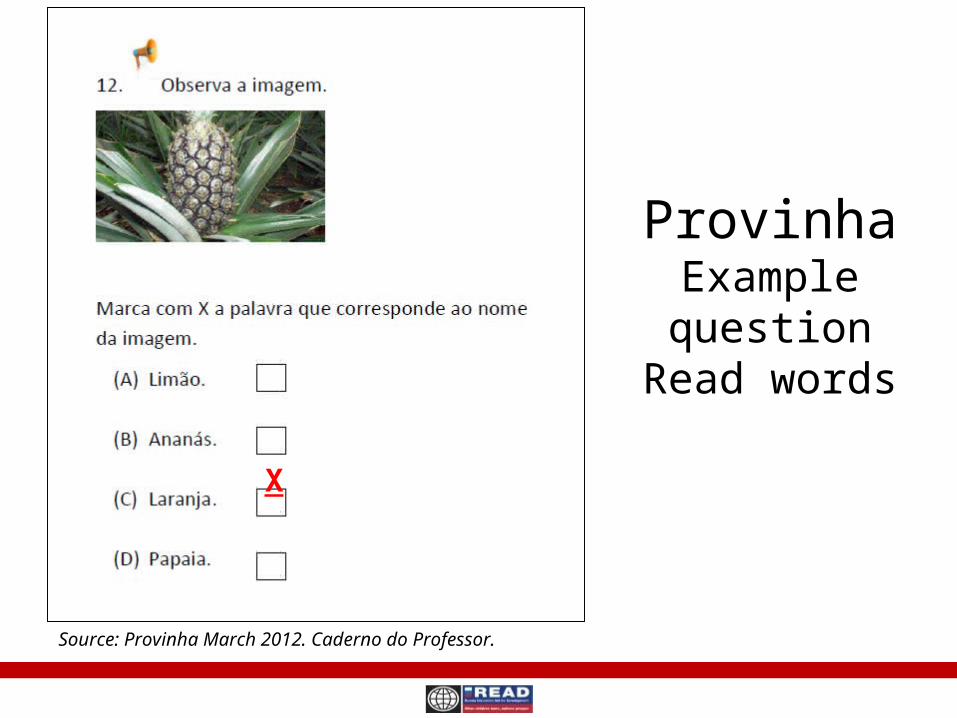
Provinha Example question
Read words
Source: Provinha March 2012. Caderno do Professor.
X

Difficulty Level of the Tests
Focus on and Retrieve Explicitly Stated Information
Make Straightforward Inferences
Interpret and Integrate Ideas and Information
Examine and Evaluate Content, Language, and Textual Elements
Recognize letters
Recognize words
Read short sentences
PIRLS & PrePIRLS
EGRA, Provinha
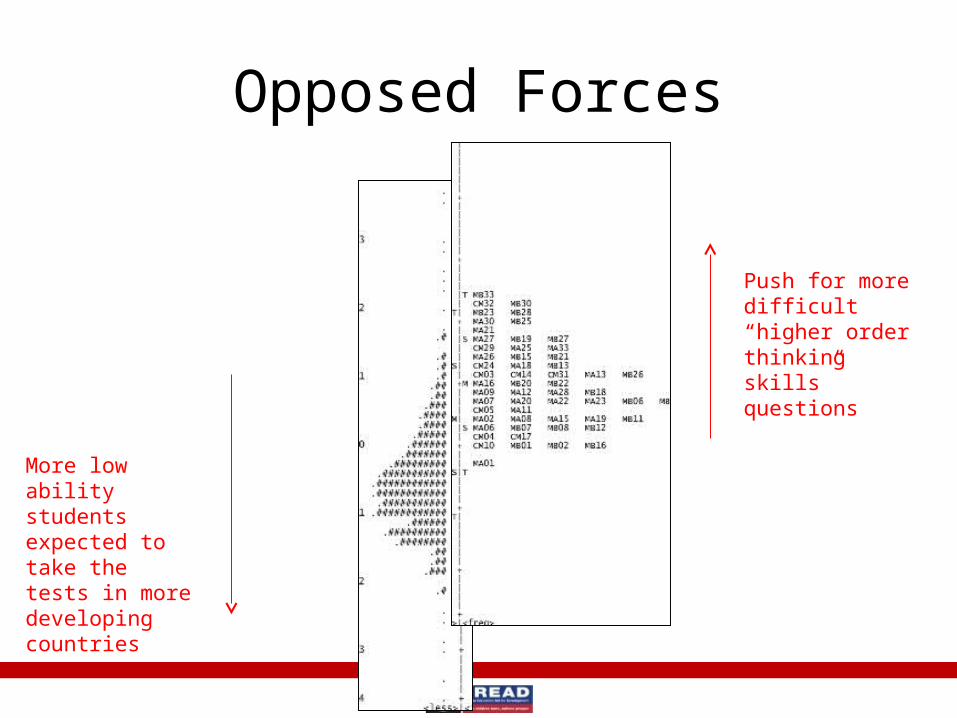
Opposed Forces
More low ability students expected to take the tests in more developing countries
Push for more difficult “higher order thinking skills” questions
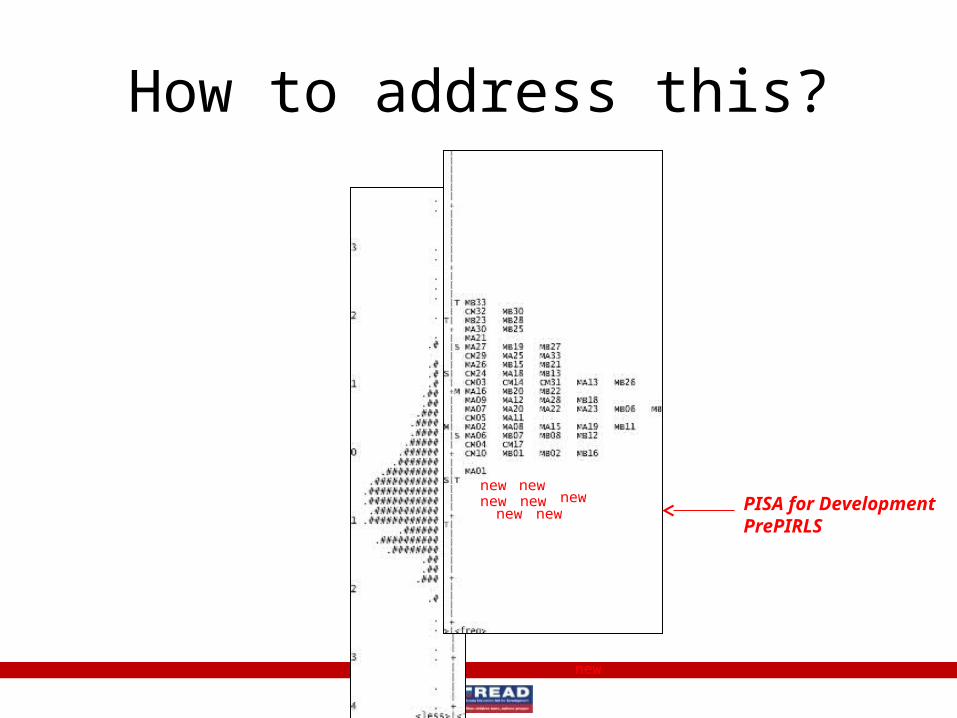
How to address this?
new
newnew new
newnew
newnew PISA for Development
PrePIRLS
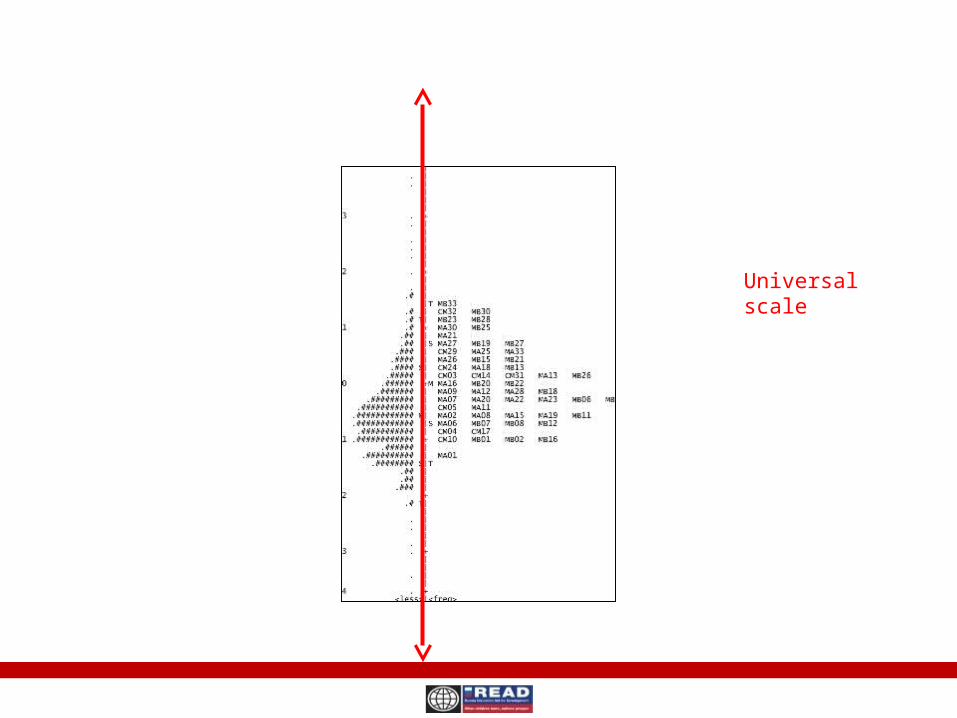
Universal scale
Discussion
What challenges do you foresee?How can they be addressed?


![arXiv:1909.02799v1 [eess.IV] 6 Sep 20194 Moscow Gamma-Knife Center, Moscow, Russia 5 Burdenko Neurosurgery Institute, Moscow, Russia m.belyaev@skoltech.ru Abstract. Stereotactic radiosurgery](https://img.pdfslide.net/doc/110x75/5f97243497bac815b47f8d13/arxiv190902799v1-eessiv-6-sep-2019-4-moscow-gamma-knife-center-moscow-russia.jpg)