Embed Size (px)
Citation preview

Challenges in Public Health Development in
Developing Countries
Than Sein
Challenges in Public Health Development in Developing Countries 1

An Overview• Demographic and epidemiological transition
• Double Burden – communicable diseases as well as noncommunicable diseases (new, emerging and re‐emerging)
• Health Inequity; Health Insecurity
• Rapid development of technology, trade expansion and liberalization, fastest transportation and communication (New Globalization)
• Many players in international health –Governments, Philanthropists, INGOs, NNGOs, Partnerships
Challenges in Public Health Development in Developing Countries 2

Challenges in Public Health Development in Developing Countries 3
Trends in Human Development
0.0
0.2
0.4
0.6
0.8
1.0
Timor-LesteNepal
BangladeshLaos
Bhutan
Myanmar
CambodiaIndia
Vietnam
Indonesia
Sri Lanka
China
Maldives
Philippines
ThailandMalaysia
Brunei
Singapore
1975 1980 1985 1990 1995 2000 2002
HDI value
Source: UNDP, Human Development Report 2004
Year

Challenges in Public Health Development in Developing Countries 4
0.000
0.100
0.200
0.300
0.400
0.500
0.600
0.700
0.800
0.900
1.000
Timor-Leste Nepal Bangladesh Bhutan Myanmar India Indonesia Sri Lanka Maldives Thailand
Inde
x va
lue
LEB EDU GDP HDI
Three Sub-index values of HDI in SEAR Countries, 2002

Prevalence of Under‐5 Under‐weight children among SEAR Countries
0
10
20
30
40
50
60
Bangladesh India Nepal Timor-Leste Bhutan Sri Lanka Indonesia Myanmar Maldives Thailand DPR Korea
Prev
alen
ce (%
)
1990 2002 2015
Source : WHO/SEARO, Routine and ad hoc reports from countries to the EHI Unit as of June 2004
Baseline data for 1990 for Timor-Leste and Maldives are estimates and 2015 is target set as MDG

Low Birth Weight Prevalence by Districts, Sri Lanka, 2002
11.6
11.8
13.4
13.7
13.7
14.6
15.0
15.2
15.5
15.6
16.2
16.3
16.6
16.8
17.7
17.9
17.9
18.0
18.5
19.1
19.2
19.4
21.7
22.8
29.4
17.1
0 5 10 15 20 25 30 35
Kilinochchi
Trincomalee
Galle
Ampara
Jaffna
Polonnaruwa
Vavuniya
Puttalam
Matara
Kurunegala
Mullaitivu
Kalutara
Kegalle
Colombo
Sri Lanka
Hambantota
Matale
Ratnapura
Gampaha
Anuradhapura
Kandy
Moneragala
Batticaloa
Badulla
Mannar
Nuwara Eliya
Low Birth Weight per 100 live births
Ampara
Anuradhapura
Moneragala
Kurunegala
Badulla
Puttalam
Ratnapura
Galle
Matale
Kandy
Mullaitivu
Polonnaruwa
Mannar
Batticaloa
Kegalle
Vavuniya
Hambantota
Trincomalee
Kalutara
Matara
GampahaNuwara
Eliya
Kilinochchi
Jaffna
Colombo
Gampaha
18.5
19.2
15.6
13.7
14.6
17.9
15.2
21.7
11.8
17.7
16.2
19.4
17.9
15.0
19.1
22.8
29.4
16.6
16.3
13.4
18.0
15.5
11.6
16.8
13.7
LBW per 100 live births10 - 15
15 - 20
20 - 25
25 - 30
Legend
Source : Family Health Bureau
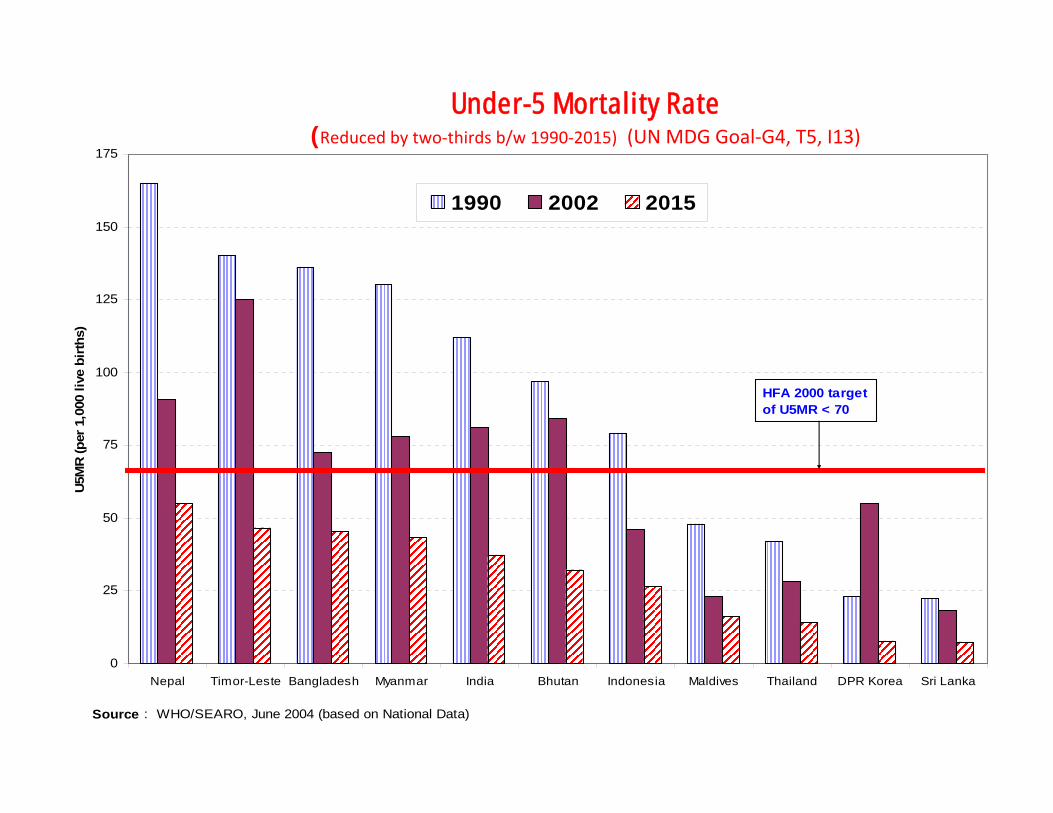
Under-5 Mortality Rate(Reduced by two‐thirds b/w 1990‐2015) (UN MDG Goal‐G4, T5, I13)
0
25
50
75
100
125
150
175
Nepal Timor-Leste Bangladesh Myanmar India Bhutan Indonesia Maldives Thailand DPR Korea Sri Lanka
U5M
R (p
er 1
,000
live
birt
hs)
1990 2002 2015
Source : WHO/SEARO, June 2004 (based on National Data)
HFA 2000 target of U5MR < 70

Infant Mortality Rate, Sri Lanka, 2001
2.0
3.2
4.3
5.1
5.2
5.6
5.9
6.8
7.3
7.5
7.6
7.9
10.0
10.0
12.4
13.1
13.1
13.5
14.4
14.6
15.9
17.3
20.7
20.9
22.5
12.2
0 5 10 15 20 25
Trincomalee
Moneragala
Kalutara
Jaffna
Gampaha
Hambantota
Ampara
Puttalam
Kilinochchi
Mannar
Matara
Matale
Kegalle
Vavuniya
Sri Lanka
Ratnapura
Polonnaruwa
Kurunegala
Galle
Mullaitivu
Batticaloa
Colombo
Kandy
Nuwara Eliya
Badulla
Anuradhapura
Infant M ortality Rate per 1,000 Live Births
Ampara
Anuradhapura
Moneragala
Kurunegala
Badulla
Puttalam
Ratnapura
Galle
Matale
Kandy
Mullaitivu
Polonnaruwa
Mannar
Batticaloa
Kegalle
Vavuniya
Hambantota
Trincomalee
Kalutara
Matara
GampahaNuwara
Eliya
Kilinochchi
Jaffna
Colombo
Gampaha
22.5
3.2
5.9
13.1
6.813.1
12.4
2.0
5.6
20.9
14.4
14.6
7.9
7.510.0
17.3
4.3
20.7
10.0
13.5
5.2
7.6
7.3
15.9
5.1
Infant Mortality Rate per 1,000 Live Births
2 - 5
5 - 10
10 - 15
15 - 20
20 - 25
Legend
Source : Sri Lanka Health Atlas 2003

47
6770 71
75 76 77 78
94
99 99
0
10
20
30
40
50
60
70
80
90
100
Timor-Leste India SEAR Nepal Myanmar Indonesia Bangladesh Bhutan Thailand Maldives Sri Lanka
Percentage
Source : WHO/SEARO, IVD Unit Note : Data for DPR Korea not available
Measles coverage in SEAR countries, 2002Measles coverage in SEAR countries, 2002

Total cases > 25,000
Trend and distribution of polio casesin the SEA Region, 1988 and 2003
1988 2003
Source: IVD Unit, WHO-SEARO
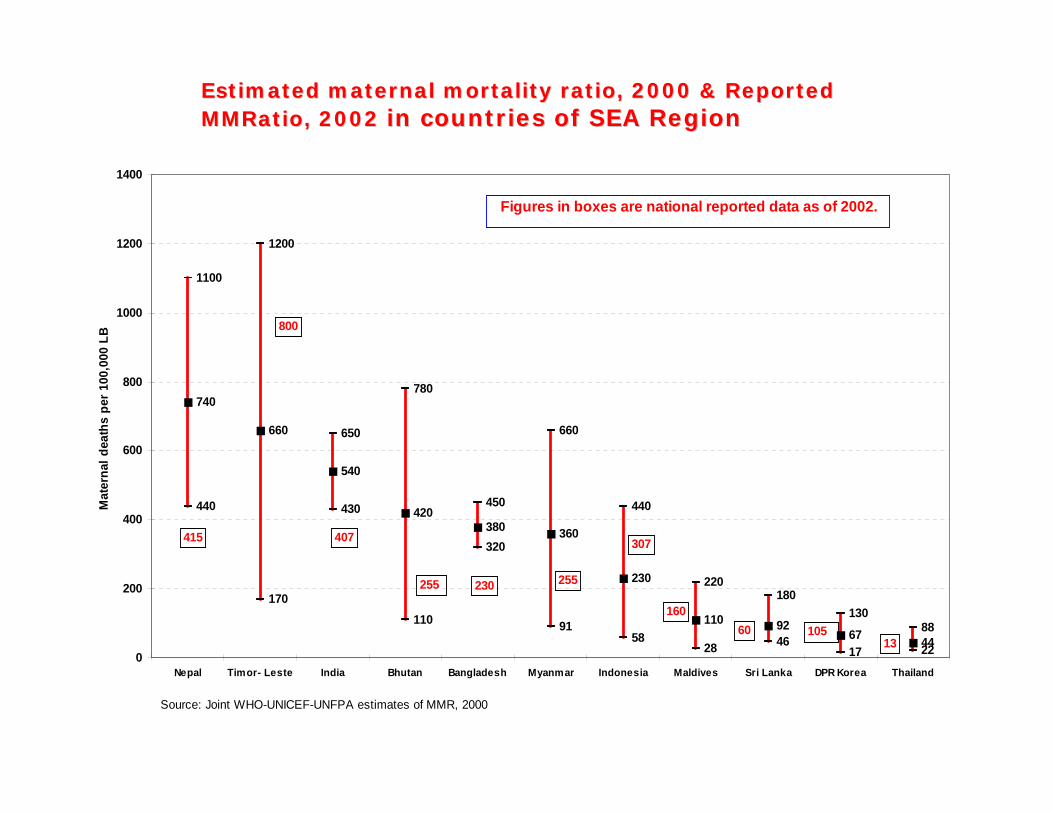
1100
1200
650
780
450
660
440
220180
13088
440
170
430
110
320
9158
28 4617 22
740
660
540
420380 360
230
110 9267 44
0
200
400
600
800
1000
1200
1400
Nepal Timor- Leste India Bhutan Bangladesh Myanmar Indonesia Maldives Sri Lanka DPR Korea Thailand
Mat
erna
l dea
ths
per 1
00,0
00 L
B
415
800
407
255 255230
307
16060 105
13
Figures in boxes are national reported data as of 2002.
Source: Joint WHO-UNICEF-UNFPA estimates of MMR, 2000
Estimated maternal mortality ratio, 2000 & Reported Estimated maternal mortality ratio, 2000 & Reported MMRatio, 2002 MMRatio, 2002 in countries of SEA Regionin countries of SEA Region

Coverage of births by skilled attendants in India by States, 1998-99 94.0
90.8
83.8
67.5
65.9
65.2
62.6
59.4
59.1
53.9
53.5
44.2
42.4
42.3
42.0
40.2
35.8
35.1
33.4
32.8
31.9
29.7
23.4
22.4
21.4
20.6
0 10 20 30 40 50 60 70 80 90 100
Kerala
Goa
Tamil Nadu
Mizoram
Delhi
Andhra Pradesh
Punjab
Maharashtra
Karnataka
Manipur
Gujarat
West Bengal
Jammu & Kashmir
India
Haryana
Himachal Pradesh
Rajasthan
Sikkim
Orissa
Nagaland
Arunachal Pradesh
Madhya Pradesh
Bihar
Uttar Pradesh
Assam
Meghalaya
Source: India, National Family Health Survey (NFHS-II), 1998-99 Percentage
Challenges in Public Health Development in Developing Countries 13

Challenges in Public Health Development in Developing Countries 14

8 8
360
975
4,500
9,750
31,50050,250
343,500
1
10
100
1,000
10,000
100,000
1,000,000
Bhutan
Maldive
s
Sri Lan
ka
Bangla
desh
Nepal
Indon
esia
Myanm
ar
Thaila
nd
India
Num
ber o
f HIV
/AID
S pa
tient
s
Source : WHO/SEARO, HIV/AIDs Unit
ARV Treatment Needs of countries in the SEA ARV Treatment Needs of countries in the SEA Region (as of December 2003)Region (as of December 2003)
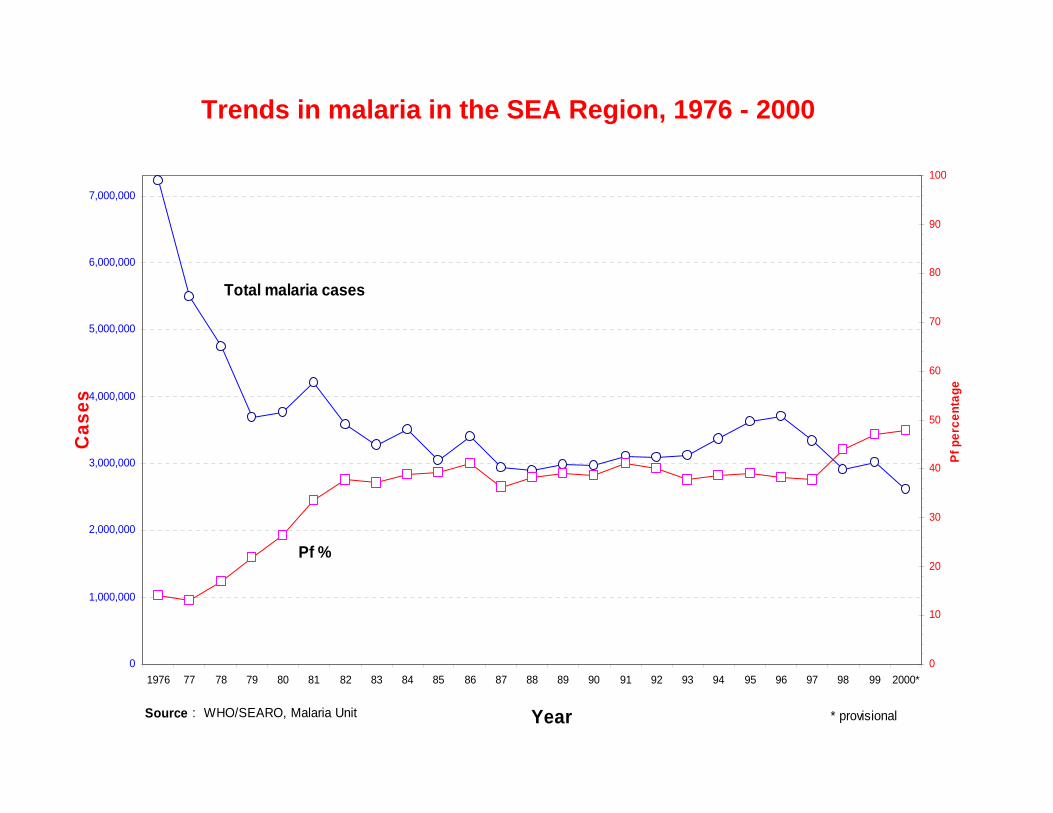
0
1,000,000
2,000,000
3,000,000
4,000,000
5,000,000
6,000,000
7,000,000
1976 77 78 79 80 81 82 83 84 85 86 87 88 89 90 91 92 93 94 95 96 97 98 99 2000*
Year
Cas
es
0
10
20
30
40
50
60
70
80
90
100
Pf p
erce
ntag
e
Source : WHO/SEARO, Malaria Unit * provisional
Total malaria cases
Pf %
Trends in malaria in the SEA Region, 1976 - 2000

Trends in TB case detection in the SEA, 1990-20020
0
10
20
30
40
50
60
70
80
1990 1995 2000 2005 2010 2015 2020
Global average rate of progress
Target 70%
SEAR 2000--2003 effort:
Challenges in Public Health Development in Developing Countries 18

0
10
20
30
40
50
60
70
80
90
1991 1992 1995 1997 1998 1999 2000
Total
Medical care for the poor and the socially supported (underprivileged) groups
Voluntary health insuranceMedical services for civil servants and state
enterprise employees
Compulsory health insurance
Source: Thailand Health Profile 1997-1998
Trends in coverage by health insurance schemes in Thailand 1991-2000
ChallengesSocio‐economic and political changesDemographic and Epidemiological TransitionsDouble Burden of diseasesIncreasing role of private health care providersIncreasing responsibility by individualsGlobalization ‐ rapid advancement in ideas and technology, ease of communication, spread of mass media, trade liberalizationChanging role in health governance (local, national, international)
Challenges in Public Health Development in Developing Countries 20
Challenge for Health Systems• Improving performance
Improving balance and relevance of human resources; Improving financing of health systems;Reducing physical and social barriers;safe and predictable supplies of affordable drugs and vaccines;Choosing effective interventions; andstrengthening stewardship, including working with other sectors.
Challenges in Public Health Development in Developing Countries 21