Embed Size (px)
Citation preview
FUNDAMENTALS December 2013
620 Newport Center Drive, Suite 900Newport Beach, CA 92660+1 (949) 325-8700
Media ContactsTucker HewesHewes Communications+ 1 (212) [email protected] ChernoffResearch Affiliates+ 1 (949) [email protected]
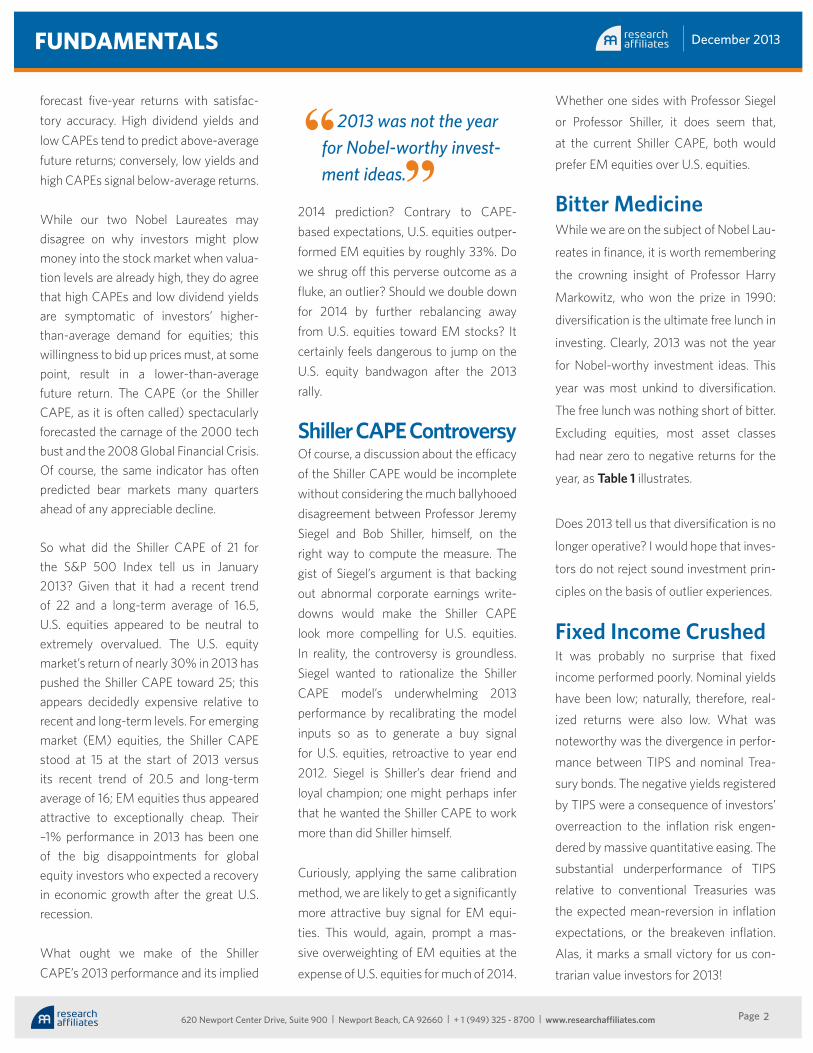
RAFI® Managed Assets*
*Includes RAFI® assets managed or sub-advised by Research Affiliates or RAFI licensees.
0$10$20$30$40$50$60$70$80$90
$100$110
3Q13E2Q131Q134Q124Q114Q104Q094Q084Q074Q064Q05
USD in Billions
Jason Hsu, Ph.D.
Christmas will soon be upon us. Many of us in the investment business have just completed annual performance reviews and informed our staff of compensation decisions that are charged with practical and symbolic signifi-cance. These are bittersweet times. No doubt we all have talented people who have put in great effort but met with bad luck and worse results. Clearly, there is no lack of the opposite as well. Ah, the million dollar question in man-agement and a topic for yet another B-school case study: “Do you reward application or out-come? Input or output?” The aftertaste in our mouth may be the eggnog, but perhaps it is the smack of our better judgment and the trace of our choice to pay big incentives for what we know was partly the product of chance. In any event, we concede that the ritual of celebrat-ing good fortune is best observed in this time of festivity. You might have been a big winner. You might be the lucky one next year. Have some eggnog.
And there is an inescapable irony. In our quiet introspection, as we look back on this past year, we, the investment officers and research analysts of the world, are smarting from the same thing. It’s been a tough year for anyone who hasn’t boldly overweighted U.S. equities in the face of inevitable tapering, continual
political dysfunction, and the uncertainty sur-rounding public policy. It’s been a bad year for anyone who has prudentially diversified away from a concentrated equity allocation. Nearly everything else has performed abysmally.
But let’s not dwell on the unpleasantness. Let’s take credit for what we got right. Let’s bemoan the irrationality of the market for the calls that we got wrong. And let’s look ahead to the coming market environment. A humor-ist said, “An economist is an expert who will know tomorrow why the things he predicted yesterday didn’t happen today.”1
Forecast the Market?Forecasting the future would merely be psy-chical posturing if there were no evidence for its feasibility. Fortunately, this year the Nobel Prize Foundation honored two economists who both produced works suggesting that index dividend yields and cyclically adjusted P/E ratios (CAPEs), among other aggregate variables, can predict future equity market returns. While Eugene Fama and Bob Shiller virtually anchor the opposite sides of the market efficiency debate, Shiller’s 1987 and 1988 research papers with John Campbell (1988a, b) and Fama’s paper with Ken French (1989) conclude that market valuation ratios
The Challenges of Year-End Forecasting
Do you reward application or outcome? Input or output? “ “
December 2013
2Page
FUNDAMENTALS
620 Newport Center Drive, Suite 900 | Newport Beach, CA 92660 | + 1 (949) 325 - 8700 | www.researchaffiliates.com
forecast five-year returns with satisfac-tory accuracy. High dividend yields and low CAPEs tend to predict above-average future returns; conversely, low yields and high CAPEs signal below-average returns.
While our two Nobel Laureates may disagree on why investors might plow money into the stock market when valua-tion levels are already high, they do agree that high CAPEs and low dividend yields are symptomatic of investors’ higher-than-average demand for equities; this willingness to bid up prices must, at some point, result in a lower-than-average future return. The CAPE (or the Shiller CAPE, as it is often called) spectacularly forecasted the carnage of the 2000 tech bust and the 2008 Global Financial Crisis. Of course, the same indicator has often predicted bear markets many quarters ahead of any appreciable decline.
So what did the Shiller CAPE of 21 for the S&P 500 Index tell us in January 2013? Given that it had a recent trend of 22 and a long-term average of 16.5, U.S. equities appeared to be neutral to extremely overvalued. The U.S. equity market’s return of nearly 30% in 2013 has pushed the Shiller CAPE toward 25; this appears decidedly expensive relative to recent and long-term levels. For emerging market (EM) equities, the Shiller CAPE stood at 15 at the start of 2013 versus its recent trend of 20.5 and long-term average of 16; EM equities thus appeared attractive to exceptionally cheap. Their –1% performance in 2013 has been one of the big disappointments for global equity investors who expected a recovery in economic growth after the great U.S. recession.
What ought we make of the Shiller CAPE’s 2013 performance and its implied
Whether one sides with Professor Siegel
or Professor Shiller, it does seem that,
at the current Shiller CAPE, both would
prefer EM equities over U.S. equities.
Bitter MedicineWhile we are on the subject of Nobel Lau-
reates in finance, it is worth remembering
the crowning insight of Professor Harry
Markowitz, who won the prize in 1990:
diversification is the ultimate free lunch in
investing. Clearly, 2013 was not the year
for Nobel-worthy investment ideas. This
year was most unkind to diversification.
The free lunch was nothing short of bitter.
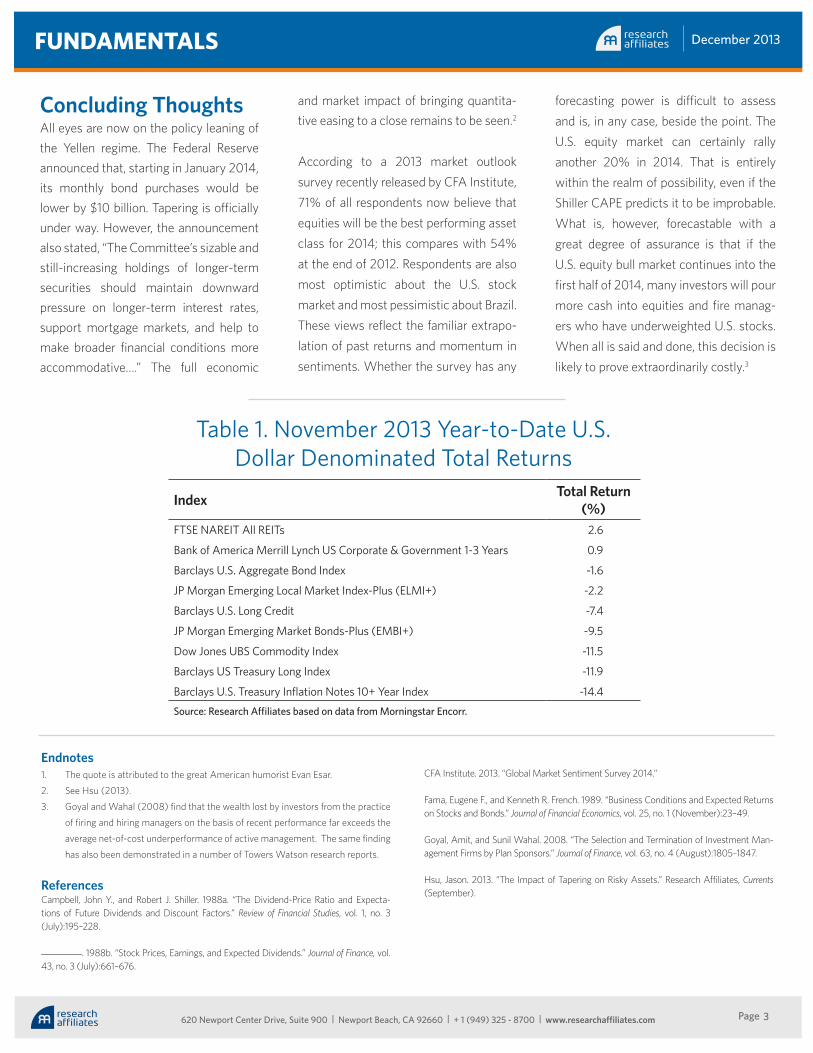
Excluding equities, most asset classes
had near zero to negative returns for the
year, as Table 1 illustrates.
Does 2013 tell us that diversification is no
longer operative? I would hope that inves-
tors do not reject sound investment prin-
ciples on the basis of outlier experiences.
Fixed Income CrushedIt was probably no surprise that fixed
income performed poorly. Nominal yields
have been low; naturally, therefore, real-
ized returns were also low. What was
noteworthy was the divergence in perfor-
mance between TIPS and nominal Trea-
sury bonds. The negative yields registered
by TIPS were a consequence of investors’
overreaction to the inflation risk engen-
dered by massive quantitative easing. The
substantial underperformance of TIPS
relative to conventional Treasuries was
the expected mean-reversion in inflation
expectations, or the breakeven inflation.
Alas, it marks a small victory for us con-
trarian value investors for 2013!
2013 was not the year for Nobel-worthy invest-ment ideas.
“ “
2014 prediction? Contrary to CAPE-based expectations, U.S. equities outper-formed EM equities by roughly 33%. Do we shrug off this perverse outcome as a fluke, an outlier? Should we double down for 2014 by further rebalancing away from U.S. equities toward EM stocks? It certainly feels dangerous to jump on the U.S. equity bandwagon after the 2013 rally.
Shiller CAPE ControversyOf course, a discussion about the efficacy of the Shiller CAPE would be incomplete without considering the much ballyhooed disagreement between Professor Jeremy Siegel and Bob Shiller, himself, on the right way to compute the measure. The gist of Siegel’s argument is that backing out abnormal corporate earnings write-downs would make the Shiller CAPE look more compelling for U.S. equities. In reality, the controversy is groundless. Siegel wanted to rationalize the Shiller CAPE model’s underwhelming 2013 performance by recalibrating the model inputs so as to generate a buy signal for U.S. equities, retroactive to year end 2012. Siegel is Shiller’s dear friend and loyal champion; one might perhaps infer that he wanted the Shiller CAPE to work more than did Shiller himself.
Curiously, applying the same calibration method, we are likely to get a significantly more attractive buy signal for EM equi-ties. This would, again, prompt a mas-sive overweighting of EM equities at the
expense of U.S. equities for much of 2014.
December 2013
3Page
FUNDAMENTALS
620 Newport Center Drive, Suite 900 | Newport Beach, CA 92660 | + 1 (949) 325 - 8700 | www.researchaffiliates.com
Concluding ThoughtsAll eyes are now on the policy leaning of the Yellen regime. The Federal Reserve announced that, starting in January 2014, its monthly bond purchases would be lower by $10 billion. Tapering is officially under way. However, the announcement also stated, “The Committee’s sizable and still-increasing holdings of longer-term securities should maintain downward pressure on longer-term interest rates, support mortgage markets, and help to make broader financial conditions more accommodative….” The full economic
and market impact of bringing quantita-tive easing to a close remains to be seen.2
According to a 2013 market outlook survey recently released by CFA Institute, 71% of all respondents now believe that equities will be the best performing asset class for 2014; this compares with 54% at the end of 2012. Respondents are also most optimistic about the U.S. stock market and most pessimistic about Brazil. These views reflect the familiar extrapo-lation of past returns and momentum in sentiments. Whether the survey has any
forecasting power is difficult to assess and is, in any case, beside the point. The U.S. equity market can certainly rally another 20% in 2014. That is entirely within the realm of possibility, even if the Shiller CAPE predicts it to be improbable. What is, however, forecastable with a great degree of assurance is that if the U.S. equity bull market continues into the first half of 2014, many investors will pour more cash into equities and fire manag-ers who have underweighted U.S. stocks. When all is said and done, this decision is likely to prove extraordinarily costly.3
Index Total Return (%)
FTSE NAREIT All REITs 2.6
Bank of America Merrill Lynch US Corporate & Government 1-3 Years 0.9
Barclays U.S. Aggregate Bond Index -1.6
JP Morgan Emerging Local Market Index-Plus (ELMI+) -2.2
Barclays U.S. Long Credit -7.4
JP Morgan Emerging Market Bonds-Plus (EMBI+) -9.5
Dow Jones UBS Commodity Index -11.5
Barclays US Treasury Long Index -11.9
Barclays U.S. Treasury Inflation Notes 10+ Year Index -14.4
Source: Research Affiliates based on data from Morningstar Encorr.
Table 1. November 2013 Year-to-Date U.S. Dollar Denominated Total Returns
Endnotes1. The quote is attributed to the great American humorist Evan Esar.
2. See Hsu (2013).
3. Goyal and Wahal (2008) find that the wealth lost by investors from the practice
of firing and hiring managers on the basis of recent performance far exceeds the
average net-of-cost underperformance of active management. The same finding
has also been demonstrated in a number of Towers Watson research reports.
ReferencesCampbell, John Y., and Robert J. Shiller. 1988a. “The Dividend-Price Ratio and Expecta-tions of Future Dividends and Discount Factors.” Review of Financial Studies, vol. 1, no. 3 (July):195–228.
_________. 1988b. “Stock Prices, Earnings, and Expected Dividends.” Journal of Finance, vol. 43, no. 3 (July):661–676.
CFA Institute. 2013. “Global Market Sentiment Survey 2014.”
Fama, Eugene F., and Kenneth R. French. 1989. “Business Conditions and Expected Returns on Stocks and Bonds.” Journal of Financial Economics, vol. 25, no. 1 (November):23–49.
Goyal, Amit, and Sunil Wahal. 2008. “The Selection and Termination of Investment Man-agement Firms by Plan Sponsors.” Journal of Finance, vol. 63, no. 4 (August):1805–1847.
Hsu, Jason. 2013. “The Impact of Tapering on Risky Assets.” Research Affiliates, Currents (September).
December 2013
4Page
FUNDAMENTALS
620 Newport Center Drive, Suite 900 | Newport Beach, CA 92660 | + 1 (949) 325 - 8700 | www.researchaffiliates.com
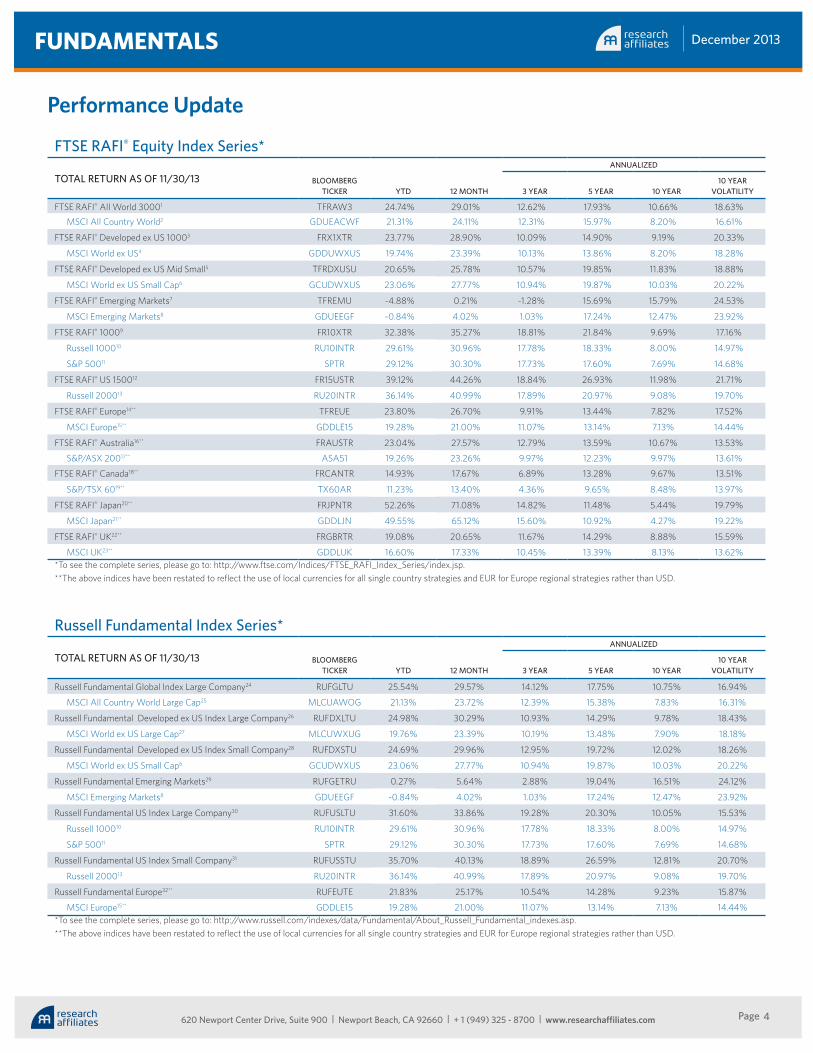
FTSE RAFI® Equity Index Series*
TOTAL RETURN AS OF 11/30/13 BLOOMBERG TICKER YTD 12 MONTH
ANNUALIZED
3 YEAR 5 YEAR 10 YEAR10 YEAR
VOLATILITY
FTSE RAFI® All World 30001 TFRAW3 24.74% 29.01% 12.62% 17.93% 10.66% 18.63%MSCI All Country World2 GDUEACWF 21.31% 24.11% 12.31% 15.97% 8.20% 16.61%
FTSE RAFI® Developed ex US 10003 FRX1XTR 23.77% 28.90% 10.09% 14.90% 9.19% 20.33%
MSCI World ex US4 GDDUWXUS 19.74% 23.39% 10.13% 13.86% 8.20% 18.28%
FTSE RAFI® Developed ex US Mid Small5 TFRDXUSU 20.65% 25.78% 10.57% 19.85% 11.83% 18.88%
MSCI World ex US Small Cap6 GCUDWXUS 23.06% 27.77% 10.94% 19.87% 10.03% 20.22%
FTSE RAFI® Emerging Markets7 TFREMU -4.88% 0.21% -1.28% 15.69% 15.79% 24.53%
MSCI Emerging Markets8 GDUEEGF -0.84% 4.02% 1.03% 17.24% 12.47% 23.92%
FTSE RAFI® 10009 FR10XTR 32.38% 35.27% 18.81% 21.84% 9.69% 17.16%
Russell 100010 RU10INTR 29.61% 30.96% 17.78% 18.33% 8.00% 14.97%
S&P 50011 SPTR 29.12% 30.30% 17.73% 17.60% 7.69% 14.68%
FTSE RAFI® US 150012 FR15USTR 39.12% 44.26% 18.84% 26.93% 11.98% 21.71%
Russell 200013 RU20INTR 36.14% 40.99% 17.89% 20.97% 9.08% 19.70%
FTSE RAFI® Europe14** TFREUE 23.80% 26.70% 9.91% 13.44% 7.82% 17.52%
MSCI Europe15** GDDLE15 19.28% 21.00% 11.07% 13.14% 7.13% 14.44%
FTSE RAFI® Australia16** FRAUSTR 23.04% 27.57% 12.79% 13.59% 10.67% 13.53%
S&P/ASX 20017** ASA51 19.26% 23.26% 9.97% 12.23% 9.97% 13.61%
FTSE RAFI® Canada18** FRCANTR 14.93% 17.67% 6.89% 13.28% 9.67% 13.51%
S&P/TSX 6019** TX60AR 11.23% 13.40% 4.36% 9.65% 8.48% 13.97%
FTSE RAFI® Japan20** FRJPNTR 52.26% 71.08% 14.82% 11.48% 5.44% 19.79%
MSCI Japan21** GDDLJN 49.55% 65.12% 15.60% 10.92% 4.27% 19.22%
FTSE RAFI® UK22** FRGBRTR 19.08% 20.65% 11.67% 14.29% 8.88% 15.59%
MSCI UK23** GDDLUK 16.60% 17.33% 10.45% 13.39% 8.13% 13.62%*To see the complete series, please go to: http://www.ftse.com/Indices/FTSE_RAFI_Index_Series/index.jsp.**The above indices have been restated to reflect the use of local currencies for all single country strategies and EUR for Europe regional strategies rather than USD.
Russell Fundamental Index Series*
TOTAL RETURN AS OF 11/30/13 BLOOMBERG TICKER YTD 12 MONTH
ANNUALIZED
3 YEAR 5 YEAR 10 YEAR10 YEAR
VOLATILITY
Russell Fundamental Global Index Large Company24 RUFGLTU 25.54% 29.57% 14.12% 17.75% 10.75% 16.94%
MSCI All Country World Large Cap25 MLCUAWOG 21.13% 23.72% 12.39% 15.38% 7.83% 16.31%
Russell Fundamental Developed ex US Index Large Company26 RUFDXLTU 24.98% 30.29% 10.93% 14.29% 9.78% 18.43%
MSCI World ex US Large Cap27 MLCUWXUG 19.76% 23.39% 10.19% 13.48% 7.90% 18.18%
Russell Fundamental Developed ex US Index Small Company28 RUFDXSTU 24.69% 29.96% 12.95% 19.72% 12.02% 18.26%
MSCI World ex US Small Cap6 GCUDWXUS 23.06% 27.77% 10.94% 19.87% 10.03% 20.22%
Russell Fundamental Emerging Markets29 RUFGETRU 0.27% 5.64% 2.88% 19.04% 16.51% 24.12%
MSCI Emerging Markets8 GDUEEGF -0.84% 4.02% 1.03% 17.24% 12.47% 23.92%
Russell Fundamental US Index Large Company30 RUFUSLTU 31.60% 33.86% 19.28% 20.30% 10.05% 15.53%
Russell 100010 RU10INTR 29.61% 30.96% 17.78% 18.33% 8.00% 14.97%
S&P 50011 SPTR 29.12% 30.30% 17.73% 17.60% 7.69% 14.68%
Russell Fundamental US Index Small Company31 RUFUSSTU 35.70% 40.13% 18.89% 26.59% 12.81% 20.70%
Russell 200013 RU20INTR 36.14% 40.99% 17.89% 20.97% 9.08% 19.70%
Russell Fundamental Europe32** RUFEUTE 21.83% 25.17% 10.54% 14.28% 9.23% 15.87%
MSCI Europe15** GDDLE15 19.28% 21.00% 11.07% 13.14% 7.13% 14.44%*To see the complete series, please go to: http://www.russell.com/indexes/data/Fundamental/About_Russell_Fundamental_indexes.asp.**The above indices have been restated to reflect the use of local currencies for all single country strategies and EUR for Europe regional strategies rather than USD.
Performance Update
December 2013
5Page
FUNDAMENTALS
620 Newport Center Drive, Suite 900 | Newport Beach, CA 92660 | + 1 (949) 325 - 8700 | www.researchaffiliates.com
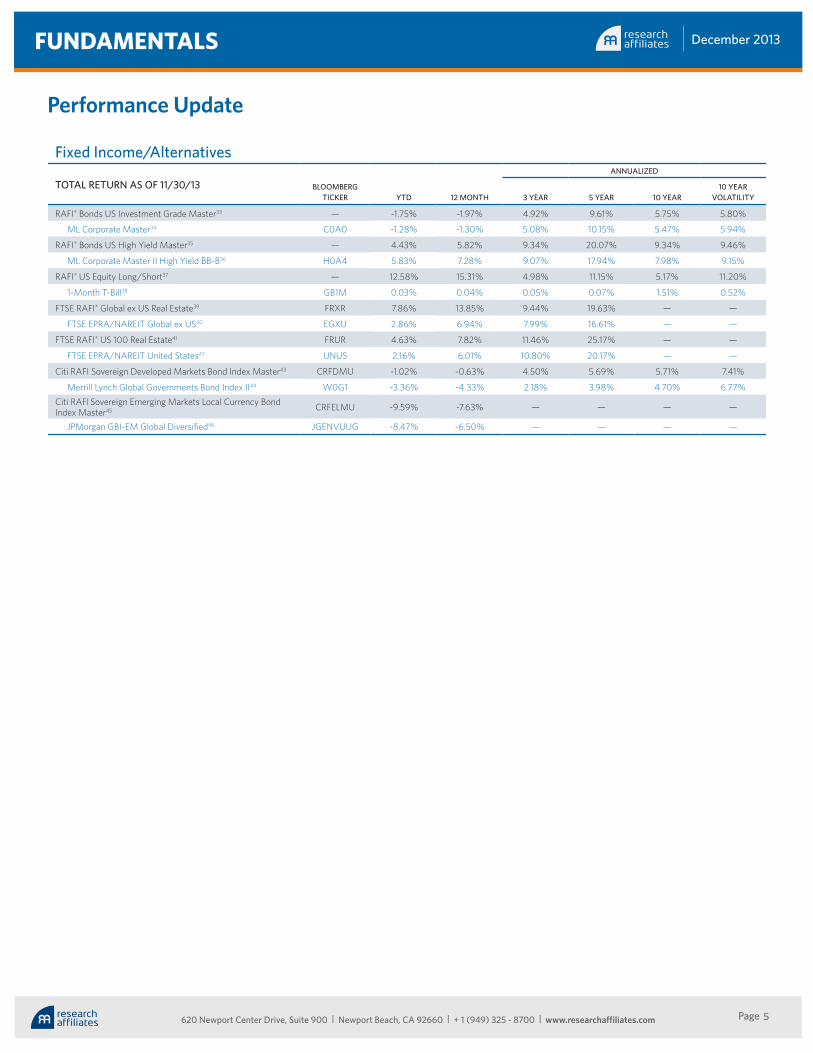
Fixed Income/Alternatives
TOTAL RETURN AS OF 11/30/13 BLOOMBERG TICKER YTD 12 MONTH
ANNUALIZED
3 YEAR 5 YEAR 10 YEAR10 YEAR
VOLATILITY
RAFI® Bonds US Investment Grade Master33 — -1.75% -1.97% 4.92% 9.61% 5.75% 5.80%
ML Corporate Master34 C0A0 -1.28% -1.30% 5.08% 10.15% 5.47% 5.94%
RAFI® Bonds US High Yield Master35 — 4.43% 5.82% 9.34% 20.07% 9.34% 9.46%
ML Corporate Master II High Yield BB-B36 H0A4 5.83% 7.28% 9.07% 17.94% 7.98% 9.15%
RAFI® US Equity Long/Short37 — 12.58% 15.31% 4.98% 11.15% 5.17% 11.20%
1-Month T-Bill38 GB1M 0.03% 0.04% 0.05% 0.07% 1.51% 0.52%
FTSE RAFI® Global ex US Real Estate39 FRXR 7.86% 13.85% 9.44% 19.63% — —
FTSE EPRA/NAREIT Global ex US40 EGXU 2.86% 6.94% 7.99% 16.61% — —
FTSE RAFI® US 100 Real Estate41 FRUR 4.63% 7.82% 11.46% 25.17% — —
FTSE EPRA/NAREIT United States42 UNUS 2.16% 6.01% 10.80% 20.17% — —
Citi RAFI Sovereign Developed Markets Bond Index Master43 CRFDMU -1.02% -0.63% 4.50% 5.69% 5.71% 7.41%
Merrill Lynch Global Governments Bond Index II44 W0G1 -3.36% -4.33% 2.18% 3.98% 4.70% 6.77%Citi RAFI Sovereign Emerging Markets Local Currency Bond Index Master45 CRFELMU -9.59% -7.63% — — — —
JPMorgan GBI-EM Global Diversified46 JGENVUUG -8.47% -6.50% — — — —
Performance Update
December 2013
6Page
FUNDAMENTALS
620 Newport Center Drive, Suite 900 | Newport Beach, CA 92660 | + 1 (949) 325 - 8700 | www.researchaffiliates.com
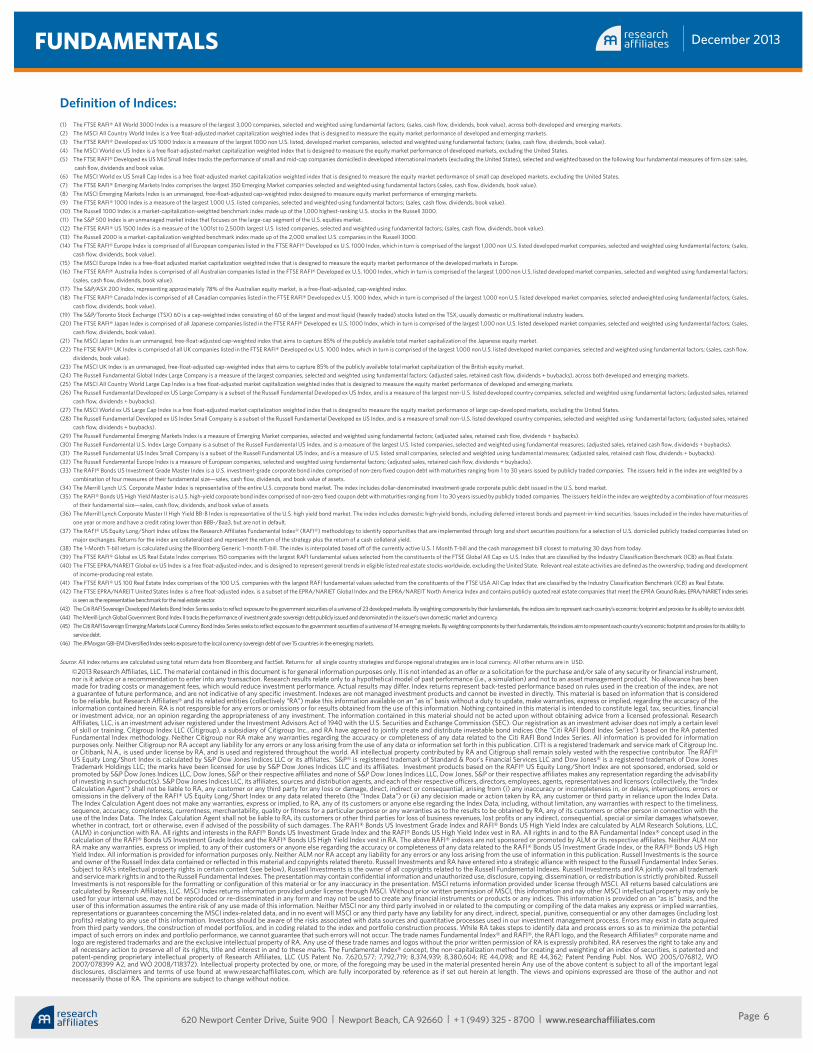
Definition of Indices:(1) The FTSE RAFI® All World 3000 Index is a measure of the largest 3,000 companies, selected and weighted using fundamental factors; (sales, cash flow, dividends, book value), across both developed and emerging markets.(2) The MSCI All Country World Index is a free float-adjusted market capitalization weighted index that is designed to measure the equity market performance of developed and emerging markets.(3) The FTSE RAFI® Developed ex US 1000 Index is a measure of the largest 1000 non U.S. listed, developed market companies, selected and weighted using fundamental factors; (sales, cash flow, dividends, book value). (4) The MSCI World ex US Index is a free float-adjusted market capitalization weighted index that is designed to measure the equity market performance of developed markets, excluding the United States.(5) The FTSE RAFI® Developed ex US Mid Small Index tracks the performance of small and mid-cap companies domiciled in developed international markets (excluding the United States), selected and weighted based on the following four fundamental measures of firm size: sales, cash flow, dividends and book value.(6) The MSCI World ex US Small Cap Index is a free float-adjusted market capitalization weighted index that is designed to measure the equity market performance of small cap developed markets, excluding the United States.(7) The FTSE RAFI® Emerging Markets Index comprises the largest 350 Emerging Market companies selected and weighted using fundamental factors (sales, cash flow, dividends, book value).(8) The MSCI Emerging Markets Index is an unmanaged, free-float-adjusted cap-weighted index designed to measure equity market performance of emerging markets. (9) The FTSE RAFI® 1000 Index is a measure of the largest 1,000 U.S. listed companies, selected and weighted using fundamental factors; (sales, cash flow, dividends, book value).(10) The Russell 1000 Index is a market-capitalization-weighted benchmark index made up of the 1,000 highest-ranking U.S. stocks in the Russell 3000. (11) The S&P 500 Index is an unmanaged market index that focuses on the large-cap segment of the U.S. equities market. (12) The FTSE RAFI® US 1500 Index is a measure of the 1,001st to 2,500th largest U.S. listed companies, selected and weighted using fundamental factors; (sales, cash flow, dividends, book value).(13) The Russell 2000 is a market-capitalization weighted benchmark index made up of the 2,000 smallest U.S. companies in the Russell 3000. (14) The FTSE RAFI® Europe Index is comprised of all European companies listed in the FTSE RAFI® Developed ex U.S. 1000 Index, which in turn is comprised of the largest 1,000 non U.S. listed developed market companies, selected and weighted using fundamental factors; (sales, cash flow, dividends, book value).(15) The MSCI Europe Index is a free-float adjusted market capitalization weighted index that is designed to measure the equity market performance of the developed markets in Europe.(16) The FTSE RAFI® Australia Index is comprised of all Australian companies listed in the FTSE RAFI® Developed ex U.S. 1000 Index, which in turn is comprised of the largest 1,000 non U.S. listed developed market companies, selected and weighted using fundamental factors; (sales, cash flow, dividends, book value).(17) The S&P/ASX 200 Index, representing approximately 78% of the Australian equity market, is a free-float-adjusted, cap-weighted index. (18) The FTSE RAFI® Canada Index is comprised of all Canadian companies listed in the FTSE RAFI® Developed ex U.S. 1000 Index, which in turn is comprised of the largest 1,000 non U.S. listed developed market companies, selected andweighted using fundamental factors; (sales, cash flow, dividends, book value).(19) The S&P/Toronto Stock Exchange (TSX) 60 is a cap-weighted index consisting of 60 of the largest and most liquid (heavily traded) stocks listed on the TSX, usually domestic or multinational industry leaders. (20) The FTSE RAFI® Japan Index is comprised of all Japanese companies listed in the FTSE RAFI® Developed ex U.S. 1000 Index, which in turn is comprised of the largest 1,000 non U.S. listed developed market companies, selected and weighted using fundamental factors; (sales, cash flow, dividends, book value).(21) The MSCI Japan Index is an unmanaged, free-float-adjusted cap-weighted index that aims to capture 85% of the publicly available total market capitalization of the Japanese equity market. (22) The FTSE RAFI® UK Index is comprised of all UK companies listed in the FTSE RAFI® Developed ex U.S. 1000 Index, which in turn is comprised of the largest 1,000 non U.S. listed developed market companies, selected and weighted using fundamental factors; (sales, cash flow, dividends, book value).(23) The MSCI UK Index is an unmanaged, free-float-adjusted cap-weighted index that aims to capture 85% of the publicly available total market capitalization of the British equity market. (24) The Russell Fundamental Global Index Large Company is a measure of the largest companies, selected and weighted using fundamental factors; (adjusted sales, retained cash flow, dividends + buybacks), across both developed and emerging markets.(25) The MSCI All Country World Large Cap Index is a free float-adjusted market capitalization weighted index that is designed to measure the equity market performance of developed and emerging markets.(26) The Russell Fundamental Developed ex US Large Company is a subset of the Russell Fundamental Developed ex US Index, and is a measure of the largest non-U.S. listed developed country companies, selected and weighted using fundamental factors; (adjusted sales, retained cash flow, dividends + buybacks).(27) The MSCI World ex US Large Cap Index is a free float-adjusted market capitalization weighted index that is designed to measure the equity market performance of large cap-developed markets, excluding the United States.(28) The Russell Fundamental Developed ex US Index Small Company is a subset of the Russell Fundamental Developed ex US Index, and is a measure of small non-U.S. listed developed country companies, selected and weighted using fundamental factors; (adjusted sales, retained cash flow, dividends + buybacks).(29) The Russell Fundamental Emerging Markets Index is a measure of Emerging Market companies, selected and weighted using fundamental factors; (adjusted sales, retained cash flow, dividends + buybacks).(30) The Russell Fundamental U.S. Index Large Company is a subset of the Russell Fundamental US Index, and is a measure of the largest U.S. listed companies, selected and weighted using fundamental measures; (adjusted sales, retained cash flow, dividends + buybacks). (31) The Russell Fundamental US Index Small Company is a subset of the Russell Fundamental US Index, and is a measure of U.S. listed small companies, selected and weighted using fundamental measures; (adjusted sales, retained cash flow, dividends + buybacks).(32) The Russell Fundamental Europe Index is a measure of European companies, selected and weighted using fundamental factors; (adjusted sales, retained cash flow, dividends + buybacks).(33) The RAFI® Bonds US Investment Grade Master Index is a U.S. investment-grade corporate bond index comprised of non-zero fixed coupon debt with maturities ranging from 1 to 30 years issued by publicly traded companies. The issuers held in the index are weighted by a combination of four measures of their fundamental size—sales, cash flow, dividends, and book value of assets.(34) The Merrill Lynch U.S. Corporate Master Index is representative of the entire U.S. corporate bond market. The index includes dollar-denominated investment-grade corporate public debt issued in the U.S. bond market. (35) The RAFI® Bonds US High Yield Master is a U.S. high-yield corporate bond index comprised of non-zero fixed coupon debt with maturities ranging from 1 to 30 years issued by publicly traded companies. The issuers held in the index are weighted by a combination of four measures of their fundamental size—sales, cash flow, dividends, and book value of assets. (36) The Merrill Lynch Corporate Master II High Yield BB-B Index is representative of the U.S. high yield bond market. The index includes domestic high-yield bonds, including deferred interest bonds and payment-in-kind securities. Issues included in the index have maturities of one year or more and have a credit rating lower than BBB-/Baa3, but are not in default. (37) The RAFI® US Equity Long/Short Index utilizes the Research Affiliates Fundamental Index® (RAFI®) methodology to identify opportunities that are implemented through long and short securities positions for a selection of U.S. domiciled publicly traded companies listed on major exchanges. Returns for the index are collateralized and represent the return of the strategy plus the return of a cash collateral yield. (38) The 1-Month T-bill return is calculated using the Bloomberg Generic 1-month T-bill. The index is interpolated based off of the currently active U.S. 1 Month T-bill and the cash management bill closest to maturing 30 days from today. (39) The FTSE RAFI® Global ex US Real Estate Index comprises 150 companies with the largest RAFI fundamental values selected from the constituents of the FTSE Global All Cap ex U.S. Index that are classified by the Industry Classification Benchmark (ICB) as Real Estate.(40) The FTSE EPRA/NAREIT Global ex US Index is a free float-adjusted index, and is designed to represent general trends in eligible listed real estate stocks worldwide, excluding the United State. Relevant real estate activities are defined as the ownership, trading and development of income-producing real estate.(41) The FTSE RAFI® US 100 Real Estate Index comprises of the 100 U.S. companies with the largest RAFI fundamental values selected from the constituents of the FTSE USA All Cap Index that are classified by the Industry Classification Benchmark (ICB) as Real Estate.(42) The FTSE EPRA/NAREIT United States Index is a free float-adjusted index, is a subset of the EPRA/NARIET Global Index and the EPRA/NAREIT North America Index and contains publicly quoted real estate companies that meet the EPRA Ground Rules. EPRA/NARIET Index series is seen as the representative benchmark for the real estate sector.(43) The Citi RAFI Sovereign Developed Markets Bond Index Series seeks to reflect exposure to the government securities of a universe of 23 developed markets. By weighting components by their fundamentals, the indices aim to represent each country’s economic footprint and proxies for its ability to service debt.(44) The Merrill Lynch Global Government Bond Index II tracks the performance of investment grade sovereign debt publicly issued and denominated in the issuer’s own domestic market and currency.(45) The Citi RAFI Sovereign Emerging Markets Local Currency Bond Index Series seeks to reflect exposure to the government securities of a universe of 14 emerging markets. By weighting components by their fundamentals, the indices aim to represent each country’s economic footprint and proxies for its ability to service debt.(46) The JPMorgan GBI-EM Diversified Index seeks exposure to the local currency sovereign debt of over 15 countries in the emerging markets.
Source: All index returns are calculated using total return data from Bloomberg and FactSet. Returns for all single country strategies and Europe regional strategies are in local currency. All other returns are in USD.
©2013 Research Affiliates, LLC. The material contained in this document is for general information purposes only. It is not intended as an offer or a solicitation for the purchase and/or sale of any security or financial instrument, nor is it advice or a recommendation to enter into any transaction. Research results relate only to a hypothetical model of past performance (i.e., a simulation) and not to an asset management product. No allowance has been made for trading costs or management fees, which would reduce investment performance. Actual results may differ. Index returns represent back-tested performance based on rules used in the creation of the index, are not a guarantee of future performance, and are not indicative of any specific investment. Indexes are not managed investment products and cannot be invested in directly. This material is based on information that is considered to be reliable, but Research Affiliates® and its related entities (collectively “RA”) make this information available on an “as is” basis without a duty to update, make warranties, express or implied, regarding the accuracy of the information contained herein. RA is not responsible for any errors or omissions or for results obtained from the use of this information. Nothing contained in this material is intended to constitute legal, tax, securities, financial or investment advice, nor an opinion regarding the appropriateness of any investment. The information contained in this material should not be acted upon without obtaining advice from a licensed professional. Research Affiliates, LLC, is an investment adviser registered under the Investment Advisors Act of 1940 with the U.S. Securities and Exchange Commission (SEC). Our registration as an investment adviser does not imply a certain level of skill or training. Citigroup Index LLC (Citigroup), a subsidiary of Citigroup Inc., and RA have agreed to jointly create and distribute investable bond indices (the “Citi RAFI Bond Index Series”) based on the RA patented Fundamental Index methodology. Neither Citigroup nor RA make any warranties regarding the accuracy or completeness of any data related to the Citi RAFI Bond Index Series. All information is provided for information purposes only. Neither Citigroup nor RA accept any liability for any errors or any loss arising from the use of any data or information set forth in this publication. CITI is a registered trademark and service mark of Citigroup Inc. or Citibank, N.A., is used under license by RA, and is used and registered throughout the world. All intellectual property contributed by RA and Citigroup shall remain solely vested with the respective contributor. The RAFI® US Equity Long/Short Index is calculated by S&P Dow Jones Indices LLC or its affiliates. S&P® is registered trademark of Standard & Poor’s Financial Services LLC and Dow Jones® is a registered trademark of Dow Jones Trademark Holdings LLC; the marks have been licensed for use by S&P Dow Jones Indices LLC and its affiliates. Investment products based on the RAFI® US Equity Long/Short Index are not sponsored, endorsed, sold or promoted by S&P Dow Jones Indices LLC, Dow Jones, S&P or their respective affiliates and none of S&P Dow Jones Indices LLC, Dow Jones, S&P or their respective affiliates makes any representation regarding the advisability of investing in such product(s). S&P Dow Jones Indices LLC, its affiliates, sources and distribution agents, and each of their respective officers, directors, employees, agents, representatives and licensors (collectively, the “Index Calculation Agent”) shall not be liable to RA, any customer or any third party for any loss or damage, direct, indirect or consequential, arising from (i) any inaccuracy or incompleteness in, or delays, interruptions, errors or omissions in the delivery of the RAFI® US Equity Long/Short Index or any data related thereto (the “Index Data”) or (ii) any decision made or action taken by RA, any customer or third party in reliance upon the Index Data. The Index Calculation Agent does not make any warranties, express or implied, to RA, any of its customers or anyone else regarding the Index Data, including, without limitation, any warranties with respect to the timeliness, sequence, accuracy, completeness, currentness, merchantability, quality or fitness for a particular purpose or any warranties as to the results to be obtained by RA, any of its customers or other person in connection with the use of the Index Data. The Index Calculation Agent shall not be liable to RA, its customers or other third parties for loss of business revenues, lost profits or any indirect, consequential, special or similar damages whatsoever, whether in contract, tort or otherwise, even if advised of the possibility of such damages. The RAFI® Bonds US Investment Grade Index and RAFI® Bonds US High Yield Index are calculated by ALM Research Solutions, LLC, (ALM) in conjunction with RA. All rights and interests in the RAFI® Bonds US Investment Grade Index and the RAFI® Bonds US High Yield Index vest in RA. All rights in and to the RA Fundamental Index® concept used in the calculation of the RAFI® Bonds US Investment Grade Index and the RAFI® Bonds US High Yield Index vest in RA. The above RAFI® indexes are not sponsored or promoted by ALM or its respective affiliates. Neither ALM nor RA make any warranties, express or implied, to any of their customers or anyone else regarding the accuracy or completeness of any data related to the RAFI® Bonds US Investment Grade Index, or the RAFI® Bonds US High Yield Index. All information is provided for information purposes only. Neither ALM nor RA accept any liability for any errors or any loss arising from the use of information in this publication. Russell Investments is the source and owner of the Russell Index data contained or reflected in this material and copyrights related thereto. Russell Investments and RA have entered into a strategic alliance with respect to the Russell Fundamental Index Series. Subject to RA’s intellectual property rights in certain content (see below), Russell Investments is the owner of all copyrights related to the Russell Fundamental Indexes. Russell Investments and RA jointly own all trademark and service mark rights in and to the Russell Fundamental Indexes. The presentation may contain confidential information and unauthorized use, disclosure, copying, dissemination, or redistribution is strictly prohibited. Russell Investments is not responsible for the formatting or configuration of this material or for any inaccuracy in the presentation. MSCI returns information provided under license through MSCI. All returns based calculations are calculated by Research Affiliates, LLC. MSCI Index returns information provided under license through MSCI. Without prior written permission of MSCI, this information and nay other MSCI intellectual property may only be used for your internal use, may not be reproduced or re-disseminated in any form and may not be used to create any financial instruments or products or any indices. This information is provided on an “as is” basis, and the user of this information assumes the entire risk of any use made of this information. Neither MSCI nor any third party involved in or related to the computing or compiling of the data makes any express or implied warranties, representations or guarantees concerning the MSCI index-related data, and in no event will MSCI or any third party have any liability for any direct, indirect, special, punitive, consequential or any other damages (including lost profits) relating to any use of this information. Investors should be aware of the risks associated with data sources and quantitative processes used in our investment management process. Errors may exist in data acquired from third party vendors, the construction of model portfolios, and in coding related to the index and portfolio construction process. While RA takes steps to identify data and process errors so as to minimize the potential impact of such errors on index and portfolio performance, we cannot guarantee that such errors will not occur. The trade names Fundamental Index® and RAFI®, the RAFI logo, and the Research Affiliates® corporate name and logo are registered trademarks and are the exclusive intellectual property of RA. Any use of these trade names and logos without the prior written permission of RA is expressly prohibited. RA reserves the right to take any and all necessary action to preserve all of its rights, title and interest in and to these marks. The Fundamental Index® concept, the non-capitalization method for creating and weighting of an index of securities, is patented and patent-pending proprietary intellectual property of Research Affiliates, LLC (US Patent No. 7,620,577; 7,792,719; 8,374,939; 8,380,604; RE 44,098; and RE 44,362; Patent Pending Publ. Nos. WO 2005/076812, WO 2007/078399 A2, and WO 2008/118372). Intellectual property protected by one, or more, of the foregoing may be used in the material presented herein Any use of the above content is subject to all of the important legal disclosures, disclaimers and terms of use found at www.researchaffiliates.com, which are fully incorporated by reference as if set out herein at length. The views and opinions expressed are those of the author and not necessarily those of RA. The opinions are subject to change without notice.