Embed Size (px)
DESCRIPTION
inventory Management of a companyffffffffffffffffffffffffffffffffffffffffffffffffffffffffferrrrrrrrrrrrrrrrrrrrrrrrrrrrrrrrrrrrrrrrrrrrrrrrrrrrrrrrrrrrrrrrrrrrrrrrrrrrrnjhbbbbbbbbbbbbbbbbbbbbbbbbbbbbbbbbbbbbbbbbbbbbbbbbbbbbbbbbbbbbbbbbbbbbbbbbbbbbbbbbbbbbbbbbbbbbbbbbbbbbbbbbbbbbbfgtttttttttttttttttttttttttttttttttrjr
Citation preview
© 2007 Pearson Education
Role of Inventory Role of Inventory Management in SCM
Chapter 10By Chandrashekeran
© 2007 Pearson Education
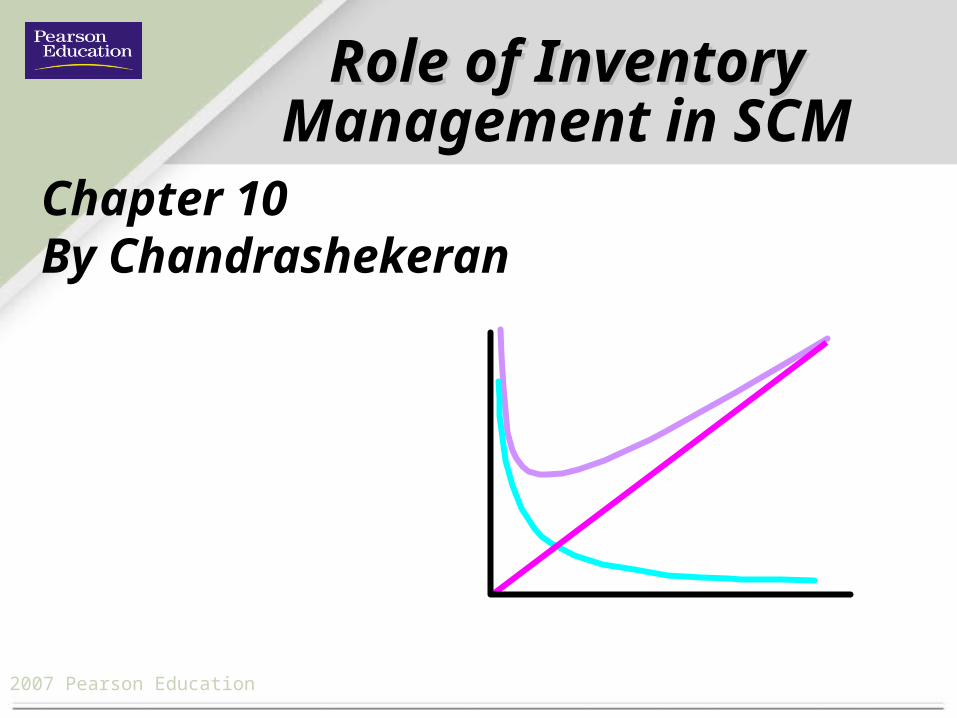
Need for Inventory Management
Fulfills the objectives and challenges of
COST AND
RESPONSIVENESS Inventory OFFERS various models and
SKU’s Pressure on inventory is higher for “made to
stock” rather than “made to engineer” or “made to stock”
Jewellery, fashion etc.

© 2007 Pearson Education
Inventory Management
Inventory management is the planning and controlling of inventories in order to meet the competitive priorities of the organization.
Effective inventory management is essential for realizing the full potential of any value chain.
Inventory management requires information about expected demands (SKU), amounts on hand (Qty) and amounts on order (EOQ) and price for every item stocked at all locations.
The appropriate timing and size of the reorder quantities must also be determined.

© 2007 Pearson Education
Inventory within supply chain network
SuppliersSubcontractingDirect site Factory
Warehouse
Production-Raw materialWork in processFinished good
Distribution channel or retailer
Customer

© 2007 Pearson Education
Inventory Basics
Inventory is created when the receipt of materials, parts, or finished goods exceeds their disbursement. (HIGH)
Inventory is depleted or replenished when their disbursement exceeds their receipt.(LOW)
An inventory manager’s job is to balance the advantages and disadvantages of both low and high inventories.Both have associated cost characteristics.
© 2007 Pearson Education
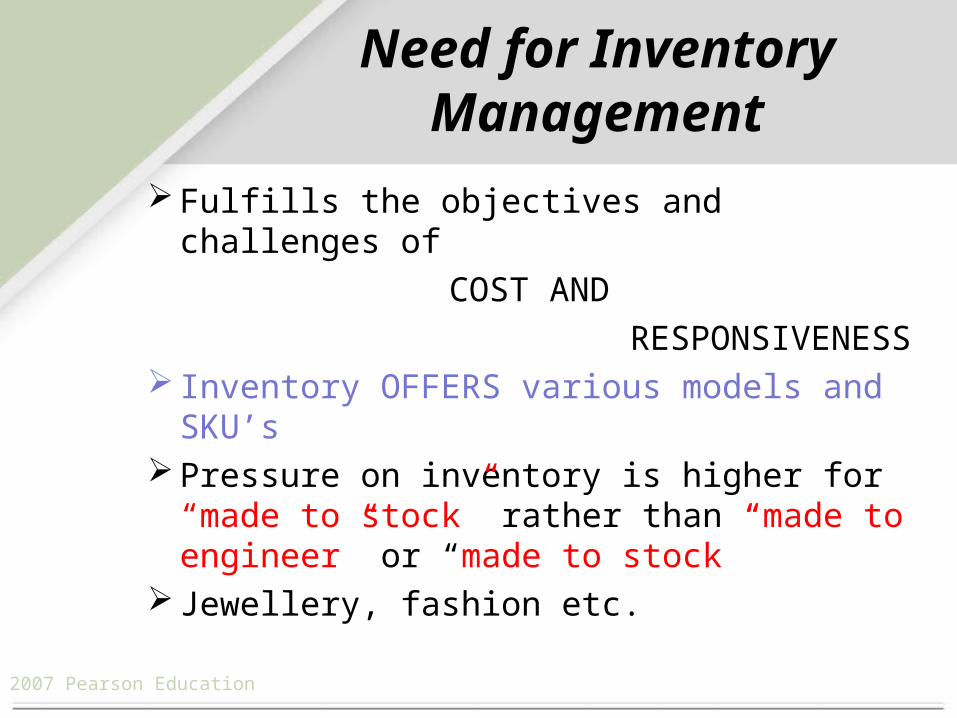
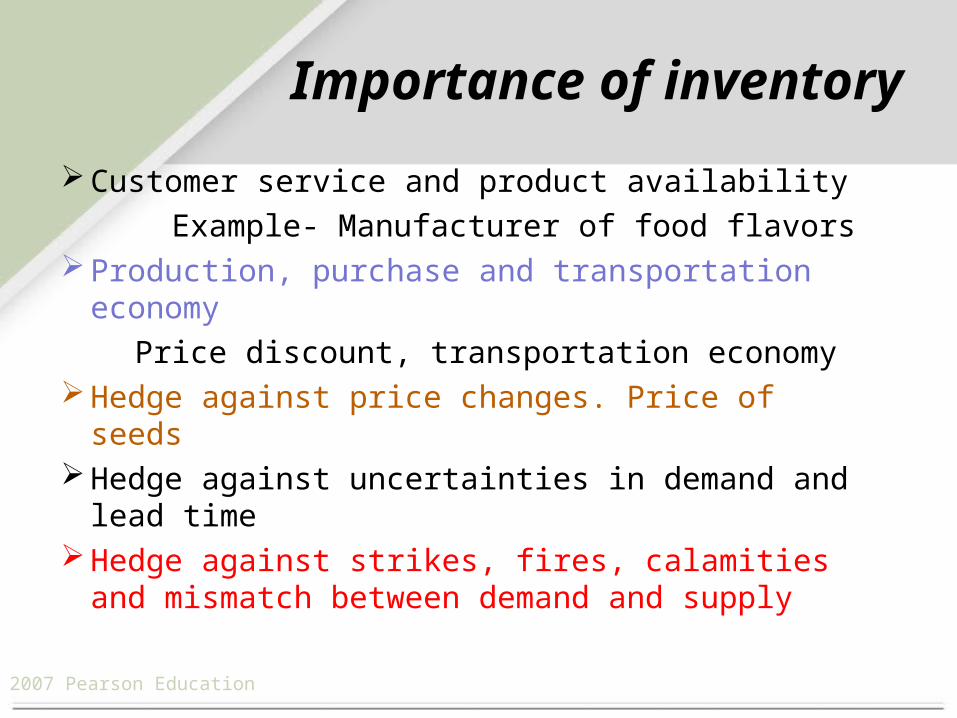
Importance of inventory
Customer service and product availability
Example- Manufacturer of food flavors Production, purchase and transportation
economy
Price discount, transportation economy Hedge against price changes. Price of seeds Hedge against uncertainties in demand and
lead time Hedge against strikes, fires, calamities and
mismatch between demand and supply

© 2007 Pearson Education
Types of Inventory
Raw Material- Purchased but not processed
Ensures Material availability for production
Reduces supplier variability in quality, quantity and time
Work in Process- Reduces cycle time (time to make a product)
Finished Goods- Reduces mismatch between demand and supply
Maintenance/ Overhauling/ Repair- Items consumed in a production but not a part of end product. Lubricants

© 2007 Pearson Education
Classification of Inventory
Cycle Inventory: Average inventory of lot or batch size.
Average cycle inventory =
Where Q= Lot or batch size, d= Demand per time
Lot Sizing: Lot size refers to quantity that a supply chain either produces or orders at a given time.
Cycle inventory takes advantages of economies of scale but each stages maintains cycle inventory which increases cost.
Q2

© 2007 Pearson Education
Classification of Inventory
Safety Stock Inventory: Surplus inventory that a company holds to protect against uncertainties in demand, lead time and supply changes. Reduces lost sales
Seasonal inventory- Meets the volatility of demand and supply.
Pipeline Inventory: Inventory moving from point to point in the materials flow system.
Includes orders that have been placed but not served. Pipeline inventory = DL = dL , L= Lead time

© 2007 Pearson Education© 2007 Pearson Education
Estimating Inventory LevelsExample 12.1
A plant makes monthly shipments of electric drills to a wholesaler in average lot sizes of 280 drills. The wholesaler’s average demand is 70 drills a week. Lead time is 3 weeks. The wholesaler must pay for the inventory from the moment the plant makes a shipment. If the wholesaler is willing to increase its purchase quantity to 350 units, the plant will guarantee a lead time of 2 weeks. What is the effect on cycle and pipeline inventories?
Average cycle inventory = = = 140Q2
2802
Pipeline inventory = DL = dL = 70(3) = 210
Under new proposal, the average lot size becomes 350 and lead time of 2 weeks. Average demand remains at 70 drills a week.
Q2Average cycle inventory = = = 175350
2
Pipeline inventory = DL = dL = 70(2) = 140
drills
drills
drills
drills
© 2007 Pearson Education
Pressures for Low Inventories
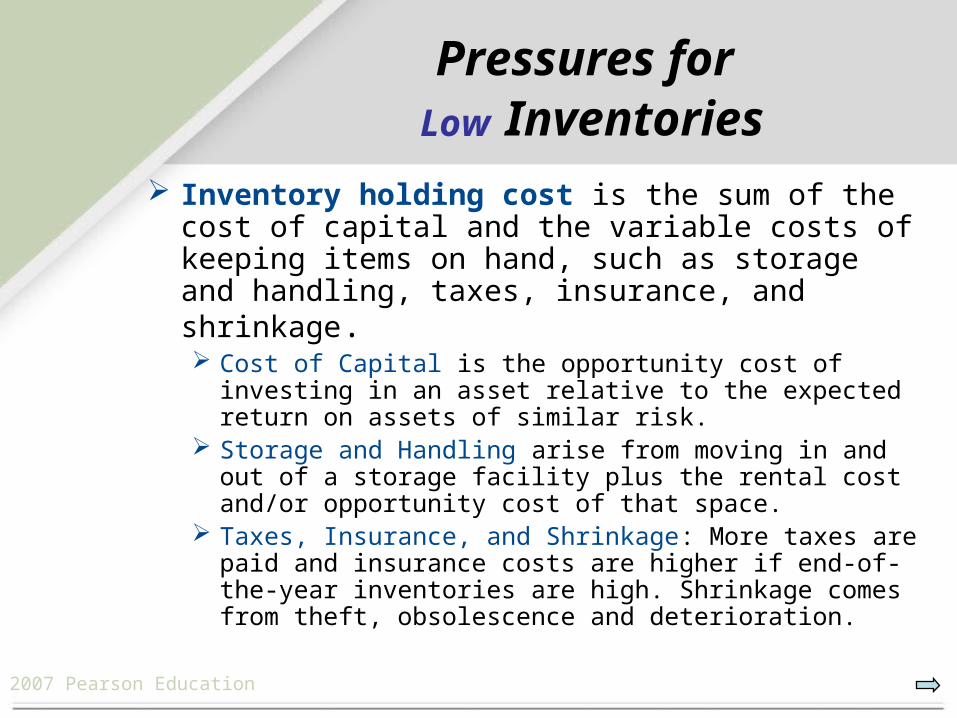
Inventory holding cost is the sum of the cost of capital and the variable costs of keeping items on hand, such as storage and handling, taxes, insurance, and shrinkage. Cost of Capital is the opportunity cost of investing in an
asset relative to the expected return on assets of similar risk.
Storage and Handling arise from moving in and out of a storage facility plus the rental cost and/or opportunity cost of that space.
Taxes, Insurance, and Shrinkage: More taxes are paid and insurance costs are higher if end-of-the-year inventories are high. Shrinkage comes from theft, obsolescence and deterioration.

© 2007 Pearson Education
Ordering Cost: The cost of preparing a purchase order for a supplier or a production order for the shop.
Setup Cost: The cost involved in changing over a machine to produce a different item.
Labor and Equipment: Creating more inventory can increase workforce productivity and facility utilization.
Transportation Costs: Costs can be reduced. Quantity Discount: A drop in the price per unit when
an order is sufficiently large.
© 2007 Pearson Education
Inventory Models
EOQ Model Production Order Quantity Model Quantity Discount Model
© 2007 Pearson Education
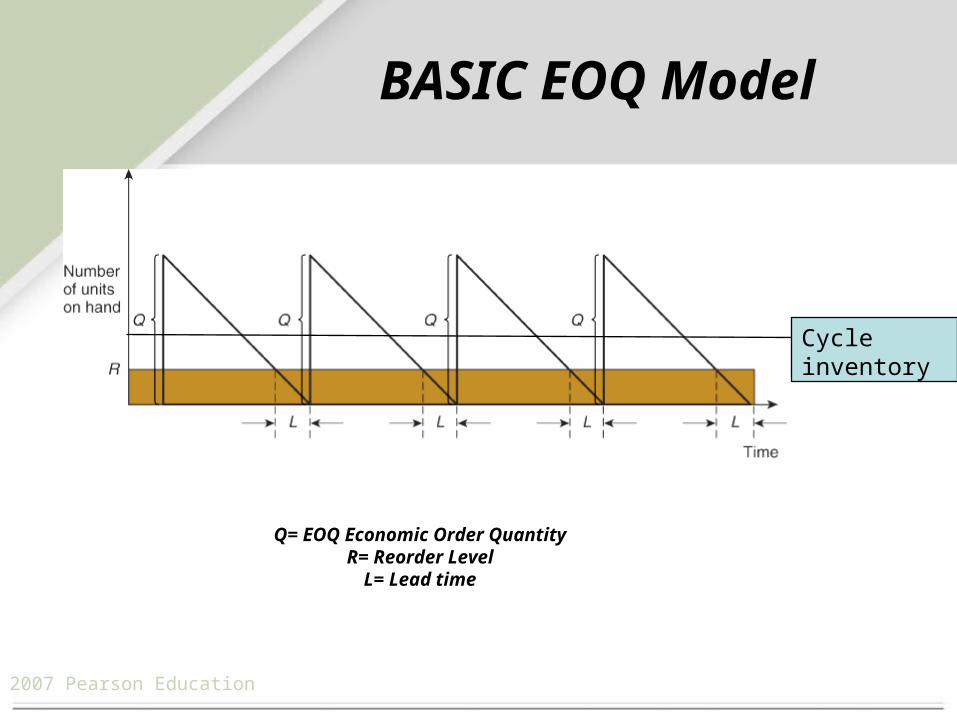
BASIC EOQ Model
Q= EOQ Economic Order QuantityR= Reorder Level
L= Lead time
Cycle inventory

© 2007 Pearson Education
Economic Order Quantity (EOQ) is the lot size that minimizes total annual inventory holding and ordering costs.
Assumptions of EOQ1. The demand rate is constant and known with
certainty.2. There are no constraints on lot size.3. The only relevant costs are holding costs and
ordering/setup costs.4. Decisions for items can be made independently
of other items.5. Lead time is constant and known with certainty.
Economic Order QuantityEconomic Order Quantity

© 2007 Pearson Education
Annual set up/ ordering cost=D.S/Q Annual Holding cost=Q.H/2 At EOQ, Annual set up cost= Annual holding
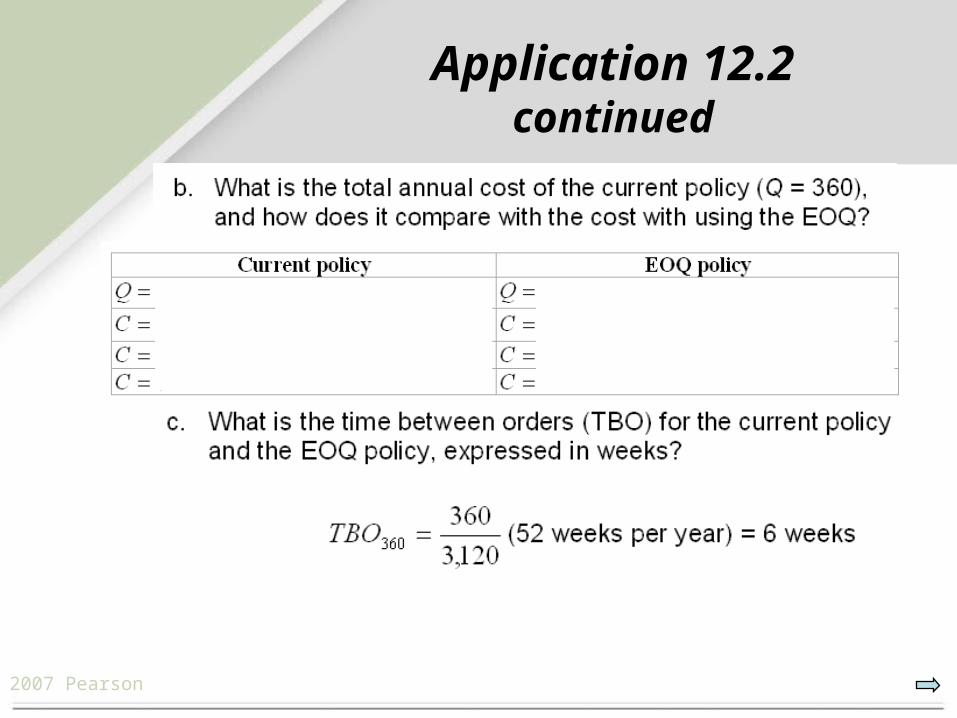
cost Reorder level=d.L Time between order=(Order size/ annual
demand) x time fraction/year

© 2007 Pearson Education
An
nu
al c
os
t (d
olla
rs)
An
nu
al c
os
t (d
olla
rs)
Lot Size (Lot Size (QQ))
Total Annual Total Annual Cycle-Inventory CostsCycle-Inventory Costs
Holding cost = (Holding cost = (HH))QQ22
Ordering cost = (Ordering cost = (SS))DDQQ
Total cost = (Total cost = (HH) + () + (SS))DDQQ
QQ22
Q = lot size; C = total annual cycle-inventory costH = holding cost per unit; D = annual demandS = ordering or setup costs per lot
© 2007 Pearson Education
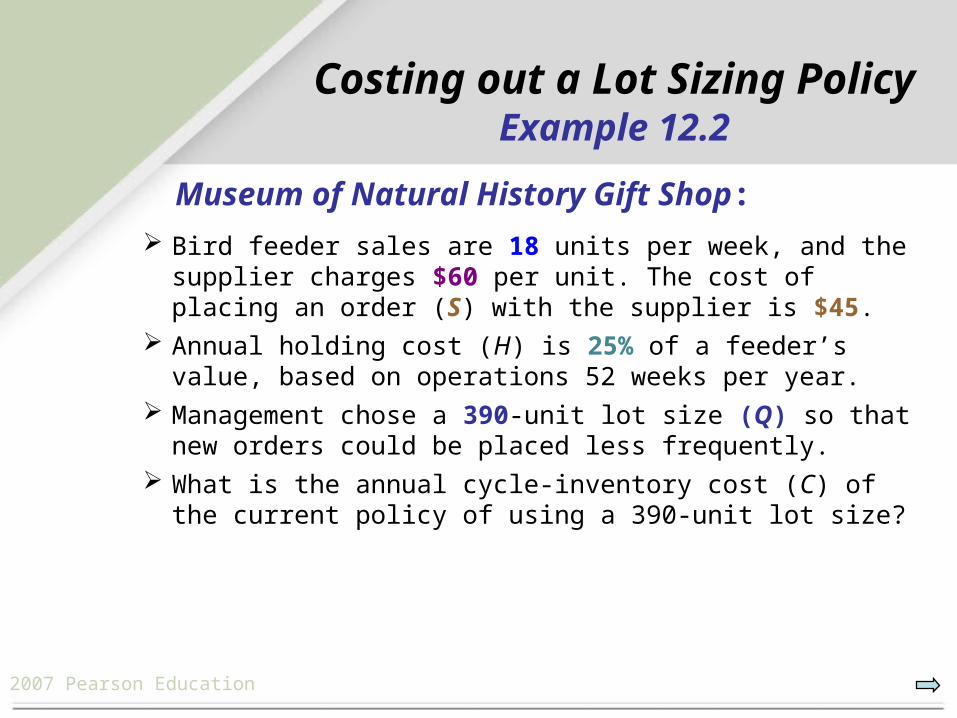
Costing out a Lot Sizing Policy Example 12.2
Bird feeder sales are 18 units per week, and the supplier charges $60 per unit. The cost of placing an order (S) with the supplier is $45.
Annual holding cost (H) is 25% of a feeder’s value, based on operations 52 weeks per year.
Management chose a 390-unit lot size (Q) so that new orders could be placed less frequently.
What is the annual cycle-inventory cost (C) of the current policy of using a 390-unit lot size?
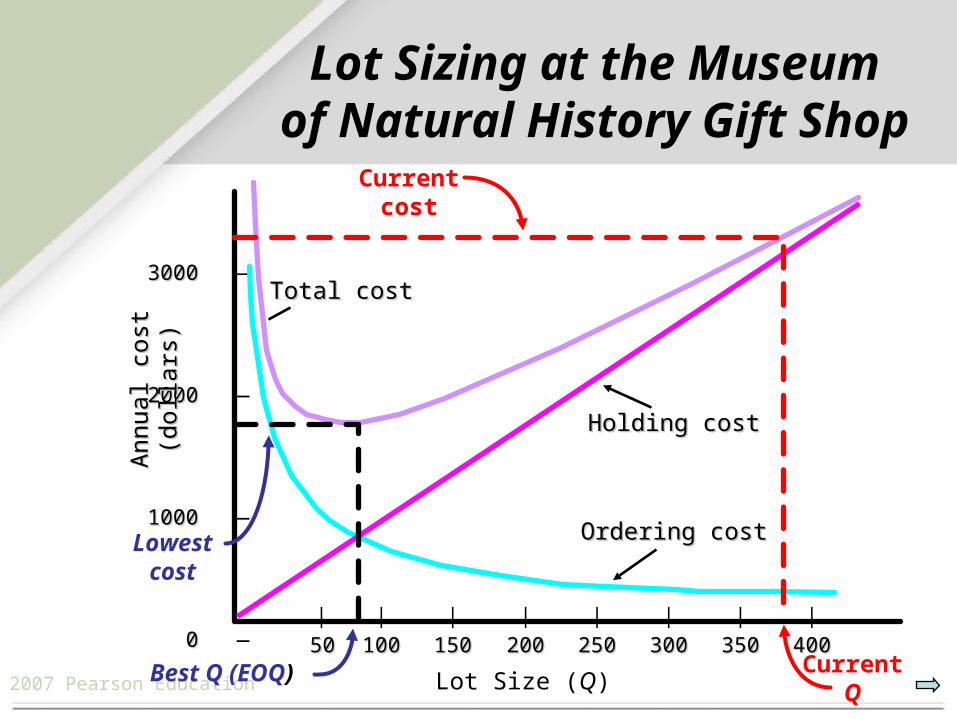
Museum of Natural History Gift Shop:

© 2007 Pearson Education
Costing out a Lot Sizing Policy Example 12.2
What is the annual cycle-inventory cost (C) of the current policy of using a 390-unit lot size?
D = (18 /week)(52 weeks) = 936 units H = 0.25 ($60/unit) = $15
C = $2925 + $108 = $3033
C = (H) + (S) = (15) + (45) Q2
DQ
936390
3902
Museum of Natural History Gift Shop:
© 2007 Pearson Education
3000 3000 —
2000 2000 —
1000 1000 —
0 0 —| | | | | | | |
5050 100100 150150 200200 250250 300300 350350 400400
Lot Size (Q)
Ann
ual c
ost
(dol
lars
)A
nnua
l cos
t (d
olla
rs) Total costTotal cost
Holding costHolding cost
Ordering costOrdering cost
Currentcost
CurrentQ
Lowestcost
Best Q (EOQ)
Lot Sizing at the Museumof Natural History Gift Shop

© 2007 Pearson Education
EOQ POLICY
C = (H) + (S)Q2
DQ
EOQ = 2DS
H
D = annual demandS = ordering or setup costs per lotH = holding costs per unit
D = 936 unitsH = $15S = $45
EOQ = 2(936)4515
= 74.94 or 75 units
C = (15) + (45)752
93675
C = $1,124.10
Bird Feeders:
© 2007 Pearson Education
ABC Cycle Ltd. A manufacturer of sports bikes, has an annual demand of 240,000 units in a year. On an average, delivery of an order takes seven working days.
What is the reorder level?

© 2007 Pearson Education
Application 12.1

© 2007 Pearson Education
Application 12.1

© 2007 Pearson Education
Application 12.2
© 2007 Pearson Education
Application 12.2continued
© 2007 Pearson Education
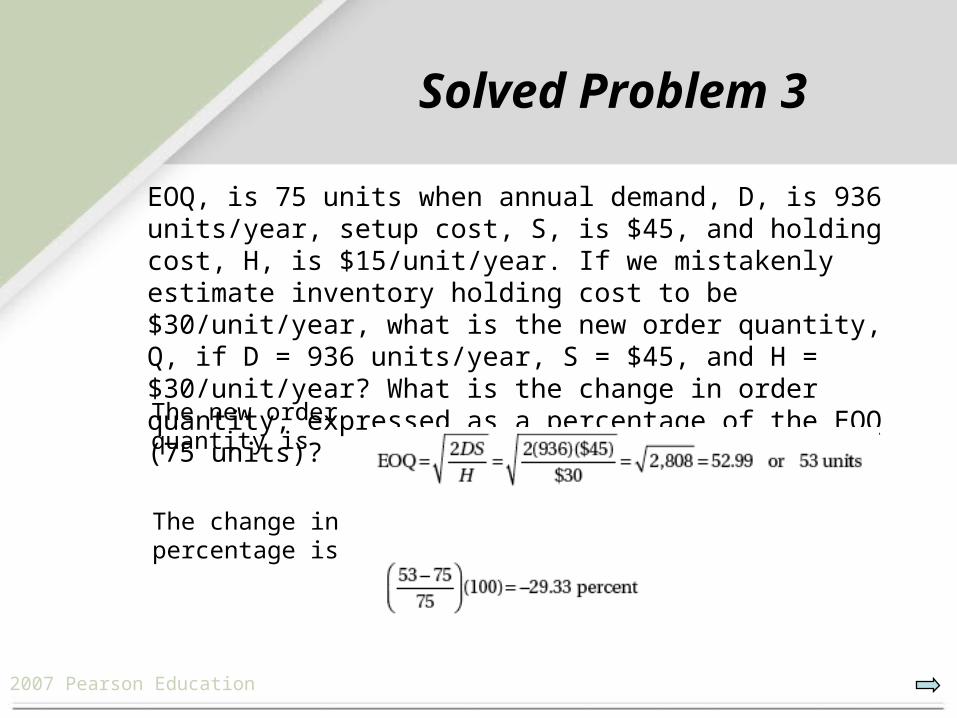
EOQ, is 75 units when annual demand, D, is 936 units/year, setup cost, S, is $45, and holding cost, H, is $15/unit/year. If we mistakenly estimate inventory holding cost to be $30/unit/year, what is the new order quantity, Q, if D = 936 units/year, S = $45, and H = $30/unit/year? What is the change in order quantity, expressed as a percentage of the EOQ (75 units)?
The new order quantity is
The change in percentage is
Solved Problem 3
© 2007 Pearson Education
Problem: Best Buy Demand for deskpro computer at Best Buy is 1000 units per
month. Best buy incurs a fixed order placement cost of $4000 each time an order is placed. Each component costs Best Buy $500 and the retailer has a holding cost of 20%.
Calculate the optimal order size and cycle inventory cost. If management chose a 900-unit lot size (Q) so that new orders could be placed less frequently, What is the annual cycle-inventory cost (C) of the current policy of using a 900-unit lot size?
Show these two situation in cost diagram. If delivery of an order takes place in each month, calculate
reorder level. What is the Time Between Orders (TBO) expressed in months.
© 2007 Pearson Education
Dominick Supermarket Dominick Supermarket sells nut flakes. Demand
for nut flakes is 1000 boxes per week. Dominicks has a holding cost of 25% and incurs $200 for each replenishment order. Calculate the cycle inventory cost.
If the ordering cost decreases to $150 then calculate the % change of cycle inventory cost.