Embed Size (px)
Citation preview
INTERNATIONAL JOURNAL OF CLIMATOLOGY
Int. J. Climatol. 19: 1477–1492 (1999)
CHANGE IN THE ASSOCIATION BETWEEN INDIAN OCEANSEA-SURFACE TEMPERATURES AND SUMMER RAINFALL OVER
SOUTH AFRICA AND NAMIBIAWILLEM A. LANDMANa,* and SIMON J. MASONb
a Climatology Research Group, Uni6ersity of the Witwatersrand, PO Box Wits 2050, South Africab International Research Institute for Climate Prediction, Scripps Institution of Oceanography, Uni6ersity of California San Diego,
Mail Code 0235, La Jolla, CA 92093-0235, USA
Recei6ed 13 August 1998Re6ised 24 February 1999Accepted 1 March 1999
ABSTRACT
The El Nino–Southern Oscillation (ENSO) signal in Indian Ocean sea-surface temperatures has weakened since thelate-1970s, resulting in important changes in the association between tropical western Indian Ocean sea-surfacetemperatures and December–February rainfall over South Africa and Namibia. Prior to the late-1970s, warm eventsin the tropical Indian Ocean occurred frequently in association with ENSO warm events, and both were typicallyassociated with anomalously dry conditions over much of South Africa and Namibia. Over the most recent twodecades, however, sea-surface temperature variability in the tropical western Indian Ocean has become significantlyless dependent upon ENSO. At the same time, warm (cold) events in the tropical western Indian Ocean have becomeassociated with wet (dry) conditions over the north-eastern half of South Africa and northern Namibia since thelate-1970s. These changes in rainfall–sea-surface temperature associations can be successfully simulated using ageneral circulation model. Such changes in the climate system have important implications for the predictability ofsouthern African rainfall, and highlight the need for an operational forecast system to predict Indian Oceansea-surface temperatures. Copyright © 1999 Royal Meteorological Society.
KEY WORDS: El Nino–Southern Oscillation; Indian Ocean; Namibia; principal component analysis; rainfall variability; sea-sur-face temperatures; seasonal forecasting; South Africa
1. INTRODUCTION
Sea-surface temperature anomalies of the Indian Ocean are related to southern African seasonal rainfallvariability (Nicholson and Entekhabi, 1987; Walker and Lindesay, 1989; Mason, 1990, 1995, 1998;Walker, 1990; Jury and Pathack, 1991; Jury et al., 1993; Mason et al., 1994; Makarau and Jury, 1997;Mason and Jury, 1997; Rocha and Simmonds, 1997; Landman and Mason, 1999; Mason and Tyson,1999). Warmer (cooler) than average sea-surface temperatures in the Agulhas system, for example, areassociated with wetter (drier) than average rainfall over part of the summer rainfall region of South Africa(Jury et al., 1993). However, areas of stronger association between sea-surface temperature and SouthAfrican rainfall are located distant from the country in the tropical Indian Ocean east of 50°E (Walker,1990), and with the strongest rainfall/sea-surface temperature association in the western equatorial IndianOcean (Mason, 1995; Mason and Jury, 1997). Anomalously warm sea-surface temperatures in the centraland tropical western Indian Ocean frequently have been associated with drier than average conditionsover South Africa, a conclusion that has been supported by general circulation model simulations (Masonet al., 1994; Jury et al., 1996; Tennant, 1996; Goddard and Graham, 1999).
* Correspondence to: South African Weather Bureau, Private Bag X097, Pretoria 0001, South Africa; e-mail:[email protected]
CCC 0899–8418/99/131477–16$17.50Copyright © 1999 Royal Meteorological Society
W.A. LANDMAN AND S.J. MASON1478
Since the late-1970s, sea-surface temperature variability in the equatorial Indian Ocean has beencharacterized by increasing temperatures (Trenberth, 1990; Kerr, 1992; Graham, 1994, 1995; Kawamura,1994; Allan et al., 1995; Wang, 1995). Subsequent to this warming, anomalously warm conditions in thetropical western Indian Ocean have sometimes been associated with wet conditions over parts of southernAfrica (Lindesay and Jury, 1991; Hulme, 1996; Mason and Jury, 1997; Mason and Tyson, 1999), possiblybecause the area is thought to be an important source of atmospheric moisture throughout the summerrainfall season (D’Abreton and Lindesay, 1993; D’Abreton and Tyson, 1995, 1996; cf. Crimp and Mason,1999). In this paper, associations between the austral summer (December–February) global sea-surfacetemperatures and seasonal rainfall over South Africa and Namibia prior to and after the late-1970swarming are compared.
2. DATA AND METHODS
Sea-surface temperature variations are responsible for a large percentage of the rainfall variability of theaustral summer rainfall over southern Africa. Three-month mean (December–February) sea-surfacetemperature data for the 40-year period 1957/1958–1996/1997 were calculated using the United KingdomMeteorological Office Historical Sea-Surface Temperature data set (Parker et al., 1995). The data arequality controlled. Missing values were estimated by averaging the anomalies from adjacent grids, andremaining missing values were replaced with Gaussian noise (Mason, 1995, 1998). A principal componentsanalysis of the correlation matrix of the 3-month mean sea-surface temperature data was performed usingdata for the Indian Ocean and for the Pacific Ocean south of 20°N. The analysis was performed on thedata for the entire 40-year period, and then for the 20-year periods prior to and after the 1976/1977 ElNino separately. In each case, the first two principal components were retained and rotated using thevarimax criterion (Richman, 1986).
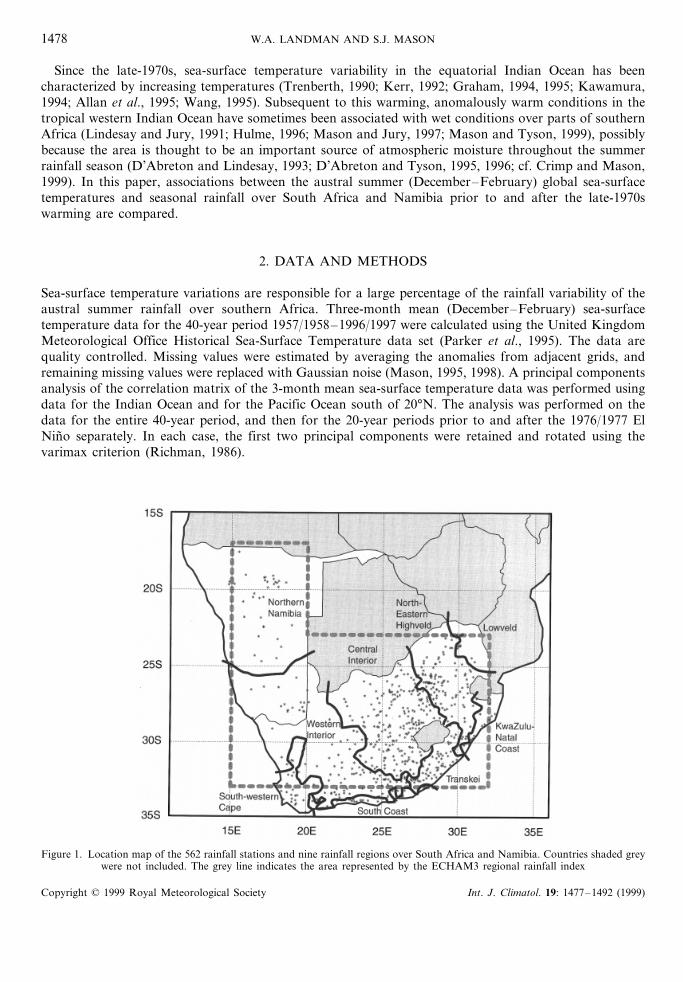
Figure 1. Location map of the 562 rainfall stations and nine rainfall regions over South Africa and Namibia. Countries shaded greywere not included. The grey line indicates the area represented by the ECHAM3 regional rainfall index
Copyright © 1999 Royal Meteorological Society Int. J. Climatol. 19: 1477–1492 (1999)

SEA-SURFACE TEMPERATURES AND SOUTHERN AFRICAN RAINFALL 1479
Table I. Percentage and cumulative percentage variances explained by the first twounrotated principal components of December–February sea-surface temperatures of the
Indian Ocean and of the Pacific Ocean south of 20°N
Period Component 1 (%) Component 2 (%) Cumulative (%)
1957/1958–1996/1997 21.6 8.2 29.91957/1958–1976/1977 24.4 10.0 34.41977/1978–1996/1997 17.2 10.4 27.6
December–February rainfall totals from 510 South African station records and 52 stations for Namibia(Figure 1) were calculated for the same 40-year period, 1957/1958–1996/1997. Regional rainfall indiceswere computed in a manner similar to that of Mason (1998). Principal components analysis (Preisendor-fer, 1988; Jackson, 1991; Von Storch and Navarra, 1995), based on standardized monthly data for theclimatological period 1961–1990, was performed and seven unrotated principal components were re-tained. Rainfall regions were defined by clustering the scores on the seven components (Mason, 1998)using Euclidian distances and Ward’s minimum variance method (Everitt, 1980). Nine regions weredefined and are illustrated in Figure 1. Weighted averages of the standardized December–Februaryrainfall for the 40-year period 1957/1958–1996/1997, and for all the stations within each region werecalculated. Weights were defined using Thiessen polygons (Thiessen, 1911). The regions are those used inthe South African Weather Bureau’s seasonal forecasting operations, and are defined as: south-westernCape; south coast; Transkei; KwaZulu-Natal coast; Lowveld; north-eastern Highveld; central interior;western interior; northern Namibia.
A regional rainfall index was calculated using simulated rainfall by the ECHAM general circulationmodel at T42 resolution (approximately 2.8° of latitude and longitude). The ECHAM model simulationswere forced with the Reynolds reconstructed SST data (Reynolds and Smith, 1994) for the period1950–1996 and Reynolds optimally interpolated (OI) SST data (Reynolds, 1988) beginning in 1997.December–February simulated rainfall totals were calculated for the same 40-year period 1957/1958–1996/1997. The seasonal rainfall totals were averaged over all grid points between 17°S–33°S and15°E–32°E, and excluding the area between 17°S–23°S and 20°E–32°E, approximately representing thesummer rainfall regions of South Africa and Namibia (as illustrated in Figure 1). A ten-memberensemble-average index was then calculated.
Correlations between regional rainfall indices and a western equatorial sea-surface temperature indexwere checked for significance at the 95% level of confidence. Permutation methods were used to test forthe significance of changes in correlations between the two 20-year periods. The 40 years were randomlydivided into two groups of 20 years 1000 times, and differences between the correlations were recorded.The observed correlation differences were then compared to the empirical distribution to obtain theprobability of exceeding the observed difference by chance. The means of the data prior to and after 1976were removed before the permutation procedure was conducted, thus ensuring that the random changesin correlation were unaffected by additional variance that would result from the differences in sea-surfacetemperatures prior to and after the abrupt warming.
3. RESULTS
3.1. Principal components analysis of the Indo–Pacific sea-surface temperatures
Principal components analyses of the correlation matrix of December–February sea-surface tempera-tures were performed for the entire 40-year period, and for the 20-year periods prior to and after the1976/1977 El Nino. The explained variances of the first two rotated components of the three periods aresummarized in Table I. The accumulated explained variances are about 30% for all three periods, with thefirst component explaining about 20% and the second about 10%.
Copyright © 1999 Royal Meteorological Society Int. J. Climatol. 19: 1477–1492 (1999)
W.A. LANDMAN AND S.J. MASON1480
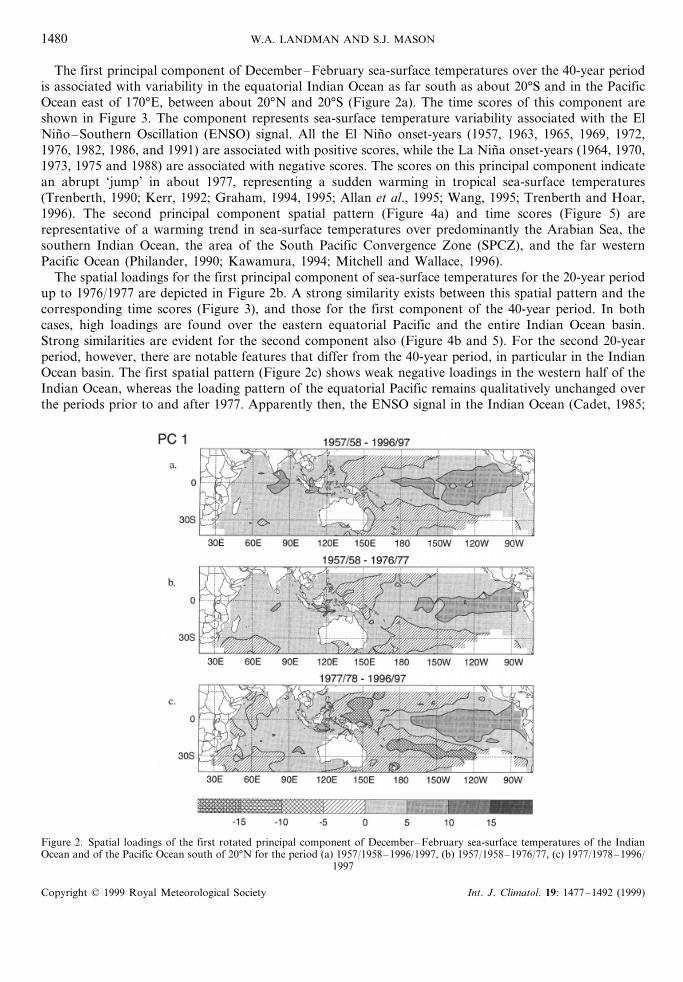
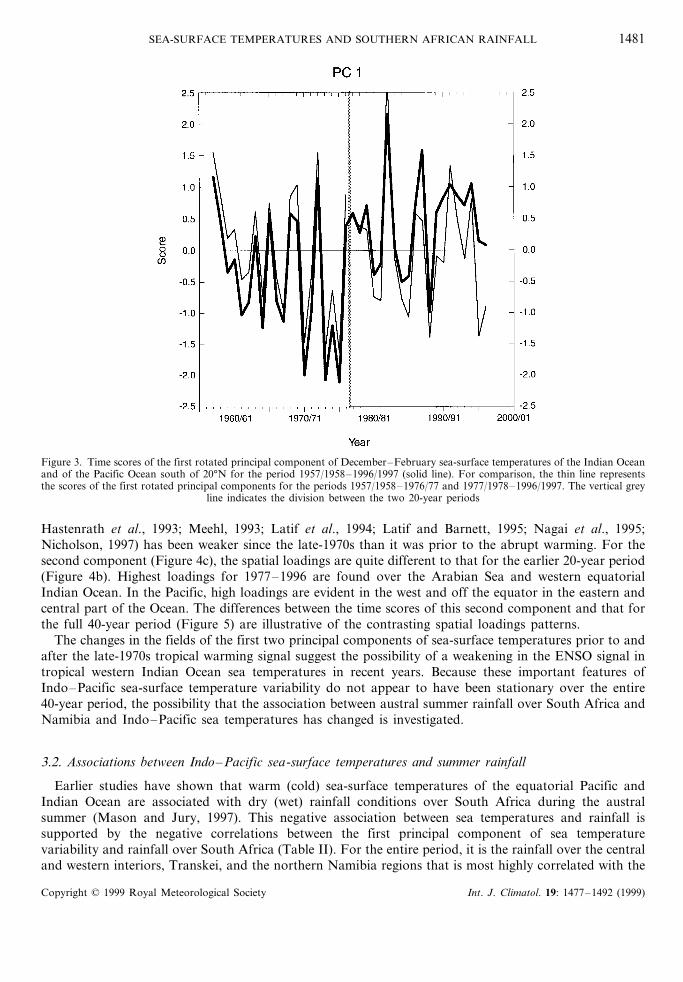
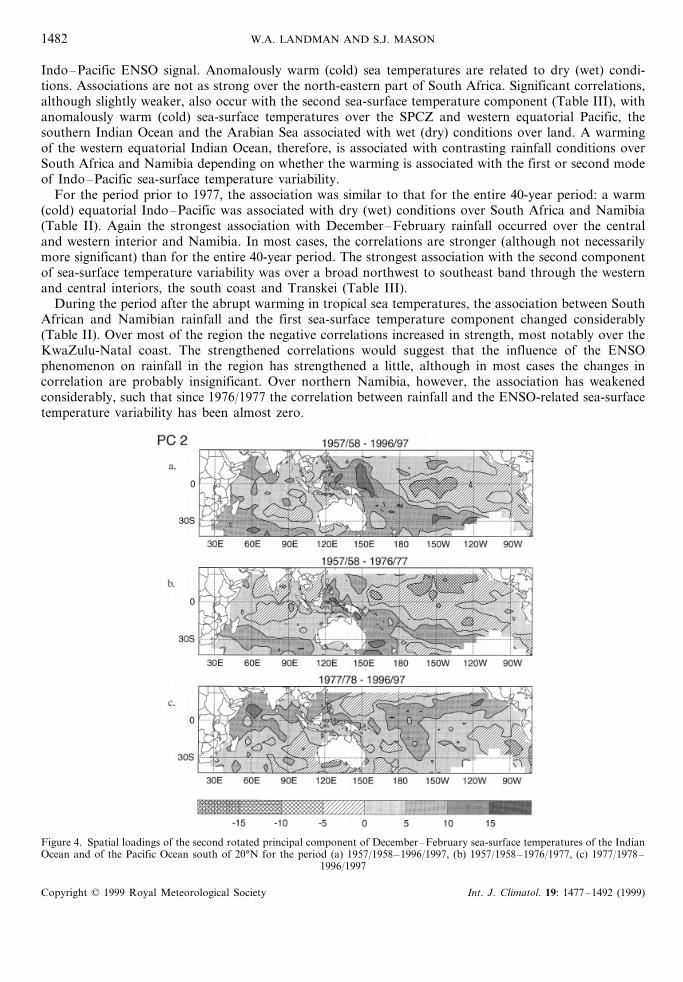
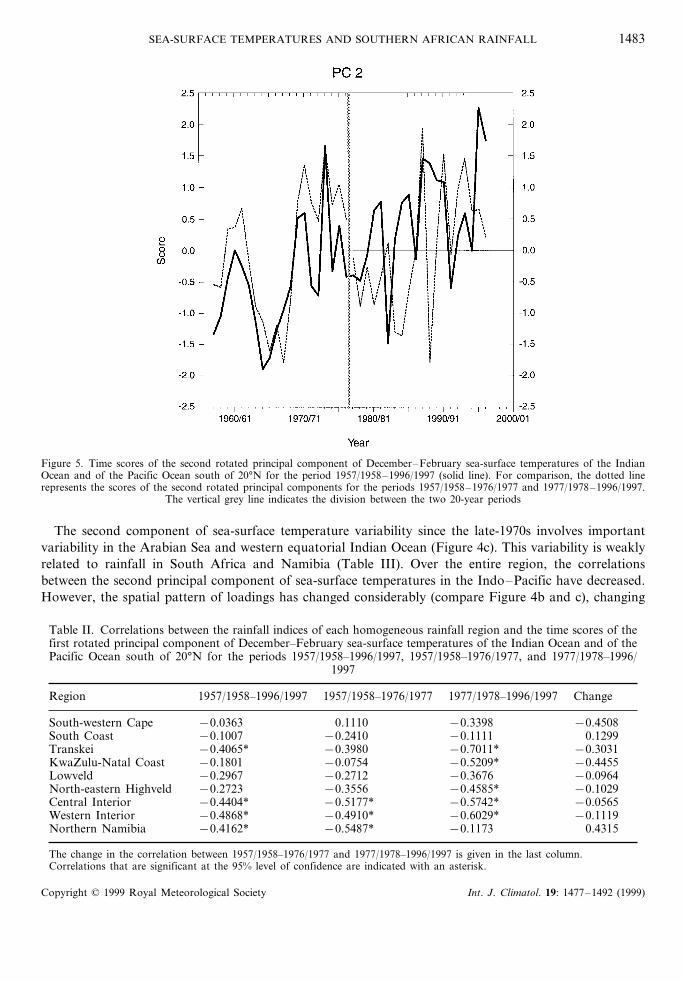
The first principal component of December–February sea-surface temperatures over the 40-year periodis associated with variability in the equatorial Indian Ocean as far south as about 20°S and in the PacificOcean east of 170°E, between about 20°N and 20°S (Figure 2a). The time scores of this component areshown in Figure 3. The component represents sea-surface temperature variability associated with the ElNino–Southern Oscillation (ENSO) signal. All the El Nino onset-years (1957, 1963, 1965, 1969, 1972,1976, 1982, 1986, and 1991) are associated with positive scores, while the La Nina onset-years (1964, 1970,1973, 1975 and 1988) are associated with negative scores. The scores on this principal component indicatean abrupt ‘jump’ in about 1977, representing a sudden warming in tropical sea-surface temperatures(Trenberth, 1990; Kerr, 1992; Graham, 1994, 1995; Allan et al., 1995; Wang, 1995; Trenberth and Hoar,1996). The second principal component spatial pattern (Figure 4a) and time scores (Figure 5) arerepresentative of a warming trend in sea-surface temperatures over predominantly the Arabian Sea, thesouthern Indian Ocean, the area of the South Pacific Convergence Zone (SPCZ), and the far westernPacific Ocean (Philander, 1990; Kawamura, 1994; Mitchell and Wallace, 1996).
The spatial loadings for the first principal component of sea-surface temperatures for the 20-year periodup to 1976/1977 are depicted in Figure 2b. A strong similarity exists between this spatial pattern and thecorresponding time scores (Figure 3), and those for the first component of the 40-year period. In bothcases, high loadings are found over the eastern equatorial Pacific and the entire Indian Ocean basin.Strong similarities are evident for the second component also (Figure 4b and 5). For the second 20-yearperiod, however, there are notable features that differ from the 40-year period, in particular in the IndianOcean basin. The first spatial pattern (Figure 2c) shows weak negative loadings in the western half of theIndian Ocean, whereas the loading pattern of the equatorial Pacific remains qualitatively unchanged overthe periods prior to and after 1977. Apparently then, the ENSO signal in the Indian Ocean (Cadet, 1985;
Figure 2. Spatial loadings of the first rotated principal component of December–February sea-surface temperatures of the IndianOcean and of the Pacific Ocean south of 20°N for the period (a) 1957/1958–1996/1997, (b) 1957/1958–1976/77, (c) 1977/1978–1996/
1997
Copyright © 1999 Royal Meteorological Society Int. J. Climatol. 19: 1477–1492 (1999)
SEA-SURFACE TEMPERATURES AND SOUTHERN AFRICAN RAINFALL 1481
Figure 3. Time scores of the first rotated principal component of December–February sea-surface temperatures of the Indian Oceanand of the Pacific Ocean south of 20°N for the period 1957/1958–1996/1997 (solid line). For comparison, the thin line representsthe scores of the first rotated principal components for the periods 1957/1958–1976/77 and 1977/1978–1996/1997. The vertical grey
line indicates the division between the two 20-year periods
Hastenrath et al., 1993; Meehl, 1993; Latif et al., 1994; Latif and Barnett, 1995; Nagai et al., 1995;Nicholson, 1997) has been weaker since the late-1970s than it was prior to the abrupt warming. For thesecond component (Figure 4c), the spatial loadings are quite different to that for the earlier 20-year period(Figure 4b). Highest loadings for 1977–1996 are found over the Arabian Sea and western equatorialIndian Ocean. In the Pacific, high loadings are evident in the west and off the equator in the eastern andcentral part of the Ocean. The differences between the time scores of this second component and that forthe full 40-year period (Figure 5) are illustrative of the contrasting spatial loadings patterns.
The changes in the fields of the first two principal components of sea-surface temperatures prior to andafter the late-1970s tropical warming signal suggest the possibility of a weakening in the ENSO signal intropical western Indian Ocean sea temperatures in recent years. Because these important features ofIndo–Pacific sea-surface temperature variability do not appear to have been stationary over the entire40-year period, the possibility that the association between austral summer rainfall over South Africa andNamibia and Indo–Pacific sea temperatures has changed is investigated.
3.2. Associations between Indo–Pacific sea-surface temperatures and summer rainfall
Earlier studies have shown that warm (cold) sea-surface temperatures of the equatorial Pacific andIndian Ocean are associated with dry (wet) rainfall conditions over South Africa during the australsummer (Mason and Jury, 1997). This negative association between sea temperatures and rainfall issupported by the negative correlations between the first principal component of sea temperaturevariability and rainfall over South Africa (Table II). For the entire period, it is the rainfall over the centraland western interiors, Transkei, and the northern Namibia regions that is most highly correlated with the
Copyright © 1999 Royal Meteorological Society Int. J. Climatol. 19: 1477–1492 (1999)
W.A. LANDMAN AND S.J. MASON1482
Indo–Pacific ENSO signal. Anomalously warm (cold) sea temperatures are related to dry (wet) condi-tions. Associations are not as strong over the north-eastern part of South Africa. Significant correlations,although slightly weaker, also occur with the second sea-surface temperature component (Table III), withanomalously warm (cold) sea-surface temperatures over the SPCZ and western equatorial Pacific, thesouthern Indian Ocean and the Arabian Sea associated with wet (dry) conditions over land. A warmingof the western equatorial Indian Ocean, therefore, is associated with contrasting rainfall conditions overSouth Africa and Namibia depending on whether the warming is associated with the first or second modeof Indo–Pacific sea-surface temperature variability.
For the period prior to 1977, the association was similar to that for the entire 40-year period: a warm(cold) equatorial Indo–Pacific was associated with dry (wet) conditions over South Africa and Namibia(Table II). Again the strongest association with December–February rainfall occurred over the centraland western interior and Namibia. In most cases, the correlations are stronger (although not necessarilymore significant) than for the entire 40-year period. The strongest association with the second componentof sea-surface temperature variability was over a broad northwest to southeast band through the westernand central interiors, the south coast and Transkei (Table III).
During the period after the abrupt warming in tropical sea temperatures, the association between SouthAfrican and Namibian rainfall and the first sea-surface temperature component changed considerably(Table II). Over most of the region the negative correlations increased in strength, most notably over theKwaZulu-Natal coast. The strengthened correlations would suggest that the influence of the ENSOphenomenon on rainfall in the region has strengthened a little, although in most cases the changes incorrelation are probably insignificant. Over northern Namibia, however, the association has weakenedconsiderably, such that since 1976/1977 the correlation between rainfall and the ENSO-related sea-surfacetemperature variability has been almost zero.
Figure 4. Spatial loadings of the second rotated principal component of December–February sea-surface temperatures of the IndianOcean and of the Pacific Ocean south of 20°N for the period (a) 1957/1958–1996/1997, (b) 1957/1958–1976/1977, (c) 1977/1978–
1996/1997
Copyright © 1999 Royal Meteorological Society Int. J. Climatol. 19: 1477–1492 (1999)
SEA-SURFACE TEMPERATURES AND SOUTHERN AFRICAN RAINFALL 1483
Figure 5. Time scores of the second rotated principal component of December–February sea-surface temperatures of the IndianOcean and of the Pacific Ocean south of 20°N for the period 1957/1958–1996/1997 (solid line). For comparison, the dotted linerepresents the scores of the second rotated principal components for the periods 1957/1958–1976/1977 and 1977/1978–1996/1997.
The vertical grey line indicates the division between the two 20-year periods
The second component of sea-surface temperature variability since the late-1970s involves importantvariability in the Arabian Sea and western equatorial Indian Ocean (Figure 4c). This variability is weaklyrelated to rainfall in South Africa and Namibia (Table III). Over the entire region, the correlationsbetween the second principal component of sea-surface temperatures in the Indo–Pacific have decreased.However, the spatial pattern of loadings has changed considerably (compare Figure 4b and c), changing
Table II. Correlations between the rainfall indices of each homogeneous rainfall region and the time scores of thefirst rotated principal component of December–February sea-surface temperatures of the Indian Ocean and of thePacific Ocean south of 20°N for the periods 1957/1958–1996/1997, 1957/1958–1976/1977, and 1977/1978–1996/
1997
Region 1957/1958–1996/1997 1957/1958–1976/1977 1977/1978–1996/1997 Change
−0.4508−0.3398South-western Cape 0.1110−0.0363South Coast −0.1007 −0.2410 −0.1111 0.1299
−0.3031−0.4065*Transkei −0.3980 −0.7011*−0.4455−0.1801 −0.0754KwaZulu-Natal Coast −0.5209*−0.0964−0.3676Lowveld −0.2712−0.2967
North-eastern Highveld −0.2723 −0.3556 −0.4585* −0.1029Central Interior −0.4404* −0.5177* −0.5742* −0.0565
−0.1119−0.6029*−0.4910*−0.4868*Western Interior0.4315Northern Namibia −0.4162* −0.5487* −0.1173
The change in the correlation between 1957/1958–1976/1977 and 1977/1978–1996/1997 is given in the last column.Correlations that are significant at the 95% level of confidence are indicated with an asterisk.
Copyright © 1999 Royal Meteorological Society Int. J. Climatol. 19: 1477–1492 (1999)
W.A. LANDMAN AND S.J. MASON1484
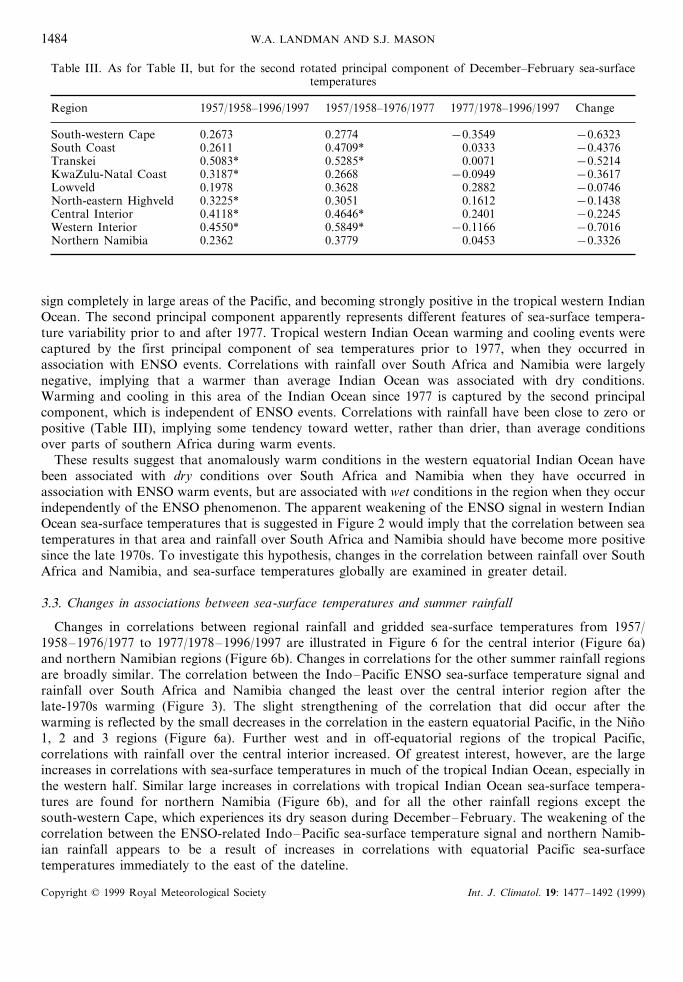
Table III. As for Table II, but for the second rotated principal component of December–February sea-surfacetemperatures
Region 1957/1958–1996/1997 1957/1958–1976/1977 1977/1978–1996/1997 Change
South-western Cape 0.2673 0.2774 −0.3549 −0.6323South Coast 0.2611 0.4709* 0.0333 −0.4376Transkei 0.5083* 0.5285* 0.0071 −0.5214KwaZulu-Natal Coast 0.3187* 0.2668 −0.0949 −0.3617Lowveld 0.1978 0.3628 0.2882 −0.0746North-eastern Highveld 0.3225* 0.3051 0.1612 −0.1438Central Interior 0.4118* 0.4646* 0.2401 −0.2245Western Interior 0.4550* 0.5849* −0.1166 −0.7016Northern Namibia 0.2362 0.3779 0.0453 −0.3326
sign completely in large areas of the Pacific, and becoming strongly positive in the tropical western IndianOcean. The second principal component apparently represents different features of sea-surface tempera-ture variability prior to and after 1977. Tropical western Indian Ocean warming and cooling events werecaptured by the first principal component of sea temperatures prior to 1977, when they occurred inassociation with ENSO events. Correlations with rainfall over South Africa and Namibia were largelynegative, implying that a warmer than average Indian Ocean was associated with dry conditions.Warming and cooling in this area of the Indian Ocean since 1977 is captured by the second principalcomponent, which is independent of ENSO events. Correlations with rainfall have been close to zero orpositive (Table III), implying some tendency toward wetter, rather than drier, than average conditionsover parts of southern Africa during warm events.
These results suggest that anomalously warm conditions in the western equatorial Indian Ocean havebeen associated with dry conditions over South Africa and Namibia when they have occurred inassociation with ENSO warm events, but are associated with wet conditions in the region when they occurindependently of the ENSO phenomenon. The apparent weakening of the ENSO signal in western IndianOcean sea-surface temperatures that is suggested in Figure 2 would imply that the correlation between seatemperatures in that area and rainfall over South Africa and Namibia should have become more positivesince the late 1970s. To investigate this hypothesis, changes in the correlation between rainfall over SouthAfrica and Namibia, and sea-surface temperatures globally are examined in greater detail.
3.3. Changes in associations between sea-surface temperatures and summer rainfall
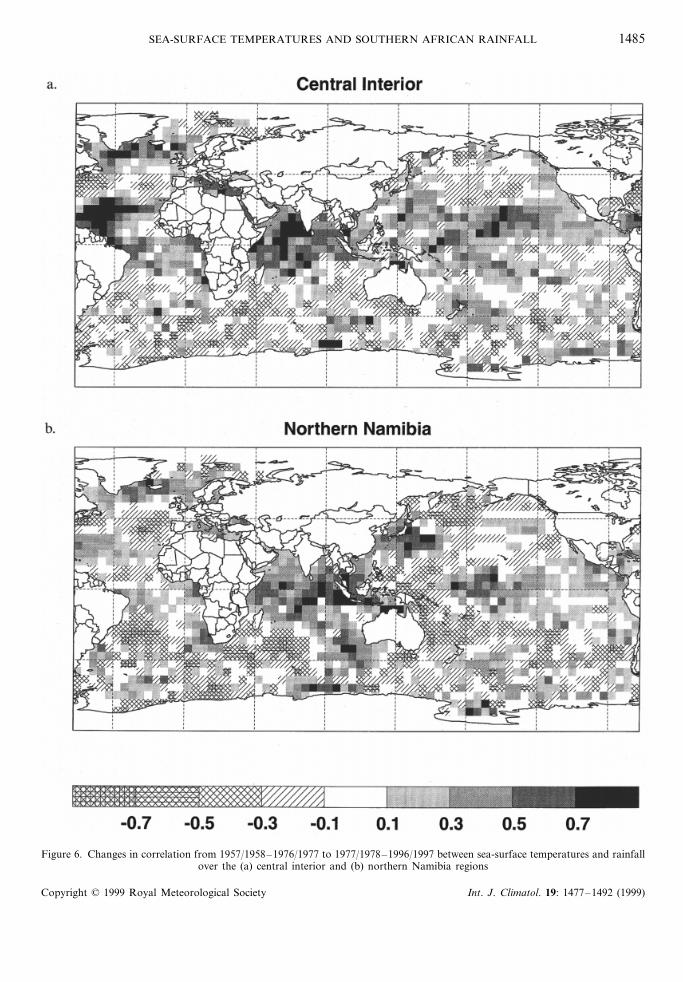
Changes in correlations between regional rainfall and gridded sea-surface temperatures from 1957/1958–1976/1977 to 1977/1978–1996/1997 are illustrated in Figure 6 for the central interior (Figure 6a)and northern Namibian regions (Figure 6b). Changes in correlations for the other summer rainfall regionsare broadly similar. The correlation between the Indo–Pacific ENSO sea-surface temperature signal andrainfall over South Africa and Namibia changed the least over the central interior region after thelate-1970s warming (Figure 3). The slight strengthening of the correlation that did occur after thewarming is reflected by the small decreases in the correlation in the eastern equatorial Pacific, in the Nino1, 2 and 3 regions (Figure 6a). Further west and in off-equatorial regions of the tropical Pacific,correlations with rainfall over the central interior increased. Of greatest interest, however, are the largeincreases in correlations with sea-surface temperatures in much of the tropical Indian Ocean, especially inthe western half. Similar large increases in correlations with tropical Indian Ocean sea-surface tempera-tures are found for northern Namibia (Figure 6b), and for all the other rainfall regions except thesouth-western Cape, which experiences its dry season during December–February. The weakening of thecorrelation between the ENSO-related Indo–Pacific sea-surface temperature signal and northern Namib-ian rainfall appears to be a result of increases in correlations with equatorial Pacific sea-surfacetemperatures immediately to the east of the dateline.
Copyright © 1999 Royal Meteorological Society Int. J. Climatol. 19: 1477–1492 (1999)
SEA-SURFACE TEMPERATURES AND SOUTHERN AFRICAN RAINFALL 1485
Figure 6. Changes in correlation from 1957/1958–1976/1977 to 1977/1978–1996/1997 between sea-surface temperatures and rainfallover the (a) central interior and (b) northern Namibia regions
Copyright © 1999 Royal Meteorological Society Int. J. Climatol. 19: 1477–1492 (1999)
W.A. LANDMAN AND S.J. MASON1486
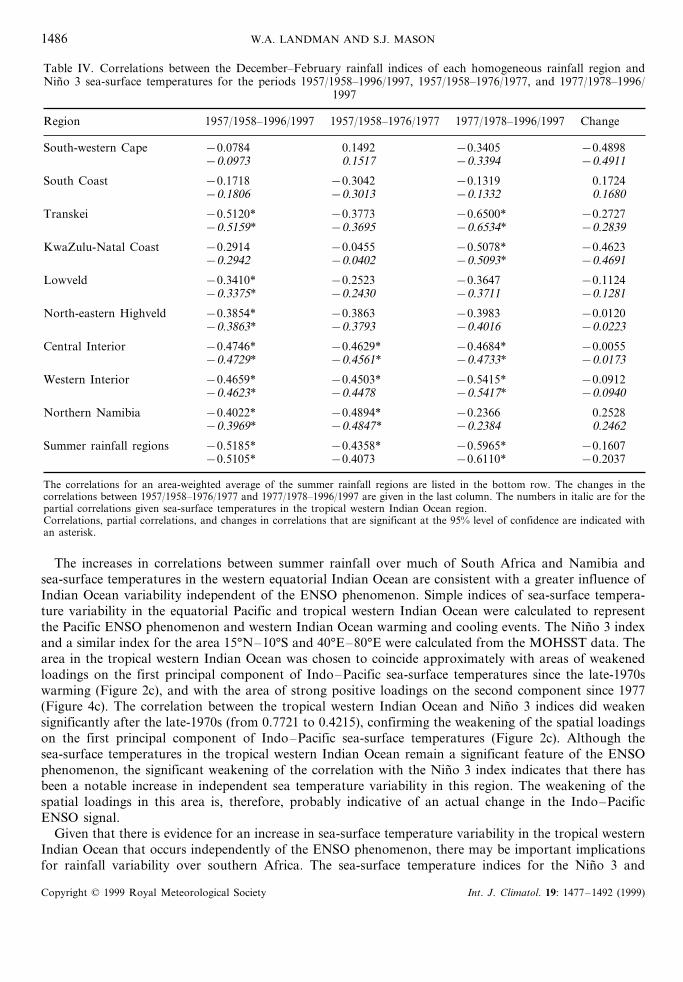
Table IV. Correlations between the December–February rainfall indices of each homogeneous rainfall region andNino 3 sea-surface temperatures for the periods 1957/1958–1996/1997, 1957/1958–1976/1977, and 1977/1978–1996/
1997
Region 1957/1958–1996/1997 1957/1958–1976/1977 1977/1978–1996/1997 Change
South-western Cape −0.0784 0.1492 −0.3405 −0.4898−0.0973 0.1517 −0.3394 −0.4911
South Coast −0.1718 −0.3042 −0.1319 0.1724−0.1806 −0.3013 −0.1332 0.1680
Transkei −0.5120* −0.3773 −0.6500* −0.2727−0.5159* −0.3695 −0.6534* −0.2839
KwaZulu-Natal Coast −0.2914 −0.0455 −0.5078* −0.4623−0.2942 −0.0402 −0.5093* −0.4691
Lowveld −0.3410* −0.2523 −0.3647 −0.1124−0.3375* −0.2430 −0.3711 −0.1281
North-eastern Highveld −0.3854* −0.3863 −0.3983 −0.0120−0.3863* −0.3793 −0.4016 −0.0223
Central Interior −0.4746* −0.4629* −0.4684* −0.0055−0.4729* −0.4561* −0.4733* −0.0173
Western Interior −0.4659* −0.4503* −0.5415* −0.0912−0.4623* −0.4478 −0.5417* −0.0940
Northern Namibia −0.4022* −0.4894* −0.2366 0.2528−0.3969* −0.4847* −0.2384 0.2462
Summer rainfall regions −0.5185* −0.4358* −0.5965* −0.1607−0.5105* −0.4073 −0.6110* −0.2037
The correlations for an area-weighted average of the summer rainfall regions are listed in the bottom row. The changes in thecorrelations between 1957/1958–1976/1977 and 1977/1978–1996/1997 are given in the last column. The numbers in italic are for thepartial correlations given sea-surface temperatures in the tropical western Indian Ocean region.Correlations, partial correlations, and changes in correlations that are significant at the 95% level of confidence are indicated withan asterisk.
The increases in correlations between summer rainfall over much of South Africa and Namibia andsea-surface temperatures in the western equatorial Indian Ocean are consistent with a greater influence ofIndian Ocean variability independent of the ENSO phenomenon. Simple indices of sea-surface tempera-ture variability in the equatorial Pacific and tropical western Indian Ocean were calculated to representthe Pacific ENSO phenomenon and western Indian Ocean warming and cooling events. The Nino 3 indexand a similar index for the area 15°N–10°S and 40°E–80°E were calculated from the MOHSST data. Thearea in the tropical western Indian Ocean was chosen to coincide approximately with areas of weakenedloadings on the first principal component of Indo–Pacific sea-surface temperatures since the late-1970swarming (Figure 2c), and with the area of strong positive loadings on the second component since 1977(Figure 4c). The correlation between the tropical western Indian Ocean and Nino 3 indices did weakensignificantly after the late-1970s (from 0.7721 to 0.4215), confirming the weakening of the spatial loadingson the first principal component of Indo–Pacific sea-surface temperatures (Figure 2c). Although thesea-surface temperatures in the tropical western Indian Ocean remain a significant feature of the ENSOphenomenon, the significant weakening of the correlation with the Nino 3 index indicates that there hasbeen a notable increase in independent sea temperature variability in this region. The weakening of thespatial loadings in this area is, therefore, probably indicative of an actual change in the Indo–PacificENSO signal.
Given that there is evidence for an increase in sea-surface temperature variability in the tropical westernIndian Ocean that occurs independently of the ENSO phenomenon, there may be important implicationsfor rainfall variability over southern Africa. The sea-surface temperature indices for the Nino 3 and
Copyright © 1999 Royal Meteorological Society Int. J. Climatol. 19: 1477–1492 (1999)
SEA-SURFACE TEMPERATURES AND SOUTHERN AFRICAN RAINFALL 1487
tropical western Indian Ocean were correlated with the regional rainfall indices to identify whether anysignificant changes in sea-surface temperature–rainfall associations have occurred. Partial correlationswere calculated also, and the significance of the changes in the correlations and partial correlations weretested at the 95% confidence level. As suggested by the first sea-surface temperature principal component,the association between ENSO-related sea-surface temperature variability (as measured by the Nino 3index) has strengthened over all the summer rainfall regions of South Africa and Namibia, except fornorthern Namibia (Table IV). None of the changes in correlation are significant, suggesting that theENSO–southern African rainfall association has been stable.
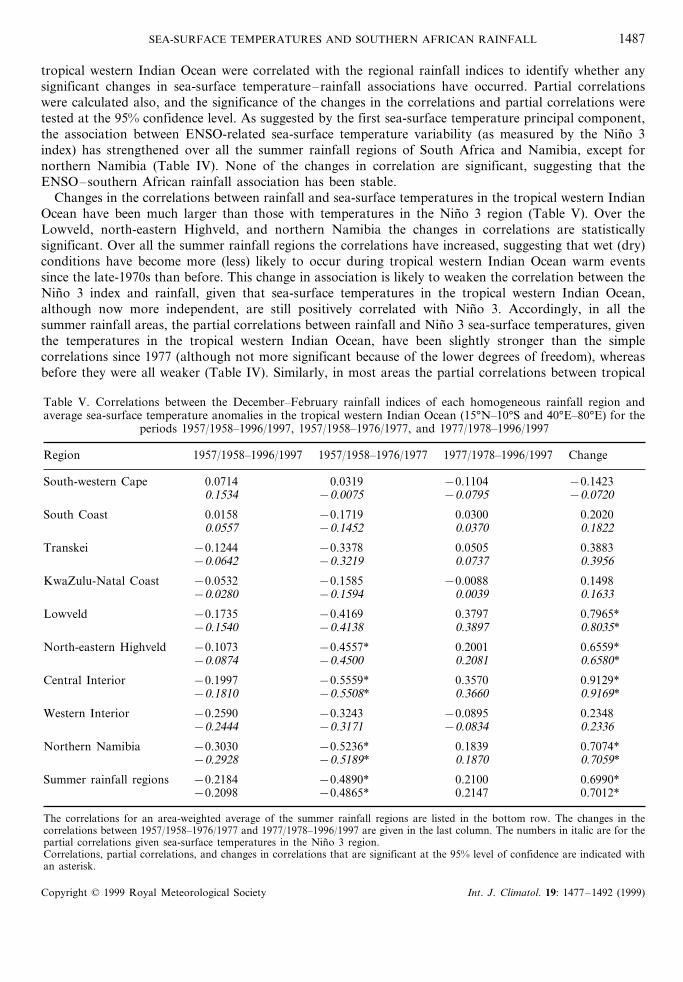
Changes in the correlations between rainfall and sea-surface temperatures in the tropical western IndianOcean have been much larger than those with temperatures in the Nino 3 region (Table V). Over theLowveld, north-eastern Highveld, and northern Namibia the changes in correlations are statisticallysignificant. Over all the summer rainfall regions the correlations have increased, suggesting that wet (dry)conditions have become more (less) likely to occur during tropical western Indian Ocean warm eventssince the late-1970s than before. This change in association is likely to weaken the correlation between theNino 3 index and rainfall, given that sea-surface temperatures in the tropical western Indian Ocean,although now more independent, are still positively correlated with Nino 3. Accordingly, in all thesummer rainfall areas, the partial correlations between rainfall and Nino 3 sea-surface temperatures, giventhe temperatures in the tropical western Indian Ocean, have been slightly stronger than the simplecorrelations since 1977 (although not more significant because of the lower degrees of freedom), whereasbefore they were all weaker (Table IV). Similarly, in most areas the partial correlations between tropical
Table V. Correlations between the December–February rainfall indices of each homogeneous rainfall region andaverage sea-surface temperature anomalies in the tropical western Indian Ocean (15°N–10°S and 40°E–80°E) for the
periods 1957/1958–1996/1997, 1957/1958–1976/1977, and 1977/1978–1996/1997
1957/1958–1996/1997 ChangeRegion 1977/1978–1996/19971957/1958–1976/1977
0.0714 0.0319South-western Cape −0.1104 −0.14230.1534 −0.0075 −0.0795 −0.0720
0.0158 −0.1719South Coast 0.0300 0.20200.0557 −0.1452 0.0370 0.1822
Transkei −0.1244 −0.3378 0.0505 0.3883−0.0642 −0.3219 0.0737 0.3956
KwaZulu-Natal Coast −0.0532 −0.1585 −0.0088 0.1498−0.0280 −0.1594 0.0039 0.1633
Lowveld −0.1735 −0.4169 0.3797 0.7965*0.8035*0.3897−0.4138−0.1540
−0.1073 −0.4557* 0.2001 0.6559*North-eastern Highveld0.6580*0.2081−0.4500−0.0874
−0.5559* 0.3570 0.9129*Central Interior −0.1997−0.1810 0.9169*−0.5508* 0.3660
−0.0895Western Interior −0.3243 0.2348−0.2590−0.0834 0.2336−0.3171−0.2444
−0.3030 −0.5236* 0.1839 0.7074*Northern Namibia−0.2928 −0.5189* 0.1870 0.7059*
0.2100−0.4890*−0.2184 0.6990*Summer rainfall regions−0.2098 −0.4865* 0.2147 0.7012*
The correlations for an area-weighted average of the summer rainfall regions are listed in the bottom row. The changes in thecorrelations between 1957/1958–1976/1977 and 1977/1978–1996/1997 are given in the last column. The numbers in italic are for thepartial correlations given sea-surface temperatures in the Nino 3 region.Correlations, partial correlations, and changes in correlations that are significant at the 95% level of confidence are indicated withan asterisk.
Copyright © 1999 Royal Meteorological Society Int. J. Climatol. 19: 1477–1492 (1999)

W.A. LANDMAN AND S.J. MASON1488
Figure 7. ECHAM ten-member ensemble-mean December–February rainfall averaged over all grid points between 18°S–33°S and15°E–32°E (solid line), and (dotted lines) (a) an area-weighted average of observed rainfall over the summer rainfall regions, (b) theNino 3 sea-surface temperature index, and (c) average sea-surface temperature anomalies in the tropical western Indian Ocean(15°N–10°S and 40°E–80°E). The axes of the sea-surface temperature indices (right-hand axes of b and c) have been inverted toemphasize the correlations. All units are in standardized anomalies. The vertical grey lines indicate the division between the 20-year
periods prior to and after 1977
western Indian Ocean sea-surface temperatures and rainfall, given the temperatures in the Nino 3 region,were weaker than the simple correlation prior to 1977, but are stronger after that date (Table V).
3.4. Implications for summer rainfall predictability
It has been shown that the influence of ENSO events on South African and Namibian rainfall hasremained reasonably stable over the 40-year period since the late-1950s, but that associations withsea-surface temperatures in the tropical western Indian Ocean have changed considerably. In addition,sea-surface temperature variability in this area of the Indian Ocean has become increasingly independentof the Indo–Pacific ENSO phenomenon. As a result of these changes, wet (dry) conditions over parts ofsouthern Africa have become more (less) likely to occur during warm events. Such changes in linearassociations will be problematic in most statistical seasonal rainfall forecasting models, but in theoryshould be reproducible in general circulation model simulations. Any change in the climate system,however, may result in some change in inherent predictability. The ECHAM general circulation modelwas, therefore, forced with observed sea-surface temperatures, and the simulated rainfall was compared tothe observations to provide an indication of the change in potential predictability of December–February
Copyright © 1999 Royal Meteorological Society Int. J. Climatol. 19: 1477–1492 (1999)
SEA-SURFACE TEMPERATURES AND SOUTHERN AFRICAN RAINFALL 1489
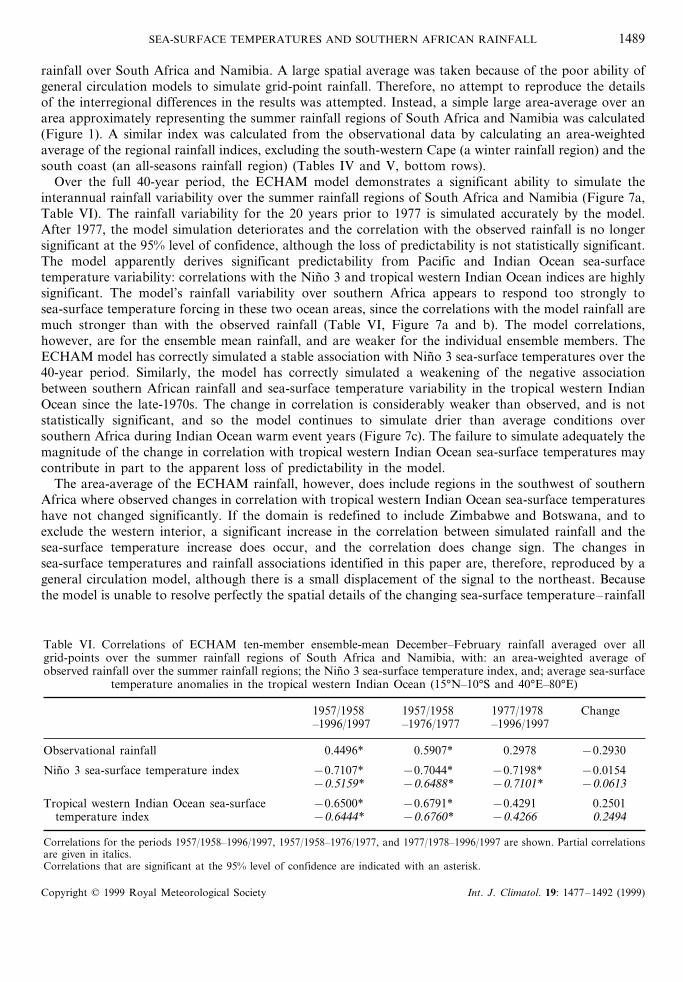
rainfall over South Africa and Namibia. A large spatial average was taken because of the poor ability ofgeneral circulation models to simulate grid-point rainfall. Therefore, no attempt to reproduce the detailsof the interregional differences in the results was attempted. Instead, a simple large area-average over anarea approximately representing the summer rainfall regions of South Africa and Namibia was calculated(Figure 1). A similar index was calculated from the observational data by calculating an area-weightedaverage of the regional rainfall indices, excluding the south-western Cape (a winter rainfall region) and thesouth coast (an all-seasons rainfall region) (Tables IV and V, bottom rows).
Over the full 40-year period, the ECHAM model demonstrates a significant ability to simulate theinterannual rainfall variability over the summer rainfall regions of South Africa and Namibia (Figure 7a,Table VI). The rainfall variability for the 20 years prior to 1977 is simulated accurately by the model.After 1977, the model simulation deteriorates and the correlation with the observed rainfall is no longersignificant at the 95% level of confidence, although the loss of predictability is not statistically significant.The model apparently derives significant predictability from Pacific and Indian Ocean sea-surfacetemperature variability: correlations with the Nino 3 and tropical western Indian Ocean indices are highlysignificant. The model’s rainfall variability over southern Africa appears to respond too strongly tosea-surface temperature forcing in these two ocean areas, since the correlations with the model rainfall aremuch stronger than with the observed rainfall (Table VI, Figure 7a and b). The model correlations,however, are for the ensemble mean rainfall, and are weaker for the individual ensemble members. TheECHAM model has correctly simulated a stable association with Nino 3 sea-surface temperatures over the40-year period. Similarly, the model has correctly simulated a weakening of the negative associationbetween southern African rainfall and sea-surface temperature variability in the tropical western IndianOcean since the late-1970s. The change in correlation is considerably weaker than observed, and is notstatistically significant, and so the model continues to simulate drier than average conditions oversouthern Africa during Indian Ocean warm event years (Figure 7c). The failure to simulate adequately themagnitude of the change in correlation with tropical western Indian Ocean sea-surface temperatures maycontribute in part to the apparent loss of predictability in the model.
The area-average of the ECHAM rainfall, however, does include regions in the southwest of southernAfrica where observed changes in correlation with tropical western Indian Ocean sea-surface temperatureshave not changed significantly. If the domain is redefined to include Zimbabwe and Botswana, and toexclude the western interior, a significant increase in the correlation between simulated rainfall and thesea-surface temperature increase does occur, and the correlation does change sign. The changes insea-surface temperatures and rainfall associations identified in this paper are, therefore, reproduced by ageneral circulation model, although there is a small displacement of the signal to the northeast. Becausethe model is unable to resolve perfectly the spatial details of the changing sea-surface temperature–rainfall
Table VI. Correlations of ECHAM ten-member ensemble-mean December–February rainfall averaged over allgrid-points over the summer rainfall regions of South Africa and Namibia, with: an area-weighted average ofobserved rainfall over the summer rainfall regions; the Nino 3 sea-surface temperature index, and; average sea-surface
temperature anomalies in the tropical western Indian Ocean (15°N–10°S and 40°E–80°E)
1977/1978 Change1957/19581957/1958–1976/1977–1996/1997 –1996/1997
0.5907*0.4496*Observational rainfall 0.2978 −0.2930
−0.7107* −0.7044*Nino 3 sea-surface temperature index −0.7198* −0.0154−0.5159* −0.6488* −0.7101* −0.0613
−0.6791* −0.4291Tropical western Indian Ocean sea-surface 0.2501−0.6500*−0.6444*temperature index 0.2494−0.4266−0.6760*
Correlations for the periods 1957/1958–1996/1997, 1957/1958–1976/1977, and 1977/1978–1996/1997 are shown. Partial correlationsare given in italics.Correlations that are significant at the 95% level of confidence are indicated with an asterisk.
Copyright © 1999 Royal Meteorological Society Int. J. Climatol. 19: 1477–1492 (1999)

W.A. LANDMAN AND S.J. MASON1490
associations since the late-1970s, some loss in predictability is incurred. Given that the model canreproduce the change, however, it may be possible to correct for the error using some form of modeloutput statistics procedure.
4. DISCUSSION AND SUMMARY
It has been shown that the ENSO signal in Indian Ocean sea-surface temperatures has weakened since thelate-1970s, and that this has resulted in important changes in the association between Indian Oceansea-surface temperatures and December–February rainfall over South Africa and Namibia. Prior to anabrupt warming in tropical sea-surface temperatures in the late-1970s, sea temperature variability in theequatorial Indian Ocean was closely related to ENSO. These warming events were typically associatedwith anomalously dry conditions over much of South Africa and Namibia, and are thought to have beena significant factor in the teleconnection between southern African rainfall variability and ENSO events(Mason and Jury, 1997; Goddard and Graham, 1999). This negative association between Indian Oceansea temperatures and rainfall was consistent with the association with equatorial Pacific sea-surfacetemperatures. Over the most recent two decades, however, sea-surface temperature variability in thetropical western Indian Ocean has become significantly less dependent upon ENSO. At the same time,warm (cold) events in the tropical western Indian Ocean have become associated with wet (dry) conditionsover the north-eastern half of South Africa and northern Namibia since the late-1970s. This positiveassociation is inconsistent with the influence of ENSO warm events on southern African rainfall. Becausethe western Indian Ocean warm events are occurring increasingly independently of ENSO events, theENSO influence on rainfall over South Africa and Namibia has remained stable, although if the IndianOcean has not been actively involved the mechanism of the transmission of the ENSO teleconnection isin question.
Because of the shortness of the 20-year periods considered in this paper, there is a possibility that theresults presented are not robust. The results in this paper are essentially unchanged if the analyses arerepeated using data from 1950, suggesting that the negative association between tropical western IndianOcean sea-surface temperatures and rainfall over much of southern Africa was stable prior to 1977. Inaddition, earlier research indicates that the association was negative since at least the early part of thecentury (Walker, 1990; Mason, 1995; Mason and Jury, 1997). The question remains whether the positiveassociation with southern African rainfall that has been dominant over the past two decades is robust, orsimply an effect of a weakening of the variance of tropical western Indian Ocean sea-surface temperaturesin a warmer background climate. It is worthy of note that the extreme positive anomalies of more thanfour sigma experienced in the Indian Ocean during the 1997/1998 El Nino were accompanied by averageto wet conditions over much of southern Africa, except for Namibia. The occurrence of an exceptionallywarm Indian Ocean during the 1997/1998 season suggests that the ENSO signal in sea-surface tempera-tures in the tropical western Indian Ocean may not have weakened, contrary to the results presented inthis paper. However, the fact that the 1997/1998 El Nino did not cause widespread dry conditions insouthern Africa confirms the evidence for a trend from a negative to a positive association between seatemperatures in the tropical western Indian Ocean and rainfall over parts of southern Africa. The need foran operational forecast system to predict Indian Ocean sea-surface temperatures is thus highlighted.
The recent change in the association between tropical western Indian Ocean sea-surface temperaturesand rainfall over parts of southern Africa, the apparent ability of sea temperatures in the region tomodulate the influence of ENSO events on rainfall over the country, and the ability of sea-surfacetemperature variability to occur independently of El Nino and La Nina events, all emphasize theimportance of including the area in both statistically- and dynamically-based seasonal forecasting models.A statistically-based model in which the period since the late-1970s is not adequately represented will bebiased toward a time when the western equatorial Indian Ocean played a somewhat different role ininfluencing rainfall variability over South Africa to what it is playing at present. It is, therefore, importantto ensure that the training set in any statistical model is kept up-to-date. One problem, however, is that
Copyright © 1999 Royal Meteorological Society Int. J. Climatol. 19: 1477–1492 (1999)
SEA-SURFACE TEMPERATURES AND SOUTHERN AFRICAN RAINFALL 1491
statistically-based models usually require long training sets of at least 30 years (Barnston and Ropelewski,1992), and so cannot easily represent changes in the nature of interactions in the climate system, such ashas been demonstrated in this paper. General circulation modelling, on the other hand, can in theory beused to simulate the effects of changes in sea-surface temperature forcing. While the changes in theassociation between rainfall over parts of southern Africa and sea-surface temperature variability in thetropical western Indian Ocean appear to have produced a small decrease in potential predictability, it isencouraging that the ECHAM model has been able to simulate these observed changes successfully, atleast qualitatively.
ACKNOWLEDGEMENTS
This paper was funded in part by a grant/cooperative agreement from the National Oceanic andAtmospheric Administration (NOAA). The views expressed herein are those of the authors and do notnecessarily reflect the views of NOAA or any of its sub-agencies. The sea-surface temperature data wereobtained from the United Kingdom Meteorological Office. Rainfall data were supplied by the SouthAfrican Weather Bureau and the Namibian Meteorological Service. Useful discussions with N.E. Grahamand L.M. Goddard are gratefully acknowledged, as is the assistance of M. Meyer and J. del Corral withthe ECHAM model runs and the production of some of the diagrams.
REFERENCES
Allan, R.J., Lindesay, J.A. and Reason, C.J.C. 1995. ‘Multidecadal variability in the climate system over the Indian Ocean regionduring the austral summer’, J. Climatol., 8, 1953–1873.
Barnston, A.G. and Ropelewski, C.F. 1992. ‘Prediction of ENSO using canonical correlation analysis’, J. Climatol., 5, 1316–1345.Cadet, D.L. 1985. ‘The Southern Oscillation over the Indian Ocean’, J. Climatol., 5, 189–212.Crimp, S.J. and Mason, S.J. 1999. ‘The extreme precipitation event of 11 to 16 February 1996 over South Africa’, Meteorol. Atmos.
Phys., in press.D’Abreton, P.C. and Lindesay, J.A. 1993. ‘Water vapour transport over southern Africa during wet and dry early and summer
months’, Int. J. Climatol., 13, 151–170.D’Abreton, P.C. and Tyson, P.D. 1995. ‘Divergent and non-divergent water vapour transport over southern Africa during wet and
dry conditions’, Meteorol. Atmos. Phys., 55, 47–59.D’Abreton, P.C. and Tyson, P.D. 1996. ‘Three dimensional kinematic trajectory modelling of water vapour transport over southern
Africa’, WaterSA, 22, 297–305.Everitt, B. 1980. Cluster Analysis, Halsted, New York, 136 pp.Goddard, L.M. and Graham, N.E. 1999. ‘The importance of the Indian Ocean for simulating rainfall anomalies over eastern and
southern Africa’, J. Geophys. Res., accepted for publication.Graham, N.E. 1994. ‘Decadal-scale climate variability in the tropical and North Pacific during the 1970s and 1980s: observations
and model results’, Climate Dyn., 10, 135–162.Graham, N.E. 1995. ‘Simulation of recent global temperature trends’, Science, 267, 666–671.Hastenrath, S., Nicklis, A. and Greischar, L. 1993. ‘Atmospheric–hydrospheric mechanisms of climate anomalies in the Western
Equatorial Indian Ocean’, J. Geophys. Res., 98, 20219–20235.Hulme, M. 1996. ‘Recent climate change in the world’s drylands’, Geophys. Res. Lett., 23, 61–64.Jackson, J.E. 1991. A User’s Guide to Principal Components, Wiley, New York, 569 pp.Jury, M.R. and Pathack, B. 1991. ‘A study of climate and weather variability over the tropical southwest Indian Ocean’, Meteorol.
Atmos. Phys., 47, 37–48.Jury, M.R., Valentine, H.R. and Lutjeharms, J.R.E. 1993. ‘Influence of the Agulhas current on summer rainfall along the southeast
coast of South Africa’, J. Appl. Meteorol., 32, 1282–1287.Jury, M.R., Pathack, B., Rautenbach, C.D.W. and Van Heerden, J. 1996. ‘Drought over South Africa and Indian Ocean SST:
statistical and GCM results’, Global Ocean-Atmos. Sys., 4, 47–63.Kawamura, R. 1994. ‘A rotated EOF analysis of global sea surface temperature variability with interannual and interdecadal scales’,
J. Phys. Ocean., 24, 707–715.Kerr, R.A. 1992. ‘Unmasking a shifty climate system’, Science, 255, 1508–1510.Landman, W.A. and Mason, S.J. 1999. ‘Operational long-lead prediction of South African rainfall using canonical correlation
analysis’, Int. J. Climatol., in press.Latif, M. and Barnett, T.P. 1995. ‘Interactions of the tropical oceans’, J. Climatol., 8, 952–964.Latif, M., Sterl, A., Assenbaum, M., Junge, M.M. and Maier-Reimer, E. 1994. ‘Climate variability in a coupled GCM. Part II: the
Indian Ocean and monsoon’, J. Climatol., 7, 1449–1462.Lindesay, J.A. and Jury, M.R. 1991. ‘Atmospheric circulation controls and characteristics of a flood event in central South Africa’,
Int. J. Climatol., 11, 609–627.Makarau, A. and Jury, M.R. 1997. ‘Predictability of Zimbabwe summer rainfall’, Int. J. Climatol., 17, 1421–1432.Mason, S.J. 1990. ‘Temporal variability of sea surface temperatures around Southern Africa: a possible forcing mechanism for the
18-year rainfall oscillation?’, S. Afr. J. Sci., 86, 243–252.
Copyright © 1999 Royal Meteorological Society Int. J. Climatol. 19: 1477–1492 (1999)
W.A. LANDMAN AND S.J. MASON1492
Mason, S.J. 1995. ‘Sea-surface temperature–South African rainfall associations, 1910–1989’, Int. J. Climatol., 15, 119–135.Mason, S.J. 1998. ‘Seasonal forecasting of South African rainfall using a non-linear discriminant analysis model’, Int. J. Climatol.,
18, 147–164.Mason, S.J. and Jury, M.R. 1997. ‘Climate variability and change over southern Africa: a reflection on underlying processes’, Prog.
Phys. Geog., 21, 23–50.Mason, S.J. and Tyson, P.D. 1999. ‘The occurrence and predictability of droughts over southern Africa’, in Wilhite, D.A. (ed.),
Hazards and Disasters: A Series of Definiti6e Major Works, Routledge, London, in press.Mason, S.J., Lindesay, J.A. and Tyson, P.D. 1994. ‘Simulating drought in southern Africa using sea-surface temperature variations’,
WaterSA, 20, 15–22.Meehl, G.A. 1993. ‘A coupled air–sea biennial mechanism in the tropical Indian and Pacific regions: role of the oceans’, J.
Climatol., 6, 31–41.Mitchell, T.P. and Wallace, J.M. 1996. ‘ENSO seasonality: 1950–78 versus 1979–92’, J. Climate, 9, 3149–3161.Nagai, T., Kitamura, Y., Endoh, M. and Tokioka, T. 1995. ‘Coupled atmosphere–ocean model simulations of El Nino/Southern
Oscillation with and without an active Indian Ocean’, J. Climatol., 8, 3–14.Nicholson, S.E. 1997. ‘An analysis of the ENSO signal in the tropical Atlantic and western Indian Oceans’, Int. J. Climatol., 17,
345–375.Nicholson, S.E. and Entekhabi, D. 1987. ‘Rainfall variability in equatorial and southern Africa: relationships with sea surface
temperatures along the southwestern coast of Africa’, J. Clim. Appl. Meteorol., 26, 561–578.Parker, D.E., Folland, C.K. and Jackson, M. 1995. ‘Marine surface temperature: observed variations and data requirements’, Clim.
Change, 31, 559–600.Philander, S.G. 1990. El Nino, La Nina, and the Southern Oscillation, Academic Press, San Diego, 293 pp.Preisendorfer, R.W. 1988. Principal Component Analysis in Meteorology and Oceanography, Elsevier, New York, 425 pp.Reynolds, R.W. 1988. ‘A real-time global sea surface temperature analysis’, J. Climatol., 1, 75–86.Reynolds, R.W. and Smith, T.M. 1994. ‘Improved global sea surface temperature analysis using optimal interpolation’, J. Climatol.,
7, 929–948.Richman, M.B. 1986. ‘Rotation of principal components’, J. Climatol., 6, 293–335.Rocha, A. and Simmonds, I.T. 1997. ‘Interannual variability of south-eastern African summer rainfall. Part I: relationships with
air–sea interaction processes’, Int. J. Climatol., 17, 235–266.Tennant, W.J. 1996. ‘Influence of Indian Ocean sea-surface temperature anomalies on the general circulation of southern Africa’,
S. Afr. J. Sci., 92, 289–295.Thiessen, A.H. 1911. ‘Precipitation averages for large areas’, Mon. Wea. Re6., 39, 1082–1084.Trenberth, K.E. 1990. ‘Recent observed interdecadal climate changes in the Northern Hemisphere’, Bull. Amer. Meteorol. Soc., 71,
988–993.Trenberth, K.E. and Hoar, T.J. 1996. ‘The 1990–1995 El Nino–Southern Oscillation event: longest on record’, Geophys. Res. Lett.,
23, 57–60.Von Storch, H. and Navarra, A. (eds.) 1995. Analysis of Climate Variability. Application of Statistical Techniques, Springer-Verlag,
Berlin, 334 pp.Walker, N.D. 1990. ‘Links between South African summer rainfall and temperature variability of the Agulhas and Benguela currents
systems’, J. Geophys. Res., 95, 3297–3319.Walker, N.D. and Lindesay, J.A. 1989. ‘Preliminary observations of oceanic influences on the February–March 1988 floods in
central South Africa’, S. Afr. J. Sci., 85, 164–169.Wang, B. 1995. ‘Interdecadal changes in El Nino onset in the last four decades’, J. Clim., 8, 267–285.
Copyright © 1999 Royal Meteorological Society Int. J. Climatol. 19: 1477–1492 (1999)