Embed Size (px)
Citation preview

Hypertension
Change of Body Surface Electrocardiogram isLinked to Left Ventricular Geometric Alteration
from Normal, Pre-Hypertension to Hypertension:Comparison of NT-ProBNP and hs-CRP in
Determining Ventricular RemodelingChih-Hsuan Yen,1,2† Jui-Peng Tsai,1,2† Yih-Jer Wu,1,2,3 Jen-Yuan Kuo,1 Hung-I Yeh,1,2 Charles Jia-Yin Hou,1,2
Chuan-Chuan Liu4,5,6 and Chung-Lieh Hung1,2
Background: The presence of echocardiographic left ventricular remodeling and hypertrophy, a potential surrogate
of pathophysiology intermediate between hypertension and heart failure, has been strongly linked to increased
cardiovascular events. Electrocardiography (ECG) data regarding such a continuous change in pre-hypertension
and hypertension subjects and their comparison with biomarkers are still elusive.
Methods and Materials: We studied 364 subjects including 140 normal subjects (mean age 47.6 � 9.4, 49% female),
136 pre-hypertensives (mean age 50.6 � 9.6, 32% female) and 88 hypertensives (mean age 58.6 � 11.5, 44%
female). Baseline demographic data and levels of biomarkers [high-sensitivity C-reactive protein (hs-CRP) and
N-terminal-pro-B type natriuretic peptide (NT-ProBNP)] were collected, with various 12-lead surface ECG criteria
analyzed. Echo-derived left ventricular (LV) geometries were assessed through standardized methods. We used
nonparametric trend tests for comparing continuous variables across different groups with receiver-operating
characteristic (ROC) curves constructed from both ECG and biomarkers for identifying echo-defined ventricular
remodeling and hypertrophy.
Results: Of all 364 subjects under survey, several ECG-based parameters demonstrated continuous changes in an
ordered fashion across different groups (all p < 0.05) which paralleled those observed from biomarkers and
echo-derived LV geometric changes and function. NT-ProBNP alone identified echo-derived LV hypertrophy
(LVH) better than hs-CRP (AUC: 0.72 vs. 0.62, respectively, both p < 0.05) while neither showed satisfactory result
in identifying concentric remodeling. The ROC area under curve in identifying LVH showed comparative result
between some electrocardiography (ECG) parameters and NT-ProBNP, with Cornell product revealed to have the
highest predictive value (AUC: 0.73, p < 0.05).
Conclusion: Surface ECG yielded ability comparable to that of NT-ProBNP in identifying LVH. LV geometric
remodeling, when defined by surface ECG, seemed to progress in subjects from normal, pre-hypertension to
hypertension. This evidence suggests that aggressive control of blood pressure may be helpful at an earlier stage.
Key Words: Echocardiography � Electrocardiography � hs-CRP � Hypertension � Left ventricular hypertrophy
� NT-ProBNP
INTRODUCTION
Hypertension has becoming the leading epidemio-
logic issue owing to its widely affected population and
increasing economic burden.1 Ventricular hypertrophy,
which represents a more severe form of ventricular re-
modeling following hypertension, denotes a clinical sur-
rogate of target organ damage.2 Left ventricular hyper-
trophy (LVH) has been shown to predict cardiovascular
events including stroke, myocardial infarction, heart
failure and sudden cardiac death.3-6 Echocardiography, a
29 Acta Cardiol Sin 2011;27:29�37
Left Ventricular Geometries Determined by Surface ElectrocardiographyOriginal Article Acta Cardiol Sin 2011;27:29�37
Received: March 30, 2010 Accepted: July 27, 20101Division of Cardiology, Department of Internal Medicine, MackayMemorial Hospital; 2Department of Medicine, Mackay MedicalCollege, and Mackay Medicine Nursing and Management College;3Institute of Traditional Medicine, National Yang-Ming University;4Graduate Institute of Health Care Organization Administration,College of Public Health National Taiwan University; 5HealthEvaluation Center, Mackay Memorial Hospital, Taipei; 6Departmentof Medical Technology, Yuanpei University of Science and Technology,Hsin-Chu, Taiwan.Address correspondence and reprint requests to: Dr. Chung-Lieh Hung,Division of Cardiology, Department of Internal Medicine, MackayMemorial Hospital, No. 92, Chung-Shan North Road, Section 2,Mackay Memorial Hospital, Taipei 100, Taiwan. Tel: 886-2-2531-9260;Fax: 886-2-2543-3535 ext. 2459; E-mail: [email protected]† Both authors contributed to this work equally.
traditional standard clinical tool in determining such car-
diac structural and functional changes, is relatively ex-
pensive and time-consuming. Recently, N-terminal-pro-
B type natriuretic peptide (NT-proBNP)7 and the inflam-
matory marker high-sensitivity C-reactive protein (hs-
CRP)8 have been proved to link with an increasing risk
for cardiovascular events and altered LV structures.9-12
Conventional surface 12-lead electrocardiography (ECG)
such as Cornell voltage13 and Sokolow-Lyon voltage14
criteria, traditionally used as diagnostic parameters for
the presence of LVH, have lead to various diagnostic
capabilities.15,16
In previous studies, the combined utilization of both
B-type BNP and C-reactive protein in predicting the
presence of LVH has lead to promising results in hyper-
tensive people.17 However, the data containing both
biomarkers and various 12-lead surface ECG criteria in
diagnosing LVH compared to echocardiography were
lacking in Asian people. The present study was to assess
the clinical value of ECG in diagnosing LVH based on
different criteria and to compare such parameters with
biomarkers and echocardiography in healthy, or pre-
hypertensive (Pre-HTN) and hypertensive (HTN) Tai-
wanese.
METHODS AND MATERIALS
Study setting and subject population
The design of this study was approved by the local
ethics committee in accordance with the Declaration of
Helsinki (IRB No: 09MMHIS037). Participants enrolled
in this study consisted of 1) Normotensive subjects with-
out other known systemic diseases (n = 140, Group A);
2) Pre-HTN (n = 136, Group B) and; 3) HTN subjects (n
= 88, Group C), all of whom underwent general health
evaluation between January 2006 and December 2008. A
detailed review of medical history through structured
questionnaire with physical examination and chest ra-
diography were all performed. All baseline characteris-
tics and related anthropometrics including age, body
height, weight and body mass index (BMI) were ac-
quired, with routine laboratory data including bioche-
mistries (including hepatic, renal and lipid profiles) and
complete blood cell counts taken. Patients with known
cardiovascular surgery or rheumatic heart disease, overt
heart failure symptoms, atrial fibrillation rhythm, pre-
vious implantation of pacemaker and overt renal insuffi-
ciency (creatinine > 2.5 mg/dl) were all excluded in our
study. History of diabetes mellitus (DM) was defined as
fasting blood glucose level of more than 126 mg/dL or
any current usage of diabetes medication with previ-
ously diagnosed DM. Patients who had hypertension his-
tory, were taking anti-hypertension agents or had sys-
tolic blood pressure � 140 mmHg and/or diastolic blood
pressure � 90 mmHg were diagnosed as HTN. Pre-HTN
subjects were those with systolic blood pressure > 120
mmHg or diastolic blood pressure > 80 mmHg without
hypertension. Normal group was defined as systolic
blood pressure � 120 mmHg and diastolic blood pres-
sure � 80 mmHg without known cardiovascular or other
systemic diseases. Blood pressures at rest were taken
shortly before the subsequent echo study by medical
staff blinded to the other test results. An average of two
measurements was used as representative data. hs-CRP
level were determined by a highly sensitive, latex parti-
cle-enhanced immunoassay using Elecsys 2010 (Hitachi
Corp, Hitachinaka Ibaraki, Japan) with pro-B-type na-
triuretic peptide (pro-BNP) level by electro-hemilu-
minescence immunoassay ECLIA (Roche E17). Serum
samples were collected using standard sampling tubes or
tubes containing separating gel. After ensuring individu-
alized patient samples, calibrators and controls were at
ambient temperature (20-25 �C) and were measured
within 2 hours because of possible evaporation effects.
12-lead surface electrocardiography analysis
All participants underwent standardized 12-lead sur-
face electrocardiography examination. Recordings were
obtained using autonomic instruments (Page Writer Trim
III, Phillip, Andover, USA) with digitized data trans-
ferred and stored for further analysis. Readings were
performed and interpreted by two experienced car-
diologists independently of each other and blinded to
clinical information. Assessment with respect to QRS
duration was measured to the nearest 4 ms as possible,
with R-wave amplitudes in leads aVL, V5, V6, and S
wave amplitudes in leads V1 and V3 measured to the
nearest 0.5 mm (0.05 mV) by use of calipers as proposed
in the LIFE study.18 Age-adjusted Cornell voltage (RaVL
+ SV3 > 2.0 mV, plus 0.8 mV in women), Cornell product
((RaVL + SV3) � QRS duration > 2436 mV.ms), Soko-
Acta Cardiol Sin 2011;27:29�37 30
Chih-Hsuan Yen et al.
low-Lyon voltage (SV1 + RV5/6 > 3.5 mV), McPhie cri-
terion (the sum of the tallest R and deepest S in the
precordial leads > 4.5 mV) and Framingham score cri-
teria (RI + SIII > 2.5 mV, SV1 + RV5/6 > 3.5 mV, SV1/2/3 >
2.5 mV + RV4/5/6 > 2.5 mV plus left ventricular strain
pattern) were used to determinate the left ventricular
hypertrophy as defined by previous studies.15
Determination of LV geometry and function
A single experienced technician blinded to other
study results and details assessed the measures of trans-
thoracic echocardiography (Hewlett Packard Sonos 5500
series equipped with a 2.5-MHz transducer). LV end-
diastolic and end-systolic volumes were calculated by
the Z-derived method,19 which allows accurate quantifi-
cation of LV volume and mass even in subjects with di-
lated chambers. LV mass, relative wall thickness and
stroke volume (SV) were all derived using such method.
The LV concentricity was estimated by relative wall
thickness (RWT), with a value > 0.42 being defined as
concentric LV geometry. LV concentric hypertrophy was
estimated as relative wall thickness (RWT) > 0.42 and
LV mass index > 115 gm/m2male gender and > 95 gm/m2
female gender with eccentric hypertrophy defined to be
the same LV mass index criteria with RWT < 0.42.
Those patients with RWT > 0.42 with LV mass index
within normal rage were classified as concentric re-
modeling. LV systolic performance by calculating endo-
cardial and mid-wall LV fractional shortening was com-
puted by using a previously described formula.20 End-
systolic circumferential wall stress was also derived
from end-systolic pressure representing mean arterial
pressure as in the previously described equation.21 Both
mid-wall fractional shortening and circumferential wall
stress were used to estimate stress-corrected left ven-
tricular after-load. We took a relatively rigorous step to
preclude any patient with significant degree valvular
heart diseases or existence of significant pulmonary hy-
pertension (defined as estimated systolic pulmonary
arterial pressure more than 50 mmHg).22
Statistical analysis
Continuous data were shown as mean � standard
deviation and were compared with t-test or Mann-Whit-
ney test for unpaired data as appropriate, and categorical
data were presented as ratio and compared by chi-square
test or Fisher’s exact test. Data without normal distribu-
tion across ordered groups were further compared by us-
ing a non-parametric trend test (Wilcoxon rank-sum
test). One-way ANOVA test was used for an un-adjusted
comparison for three groups, with post hoc Bonferroni
correction for multiple comparisons between groups. All
p value were two-sided, with value less than 0.05 con-
sidered statistically significant.
RESULTS
Baseline characteristics and demographic
data
Baseline demographics and characteristics of these
364 enrolled subjects are listed in Table 1. From normal,
pre-HTN to HTN groups, age tended to be older with
larger waist circumference, body mass index, waist-to-
hip ratio, higher fasting glucose level and biomarker
levels including both hs-CRP and NT-ProBNP (all
trends p < 0.001). Participants with hypertension were
significantly older, had higher waist circumference,
higher systolic blood pressure, higher hs-CRP, NT-
ProBNP level and worse renal function than both pre-
HTN and normal subjects (all p < 0.05). Compared with
normal population, pre-HTN group tended to have
higher body mass index and fasting glucose level (all p <
0.05).
ECG criteria of left ventricular hypertrophy in
the pre-hypertensive and hypertensive
In Table 2, value from all electrocardiography (ECG)
derived parameters in these three groups were displayed.
There was an ordered increase of Sokolow-Lyon volt-
age, gender-adjusted Cornell voltage, Cornell product,
and McPhie and Gubner/Ungerleider voltage criteria
across different groups (all trend p < 0.001). ECG crite-
ria including gender-adjusted Cornell voltage, Cornell
product and Gubner/Ungerleider in the HTN group all
seemed significantly higher than in the pre-HTN and
normal group (all p value < 0.05). Compared with the
normal group, ECG parameters including Sokolow-Lyon
and McPhie voltage were higher in the pre-HTN and
HTN groups (both p < 0.05). Finally, PR interval was
significantly longer in the HTN group when compared to
those in the others (p < 0.05).
31 Acta Cardiol Sin 2011;27:29�37
Left Ventricular Geometries Determined by Surface Electrocardiography

Changes of LV structure and function in the
pre-HTN and HTN groups
The distribution of LV geometric alteration in terms
of remodeling and hypertrophy is shown in Figure 1,
while other LV structural and functional parameters
based on echocardiography are further displayed in
Table 3. The hypertension group had higher percentage
of concentric and eccentric hypertrophy and lower ratio
of normal LV geometry compared with the normal
group, with the pre-HTN group falling in-between. A
graded increase in LA diameter, RWT, LV mass with and
without indexes and mass-to-volume ratio was observed
in a significant trend higher from normal to pre-HTN to
HTN groups (all trends p < 0.001). With a borderline
Acta Cardiol Sin 2011;27:29�37 32
Chih-Hsuan Yen et al.
Table 1. Baseline demographic characteristics of the study population
Control (n = 140) Pre-HTN (n = 136) HTN (n = 88) Trend p
Age 47.2 � 9.60 50.6 � 9.6* 058.6 � 11.5*† < 0.001
Gender (female) 69 (49%) 48 (32%) 46 (44%) < 0.015
BW 62.3 � 12.1 66.9 � 11*. 67 � 12* < 0.001
Waist 78.8 � 9.70 83.4 � 9.2* 086.4 � 10.2*† < 0.001
Waist-hip ratio 0.85 � 0.08 00.89 � 0.07* 0.91 � 0.07* < 0.001
BMI 22.9 � 3.20 24.8 � 3.4* 026 � 3.7* < 0.001
SBP 105.6 � 7.200 123.7 � 6.5*0 137.3 � 17*†0. < 0.001
AC Sugar 91.4 � 8.50 101.4 � 23.9* 106.7 � 27.9*0 < 0.001
Cholesterol 196.9 � 3600. 203.2 � 37.10 199.7 � 37.60. 00.38
eGFR 86.5 � 15.2 0..87 � 15.2 0.80.7 � 16.7*† < 0.001
Smoking 37 (27.8) 35 (24.1) 17 (17.5) < 0.192
Hs-CRP (log) 0.13 � 0.17 0.20 � 0.48 0.0.30 � 0.50*† < 0.001
NT-ProBNP (log) 25.8 � 37.5 27.1 � 35.2 063.5 � 105*† < 0.001
BW, body weight; BMI, body mass index; SBP, systolic blood pressure; AC Sugar, fasting blood sugar; eGFR, estimated glomerular
filtration rate.
* denotes p < 0.05 compared with normal; † denotes p < 0.05 compared with pre-HTN; ‡ denotes p < 0.1 compared with pre-HTN;
* denotes p < 0.1 compared with normal.
Table 2. Various ECG parameters analyzed from the study population
Control (n = 140) Pre-HTN (n = 136) HTN (n = 88) Trend p
Sokolow-Lyon 19.5 � 6.50 .22.8 � 6.4* 23.7 � 8.4*. < 0.001
Sokolow-Lyon/or strain 8 (5.7) 14 (9.5) 12 (11.4) < 0.255
Cornell (after gender adjust) .14 � 4.8 14.7 � 5.6. .16.8 � 5.6*† < 0.001
Cornell product 1216.2 � 44400. 1289.9 � 538.1. .1501.4 � 548.8*† < 0.001
Mcphie .22 � 6.4 .25.3 � 6.8* 27.1 � 8.1* < 0.001
Gubner & Ungerleider 6.1 � 3.1 07.6 � 4.1* 0.8.9 � 4.4*† < 0.001
Framingham score 5 (3.6%) 17 (11.5%) 15 (14.3%) < 0.009
QRS duration (max) 0.87 � 11.8 87.8 � 11.3 90.1 � 15.1 00.10
P duration (max) 1.67 � 0.58 1.69 � 0.54 1.69 � 0.54 00.55
PR interval 163.6 � 19.40 162.6 � 2900. .170.9 � 22.5*† < 0.001
HR from RR (1/min) 63.7 � 8.80 65.5 � 11.1 66.6 � 11.1 00.04
QT interval (max) 382.8 � 38.80 383.3 � 32.40 387.8 � 4600. 00.85
QT interval corrected (max) .395 � 23.7 393.5 � 36.70 0404 � 40.2† < 0.001
P axis 51.6 � 26.1 45.9 � 25.2 50.5 � 27.9 00.04
QRS axis 48.4 � 34.9 41.5 � 35.9 41.8 � 43.9 00.01
T axis 31.8 � 25.8 33.4 � 20.7 33.6 � 32.7 00.58
* denotes p < 0.05 compared with normal; † denotes p < 0.05 compared with pre-HTN; ‡ denotes p < 0.1 compared with pre-HTN;
* denotes p < 0.1 compared with normal.

increase of LV end-diastolic volume in the pre-HTN and
HTN groups (trend p = 0.06), stress-corrected mid-wall
fractional shortening tended to decrease, while LV wall-
stress increased (both trends p < 0.05). Compared with
normal and pre-HTN groups, subjects in the HTN group
had significantly larger RWT, LV mass with and without
index, mass-to-volume ratio while showing obviously
decreased LV contraction in terms of reduced fractional
shortening with or without stress correction (all p < 0.05).
Role of ECG criteria, NT-ProBNP and hs-CRP
levels in the discrimination of LV remodeling
and hypertrophy
In Figure 2, we further demonstrated the diagnostic
33 Acta Cardiol Sin 2011;27:29�37
Left Ventricular Geometries Determined by Surface Electrocardiography
Table 3. Various echo-derived cardiac structures and parameters analyzed from the study population
Control (n = 140) Pre-HTN (n = 136) HTN (n = 88) Trend p
LA diameter 30.9 � 4.90 32.9 � 4.8* 0034.4 � 5.1*‡ < 0.001
LVESV 33.8 � 9.30 34.7 � 10.0 34.7 � 8.7 00.52
LVEDV 98.6 � 18.2 104.4 � 21.1* 103.0 � 21.1 00.06
LV EF 65.9 � 6.00 66.9 � 5.90 66.2 � 5.5 00.55
RWT 0.38 � 0.06 00.40 � 0.07* 0000.43 � 0.07*† < 0.001
Mass-to-V Ratio 1.38 � 0.29 1.53 � 0.3* 0001.71 � 0.36*† < 0.001
LV mass 136.1 � 3500. 157.1 � 37.3* 00173.6 � 38.5*† < 0.001
LV mass index 75 � 16 00.89 � 18.9* 00093.8 � 18.3*† < 0.001
FS endo 36.4 � 4.70 37.2 � 4.70 36.6 � 4.3 0.5
FS mmw 00.2 � 0.02 00.2 � 0.02 0000.19 � 0.03*† < 0.001
FS cmw 0.22 � 0.03 0.22 � 0.03 0000.21 � 0.03*† 00.03
Cscom 81.3 � 18.3 086.4 � 19.1* 0087.5 � 19.5* 00.01
Cscom, circumferential wall stress; EDV, end-diastolic volume; EF, ejection fraction; ESV, end-systolic volume; FS endo, endocardial
fractional shortening; FS, midwall fractional shortening; FS cmw, stress-corrected fractional shortening; LA, left atrium/atrial; LV,
left ventricular; Mass-to-V, mass to volume; RWT, relative wall thickness.
* denotes p < 0.05 compared with normal; † denotes p < 0.05 compared with pre-HTN; ‡ denotes p < 0.1 compared with pre-HTN;
* denotes p < 0.1 compared with normal.
Figure 1. Shown here are the distribution and proportions of different geometries and cardiac structures from normal, pre-HTN to HTN groups.
Higher prevalence of cardiac remodeling and hypertrophy was associated with pre-HTN and HTN groups.
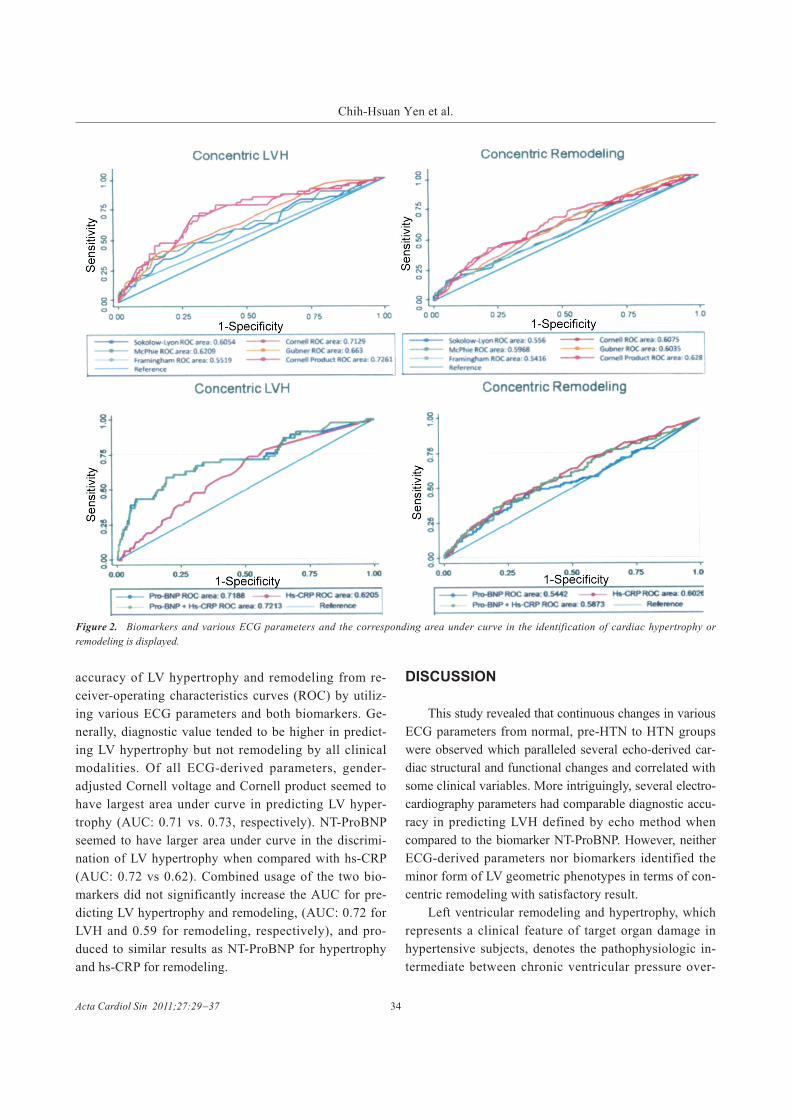
accuracy of LV hypertrophy and remodeling from re-
ceiver-operating characteristics curves (ROC) by utiliz-
ing various ECG parameters and both biomarkers. Ge-
nerally, diagnostic value tended to be higher in predict-
ing LV hypertrophy but not remodeling by all clinical
modalities. Of all ECG-derived parameters, gender-
adjusted Cornell voltage and Cornell product seemed to
have largest area under curve in predicting LV hyper-
trophy (AUC: 0.71 vs. 0.73, respectively). NT-ProBNP
seemed to have larger area under curve in the discrimi-
nation of LV hypertrophy when compared with hs-CRP
(AUC: 0.72 vs 0.62). Combined usage of the two bio-
markers did not significantly increase the AUC for pre-
dicting LV hypertrophy and remodeling, (AUC: 0.72 for
LVH and 0.59 for remodeling, respectively), and pro-
duced to similar results as NT-ProBNP for hypertrophy
and hs-CRP for remodeling.
DISCUSSION
This study revealed that continuous changes in various
ECG parameters from normal, pre-HTN to HTN groups
were observed which paralleled several echo-derived car-
diac structural and functional changes and correlated with
some clinical variables. More intriguingly, several electro-
cardiography parameters had comparable diagnostic accu-
racy in predicting LVH defined by echo method when
compared to the biomarker NT-ProBNP. However, neither
ECG-derived parameters nor biomarkers identified the
minor form of LV geometric phenotypes in terms of con-
centric remodeling with satisfactory result.
Left ventricular remodeling and hypertrophy, which
represents a clinical feature of target organ damage in
hypertensive subjects, denotes the pathophysiologic in-
termediate between chronic ventricular pressure over-
Acta Cardiol Sin 2011;27:29�37 34
Chih-Hsuan Yen et al.
Figure 2. Biomarkers and various ECG parameters and the corresponding area under curve in the identification of cardiac hypertrophy or
remodeling is displayed.

load and heart failure6 and has been strongly linked to
increased cardiovascular events.3-5,23,24 In terms of con-
centric remodeling, earlier-stage LV geometric pheno-
types when assessed by either relative wall thickness or
mass-to-volume ratio, may represent a precursor of
LVH, has been reported as a predictor of cardiovascular
events and is related to several cardiovascular risk fac-
tors.25 Furthermore, the regression of left ventricular re-
modeling and LVH indicates improvement of cardiovas-
cular function and prognosis.26,27 In this regard, optimal
monitoring of the management of hypertensive patients
with LVH may thus rely on precise and reproducible
electrocardiography or echocardiography methods and
medical therapy. Echocardiography as a robust clinical
diagnostic tool has been proven to be reliable in differ-
entiating various phenotypes of left ventricular structural
and functional changes but is obviously limited by its
higher costs and time-consuming procedure.28 Tradi-
tional application of 12-lead surface electrocardiography
in assessing various ventricular geometric phenotypes,
such as Cornell voltage12 and Sokolow-Lyon voltage13
criteria, were not promising in some previous studies. In
the LIFE study, Peter et al. observed that anti-hyperten-
sive treatment may result in the regression of electro-
cardiographic LVH which parallels reduced cardiovascu-
lar events29 and may indicate the validation and feasibil-
ity of surface ECG relating to clinical outcomes.
Elevation of NT-proBNP, a biologically inactive
peptide from ProBNP precursor in response to increased
ventricular wall stress, was proven to be a useful indica-
tor of left ventricular dysfunction after acute myocardial
infarction, heart failure, or even in patients with normal
blood pressure.30,31 More recently, biomarkers such as
BNP, NT-ProBNP or their combination usage with C-
reactive protein have been adopted as alternative and
useful markers in discriminating such cardiac structural
changes and functional decay in hypertensive sub-
jects.16,32 Furthermore, higher NT-ProBNP levels were
proven to be more indicative of ventricular hypertrophy
per se rather than the existence of hypertension.33 Dif-
ferent from the previous study by David et al., our data
didn’t show the combination superiority of two bio-
markers in assessing echo-defined LVH.17 Also, we ob-
served a continuous, graded progress of ECG parameters
from normal, pre-hypertensive to hypertensive groups,
which was in line with the scenario of biomarkers and
echocardiographic changes reflecting the clinical con-
tinuum of hypertension pathology. Interestingly, while
comparable effects were observed for both biomarkers
and several ECG-based parameters in identifying echo-
defined ventricular hypertrophy, the clinical values for
predicting concentric remodeling by these conventional
ECG parameters were less impressive which was similar
with previous study.34
According to JNC VII guidelines, pre-hypertension
is the term used to describe intermediate blood pressure
value between normotension (< 120/80 mmHg) and tra-
ditional hypertension (� 140/90 mmHg).35 In the Fra-
mingham study series, the 12-year risk of ischemic heart
disease of patients with systolic blood pressure between
130 and 139 mmHg was twice that of those with blood
pressure less than 120 mmHg.30 Previous study in Singa-
pore by Lee et al. illustrated the impact of pre-hyper-
tension on all-cause and cardiovascular mortality.36
From epidemiologic studies, aging per se was a strong
factor contributing to vascular stiffening and subsequent
elevated blood pressure.37 Theoretically, in the aging so-
ciety of the modern world, the population of pre-hyper-
tension should be increasing and will thus become a ma-
jor health-care burden in the near future. A more easily
applied and clinically feasible tool, such as ECG, may be
more helpful in the initial screening for this population.
LIMITATIONS
Although left ventricular remodeling process charac-
terized by surface ECG seemed to progress in subjects
from normal, pre-HTN to HTN and correlated with echo-
derived parameter and biomarkers, several limitations
still need to be acknowledged. First, we only assessed
and summed up the ECG criteria for quantitative LVH
analysis; more detailed ECG characters from individual
leads were not included. Second, this was a relative small,
retrospective and observational study; the generalizability
for a broader population and the follow up information
with respect to our findings was not proved.
CONCLUSION
ECG-based parameters may yield similar capability
35 Acta Cardiol Sin 2011;27:29�37
Left Ventricular Geometries Determined by Surface Electrocardiography

as NT-ProBNP for diagnosing LVH. Further, left ven-
tricular remodeling process, when assessed by surface
ECG parameters, seemed to progress in subjects from
normal, pre-hypertension to hypertension and correlated
with several echo-derived parameters and biomarkers.
This evidence suggested that detection and aggressive
control of blood pressure may be helpful at an earlier
stage.
REFERENCES
1. Perkovic V, Huxley R, Wu Y, et al. The burden of blood pres-
sure-related disease A neglected priority for global health. Hyper-
tension 2007;50:991-7.
2. Kannel WB. Blood pressure as a cardiovascular risk factor: pre-
vention and treatment. JAMA 1996;275:1571-6.
3. Verdecchia P, Carini G, Circo A, et al. Left ventricular mass and
cardiovascular morbidity in essential hypertension: the MAVI
study. J Am Coll Cardiol 2001;38:1829-35.
4. Haider AW, Larson MG, Benjamin EJ, et al. Increased left ven-
tricular mass and hypertrophy are associated with increased risk
for sudden death. J Am Coll Cardiol 1998;32:1454-9.
5. Kohsaka S, Sciacca RR, Sugioka K, et al. Additional impact of
electrocardiographic over echocardiographic diagnosis of left
ventricular hypertrophy for predicting the risk of ischemic stroke.
Am Heart J 2005;149:181-6.
6. Wright JW, Mizutani S, Harding JW. Pathway involved in the
transition from hypertension to hypertrophy to heart failure.
Treatment strategies. Heart Fail Rev 2008;13:367-75.
7. Vasan RS, Benjamin EJ, Larson MG, et al. Plasma natriuretic
peptides for community screening for left ventricular hyper-
trophy and systolic dysfunction: The Framingham Heart Study.
JAMA 2002;288:1252-9.
8. Ross R. Atherosclerosis: an inflammatory disease. N Engl J Med
1999;340:115-26.
9. Wang TJ, Larson MG, Levy D, et al. Plasma natriuretic peptide
levels and the risk of cardiovascular events and death. N Engl J
Med 2004;350:655-63.
10. Ridker PM, Cushman M, Stampfer MJ, et al. Inflammation, as-
pirin, and the risk of cardiovascular disease in apparently healthy
men. N Engl J Med 1997;336:973-9.
11. Vasan RS, Sullivan LM, Roubenoff R, et al. Inflammatory
markers in risk of heart failure in elderly subjects without prior
myocardial infarction:the Framingham Heart Study. Circulation
2003;107:1486-91.
12. Palmieri V, Tracy RP, Roman MJ, et al. Relation of left ventricular
hypertrophy to inflammation and albuminuria in adults with type
2 diabetes: the Strong Heart Study. Diabetes Care 2003;26:
2764-9.
13. Casale PN, Devereux RB, Alonso DR, et al. Improved sex-spe-
cific criteria of left ventricular hypertrophy for clinical and com-
puter interpretation of electrocardiograms: validation with au-
topsy findings. Circulation 1987;3:565-72.
14. Sokolow M, Lyon TP. The ventricular complex in left ventricular
hypertrophy as obtained by unipolar precordial and limb leads.
Am Heart J 1949;37:161.
15. Levy D, Labib SB, Anderson KM, et al. Determinants of sen-
sitivity and specificity of electrocardiographic criteria for left
ventricular hypertrophy. Circulation 1990;81:815-20.
16. Ang D, Lang C. The prognostic value of the ECG in hyperten-
sion: where are we now? J Hum Hypertens 2008;22:460-7.
17. Conen D, Zeller A, Pfisterer M, Martina B, et al. Usefulness of
B-type natriuretic peptide and C-reactive protein in predicting the
presence of absence of left ventricular hypertrophy in patients
with systolic hypertension. Am J Cardiol 2006;15;97:249-52.
18. Okin PM, Devereux RB, Jern S, et al. Baseline characteristics in
relation to electrocardiographic left ventricular hypertrophy in
hypertensive patients: the Losartan Intervention For Endpoint Re-
duction (LIFE) in Hypertension Study. Hypertension 2000;36:
766-73.
19. de Simone G, Devereux RB, Ganau A, et al. Estimation of left
ventricular chamber and stroke volume by limited M-mode
echocardiography and validation by two-dimensional and Dopp-
ler echocardiography. Am J Cardiol 1996;78:801-7.
20. Shimizu G, Hirota Y, Kita Y, et al. Left ventricular midwall me-
chanics in systemic arterial hypertension: myocardial function is
depressed in pressure-overload hypertrophy. Circulation 1991;
83:1676-84.
21. Aurigemma GP, Silver KH, Priest MA, Gaasch WH. Geometric
changes allow normal ejection fraction despite depressed myo-
cardial shortening in hypertensive left ventricular hypertrophy. J
Am Coll Cardiol 1995;26:195-202.
22. Kitabatake A, Inoue M, Asao M, et al. Non-invasive evaluation of
pulmonary hypertension by a pulsed Doppler technique. Cir-
culation 1983;68:302-9.
23. Dahlof B, Devereux RB, Julius S, et al. Characteristics of 9194
patients with left ventricular hypertrophy: the LIFE study: Lo-
sartan Intervention For Endpoint reduction in hypertension.
Hypertension 1998;32:989-97.
24. Havranek EP, Emsermann CD, Froshaug DN, et al. Thresholds in
the relationship between mortality and left ventricular hyper-
trophy defined by electrocardiography. J Electrocardiol 2008
Jul-Aug;41(4):342-50.
25. Cheng S, Fernandes VR, Bluemke DA, et al. Age-related left ven-
tricular remodeling and associated risk for cardiovascular out-
comes: the MESA study. Circ Cardiovasc Imaging 2009;2:191-8.
26. Devereux RB, Wachtell K, Gerdts E, et al. Prognostic signifi-
cance of left ventricular mass change during treatment of hyper-
tension: the LIFE study. JAMA 2004;292:2350-6.
27. Vakili BA, Okin PM, Devereux RB, et al. Prognostic implications
of left ventricular hypertrophy. Am Heart J 2001;141:334-41.
28. Palmieri V, Dahlöf B, DeQuattro V, et al. Reliability of echocar-
diographic assessment of left ventricular structure and function.
Acta Cardiol Sin 2011;27:29�37 36
Chih-Hsuan Yen et al.
the PRESERVED study. J Am Coll Cardiol 1999;34:1625-32.
29. Okin PM, Devereux RB, Jern S, et al. Regression of elec-
trocardiographic left ventricular hypertrophy during antihyper-
tensive treatment and the prediction of major cardiovascular
events. JAMA 2004;292:2343-9.
30. Talwar S, Siebenhofer A, Williams B, Ng L. Influence of hyper-
tension, left ventricular hypertrophy, and left ventrocilar systolic
dysfunction on plasma N terminal proBNP. Heart 2000;83:
278-82.
31. Chou PC, Chin CH, Lin CL, et al. Predicting heart failure symp-
toms by plasma N-terminal pro-B-type natriuretic peptide for
patients with chronic aortic regurgitation and preserved left
ventricular function. Acta Cardiol Sin 2008;24:29-34.
32. Rivera Otero JM, Taléns-Visconti R, Salvador A, et al. Ven-
tricular hypertrophy increases NT-proBNP in subjects with and
without hypertension. Int J Cardiol 2004;96:265-71.
33. Hung CL, Liu CC, Yeh HI, et al. NT-ProBNP but not high sensi-
tivity CRP independently predict abnormal exercise duke score in
well-controlled hypertension and pre-hypertension � a study from
the subjects undergoing health evaluation. Acta Cardiol Sin
2009;25:7-17.
34. Aktoz M, Erdogan O, Altun A. Electrocardiographic prediction
of left ventricular geometric patterns in patients with essential
hypertension. Int J Cardiol 2007;120:344-50.
35. Chobanian AV, Bakris GL, Black HR, et al. The seventh report of
the Joint National Committee on Prevention, Detection, Evalua-
tion, and Treatment of High Blood Pressure: the JNC 7 report.
JAMA 2003;289:2560-72.
36. Lee J, Heng D, Ma S, et al. Influence of pre-hypertension on
all-cause and cardiovascular mortality: the Singapore cardio-
vascular cohort study. Int J Cardiol 2009;135:331-7.
37. Chen CH, Nakayama M, Nevo E, et al. Coupled systolic-ven-
tricular and vascular stiffening with age: implications for pressure
regulation and cardiac reserve in the elderly. J Am Coll Cardiol
1998;32:1221-7.
37 Acta Cardiol Sin 2011;27:29�37
Left Ventricular Geometries Determined by Surface Electrocardiography


![Hypertension Associated with Atherosclerosis Risk Factors ... · diabetes mellitus, left ventricular hypertrophy, psychosocial factorsbesides sy, s- tolic arterial hypertension [7]](https://img.pdfslide.net/doc/110x75/5d4edcdd88c99342288b9569/hypertension-associated-with-atherosclerosis-risk-factors-diabetes-mellitus.jpg)