Embed Size (px)
Citation preview
Changes in Cross-Section Geometry and Channel Volume in Two Reaches of the Kankakee River in Illinois, 1959–94
By PAUL J. TERRIO and JOHN E. NAZIMEK
Urbana, Illinois1997
U.S. GEOLOGICAL SURVEY
Water-Resources Investigations Report 96–4261
Prepared in cooperation with the
KANKAKEE COUNTY SOIL AND WATER CONSERVATION DISTRICT
U.S. DEPARTMENT OF THE INTERIOR
BRUCE BABBITT, Secretary
U.S. GEOLOGICAL SURVEY
Gordon P. Eaton, Director
For additional information write to: Copies of this report can be purchasedfrom:
U.S. Geological SurveyBranch of Information ServicesBox 25286Denver, CO 80225
The use of firm, trade, and brand names in this report is for identification purposes only and does not constitute endorsement by the U.S. Geological Survey.
District ChiefU.S. Geological Survey221 N. BroadwayUrbana, Illinois 61801
Contents III
CONTENTS
Abstract . . . . . . . . . . . . . . . . . . . . . . . . . . . . . . . . . . . . . . . . . . . . . . . . . . . . . . . . . . . . . . . . . . . . . . . . . . . . . . . . . . . . . . . . . 1Introduction . . . . . . . . . . . . . . . . . . . . . . . . . . . . . . . . . . . . . . . . . . . . . . . . . . . . . . . . . . . . . . . . . . . . . . . . . . . . . . . . . . . . . . 1
Purpose and Scope. . . . . . . . . . . . . . . . . . . . . . . . . . . . . . . . . . . . . . . . . . . . . . . . . . . . . . . . . . . . . . . . . . . . . . . . . . . . 3Description of the Study Area . . . . . . . . . . . . . . . . . . . . . . . . . . . . . . . . . . . . . . . . . . . . . . . . . . . . . . . . . . . . . . . . . . . 4Acknowledgments . . . . . . . . . . . . . . . . . . . . . . . . . . . . . . . . . . . . . . . . . . . . . . . . . . . . . . . . . . . . . . . . . . . . . . . . . . . . 4
Compilation and Measurement of Channel Cross-Section Geometry Data . . . . . . . . . . . . . . . . . . . . . . . . . . . . . . . . . . . . . 6Momence Wetlands Reach . . . . . . . . . . . . . . . . . . . . . . . . . . . . . . . . . . . . . . . . . . . . . . . . . . . . . . . . . . . . . . . . . . . . . 6Six-Mile Pool Reach . . . . . . . . . . . . . . . . . . . . . . . . . . . . . . . . . . . . . . . . . . . . . . . . . . . . . . . . . . . . . . . . . . . . . . . . . . 9
Methods of Analysis . . . . . . . . . . . . . . . . . . . . . . . . . . . . . . . . . . . . . . . . . . . . . . . . . . . . . . . . . . . . . . . . . . . . . . . . . . . . . . . 9Changes in Cross-Section Geometry and Channel Volume . . . . . . . . . . . . . . . . . . . . . . . . . . . . . . . . . . . . . . . . . . . . . . . . . 10
Momence Wetlands Reach . . . . . . . . . . . . . . . . . . . . . . . . . . . . . . . . . . . . . . . . . . . . . . . . . . . . . . . . . . . . . . . . . . . . . 11Six-Mile Pool Reach . . . . . . . . . . . . . . . . . . . . . . . . . . . . . . . . . . . . . . . . . . . . . . . . . . . . . . . . . . . . . . . . . . . . . . . . . . 26
Period from 1980 to 1994 . . . . . . . . . . . . . . . . . . . . . . . . . . . . . . . . . . . . . . . . . . . . . . . . . . . . . . . . . . . . . . . . . 34Period from 1978 to 1980 . . . . . . . . . . . . . . . . . . . . . . . . . . . . . . . . . . . . . . . . . . . . . . . . . . . . . . . . . . . . . . . . . 35Period from 1968 to 1978 . . . . . . . . . . . . . . . . . . . . . . . . . . . . . . . . . . . . . . . . . . . . . . . . . . . . . . . . . . . . . . . . . 38Period from 1959 to 1978 . . . . . . . . . . . . . . . . . . . . . . . . . . . . . . . . . . . . . . . . . . . . . . . . . . . . . . . . . . . . . . . . . 38
Summary . . . . . . . . . . . . . . . . . . . . . . . . . . . . . . . . . . . . . . . . . . . . . . . . . . . . . . . . . . . . . . . . . . . . . . . . . . . . . . . . . . . . . . . . 37References Cited . . . . . . . . . . . . . . . . . . . . . . . . . . . . . . . . . . . . . . . . . . . . . . . . . . . . . . . . . . . . . . . . . . . . . . . . . . . . . . . . . . 41
FIGURES
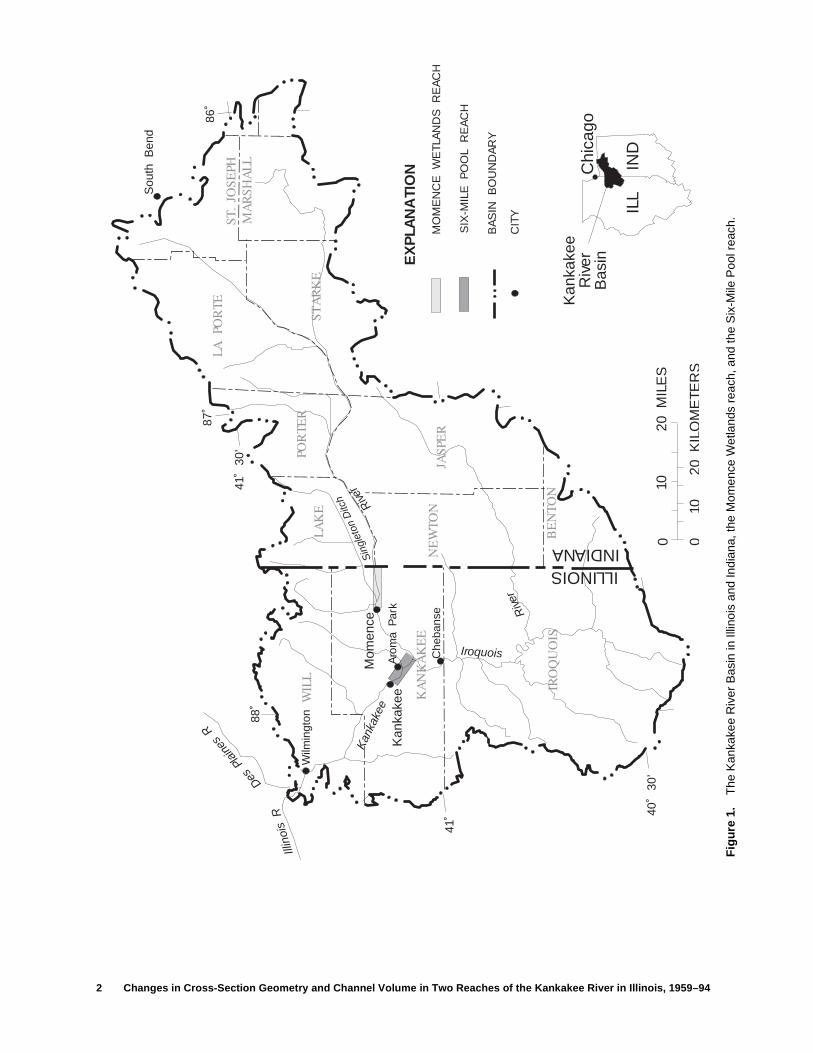
1. Map showing the Kankakee River Basin in Illinois and Indiana, the Momence Wetlands reach, and the Six-Mile Pool reach . . . . . . . . . . . . . . . . . . . . . . . . . . . . . . . . . . . . . . . . . . . . . . . . . . . . . . . . . . . . . . . . . . . . . . . . . 2
2. Graph showing annual peak streamflow at Kankakee River at Momence, Illinois, 1915–93 . . . . . . . . . . . . . . . . . 53–4. Maps showing:
3. Locations of the 35 cross sections in the Momence Wetlands reach of the Kankakee River in Illinois. . . . . . 74. Water-surface elevations at the 35 cross-section locations in the Momence Wetlands reach of the
Kankakee River in Illinois, August 1994 . . . . . . . . . . . . . . . . . . . . . . . . . . . . . . . . . . . . . . . . . . . . . . . . . . . . . 85. Locations of the 29 cross sections in the Six-Mile Pool reach of the Kankakee River in Illinois . . . . . . . . . . 10
6–12. Graphs showing:6. Schematic showing cross section and cross-section segment used to calculate cross-section segment
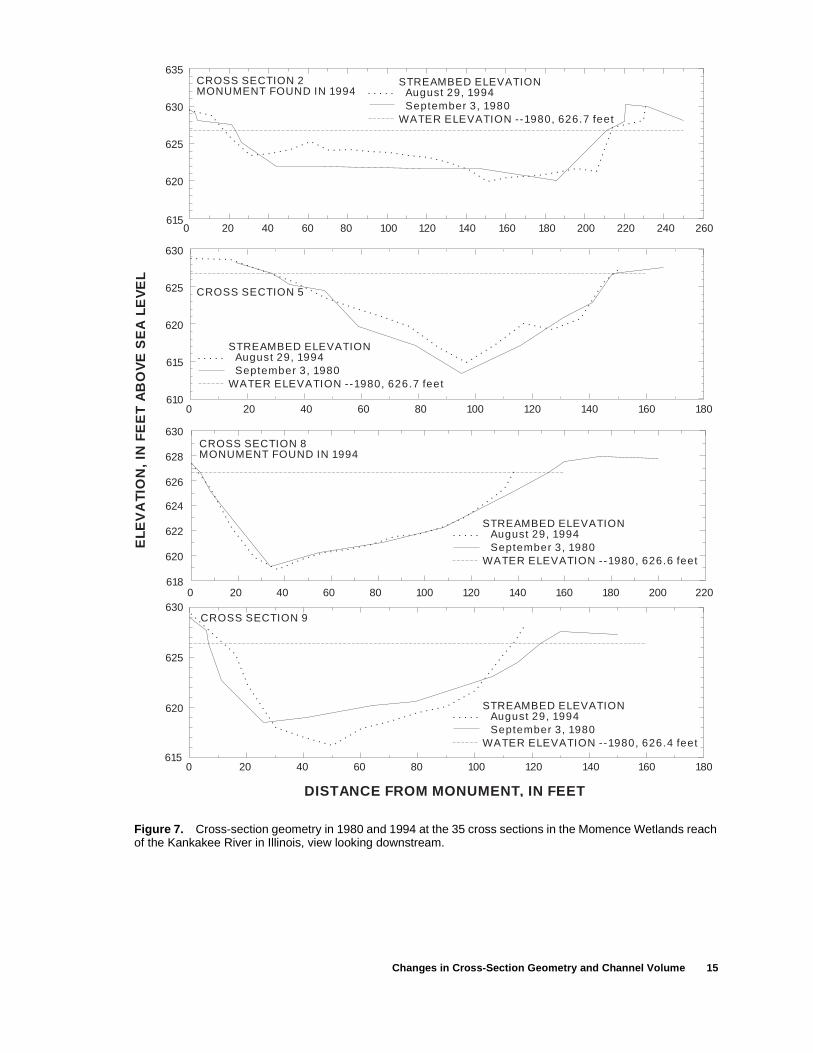
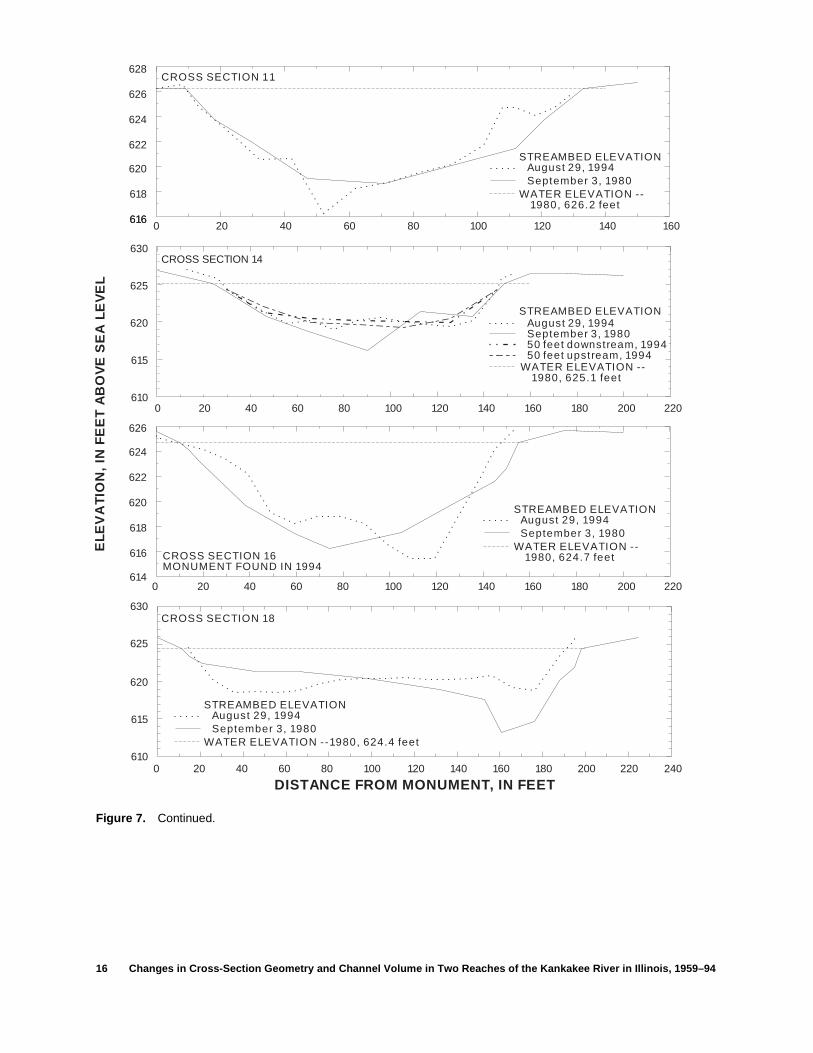
volume. . . . . . . . . . . . . . . . . . . . . . . . . . . . . . . . . . . . . . . . . . . . . . . . . . . . . . . . . . . . . . . . . . . . . . . . . . . . . . . . 117. Cross-section geometry in 1980 and 1994 at the 35 cross sections in the Momence Wetlands reach
of the Kankakee River in Illinois, view looking downstream. . . . . . . . . . . . . . . . . . . . . . . . . . . . . . . . . . . . . . 158. Changes in channel volume of the 35 cross-section segments in the Momence Wetlands reach of the
Kankakee River in Illinois, 1980–94. . . . . . . . . . . . . . . . . . . . . . . . . . . . . . . . . . . . . . . . . . . . . . . . . . . . . . . . . 249. Cross-section geometry in 1959, 1968, 1978, 1980, and 1994 at the 29 cross sections in the Six-Mile
Pool reach of the Kankakee River in Illinois, view looking downstream. . . . . . . . . . . . . . . . . . . . . . . . . . . . . 2710. Changes in channel volume of the 29 cross-section segments in the Six-Mile Pool reach of the
Kankakee River in Illinois, 1980–94 and 1978–80. . . . . . . . . . . . . . . . . . . . . . . . . . . . . . . . . . . . . . . . . . . . . . 3611. Changes in channel volume of eight cross-section segments in the Six-Mile Pool reach of the
Kankakee River in Illinois, 1968–94. . . . . . . . . . . . . . . . . . . . . . . . . . . . . . . . . . . . . . . . . . . . . . . . . . . . . . . . . 3812. Changes in channel volume of four cross-section segments in the Six-Mile Pool reach of the
Kankakee River in Illinois, 1959–94. . . . . . . . . . . . . . . . . . . . . . . . . . . . . . . . . . . . . . . . . . . . . . . . . . . . . . . . . 39
IV Contents
TABLES
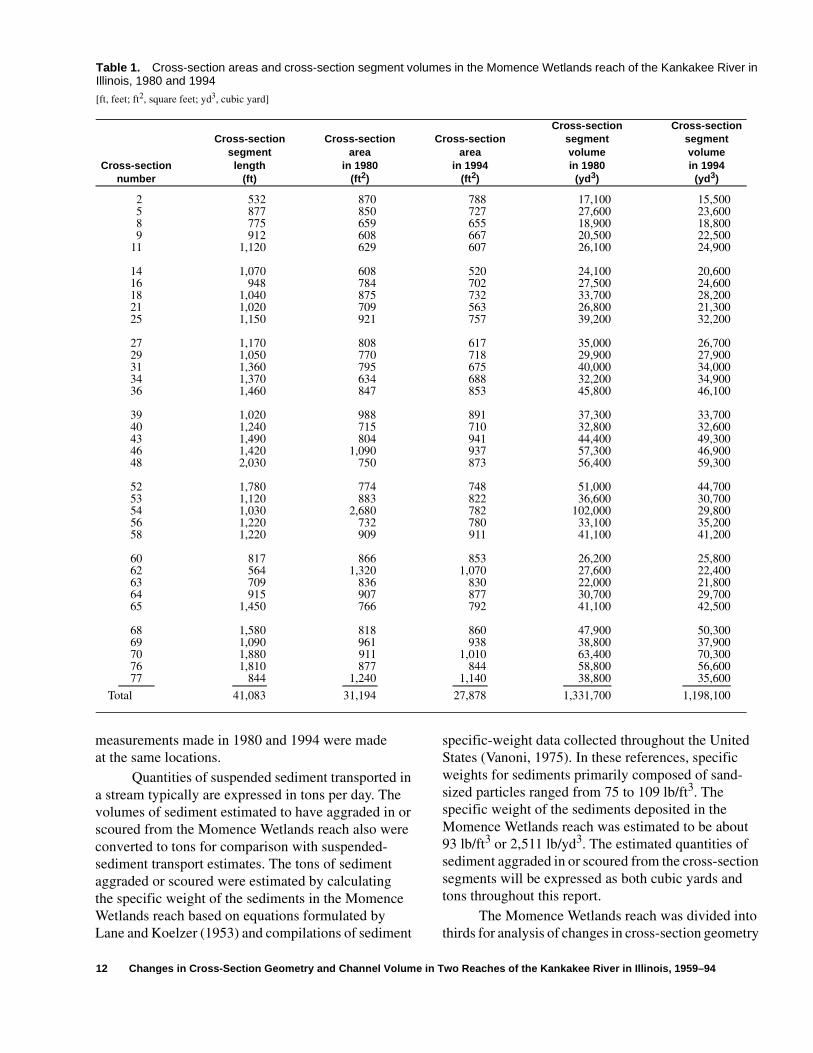
1. Cross-section areas and cross-section segment volumes in the Momence Wetlands reach of the Kankakee River in Illinois, 1980 and 1994 .................................................................................................................................. 12
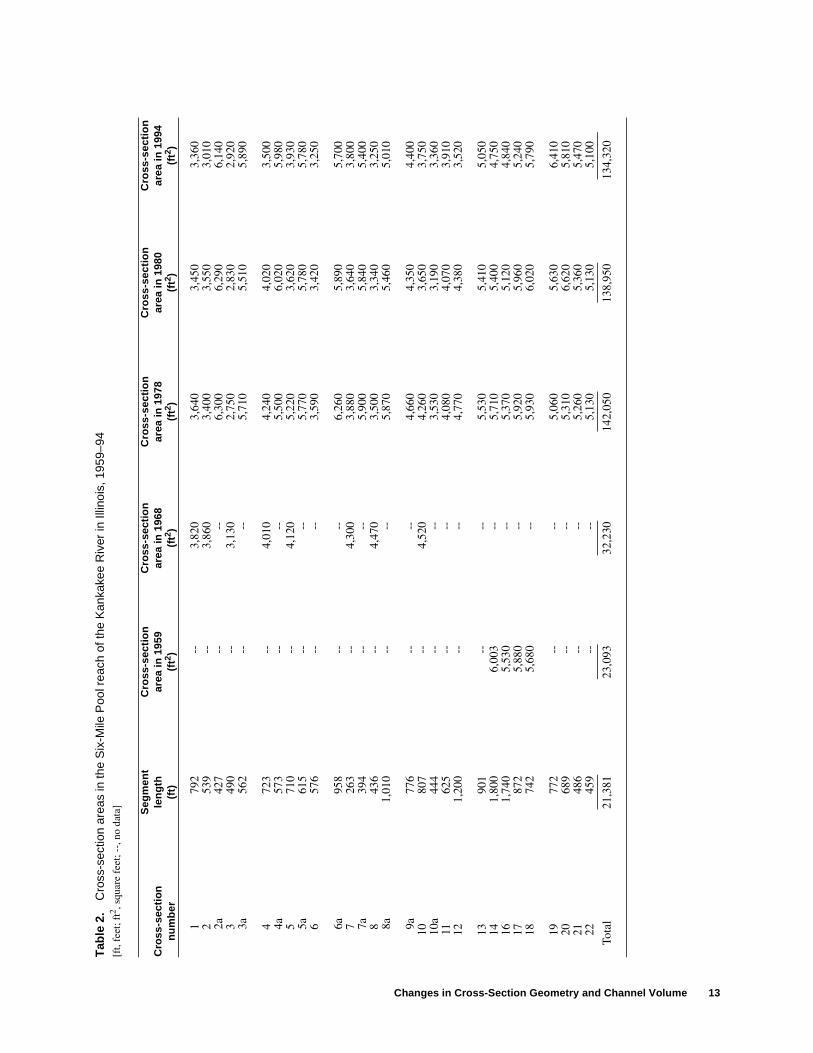
2. Cross-section areas in the Six-Mile Pool reach of the Kankakee River in Illinois, 1959–94 ..................................... 133. Cross-section segment volumes in the Six-Mile Pool reach of the Kankakee River in Illinois, 1959–94.................. 144. Summary of changes in channel geometry and volume for the Momence Wetlands reach of the Kankakee
River in Illinois, 1980–94............................................................................................................................................ 255. Summary of changes in channel geometry and volume for the Six-Mile Pool reach of the Kankakee River
in Illinois, 1959–94...................................................................................................................................................... 35
CONVERSION FACTORS AND VERTICAL DATUM
Sea level: In this report “sea level” refers to the National Geodetic Vertical Datum of 1929 (NGVDof 1929)—a geodetic datum derived from a general adjustment of the first-order level nets of boththe United States and Canada, formerly called Sea Level Datum of 1929.
Multiply By To obtain
inch (in.) 25.4 millimeterfoot (ft) 0.3048 meter
mile (mi) 1.609 kilometersquare foot (ft2) 0.09290 square meter
square mile (mi2) 2.590 square kilometercubic foot per second (ft3/s) 0.02832 cubic meter per second
cubic yard (yd3) 0.7646 cubic meterton 907.1848 kilogram
inch per mile (in/mi) 1.5786 centimeter per kilometerfoot per mile (ft/mi) 0.1894 meter per kilometer
pound per cubic foot (lb/ft3) 16.01 kilogram per cubic meterpound per cubic yard (lb/yd3) 0.5933 kilogram per cubic meter
cubic yard per square mile per year [(yd3/mi2)/yr] 0.2952 cubic meter per square kilometer per yearton per square mile per year [(ton/mi2)/yr] 350.2644 kilogram per square kilometer per year
Introduction 1
Changes in Cross-Section Geometry and Channel Volume in Two Reaches of the Kankakee River in Illinois, 1959–94By Paul J. Terrio and John E. Nazimek
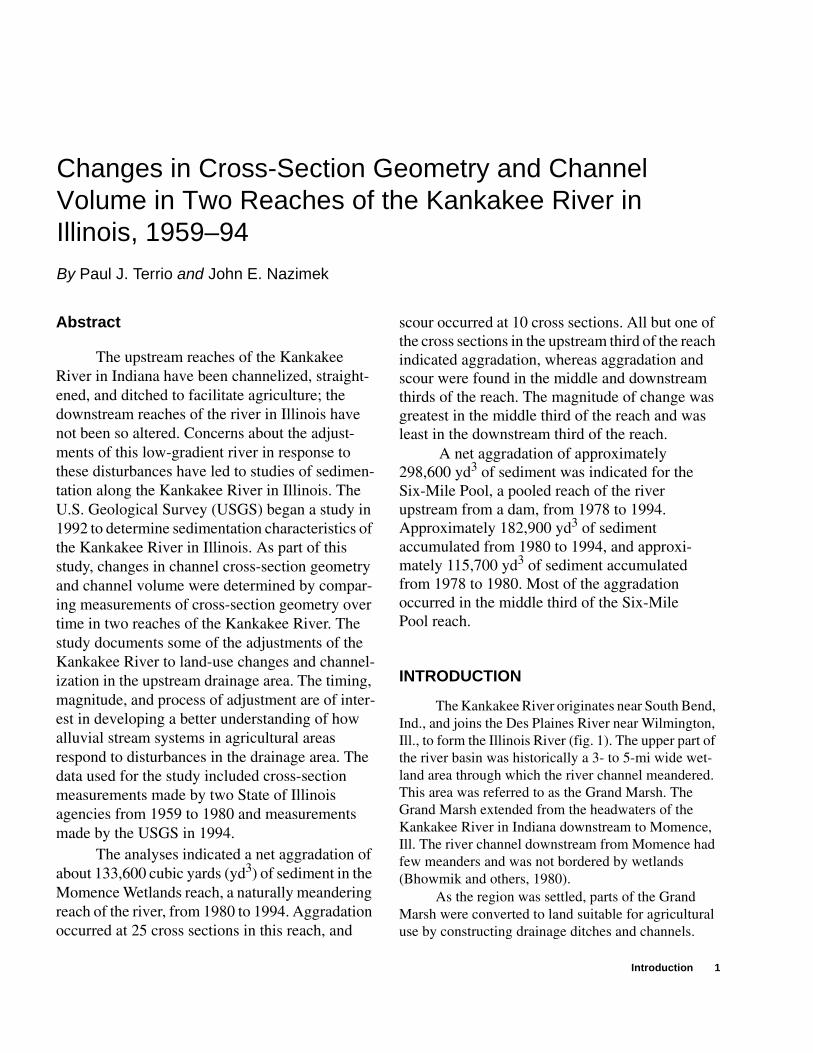
Abstract
The upstream reaches of the Kankakee River in Indiana have been channelized, straight-ened, and ditched to facilitate agriculture; the downstream reaches of the river in Illinois have not been so altered. Concerns about the adjust-ments of this low-gradient river in response to these disturbances have led to studies of sedimen-tation along the Kankakee River in Illinois. The U.S. Geological Survey (USGS) began a study in 1992 to determine sedimentation characteristics of the Kankakee River in Illinois. As part of this study, changes in channel cross-section geometry and channel volume were determined by compar-ing measurements of cross-section geometry over time in two reaches of the Kankakee River. The study documents some of the adjustments of the Kankakee River to land-use changes and channel-ization in the upstream drainage area. The timing, magnitude, and process of adjustment are of inter-est in developing a better understanding of how alluvial stream systems in agricultural areas respond to disturbances in the drainage area. The data used for the study included cross-section measurements made by two State of Illinois agencies from 1959 to 1980 and measurements made by the USGS in 1994.
The analyses indicated a net aggradation of about 133,600 cubic yards (yd3) of sediment in the Momence Wetlands reach, a naturally meandering reach of the river, from 1980 to 1994. Aggradation occurred at 25 cross sections in this reach, and
scour occurred at 10 cross sections. All but one of the cross sections in the upstream third of the reach indicated aggradation, whereas aggradation and scour were found in the middle and downstream thirds of the reach. The magnitude of change was greatest in the middle third of the reach and was least in the downstream third of the reach.
A net aggradation of approximately 298,600 yd3 of sediment was indicated for the Six-Mile Pool, a pooled reach of the river upstream from a dam, from 1978 to 1994. Approximately 182,900 yd3 of sediment accumulated from 1980 to 1994, and approxi-mately 115,700 yd3 of sediment accumulated from 1978 to 1980. Most of the aggradation occurred in the middle third of the Six-Mile Pool reach.
INTRODUCTION
The Kankakee River originates near South Bend, Ind., and joins the Des Plaines River near Wilmington, Ill., to form the Illinois River (fig. 1). The upper part of the river basin was historically a 3- to 5-mi wide wet-land area through which the river channel meandered. This area was referred to as the Grand Marsh. The Grand Marsh extended from the headwaters of the Kankakee River in Indiana downstream to Momence, Ill. The river channel downstream from Momence had few meanders and was not bordered by wetlands (Bhowmik and others, 1980).
As the region was settled, parts of the Grand Marsh were converted to land suitable for agricultural use by constructing drainage ditches and channels.
2 Changes in Cross-Section Geometry and Channel Volume in Two Reaches of the Kankakee River in Illinois, 1959–94
Fig
ure
1.
The
Kan
kake
e R
iver
Bas
in in
Illin
ois
and
Indi
ana,
the
Mom
ence
Wet
land
s re
ach,
and
the
Six
-Mile
Poo
l rea
ch.
Wilm
ingt
on
Che
bans
e
Aro
ma
Par
k
Sou
th B
end
Kan
kake
eR
iver
Bas
in
ILL
IND
EX
PLA
NA
TIO
NK
anka
kee
LAK
E
NE
WTO
N
IRO
QU
OIS
KA
NK
AK
EE
WIL
L
JASP
ER
POR
TER
BE
NTO
N
STA
RK
E
MA
RSH
ALL
ST.
JOSE
PHLA
PO
RTE
INDIANAILLINOIS
88˚
86˚
87˚
41˚
30’
41˚ 40
˚ 30
’0 0
1020
MIL
ES
1020
KIL
OM
ETE
RS
Illin
ois
R
Des P
laine
s R
Iroquois
Riv
er
BA
SIN
BO
UN
DA
RY
CIT
Y
MO
ME
NC
E W
ETL
AN
DS
RE
AC
H
SIX
-MIL
E P
OO
L R
EA
CH
Chi
cago
Kan
kake
eRive
rM
omen
ceS
ingl
eton
Ditc
h
Introduction 3
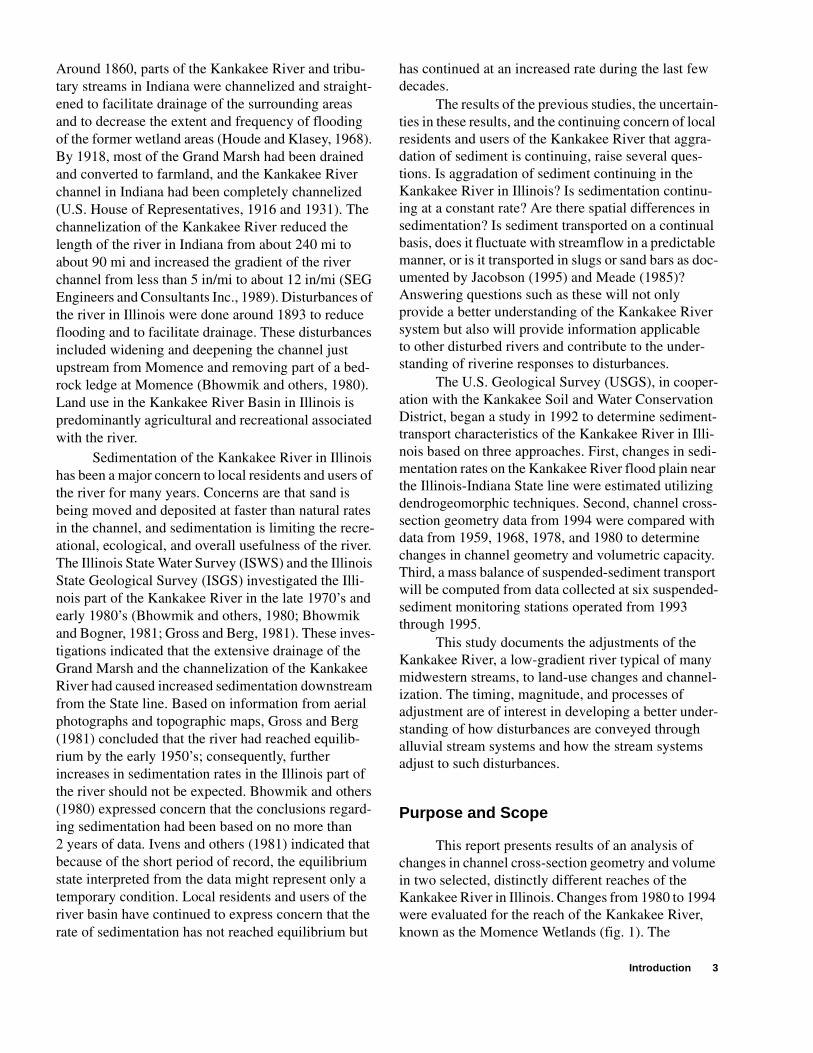
Around 1860, parts of the Kankakee River and tribu-tary streams in Indiana were channelized and straight-ened to facilitate drainage of the surrounding areas and to decrease the extent and frequency of flooding of the former wetland areas (Houde and Klasey, 1968). By 1918, most of the Grand Marsh had been drained and converted to farmland, and the Kankakee River channel in Indiana had been completely channelized (U.S. House of Representatives, 1916 and 1931). The channelization of the Kankakee River reduced the length of the river in Indiana from about 240 mi to about 90 mi and increased the gradient of the river channel from less than 5 in/mi to about 12 in/mi (SEG Engineers and Consultants Inc., 1989). Disturbances of the river in Illinois were done around 1893 to reduce flooding and to facilitate drainage. These disturbances included widening and deepening the channel just upstream from Momence and removing part of a bed-rock ledge at Momence (Bhowmik and others, 1980). Land use in the Kankakee River Basin in Illinois is predominantly agricultural and recreational associated with the river.
Sedimentation of the Kankakee River in Illinois has been a major concern to local residents and users of the river for many years. Concerns are that sand is being moved and deposited at faster than natural rates in the channel, and sedimentation is limiting the recre-ational, ecological, and overall usefulness of the river. The Illinois State Water Survey (ISWS) and the Illinois State Geological Survey (ISGS) investigated the Illi-nois part of the Kankakee River in the late 1970’s and early 1980’s (Bhowmik and others, 1980; Bhowmik and Bogner, 1981; Gross and Berg, 1981). These inves-tigations indicated that the extensive drainage of the Grand Marsh and the channelization of the Kankakee River had caused increased sedimentation downstream from the State line. Based on information from aerial photographs and topographic maps, Gross and Berg (1981) concluded that the river had reached equilib-rium by the early 1950’s; consequently, further increases in sedimentation rates in the Illinois part of the river should not be expected. Bhowmik and others (1980) expressed concern that the conclusions regard-ing sedimentation had been based on no more than 2 years of data. Ivens and others (1981) indicated that because of the short period of record, the equilibrium state interpreted from the data might represent only a temporary condition. Local residents and users of the river basin have continued to express concern that the rate of sedimentation has not reached equilibrium but
has continued at an increased rate during the last few decades.
The results of the previous studies, the uncertain-ties in these results, and the continuing concern of local residents and users of the Kankakee River that aggra-dation of sediment is continuing, raise several ques-tions. Is aggradation of sediment continuing in the Kankakee River in Illinois? Is sedimentation continu-ing at a constant rate? Are there spatial differences in sedimentation? Is sediment transported on a continual basis, does it fluctuate with streamflow in a predictable manner, or is it transported in slugs or sand bars as doc-umented by Jacobson (1995) and Meade (1985)? Answering questions such as these will not only provide a better understanding of the Kankakee River system but also will provide information applicable to other disturbed rivers and contribute to the under-standing of riverine responses to disturbances.
The U.S. Geological Survey (USGS), in cooper-ation with the Kankakee Soil and Water Conservation District, began a study in 1992 to determine sediment-transport characteristics of the Kankakee River in Illi-nois based on three approaches. First, changes in sedi-mentation rates on the Kankakee River flood plain near the Illinois-Indiana State line were estimated utilizing dendrogeomorphic techniques. Second, channel cross-section geometry data from 1994 were compared with data from 1959, 1968, 1978, and 1980 to determine changes in channel geometry and volumetric capacity. Third, a mass balance of suspended-sediment transport will be computed from data collected at six suspended-sediment monitoring stations operated from 1993 through 1995.
This study documents the adjustments of the Kankakee River, a low-gradient river typical of many midwestern streams, to land-use changes and channel-ization. The timing, magnitude, and processes of adjustment are of interest in developing a better under-standing of how disturbances are conveyed through alluvial stream systems and how the stream systems adjust to such disturbances.
Purpose and Scope
This report presents results of an analysis of changes in channel cross-section geometry and volume in two selected, distinctly different reaches of the Kankakee River in Illinois. Changes from 1980 to 1994 were evaluated for the reach of the Kankakee River, known as the Momence Wetlands (fig. 1). The
4 Changes in Cross-Section Geometry and Channel Volume in Two Reaches of the Kankakee River in Illinois, 1959–94
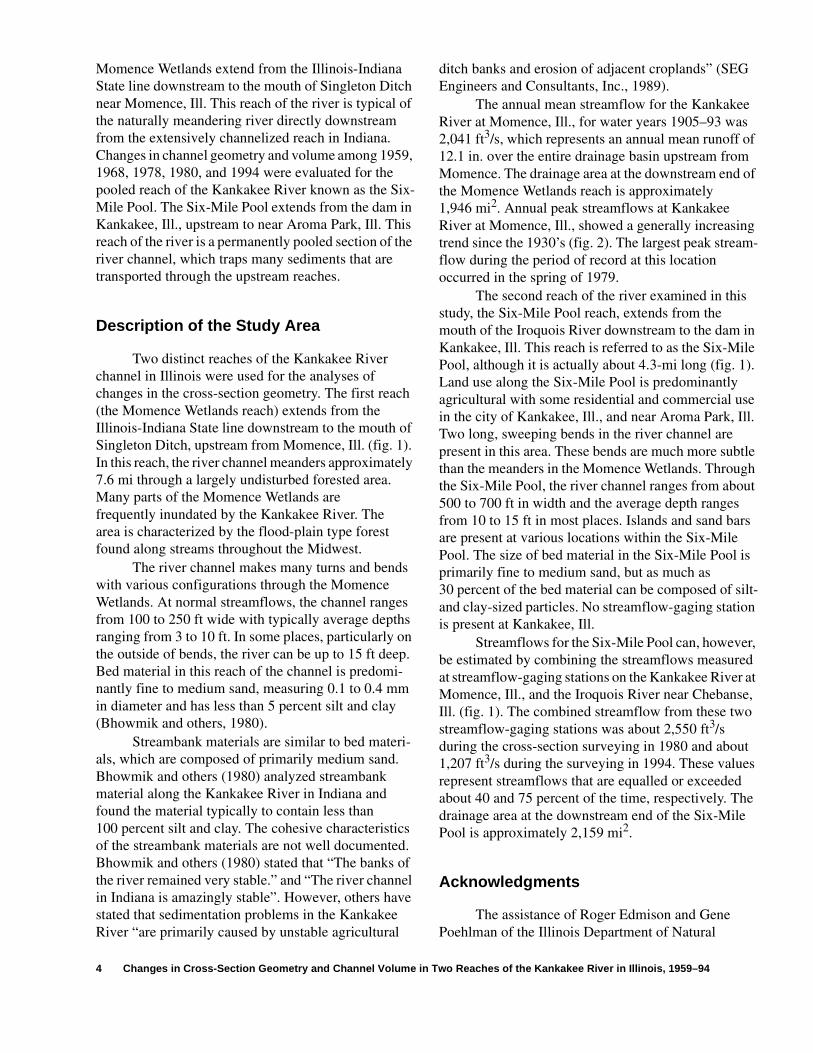
Momence Wetlands extend from the Illinois-Indiana State line downstream to the mouth of Singleton Ditch near Momence, Ill. This reach of the river is typical of the naturally meandering river directly downstream from the extensively channelized reach in Indiana. Changes in channel geometry and volume among 1959, 1968, 1978, 1980, and 1994 were evaluated for the pooled reach of the Kankakee River known as the Six-Mile Pool. The Six-Mile Pool extends from the dam in Kankakee, Ill., upstream to near Aroma Park, Ill. This reach of the river is a permanently pooled section of the river channel, which traps many sediments that are transported through the upstream reaches.
Description of the Study Area
Two distinct reaches of the Kankakee River channel in Illinois were used for the analyses of changes in the cross-section geometry. The first reach (the Momence Wetlands reach) extends from the Illinois-Indiana State line downstream to the mouth of Singleton Ditch, upstream from Momence, Ill. (fig. 1). In this reach, the river channel meanders approximately 7.6 mi through a largely undisturbed forested area. Many parts of the Momence Wetlands are frequently inundated by the Kankakee River. The area is characterized by the flood-plain type forest found along streams throughout the Midwest.
The river channel makes many turns and bends with various configurations through the Momence Wetlands. At normal streamflows, the channel ranges from 100 to 250 ft wide with typically average depths ranging from 3 to 10 ft. In some places, particularly on the outside of bends, the river can be up to 15 ft deep. Bed material in this reach of the channel is predomi-nantly fine to medium sand, measuring 0.1 to 0.4 mm in diameter and has less than 5 percent silt and clay (Bhowmik and others, 1980).
Streambank materials are similar to bed materi-als, which are composed of primarily medium sand. Bhowmik and others (1980) analyzed streambank material along the Kankakee River in Indiana and found the material typically to contain less than 100 percent silt and clay. The cohesive characteristics of the streambank materials are not well documented. Bhowmik and others (1980) stated that “The banks of the river remained very stable.” and “The river channel in Indiana is amazingly stable”. However, others have stated that sedimentation problems in the Kankakee River “are primarily caused by unstable agricultural
ditch banks and erosion of adjacent croplands” (SEG Engineers and Consultants, Inc., 1989).
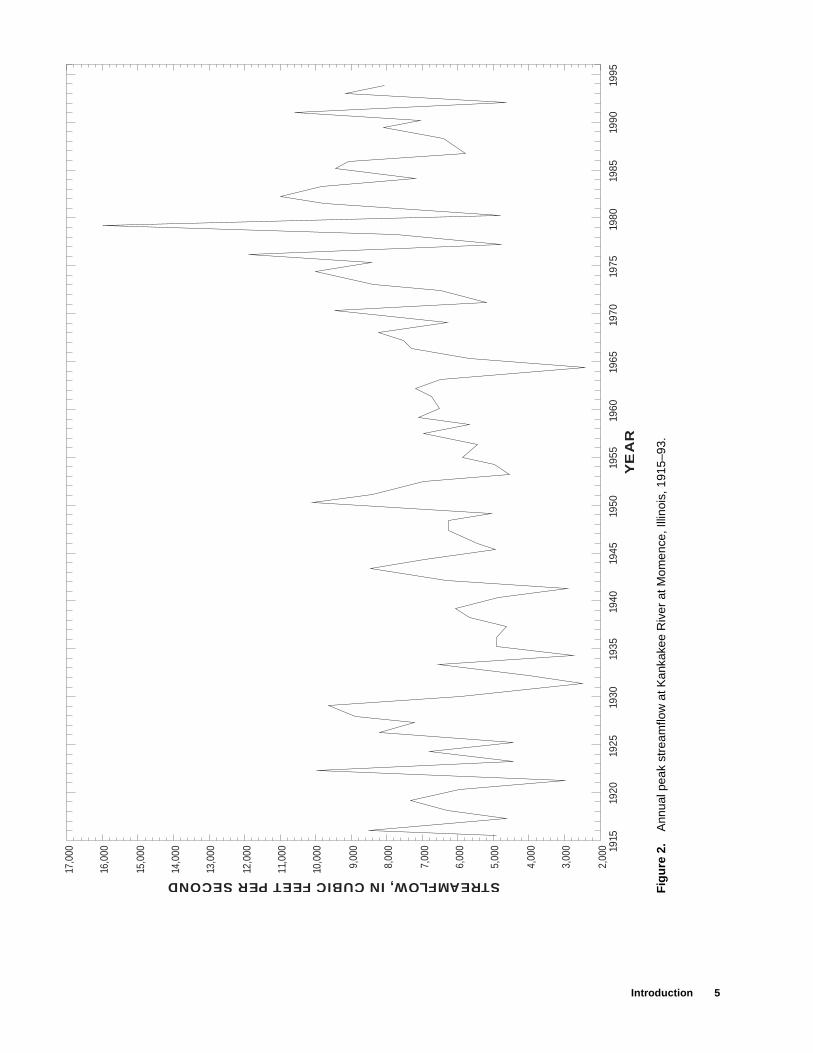
The annual mean streamflow for the Kankakee River at Momence, Ill., for water years 1905–93 was 2,041 ft3/s, which represents an annual mean runoff of 12.1 in. over the entire drainage basin upstream from Momence. The drainage area at the downstream end of the Momence Wetlands reach is approximately 1,946 mi2. Annual peak streamflows at Kankakee River at Momence, Ill., showed a generally increasing trend since the 1930’s (fig. 2). The largest peak stream-flow during the period of record at this location occurred in the spring of 1979.
The second reach of the river examined in this study, the Six-Mile Pool reach, extends from the mouth of the Iroquois River downstream to the dam in Kankakee, Ill. This reach is referred to as the Six-Mile Pool, although it is actually about 4.3-mi long (fig. 1). Land use along the Six-Mile Pool is predominantly agricultural with some residential and commercial use in the city of Kankakee, Ill., and near Aroma Park, Ill. Two long, sweeping bends in the river channel are present in this area. These bends are much more subtle than the meanders in the Momence Wetlands. Through the Six-Mile Pool, the river channel ranges from about 500 to 700 ft in width and the average depth ranges from 10 to 15 ft in most places. Islands and sand bars are present at various locations within the Six-Mile Pool. The size of bed material in the Six-Mile Pool is primarily fine to medium sand, but as much as 30 percent of the bed material can be composed of silt-and clay-sized particles. No streamflow-gaging station is present at Kankakee, Ill.
Streamflows for the Six-Mile Pool can, however, be estimated by combining the streamflows measured at streamflow-gaging stations on the Kankakee River at Momence, Ill., and the Iroquois River near Chebanse, Ill. (fig. 1). The combined streamflow from these two streamflow-gaging stations was about 2,550 ft3/s during the cross-section surveying in 1980 and about 1,207 ft3/s during the surveying in 1994. These values represent streamflows that are equalled or exceeded about 40 and 75 percent of the time, respectively. The drainage area at the downstream end of the Six-Mile Pool is approximately 2,159 mi2.
Acknowledgments
The assistance of Roger Edmison and Gene Poehlman of the Illinois Department of Natural
Introduction 5
Fig
ure
2.
Ann
ual p
eak
stre
amflo
w a
t Kan
kake
e R
iver
at M
omen
ce, I
llino
is, 1
915–
93.
1915
1920
1925
1930
1935
1940
1945
1950
1955
1960
1965
1970
1975
1980
1985
1990
1995
17,0
00
2,00
0
3,00
0
4,00
0
5,00
0
6,00
0
7,00
0
8,00
0
9,00
0
10,0
00
11,0
00
12,0
00
13,0
00
14,0
00
15,0
00
16,0
00
STREAMFLOW, IN CUBIC FEET PER SECOND
YE
AR
6 Changes in Cross-Section Geometry and Channel Volume in Two Reaches of the Kankakee River in Illinois, 1959–94
Resources, Office of Water Resources (IDNR/OWR, formerly the Illinois Department of Transportation, Division of Water Resources) for providing historical channel cross-section geometry data, associated docu-mentation, and explanation is gratefully acknowl-edged. Field notes and explanations of channel cross section measured in 1980 by Bill Bogner of the ISWS also was vital to this study.
COMPILATION AND MEASUREMENT OF CHANNEL CROSS-SECTION GEOMETRY DATA
Historical cross-section geometry data for the Kankakee River channel in Illinois were available from previous measurements made by the IDNR/OWR and the ISWS. Cross-section measurements were made by the USGS in selected reaches of the Kankakee River in 1994 at locations where previous data had been collected.
Momence Wetlands Reach
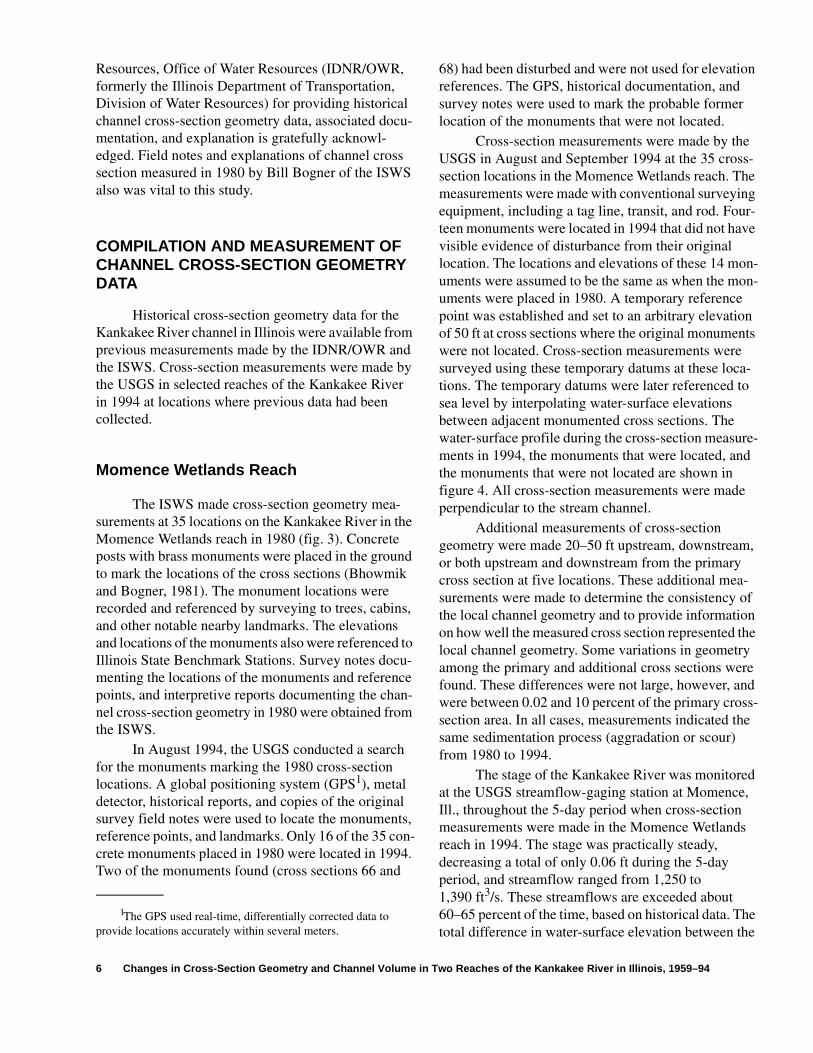
The ISWS made cross-section geometry mea-surements at 35 locations on the Kankakee River in the Momence Wetlands reach in 1980 (fig. 3). Concrete posts with brass monuments were placed in the ground to mark the locations of the cross sections (Bhowmik and Bogner, 1981). The monument locations were recorded and referenced by surveying to trees, cabins, and other notable nearby landmarks. The elevations and locations of the monuments also were referenced to Illinois State Benchmark Stations. Survey notes docu-menting the locations of the monuments and reference points, and interpretive reports documenting the chan-nel cross-section geometry in 1980 were obtained from the ISWS.
In August 1994, the USGS conducted a search for the monuments marking the 1980 cross-section locations. A global positioning system (GPS1), metal detector, historical reports, and copies of the original survey field notes were used to locate the monuments, reference points, and landmarks. Only 16 of the 35 con-crete monuments placed in 1980 were located in 1994. Two of the monuments found (cross sections 66 and
68) had been disturbed and were not used for elevation references. The GPS, historical documentation, and survey notes were used to mark the probable former location of the monuments that were not located.
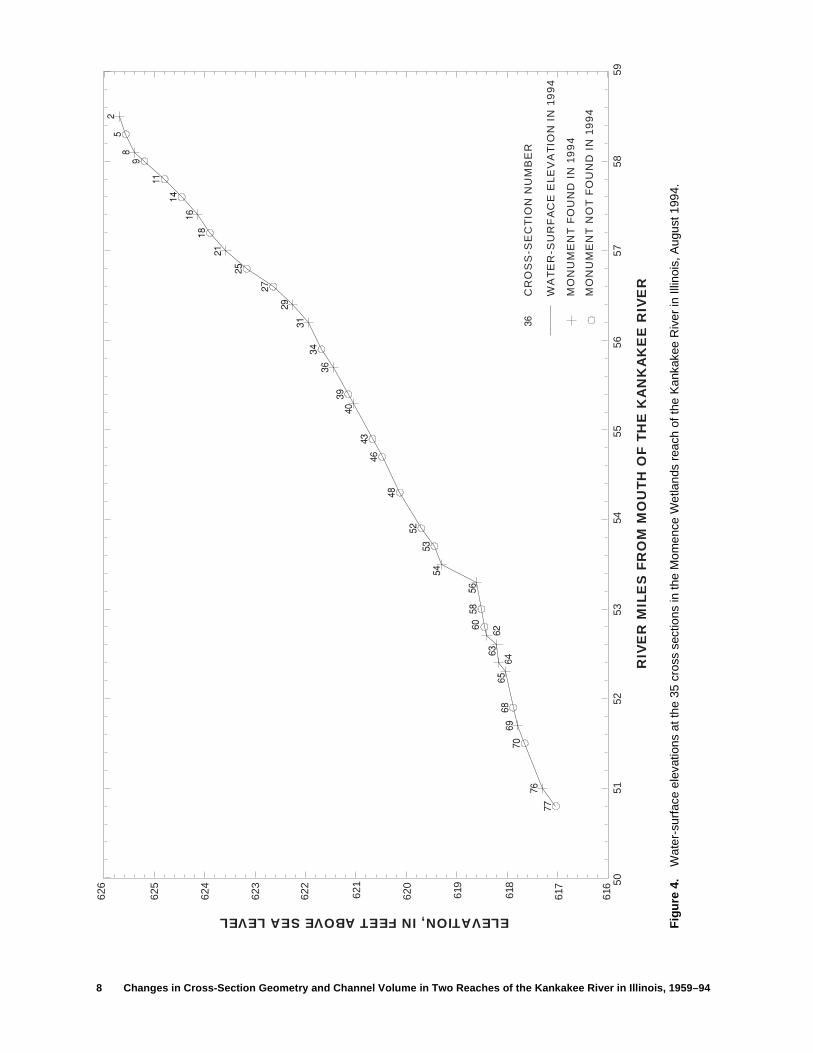
Cross-section measurements were made by the USGS in August and September 1994 at the 35 cross-section locations in the Momence Wetlands reach. The measurements were made with conventional surveying equipment, including a tag line, transit, and rod. Four-teen monuments were located in 1994 that did not have visible evidence of disturbance from their original location. The locations and elevations of these 14 mon-uments were assumed to be the same as when the mon-uments were placed in 1980. A temporary reference point was established and set to an arbitrary elevation of 50 ft at cross sections where the original monuments were not located. Cross-section measurements were surveyed using these temporary datums at these loca-tions. The temporary datums were later referenced to sea level by interpolating water-surface elevations between adjacent monumented cross sections. The water-surface profile during the cross-section measure-ments in 1994, the monuments that were located, and the monuments that were not located are shown in figure 4. All cross-section measurements were made perpendicular to the stream channel.
Additional measurements of cross-section geometry were made 20–50 ft upstream, downstream, or both upstream and downstream from the primary cross section at five locations. These additional mea-surements were made to determine the consistency of the local channel geometry and to provide information on how well the measured cross section represented the local channel geometry. Some variations in geometry among the primary and additional cross sections were found. These differences were not large, however, and were between 0.02 and 10 percent of the primary cross-section area. In all cases, measurements indicated the same sedimentation process (aggradation or scour) from 1980 to 1994.
The stage of the Kankakee River was monitored at the USGS streamflow-gaging station at Momence, Ill., throughout the 5-day period when cross-section measurements were made in the Momence Wetlands reach in 1994. The stage was practically steady, decreasing a total of only 0.06 ft during the 5-day period, and streamflow ranged from 1,250 to 1,390 ft3/s. These streamflows are exceeded about 60–65 percent of the time, based on historical data. The total difference in water-surface elevation between the
1The GPS used real-time, differentially corrected data to provide locations accurately within several meters.
Compilation and Measurement of Channel Cross-Section Geometry Data 7
Fig
ure
3.
Loca
tions
of t
he 3
5 cr
oss
sect
ions
in th
e M
omen
ce W
etla
nds
reac
h of
the
Kan
kake
e R
iver
in Il
linoi
s.
60
KAN
KAK
EE
KANKAKE
ER
IVE
R
RIV
ER
ILLINOISINDIANA
CR
OS
S-S
EC
TIO
N L
OC
AT
ION
AN
D N
UM
BE
R
4676
77
7069
65
62
60
5654
5248
43
31
29
2725
211898
5
68
6463
58
53
40
39
36
34
16
1411
2
Mid
dle
-th
ird
cro
ss
se
cti
on
sD
ow
ns
tre
am
-th
ird
cro
ss
se
cti
on
s
EX
PL
AN
AT
ION
Up
str
ea
m-t
hir
dc
ros
s s
ec
tio
ns
0 0
1
1
2 M
ILE
S
2 K
ILO
ME
TE
RS
8 Changes in Cross-Section Geometry and Channel Volume in Two Reaches of the Kankakee River in Illinois, 1959–94
Fig
ure
4.
Wat
er-s
urfa
ce e
leva
tions
at t
he 3
5 cr
oss
sect
ions
in th
e M
omen
ce W
etla
nds
reac
h of
the
Kan
kake
e R
iver
in Il
linoi
s, A
ugus
t 199
4.
CR
OS
S-S
EC
TIO
N N
UM
BE
R
WA
TE
R-S
UR
FA
CE
ELE
VA
TIO
N I
N 1
99
4
MO
NU
ME
NT
FO
UN
D I
N 1
99
4
MO
NU
ME
NT
NO
T F
OU
ND
IN
19
94
ELEVATION, IN FEET ABOVE SEA LEVEL
RIV
ER
MIL
ES
FR
OM
MO
UT
H O
F T
HE
KA
NK
AK
EE
RIV
ER
626
625
624
623
622
621
620
619
618
617
616 50
5152
5354
5556
5758
5 9
Methods of Analysis 9
upstream most cross-section location and the down-stream most cross-section location was 8.4 ft, which resulted in an average water-surface slope through the Momence Wetlands reach of 1.11 ft/mi.
Six-Mile Pool Reach
Historical cross-section geometry data for the Six-Mile Pool reach included cross-section measure-ments made by the IDNR/OWR at 4 locations in 1959, 10 locations in 1968, and 32 locations in 1978. The ISWS made cross-section measurements in 1980 at all 32 locations measured by the IDNR/OWR in 1978. The cross-section locations were referenced to Illinois State Benchmark Stations with known horizontal locations and elevations. Survey notes, maps, interpretive reports documenting the locations of the cross sections, and the historical cross-section geometry were obtained from the IDNR/OWR and ISWS.
Cross-section geometry at 29 previous cross-sec-tion measurement locations in the Six-Mile Pool reach was measured by the USGS in September 1994 (fig. 5). Survey notes, maps, and reports were used to locate the previous cross-section locations. Cross-section geome-try was measured utilizing a GPS and a digital Fathom-eter. The GPS was used to locate and record the horizontal position of the boat, while the Fathometer was used to simultaneously determine the depth of water. The Fathometer was not capable of accurately measuring depths of less than about 3 ft. No data were collected along the edges of the river or along the islands where the depth of water was less than 3 ft.
The stage of the Six-Mile Pool during the period when cross-section measurements were made in 1994 was determined from records provided by the Kanka-kee Metropolitan Wastewater Utility. These stages were referenced to the elevations of Illinois State Benchmark Stations. The stage of the Six-Mile Pool was stable during the 3-day survey period, and no sub-stantial change in the streamflow of the Kankakee River at Momence, Ill., was observed during the 3-day period. The difference in water-surface elevation from the upstream end of the Six-Mile Pool near the mouth of the Iroquois River to the downstream end of the pool at the dam in Kankakee, Ill., (approximately 4.3 mi) was only 0.04 ft on September 29, 1994 (the last day of the cross-section measurements). It is assumed that this difference in water-surface elevation represents the typically nominal difference between the upstream and
downstream ends of the Six-Mile Pool during stable streamflow conditions.
METHODS OF ANALYSIS
This section describes the methods used to analyze the cross-section measurement data collected in 1959, 1968, 1978, 1980, and 1994 in the Momence Wetlands and Six-Mile Pool reaches of the Kankakee River. Initially, elevations of all cross-section measure-ments made in 1994 were referenced to sea level. This was done based on known elevations of State Plane Benchmarks and documented elevations of the con-crete monuments placed in the Momence Wetlands in 1980. Elevations from previous cross-section measure-ments were determined from historical field notes and reports. The channel cross-section data were entered into a computer data base in flat-file format including the distance from the monument (or probable former monument location) and the elevation of the channel bottom.
The data were plotted with horizontal distance from the monument or edge of stream as the abscissa and with elevation as the ordinate. Plots of the cross-section measurements were digitized, and the cross-section area (area below the water surface) was mea-sured in digitizer units and subsequently converted to square feet. The cross-section areas were determined to be below a specified water-surface elevation—the water-surface elevation during the cross-section mea-surement in 1980 in the Momence Wetlands reach and the water-surface elevation during the cross-section measurement in 1994 in the Six-Mile Pool reach.
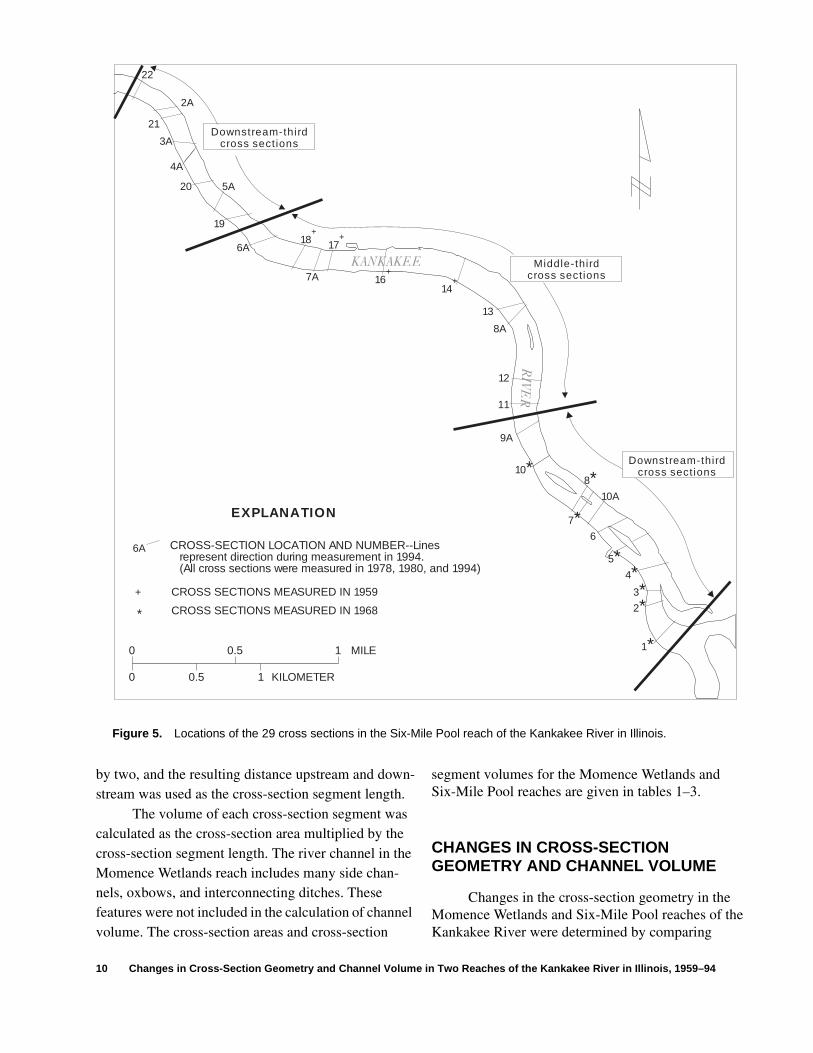
Each cross-section measurement was used to represent the channel geometry for a segment of the channel extending one-half the distance upstream and downstream from the measured cross section to the next cross section (fig. 6). The segment of the river channel represented by each cross-section measure-ment is referred to as the cross-section segment. Lengths of the cross-section segments were determined as follows. The boundaries of the Six-Mile Pool and Momence Wetlands reaches were digitized from 7.5-minute USGS topographic quadrangle maps. The reach boundaries and the locations of the measured cross sections were then overlaid using a geographic information system. A line representing the center of the channel was digitized, and the distances between cross sections along this center line were calculated. These distances between cross sections were divided
10 Changes in Cross-Section Geometry and Channel Volume in Two Reaches of the Kankakee River in Illinois, 1959–94
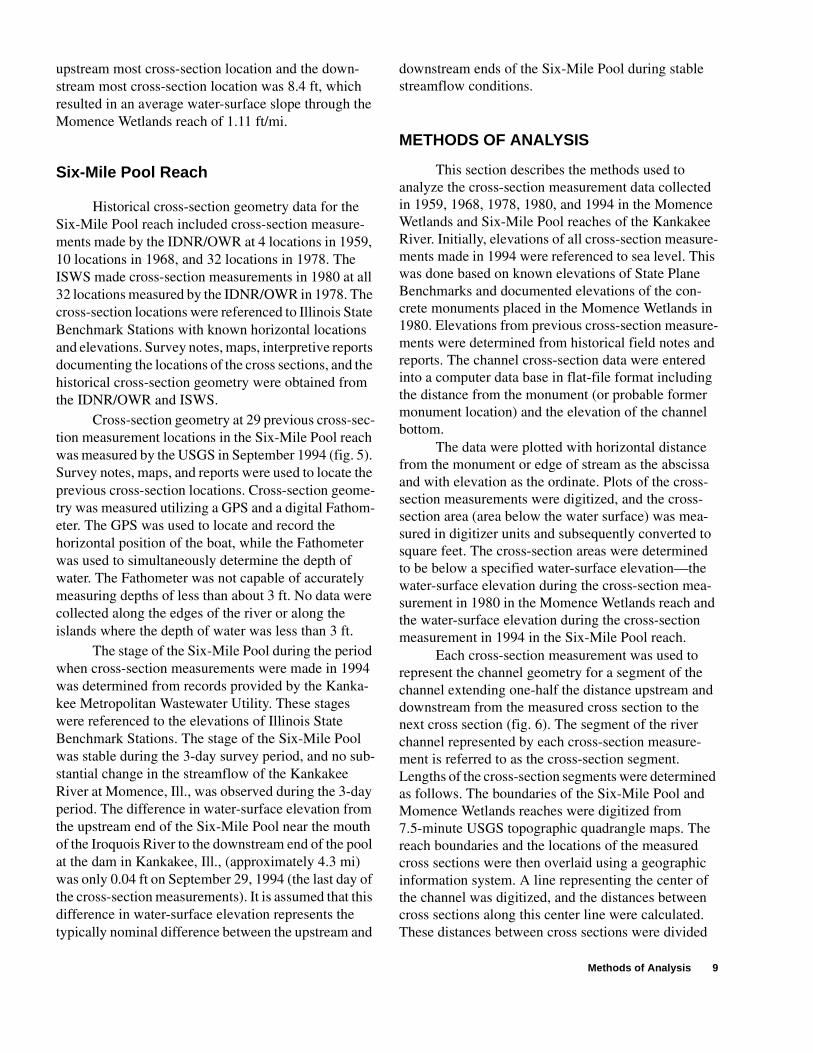
Figure 5. Locations of the 29 cross sections in the Six-Mile Pool reach of the Kankakee River in Illinois.
0.5
0.5
1
1
MILE
KILOMETER
0
0
22
2A
21
3A
4A
5A
6A
6A
7A
20
19
18+
17+
16+
+
14+
13
12
11
10*8*
7*10A
6
5*4*
3*2*
1*
9A
*
8A
CROSS-SECTION LOCATION AND NUMBER--Lines represent direction during measurement in 1994. (All cross sections were measured in 1978, 1980, and 1994)
CROSS SECTIONS MEASURED IN 1959
CROSS SECTIONS MEASURED IN 1968
Downstream-thirdcross sections
Middle-thirdcross sections
Downstream-thirdcross sections
EXPLANATION
by two, and the resulting distance upstream and down-stream was used as the cross-section segment length.
The volume of each cross-section segment was calculated as the cross-section area multiplied by the cross-section segment length. The river channel in the Momence Wetlands reach includes many side chan-nels, oxbows, and interconnecting ditches. These features were not included in the calculation of channel volume. The cross-section areas and cross-section
segment volumes for the Momence Wetlands and Six-Mile Pool reaches are given in tables 1–3.
CHANGES IN CROSS-SECTION GEOMETRY AND CHANNEL VOLUME
Changes in the cross-section geometry in the Momence Wetlands and Six-Mile Pool reaches of the Kankakee River were determined by comparing
Changes in Cross-Section Geometry and Channel Volume 11
Figure 6. Schematic showing cross section and cross-section segment used to calculate cross-section segment volume.
Cross section 8
Cross section 5
Cross section 2
Cross-sectionsegment
historical and recent cross-section measurements. Comparisons were made by graphically plotting the cross-section geometry data from the historical and 1994 measurements, and evaluating changes in geom-etry, cross-section area, and channel volume. In this report, channel volume refers to the volume of the river channel below the water-surface elevation at the time cross-section measurements were made for the Momence Wetlands reach in 1980 and for the Six-Mile Pool reach in 1994.
Momence Wetlands Reach
The 1980 and 1994 cross-section measurements provide valuable information regarding the net change in channel geometry in the Momence Wetlands reach from 1980 to 1994. Comparison of cross-section measurements made in 1980 and 1994 indicates the net change in channel geometry between the two measurement times. The morphology of the Kankakee River channel in the Momence Wetlands undergoes continual change. Temporary conditions and changes during the intervening period are not known from these measurements. Regular and more frequent measurement of cross-section geometry would be needed to provide this information.
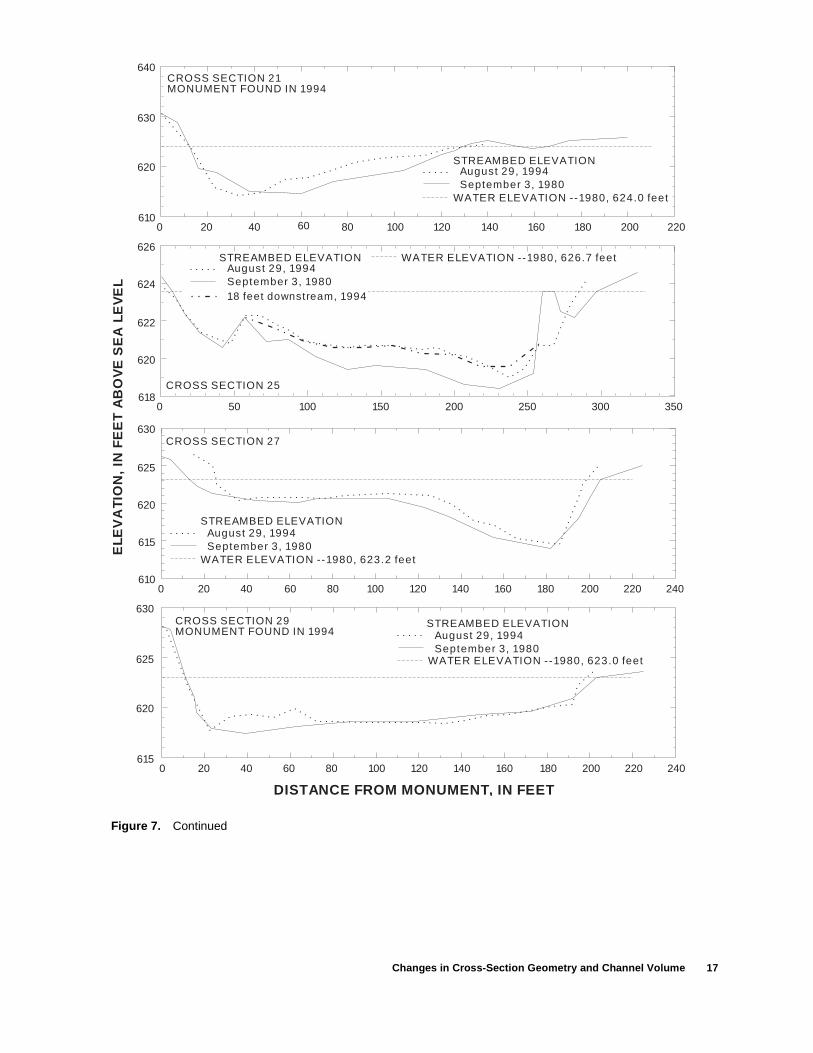
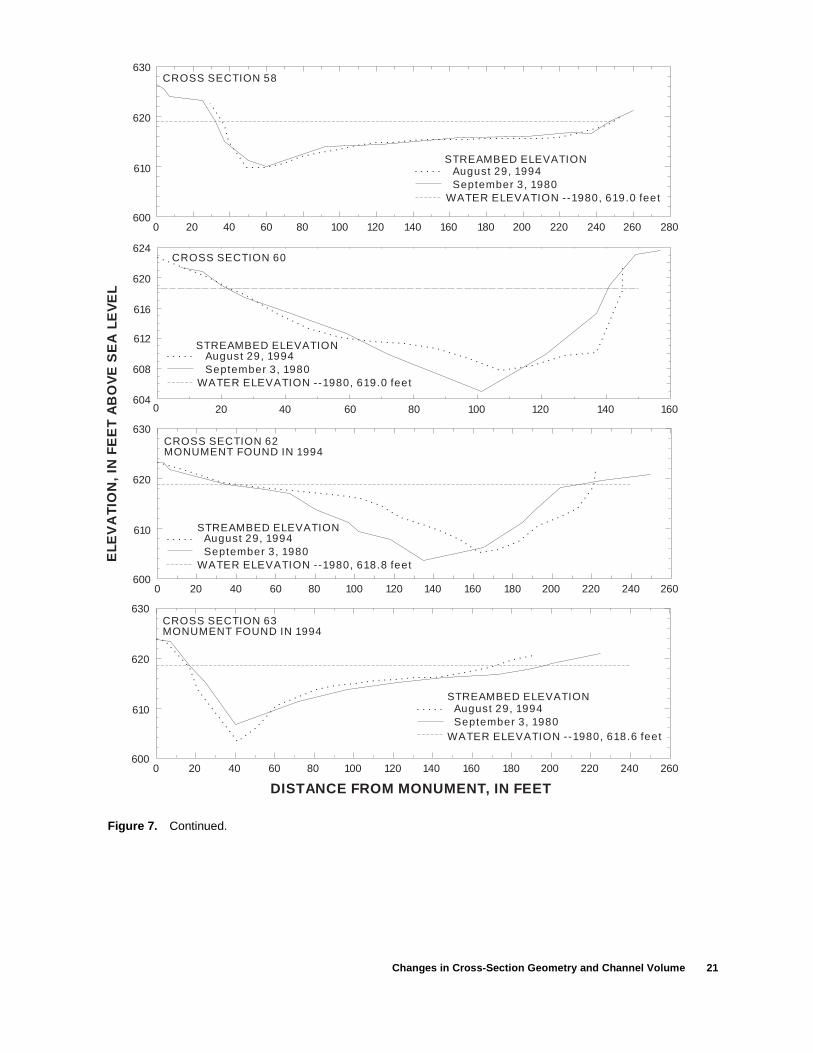
The locations of the 35 cross sections in the Momence Wetlands reach are shown in figure 3. Graphs of the cross-section geometry at the 35 loca-tions measured in 1980 and 1994 are shown in figure 7. Each cross-section measurement was used to represent channel geometry for one-half of the distance between the cross section and the nearest cross section upstream and downstream (fig. 6). The net changes in channel volume from 1980 to 1994 in each of the cross-section segments in the Momence Wetlands reach are shown in figure 8.
Only 16 of the original concrete monuments placed in 1980 were located in 1994 (noted on figure 4). Cross-section measurements were made at probable locations of the original monuments determined from survey notes and records for cross sections where monuments were not located in 1994. Because of uncertainties in the exact locations of some of the 1980 cross-section locations, some cross-section plots from 1994 were matched by visual inter-pretation to cross-section plots from 1980 (fig. 4). Cross-section plots were adjusted horizontally for matching but not vertically, and the adjustments did not affect cross-section area or channel-volume calculations. For the purposes of calculating channel volume, it was assumed that the cross-section
12 Changes in Cross-Section Geometry and Channel Volume in Two Reaches of the Kankakee River in Illinois, 1959–94
Table 1. Cross-section areas and cross-section segment volumes in the Momence Wetlands reach of the Kankakee River in Illinois, 1980 and 1994
[ft, feet; ft2, square feet; yd3, cubic yard]
Cross-sectionnumber
Cross-sectionsegment
length(ft)
Cross-sectionarea
in 1980(ft2)
Cross-sectionarea
in 1994(ft2)
Cross-sectionsegmentvolumein 1980
(yd3)
Cross-sectionsegmentvolumein 1994
(yd3)
2 532 870 788 17,100 15,5005 877 850 727 27,600 23,6008 775 659 655 18,900 18,8009 912 608 667 20,500 22,500
11 1,120 629 607 26,100 24,900
14 1,070 608 520 24,100 20,60016 948 784 702 27,500 24,60018 1,040 875 732 33,700 28,20021 1,020 709 563 26,800 21,30025 1,150 921 757 39,200 32,200
27 1,170 808 617 35,000 26,70029 1,050 770 718 29,900 27,90031 1,360 795 675 40,000 34,00034 1,370 634 688 32,200 34,90036 1,460 847 853 45,800 46,100
39 1,020 988 891 37,300 33,70040 1,240 715 710 32,800 32,60043 1,490 804 941 44,400 49,30046 1,420 1,090 937 57,300 46,90048 2,030 750 873 56,400 59,300
52 1,780 774 748 51,000 44,70053 1,120 883 822 36,600 30,70054 1,030 2,680 782 102,000 29,80056 1,220 732 780 33,100 35,20058 1,220 909 911 41,100 41,200
60 817 866 853 26,200 25,80062 564 1,320 1,070 27,600 22,40063 709 836 830 22,000 21,80064 915 907 877 30,700 29,70065 1,450 766 792 41,100 42,500
68 1,580 818 860 47,900 50,30069 1,090 961 938 38,800 37,90070 1,880 911 1,010 63,400 70,30076 1,810 877 844 58,800 56,60077 844 1,240 1,140 38,800 35,600
Total 41,083 31,194 27,878 1,331,700 1,198,100
measurements made in 1980 and 1994 were made at the same locations.
Quantities of suspended sediment transported in a stream typically are expressed in tons per day. The volumes of sediment estimated to have aggraded in or scoured from the Momence Wetlands reach also were converted to tons for comparison with suspended-sediment transport estimates. The tons of sediment aggraded or scoured were estimated by calculating the specific weight of the sediments in the Momence Wetlands reach based on equations formulated by Lane and Koelzer (1953) and compilations of sediment
specific-weight data collected throughout the United States (Vanoni, 1975). In these references, specific weights for sediments primarily composed of sand-sized particles ranged from 75 to 109 lb/ft3. The specific weight of the sediments deposited in the Momence Wetlands reach was estimated to be about 93 lb/ft3 or 2,511 lb/yd3. The estimated quantities of sediment aggraded in or scoured from the cross-section segments will be expressed as both cubic yards and tons throughout this report.
The Momence Wetlands reach was divided into thirds for analysis of changes in cross-section geometry
Changes in Cross-Section Geometry and Channel Volume 13
Tab
le 2
.C
ross
-sec
tion
area
s in
the
Six
-Mile
Poo
l rea
ch o
f the
Kan
kake
e R
iver
in Il
linoi
s, 1
959–
94[f
t, fe
et; f
t2 , squ
are
feet
; --,
no
data
]
Cro
ss-s
ecti
on
nu
mb
er
Seg
men
tle
ng
th(f
t)
Cro
ss-s
ecti
on
area
in 1
959
(ft2 )
Cro
ss-s
ecti
on
area
in 1
968
(ft2 )
Cro
ss-s
ecti
on
area
in 1
978
(ft2 )
Cro
ss-s
ecti
on
area
in 1
980
(ft2 )
Cro
ss-s
ecti
on
area
in 1
994
(ft2 )
179
2--
3,82
03,
640
3,45
03,
360
253
9--
3,86
03,
400
3,55
03,
010
2a42
7--
--6,
300
6,29
06,
140
349
0--
3,13
02,
750
2,83
02,
920
3a56
2--
--5,
710
5,51
05,
890
472
3--
4,01
04,
240
4,02
03,
500
4a57
3--
--5,
500
6,02
05,
980
571
0--
4,12
05,
220
3,62
03,
930
5a61
5--
--5,
770
5,78
05,
780
657
6--
--3,
590
3,42
03,
250
6a95
8--
--6,
260
5,89
05,
700
726
3--
4,30
03,
880
3,64
03,
800
7a39
4--
--5,
900
5,84
05,
400
843
6--
4,47
03,
500
3,34
03,
250
8a1,
010
----
5,87
05,
460
5,01
0
9a77
6--
--4,
660
4,35
04,
400
1080
7--
4,52
04,
260
3,65
03,
750
10a
444
----
3,53
03,
190
3,36
011
625
----
4,08
04,
070
3,91
012
1,20
0--
--4,
770
4,38
03,
520
1390
1--
--5,
530
5,41
05,
050
141,
800
6,00
3--
5,71
05,
400
4,75
016
1,74
05,
530
--5,
370
5,12
04,
840
1787
25,
880
--5,
920
5,96
05,
240
1874
25,
680
--5,
930
6,02
05,
790
1977
2--
--5,
060
5,63
06,
410
2068
9--
--5,
310
6,62
05,
810
2148
6--
--5,
260
5,36
05,
470
2245
9--
--5,
130
5,13
05,
100
Tota
l21
,381
23,0
9332
,230
142,
050
138,
950
134,
320

14 Changes in Cross-Section Geometry and Channel Volume in Two Reaches of the Kankakee River in Illinois, 1959–94
Tab
le 3
.C
ross
-sec
tion
segm
ent v
olum
es in
the
Six
-Mile
Poo
l rea
ch o
f the
Kan
kake
e R
iver
in Il
linoi
s, 1
959–
94
[ft,
feet
; yd3 , c
ubic
yar
ds; -
-, n
o da
ta]
Cro
ss-s
ecti
on
nu
mb
er
Seg
men
tle
ng
th(f
t)
1959
Cro
ss-s
ecti
on
volu
me
(yd
3 )
1968
Cro
ss-s
ecti
on
volu
me
(yd
3 )
1978
Cro
ss-s
ecti
on
volu
me
(yd
3 )
1980
Cro
ss-s
ecti
on
volu
me
(yd
3 )
1994
Cro
ss-s
ecti
on
volu
me
(yd
3 )
179
2--
112,
000
107,
000
101,
000
98,6
002
539
--77
,100
67,9
0070
,900
60,1
002a
427
----
99,6
0099
,500
97,1
003
490
--56
,800
49,9
0051
,400
53,0
003a
562
----
119,
000
115,
000
123,
000
472
3--
107,
000
113,
000
108,
000
93,7
004a
573
----
117,
000
128,
000
127,
000
571
0--
108,
000
137,
000
95,2
0010
3,00
05a
615
----
131,
000
132,
000
132,
000
657
6--
--76
,600
73,0
0069
,300
6a95
8--
--22
2,00
020
9,00
020
2,00
07
263
--41
,900
37,8
0035
,500
37,0
007a
394
----
86,1
0085
,200
78,8
008
436
--72
,200
56,5
0053
,900
52,5
008a
1,01
0--
--22
0,00
020
4,00
018
7,00
0
9a77
6--
--13
4,00
012
5,00
012
6,00
010
807
--13
5,00
012
7,00
010
9,00
011
2,00
010
a44
4--
--58
,000
52,5
0055
,300
1162
5--
--94
,400
94,2
0090
,500
121,
200
----
212,
000
195,
000
156,
000
1390
1--
--18
5,00
018
1,00
016
9,00
014
1,80
040
0,00
0--
381,
000
360,
000
317,
000
161,
740
356,
000
--34
6,00
033
0,00
031
2,00
017
872
190,
000
--19
1,00
019
2,00
016
9,00
018
742
156,
000
--16
3,00
016
5,00
015
9,00
0
1977
2--
--14
5,00
016
1,00
018
3,00
020
689
----
136,
000
169,
000
148,
000
2148
6--
--94
,700
96,5
0098
,500
2245
9--
--87
,200
87,2
0086
,700
Tota
l21
,381
1,10
2,00
071
0,00
03,
994,
700
3,87
9,00
03,
696,
100
Changes in Cross-Section Geometry and Channel Volume 15
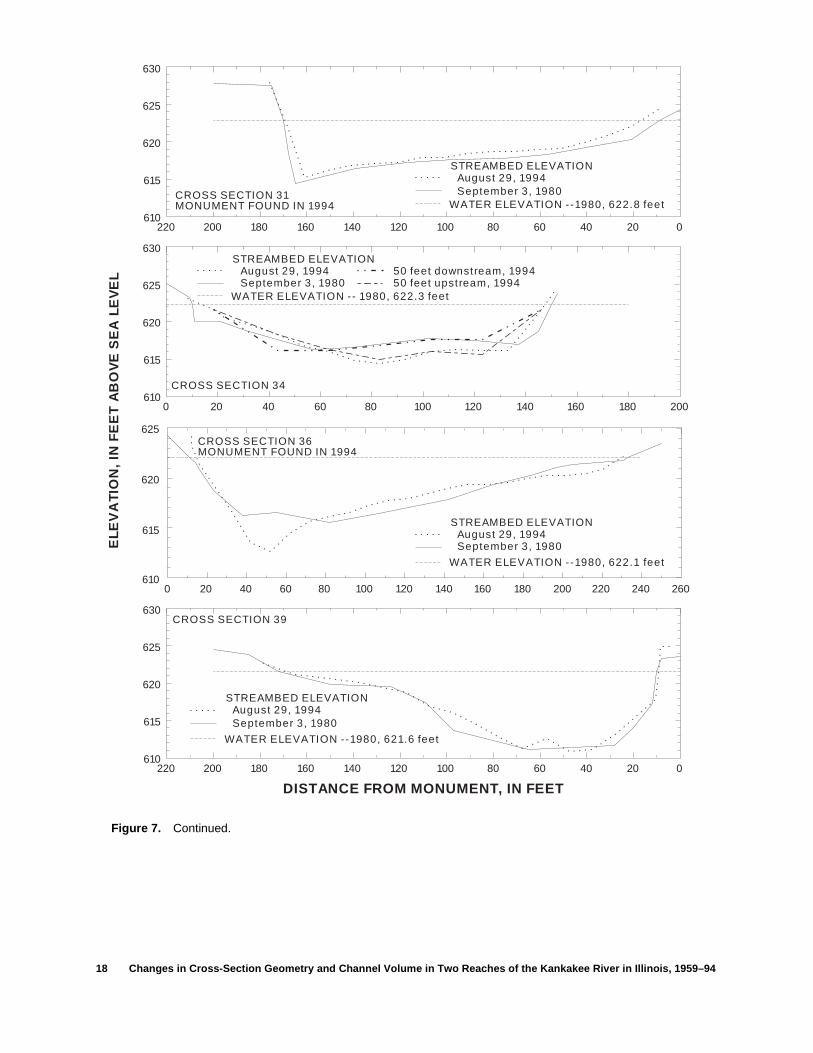
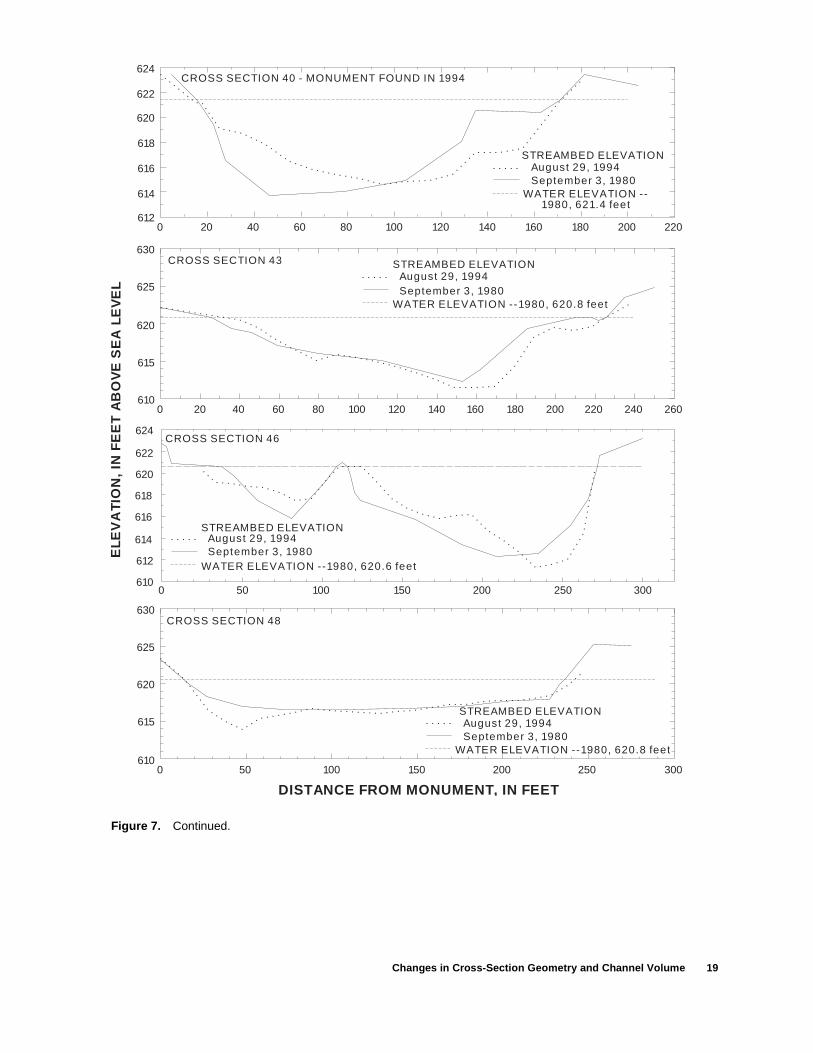
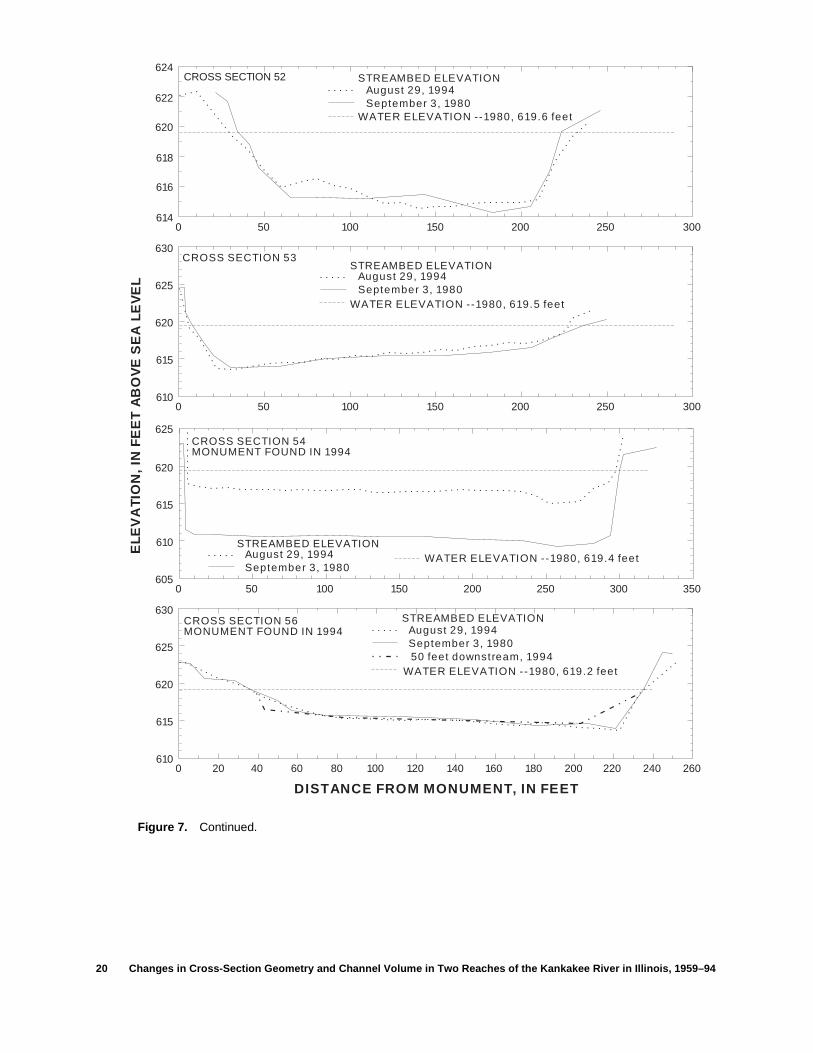
Figure 7. Cross-section geometry in 1980 and 1994 at the 35 cross sections in the Momence Wetlands reach of the Kankakee River in Illinois, view looking downstream.
ELE
VA
TIO
N,
IN F
EE
T A
BO
VE
SE
A L
EV
EL
635
615
620
625
630
2600 20 40 60 80 100 120 140 160 180 200 220 240
CROSS SECTION 2 MONUMENT FOUND IN 1994
630
610
615
620
625
1800 20 40 60 80 100 120 140 160
CROSS SECTION 5
630
618
620
622
624
626
628
2200 20 40 60 80 100 120 140 160 180 200
CROSS SECTION 8 MONUMENT FOUND IN 1994
DISTANCE FROM MONUMENT, IN FEET
615
630
620
625
0 18020 40 60 80 100 120 140 160
CROSS SECTION 9
August 29, 1994September 3, 1980
WATER ELEVATION --1980, 626.7 feet
STREAMBED ELEVATION
August 29, 1994September 3, 1980
WATER ELEVATION --1980, 626.7 feet
STREAMBED ELEVATION
August 29, 1994September 3, 1980
WATER ELEVATION --1980, 626.6 feet
STREAMBED ELEVATION
August 29, 1994September 3, 1980
WATER ELEVATION --1980, 626.4 feet
STREAMBED ELEVATION
16 Changes in Cross-Section Geometry and Channel Volume in Two Reaches of the Kankakee River in Illinois, 1959–94
Figure 7. Continued.
August 29, 1994September 3, 1980
STREAMBED ELEVATION
WATER ELEVATION --1980, 626.2 feet
August 29, 1994September 3, 1980
WATER ELEVATION --1980, 624.7 feet
STREAMBED ELEVATION
August 29, 1994September 3, 1980
WATER ELEVATION --1980, 624.4 feet
STREAMBED ELEVATION
ELE
VA
TIO
N,
IN F
EE
T A
BO
VE
SE
A L
EV
EL
CROSS SECTION 11
CROSS SECTION 16 MONUMENT FOUND IN 1994
DISTANCE FROM MONUMENT, IN FEET
CROSS SECTION 18
616
628
616
618
620
622
624
626
0 16020 40 60 80 100 120 140
626
614
616
618
620
622
624
2200 20 40 60 80 100 120 140 160 180 200
630
610
615
620
625
2400 20 40 60 80 100 120 140 160 180 200 220
630
610
615
620
625
2200 20 40 60 80 100 120 140 160 180 200
CROSS SECTION 14
August 29, 1994September 3, 198050 feet downstream, 199450 feet upstream, 1994
STREAMBED ELEVATION
WATER ELEVATION --1980, 625.1 feet
Changes in Cross-Section Geometry and Channel Volume 17
Figure 7. Continued
August 29, 1994September 3, 1980
WATER ELEVATION --1980, 624.0 feet
STREAMBED ELEVATION
August 29, 1994September 3, 1980
WATER ELEVATION --1980, 626.7 feetSTREAMBED ELEVATION
August 29, 1994September 3, 1980
WATER ELEVATION --1980, 623.2 feet
STREAMBED ELEVATION
August 29, 1994September 3, 1980
WATER ELEVATION --1980, 623.0 feet
STREAMBED ELEVATION
ELE
VA
TIO
N,
IN F
EE
T A
BO
VE
SE
A L
EV
EL
CROSS SECTION 25
CROSS SECTION 27
DISTANCE FROM MONUMENT, IN FEET
CROSS SECTION 29MONUMENT FOUND IN 1994
640
610
620
630
2200 20 40 60 80 100 120 140 160 180 200
CROSS SECTION 21 MONUMENT FOUND IN 1994
626
618
620
622
624
0 35050 100 150 200 250 300
610
630
615
620
625
0 24020 40 60 80 100 120 140 160 180 200 220
615
630
620
625
0 24020 40 60 80 100 120 140 160 180 200 220
18 feet downstream, 1994
18 Changes in Cross-Section Geometry and Channel Volume in Two Reaches of the Kankakee River in Illinois, 1959–94
Figure 7. Continued.
ELE
VA
TIO
N,
IN F
EE
T A
BO
VE
SE
A L
EV
EL
CROSS SECTION 31MONUMENT FOUND IN 1994
CROSS SECTION 34
CROSS SECTION 36 MONUMENT FOUND IN 1994
DISTANCE FROM MONUMENT, IN FEET
CROSS SECTION 39
610
630
615
620
625
220 020406080100120140160180200
610
630
615
620
625
0 20020 40 60 80 100 120 140 160 180
WATER ELEVATION -- 1980, 622.3 feet
August 29, 1994September 3, 1980
50 feet downstream, 199450 feet upstream, 1994
625
610
615
620
0 26020 40 60 80 100 120 140 160 180 200 220 240
610
630
615
620
625
0220 20406080100120140160180200
August 29, 1994September 3, 1980
WATER ELEVATION --1980, 622.8 feet
STREAMBED ELEVATION
August 29, 1994September 3, 1980
WATER ELEVATION --1980, 621.6 feet
STREAMBED ELEVATION
August 29, 1994September 3, 1980
WATER ELEVATION --1980, 622.1 feet
STREAMBED ELEVATION
STREAMBED ELEVATION
Changes in Cross-Section Geometry and Channel Volume 19
Figure 7. Continued.
August 29, 1994September 3, 1980
WATER ELEVATION --1980, 621.4 feet
STREAMBED ELEVATION
August 29, 1994September 3, 1980
WATER ELEVATION --1980, 620.8 feet
STREAMBED ELEVATION
August 29, 1994September 3, 1980
WATER ELEVATION --1980, 620.8 feet
STREAMBED ELEVATION
August 29, 1994September 3, 1980
WATER ELEVATION --1980, 620.6 feet
STREAMBED ELEVATION
ELE
VA
TIO
N,
IN F
EE
T A
BO
VE
SE
A L
EV
EL
CROSS SECTION 40 - MONUMENT FOUND IN 1994
CROSS SECTION 43
CROSS SECTION 46
DISTANCE FROM MONUMENT, IN FEET
CROSS SECTION 48
612
624
614
616
618
620
622
0 22020 40 60 80 100 120 140 160 180 200
610
630
615
620
625
0 26020 40 60 80 100 120 140 160 180 200 220 240
610
624
618
616
614
612
620
622
0 50 100 150 200 250 300
610
630
615
620
625
0 30050 100 150 200 250
20 Changes in Cross-Section Geometry and Channel Volume in Two Reaches of the Kankakee River in Illinois, 1959–94
Figure 7. Continued.
August 29, 1994September 3, 1980
WATER ELEVATION --1980, 619.6 feet
STREAMBED ELEVATION
August 29, 1994September 3, 1980
WATER ELEVATION --1980, 619.5 feet
STREAMBED ELEVATION
WATER ELEVATION --1980, 619.4 feetAugust 29, 1994September 3, 1980
STREAMBED ELEVATION
August 29, 1994September 3, 1980
WATER ELEVATION --1980, 619.2 feet
STREAMBED ELEVATION
ELE
VA
TIO
N,
IN F
EE
T A
BO
VE
SE
A L
EV
EL
CROSS SECTION 52
CROSS SECTION 53
CROSS SECTION 54 MONUMENT FOUND IN 1994
DISTANCE FROM MONUMENT, IN FEET
CROSS SECTION 56 MONUMENT FOUND IN 1994
614
624
616
618
620
622
0 30050 100 150 200 250
610
630
615
620
625
0 30050 100 150 200 250
610
630
615
620
625
0 26020 40 60 80 100 120 140 160 180 200 220 240
50 feet downstream, 1994
605
625
610
615
620
0 35050 100 150 200 250 300
Changes in Cross-Section Geometry and Channel Volume 21
Figure 7. Continued.
August 29, 1994September 3, 1980
WATER ELEVATION --1980, 619.0 feet
STREAMBED ELEVATION
August 29, 1994September 3, 1980
WATER ELEVATION --1980, 619.0 feet
STREAMBED ELEVATION
August 29, 1994September 3, 1980
WATER ELEVATION --1980, 618.8 feet
STREAMBED ELEVATION
August 29, 1994September 3, 1980
WATER ELEVATION --1980, 618.6 feet
STREAMBED ELEVATION
ELE
VA
TIO
N,
IN F
EE
T A
BO
VE
SE
A L
EV
EL
CROSS SECTION 58
CROSS SECTION 60
CROSS SECTION 62MONUMENT FOUND IN 1994
DISTANCE FROM MONUMENT, IN FEET
CROSS SECTION 63 MONUMENT FOUND IN 1994
600
630
610
620
0 28020 40 60 80 100 120 140 160 180 200 220 240 260
604
608
612
616
620
624
0 20 40 60 80 100 120 140 160
600
630
610
620
0 26020 40 60 80 100 120 140 160 180 200 220 240
600
630
610
620
0 26020 40 60 80 100 120 140 160 180 200 220 240
22 Changes in Cross-Section Geometry and Channel Volume in Two Reaches of the Kankakee River in Illinois, 1959–94
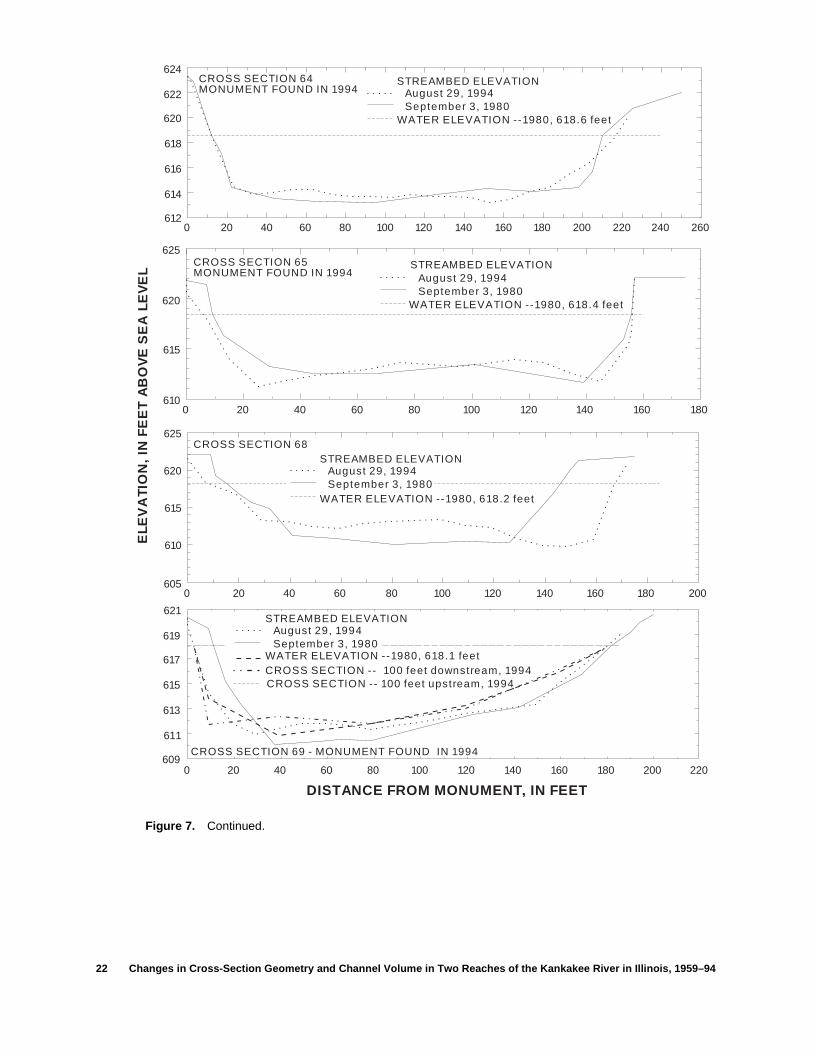
Figure 7. Continued.
August 29, 1994September 3, 1980
WATER ELEVATION --1980, 618.6 feet
STREAMBED ELEVATION
August 29, 1994September 3, 1980
WATER ELEVATION --1980, 618.4 feet
STREAMBED ELEVATION
August 29, 1994
WATER ELEVATION --1980, 618.1 feet
STREAMBED ELEVATION
August 29, 1994
WATER ELEVATION --1980, 618.2 feet
STREAMBED ELEVATION
ELE
VA
TIO
N,
IN F
EE
T A
BO
VE
SE
A L
EV
EL
CROSS SECTION 64 MONUMENT FOUND IN 1994
CROSS SECTION 65 MONUMENT FOUND IN 1994
CROSS SECTION 68
DISTANCE FROM MONUMENT, IN FEET
CROSS SECTION 69 - MONUMENT FOUND IN 1994
612
624
614
616
618
620
622
0 26020 40 60 80 100 120 140 160 180 200 220 240
610
625
615
620
0 18020 40 60 80 100 120 140 160
605
625
610
615
620
0 20020 40 60 80 100 120 140 160 180
609
621
613
611
615
617
619
0 22020 40 60 80 100 120 140 160 180 200
CROSS SECTION -- 100 feet downstream, 1994CROSS SECTION -- 100 feet upstream, 1994
September 3, 1980
September 3, 1980
Changes in Cross-Section Geometry and Channel Volume 23
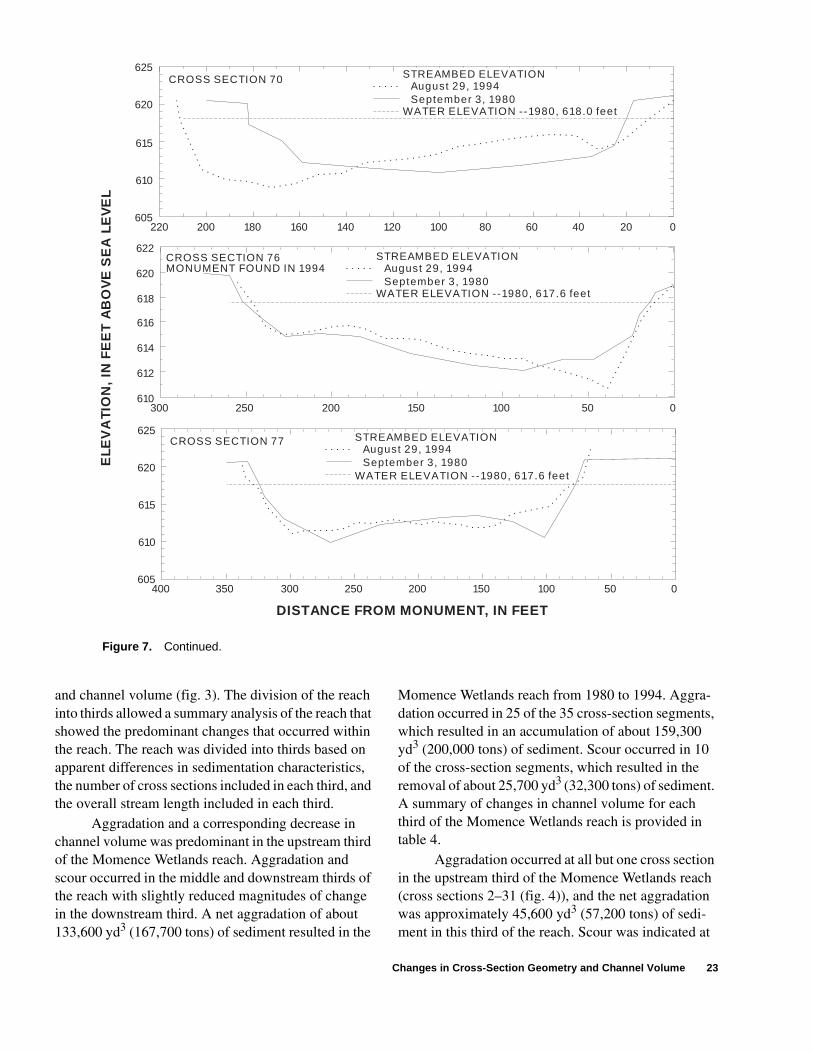
Figure 7. Continued.
August 29, 1994September 3, 1980
WATER ELEVATION --1980, 618.0 feet
August 29, 1994September 3, 1980
WATER ELEVATION --1980, 617.6 feet
August 29, 1994September 3, 1980
WATER ELEVATION --1980, 617.6 feet
ELE
VA
TIO
N,
IN F
EE
T A
BO
VE
SE
A L
EV
EL
DISTANCE FROM MONUMENT, IN FEET
CROSS SECTION 70
CROSS SECTION 76 MONUMENT FOUND IN 1994
CROSS SECTION 77
625
605
610
615
620
0220 20406080100120140160180200
610
622
612
614
616
618
620
0300 50100150200250
605
625
610
615
620
0400 50100150200250300350
STREAMBED ELEVATION
STREAMBED ELEVATION
STREAMBED ELEVATION
and channel volume (fig. 3). The division of the reach into thirds allowed a summary analysis of the reach that showed the predominant changes that occurred within the reach. The reach was divided into thirds based on apparent differences in sedimentation characteristics, the number of cross sections included in each third, and the overall stream length included in each third.
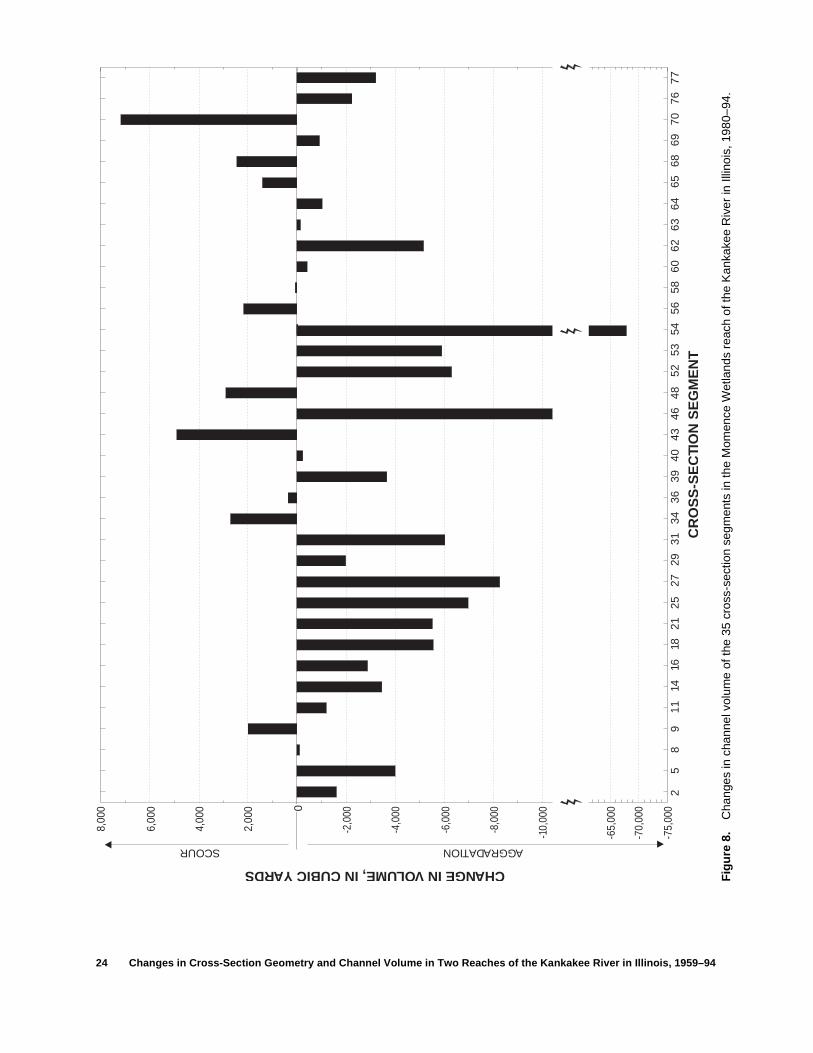
Aggradation and a corresponding decrease in channel volume was predominant in the upstream third of the Momence Wetlands reach. Aggradation and scour occurred in the middle and downstream thirds of the reach with slightly reduced magnitudes of change in the downstream third. A net aggradation of about 133,600 yd3 (167,700 tons) of sediment resulted in the
Momence Wetlands reach from 1980 to 1994. Aggra-dation occurred in 25 of the 35 cross-section segments, which resulted in an accumulation of about 159,300 yd3 (200,000 tons) of sediment. Scour occurred in 10 of the cross-section segments, which resulted in the removal of about 25,700 yd3 (32,300 tons) of sediment. A summary of changes in channel volume for each third of the Momence Wetlands reach is provided in table 4.
Aggradation occurred at all but one cross section in the upstream third of the Momence Wetlands reach (cross sections 2–31 (fig. 4)), and the net aggradation was approximately 45,600 yd3 (57,200 tons) of sedi-ment in this third of the reach. Scour was indicated at
24 Changes in Cross-Section Geometry and Channel Volume in Two Reaches of the Kankakee River in Illinois, 1959–94
Fig
ure
8.
Cha
nges
in c
hann
el v
olum
e of
the
35 c
ross
-sec
tion
segm
ents
in th
e M
omen
ce W
etla
nds
reac
h of
the
Kan
kake
e R
iver
in Il
linoi
s, 1
980–
94.
25
89
1114
1618
2125
2729
3134
3639
4043
4648
5253
5456
5860
6263
6465
6869
7076
77
-75,
000
-70,
000
-65,
000
8,00
0
-10,
000
-8,0
00
-6,0
00
-4,0
00
-2,0
00
2,00
0
4,00
0
6,00
0
CHANGE IN VOLUME, IN CUBIC YARDS
CR
OS
S-S
EC
TIO
N S
EG
ME
NT
SCOUR AGGRADATION
0
Changes in Cross-Section Geometry and Channel Volume 25
Tab
le 4
.S
umm
ary
of c
hang
es in
cha
nnel
geo
met
ry a
nd v
olum
e fo
r th
e M
omen
ce W
etla
nds
reac
h of
the
Kan
kake
e R
iver
in Il
linoi
s, 1
980–
94
[Vol
umes
exp
ress
ed a
s cu
bic
yard
s]
Up
stre
am t
hir
dM
idd
le t
hir
dD
ow
nst
ream
th
ird
Per
iod
Tota
ln
um
ber
of
cro
ssse
ctio
ns
Nu
mb
er o
fcr
oss
sect
ion
s w
ith
agg
rad
atio
n(a
nd
vo
lum
e)
Nu
mb
er o
fcr
oss
sect
ion
s w
ith
sco
ur
(an
dvo
lum
e)
Net
chan
ge
invo
lum
e
Tota
ln
um
ber
of
cro
ssse
ctio
ns
Nu
mb
er o
fcr
oss
sect
ion
s w
ith
agg
rad
atio
n(a
nd
vo
lum
e)
Nu
mb
er o
fcr
oss
sect
ion
s w
ith
sco
ur
(an
dvo
lum
e)
Net
chan
ge
invo
lum
e
Tota
ln
um
ber
of
cro
ssse
ctio
ns
Nu
mb
er o
fcr
oss
sect
ion
s w
ith
agg
rad
atio
n(a
nd
vo
lum
e)
Nu
mb
er o
fcr
oss
sect
ion
s w
ith
sco
ur
(an
dvo
lum
e)
Net
chan
ge
invo
lum
e
1980
–94
1312
(47
,600
)1
(2,0
00)
−45,
600
116
(98,
600)
5 (1
2,90
0)−8
5,70
011
7 (1
3,10
0)4
(10,
800)
-2,3
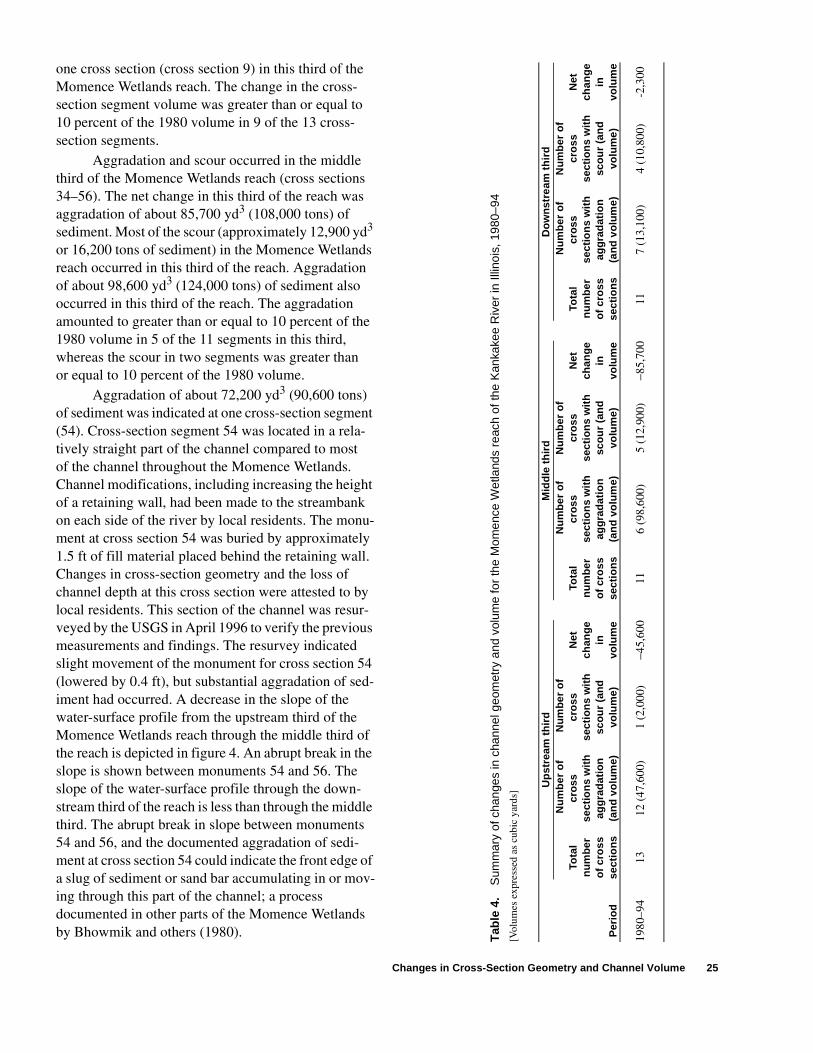
00one cross section (cross section 9) in this third of the Momence Wetlands reach. The change in the cross-section segment volume was greater than or equal to 10 percent of the 1980 volume in 9 of the 13 cross-section segments.
Aggradation and scour occurred in the middle third of the Momence Wetlands reach (cross sections 34–56). The net change in this third of the reach was aggradation of about 85,700 yd3 (108,000 tons) of sediment. Most of the scour (approximately 12,900 yd3
or 16,200 tons of sediment) in the Momence Wetlands reach occurred in this third of the reach. Aggradation of about 98,600 yd3 (124,000 tons) of sediment also occurred in this third of the reach. The aggradation amounted to greater than or equal to 10 percent of the 1980 volume in 5 of the 11 segments in this third, whereas the scour in two segments was greater than or equal to 10 percent of the 1980 volume.
Aggradation of about 72,200 yd3 (90,600 tons) of sediment was indicated at one cross-section segment (54). Cross-section segment 54 was located in a rela-tively straight part of the channel compared to most of the channel throughout the Momence Wetlands. Channel modifications, including increasing the height of a retaining wall, had been made to the streambank on each side of the river by local residents. The monu-ment at cross section 54 was buried by approximately 1.5 ft of fill material placed behind the retaining wall. Changes in cross-section geometry and the loss of channel depth at this cross section were attested to by local residents. This section of the channel was resur-veyed by the USGS in April 1996 to verify the previous measurements and findings. The resurvey indicated slight movement of the monument for cross section 54 (lowered by 0.4 ft), but substantial aggradation of sed-iment had occurred. A decrease in the slope of the water-surface profile from the upstream third of the Momence Wetlands reach through the middle third of the reach is depicted in figure 4. An abrupt break in the slope is shown between monuments 54 and 56. The slope of the water-surface profile through the down-stream third of the reach is less than through the middle third. The abrupt break in slope between monuments 54 and 56, and the documented aggradation of sedi-ment at cross section 54 could indicate the front edge of a slug of sediment or sand bar accumulating in or mov-ing through this part of the channel; a process documented in other parts of the Momence Wetlands by Bhowmik and others (1980).
26 Changes in Cross-Section Geometry and Channel Volume in Two Reaches of the Kankakee River in Illinois, 1959–94
Changes in cross-section geometry and channel volume in the downstream third of the Momence Wet-lands reach (cross sections 58–77) were not as marked as in the other two-thirds of the reach. In the down-stream third, aggradation of approximately 13,100 yd3 (16,450 tons) of sediment and scour of approximately 10,800 yd3 (13,600 tons) of sediment yielded a net aggradation of approximately 2,300 yd3 (2,890 tons) of sediment. Eleven cross-section segments were included in the downstream third of the reach. There was only one segment in which aggradation was greater than or equal to 10 percent of the 1980 volume and only one segment in which the scour was greater than or equal to 10 percent of the 1980 volume.
Aggradation likely results in the upstream one-third of the Momence Wetlands reach because of the transition from a straight river channel in Indiana to a mostly natural meandering river channel in Illinois. The slope of the Kankakee River channel in Indiana is approximately 1.06 ft/mi, based on flood-profile data (T.K. Greeman, U.S. Geological Survey, written com-mun., 1995). The slope of the channel through the Momence Wetlands reach is about 1.6 ft/mi, 1.1 ft/mi, and 0.5 ft/mi, respectively, for the upstream, middle, and downstream thirds, based on water-surface eleva-tions. The channelized river in Indiana provides a com-paratively efficient conveyance for water and sediment transport compared to the natural channel in Illinois. The capability of the stream to transport sediment through the Momence Wetlands is reduced as a result of a decrease in flow velocity. Consequently, the amount of sediment held in suspension in the water exceeds the capability of the stream to carry sediment, and the excess sediment settles onto the streambed.
Sediment also is transported along the streambed. The downstream movement of a sandbar at the Illinois-Indiana State line was documented by Bhowmik and others (1980). It is reasonable to assume that this process occurs to some extent on a continual basis throughout the Momence Wetlands reach. This process likely contributes to the change in cross-section geometry and the decreases in channel depths noted by local residents and users of the river.
Six-Mile Pool Reach
Cross-section measurements of the Six-Mile Pool reach were made periodically from 1959 to 1994. Data from these measurements allow an analysis of changes in cross-section geometry and channel volume
over a period of 3 decades. Similar to the river channel in the Momence Wetlands, the morphology of the Six-Mile Pool is in a dynamic process of change. The com-parisons of cross-section measurements indicate only the net change between the measurement times. Changes in the Six-Mile Pool reach can be more readily determined than in the Momence Wetlands reach because measurements were made five times from 1959 to 1994. The locations of the 29 cross sections in the Six-Mile Pool reach are shown in figure 5.
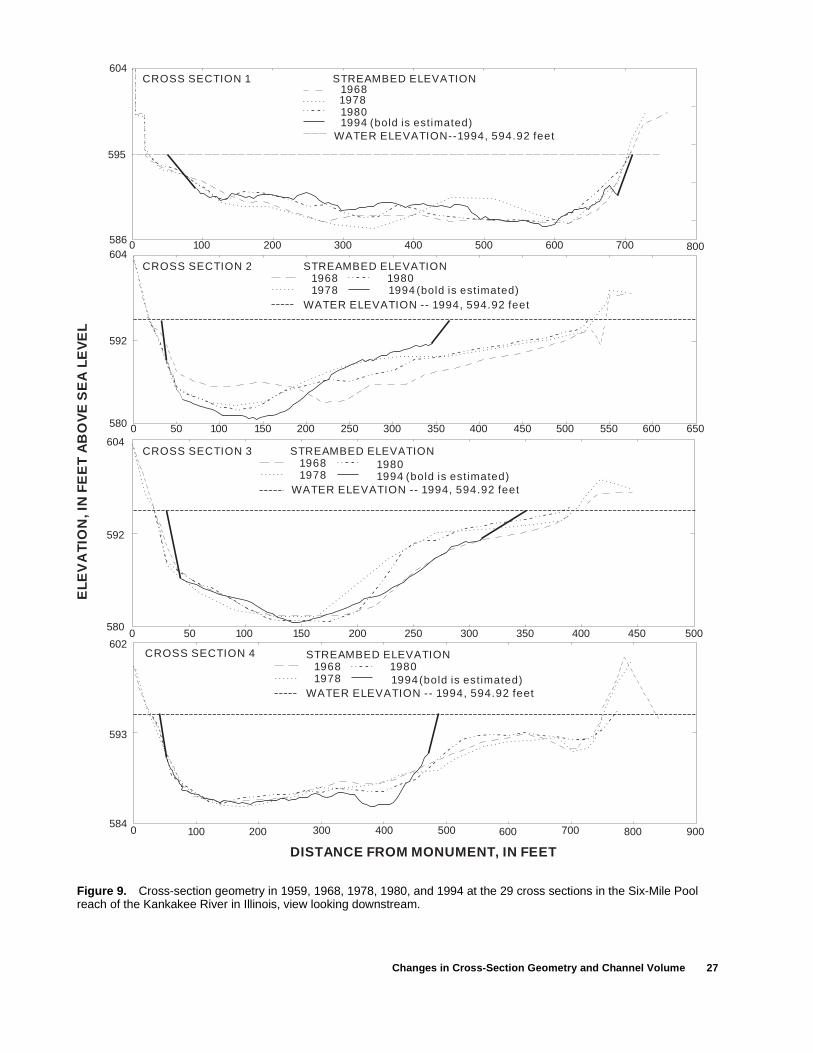
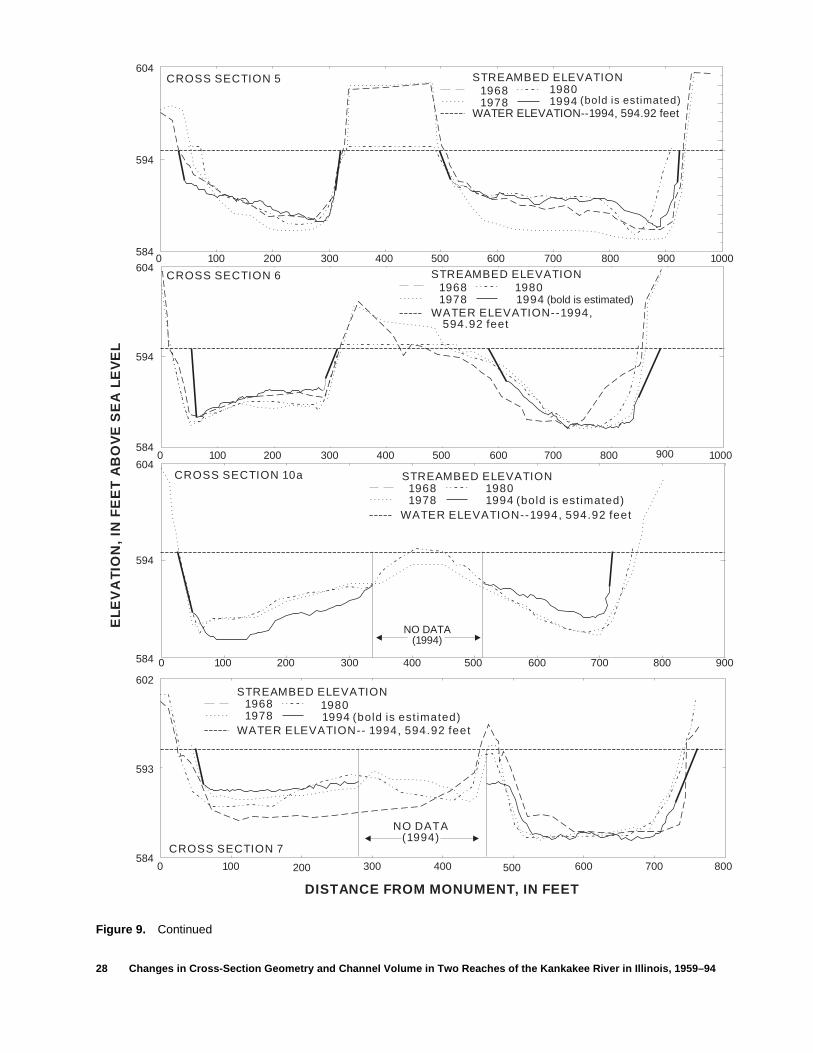
Graphs of the cross-section geometry at 29 cross sections in the Six-Mile Pool reach for 1959, 1968, 1978, 1980, and 1994 are shown in figure 9. Three cross sections previously measured are not included in the analysis—one cross section was not measured in 1994, the data for a second cross section was found to contain errors and was not used, and the third cross section was excluded because only one-half of the cross section could be measured because of shallow water on one side of an island. The Fathometer used to make the cross-section measurements in 1994 did not provide accurate depth information when depths were less than about 3 ft. Cross-section geometry for the edges of the channel, therefore, was estimated based on historical and 1994 geometry, channel characteristics, hydrologic judgement and interpretation, field notes, and observations. Field notes from the 1994 measure-ments included estimated distances from the stopping point of the Fathometer readings to the edge of the water on each side of the channel and along the islands. Matching of cross-section plots from different years was based on visual interpretation, field notes, and observations. The cross-section plots were adjusted horizontally but not vertically, and the adjustments did not affect calculations of cross-section area or channel volume.
The water-surface elevation in 1994 was used as the upper boundary for the cross-section area calcula-tions. The 1980 cross-section measurements did not extend above the 1994 water-surface elevation for many of the cross sections, and extrapolation and inter-pretation of the 1994 geometry above the 1994 water-surface elevation would have introduced additional uncertainty into the calculations and analysis. Cross-section segments for the Six-Mile Pool reach were determined in the same manner as for the Momence Wetlands reach.
The Six-Mile Pool reach, as with the Momence Wetlands reach, was divided into thirds for analysis.
Changes in Cross-Section Geometry and Channel Volume 27
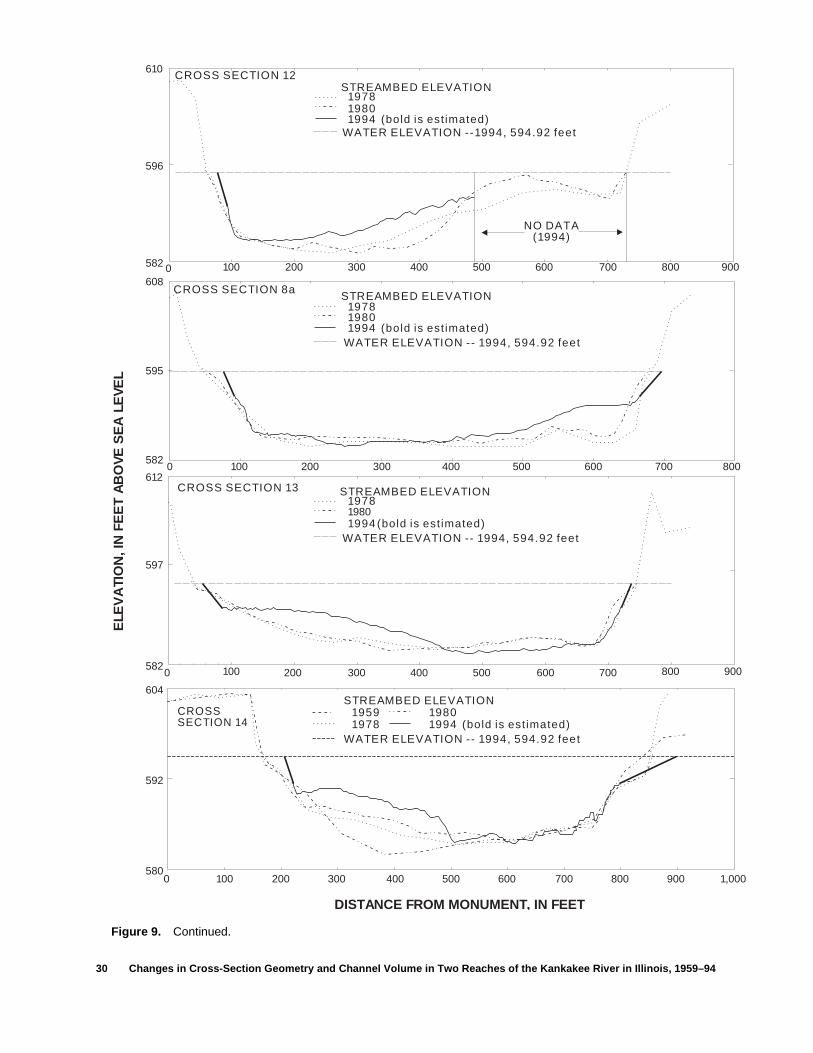
Figure 9. Cross-section geometry in 1959, 1968, 1978, 1980, and 1994 at the 29 cross sections in the Six-Mile Pool reach of the Kankakee River in Illinois, view looking downstream.
CROSS SECTION 2
CROSS SECTION 3
CROSS SECTION 4
EL
EV
AT
ION
, IN
FE
ET
AB
OV
E S
EA
LE
VE
L
DISTANCE FROM MONUMENT, IN FEET
604
584
5800 50 100 150 200 250 300 350 400 450 500
0 50 100 150 200 250 300 350 400 450 500 550 600 650580
0 100 200 300 400 500 600 700 800 900
592
592
593
602
CROSS SECTION 1
0 100 200 300 400 500 600 700 800586
595
604
604
1978
WATER ELEVATION--1994, 594.92 feet
1968
19801994
STREAMBED ELEVATION
(bold is estimated)
19681978
WATER ELEVATION -- 1994, 594.92 feet
19801994
STREAMBED ELEVATION
(bold is estimated)
19681978
WATER ELEVATION -- 1994, 594.92 feet
19801994
STREAMBED ELEVATION
(bold is estimated)
19681978
WATER ELEVATION -- 1994, 594.92 feet
19801994
STREAMBED ELEVATION
(bold is estimated)
28 Changes in Cross-Section Geometry and Channel Volume in Two Reaches of the Kankakee River in Illinois, 1959–94
Figure 9. Continued
19681978
WATER ELEVATION--1994, 594.92 feet
19801994
STREAMBED ELEVATION
(bold is estimated)
19681978
WATER ELEVATION--1994, 594.92 feet
19801994
STREAMBED ELEVATION
(bold is estimated)
19681978
WATER ELEVATION--1994, 594.92 feet
19801994
STREAMBED ELEVATION
(bold is est imated)
19681978
WATER ELEVATION-- 1994, 594.92 feet
19801994
STREAMBED ELEVATION
(bold is est imated)
CROSS SECTION 5
CROSS SECTION 6
CROSS SECTION 10a
CROSS SECTION 7
EL
EV
AT
ION
, IN
FE
ET
AB
OV
E S
EA
LE
VE
L
DISTANCE FROM MONUMENT, IN FEET
604
584
584
0 100 200 300 400 500 600 700 800 900
0 100 200 300 400 500 600 700 800 900 1000
584
5840 100 200 300 400 500 600 700 800
0 100 200 300 400 500 600 700 800 900 1000
594
594
593
594
602
604
604
NO DATA(1994)
NO DATA(1994)
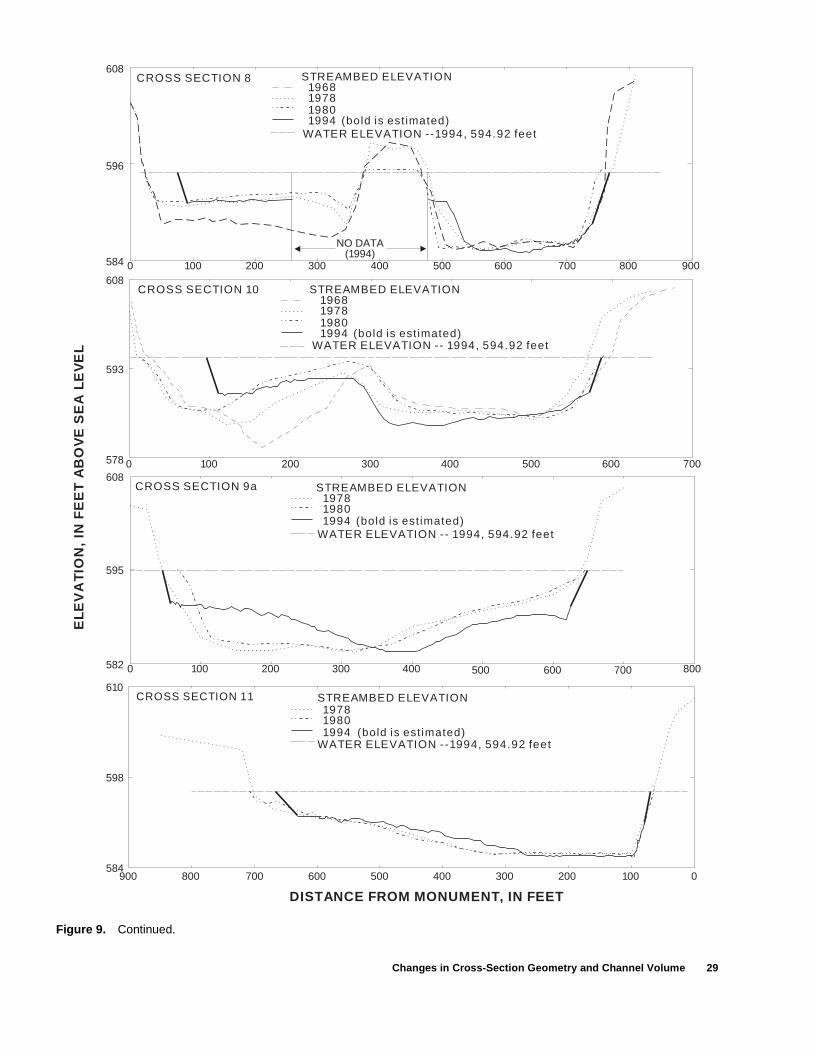
Changes in Cross-Section Geometry and Channel Volume 29
Figure 9. Continued.
CROSS SECTION 8
CROSS SECTION 9a
CROSS SECTION 11
EL
EV
AT
ION
, IN
FE
ET
AB
OV
E S
EA
LE
VE
L
DISTANCE FROM MONUMENT, IN FEET
608
608
584
578
0 100 200 300 400 500 600 700 800
0 100 200 300 400 500 600 700
582
5840100200300400500600700800900
0 100 200 300 400 500 600 700 800 900
598
593
596
595
610
608
CROSS SECTION 10
NO DATA(1994)
WATER ELEVATION -- 1994, 594.92 feet
19781968
19801994
STREAMBED ELEVATION
(bold is est imated)
WATER ELEVATION -- 1994, 594.92 feet
197819801994
STREAMBED ELEVATION
(bold is est imated)
WATER ELEVATION --1994, 594.92 feet
197819801994
STREAMBED ELEVATION
(bold is est imated)
WATER ELEVATION --1994, 594.92 feet
19781968
19801994
STREAMBED ELEVATION
(bold is est imated)
30 Changes in Cross-Section Geometry and Channel Volume in Two Reaches of the Kankakee River in Illinois, 1959–94
Figure 9. Continued.
19591978
WATER ELEVATION -- 1994, 594.92 feet
19801994
STREAMBED ELEVATION
(bold is est imated)
WATER ELEVATION --1994, 594.92 feet
WATER ELEVATION -- 1994, 594.92 feet
1978
1978
1980
1980
1994
1994
STREAMBED ELEVATION
STREAMBED ELEVATION
(bold is est imated)
(bold is est imated)
CROSS SECTION 12
CROSS SECTION 13
CROSSSECTION 14
ELE
VA
TIO
N, I
N F
EE
T A
BO
VE
SE
A L
EV
EL
DISTANCE FROM MONUMENT, IN FEET
610
608
582
0 100 200 300 400 500 600 700 800 900
0 100 200 300 400 500 600 700 800582
582
5800 100 200 300 400 500 600 700 800 900 1,000
0 100 200 300 400 500 600 700 800 900
592
596
595
604
597
612
CROSS SECTION 8a
NO DATA(1994)
WATER ELEVATION -- 1994, 594.92 feet
197819801994
STREAMBED ELEVATION
(bold is est imated)
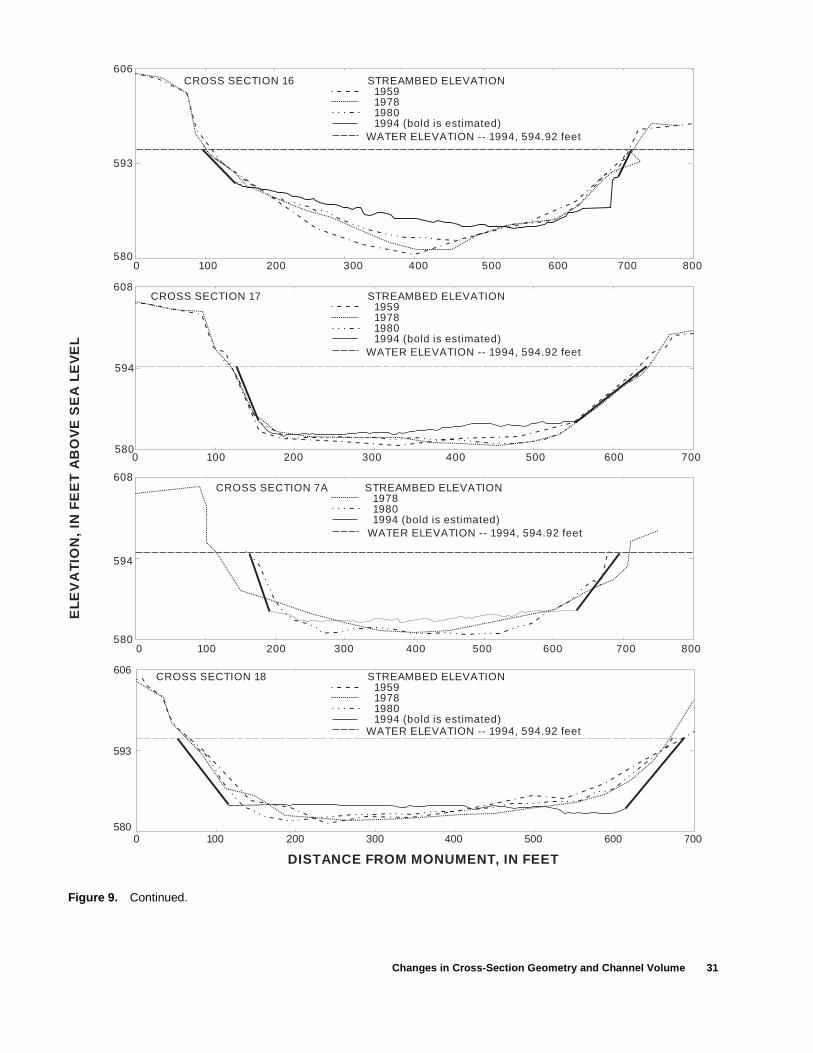
Changes in Cross-Section Geometry and Channel Volume 31
Figure 9. Continued.
STREAMBED ELEVATION
WATER ELEVATION -- 1994, 594.92 feet
1959197819801994 (bold is estimated)
606
593
5800 100 200 300 400 500 600 700 800
CROSS SECTION 16
STREAMBED ELEVATION
WATER ELEVATION -- 1994, 594.92 feet
1959197819801994 (bold is estimated)
608
594
5800 100 200 300 400 500 600 700
CROSS SECTION 17
STREAMBED ELEVATION
WATER ELEVATION -- 1994, 594.92 feet
197819801994 (bold is estimated)
608
594
5800 100 200 300 400 500 600 700 800
CROSS SECTION 7A
STREAMBED ELEVATION
WATER ELEVATION -- 1994, 594.92 feet
1959197819801994 (bold is estimated)
CROSS SECTION 18606
593
5800 100 200 300 400 500 600 700
EL
EV
AT
ION
, IN
FE
ET
AB
OV
E S
EA
LE
VE
L
DISTANCE FROM MONUMENT, IN FEET
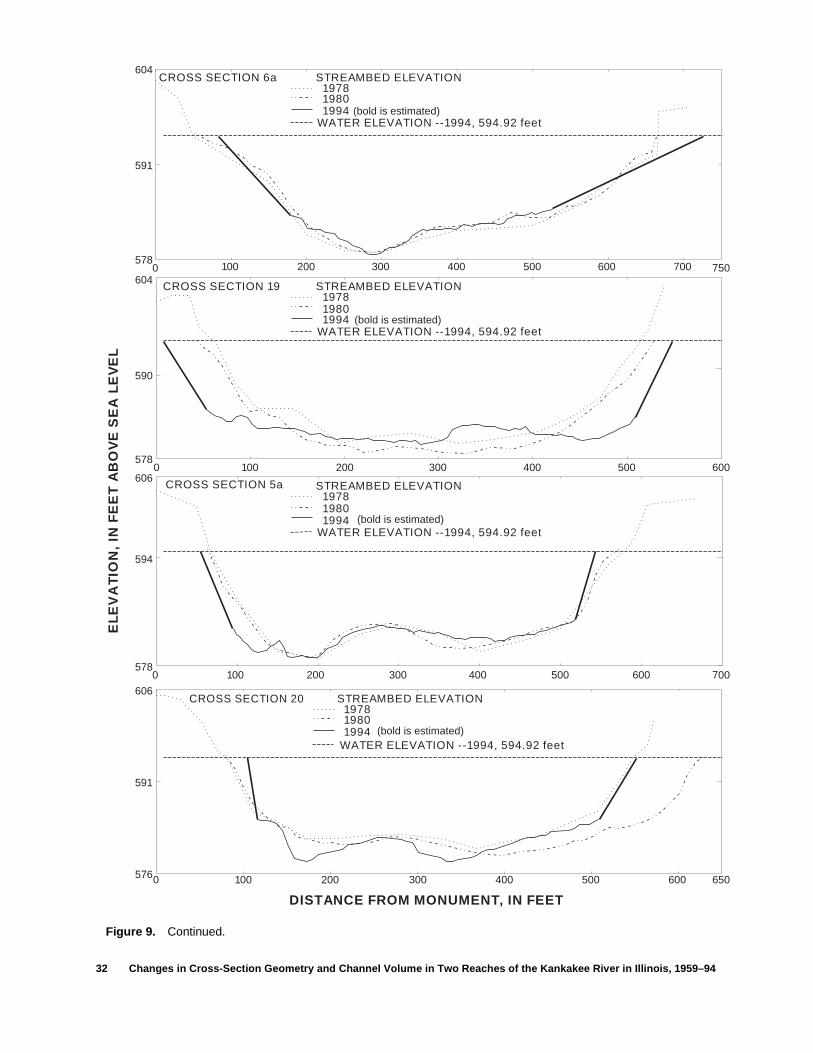
32 Changes in Cross-Section Geometry and Channel Volume in Two Reaches of the Kankakee River in Illinois, 1959–94
CROSS SECTION 6a
CROSS SECTION 5a
EL
EV
AT
ION
, IN
FE
ET
AB
OV
E S
EA
LE
VE
L
DISTANCE FROM MONUMENT, IN FEET
578
0 100 200 300 400 500 600 700
0 100 200 300 400 500 600578
578
576 0 100 200 300 400 500 600 650
0 100 200 300 400 500 600 700 750
591
590
591
594
606
606
604
604CROSS SECTION 19
CROSS SECTION 20
WATER ELEVATION --1994, 594.92 feet
197819801994
STREAMBED ELEVATION
(bold is estimated)
(bold is estimated)
(bold is estimated)
(bold is estimated)
WATER ELEVATION --1994, 594.92 feet
197819801994
STREAMBED ELEVATION
WATER ELEVATION --1994, 594.92 feet
197819801994
STREAMBED ELEVATION
WATER ELEVATION --1994, 594.92 feet
197819801994
STREAMBED ELEVATION
Figure 9. Continued.
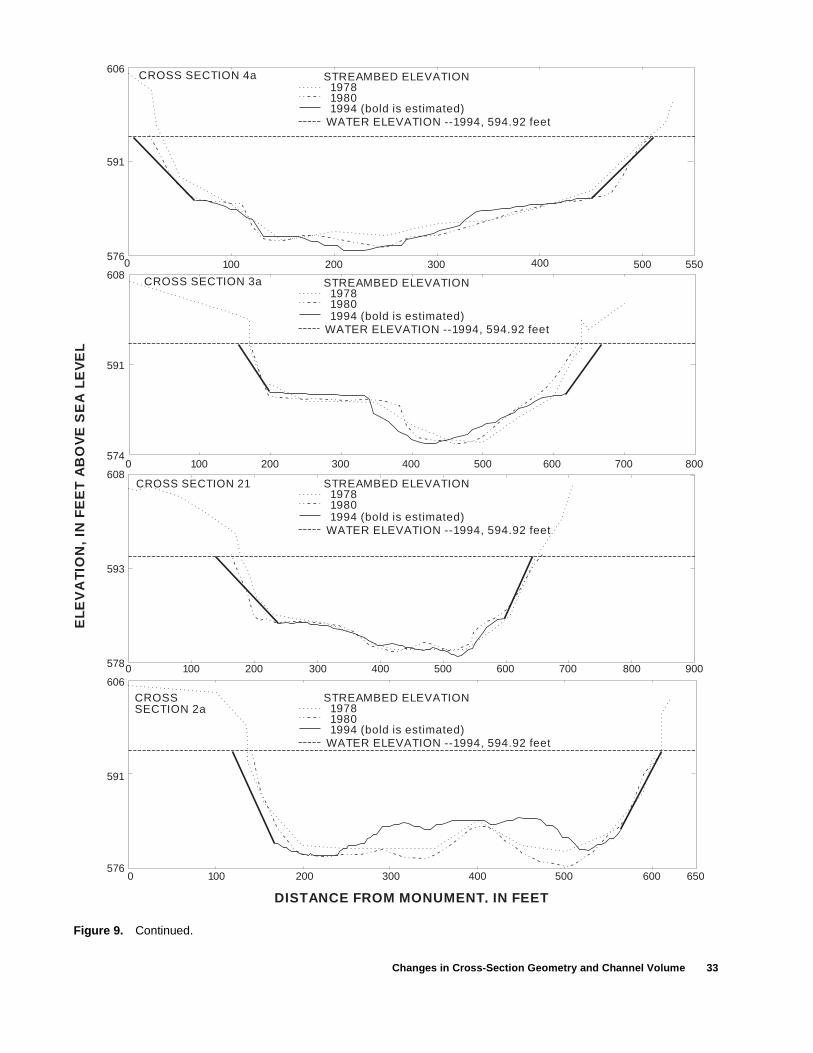
Changes in Cross-Section Geometry and Channel Volume 33
Figure 9. Continued.
WATER ELEVATION --1994, 594.92 feet
197819801994 (bold is estimated)
STREAMBED ELEVATION
WATER ELEVATION --1994, 594.92 feet
197819801994 (bold is estimated)
STREAMBED ELEVATION
WATER ELEVATION --1994, 594.92 feet
197819801994 (bold is estimated)
STREAMBED ELEVATION
WATER ELEVATION --1994, 594.92 feet
197819801994 (bold is estimated)
STREAMBED ELEVATION
CROSS SECTION 3a
CROSSSECTION 2a
EL
EV
AT
ION
, IN
FE
ET
AB
OV
E S
EA
LE
VE
L
DISTANCE FROM MONUMENT, IN FEET
608
576
0 100 200 300 400 500 600 700 800 900
0 100 200 300 400 500 600 700 800574
578
5760 100 200 300 400 500 600 650
0 100 200 300 400 500 550
591
591
591
593
606
606
608
CROSS SECTION 4a
CROSS SECTION 21
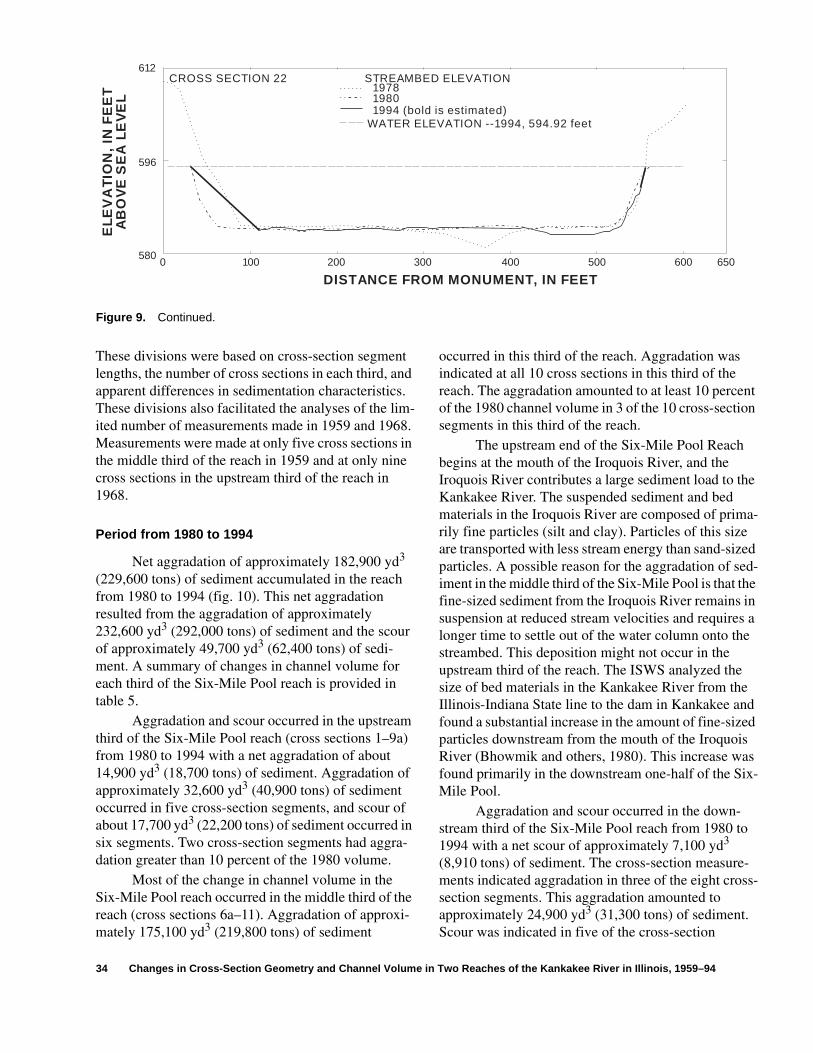
34 Changes in Cross-Section Geometry and Channel Volume in Two Reaches of the Kankakee River in Illinois, 1959–94
Figure 9. Continued.
WATER ELEVATION --1994, 594.92 feet
197819801994 (bold is estimated)
STREAMBED ELEVATIONCROSS SECTION 22
EL
EV
AT
ION
, IN
FE
ET
A
BO
VE
SE
A L
EV
EL
DISTANCE FROM MONUMENT, IN FEET
612
5800 100 200 300 400 500 600 650
596
These divisions were based on cross-section segment lengths, the number of cross sections in each third, and apparent differences in sedimentation characteristics. These divisions also facilitated the analyses of the lim-ited number of measurements made in 1959 and 1968. Measurements were made at only five cross sections in the middle third of the reach in 1959 and at only nine cross sections in the upstream third of the reach in 1968.
Period from 1980 to 1994
Net aggradation of approximately 182,900 yd3 (229,600 tons) of sediment accumulated in the reach from 1980 to 1994 (fig. 10). This net aggradation resulted from the aggradation of approximately 232,600 yd3 (292,000 tons) of sediment and the scour of approximately 49,700 yd3 (62,400 tons) of sedi-ment. A summary of changes in channel volume for each third of the Six-Mile Pool reach is provided in table 5.
Aggradation and scour occurred in the upstream third of the Six-Mile Pool reach (cross sections 1–9a) from 1980 to 1994 with a net aggradation of about 14,900 yd3 (18,700 tons) of sediment. Aggradation of approximately 32,600 yd3 (40,900 tons) of sediment occurred in five cross-section segments, and scour of about 17,700 yd3 (22,200 tons) of sediment occurred in six segments. Two cross-section segments had aggra-dation greater than 10 percent of the 1980 volume.
Most of the change in channel volume in the Six-Mile Pool reach occurred in the middle third of the reach (cross sections 6a–11). Aggradation of approxi-mately 175,100 yd3 (219,800 tons) of sediment
occurred in this third of the reach. Aggradation was indicated at all 10 cross sections in this third of the reach. The aggradation amounted to at least 10 percent of the 1980 channel volume in 3 of the 10 cross-section segments in this third of the reach.
The upstream end of the Six-Mile Pool Reach begins at the mouth of the Iroquois River, and the Iroquois River contributes a large sediment load to the Kankakee River. The suspended sediment and bed materials in the Iroquois River are composed of prima-rily fine particles (silt and clay). Particles of this size are transported with less stream energy than sand-sized particles. A possible reason for the aggradation of sed-iment in the middle third of the Six-Mile Pool is that the fine-sized sediment from the Iroquois River remains in suspension at reduced stream velocities and requires a longer time to settle out of the water column onto the streambed. This deposition might not occur in the upstream third of the reach. The ISWS analyzed the size of bed materials in the Kankakee River from the Illinois-Indiana State line to the dam in Kankakee and found a substantial increase in the amount of fine-sized particles downstream from the mouth of the Iroquois River (Bhowmik and others, 1980). This increase was found primarily in the downstream one-half of the Six-Mile Pool.
Aggradation and scour occurred in the down-stream third of the Six-Mile Pool reach from 1980 to 1994 with a net scour of approximately 7,100 yd3 (8,910 tons) of sediment. The cross-section measure-ments indicated aggradation in three of the eight cross-section segments. This aggradation amounted to approximately 24,900 yd3 (31,300 tons) of sediment. Scour was indicated in five of the cross-section
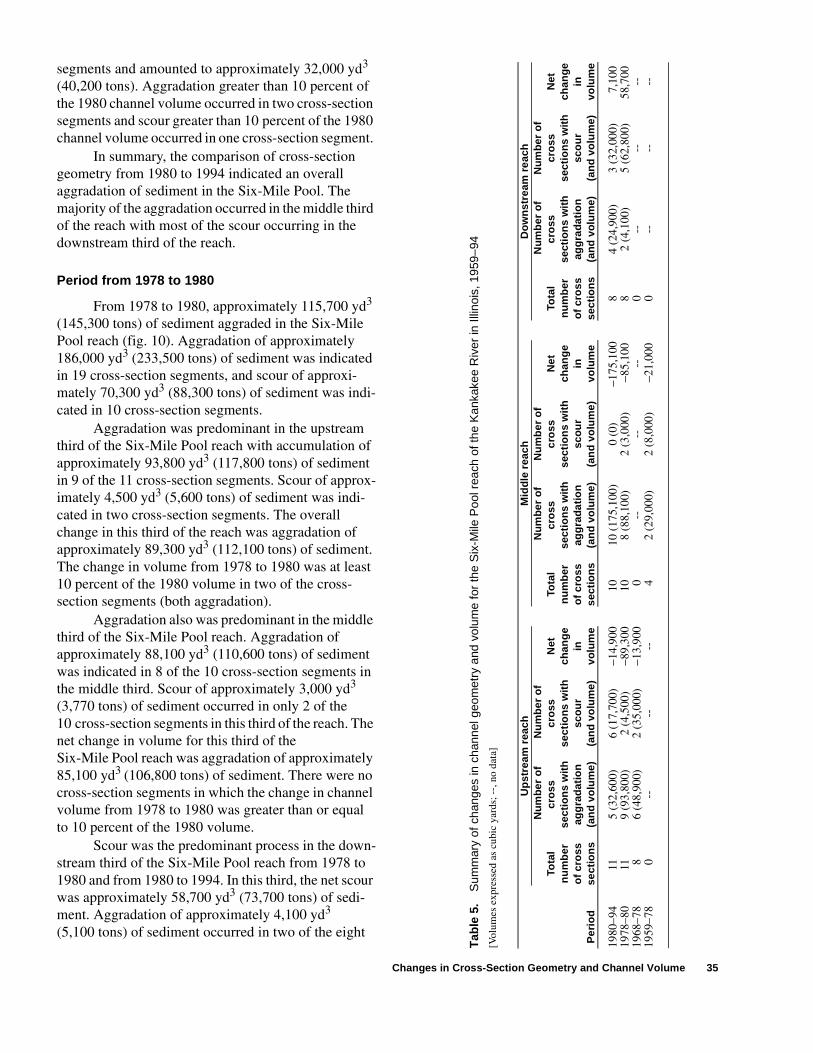
Changes in Cross-Section Geometry and Channel Volume 35
Tab
le 5
.S
umm
ary
of c
hang
es in
cha
nnel
geo
met
ry a
nd v
olum
e fo
r th
e S
ix-M
ile P
ool r
each
of t
he K
anka
kee
Riv
er in
Illin
ois,
195
9–94
[Vol
umes
exp
ress
ed a
s cu
bic
yard
s; -
-, n
o da
ta]
Up
stre
am r
each
Mid
dle
rea
chD
ow
nst
ream
rea
ch
Per
iod
Tota
ln
um
ber
of
cro
ssse
ctio
ns
Nu
mb
er o
fcr
oss
sect
ion
s w
ith
agg
rad
atio
n(a
nd
vo
lum
e)
Nu
mb
er o
fcr
oss
sect
ion
s w
ith
sco
ur
(an
d v
olu
me)
Net
chan
ge
invo
lum
e
Tota
ln
um
ber
of
cro
ssse
ctio
ns
Nu
mb
er o
fcr
oss
sect
ion
s w
ith
agg
rad
atio
n(a
nd
vo
lum
e)
Nu
mb
er o
fcr
oss
sect
ion
s w
ith
sco
ur
(an
d v
olu
me)
Net
chan
ge
invo
lum
e
Tota
ln
um
ber
of
cro
ssse
ctio
ns
Nu
mb
er o
fcr
oss
sect
ion
s w
ith
agg
rad
atio
n(a
nd
vo
lum
e)
Nu
mb
er o
fcr
oss
sect
ion
s w
ith
sco
ur
(an
d v
olu
me)
Net
chan
ge
invo
lum
e
1980
–94
115
(32,
600)
6 (1
7,70
0)−1
4,90
010
10 (
175,
100)
0 (0
)−1
75,1
008
4 (2
4,90
0)3
(32,
000)
7,10
019
78–8
011
9 (9
3,80
0)2
(4,5
00)
−89,
300
108
(88,
100)
2 (3
,000
)−8
5,10
08
2 (4
,100
)5
(62,
800)
58,7
0019
68–7
88
6 (4
8,90
0)2
(35,
000)
−13,
900
0--
----
0--
----
1959
–78
0--
----
42
(29,
000)
2 (8
,000
)−2
1,00
00
----
--
segments and amounted to approximately 32,000 yd3 (40,200 tons). Aggradation greater than 10 percent of the 1980 channel volume occurred in two cross-section segments and scour greater than 10 percent of the 1980 channel volume occurred in one cross-section segment.
In summary, the comparison of cross-section geometry from 1980 to 1994 indicated an overall aggradation of sediment in the Six-Mile Pool. The majority of the aggradation occurred in the middle third of the reach with most of the scour occurring in the downstream third of the reach.
Period from 1978 to 1980
From 1978 to 1980, approximately 115,700 yd3 (145,300 tons) of sediment aggraded in the Six-Mile Pool reach (fig. 10). Aggradation of approximately 186,000 yd3 (233,500 tons) of sediment was indicated in 19 cross-section segments, and scour of approxi-mately 70,300 yd3 (88,300 tons) of sediment was indi-cated in 10 cross-section segments.
Aggradation was predominant in the upstream third of the Six-Mile Pool reach with accumulation of approximately 93,800 yd3 (117,800 tons) of sediment in 9 of the 11 cross-section segments. Scour of approx-imately 4,500 yd3 (5,600 tons) of sediment was indi-cated in two cross-section segments. The overall change in this third of the reach was aggradation of approximately 89,300 yd3 (112,100 tons) of sediment. The change in volume from 1978 to 1980 was at least 10 percent of the 1980 volume in two of the cross-section segments (both aggradation).
Aggradation also was predominant in the middle third of the Six-Mile Pool reach. Aggradation of approximately 88,100 yd3 (110,600 tons) of sediment was indicated in 8 of the 10 cross-section segments in the middle third. Scour of approximately 3,000 yd3 (3,770 tons) of sediment occurred in only 2 of the 10 cross-section segments in this third of the reach. The net change in volume for this third of the Six-Mile Pool reach was aggradation of approximately 85,100 yd3 (106,800 tons) of sediment. There were no cross-section segments in which the change in channel volume from 1978 to 1980 was greater than or equal to 10 percent of the 1980 volume.
Scour was the predominant process in the down-stream third of the Six-Mile Pool reach from 1978 to 1980 and from 1980 to 1994. In this third, the net scour was approximately 58,700 yd3 (73,700 tons) of sedi-ment. Aggradation of approximately 4,100 yd3 (5,100 tons) of sediment occurred in two of the eight
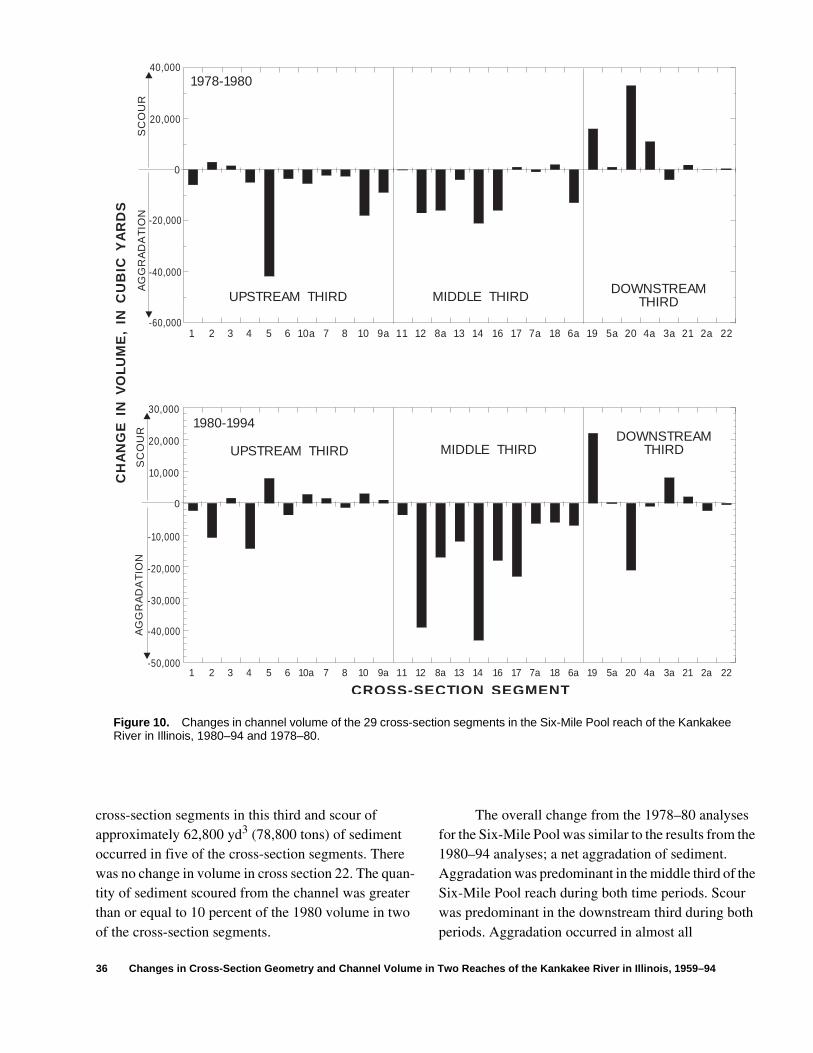
36 Changes in Cross-Section Geometry and Channel Volume in Two Reaches of the Kankakee River in Illinois, 1959–94
Figure 10. Changes in channel volume of the 29 cross-section segments in the Six-Mile Pool reach of the Kankakee River in Illinois, 1980–94 and 1978–80.
1 2 3 4 5 6 10a 7 8 10 9a 11 12 8a 13 14 16 17 7a 18 6a 19 5a 20 4a 3a 21 2a 22
40,000
-60,000
-40,000
-20,000
20,000
1 2 3 4 5 6 10a 7 8 10 9a 11 12 8a 13 14 16 17 7a 18 6a 19 5a 20 4a 3a 21 2a 22
CROSS-SECTION SEGMENT
30,000
-50,000
-40,000
-30,000
-20,000
-10,000
10,000
20,000
CH
AN
GE
IN
VO
LU
ME
, IN
CU
BIC
YA
RD
S
0
0
AG
GR
AD
AT
ION
AG
GR
AD
AT
ION
SC
OU
RS
CO
UR
1978-1980
1980-1994
UPSTREAM THIRD
UPSTREAM THIRD
MIDDLE THIRD
MIDDLE THIRD
DOWNSTREAM THIRD
DOWNSTREAM THIRD
cross-section segments in this third and scour of approximately 62,800 yd3 (78,800 tons) of sediment occurred in five of the cross-section segments. There was no change in volume in cross section 22. The quan-tity of sediment scoured from the channel was greater than or equal to 10 percent of the 1980 volume in two of the cross-section segments.
The overall change from the 1978–80 analyses for the Six-Mile Pool was similar to the results from the 1980–94 analyses; a net aggradation of sediment. Aggradation was predominant in the middle third of the Six-Mile Pool reach during both time periods. Scour was predominant in the downstream third during both periods. Aggradation occurred in almost all
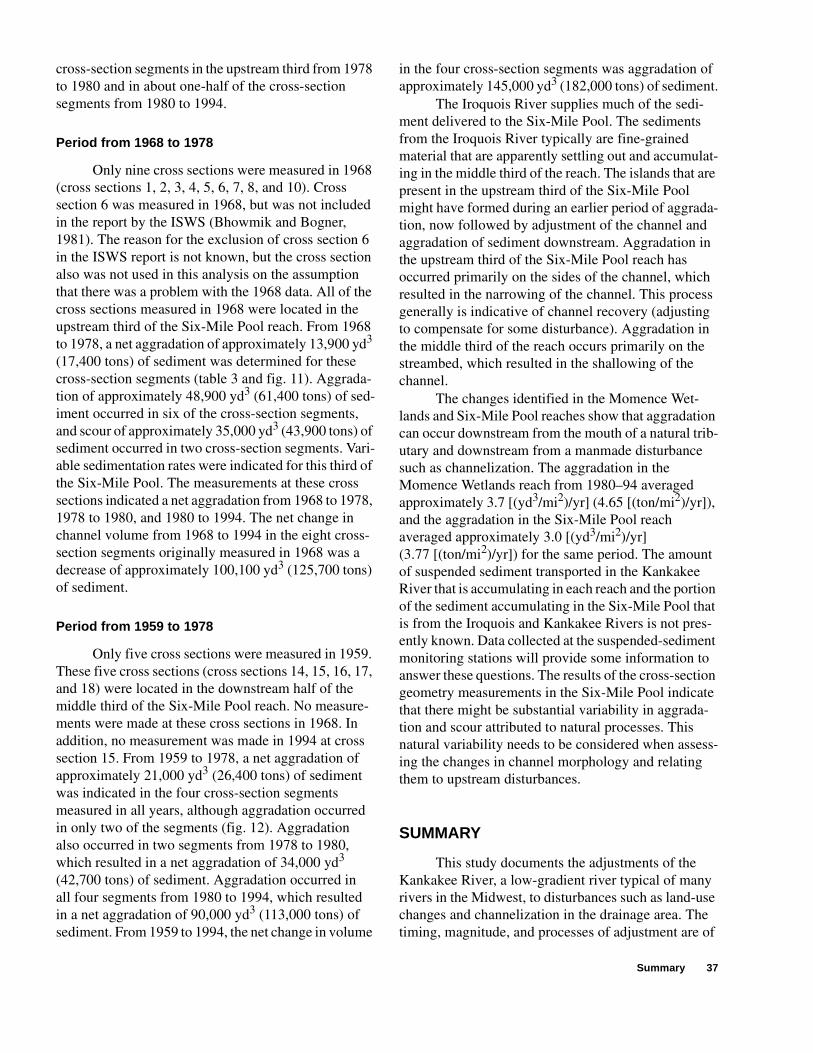
Summary 37
cross-section segments in the upstream third from 1978 to 1980 and in about one-half of the cross-section segments from 1980 to 1994.
Period from 1968 to 1978
Only nine cross sections were measured in 1968 (cross sections 1, 2, 3, 4, 5, 6, 7, 8, and 10). Cross section 6 was measured in 1968, but was not included in the report by the ISWS (Bhowmik and Bogner, 1981). The reason for the exclusion of cross section 6 in the ISWS report is not known, but the cross section also was not used in this analysis on the assumption that there was a problem with the 1968 data. All of the cross sections measured in 1968 were located in the upstream third of the Six-Mile Pool reach. From 1968 to 1978, a net aggradation of approximately 13,900 yd3 (17,400 tons) of sediment was determined for these cross-section segments (table 3 and fig. 11). Aggrada-tion of approximately 48,900 yd3 (61,400 tons) of sed-iment occurred in six of the cross-section segments, and scour of approximately 35,000 yd3 (43,900 tons) of sediment occurred in two cross-section segments. Vari-able sedimentation rates were indicated for this third of the Six-Mile Pool. The measurements at these cross sections indicated a net aggradation from 1968 to 1978, 1978 to 1980, and 1980 to 1994. The net change in channel volume from 1968 to 1994 in the eight cross-section segments originally measured in 1968 was a decrease of approximately 100,100 yd3 (125,700 tons) of sediment.
Period from 1959 to 1978
Only five cross sections were measured in 1959. These five cross sections (cross sections 14, 15, 16, 17, and 18) were located in the downstream half of the middle third of the Six-Mile Pool reach. No measure-ments were made at these cross sections in 1968. In addition, no measurement was made in 1994 at cross section 15. From 1959 to 1978, a net aggradation of approximately 21,000 yd3 (26,400 tons) of sediment was indicated in the four cross-section segments measured in all years, although aggradation occurred in only two of the segments (fig. 12). Aggradation also occurred in two segments from 1978 to 1980, which resulted in a net aggradation of 34,000 yd3 (42,700 tons) of sediment. Aggradation occurred in all four segments from 1980 to 1994, which resulted in a net aggradation of 90,000 yd3 (113,000 tons) of sediment. From 1959 to 1994, the net change in volume
in the four cross-section segments was aggradation of approximately 145,000 yd3 (182,000 tons) of sediment.
The Iroquois River supplies much of the sedi-ment delivered to the Six-Mile Pool. The sediments from the Iroquois River typically are fine-grained material that are apparently settling out and accumulat-ing in the middle third of the reach. The islands that are present in the upstream third of the Six-Mile Pool might have formed during an earlier period of aggrada-tion, now followed by adjustment of the channel and aggradation of sediment downstream. Aggradation in the upstream third of the Six-Mile Pool reach has occurred primarily on the sides of the channel, which resulted in the narrowing of the channel. This process generally is indicative of channel recovery (adjusting to compensate for some disturbance). Aggradation in the middle third of the reach occurs primarily on the streambed, which resulted in the shallowing of the channel.
The changes identified in the Momence Wet-lands and Six-Mile Pool reaches show that aggradation can occur downstream from the mouth of a natural trib-utary and downstream from a manmade disturbance such as channelization. The aggradation in the Momence Wetlands reach from 1980–94 averaged approximately 3.7 [(yd3/mi2)/yr] (4.65 [(ton/mi2)/yr]), and the aggradation in the Six-Mile Pool reach averaged approximately 3.0 [(yd3/mi2)/yr] (3.77 [(ton/mi2)/yr]) for the same period. The amount of suspended sediment transported in the Kankakee River that is accumulating in each reach and the portion of the sediment accumulating in the Six-Mile Pool that is from the Iroquois and Kankakee Rivers is not pres-ently known. Data collected at the suspended-sediment monitoring stations will provide some information to answer these questions. The results of the cross-section geometry measurements in the Six-Mile Pool indicate that there might be substantial variability in aggrada-tion and scour attributed to natural processes. This natural variability needs to be considered when assess-ing the changes in channel morphology and relating them to upstream disturbances.
SUMMARY
This study documents the adjustments of the Kankakee River, a low-gradient river typical of many rivers in the Midwest, to disturbances such as land-use changes and channelization in the drainage area. The timing, magnitude, and processes of adjustment are of
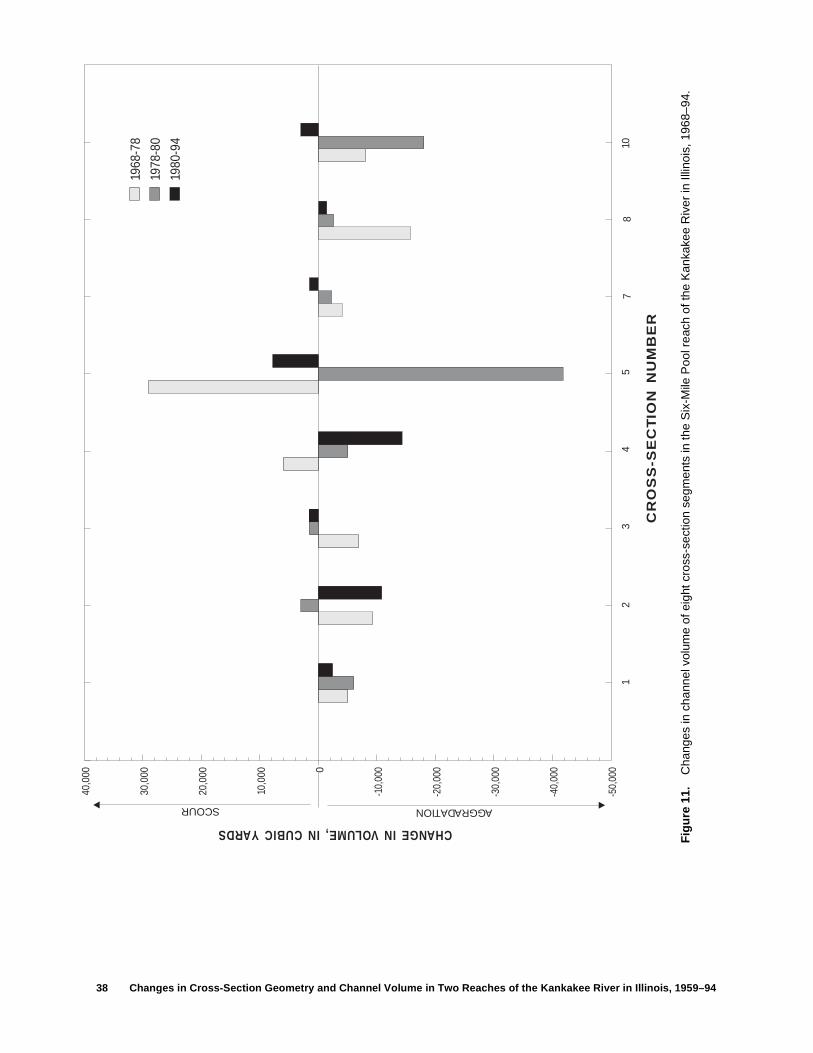
38 Changes in Cross-Section Geometry and Channel Volume in Two Reaches of the Kankakee River in Illinois, 1959–94
Fig
ure
11.
Cha
nges
in c
hann
el v
olum
e of
eig
ht c
ross
-sec
tion
segm
ents
in th
e S
ix-M
ile P
ool r
each
of t
he K
anka
kee
Riv
er in
Illin
ois,
196
8–94
.
12
34
57
810
CR
OS
S-S
EC
TIO
N N
UM
BE
R
40,0
00
-50,
000
-40,
000
-30,
000
-20,
000
-10,
000
10,0
00
20,0
00
30,0
00
CHANGE IN VOLUME, IN CUBIC YARDS
1968
-78
1978
-80
1980
-94
0
SCOUR AGGRADATION
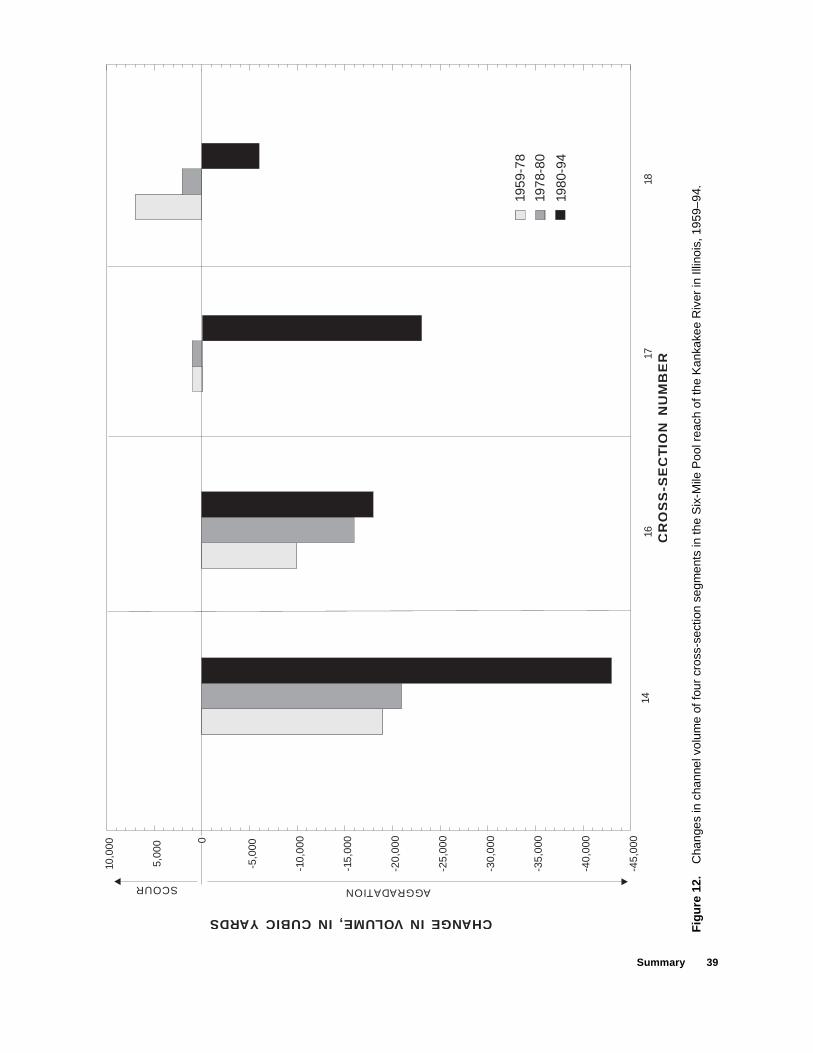
Summary 39
Fig
ure
12.
Cha
nges
in c
hann
el v
olum
e of
four
cro
ss-s
ectio
n se
gmen
ts in
the
Six
-Mile
Poo
l rea
ch o
f the
Kan
kake
e R
iver
in Il
linoi
s, 1
959–
94.
10,0
00
-45,
000
-40,
000
-35,
000
-30,
000
-25,
000
-20,
000
-15,
000
-10,
000
-5,0
00
5,00
0
CHANGE IN VOLUME, IN CUBIC YARDS
1416
1718
CR
OS
S-S
EC
TIO
N N
UM
BE
R
1959
-78
1978
-80
1980
-94
0
SCOUR AGGRADATION
40 Changes in Cross-Section Geometry and Channel Volume in Two Reaches of the Kankakee River in Illinois, 1959–94
interest in developing better understanding of how dis-turbances are conveyed through alluvial stream systems in agricultural areas and how such stream systems adjust to these disturbances.
Two distinct reaches of the Kankakee River channel in Illinois were used in an analysis to deter-mine changes in cross-section geometry and channel volume from 1959 to 1994. The first reach extended from the Illinois-Indiana State line downstream to the mouth of Singleton Ditch near Momence, Ill. In this reach, known as the Momence Wetlands, the river channel meanders approximately 6.4 mi through a largely undisturbed forested area. The second reach of the river used for this study was a pooled reach extend-ing from the dam in Kankakee, Ill., upstream to the mouth of the Iroquois River. This reach generally is referred to as the Six-Mile Pool, although it is actually about 4.3-mi long.
In the Momence Wetlands, the Illinois State Water Survey (ISWS) made cross-section measure-ments at 36 locations in 1980, and the U.S. Geological Survey (USGS) made measurements at the same loca-tions in 1994. In the Six-Mile Pool, cross-section mea-surements were made by the Illinois Department of Natural Resources, Office of Water Resources in 1959, 1968, and 1978; by the ISWS in 1980; and by the USGS in 1994. Only 4 cross sections were measured in 1959 and, subsequently, only 10 cross sections were measured in 1968 and in subsequent years.
Changes in cross-section geometry and channel volume were determined by comparing historical and recent (1994) cross-section measurements. Differences in cross-section area between time periods were deter-mined and multiplied by the length of the river channel represented by any particular cross section to derive estimates of changes in channel volume. The Momence Wetlands reach and the Six-Mile Pool reach were divided into thirds to facilitate the analysis, based on apparent sedimentation characteristics.
In the Momence Wetlands reach, an overall aggradation of approximately 133,600 yd3 (167,700 tons) of sediment occurred from 1980 to 1994. This net aggradation was the result of the aggradation of about 159,300 yd3 (200,000 tons) of sediment in 25 cross-section segments and scour of about 25,700 yd3 (32,300 tons) of sediment in 10 cross-section segments. Most of the aggradation occurred in the upstream third of the Momence Wetlands reach with aggradation and scour occurring in the middle and downstream thirds.
The magnitude of changes was least in the downstream third of the reach.
A net aggradation of sediment in the Six-Mile Pool from 1980 to 1994 also was determined. Approximately 182,900 yd3 (229,600 tons) of sedi-ment accumulated in the reach during this period. This net aggradation resulted from the accumulation of about 232,600 yd3 (292,000 tons) of sediment and the scour of about 49,700 yd3 (62,400 tons) of sediment. Most of the aggradation in the Six-Mile Pool reach occurred in the middle third of the reach, whereas all 10 cross sections indicated aggradation. Aggradation and scour occurred in the upstream and downstream thirds, but scour was predominant in each of these thirds of the reach.
From 1978 to 1980, a net aggradation of sedi-ment was determined for the Six-Mile Pool reach. Aggradation of approximately 115,700 yd3 (145,300 tons) of sediment occurred in the reach during these 2 years. This net aggradation resulted from aggradation of approximately 186,000 yd3 (233,500 tons) of sediment and from scour of about 70,300 yd3 (88,300 tons) of sediment. Aggradation was predominant in the upstream and middle thirds of the reach, whereas scour was predominant in the downstream third.
Eight cross sections were measured in the Six-Mile Pool reach in 1968. These cross sections were located in the upstream third of the reach. From 1968 to 1978, a net aggradation of sediment in the Six-Mile Pool reach amounting to approximately 13,900 yd3 (17,400 tons) in these 10 cross-section segments. The measurements at these cross sections indicated aggra-dation from 1968 to 1978, 1978 to 1980, and 1980 to 1994. A net aggradation of approximately 100,100 yd3 (125,700 tons) of sediment was determined in the nine cross-section segments from 1968 to 1994.
Only five cross sections were measured in 1959, and only four of these were measured in 1994. These cross sections were located in the middle third of the Six-Mile Pool reach. From 1959 to 1978, a net aggra-dation of approximately 21,000 yd3 (26,400 tons) of sediment was determined in the four cross-section seg-ments. A net aggradation of sediment was determined in the four segments from 1978 to 1980 and from 1980 to 1994. From 1959 to 1994, the net change in volume in the four cross-section segments was an aggradation of approximately 145,000 yd3 (182,000 tons) of sediment.
References Cited 41
REFERENCES CITED
Bhowmik, N.G., and Bogner, W.C., 1981, Sediment trans-port and hydraulics of flow in the Kankakee River, Illinois - Phase II: Illinois State Water Survey Contract Report 282, 67 p.
Bhowmik, N.G., Bonini, A.P., Bogner, W.C., and Byrne, W.C., 1980, Hydraulics of flow and sediment transport in the Kankakee River in Illinois: Illinois State Water Survey, Report of Investigation 98, 181 p.
Gross, D.L., and Berg, R.C., 1981, Geology of the Kankakee River system in Kankakee County, Illinois: Illinois Institute of Natural Resources, State Geological Survey Division, Environmental Geology Notes 92, 80 p.
Houde, M.J., and Klasey, John, 1968, Of the people, a history of Kankakee County: Chicago, Ill., The General Printing Company, 436 p.
Ivens, J.L., Bhowmik, N.G., Brighan, A.R., and Gross, D.L., 1981, The Kankakee River yesterday and today: Illinois State Water Survey Miscellaneous Publication 60, 24 p.
Jacobson, R.B., 1995, Spatial controls on pattern of land-use induced stream disturbance at the drainage-basin scale—An example from gravel-bed streams of the
Ozark Plateaus, Missouri: American Geophysical Union Geophysical Monograph, p. 219–239.
Lane, E.W. and Koelzer, V.A., 1953, Density of sediments deposited in reservoirs, Report no. 9 of a study of methods used in measurement and analysis of sediment loads in streams: St. Paul, Minn., U.S. Army Corps of Engineers, St. Paul Engineering District.
Meade, R. H., 1985, Wavelike movement of bedload sedi-ment, East Fork River, Wyoming: Environmental Geology and Water Sciences, v. 7, no. 4, p. 215–255.
SEG Engineers and Consultants, Inc., 1989, Kankakee River master plan: A guide for flood control and land use alternatives in Indiana: Highland, Ind., prepared for the Kankakee River Basin Commission, 79 p.
U.S. House of Representatives, 1916, Kankakee River, Illinois and Indiana: Letter from the Secretary of War, U.S. Congress, 64th, 1st session, Document 931.
———1931, Kankakee River, Illinois and Indiana: Letter from the Secretary of War, U.S. Congress, 71st, 3rd session, Document 784.
Vanoni, V.A., Editor, 1975, Sedimentation engineering: American Society of Civil Engineers, New York, 745 p.