Embed Size (px)
Citation preview
Research article
696 The Journal of Clinical Investigation http://www.jci.org Volume 124 Number 2 February 2014
Changes in neural network homeostasis trigger neuropsychiatric symptoms
Aline Winkelmann,1,2 Nicola Maggio,3 Joanna Eller,4 Gürsel Caliskan,5 Marcus Semtner,2 Ute Häussler,6 René Jüttner,7 Tamar Dugladze,4 Birthe Smolinsky,8 Sarah Kowalczyk,8
Ewa Chronowska,9 Günter Schwarz,8 Fritz G. Rathjen,7 Gideon Rechavi,10 Carola A. Haas,6,11 Akos Kulik,9,12 Tengis Gloveli,4,13 Uwe Heinemann,5 and Jochen C. Meier2
1FU-Berlin, Fachbereich Biologie, Chemie, Pharmazie, Berlin, Germany. 2RNA editing and Hyperexcitability Disorders Helmholtz Group, Max Delbrück Center for Molecular Medicine, Berlin, Germany. 3Talpiot Medical Leadership Program,
Department of Neurology and the J. Sagol Neuroscience Center, The Chaim Sheba Medical Center, Tel HaShomer, Israel. 4Cellular and Network Physiology Group, Institute of Neurophysiology, Charité Universitätsmedizin Berlin, Berlin, Germany. 5CC2 Zentrum für Physiologie,
Freie Universität Berlin, Berlin, Germany. 6Experimental Epilepsy Research, Department of Neurosurgery, Neurocenter, University of Freiburg, Freiburg, Germany. 7Developmental Neurobiology, Max Delbrück Center for Molecular Medicine, Berlin, Germany. 8Institute of Biochemistry,
University of Cologne and Center for Molecular Medicine, Cologne, Germany. 9Department of Physiology II, University of Freiburg, Freiburg, Germany. 10Sheba Cancer Research Center, The Chaim Sheba Medical Center and Sackler Faculty of Medicine, Tel Aviv University, Tel Aviv, Israel.
11BrainLinks-BrainTools, Cluster of Excellence and 12BIOSS Centre for Biological Signalling Studies, University of Freiburg, Freiburg, Germany. 13Bernstein Center for Computational Neuroscience Berlin, Berlin, Germany.
The mechanisms that regulate the strength of synaptic transmission and intrinsic neuronal excitability are well characterized; however, the mechanisms that promote disease-causing neural network dysfunction are poorly defined. We generated mice with targeted neuron type–specific expression of a gain-of-function variant of the neurotransmitter receptor for glycine (GlyR) that is found in hippocampectomies from patients with temporal lobe epilepsy. In this mouse model, targeted expression of gain-of-function GlyR in terminals of glutamatergic cells or in parvalbumin-positive interneurons persistently altered neural network excitability. The increased network excitability associated with gain-of-function GlyR expression in glutamatergic neurons resulted in recurrent epileptiform discharge, which provoked cognitive dysfunction and memory deficits without affect-ing bidirectional synaptic plasticity. In contrast, decreased network excitability due to gain-of-function GlyR expression in parvalbumin-positive interneurons resulted in an anxiety phenotype, but did not affect cognitive performance or discriminative associative memory. Our animal model unveils neuron type–specific effects on cognition, formation of discriminative associative memory, and emotional behavior in vivo. Furthermore, our data identify a presynaptic disease–causing molecular mechanism that impairs homeostatic regulation of neural network excitability and triggers neuropsychiatric symptoms.
IntroductionResearch has established a solid basis for our understanding of how different nerve cells interact, assemble into functional units, and influence behavior and mood (1–4). High-frequency oscillation of the neuronal membrane potential creates permissive time windows for induction of sensory context–dependent bidirectional plasticity of glutamatergic synaptic transmission (1, 5, 6), which is a synaptic correlate of discriminative associative memory (6–9). Thus, temporal precision of neuronal inputs relative to the actual membrane poten-tial is an important determinant of information coding and memory formation (5, 10–12). GABAergic synaptic transmission is equally relevant for cognitive function, because GABAergic interneurons regulate neuronal excitability and provide a spatiotemporal control framework for the timing of synaptic glutamatergic transmission. Fast-spiking (parvalbumin-positive) interneurons, for example, regu-late hippocampal neural network oscillation in cognitively relevant high–gamma frequency ranges (13, 14). In conjunction with other interneuron types, they form a precision clockwork without which cortical operations are not possible (15, 16). Thus, spatiotemporal coordination of glutamatergic and GABAergic synaptic transmission is essential for sensory processing and cognitive performance.
Homeostatic plasticity in the somatodendritic neuronal com-partment is known to regulate synaptic strength in order to keep the neuronal gain within physiological limits (17, 18). Nonetheless, impaired neural network homeostasis is associated with a pleth-ora of clinical symptoms of neuropsychiatric disorders (1, 19–21) including cognitive dysfunction and various symptoms of mood disorders in patients with epilepsy (22, 23), which raises the ques-tion of identifying the responsible molecular and cellular mecha-nisms that are able to subvert homeostatic control of synaptic transmission and neural network excitability in disease conditions.
Glycine receptor (GlyR) α3 is a pathogenic molecular candidate, because changes in RNA processing of this subunit are associated with the pathophysiology of epilepsy (24–26). In fact, expression of RNA-edited GlyR α3 is increased in patients with temporal lobe epilepsy and leads to P185L amino acid substitution and neu-rotransmitter receptor gain of function. Furthermore, it has been established that the RNA-spliced long GlyR α3L variant is prepon-derantly expressed in the hippocampus of patients with epilepsy and shows particular synaptic clustering and physiological receptor properties (27, 28). To address the question of whether α3L185L-GlyR triggers clinical symptoms of epilepsy, we generated a correspond-ing knockin mouse model and investigated the neuron type–specific functional impact of this particular molecule on bidirectional syn-aptic plasticity, network excitability and gamma oscillatory activity,
Conflict of interest: The authors have declared that no conflict of interest exists.
Citation for this article: J Clin Invest. 2014;124(2):696–711. doi:10.1172/JCI71472.
research article
The Journal of Clinical Investigation http://www.jci.org Volume 124 Number 2 February 2014 697
cognitive function, discriminative associative memory, and mood-related behavior. We show that the L-splice insert in GlyR α3L inter-acts with SEC8, a member of the exocyst protein family of vesicular trafficking factors, and equips spliced α3L GlyRs with axonal and presynaptic trafficking signals. We observed that presynaptic GlyR α3L185L exerted an excitatory function by facilitating neurotransmit-ter release, which increased the functional weight of neurons in the network. Functional enhancement of glutamatergic neurons elicit-ed neural network hyperexcitability and recurrent epileptiform dis-charge (large population of field excitatory postsynaptic potentials [EPSPs]), thereby impairing cognitively relevant gamma oscillatory network activity, cognitive function, and discriminative associative memory without influencing the bidirectional plasticity of gluta-matergic synaptic transmission. Further, we found that functional enhancement of parvalbumin-positive interneurons reduced neural network excitability, impaired long-term depression of glutamater-gic synaptic transmission, and triggered anxiety-related behavior without affecting cognitive function or memory formation. Thus, increased presynaptic function is a pathogenic disease mechanism, as it is able to subvert homeostatic control of synaptic transmission and neural network excitability, persistently affect neural network homeostasis, and trigger neuropsychiatric symptoms reminiscent of the epilepsy psychopathology.
ResultsRNA splicing regulates axonal expression of GlyR α3. Hippocampal GlyRs are implicated in the regulation of glutamatergic synaptic transmission (27, 29). Here, we focused on the long (L) RNA splice
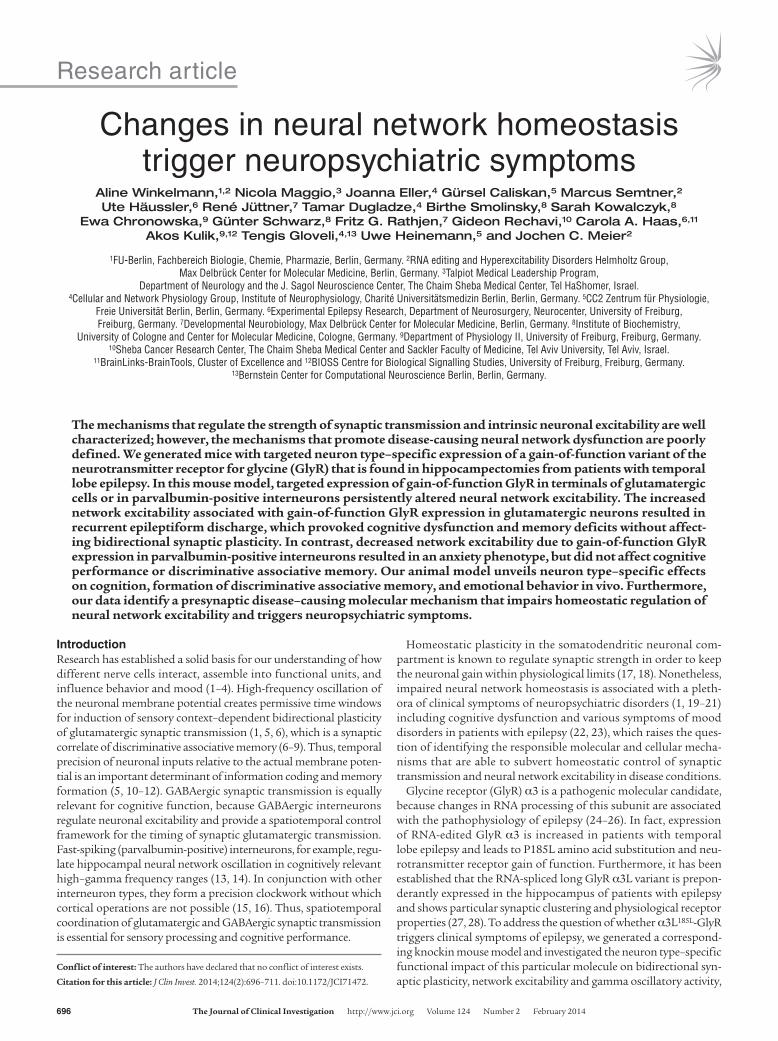
variant of GlyR α3 because of its preponderance in brain (27). Unlike the short GlyR α3K variant, GlyR α3L contains exon 8A (30, 31), which codes for the TEAFALEKFYRFSDT peptide located in the large cytoplasmic loop between transmembrane domains 3 and 4 (TM3-4). Exon 8A was shown to confer particular subcel-lular trafficking and clustering properties on GlyR α3 (27, 28). To further investigate the relevance of this exon, we searched for interaction partners of GlyR α3L. To this end, the glutathione S-transferase–tagged (GST-tagged) α3L TM3-4 loop was used for cosedimentation assays with adult mouse brain lysate and mass spectrometric fingerprint analysis (Figure 1A and Supplemental Table 1; supplemental material available online with this article; doi:10.1172/JCI71472DS1). Our approach identified the vesicular trafficking factor SEC8 as a putative determinant of subcellular GlyR α3L localization (Supplemental Table 1, Exoc4). In fact, SEC8 belongs to the exocyst complex protein family of vesicular traffick-ing factors and was shown to be involved in targeting membrane material to presynaptic sites (32), as with glycine transporter GlyT1 targeting to presynaptic glutamatergic terminals (33, 34). To cor-roborate that the α3L TM3-4 loop interacts with SEC8, we probed the adult mouse brain proteins that cosedimented with GST::α3L or GST::α3K for SEC8 immunoreactivity (Figure 1B and full uncut gels are shown in the Supplemental Material). Indeed, our Western blot analysis with a SEC8 antibody confirmed cosedimentation of SEC8 with the TM3-4 loop of the GlyR α3L RNA splice variant (Figure 1B), while the α3K TM3-4 loop without exon 8A was far less effective. Thus, the peptide TEAFALEKFYRFSDT encoded by exon 8A of the Glra3 gene facilitates interaction of GlyR α3 with SEC8.
Figure 1The vesicular trafficking factor SEC8 is a new interaction partner of GlyR α3L and allows axonal receptor expression. (A) Proteins interacting with GST::α3L in the presence of adult mouse brain lysate were excised and analyzed with mass spectrom-etry. Supplemental Table 1 provides a list of significant hits. (B) Western blot with an SEC8 antibody confirms the cosedimenta-tion of SEC8 with GlyR α3L and identifies the spliced exon 8A coding for TEAFALE-KFYRFSDT of GlyR α3L as the SEC8 interaction domain. Equal GST bead load-ing with α3K- or α3L-loops was verified with Coomassie staining (B, left panel). (C) SEC8 bound with the GlyR α3L TM3-4 loop in HEK293 cells. The GlyR α3 TM3-4 loop harbored an intrinsic NLS, which led to the translocation of SEC8::EGFP to the nucleus of HEK293 cells upon coexpression of the α3L-loop. (D–G) To investigate the role of SEC8 in subcellular GlyR α3L trafficking, primary hippocampal neurons were cotrans-fected with HA-tagged full-length GlyR α3L and SEC8::EGFP or EGFP. Arrows indicate the presumptive axonal compartment devoid of MAP2, and arrowheads point to the somatodendritic MAP2-positive compart-ment. Note that SEC8::EGFP coclustered with GlyR α3L in the MAP2-negative com-partment, an activity that was not observed upon coexpression of EGFP. Scale bars: 10 μm (C), and 5 μm (D–G).
research article
698 The Journal of Clinical Investigation http://www.jci.org Volume 124 Number 2 February 2014
To verify the biochemical data, we tested for the interaction of α3K/L TM3-4 loops with SEC8 in a cellular context. For this purpose, we cotransfected human embryonic kidney 293 (HEK293) cells with DsRed-Express–tagged α3K or α3L TM3-4 loops and EGFP-tagged SEC8 (Figure 1C and Supplemental Fig-ures 1–3). We performed quantification of nuclear versus cyto-plasmic fluorescence and analysis of colocalization of α3 loops and SEC8::EGFP in the nucleus using fluorescence intensity measurements within circular regions of interest and line scans (Supplemental Figure 2 and Table 1). The fact that α3 loops harbor an effective nuclear localization sequence (NLS) (ref. 35, Supplemental Figure 2A, and Table 1) was particularly useful, because coexpression of the DsRed-E–tagged GlyR α3L, not α3K, loop increased the ratio between nuclear and cytoplasmic SEC8::EGFP fluorescence (Supplemental Figure 2A and Table 1) and revealed α3L loop–dependent translocation of SEC8::EGFP to the nucleus. In agreement with the α3L loop–dependent change in the nuclear gray level ratio between integrated DsRed-E and EGFP fluorescence intensities (Table 1), line scans of nuclear fluorescence profiles and pixel-wise correlation analysis further revealed an almost perfect overlap of SEC8::EGFP and α3L-NLS::DsRed-E, but not α3K-NLS::DsRed-E (Supplemen-tal Figure 2B, C). Taken together with the observation that SEC8::EGFP expressed alone was not able to access the nucleus of HEK293 cells even when it was equipped with different NLSs (Supplemental Figures 1–3 and Table 1), these results demon-strate that the RNA splicing–dependent L insert TEAFALEK-FYRFSDT was responsible for nuclear SEC8 translocation.
Furthermore, we wanted to know whether SEC8 also influences subcellular trafficking of full-length GlyR α3L in neurons. There-fore, we coexpressed SEC8::EGFP and HA-tagged full-length GlyR α3L (27) in primary hippocampal neurons. Figure 1, D and E, shows that GlyR HA-α3L accessed the presumptive axonal com-partment (devoid of microtubule-associated protein 2 [MAP2]) when SEC8::EGFP was coexpressed, whereas GlyR HA-α3L clus-ters were retained in the MAP2-positive somatodendritic compart-ment when EGFP was coexpressed (Figure 1, F and G; arrowheads). GlyR HA-α3L clusters colocalized with SEC8::EGFP in MAP2-negative neuronal processes (Figure 1, D and E; arrows). To verify axonal trafficking of HA-α3L upon coexpression of SEC8::EGFP, we used neurofilament M to stain the axonal compartment (Sup-plemental Figure 4, A and B). Colocalized clusters of HA-α3L and SEC8::EGFP decorated the axonal arbor in 85.2% (23 of 27) of SEC8::EGFP-positive neurons, whereas a minor fraction (7.7%, 2 of 26) of EGFP-coexpressing neurons showed axonal trafficking of HA-α3L. Quantification of GlyR HA-α3L immunofluorescence using line scans in cytoplasmic, dendritic, and neurofilament M–positive axonal compartments revealed a significant SEC8::EGFP-dependent increase in axonal GlyR α3L expression (Table 2, axon/soma and axon/dendrite ratios). Pixel-wise correlation analysis of HA-α3L and SEC8::EGFP signal intensities further revealed a strong positive correlation between HA-α3L immunofluorescence and SEC8::EGFP fluorescence in axons (Supplemental Figure 4, B and C), which confirmed colocalization of both proteins. We found that a large number of colocalized, large (>1 μm in diameter) axonal GlyR HA-α3L and SEC8::EGFP clusters were associated with the
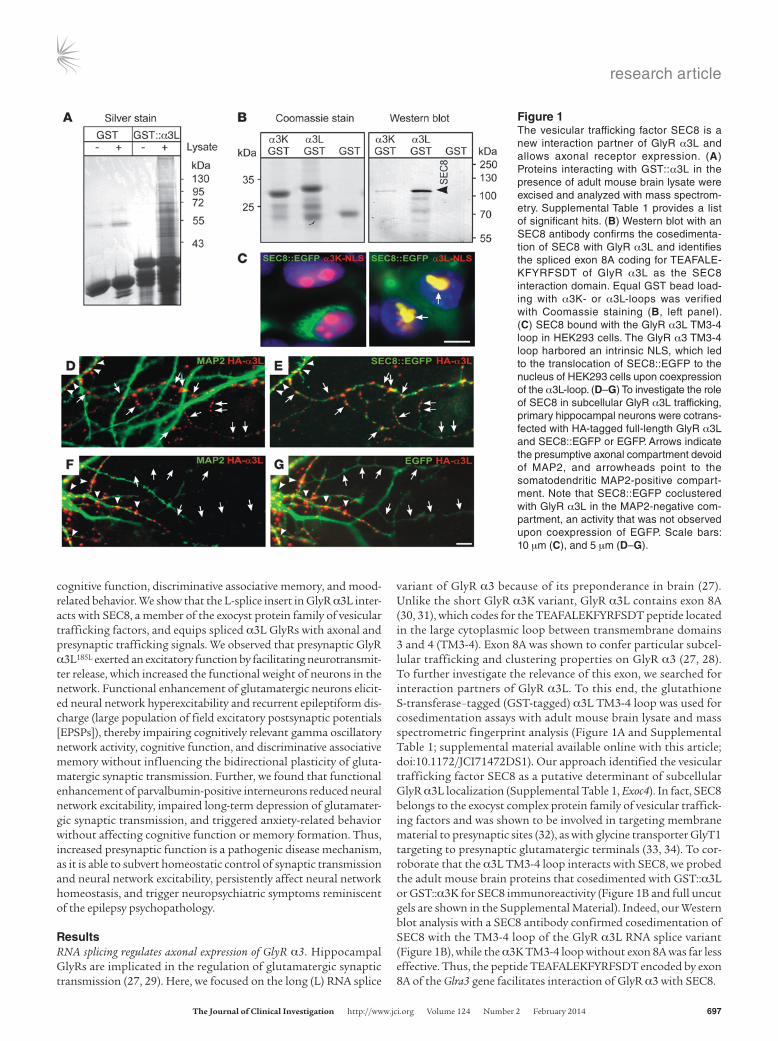
Table 1Summary of the quantification of integrated fluorescence intensities measured within circular (5 μm in diameter) regions of interest that were nucleus centered or positioned in the perinuclear cytoplasmic compartment of transfected HEK293 cells
DsRed-E gray level ratio EGFP gray level ratio Nuclear gray level ratio (nucleus/cytoplasm) (nucleus/cytoplasm) (DsRed-E/EGFP)α3K-NLS::DsRed-E 7.32 ± 0.83 (n = 40) ND NDα3L-NLS::DsRed-E 7.02 ± 0.56 (n = 40) ND NDα3K-NLS::DsRed-E SEC8::EGFP 7.55 ± 0.69 (n = 50) 0.45 ± 0.03 (n = 50) 5.90 ± 0.35 (n = 50)α3L-NLS::DsRed-E SEC8::EGFP 6.89 ± 0.41 (n = 46) 1.98 ± 0.17 (n = 46)A 1.24 ± 0.04 (n = 46)A
SEC8::EGFP ND 0.56 ± 0.03 (n = 43) NDNLS-SEC8::EGFP ND 0.45 ± 0.05 (n = 39) NDNLSα3_1-SEC8::EGFP ND 0.40 ± 0.10 (n = 36) NDNLSα3_2-SEC8::EGFP ND 0.49 ± 0.05 (n = 40) ND
Note that only the α3L-NLS::DsRed-E loop significantly increased the SEC8::EGFP gray level ratio between nucleus and cytoplasm. Also note the signifi-cant difference in gray level ratios (DsRed-E/EGFP) in α3L-NLS::DsRed-E/SEC8::EGFP- versus α3K-NLS::DsRed-E/SEC8::EGFP-coexpressing cells. AP < 0.001. Data represent the means ± SEM. ND, not determined.
Table 2Summary of the quantification of integrated fluorescence intensities measured with line scans (10 μm in length) in axons, dendrites, and somata of transfected primary hippocampal neurons
HA-α3L gray level ratio HA-α3L gray level ratio HA-α3L gray level ratio (axon/soma) (axon/dendrite) (dendrite/soma)HA-α3L EGFP 0.17 ± 0.02 (n = 26) 0.23 ± 0.04 (n = 26) 0.83 ± 0.07 (n = 26)HA-α3L SEC8::EGFP 0.84 ± 0.07 (n = 27)A 1.01 ± 0.11 (n = 27)A 0.91 ± 0.08 (n = 27)
Values represent calculated ratios between integrated HA-α3L pixel intensities in axon and soma, axon and dendrite, or dendrite and soma. Coexpression of SEC8::EGFP and GlyR HA-α3L significantly increased the ratios of integrated HA-α3L signal intensities between axon and soma as well as between axon and dendrite. AP < 0.001. Data represent the means ± SEM.
research article
The Journal of Clinical Investigation http://www.jci.org Volume 124 Number 2 February 2014 699
vesicular glutamate transporter VGluT (185 of 215 clusters in 23 of 27 SEC8::EGFP-coexpressing neurons, Supplemental Figure 4B, arrows), a vesicular axonal and presynaptic marker of glutamatergic neurons, whereas only some smaller axonal GlyR HA-α3L clusters in the EGFP-coexpressing neurons (2 of 26) colocalized with VGluT (5 of 24). Collectively, these results demonstrate that SEC8::EGFP facilitates axonal trafficking of HA-tagged GlyR α3L, and they suggest that SEC8 tethers GlyR α3L and VGluT in axonal cargo vesicles on their way to presynaptic terminals.
RNA editing leads to spontaneous channel opening of GlyR α3L. RNA editing of GlyR α3–coding mRNA leads to gain of function (26). In fact, substitution of the proline residue by the aliphatic hydro-phobic amino acid leucine at position 185 in the mature GlyR α3 polypeptide impacts the conformation of the ligand binding domain and thereby confers increased accessibility of the neu-rotransmitters glycine and GABA to the agonist binding site (24). Due to the close proximity of the RNA-edited position to the plas-ma membrane, thermodynamic rules also imply a spontaneous channel opening of RNA-edited GlyR α3L185L in the absence of an agonist. We investigated this possibility by electrophysiological
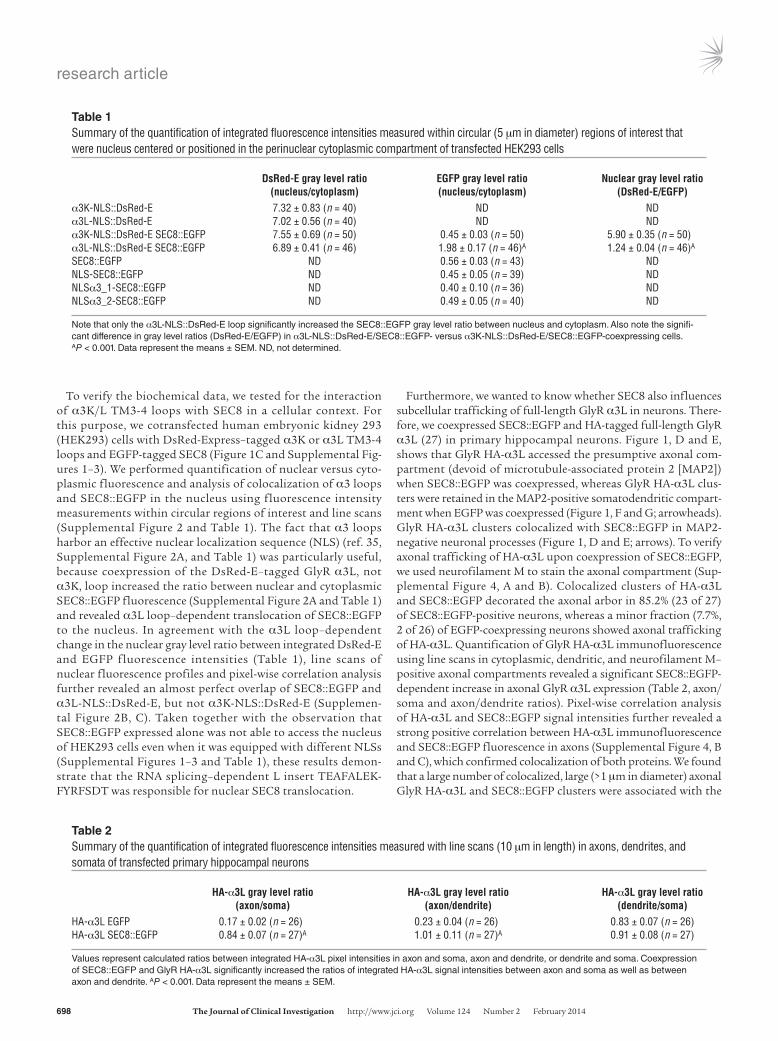
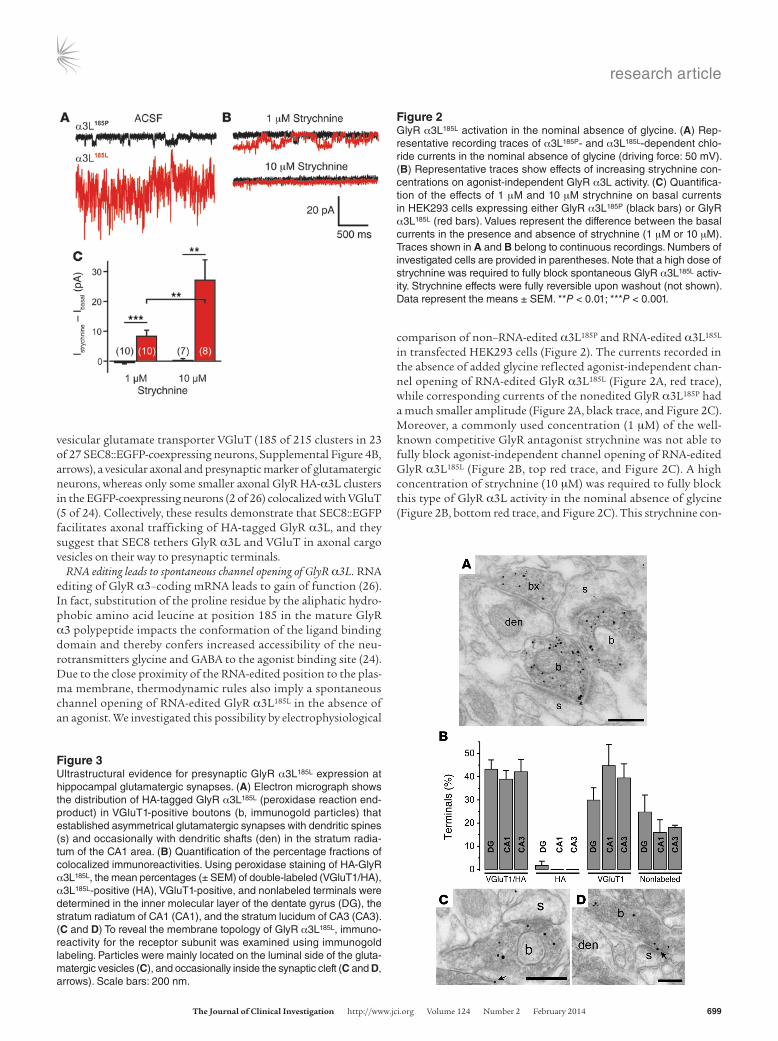
comparison of non–RNA-edited α3L185P and RNA-edited α3L185L in transfected HEK293 cells (Figure 2). The currents recorded in the absence of added glycine reflected agonist-independent chan-nel opening of RNA-edited GlyR α3L185L (Figure 2A, red trace), while corresponding currents of the nonedited GlyR α3L185P had a much smaller amplitude (Figure 2A, black trace, and Figure 2C). Moreover, a commonly used concentration (1 μM) of the well-known competitive GlyR antagonist strychnine was not able to fully block agonist-independent channel opening of RNA-edited GlyR α3L185L (Figure 2B, top red trace, and Figure 2C). A high concentration of strychnine (10 μM) was required to fully block this type of GlyR α3L activity in the nominal absence of glycine (Figure 2B, bottom red trace, and Figure 2C). This strychnine con-
Figure 2GlyR α3L185L activation in the nominal absence of glycine. (A) Rep-resentative recording traces of α3L185P- and α3L185L-dependent chlo-ride currents in the nominal absence of glycine (driving force: 50 mV). (B) Representative traces show effects of increasing strychnine con-centrations on agonist-independent GlyR α3L activity. (C) Quantifica-tion of the effects of 1 μM and 10 μM strychnine on basal currents in HEK293 cells expressing either GlyR α3L185P (black bars) or GlyR α3L185L (red bars). Values represent the difference between the basal currents in the presence and absence of strychnine (1 μM or 10 μM). Traces shown in A and B belong to continuous recordings. Numbers of investigated cells are provided in parentheses. Note that a high dose of strychnine was required to fully block spontaneous GlyR α3L185L activ-ity. Strychnine effects were fully reversible upon washout (not shown). Data represent the means ± SEM. **P < 0.01; ***P < 0.001.
Figure 3Ultrastructural evidence for presynaptic GlyR α3L185L expression at hippocampal glutamatergic synapses. (A) Electron micrograph shows the distribution of HA-tagged GlyR α3L185L (peroxidase reaction end-product) in VGluT1-positive boutons (b, immunogold particles) that established asymmetrical glutamatergic synapses with dendritic spines (s) and occasionally with dendritic shafts (den) in the stratum radia-tum of the CA1 area. (B) Quantification of the percentage fractions of colocalized immunoreactivities. Using peroxidase staining of HA-GlyR α3L185L, the mean percentages (± SEM) of double-labeled (VGluT1/HA), α3L185L-positive (HA), VGluT1-positive, and nonlabeled terminals were determined in the inner molecular layer of the dentate gyrus (DG), the stratum radiatum of CA1 (CA1), and the stratum lucidum of CA3 (CA3). (C and D) To reveal the membrane topology of GlyR α3L185L, immuno-reactivity for the receptor subunit was examined using immunogold labeling. Particles were mainly located on the luminal side of the gluta-matergic vesicles (C), and occasionally inside the synaptic cleft (C and D, arrows). Scale bars: 200 nm.
research article
700 The Journal of Clinical Investigation http://www.jci.org Volume 124 Number 2 February 2014
centration also blocks GABA type A receptors (GABAARs) (36) and, hence, is not suitable for the discrimination of glycine and GABA effects on neuronal function in slice preparations.
Knockin mouse model for characterization of GlyR α3L185L function in the brain. In order to investigate the functional role of GlyR α3L in vivo, we generated a knockin mouse line for Cre-dependent neuron type–specific expression of the gain-of-function α3L receptor variant. For this purpose, we used a targeting vector containing the cDNA copy of the HA-tagged GlyR α3L185L RNA variant (ref. 24 and Supple-mental Figure 5) for recombination with the X chromosomal Hprt gene locus. Cre recombinase–dependent excision of the floxed STOP
cassette upstream of the DNA coding for HA-tagged GlyR α3L185L enables minigene protein expression in different neuron types.
Endogenous GlyR α3 is expressed in principal cells in stratum granulosum (27) and stratum pyramidale (37) as well as in fast-spiking interneurons (Supplemental Figure 6). Therefore, we studied the functional impact of GlyR α3L185L on the two cog-nitively relevant neuron types (principal cells and fast-spiking interneurons) by mating homozygous Hprtα3L185L+/+ females with heterozygous Camk2aCre+/– males (38) or homozygous PvalbCre+/+ males (39), which excises the STOP cassette and induces neuron type–specific GlyR α3L185L protein expression in principal cells or parvalbumin-positive neurons, respectively. Western blot analyses with an HA epitope–directed antibody indeed confirmed full-length (48 kDa) HA-α3L185L GlyR expression in the hippocam-pus and cortex of male offspring that were hemizygous for the HA-α3L185L allele (Hprtα3L185L+/0) and heterozygous for the Camk2aCre or PvalbCre alleles (Supplemental Figure 7). Male Hprtα3L185L+/0 mice were used as control animals. We also verified at a functional level that Cre recombinase induced gain-of-function GlyR α3L185L pro-tein expression. For this purpose, Cre recombinase was expressed in primary neuron cultures of Hprtα3L185L+/0;Hprtα3L185L+/+ mice, and whole cell patch clamp recording was performed. Cre-positive neu-rons indeed responded with transmembrane chloride currents to the application of a low (10 μM) glycine concentration (Supple-
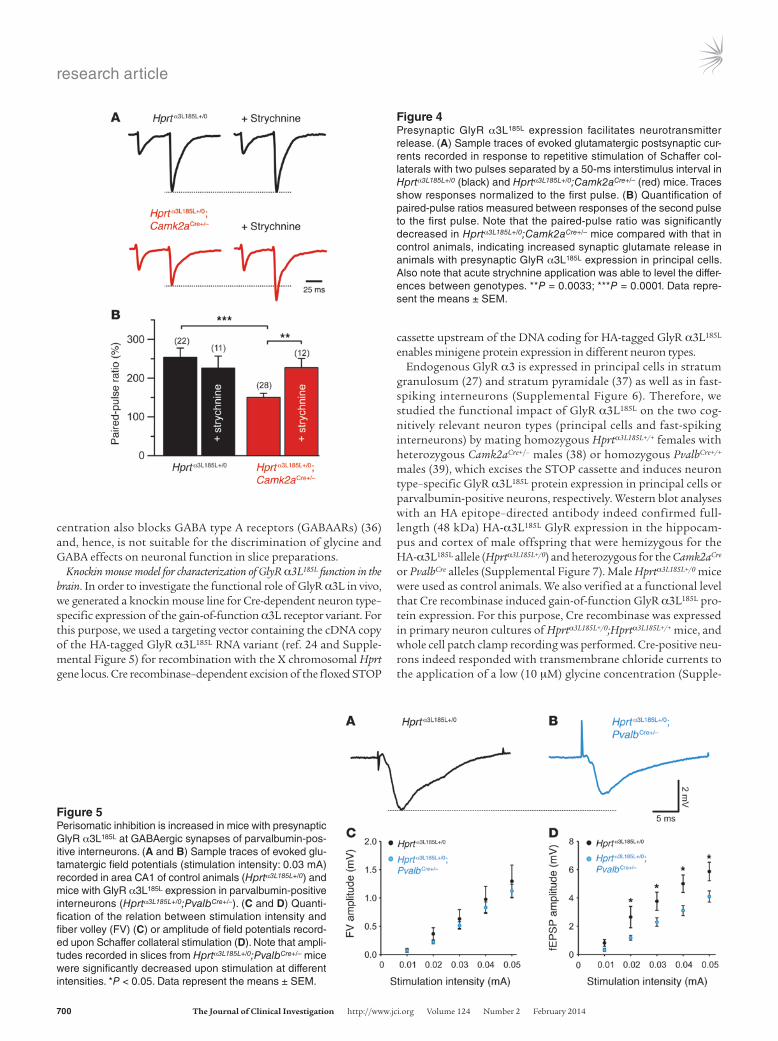
Figure 4Presynaptic GlyR α3L185L expression facilitates neurotransmitter release. (A) Sample traces of evoked glutamatergic postsynaptic cur-rents recorded in response to repetitive stimulation of Schaffer col-laterals with two pulses separated by a 50-ms interstimulus interval in Hprtα3L185L+/0 (black) and Hprtα3L185L+/0;Camk2aCre+/– (red) mice. Traces show responses normalized to the first pulse. (B) Quantification of paired-pulse ratios measured between responses of the second pulse to the first pulse. Note that the paired-pulse ratio was significantly decreased in Hprtα3L185L+/0;Camk2aCre+/– mice compared with that in control animals, indicating increased synaptic glutamate release in animals with presynaptic GlyR α3L185L expression in principal cells. Also note that acute strychnine application was able to level the differ-ences between genotypes. **P = 0.0033; ***P = 0.0001. Data repre-sent the means ± SEM.
Figure 5Perisomatic inhibition is increased in mice with presynaptic GlyR α3L185L at GABAergic synapses of parvalbumin-pos-itive interneurons. (A and B) Sample traces of evoked glu-tamatergic field potentials (stimulation intensity: 0.03 mA) recorded in area CA1 of control animals (Hprtα3L185L+/0) and mice with GlyR α3L185L expression in parvalbumin-positive interneurons (Hprtα3L185L+/0;PvalbCre+/–). (C and D) Quanti-fication of the relation between stimulation intensity and fiber volley (FV) (C) or amplitude of field potentials record-ed upon Schaffer collateral stimulation (D). Note that ampli-tudes recorded in slices from Hprtα3L185L+/0;PvalbCre+/– mice were significantly decreased upon stimulation at different intensities. *P < 0.05. Data represent the means ± SEM.
research article
The Journal of Clinical Investigation http://www.jci.org Volume 124 Number 2 February 2014 701
mental Figure 8), which confirmed Cre-dependent excision of the floxed STOP cassette and, hence, induction of gain-of-function GlyR α3L185L protein expression.
Anatomical evidence for presynaptic GlyR α3L185L expression in vivo. We determined the characteristics of HA-α3L185L GlyR expression in principal glutamatergic neurons (Hprtα3L185L+/0;Camk2aCre+/–) using pre-embedding double immunochemistry and ultrastructur-al analysis with electron microscopy. In Hprtα3L185L+/0;Camk2aCre+/– animals, HA-α3L185L immunoreactivity was found predominantly at VGluT1-positive glutamatergic terminals (Figure 3A), estab-lishing asymmetrical synapses with dendritic shafts and pre-dominantly with dendritic spines of putative principal cells in the inner molecular layer of the dentate gyrus (n = 341 terminals in 2 animals), as well as in the stratum radiatum of cornu ammo-nis subfield 1 (CA1) (n = 391) and in the stratum lucidum of CA3 (n = 242). Approximately 40% of the VGluT1-positive presynap-tic boutons (immunogold particles) showed immunoreactivity against HA-α3L185L (peroxidase reaction end product) in these areas, whereas 30%–45% of the terminals were immunopositive for the glutamate transporter, but not for the receptor pro-tein (Figure 3B). In addition, we found a small subpopulation of axon terminals (3.6%) mak-ing asymmetrical synapses with postsynaptic dendritic spines to be immunopositive for HA-3L185L, but not for VGluT1 in the dentate gyrus (Figure 3B). Thus, GlyR HA-α3L185L spe-cifically targets a subset of
glutamatergic presynaptic terminals in mice with Camk2aCre-dependent GlyR HA-α3L185L expression. In another set of experi-ments, we identified VGluT1-positive terminals by the peroxidase reaction end product, and we detected immunoreactivity against HA-α3L185L with gold particles that allowed us to precisely visual-ize the location of the receptor protein at presynaptic terminals (Figure 3, C and D). Immunogold particle labeling of HA-α3L185L revealed that the receptor protein was preferentially located over presynaptic vesicles (Figure 3, C and D). We found that approxi-mately one-third of the immunoparticles in the investigated boutons were associated with synaptic or extrasynaptic terminal membranes (Figure 3, C and D, arrows; percentage of immuno-gold particles in the dentate gyrus: 34.9 ± 7.3, CA3: 22.4 ± 1.5, CA1: 33.1 ± 8.6; means ± SD). Thus, the ultrastructural analysis is con-sistent with the proposed membrane topology of GlyRs, and it corroborates presynaptic GlyR α3L expression at glutamater-gic synapses in vivo. We detected no immunoreactivity against HA-α3L185L in tissues obtained from control mice (Hprtα3L185L+/0).
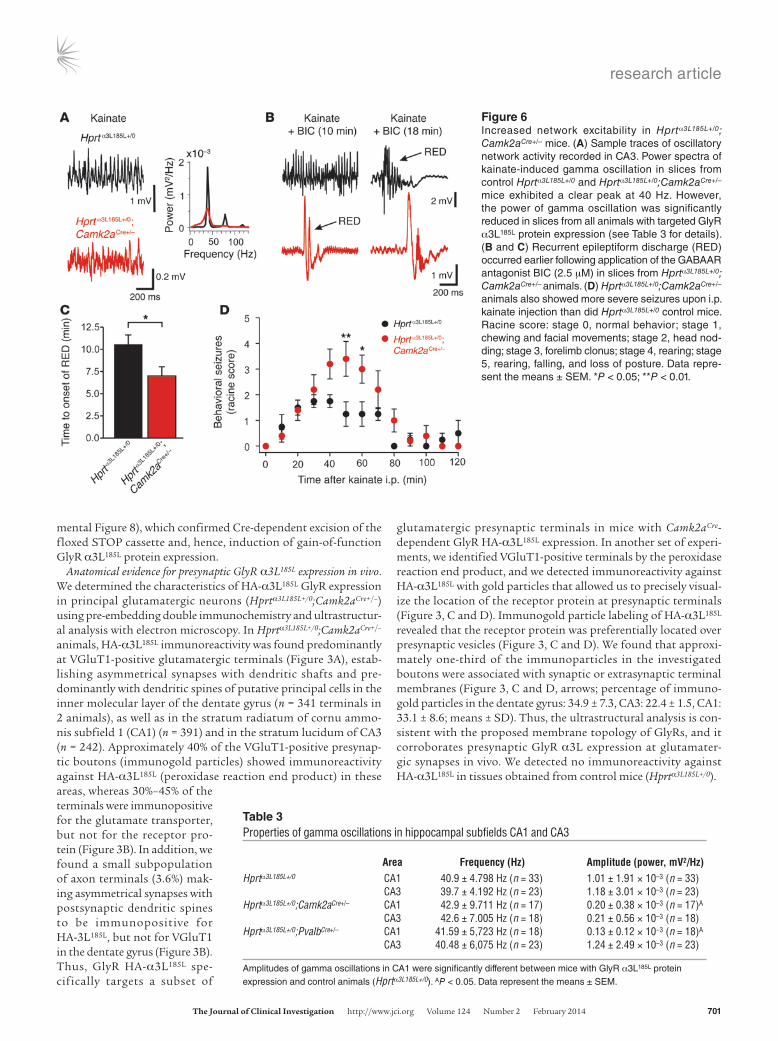
Figure 6Increased network excitability in Hprtα3L185L+/0; Camk2aCre+/– mice. (A) Sample traces of oscillatory network activity recorded in CA3. Power spectra of kainate-induced gamma oscillation in slices from control Hprtα3L185L+/0 and Hprtα3L185L+/0;Camk2aCre+/– mice exhibited a clear peak at 40 Hz. However, the power of gamma oscillation was significantly reduced in slices from all animals with targeted GlyR α3L185L protein expression (see Table 3 for details). (B and C) Recurrent epileptiform discharge (RED) occurred earlier following application of the GABAAR antagonist BIC (2.5 μM) in slices from Hprtα3L185L+/0; Camk2aCre+/– animals. (D) Hprtα3L185L+/0;Camk2aCre+/– animals also showed more severe seizures upon i.p. kainate injection than did Hprtα3L185L+/0 control mice. Racine score: stage 0, normal behavior; stage 1, chewing and facial movements; stage 2, head nod-ding; stage 3, forelimb clonus; stage 4, rearing; stage 5, rearing, falling, and loss of posture. Data repre-sent the means ± SEM. *P < 0.05; **P < 0.01.
Table 3Properties of gamma oscillations in hippocampal subfields CA1 and CA3
Area Frequency (Hz) Amplitude (power, mV2/Hz)Hprtα3L185L+/0 CA1 40.9 ± 4.798 Hz (n = 33) 1.01 ± 1.91 × 10⁻³ (n = 33) CA3 39.7 ± 4.192 Hz (n = 23) 1.18 ± 3.01 × 10⁻³ (n = 23)Hprtα3L185L+/0;Camk2aCre+/– CA1 42.9 ± 9.711 Hz (n = 17) 0.20 ± 0.38 × 10⁻³ (n = 17)A
CA3 42.6 ± 7.005 Hz (n = 18) 0.21 ± 0.56 × 10⁻³ (n = 18)Hprtα3L185L+/0;PvalbCre+/– CA1 41.59 ± 5,723 Hz (n = 18) 0.13 ± 0.12 × 10⁻³ (n = 18)A
CA3 40.48 ± 6,075 Hz (n = 23) 1.24 ± 2.49 × 10⁻³ (n = 23)
Amplitudes of gamma oscillations in CA1 were significantly different between mice with GlyR α3L185L protein expression and control animals (Hprtα3L185L+/0). AP < 0.05. Data represent the means ± SEM.
research article
702 The Journal of Clinical Investigation http://www.jci.org Volume 124 Number 2 February 2014
To characterize subcellular HA-α3L185L trafficking in parval-bumin-positive interneurons, we evaluated HA immunoreactivity in slice preparations from Hprtα3L185L+/0;PvalbCre+/– mice using con-focal laser scanning microscopy, image deconvolution, and 3D reconstruction of multichannel images acquired in the stratum pyramidale. Quantification of colocalization between HA-α3L185L and parvalbumin using well-established Pearson’s correlation and Manders’ overlap coefficients (40) clearly revealed that GlyR HA-α3L185L overlapped with parvalbumin (Supplemental Fig-ure 9; Pearson’s coefficient: 0.83 ± 0.01, Manders’ coefficient: 0.964 ± 0.019; means ± SEM). More importantly, GlyR HA-α3L185L signals were also congruent with the vesicular inhibi-tory amino acid transporter (VIAAT) (Supplemental Figure 9; Pearson’s correlation coefficient and Man-ders’ overlap coefficient of colocalization between HA-α3L185L and VIAAT: 0.73 ± 0.03 and 0.953 ± 0.056, respectively; means ± SEM). VIAAT is a well-charac-terized presynaptic marker of GABAergic synapses, hence, our high-resolution imaging approach dem-onstrates presynaptic expression of HA-α3L185L-GlyRs at hippocampal parvalbumin-positive synapses. Col-lectively, targeted expression of HA-α3L185L in our knockin mouse model led to presynaptic receptor localization in vivo.
Presynaptic GlyR α3L185L expression in vivo facilitates neurotransmitter release. To corroborate presynaptic GlyR α3L185L expression at a functional level, we performed a commonly used assay to determine the neurotransmitter release property of synapses. The paired-pulse recording approach examines the response properties of synapses during repetitive stimulation. By ruling out postsynaptic mecha-nisms during two stimulations, this technique can provide information about the capacity of the pre-
synaptic neurotransmitter release machinery to satisfy repeti-tive demands. A ratio of less than one between the second and first response indicates fatigue of this machinery (paired-pulse depression) and, hence, reflects a high probability of neurotrans-mitter release upon the first stimulus. Likewise, a ratio greater than one (paired-pulse facilitation) indicates a low probability of transmitter release upon the first stimulus (41). To rule out con-comitant recruitment of GABAergic synapses and their impact on glutamatergic synaptic transmission, we performed paired-pulse recordings in the whole-cell configuration in the presence of gabazine (1 μM) and saclofen (100 μM), which block GABAARs
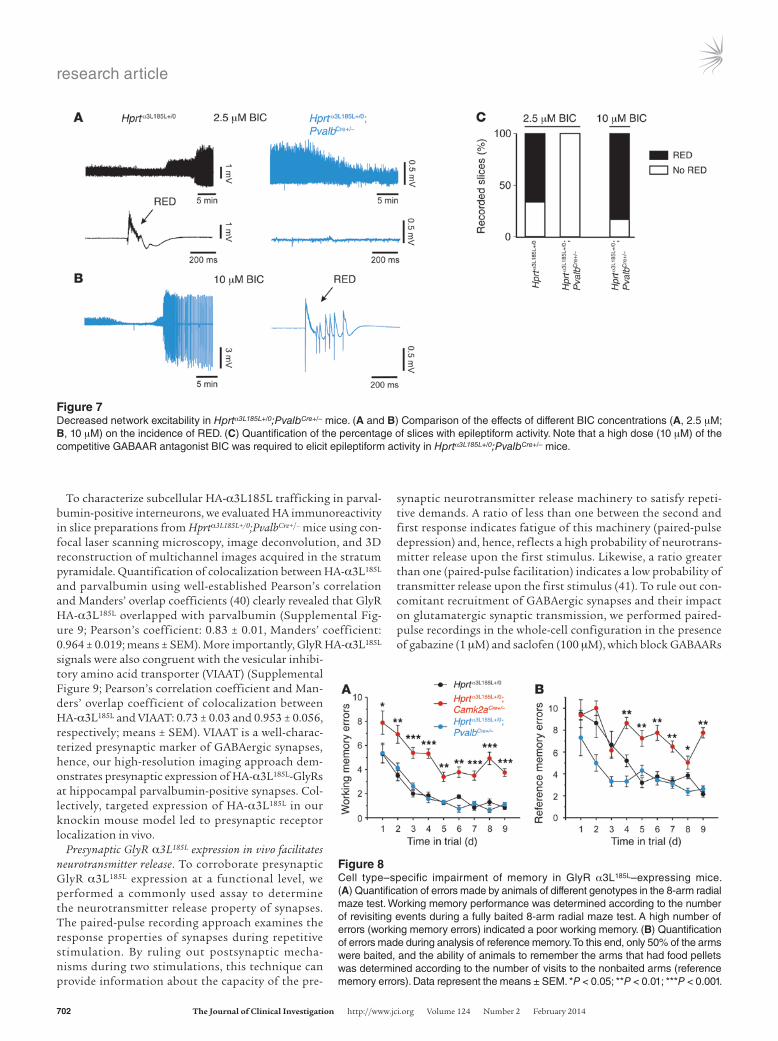
Figure 7Decreased network excitability in Hprtα3L185L+/0;PvalbCre+/– mice. (A and B) Comparison of the effects of different BIC concentrations (A, 2.5 μM; B, 10 μM) on the incidence of RED. (C) Quantification of the percentage of slices with epileptiform activity. Note that a high dose (10 μM) of the competitive GABAAR antagonist BIC was required to elicit epileptiform activity in Hprtα3L185L+/0;PvalbCre+/– mice.
Figure 8Cell type–specific impairment of memory in GlyR α3L185L–expressing mice. (A) Quantification of errors made by animals of different genotypes in the 8-arm radial maze test. Working memory performance was determined according to the number of revisiting events during a fully baited 8-arm radial maze test. A high number of errors (working memory errors) indicated a poor working memory. (B) Quantification of errors made during analysis of reference memory. To this end, only 50% of the arms were baited, and the ability of animals to remember the arms that had food pellets was determined according to the number of visits to the nonbaited arms (reference memory errors). Data represent the means ± SEM. *P < 0.05; **P < 0.01; ***P < 0.001.
research article
The Journal of Clinical Investigation http://www.jci.org Volume 124 Number 2 February 2014 703
and GABA type B receptors, respectively (Figure 4A). Camk2aCre-dependent GlyR α3L185L protein expression began around post-natal day 15 (Supplemental Figure 10), and whole-cell recordings performed at this age revealed that the paired-pulse ratio was significantly decreased in slices from Hprtα3L185L+/0;Camk2aCre+/– mice compared with those from control Hprtα3L185L+/0 animals (Figure 4B, 150.2 ± 10.8% vs. 253.2 ± 24.3%). Because spontane-ous channel openings of GlyR α3L185L in the nominal absence of glycine necessitate a high dose of strychnine for full receptor antagonism (above, Figure 2), we used 10 μM strychnine here. We found that strychnine leveled the difference between geno-types in paired-pulse recordings (Figure 4B, 226.7 ± 24.1% vs. 225.7 ± 30.8%), confirming that the observed genotype-specific difference was due to targeted GlyR α3L185L expression. Thus, presynaptic GlyR α3L185L expression in Hprtα3L185L+/0;Camk2aCre+/– animals increased synaptic glutamate release.
Facilitation of presynaptic GABA release due to targeted GlyR α3L185L expression in parvalbumin-positive interneurons should increase perisomatic inhibition and hence affect glutamatergic synaptic transmission. To address this possibility, we recorded evoked field potentials in area CA1 in response to Schaffer col-lateral stimulation in the absence of GABAAR antagonists (Figure 5, A and B). While volleys generated by glutamatergic fibers were not influenced by the genotype (Figure 5C), the amplitudes of field potentials were indeed significantly reduced in slices from Hprtα3L185L+/0;PvalbCre+/– animals (Figure 5D) . The chloride trans-porter antagonist bumetanide (50 µM) minimized differences between genotypes (not shown). These results demonstrate that presynaptic GlyR α3L185L expression in parvalbumin-positive interneurons increases perisomatic inhibition.
Neuron type–specific GlyR α3L185L effects on network properties and excitability in vivo. To address the impact of enhanced neuronal function on a neural network substrate of cognitive function, we investigated high-frequency (gamma) oscillatory network activity in Hprtα3L185L+/0;Camk2aCre+/–, Hprtα3L185L+/0;PvalbCre+/–, and Hprtα3L185L+/0 control mice using local field potential recordings in hippocampal subfields CA1 and CA3. Gamma rhythm in the hippocampus could be induced in all three genotypes follow-ing bath application of 400 nM kainate, as described previously (42). The power spectra of the oscillations in slices of the differ-ent genotypes showed a clear peak in the 40-Hz frequency band (Figure 6A and Table 3). However, the power of gamma oscillations in the CA1 region was significantly reduced in slices from Hprtα3L185L+/0; Camk2aCre+/– and Hprtα3L185L+/0;PvalbCre+/– mice (Table 3). To assess hippocampal network excitability, the latency to recurrent epi-leptiform discharge upon blockage of GABA-ergic inhibition with a low dose (2.5 μM) of the competitive GABAAR antagonist bicuculline methiodide (BIC) was measured first in Hprtα3L185L+/0; Camk2aCre+/– animals (Figure 6B). Network disinhibition with 2.5 μM BIC indeed induced epileptiform network activity (Figure 6B), and the latency to pathological activity was significantly shorter in slices from Hprtα3L185L+/0;Camk2aCre+/– mice compared with those from Hprtα3L185L+/0 mice (7.0 ± 1.0 minutes vs. 10.5 ± 1.1 minutes) (Figure 6C), which is in agreement with the facilitation of pre-synaptic glutamate release due to targeted GlyR α3L185L expres-sion (see Figure 4). Increased network excitability in Hprtα3L185L+/0; Camk2aCre+/– mice should also increase behavioral seizure activity. Therefore, we administered an i.p. injection of kainate and mea-sured behavioral seizure activity according to the Racine classifi-cation (Figure 6D). Behavioral seizures were indeed exacerbated
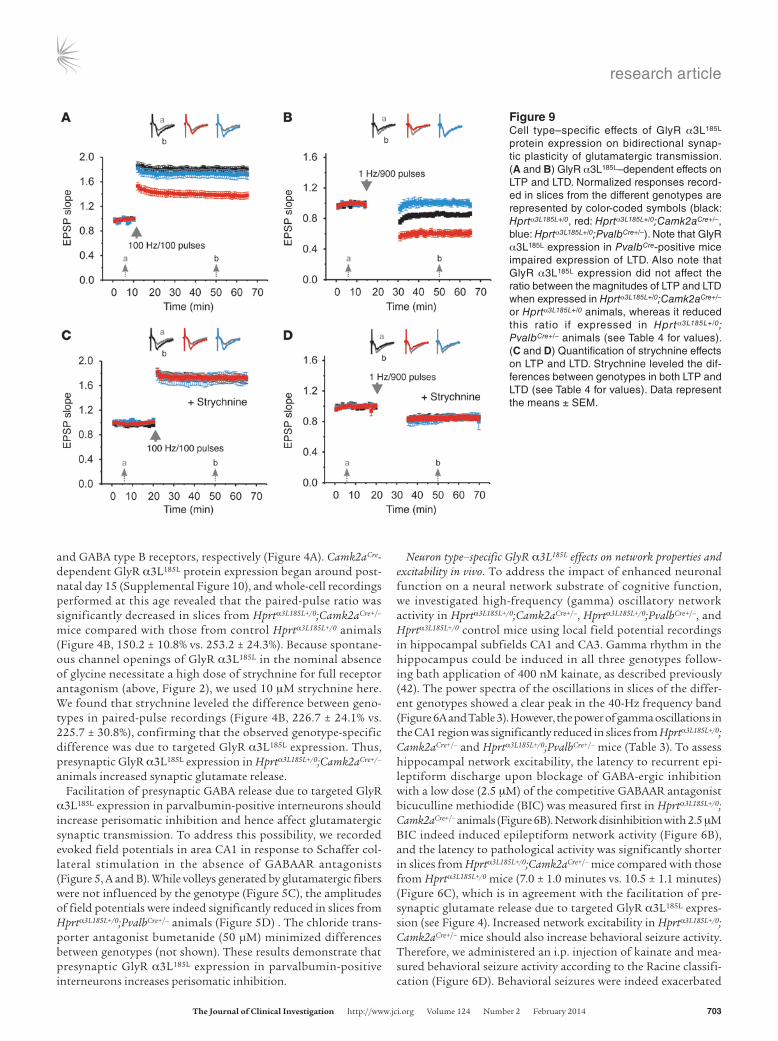
Figure 9Cell type–specific effects of GlyR α3L185L protein expression on bidirectional synap-tic plasticity of glutamatergic transmission. (A and B) GlyR α3L185L–dependent effects on LTP and LTD. Normalized responses record-ed in slices from the different genotypes are represented by color-coded symbols (black: Hprtα3L185L+/0, red: Hprtα3L185L+/0;Camk2aCre+/–, blue: Hprtα3L185L+/0;PvalbCre+/–). Note that GlyR α3L185L expression in PvalbCre-positive mice impaired expression of LTD. Also note that GlyR α3L185L expression did not affect the ratio between the magnitudes of LTP and LTD when expressed in Hprtα3L185L+/0;Camk2aCre+/–
or Hprtα3L185L+/0 animals, whereas it reduced this ratio if expressed in Hprtα3L185L+/0; PvalbCre+/– animals (see Table 4 for values). (C and D) Quantification of strychnine effects on LTP and LTD. Strychnine leveled the dif-ferences between genotypes in both LTP and LTD (see Table 4 for values). Data represent the means ± SEM.
research article
704 The Journal of Clinical Investigation http://www.jci.org Volume 124 Number 2 February 2014
in Hprtα3L185L+/0;Camk2aCre+/– mice, and pronounced differences between the two genotypes were observed 50–60 minutes after the kainate injection (Figure 6D).
In contrast to Hprtα3L185L+/0;Camk2aCre+/– animals, Hprtα3L185L+/0; PvalbCre+/– mice required a higher dose (10 μM) of the competitive GAB AAR antagonist BIC to generate epileptiform discharge in slice preparations (Figure 7). Qualitatively, we obtained the same results with different concentrations of another competitive GABAAR antagonist, i.e., 0.3 μM and 3 μM gabazine (Supplemen-tal Figure 11). Thus, consistent with the data from the field poten-tial recordings (see Figure 5), presynaptic GlyR α3L185L expression at parvalbumin-positive GABAergic synapses decreased network excitability. Collectively, these results demonstrate that GlyR α3L185L persistently increased neuronal impact in the neural net-work through a presynaptic mode of action in glutamatergic prin-cipal cells and parvalbumin-positive interneurons.
Consequences of neuronal enhancement for synaptic plasticity and behavior in vivo. Bidirectional synaptic plasticity, in the form of long-term potentiation and depression (LTP and LTD), is deemed to be the cellular substrate for associative spatial mem-ory (43–45). However, recent evidence also demonstrated that LTP at the Schaffer collateral synapse influences discrimina-tion of competing or overlapping memories and corresponding behavioral responses. To determine whether neuronal enhance-ment influences bidirectional plasticity of glutamatergic syn-aptic transmission and its relation to performance in learning and memory tasks, we used the reward-based 8-arm radial maze test, which addresses discriminative associative memory forma-tion, and compared short- (working) and long-term (reference) memory of mice with enhanced function of glutamatergic prin-cipal cells or parvalbumin-positive interneurons (Figure 8, A and B). The learning curve in Figure 8A shows that working mem-ory was impaired in Hprtα3L185L+/0;Camk2aCre+/– mice, since they required more trials than control Hprtα3L185L+/0 or Hprtα3L185L+/0; PvalbCre+/– animals. Furthermore, reference memory was selec-tively impaired in Hprtα3L185L+/0;Camk2aCre+/– mice (Figure 8B). For control purposes, we verified that the genotype did not influence motor coordination or hedonic behavior (Supplemental Figure 12). These results demonstrate that Hprtα3L185L+/0;Camk2aCre+/– mice were impaired in working memory formation and deficient in reference memory in a behavioral test that addressed discrimi-native associative memory (46).
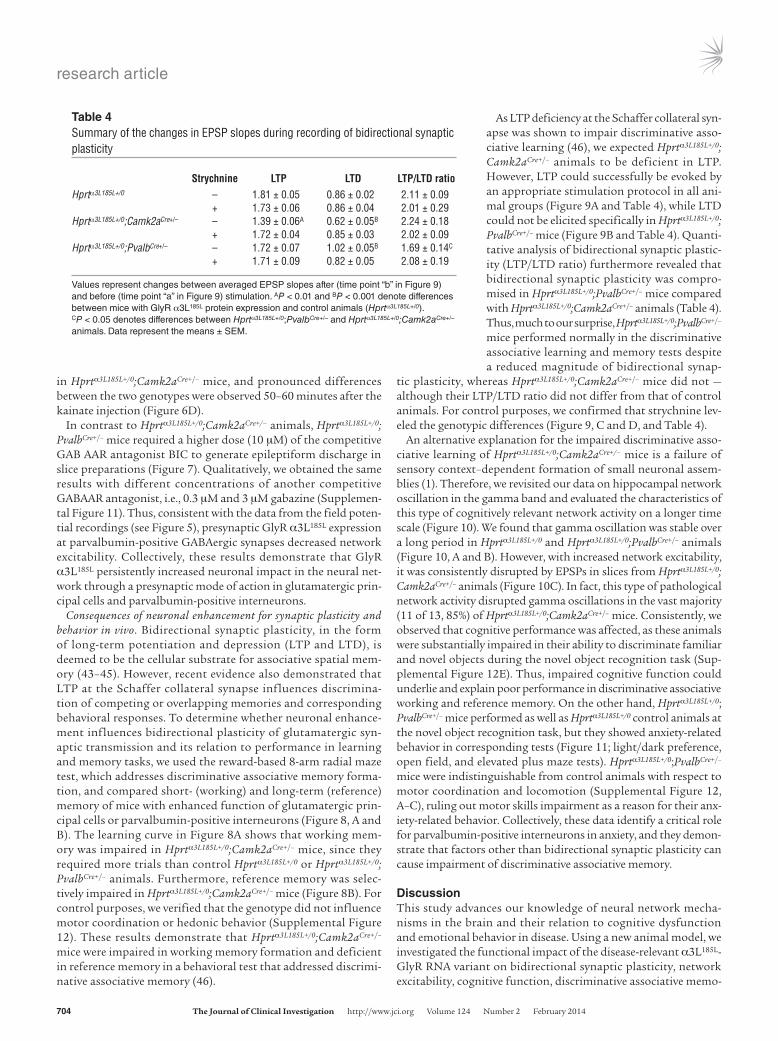
As LTP deficiency at the Schaffer collateral syn-apse was shown to impair discriminative asso-ciative learning (46), we expected Hprtα3L185L+/0; Camk2aCre+/– animals to be deficient in LTP. However, LTP could successfully be evoked by an appropriate stimulation protocol in all ani-mal groups (Figure 9A and Table 4), while LTD could not be elicited specifically in Hprtα3L185L+/0;PvalbCre+/– mice (Figure 9B and Table 4). Quanti-tative analysis of bidirectional synaptic plastic-ity (LTP/LTD ratio) furthermore revealed that bidirectional synaptic plasticity was compro-mised in Hprtα3L185L+/0;PvalbCre+/– mice compared with Hprtα3L185L+/0;Camk2aCre+/– animals (Table 4). Thus, much to our surprise, Hprtα3L185L+/0;PvalbCre+/– mice performed normally in the discriminative associative learning and memory tests despite a reduced magnitude of bidirectional synap-
tic plasticity, whereas Hprtα3L185L+/0;Camk2aCre+/– mice did not — although their LTP/LTD ratio did not differ from that of control animals. For control purposes, we confirmed that strychnine lev-eled the genotypic differences (Figure 9, C and D, and Table 4).
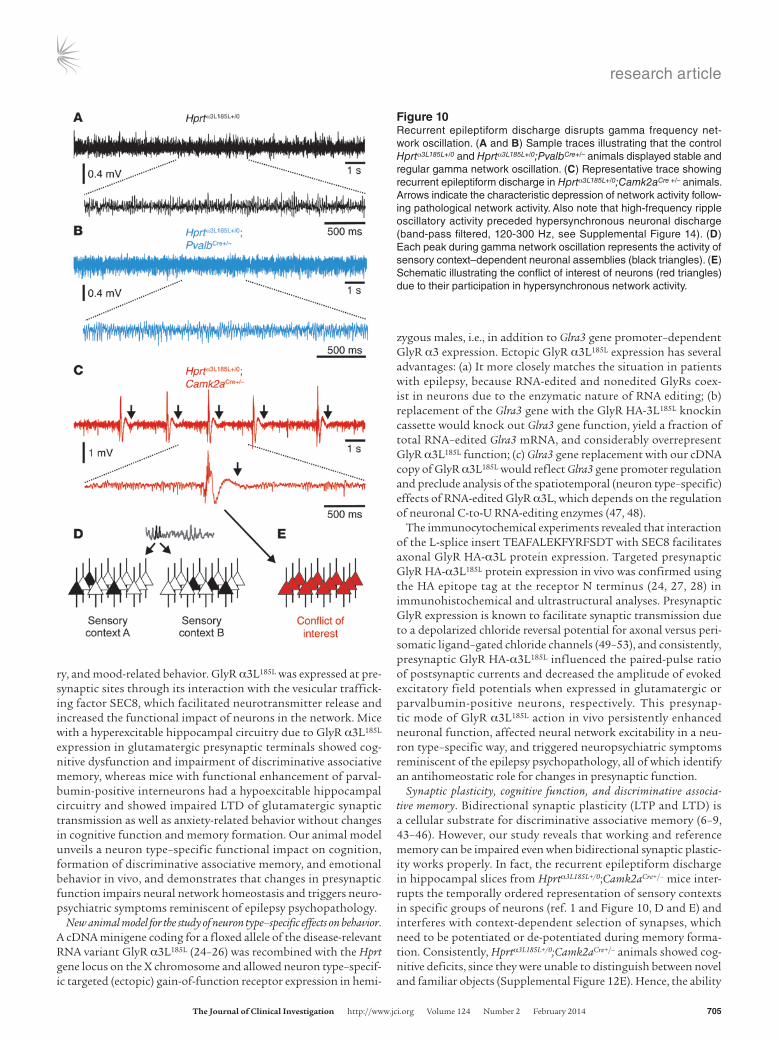
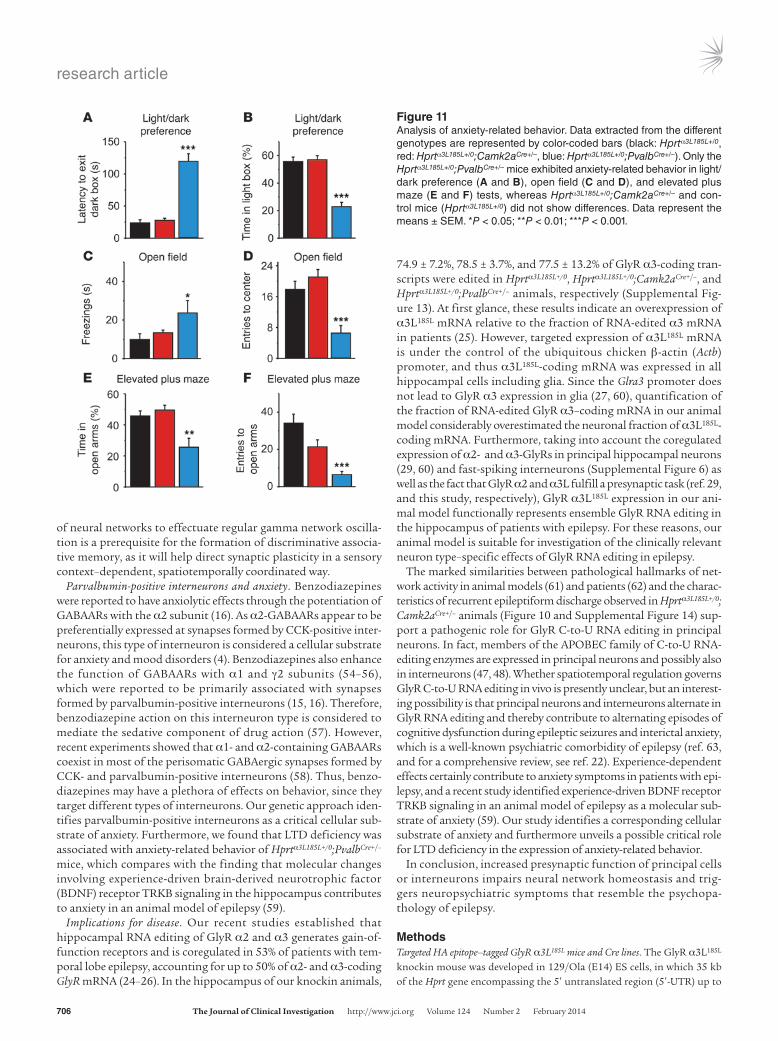
An alternative explanation for the impaired discriminative asso-ciative learning of Hprtα3L185L+/0;Camk2aCre+/– mice is a failure of sensory context–dependent formation of small neuronal assem-blies (1). Therefore, we revisited our data on hippocampal network oscillation in the gamma band and evaluated the characteristics of this type of cognitively relevant network activity on a longer time scale (Figure 10). We found that gamma oscillation was stable over a long period in Hprtα3L185L+/0 and Hprtα3L185L+/0;PvalbCre+/– animals (Figure 10, A and B). However, with increased network excitability, it was consistently disrupted by EPSPs in slices from Hprtα3L185L+/0; Camk2aCre+/– animals (Figure 10C). In fact, this type of pathological network activity disrupted gamma oscillations in the vast majority (11 of 13, 85%) of Hprtα3L185L+/0;Camk2aCre+/– mice. Consistently, we observed that cognitive performance was affected, as these animals were substantially impaired in their ability to discriminate familiar and novel objects during the novel object recognition task (Sup-plemental Figure 12E). Thus, impaired cognitive function could underlie and explain poor performance in discriminative associative working and reference memory. On the other hand, Hprtα3L185L+/0; PvalbCre+/– mice performed as well as Hprtα3L185L+/0 control animals at the novel object recognition task, but they showed anxiety-related behavior in corresponding tests (Figure 11; light/dark preference, open field, and elevated plus maze tests). Hprtα3L185L+/0;PvalbCre+/– mice were indistinguishable from control animals with respect to motor coordination and locomotion (Supplemental Figure 12, A–C), ruling out motor skills impairment as a reason for their anx-iety-related behavior. Collectively, these data identify a critical role for parvalbumin-positive interneurons in anxiety, and they demon-strate that factors other than bidirectional synaptic plasticity can cause impairment of discriminative associative memory.
DiscussionThis study advances our knowledge of neural network mecha-nisms in the brain and their relation to cognitive dysfunction and emotional behavior in disease. Using a new animal model, we investigated the functional impact of the disease-relevant α3L185L-GlyR RNA variant on bidirectional synaptic plasticity, network excitability, cognitive function, discriminative associative memo-
Table 4Summary of the changes in EPSP slopes during recording of bidirectional synaptic plasticity
Strychnine LTP LTD LTP/LTD ratioHprtα3L185L+/0 – 1.81 ± 0.05 0.86 ± 0.02 2.11 ± 0.09 + 1.73 ± 0.06 0.86 ± 0.04 2.01 ± 0.29Hprtα3L185L+/0;Camk2aCre+/– – 1.39 ± 0.06A 0.62 ± 0.05B 2.24 ± 0.18 + 1.72 ± 0.04 0.85 ± 0.03 2.02 ± 0.09Hprtα3L185L+/0;PvalbCre+/– – 1.72 ± 0.07 1.02 ± 0.05B 1.69 ± 0.14C
+ 1.71 ± 0.09 0.82 ± 0.05 2.08 ± 0.19
Values represent changes between averaged EPSP slopes after (time point “b” in Figure 9) and before (time point “a” in Figure 9) stimulation. AP < 0.01 and BP < 0.001 denote differences between mice with GlyR α3L185L protein expression and control animals (Hprtα3L185L+/0). CP < 0.05 denotes differences between Hprtα3L185L+/0;PvalbCre+/– and Hprtα3L185L+/0;Camk2aCre+/– animals. Data represent the means ± SEM.
research article
The Journal of Clinical Investigation http://www.jci.org Volume 124 Number 2 February 2014 705
ry, and mood-related behavior. GlyR α3L185L was expressed at pre-synaptic sites through its interaction with the vesicular traffick-ing factor SEC8, which facilitated neurotransmitter release and increased the functional impact of neurons in the network. Mice with a hyperexcitable hippocampal circuitry due to GlyR α3L185L expression in glutamatergic presynaptic terminals showed cog-nitive dysfunction and impairment of discriminative associative memory, whereas mice with functional enhancement of parval-bumin-positive interneurons had a hypoexcitable hippocampal circuitry and showed impaired LTD of glutamatergic synaptic transmission as well as anxiety-related behavior without changes in cognitive function and memory formation. Our animal model unveils a neuron type–specific functional impact on cognition, formation of discriminative associative memory, and emotional behavior in vivo, and demonstrates that changes in presynaptic function impairs neural network homeostasis and triggers neuro-psychiatric symptoms reminiscent of epilepsy psychopathology.
New animal model for the study of neuron type–specific effects on behavior. A cDNA minigene coding for a floxed allele of the disease-relevant RNA variant GlyR α3L185L (24–26) was recombined with the Hprt gene locus on the X chromosome and allowed neuron type–specif-ic targeted (ectopic) gain-of-function receptor expression in hemi-
zygous males, i.e., in addition to Glra3 gene promoter–dependent GlyR α3 expression. Ectopic GlyR α3L185L expression has several advantages: (a) It more closely matches the situation in patients with epilepsy, because RNA-edited and nonedited GlyRs coex-ist in neurons due to the enzymatic nature of RNA editing; (b) replacement of the Glra3 gene with the GlyR HA-3L185L knockin cassette would knock out Glra3 gene function, yield a fraction of total RNA–edited Glra3 mRNA, and considerably overrepresent GlyR α3L185L function; (c) Glra3 gene replacement with our cDNA copy of GlyR α3L185L would reflect Glra3 gene promoter regulation and preclude analysis of the spatiotemporal (neuron type–specific) effects of RNA-edited GlyR α3L, which depends on the regulation of neuronal C-to-U RNA-editing enzymes (47, 48).
The immunocytochemical experiments revealed that interaction of the L-splice insert TEAFALEKFYRFSDT with SEC8 facilitates axonal GlyR HA-α3L protein expression. Targeted presynaptic GlyR HA-α3L185L protein expression in vivo was confirmed using the HA epitope tag at the receptor N terminus (24, 27, 28) in immunohistochemical and ultrastructural analyses. Presynaptic GlyR expression is known to facilitate synaptic transmission due to a depolarized chloride reversal potential for axonal versus peri-somatic ligand–gated chloride channels (49–53), and consistently, presynaptic GlyR HA-α3L185L influenced the paired-pulse ratio of postsynaptic currents and decreased the amplitude of evoked excitatory field potentials when expressed in glutamatergic or parvalbumin-positive neurons, respectively. This presynap-tic mode of GlyR α3L185L action in vivo persistently enhanced neuronal function, affected neural network excitability in a neu-ron type–specific way, and triggered neuropsychiatric symptoms reminiscent of the epilepsy psychopathology, all of which identify an antihomeostatic role for changes in presynaptic function.
Synaptic plasticity, cognitive function, and discriminative associa-tive memory. Bidirectional synaptic plasticity (LTP and LTD) is a cellular substrate for discriminative associative memory (6–9, 43–46). However, our study reveals that working and reference memory can be impaired even when bidirectional synaptic plastic-ity works properly. In fact, the recurrent epileptiform discharge in hippocampal slices from Hprtα3L185L+/0;Camk2aCre+/– mice inter-rupts the temporally ordered representation of sensory contexts in specific groups of neurons (ref. 1 and Figure 10, D and E) and interferes with context-dependent selection of synapses, which need to be potentiated or de-potentiated during memory forma-tion. Consistently, Hprtα3L185L+/0;Camk2aCre+/– animals showed cog-nitive deficits, since they were unable to distinguish between novel and familiar objects (Supplemental Figure 12E). Hence, the ability
Figure 10Recurrent epileptiform discharge disrupts gamma frequency net-work oscillation. (A and B) Sample traces illustrating that the control Hprtα3L185L+/0 and Hprtα3L185L+/0;PvalbCre+/– animals displayed stable and regular gamma network oscillation. (C) Representative trace showing recurrent epileptiform discharge in Hprtα3L185L+/0;Camk2aCre +/– animals. Arrows indicate the characteristic depression of network activity follow-ing pathological network activity. Also note that high-frequency ripple oscillatory activity preceded hypersynchronous neuronal discharge (band-pass filtered, 120-300 Hz, see Supplemental Figure 14). (D) Each peak during gamma network oscillation represents the activity of sensory context–dependent neuronal assemblies (black triangles). (E) Schematic illustrating the conflict of interest of neurons (red triangles) due to their participation in hypersynchronous network activity.
research article
706 The Journal of Clinical Investigation http://www.jci.org Volume 124 Number 2 February 2014
of neural networks to effectuate regular gamma network oscilla-tion is a prerequisite for the formation of discriminative associa-tive memory, as it will help direct synaptic plasticity in a sensory context–dependent, spatiotemporally coordinated way.
Parvalbumin-positive interneurons and anxiety. Benzodiazepines were reported to have anxiolytic effects through the potentiation of GABAARs with the α2 subunit (16). As α2-GABAARs appear to be preferentially expressed at synapses formed by CCK-positive inter-neurons, this type of interneuron is considered a cellular substrate for anxiety and mood disorders (4). Benzodiazepines also enhance the function of GABAARs with α1 and γ2 subunits (54–56), which were reported to be primarily associated with synapses formed by parvalbumin-positive interneurons (15, 16). Therefore, benzodiazepine action on this interneuron type is considered to mediate the sedative component of drug action (57). However, recent experiments showed that α1- and α2-containing GABAARs coexist in most of the perisomatic GABAergic synapses formed by CCK- and parvalbumin-positive interneurons (58). Thus, benzo-diazepines may have a plethora of effects on behavior, since they target different types of interneurons. Our genetic approach iden-tifies parvalbumin-positive interneurons as a critical cellular sub-strate of anxiety. Furthermore, we found that LTD deficiency was associated with anxiety-related behavior of Hprtα3L185L+/0;PvalbCre+/– mice, which compares with the finding that molecular changes involving experience-driven brain-derived neurotrophic factor (BDNF) receptor TRKB signaling in the hippocampus contributes to anxiety in an animal model of epilepsy (59).
Implications for disease. Our recent studies established that hippocampal RNA editing of GlyR α2 and α3 generates gain-of-function receptors and is coregulated in 53% of patients with tem-poral lobe epilepsy, accounting for up to 50% of α2- and α3-coding GlyR mRNA (24–26). In the hippocampus of our knockin animals,
74.9 ± 7.2%, 78.5 ± 3.7%, and 77.5 ± 13.2% of GlyR α3-coding tran-scripts were edited in Hprtα3L185L+/0, Hprtα3L185L+/0;Camk2aCre+/–, and Hprtα3L185L+/0;PvalbCre+/– animals, respectively (Supplemental Fig-ure 13). At first glance, these results indicate an overexpression of α3L185L mRNA relative to the fraction of RNA-edited α3 mRNA in patients (25). However, targeted expression of α3L185L mRNA is under the control of the ubiquitous chicken β-actin (Actb) promoter, and thus α3L185L-coding mRNA was expressed in all hippocampal cells including glia. Since the Glra3 promoter does not lead to GlyR α3 expression in glia (27, 60), quantification of the fraction of RNA-edited GlyR α3–coding mRNA in our animal model considerably overestimated the neuronal fraction of α3L185L-coding mRNA. Furthermore, taking into account the coregulated expression of α2- and α3-GlyRs in principal hippocampal neurons (29, 60) and fast-spiking interneurons (Supplemental Figure 6) as well as the fact that GlyR α2 and α3L fulfill a presynaptic task (ref. 29, and this study, respectively), GlyR α3L185L expression in our ani-mal model functionally represents ensemble GlyR RNA editing in the hippocampus of patients with epilepsy. For these reasons, our animal model is suitable for investigation of the clinically relevant neuron type–specific effects of GlyR RNA editing in epilepsy.
The marked similarities between pathological hallmarks of net-work activity in animal models (61) and patients (62) and the charac-teristics of recurrent epileptiform discharge observed in Hprtα3L185L+/0; Camk2aCre+/– animals (Figure 10 and Supplemental Figure 14) sup-port a pathogenic role for GlyR C-to-U RNA editing in principal neurons. In fact, members of the APOBEC family of C-to-U RNA-editing enzymes are expressed in principal neurons and possibly also in interneurons (47, 48). Whether spatiotemporal regulation governs GlyR C-to-U RNA editing in vivo is presently unclear, but an interest-ing possibility is that principal neurons and interneurons alternate in GlyR RNA editing and thereby contribute to alternating episodes of cognitive dysfunction during epileptic seizures and interictal anxiety, which is a well-known psychiatric comorbidity of epilepsy (ref. 63, and for a comprehensive review, see ref. 22). Experience-dependent effects certainly contribute to anxiety symptoms in patients with epi-lepsy, and a recent study identified experience-driven BDNF receptor TRKB signaling in an animal model of epilepsy as a molecular sub-strate of anxiety (59). Our study identifies a corresponding cellular substrate of anxiety and furthermore unveils a possible critical role for LTD deficiency in the expression of anxiety-related behavior.
In conclusion, increased presynaptic function of principal cells or interneurons impairs neural network homeostasis and trig-gers neuropsychiatric symptoms that resemble the psychopa-thology of epilepsy.
MethodsTargeted HA epitope–tagged GlyR α3L185L mice and Cre lines. The GlyR α3L185L knockin mouse was developed in 129/Ola (E14) ES cells, in which 35 kb of the Hprt gene encompassing the 5′ untranslated region (5′-UTR) up to
Figure 11Analysis of anxiety-related behavior. Data extracted from the different genotypes are represented by color-coded bars (black: Hprtα3L185L+/0, red: Hprtα3L185L+/0;Camk2aCre+/–, blue: Hprtα3L185L+/0;PvalbCre+/–). Only the Hprtα3L185L+/0;PvalbCre+/– mice exhibited anxiety-related behavior in light/dark preference (A and B), open field (C and D), and elevated plus maze (E and F) tests, whereas Hprtα3L185L+/0;Camk2aCre+/– and con-trol mice (Hprtα3L185L+/0) did not show differences. Data represent the means ± SEM. *P < 0.05; **P < 0.01; ***P < 0.001.
research article
The Journal of Clinical Investigation http://www.jci.org Volume 124 Number 2 February 2014 707
intron 2 was deleted (Supplemental Figure 5). In the first phase of the proj-ect, the targeting vector was constructed by inserting the CAG promoter (a combination of the cytomegalovirus early enhancer element and the chicken Actb promoter), the floxed STOP cassette and the HA-tagged GlyR α3L185L cDNA (24, 27) into a genOway Quick Knock-In targeting vector. Homologous recombination of the genOway targeting vector with the Hprt gene locus repairs the Hprt gene deletion (Supplemental Figure 5, Hprt-HR). During the ES cell phases, the reconstituted Hprt gene was selected using hypoxanthine, aminopterine, and thymidine (HAT) media to enrich for ES cell clones showing the correct targeting event. The construct was then elec-troporated into 129/Ola (E14) ES cells, and the HAT-resistant ES cell clones were isolated. Chimeric males generated from the ES cell clones were mated with wild-type C57BL/6J females, and germline transmission to agouti F1 females (B6;129P2-Hprt<tm1(CAG-Glra3*)GW>) was verified by Southern blotting (not shown). Heterozygous F1 females were bred with wild-type C57BL/6J males to generate F2 hemizygous males for inbreeding purposes.
To achieve GlyR α3L185L expression in glutamatergic principal neurons, homozygous B6;129P2-Hprt<tm1(CAG-Glra3*)GW/MEJ> females (abbre-viated as Hprtα3L185L+/+) were crossed with heterozygous B6.FVB-Tg(Camk2a-Cre)2Gsc/Cnrm (abbreviated as Camk2aCre+/–) males (provided by Günther Schütz, German Cancer Research Center DKFZ, Heidelberg, Germany). Male offspring (Hprtα3L185L+/0;CamkCre+/–) aged between 3 and 5 months that were hemizygous for the GlyR α3L185L allele and heterozygous for the Camk2aCre+/– allele were used. For receptor expression in parvalbumin-pos-itive interneurons, homozygous Hprtα3L185L+/+ females were crossed with homozygous B6;129P2-Pvalb<tm1(Cre)Arbr>/J (abbreviated as PvalbCre+/+) males (The Jackson Laboratory), and 3- to 5-month-old male offspring (Hprtα3L185L+/0;PvalbCre+/–) were used. Age-matched Hprtα3L185L+/0 male mice were used as control animals. Genotyping was performed on genomic DNA obtained from tail biopsies. Genomic DNA was isolated using a stan-dard protocol. Briefly, tail lysis was performed at 55°C for 1 to 2 hours in the presence of proteinase K (1 mg/ml) in a buffer containing 100 mM Tris (pH 8.0), 5 mM EDTA, 200 mM NaCl, and 0.2% SDS. RNA was degraded with 0.2 mg/ml RNase A for 15 minutes at 37°C. Following isopropanol precipitation, 10 ng of genomic DNA was used in combination with the oligonucleotides and PCR programs listed in Supplemental Table 2.
Targeted GlyR α3L185L expression did not affect the viability of the mice; survival rates of GlyR α3L185L–knockin animals (Hprtα3L185L+/0) and male off-spring of the Hprtα3L185L+/0 mice mated with Camk2aCre+/– or PvalbCre+/+ animals were 97.4% (112 of 115), 96.2% (50 of 52), and 91.5% (54 of 59), respectively.
Molecular procedures. We thank Susanne Schoch (University of Bonn, Institute of Neuropathology, Bonn, Germany) for providing a human synapsin-1 promoter-containing clone and Sebastian Auer (Max Delbrück Center for Molecular Medicine, Berlin, Germany) for providing a Cre recombinase–encoding clone. Details on molecular cloning, constructs, quantification of the fraction of GlyR α3185L–coding mRNA, and single-cell PCR are provided in the Supplemental Methods.
Preparation of mouse brain crude protein extract. Mouse brains were minced, transferred to buffer (0.1 M Tris pH 8.0, 0.3% Triton X-100, protease inhibi-tor; Roche) and homogenized using a Potter S homogenizer (Sartorius). The crude protein extract was centrifuged, and the soluble supernatant was used for further experiments. Determination of protein concentration was performed using the Bradford assay (64).
Preparation of GST-tagged receptor loops. Immobilized GST and GST-tagged α3 loops were prepared using E. coli (strain ER2566; New Eng-land Biolabs Inc.). Transformed bacteria were grown to an OD600 of 0.7 in lysogeny broth medium at 37°C. Then, they were cooled to 22°C and induced with 100 μM isopropyl-β-thiogalactosidase. Cells were harvested 4 hours later and resuspended in PBS (pH 7.4) containing protease inhibi-tor and 137 mM NaCl, 2.7 mM KH2PO4, 8.1 mM Na2HPO4, and 1.76 mM
KCl. For protein solubilization, a cell disruptor was used, and the crude protein extract was centrifuged to obtain the clarified supernatant, which was loaded onto 400 μl glutathione sepharose 4 Fast Flow Beads (GE Healthcare). After incubation for 1.5 hours at 4°C under shaking, the sep-harose beads with bound GST or GST-tagged receptor loops were washed with 30 column volumes of PBS. The prepared beads were stored at 4°C in PBS with additional protease inhibitor. Aliquots of the beads were ana-lyzed via SDS-PAGE and stained with Coomassie brilliant blue to quantify their quality and loading capacity.
Cosedimentation (mass spectrometry). Depending on the receptor loop saturation, receptor loop beads (10–20 μl) were used for cosedimentation experiments. GST-loaded beads were used as a negative control. The dif-ferent samples were incubated for 1.5 hours at room temperature under gentle shaking with 4 mg mouse brain crude extract in a total volume of 80 μl and pulldown buffer containing 20 mM Tris (pH 8.0), 150 mM NaCl, and 1 mM EDTA. Afterward, the beads were sedimented at 1,200 g for 4 minutes, and the supernatant was removed. In order to remove unbound proteins, the receptor loop beads were washed four times with 1 ml wash buffer containing 20 mM Tris (pH 8.0), 50 mM NaCl, and 1 mM EDTA. Sepharose bead elution was performed with 10 mM glutathione dissolved in wash buffer. Elution and supernatant fractions (both 14 μl) were analyzed with SDS-PAGE and silver staining (G-Biosciences). As a negative control, identical amounts of coated beads were processed in the same manner without addition of brain crude extract. Protein bands in the GST::α3L GlyR sample, not in the GST sample, were excised and ana-lyzed by peptide mass fingerprinting at the Centre for Molecular Medicine (Cologne, Germany). Data were processed using the Mascot Search Engine software (Matrix Science) (65).
Cosedimentation (SEC8 interaction). To study cosedimentation of α3K and α3L loops with SEC8, 600 μg crude brain extract was used. GST, GST::α3K, and GST::α3L loops including possibly interacting proteins were eluted from the sepharose beads with 10 mM glutathione. Samples were then subject to SDS-PAGE, Coomassie staining, and Western blot analysis. SEC8 was detected with a mouse monoclonal antibody against SEC8 (14G1, 1:1,000; Abcam) and anti-mouse alkaline phosphatase–cou-pled antibody (1:3,000; Sigma-Aldrich).
Western blot analysis. Western blot analysis was also performed for verifica-tion of GlyR minigene expression in knockin animals. Mice were killed by cervical dislocation, and the cortex and hippocampus were isolated. Tissue specimens were homogenized in the presence of lysis buffer containing 1% 3-[(3-cholamidopropyl)dimethylammonio]-1-propane-sulfonate, 10 μM pepstatin, 10 μM leupeptin, 0.52 μM aprotinin, and 200 μM PMSF in PBS and centrifuged at full speed for 15 minutes at 4°C. The protein concentra-tion was determined by measuring the extinction with a standard photom-eter using the Warburg-Christian equation: (1.55 × A280) – (0.76 × A260). Protein (8 μg) from each sample was supplemented with 5× SDS sample buffer containing 50% glycerol, 3.5% SDS, 15% β-mercaptoethanol, and 0.02% bromphenol blue and boiled for 7 minutes at 95°C. Protein solutions were loaded on a 10% SDS gel and processed for Western blot analysis, as described in the Supplemental Methods.
Cell culture and transfection. HEK293 cells were grown on coverslips in cell cul-ture dishes containing MEM supplemented with 10% FCS and 1% penicillin/streptomycin and containing 30 mM D-glucose, 10 mM HEPES, 0.23 mM sodium-pyruvate, and 0.25 mM L-glutamine. For transient protein expres-sion, a standard Ca2+-phosphate protocol was applied, and cells were analyzed 2 days after transfection. Primary hippocampal neurons from E19 Wistar rats were prepared as described (66) and kept in B27- and 1% FCS-supplemented neurobasal medium (67). The initial cell density was 68,000/cm2. Transfection was performed on day in vitro (div) 6 in the presence of transfection medium (neurobasal medium supplemented only with 0.25 mM glutamine) by incu-
research article
708 The Journal of Clinical Investigation http://www.jci.org Volume 124 Number 2 February 2014
bating cells with complexes formed between 300 ng of DNA and 5 μl of Effec-tene transfection reagent (QIAGEN). For cotransfection, a 1:1 ratio of the dif-ferent DNAs was applied. The QIAGEN protocol was followed, except that the incubation time was reduced to 60 minutes, which ensured moderate protein expression in approximately 1% of the hippocampal neurons on div 9. Primary hippocampal neurons were also isolated from HA-GlyR α3L185L–targeted mice on postnatal day 0 and treated likewise.
Antibodies. For electron microscopy, guinea pig anti-VGluT1 (1:100; Syn-aptic Systems) and rat monoclonal anti-HA (clone 3F10, 2 μg/ml; Roche Applied Science) were used. For fluorescence microscopy, the rat monoclo-nal anti-HA antibody (Roche Applied Science) was used at 4 μg/ml, and the guinea pig polyclonal anti-VGluT1 (Synaptic Systems) was used at a 1:600 dilution. Furthermore, rabbit polyclonal anti–neurofilament-M antibody (1:500; Kamiya Biomedical Company), guinea pig polyclonal anti-MAP2 antibody (1:200; Synaptic Systems), rabbit polyclonal anti-VIAAT antibody (1:300; Synaptic Systems), and mouse monoclonal anti-parvalbumin anti-body (clone 235, 1:2,500; Swant) were used. Secondary antibodies were pur-chased from Jackson ImmunoResearch Laboratories and coupled to FITC, indocarbocyanin (Cy3), carboxymethyl indocyanine (Cy5), or aminometh-ylcoumarin-acetat (AMCA). For Western blot analysis, rabbit polyclonal anti-tubulin antibody (1:1,000; Cell Signaling Technology), rat monoclo-nal anti-HA antibody (clone 3F10, 0.1 μg/ml; Roche Applied Science), and mouse monoclonal SEC8 antibody (clone 14G1, 1:1,000; Abcam) were used. Secondary HRP- or alkaline phosphatase–coupled antibodies were used at the indicated dilution and purchased from Jackson ImmunoResearch Laboratories (1:10,000) or from Sigma-Aldrich (1:3,000).
Immunochemistry. Transfected HEK293 cells and neurons were fixed with an ice-cold mixture of PFA and sucrose (4% of each) for 15 minutes at room temperature. After three wash steps in PBS, the coverslips were pro-cessed for immunochemistry using the antibodies mentioned above and as described previously (27, 68) and were then mounted on microscopy slides using VECTASHIELD medium with DAPI (Vector Laboratories). When quadruple staining (HA-α3L185L, SEC8::EGFP, neurofilament-M, and VGluT1) was performed, VECTASHIELD medium without DAPI was used.
For immunohistochemical analyses of GlyR HA-α3L185L expression in Hprtα3L185L+/0;PvalbCre+/– hippocampus, brain tissues from three male mice were isolated and fixed in a mixture of methanol and glacial acetic acid (95:5) for 30 minutes at –20°C. After three wash steps with PBS, cryopro-tection was performed overnight at 4°C in PBS containing 8% sucrose. On the following day, tissues were embedded in Tissue-Tek O.C.T. Compound (Sakura Finetek), and 20-μm-thick cryosections (CM1850; Leica Microsys-tems) were mounted on Superfrost microscope slides (Carl Roth). After fixation (5 minutes at –20°C with methanol-glacial acetic acid) of the fro-zen cryosections, samples were blocked for 2 hours in PBS-gelatin. Primary antibodies were incubated overnight at 4°C in PBS-gelatin, and after three wash steps, secondary antibodies were incubated for 1 hour at room tem-perature. After two wash steps in PBS-gelatin and one in PBS, samples were mounted in VECTASHIELD medium.
Microscopy. Transfected cells were visualized with a standard epifluo-rescence microscope (BX51; Olympus) under a U Plan Apo ×40 oil objec-tive with a numerical aperture of 1.00. Appropriate filters (U-MSP100v2 MFISH DAPI, U-MSP101v1 MFISH FITC, U-MSP102v1 MFISH Cy3, and U-MSP104v1 MFISH Cy5) allowed the detection and separation of fluo-rescent signals. Images were acquired using a 14-bit cooled CCD camera (Spot PURSUIT; Visitron Systems) and processed with Metamorph soft-ware (Universal Imaging Corporation). Colocalization of GlyR α3K- and L-loops with SEC8::EGFP in HEK293 cells was quantified using line scans (10-μm length) and signal correlation analysis, as previously described (68). For quantification of nuclear versus somatic protein distributions, inte-grated signal intensities were measured cell-wise within circular regions
of interest (5 μm in diameter) that were nucleus centered and placed in the perinuclear cytoplasm. Neuronal subcellular distribution of full-length GlyR HA-α3L in transfected primary hippocampal neurons was quantified cell-wise using line scans (10 μm in length) of fluorescence intensities in soma as well as in proximal axonal and dendritic compartments (at dis-tances from the soma of <100 μm and <50 μm, respectively). Hippocampal slice preparations from animals with targeted GlyR α3L185L expression were analyzed with confocal laser scanning microscopy (DM TCS SP5; Leica Microsystems), image deconvolution, and 3D reconstruction using Huygens professional image deconvolution software (Scientific Volume Imaging) and Imaris 7.6 software (Bitplane AG), respectively. Colocaliza-tion of GlyR HA-α3L185L and parvalbumin or VIAAT was quantified using Pearson’s correlation and Manders’ overlap coefficients.
Pre-embedding double immunochemistry for electron microscopy. Immuno-histochemical labeling for electron microscopy was performed as described earlier (69). Three- to 5-month-old male Hprtα3L185L+/0;Camk2aCre+/– mice (n = 4) with Camk2aCre-dependent expression of HA-tagged GlyR α3L185L and control Hprtα3L185L+/0 animals (n = 2) were used. Animals were deeply anesthetized with Narkodorm-n (180 mg/kg i.p.; Alvetra), and the hearts were surgically exposed for perfusion fixation. First, the vascular system was flushed by circulating 0.9% saline for 1 minute. This was fol-lowed by transcardial perfusion with a fixative prepared in 0.1 M PBS (pH 7.4) containing 4% PFA (Merck), 15% saturated picric acid, and 0.05% glutaraldehyde (Polyscience). After perfusion, brains were removed from the skull, and tissue blocks containing the hippocampus were dissected and washed in 0.1 M PBS. Then, they were cryoprotected and freeze-thawed, and 40-μm sections were cut. Sections were incubated in a block-ing solution containing 20% normal goat serum (Vector Laboratories) prepared in 50 mM Tris-buffered saline (pH 7.3) for 1 hour, followed by overnight incubation at 4°C with a mixture of rat anti-HA and guinea pig anti-VGluT1 antibodies in 50 mM Tris-buffered saline containing 3% nor-mal goat serum. After washing, the sections were transferred into a mixture of the following secondary antibodies: biotinylated goat anti-rat antibody (1:50; Vector Laboratories) and goat anti–guinea pig antibody (Fab fragment, 1:100 Nanogold; Nanoprobes) coupled to 1.4 nm gold particle for quanti-fication of the percentage of HA-positive glutamatergic synapses; or bioti-nylated goat anti–guinea pig antibody (1:50; Vector Laboratories) and goat anti-rat antibody (Fab fragment, 1:100; Nanoprobes) coupled to 1.4 nm gold particle for visualization of the membrane topology of HA-GlyR α3L185L. After washing, sections were first reacted with HQ Silver kit (Nanoprobes) and then with avidin-biotin peroxidase complex (ABC kit; Vector Laborato-ries) for 2 hours at room temperature. Subsequently, sections were incubated in 50 mM Tris-buffer (pH 7.3) containing 0.05% DAB tetrahydrochloride (Sigma-Aldrich) and 0.01% hydrogen peroxide. After treatment with OsO4, sections were stained with uranyl acetate, dehydrated, and flat embedded in Durcupan resin (Fluka). Ultrathin sections were prepared (Reichert-Nissei Ultracut S; Leica) for examination with a LEO 906 E electron microscope (Zeiss). The percentage of double-labeled (VGluT1/HA), GlyR α3L185L–posi-tive (HA), VGluT1-positive, and nonlabeled boutons was determined and expressed as percentage fractions.
Whole-cell recording of paired-pulse responses. Hprtα3L185L+/0 control and Hprtα3L185L+/0;Camk2aCre+/– mice were anesthetized between postnatal days 15 and 18 with halothane (5%) and decapitated. The brain was quickly removed and placed in an ice-cold dissection solution with a reduced calci-um concentration consisting of: 125 mM NaCl, 4 mM KCl, 10 mM glucose, 1.25 mM NaH2PO4, 25 mM NaHCO3, 0.1 mM CaCl2, and 3.0 mM MgCl2 (pH 7.3). Transversal slices (200 μm) were prepared using a vibratome (Leica VT1000S; Leica Microsystems). Slices were maintained for at least 1 hour at room temperature before recording. Whole-cell patch-clamp recordings were performed from CA1 pyramidal neurons visualized using
research article
The Journal of Clinical Investigation http://www.jci.org Volume 124 Number 2 February 2014 709
Recording of gamma-type network oscillatory activity. Experiments were per-formed using hippocampal slices from 3- to 5-month-old Hprtα3L185L+/0, Hprtα3L185L+/0;PvalbCre+/–, and Hprtα3L185L+/0;Camk2aCre+/– animals. Transverse slices (400-μm-thick) were obtained as described earlier (70). The slices were transferred to an interface chamber continuously perfused with prewarmed (34°C), oxygenated (95% O2 and 5% CO2) ACSF containing 126 mM NaCl, 3 mM KCl, 1.25 mM NaH2PO4, 2 mM CaCl2, 2 mM MgSO4, 24 mM NaHCO3, and 10 mM glucose. Prior to recordings, the slices were allowed to rest for at least 1 hour after preparation. Kainate (400 nM) was applied by bath in order to elicit network oscillatory activity in the high-frequency range (>30 Hz, denoted as gamma). To directly compare the hippocampal network activity of control Hprtα3L185L+/0 animals and mice with targeted GlyR protein expression, slices from the different animal groups were simultaneously recorded. Extracellular field potentials were acquired as described earlier (70). Briefly, recordings were done in the stra-tum radiatum and pyramidale of areas CA1 and CA3 using glass pipettes, and they were low-pass-filtered at 1 kHz with a custom-made Bessel filter, digitized at 10 kHz using a Digidata 1322 (Axon Instruments), and ana-lyzed using pClamp software (Axon Instruments). For determination of ripple oscillatory activity, traces were band-pass filtered (high-pass 8-pole Butterworth and low-pass 8-pole Bessel). The power spectra were calcu-lated by Fourier transformation.
Classification of kainate-induced epileptic seizures in vivo. Three- to 5-month-old male mice (five Hprtα3L185L+/0;Camk2aCre+/– mice and four Hprtα3L185L+/0 control mice) received an i.p. injection of kainate (20 mg/kg BW; Tocris) dissolved in 0.9% saline. The experimenter was blinded to the genotype of the animals. After injection, mice were continuously observed for 2 hours, and seizure severity was classified according to Racine’s scale (71): stage 0, normal behavior; stage 1, chewing and facial movements; stage 2, head nodding; stage 3, forelimb clonus; stage 4, rearing; stage 5, rearing, falling, and loss of posture. The seizure score was determined every 10 minutes, and the highest score reached during each 10-minute interval was used to calculate mean seizure severity scores for both groups of mice.
Analysis of LTP and LTD. Recordings were performed as described previ-ously (72). Briefly, mice were decapitated, the hippocampus was removed, and 350-μm-thick slices were prepared using a vibroslicer. Slices were then incubated for 1.5 hours at 33°C ± 1°C in oxygenated (95% O2 and 5% CO2) ACSF containing 124 mM NaCl, 2 mM KCl, 26 mM NaHCO3, 1.24 mM KH2PO4, 2.5 mM CaCl2, 2 mM MgSO4, and 10 mM glucose (pH 7.4) in a standard interface chamber. Recordings were made with a glass pipette containing 0.75 M NaCl (4 MΩ) that was placed in the stratum radiatum of CA1. Stimulation was evoked using a Master-8 pulse stimulator (A.M.P.I.) and delivered through a set of bipolar nichrome electrodes placed on the side of the recording electrode. LTP was induced by high-frequency (100 Hz) stimulation consisting of 100 pulses at twice the current that elicited 50% of the maximal response. LTD was induced by applying low-frequency (1 Hz) stimulation (900 pulses). Baseline values were recorded at a frequency of 0.033 Hz. Responses were digitized at 5 kHz and stored on a computer. Off-line analysis and data acquisition were performed using Spike 2 software (Cambridge Electronic Design). Changes in the slope of EPSPs following Schaffer collateral stimulation were calculated with respect to baseline and followed for at least 45 minutes.
Behavior analyses. All behavioral tests were performed by an experimenter who was blinded to the genotype of the animals. All details on the indi-vidual tests are provided in the Supplemental Methods.
Statistics. One-way ANOVA analysis followed by a post-hoc Bonfer-roni’s test were used for statistical analysis of fluorescence in transfected HEK293 cells. Two-way ANOVA followed by a post-hoc Bonferroni’s test were used for statistical analysis of fluorescence in transfected primary neurons. Data obtained from analyses of animal behavior were tested for
a Zeiss upright microscope fitted with a ×63 water immersion objective. Slices were transferred to a recording chamber and continuously perfused (1–1.5 ml/minute) with a bath solution containing 125 mM NaCl, 4 mM KCl, 10 mM glucose, 1.25 mM NaH2PO4, 25 mM NaHCO3, 2.0 mM CaCl2, and 1.0 mM MgCl2 (pH 7.3) and bubbled at room temperature with 95% O2 and 5% CO2. Excitatory postsynaptic currents (EPSCs) were iso-lated pharmacologically by blocking GABAA and GABAB receptors as well as NMDA receptor–dependent currents (gabazine, 1 μM; 2-hydroxysa-clofen, 100 μM; DL-2-amino-5-phosphonovaleric acid, 50 μM). To block glycinergic receptors including GlyR α3L185L activation in the nominal absence of glycine, a high dose of strychnine (10 μM) had to be applied. The patch pipette solution contained 120 mM CsCl, 4 mM NaCl, 5 mM glucose, 5 mM EGTA, 10 mM HEPES, 0.5 mM CaCl2, and 4 mM MgCl2 (pH 7.3). Evoked EPSCs were induced by stimulation of the Schaf-fer collateral pathway through a glass pipette filled with bath solution. Paired pulses (50-ms interstimulus intervals, every 30 seconds) of con-stant current (2–7 μA, 0.5 ms) were delivered with an Analog Stimulus Isolator Model 2200 (A-M Systems). The stimulus intensity was adjusted to obtain a minimal, but clear, postsynaptic response. During recordings at a holding potential of –80 mV, the access resistance was in the range of 6 to 15 MΩ, compensated up to 60%, and checked throughout the entire experiment by using a short depolarizing pulse. Recordings were accepted only if the access resistance was less than 15 MΩ and did not change by more than 20% during the experiment. Recordings were made with an EPC-10 (HEKA Electronics). Signals were acquired at a rate of 10 kHz and analyzed off-line using WinTida 5.0 (HEKA Electronics).
Recording of local field potentials. The experiments were performed on brain slices obtained from 3- to 12-month-old male Hprtα3L185L+/0, Hprtα3L185L+/0; Camk2aCre+/–, and Hprtα3L185L+/0;PvalbCre+/– mice. Animals were decapitated under N2O (70% N2O and 30% O2) and isoflurane (starting with 3% isoflu-rane and then rapidly reducing it to 0.5%) anesthesia. Brains were placed in ice-cold oxygenated (95% O2 and 5% CO2) artificial cerebrospinal fluid (ACSF) that contained 129 mM NaCl, 21 mM NaHCO3, 3 mM KCl, 1.6 mM CaCl2, 1.8 mM MgSO4, 1.25 mM NaH2PO4, and 10 mM glucose at a pH of 7.4 and an osmolarity of 300 ± 5 mOsm/kg. Horizontal hippocampal slices (400 μm at bregma –4.7 to –7.3 mm) were prepared at an angle of 12° in the fronto-occipital direction (with the frontal portion up) using a vibratome (752 M Vibroslice; Campden Instruments). Brain slices were transferred to an interface recording chamber continuously perfused with ACSF at a flow rate of 1.8 ± 0.2 ml/minute at 36°C ± 0.1°C. Slices were incubated for 1 to 2 hours before the start of recording.
For analysis of network excitability, field potentials were recorded in area CA3 using microelectrodes filled with ACSF with resistances of 5 to 10 MΩ. To investigate whether the threshold to induce epileptiform discharge was altered in mice with GlyR α3L185L expression in glutamatergic prin-cipal cells or parvalbumin-positive interneurons, competitive GABAAR antagonists were used. In the first set of experiments, 2.5 μM or 10 μM BIC was applied. In the second set of experiments, two different concentra-tions of another competitive GABAAR antagonist, gabazine, were applied (0.3 μM and 3 μM). Signals were preamplified using a custom-made ampli-fier equipped with negative capacitance regulation and low pass filtered at 3 kHz. Signals were sampled at a frequency of 10 kHz and stored on a computer hard disk for off-line analysis (Cambridge Electronic Design).
For analysis of glutamatergic transmission at the Schaffer collateral syn-apse in Hprtα3L185L+/0;PvalbCre+/– mice, field potentials were recorded from the stratum radiatum of area CA1. A bipolar stimulation electrode was placed at the Schaffer collaterals proximal to the CA1, and 20–30 min-utes later, when the responses had been stabilized, an input-output curve was obtained (interstimulus interval: 20 seconds). Stimulation intensities ranged from 10 to 50 μA, and signals were processed as described above.
research article
710 The Journal of Clinical Investigation http://www.jci.org Volume 124 Number 2 February 2014
management of our mouse colonies, and genotyping. We thank Natalie Callies and Sigrun Nestel (University of Freiburg) for their assistance with molecular cloning and electron microscopy. We thank Stefan Müller (Center for Molecular Medicine Cologne) for performing peptide mass finger printing and Anje Sporbert (Joint Intravital Microscopy and Imaging platform [JIMI], Max Delbrück Center for Molecular Medicine) for support and access to the SP5 confocal microscope. This work was funded by the Helmholtz Association (VH-NG-246, to J.C. Meier); the Deutsche Forschungsgemeinschaft (DFG) (ME2075/3-1, to J.C. Meier; SFB-TR3 B5, to J.C. Meier and T. Gloveli; SFB635 A11, to G. Schwarz; SFB780 C2, to C.A. Haas; SFB780 A2, to A. Kulik; BIOSS-2 A6, to A. Kulik; GL254/5-1 and GL254/5-2, to T. Gloveli; and Ra424/5-1, to F.G. Rathjen); the Center for Molecular Medicine Cologne (D5, to G. Schwarz); Fonds der Chemischen Industrie (to G. Schwarz); and the Bundesministerium für Bildung und Forschung (BMBF) (BCCN II A3, to T. Gloveli and ERA-Net NEURON II CIPRESS, to J.C. Meier and C.A. Haas).
Received for publication June 7, 2013, and accepted in revised form October 31, 2013. Address correspondence to: Jochen C. Meier, Max Delbrück Center for Molecular Medicine, Robert-Rössle-Str. 10, 13092 Berlin, Ger-many. Phone: 49.0.30.9406.3062; Fax: 49.0.30.9406.3819; E-mail: [email protected].
statistical significance using one- or two-way ANOVA as the case may be, followed by a post-hoc Bonferroni’s test. Statistical analysis of the means ± SEM obtained from LTP and LTD experiments was performed by applying one-way ANOVA analysis followed by a post-hoc Bonferroni’s test. Sigma-Plot (Systat Software) and Origin software (Microcal) were used. Statistical analysis of field potential recordings and epileptiform network activity was performed with SigmaPlot. A One-tailed Student’s t test was used for sta-tistical comparisons of the means ± SEM. Two-way ANOVA followed by a post-hoc Bonferroni’s test (GraphPad Prism 4.02 software) was applied for analysis of statistical significance between the means ± SEM in behavioral seizure experiments. Statistical analysis of the means ± SEM obtained from paired-pulse recordings was performed using SigmaPlot v11.0. A Mann-Whitney U test was applied for statistical comparisons after testing the data for normality (Shapiro-Wilk test). A P value of less than 0.05 was con-sidered significant. Significant differences are indicated in the Figures as *P < 0.05, **P < 0.01, and ***P < 0.001.
Study approval. Animals were handled according to regulations established by the European Community Council Directive and to protocols approved by the IACUC of the Office for Health Protection and Technical Safety of the regional council of Berlin (LaGeSo, permits T0122/07, T0212/08, and O-0389/10) and the regional council of Freiburg (permit G-11/86).
AcknowledgmentsWe thank Josephine Grosch, Silke Dusatko, Anne Schäfer, Sebastian Tausch, and Carola Bernert (Max Delbrück Center for Molecular Medicine) for their excellent technical assistance,
1. Lisman J, Buzsaki G. A neural coding scheme formed by the combined function of gamma and theta oscil-lations. Schizophr Bull. 2008;34(5):974–980.
2. Nagel G, et al. Channelrhodopsin-1: a light-gat-ed proton channel in green algae. Science. 2002; 296(5577):2395–2398.
3. Behrens CJ, van den Boom LP, de HL, Friedman A, Heinemann U. Induction of sharp wave-ripple com-plexes in vitro and reorganization of hippocampal networks. Nat Neurosci. 2005;8(11):1560–1567.
4. Luscher B, Shen Q, Sahir N. The GABAergic deficit hypothesis of major depressive disorder. Mol Psy-chiatry. 2010;16(4):383–406.
5. Bikbaev A, Manahan-Vaughan D. Relationship of hippocampal theta and gamma oscillations to potentiation of synaptic transmission. Front Neuro-sci. 2008;2(1):56–63.
6. Bi GQ, Poo MM. Synaptic modifications in cul-tured hippocampal neurons: dependence on spike timing, synaptic strength, and postsynaptic cell type. J Neurosci. 1998;18(24):10464–10472.
7. Hebb DO. The Organization Of Behavior. New York, New York, USA: John Wiley and Sons; 1949.
8. Sjostrom PJ, Hausser M. A cooperative switch deter-mines the sign of synaptic plasticity in distal den-drites of neocortical pyramidal neurons. Neuron. 2006;51(2):227–238.
9. Bliss TV, Lomo T. Long-lasting potentiation of synaptic transmission in the dentate area of the anaesthetized rabbit following stimulation of the perforant path. J Physiol. 1973;232(2):331–356.
10. Cardin JA, et al. Driving fast-spiking cells induces gamma rhythm and controls sensory responses. Nature. 2009;459(7247):663–667.
11. Huerta PT, Lisman JE. Bidirectional synaptic plas-ticity induced by a single burst during cholinergic theta oscillation in CA1 in vitro. Neuron. 1995; 15(5):1053–1063.
12. Kempter R, Gerstner W, van Hemmen JL. Intrinsic stabilization of output rates by spike-based Hebbi-an learning. Neural Comput. 2001;13(12):2709–2741.
13. Fuchs EC, et al. Recruitment of parvalbumin-positive interneurons determines hippocampal
function and associated behavior. Neuron. 2007; 53(4):591–604.
14. Bartos M, Vida I, Jonas P. Synaptic mechanisms of synchronized gamma oscillations in inhibi-tory interneuron networks. Nat Rev Neurosci. 2007; 8(1):45–56.
15. Freund TF. Interneuron diversity series: rhythm and mood in perisomatic inhibition. Trends Neurosci. 2003;26(9):489–495.
16. Freund TF, Katona I. Perisomatic inhibition. Neuron. 2007;56(1):33–42.
17. Turrigiano GG. The self-tuning neuron: syn-aptic scaling of excitatory synapses. Cell. 2008; 135(3):422–435.
18. Turrigiano G. Too many cooks? Intrinsic and syn-aptic homeostatic mechanisms in cortical circuit refinement. Annu Rev Neurosci. 2011;34:89–103.
19. Kehrer C, Maziashvili N, Dugladze T, Gloveli T. Altered excitatory-inhibitory balance in the NMDA-hypofunction model of schizophrenia. Front Mol Neurosci. 2008;1:6.
20. Eichler SA, Meier JC. E-I balance and human dis-eases — from molecules to networking. Front Mol Neurosci. 2008;1:2.
21. Maffei A, Fontanini A. Network homeostasis: a matter of coordination. Curr Opin Neurobiol. 2009; 19(2):168–173.
22. Beyenburg S, Mitchell AJ, Schmidt D, Elger CE, Reuber M. Anxiety in patients with epilepsy: sys-tematic review and suggestions for clinical man-agement. Epilepsy Behav. 2005;7(2):161–171.
23. Gaitatzis A, Carroll K, Majeed A, Sander W. The epi-demiology of the comorbidity of epilepsy in the gen-eral population. Epilepsia. 2004;45(12):1613–1622.
24. Legendre P, Förstera B, Jüttner R, Meier JC. Glycine receptors caught between genome and proteome — functional implications of RNA editing and splic-ing. Front Mol Neurosci. 2009;2:23.
25. Eichler SA, et al. Glycinergic tonic inhibition of hippocampal neurons with depolarizing GABAer-gic transmission elicits histopathological signs of temporal lobe epilepsy. J Cell Mol Med. 2008; 12(6B):2848–2866.
26. Meier JC, et al. RNA editing produces glycine recep-tor α3P185L resulting in high agonist potency. Nat Neurosci. 2005;8(6):736–744.
27. Eichler SA, et al. Splice-specific roles of glycine recep-tor α3 in the hippocampus. Eur J Neurosci. 2009; 30(6):1077–1091.
28. Notelaers K, et al. Ensemble and single particle flu-orimetric techniques in concerted action to study the diffusion and aggregation of the glycine recep-tor alpha3 isoforms in the cell plasma membrane. Biochim Biophys Acta. 2012;1818(12):3131–3140.
29. Kubota H, Alle H, Betz H, Geiger JR. Presynaptic glycine receptors on hippocampal mossy fibers. Biochem Biophys Res Commun. 2010;393(4):587–591.
30. Nikolic Z, et al. The human glycine receptor subunit alpha3. Glra3 gene structure, chromo-somal localization, and functional characteriza-tion of alternative transcripts. J Biol Chem. 1998; 273(31):19708–19714.
31. Kuhse J, Schmieden V, Betz H. Identification and functional expression of a novel ligand binding subunit of the inhibitory glycine receptor. J Biol Chem. 1990;265(36):22317–22320.
32. Vik-Mo EO, Oltedal L, Hoivik EA, Kleivdal H, Eidet J, Davanger S. Sec6 is localized to the plasma mem-brane of mature synaptic terminals and is trans-ported with secretogranin II-containing vesicles. Neurosci. 2003;119(1):73–85.
33. Cubelos B, Gimenez C, Zafra F. Localization of the GLYT1 glycine transporter at glutamatergic synaps-es in the rat brain. Cereb Cortex. 2005;15(4):448–459.
34. Cubelos B, Gimenez C, Zafra F. The glycine trans-porter GLYT1 interacts with Sec3, a component of the exocyst complex. Neuropharmacology. 2005; 49(6):935–944.
35. Melzer N, et al. Multifunctional basic motif in the glycine receptor intracellular domain induc-es subunit-specific sorting. J Biol Chem. 2010; 285(6):3730–3739.
36. Jonas P, Bischofberger J, Sandkuhler J. Corelease of two fast neurotransmitters at a central synapse. Science. 1998;281(5375):419–424.
37. Aroeira RI, Ribeiro JA, Sebastiao AM, Valente CA.
research article
The Journal of Clinical Investigation http://www.jci.org Volume 124 Number 2 February 2014 711
Age-related changes of glycine receptor at the rat hippocampus: from the embryo to the adult. J Neu-rochem. 2011;118(3):339–353.
38. Casanova E, et al. A CamKIIalpha iCre BAC allows brain-specific gene inactivation. Genesis. 2001; 31(1):37–42.
39. Hippenmeyer S, et al. A developmental switch in the response of DRG neurons to ETS transcription factor signaling. PLoS Biol. 2005;3(5):e159.
40. Manders EMM, Verbeek FJ, Aten JA. Measurements of co-localization of objects in dual-color confocal images. J Microsc. 1993;169(3):375–382.
41. Dobrunz LE, Stevens CF. Heterogeneity of release probability, facilitation, and depletion at central synapses. Neuron. 1997;18(6):995–1008.
42. Dugladze T, et al. Impaired hippocampal rhyth-mogenesis in a mouse model of mesial tempo-ral lobe epilepsy. Proc Natl Acad Sci U S A. 2007; 104(44):17530–17535.
43. Tsien JZ, Huerta PT, Tonegawa S. The essential role of hippocampal CA1 NMDA receptor-dependent synaptic plasticity in spatial memory. Cell. 1996; 87(7):1327–1338.
44. Kim JI, et al. PI3Kgamma is required for NMDA receptor-dependent long-term depression and behavioral f lexibility. Nat Neurosci. 2011; 14(11):1447–1454.
45. Goh JJ, Manahan-Vaughan D. Spatial object recog-nition enables endogenous LTD that curtails LTP in the mouse hippocampus. Cereb Cortex. 2013; 23(5):1118–1125.
46. Bannerman DM, et al. Dissecting spatial knowledge from spatial choice by hippocampal NMDA recep-tor deletion. Nat Neurosci. 2012;15(8):1153–1159.
47. Gee P, et al. APOBEC1-mediated editing and atten-uation of herpes simplex virus 1 DNA indicate that neurons have an antiviral role during herpes sim-plex encephalitis. J Virol. 2011;85(19):9726–9736.
48. Wang YJ, et al. Expression and regulation of anti-viral protein APOBEC3G in human neuronal cells. J Neuroimmunol. 2009;206(1–2):14–21.
49. Turecek R, Trussell LO. Presynaptic glycine recep-tors enhance transmitter release at a mammalian central synapse. Nature. 2001;411(6837):587–590.
50. Lee EA, et al. Presynaptic glycine receptors facili-tate spontaneous glutamate release onto hilar neu-
rons in the rat hippocampus. J Neurochem. 2009; 109(1):275–286.
51. Waseem TV, Fedorovich SV. Presynaptic glycine receptors influence plasma membrane poten-tial and glutamate release. Neurochem Res. 2010; 35(8):1188–1195.
52. Szabadics J, Varga C, Molnar G, Olah S, Barzo P, Tamas G. Excitatory effect of GABAergic axo-axonic cells in cortical microcircuits. Science. 2006; 311(5758):233–235.
53. Jang IS, Nakamura M, Ito Y, Akaike N. Presynaptic GABAA receptors facilitate spontaneous glutamate release from presynaptic terminals on mechanical-ly dissociated rat CA3 pyramidal neurons. Neurosci. 2006;138(1):25–35.
54. Gunther U, et al. Benzodiazepine-insensitive mice generated by targeted disruption of the gamma 2 subunit gene of gamma-aminobutyric acid type A receptors. Proc Natl Acad Sci U S A. 1995; 92(17):7749–7753.
55. Khan ZU, Gutierrez A, De Blas AL. The alpha 1 and alpha 6 subunits can coexist in the same cerebel-lar GABAA receptor maintaining their individual benzodiazepine-binding specificities. J Neurochem. 1996;66(2):685–691.
56. Kralic JE, O’Buckley TK, Khisti RT, Hodge CW, Homanics GE, Morrow AL. GABA(A) receptor alpha-1 subunit deletion alters receptor sub-type assembly, pharmacological and behavioral responses to benzodiazepines and zolpidem. Neu-ropharmacology. 2002;43(4):685–694.
57. Rudolph U, Mohler H. Analysis of GABAA recep-tor function and dissection of the pharmacology of benzodiazepines and general anesthetics through mouse genetics. Annu Rev Pharmacol Toxicol. 2004; 44:475–498.
58. Kasugai Y, et al. Quantitative localisation of syn-aptic and extrasynaptic GABAA receptor subunits on hippocampal pyramidal cells by freeze-fracture replica immunolabelling. Eur J Neurosci. 2010; 32(11):1868–1888.
59. Liu G, et al. Transient inhibition of TrkB kinase after status epilepticus prevents development of temporal lobe epilepsy. Neuron. 2013;79(1):31–38.
60. Malosio ML, Marqueze-Pouey B, Kuhse J, Betz H. Widespread expression of glycine receptor subunit
mRNAs in the adult and developing rat brain. EMBO J. 1991;10(9):2401–2409.
61. Pais I, et al. Sharp wave-like activity in the hip-pocampus in vitro in mice lacking the gap junc-tion protein connexin 36. J Neurophysiol. 2003; 89(4):2046–2054.
62. Huberfeld G, et al. Glutamatergic pre-ictal dis-charges emerge at the transition to seizure in human epilepsy. Nat Neurosci. 2011;14(5):627–634.
63. Currie S, Heathfield KW, Henson RA, Scott DF. Clinical course and prognosis of temporal lobe epilepsy. A survey of 666 patients. Brain. 1971; 94(1):173–190.
64. Bradford MM. A rapid and sensitive method for the quantitation of microgram quantities of protein utilizing the principle of protein-dye binding. Anal Biochem. 1976;72:248–254.
65. Koenig T, et al. Robust prediction of the MASCOT score for an improved quality assessment in mass spectrometric proteomics. J Proteome Res. 2008; 7(9):3708–3717.
66. Förstera B, et al. Irregular RNA splicing cur-tails postsynaptic gephyrin in the cornu ammo-nis of patients with epilepsy. Brain. 2010; 133(pt 12):3778–3794.
67. Brewer GJ, Cotman CW. Survival and growth of hippocampal neurons in defined medium at low density: advantages of a sandwich culture tech-nique or low oxygen. Brain Res. 1989;494(1):65–74.
68. Kowalczyk S, et al. Direct binding of GABA(A) receptor β2 and β3 subunits to gephyrin. Eur J Neu-rosci. 2013;37(4):544–554.
69. Kulik A, et al. Distinct localization of GABA(B) receptors relative to synaptic sites in the rat cerebel-lum and ventrobasal thalamus. Eur J Neurosci. 2002; 15(2):291–307.
70. Gloveli T, et al. Orthogonal arrangement of rhythm-generating microcircuits in the hippocampus. Proc Natl Acad Sci U S A. 2005;102(37):13295–13300.
71. Racine RJ. Modification of seizure activity by elec-trical stimulation. II. Motor seizure. Electroencepha-logr Clin Neurophysiol. 1972;32(3):281–294.
72. Maggio N, Segal M. Persistent changes in ability to express long-term potentiation/depression in the rat hippocampus after juvenile/adult stress. Biol Psychiatry. 2011;69(8):748–753.