Embed Size (px)
Citation preview
Portland State University Portland State University
PDXScholar PDXScholar
Dissertations and Theses Dissertations and Theses
1979
Changes in populations of soil acari during the first Changes in populations of soil acari during the first
year after clearcutting year after clearcutting
Sue Ellen Orlaske Portland State University
Follow this and additional works at: https://pdxscholar.library.pdx.edu/open_access_etds
Part of the Agricultural Science Commons, and the Forest Sciences Commons
Let us know how access to this document benefits you.
Recommended Citation Recommended Citation Orlaske, Sue Ellen, "Changes in populations of soil acari during the first year after clearcutting" (1979). Dissertations and Theses. Paper 2901. https://doi.org/10.15760/etd.2897
This Thesis is brought to you for free and open access. It has been accepted for inclusion in Dissertations and Theses by an authorized administrator of PDXScholar. Please contact us if we can make this document more accessible: [email protected].
AN ABSTRACT OF THE THESIS OF Sue Ellen Orlaske for the
Master of Science in Biology presented November 21, 1979.
Title: Changes in Populations of Soil Acari During the
First Year After Clearcutting.
APPROVED BY MEMBERS OF THE THESIS COMMITTEE~
Earl R. Rosenwinkel, Chairperson
Denni s---w-:--Boddy
Leonard Simpson
~ ! ..
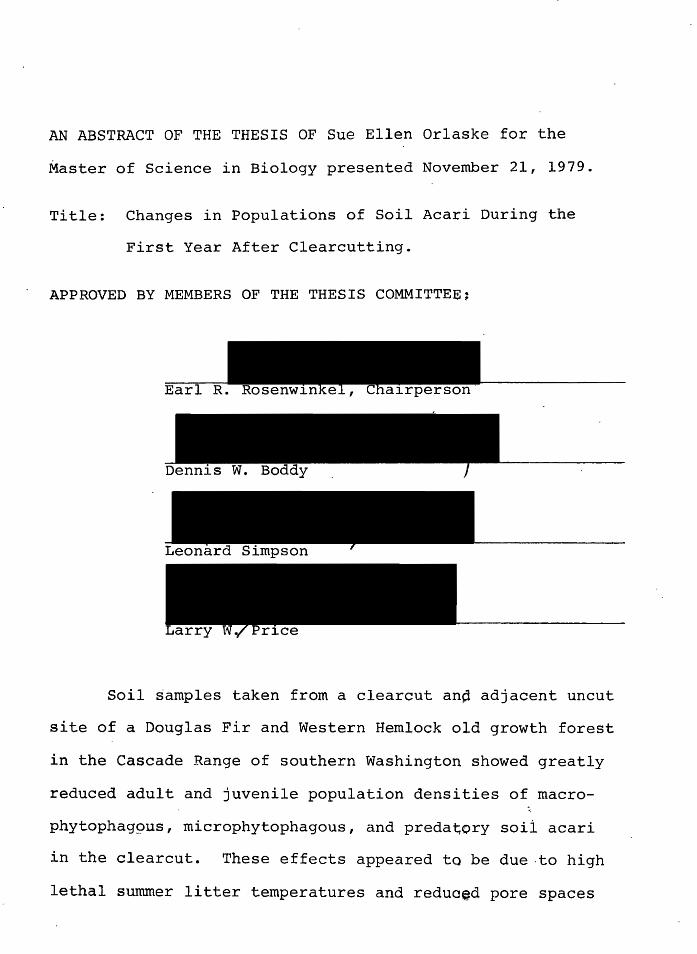
Soil samples taken from a clearcut anp adjacent uncut
site of a Douglas Fir and Western Hemlock old growth forest
in the Cascade Range of southern Washington showed greatly
reduced adult and juvenile population densities of macro-
phytophag9us, microphytophagous, and preda~ory soii acari
in the clearcut. These effects appeared ta be due .to high
lethal summer litter temperatures and reduced pore spaces
1
I I
2
due to scarification. Also, the number of species of acari
in the clearcut was lower than in the control after clear-
cutting.
l .
CHANGES IN POPULATIONS OF SOIL ACARI
DURING THE FIRST YEAR AFTER CLEARCUTTING
by
Sue E. Orlaske
A thesis submitted in partial fulfillment of the requirements for the degree of
MASTERS OF SCIENCE in
BIOLOGY
Portland State University
1979
~
I I I I
TO THE OFFICE OF GRADUATE STUDIES AND RESEARCH:
The members of the Committee approve, the.thesis of
Sue Ellen Orlaske presented November 21, 1979.
Earl R. Eosenwinkel, Chairperson
Leonard S.impson
APPROVED:
of Biology
Stanlev i" .. VR<illCh: J)pan 0Grach1~t-P ~t-nrl i A~ ;:rnn 'RA~A~r,,h

-i l I I
ACKNOWLEDGMENTS
I would like to extend thanks to Dr. Earl Rosenwinkel,
my advisor, and Dr. Ellen Benedict for their help and criti-
cism; Weyerhaeuser Corporatiqn for providing me· with a site;
Mr. Robert Gooding, Kalama District Forest ~anager, Weyer-
haeuser Corporation, for his unending assistance and
patience; Drs. Roy Norton and W. Calvin Welbourn for identi-
fication of my acari specimens; Mr. Rod Crawford for identi-
fication of my araneida specimens; Dr. Richard Forbes for
providing me with laboratory space; Dr. Quentin D. Clarkson
for assistance with statistical analyses; Drs. David Cook
and Gerald Krantz for introducing me to the acari; and Ms.
Esther Gruber £or her contagious enthusiasm. I would also
like to give special recognition and appreciation to my
field assistants: Ellen Benedict, Michael Neiswonger,
Kathy Orlaske, Earl Rosenwinkel, and D. Mitchell Wolgamott.
TABLE OF CONTENTS
ACKN~S • . . LIST OF TABLES
LIST OF FIGURES
INTRODUCTION
Soil Microarthropods . . • • • . • • • • Effects of Clearcutting on Soil Microarthropods Purpose of Study • • • • • • • •
MATERIALS AND ME'IHODS • •
Site Description • Sanpling Procedure
RESULTS AND DISCUSSION
Similarity of Species Composition Macrophytophagous Soil Acari • Microphytophagous Soil Acari Panphytophagous Soil Acari • Predatory Soil Acari • • • . • Vertical Migration • • • . . Soil Canpaction and Scarification T~rature . • • • . • • . • • . • • Moisture •
CONCIDSIONS
BIBLIOGRAPHY
APPENDICES
PAGE
iii
v
vi
1
1 4 6
7
7 9
12
12 13 17 18 19 25 25 27 31
34
37
42
Habitat Data Sheet • . • • • • . • • . • • • • , • • • • • • 42 Classification of Acari, Opiliones, and Araneiqa • • • • . • 43 Tabulation of Data • • • • • • • • • • • . • • • • • . • • • 4 7 United -States Weather Bureau Data • • • • . • , • • • • . • 58

LIST OF TABLES
TABLE
I revel of Significance of Density Differences of the Life Stages of Parholaspella spa.tulata
PAGE
20
~ .
LIST OF FIGURES
FIGURE PAGE
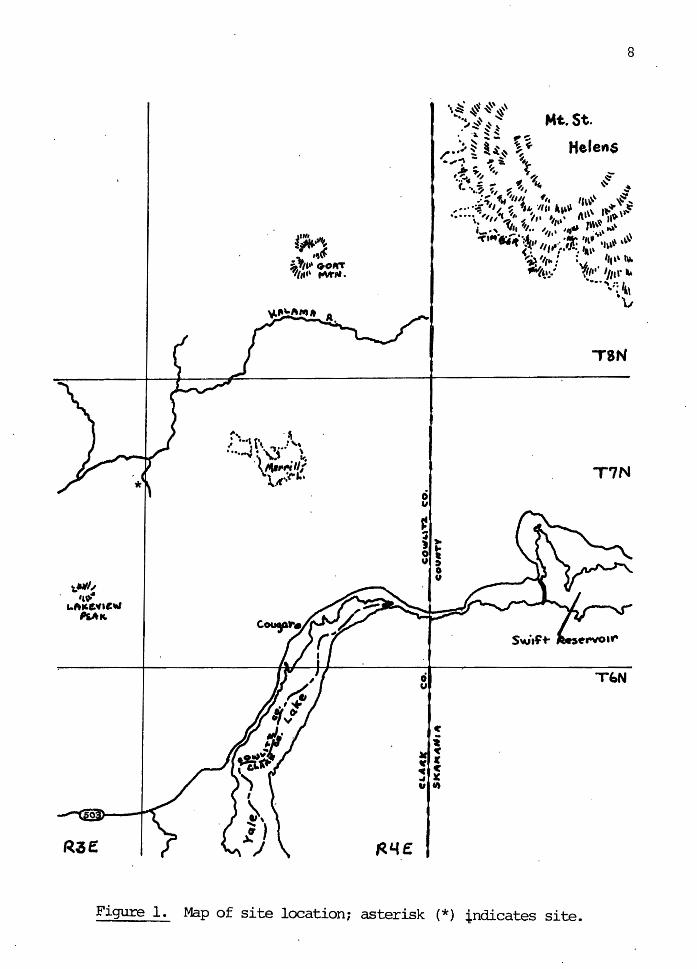
1. Map of site location • • • • • . • • . • . • • • • • • • • 8
2. Illustration of ·plot and numbering system used for s~ling 10
3. S0rensen's Quotient of Similarity applied to the control and clearcut sites for each sanple month . • • . • • • • • 12
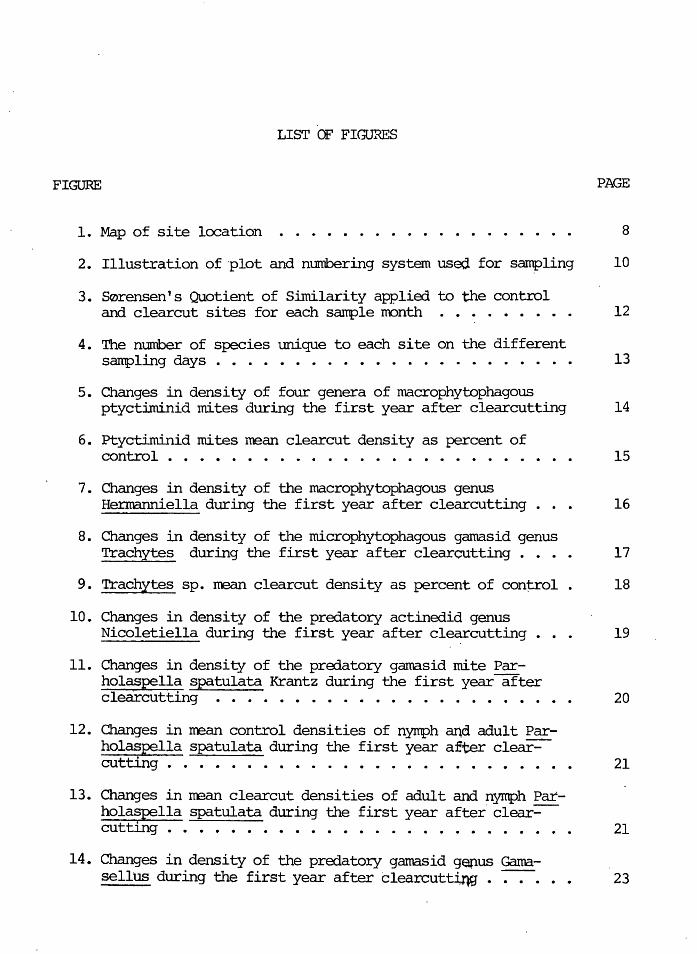
4. The number of species unique to each site on the different sarcpling days . • • • • • • • • • • • • • • . • • • • • . • 13
5. Changes in density of four genera of macrophytophagous ptyctiminid mites during the first year after clearcutting 14
6. Ftyctiminid mites mean clearcut density as percent of control . . . . . . . . . . . . . . . . . . . . . . . . . . 15
7. Changes in density of the macrophytophagous genus Hermanniella during the first year after clearcutting • . • 16
8. Changes in density of the microphytophagous gamasid genus Trachytes during the first year after clearcutting • • • • 17
9. Trachytes sp. mean clearcut density as percent of control • 18
10. Changes in density of the predatory actinedid genus Nicoletiella during the first year after clearcutting • • • 19
11. Changes in density of the predatory gamasid mite Parholaspella spatulata Krantz during the first year after clearcut ting • • • • • • • • • • • • • • • • • • • • • • • 20
12. Changes in nean control densities of nymph and adult Parholaspella spatulata during the first year aft.er clear-cutting • • • • • • • • • • • • • • • • • • • • • • • • • • 21
13. Changes in rrean clearcut densities of adult and nymph Parholaspella spa.tulata during the first year after· clear=----cutting . . . . . . . . . . . . . . . . . . . . . . . . . . 21
14. Changes in density of the predatory gamasid germs Ga.ma-sellus during the first year after clearcutt~ • -. -.-. • • 23
vii
FIGURE PAGE
15. Changes in mean control densities of adult and nymphal Gamasellus during the first year after clearcutting • • • • 23
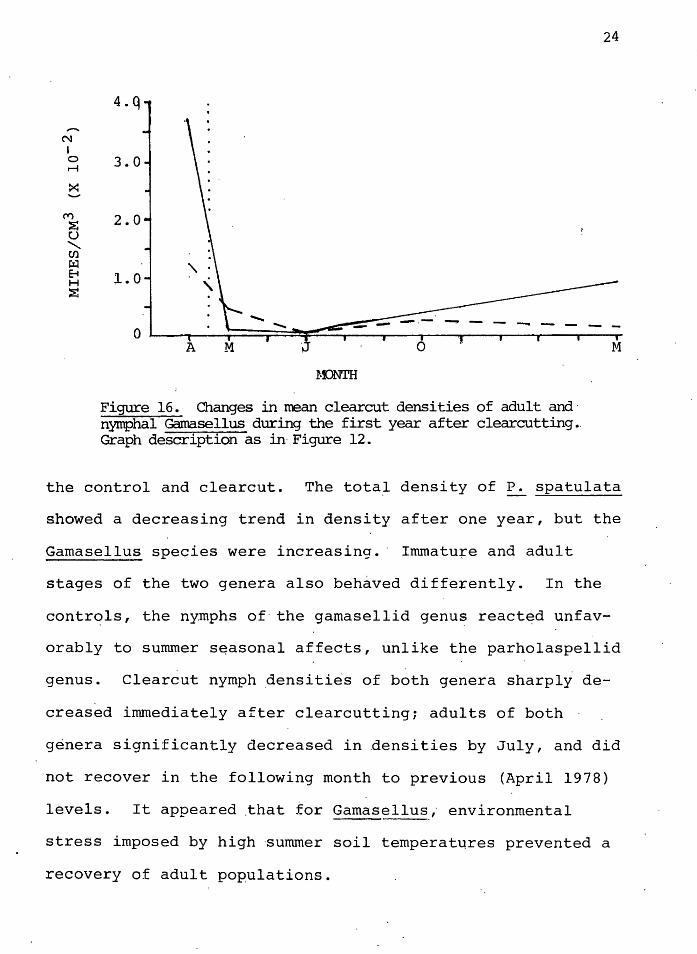
16. Changes in mean clearcut densities of adult and nymphal Gamasellus during the first year after clearcutting • . • • 24
17. Mean temperatures in the controls and clearcuts in the four sampling :rronths following clearcutting • • • • • • • • • • · 29
INTRODUCTION
Clearcutting, a widely-used practice in Europe and
North America, is· considered to be the most economically ex
pedient method of harvesting large stands of timber, both
for efficiency in harvesting and in reforestation (Smith
1962). The practice has been criticized not only for
esthetic reasons but for its effects on watersheds and wild
life. Recently several authors have suggested that clear
cutting results in nutrient depletion in soils (Moore and
Norris 1974, Vitousek et al 1979), disturbance of soil
biota food webs and consequent destruction of soil-building
proce~ses .(Bollen 1974, Mitchell and Sartwell 1974, Moore
and Norris 1974, Szujecki 1971, 1972), and increases in
numbers and densities of pest species (Francke-Grosmann
1963).
Soil Microarthropods
Wallwork (1970) defines soil animals as those which
live in the soil on a permanent or temporary basis. The
most numerous and diverse of these are represented by the
arthropods: Pseudoscorpionida, Araneida, 0Piliones, Acari,
Isopoda, Insecta (larvae and adults), Chilopoda, Symphyla,
Diplopoda, and Pauropoda. The Annelida anq Nematoda are
also abundant. These organisms may be her~~vores, fungi-
·2
vores, or carnivores.
Forest soil animals are usually dependent on detritus
food chains.. The source of their nutrients is litter from
vegetation or the fungi and bacteria which utilize the lit-
ter. Larger· organisms, such as lumbricid annelids, general-
ly play a mech~riical r~le in litter breakdown, while smaller
animals are considered ·to be regulators of the. decomposition
of these r~sidues (Crossley 1977b, Edwards and Heath 1963,
Ghilarov 1963, 1971). This regulation may be accomplished
directly by feeding on the litter and associated microflora
.(Engelmann 1961, Gist and Crossley 1975), or indi~ectly by
mixing the soil, enriching the soil.with their feces, elim-
inating mycostasis and bacteriostasis (MacFadyen 1963), dis-
tributing fungal spores to favorable sites for germination
(Witkamp 1960),· enhancing microbial growth by browsing of
senescent colonies (Hinshelwood 1951) .and by· exposing new
·material_ (Engelmann 1961), providing a substrat~·for micro-
flora with their feces (McBrayer 1973) ,·-inoculating litter
with microbes and microbial spores (Crossley 1977b, Engel-
mann 1961, Ghilarov 1963), and fragmenting the litter mater
ial (Gray and Wiiliams 1971, Kurcheva 1960, Witkamp' and
Crossley 1966). As such, soil animals have a significant
role in soil development and-nutrient cycling (Gornaby 1977,
Crossley 1977a, MacFadyen 1961).
Soils under coniferous forests are acidic in nature
and are therefore favorable for the proliferation of soil
l '
fungi (Griffin 1972). Acid conditions, however, are unfav
orable for many soil animals, such as lumbricid annelids,
diplopods, and isopod~. Therefore the dominant groups of
microarthropods which occur in coniferous soils are fungi
vorous mites of the suborder Oribatida and fungivorous in
sects of the order Collembola (Huhta et al 1967, Krantz
1978, Wallwork 1976).
3
Soil microarthropods are horizontally distributed in
the soil in a.contagious way (Hartenstein 1961, MacFadyen
1962, Mitchell 1978). Microhabitat appears to be important
in this 'clumping'effect, but the specifics of this are not
clearly understood. Even 'pure' woodland stands may show
local variations in biological characteristics of the forest
floor which may influence distribution patterns (Cornaby
1977, MacFadyen 1968, Wallwork 1976). Mitchell (1978) in
dicates that horizontal distribution varies with species
among oribatid mites, and that distributio~ is positively
correlated with moisture for those mites inhabiting soil
layers below 2.5 cm, and negatively. or not correlated for
those mites inhabiting organic layers above 2.5 cm. Harten
stein (1961) indicates that food availability causes aggre
gation of oribatids in the laboratory, and predatory mites
of the suborder Gamasida are attracted to these sites in
directly.
Microarthropods are a~so vertically distributed in
the soil .. Some are mainly litter inhabitaqts, some are fer-
4
mentation layer inhabitants, and some occupy the humus hori
zon. Immatures appear to inhabit deeper horizons (Mitchell
1978). Vertical migrations may be seasonal or diurnal, and
may be correlated with soil moisture (Madge 1964, Mitchell
1978), temperature (Madge 1965, Wallwork 1959, 1960), avail
able food supplies {Wallwork 1958, 1960), and carbon dioxide
levels (MacFadyen 1968).
Effects of Clearcutting_on Soil Microarthropods
The effects of .clearcutting on soil microarthropods
have not been w·ell-covered in the literature. Few major
studies have been made, and fewer still analyze density and
diversity changes of populations. Most studies group all
mites, all spiders, etc. together as if the groups perform
identical roles in the soil community {Cornaby 1977). The
results have been inconclusive.
Huhta et al (1967, 1969) conducted a major study of
the effects of forest management on soil arthropods, nema
todes, and annelids inhabiting coniferous forest soil. They
compared several sites in Finland which had been uncut (con
trols), clearcut one year previously, slash-burned, etc.
The sites, although not adjacent, weie chos~n for similarity
in vegetation. They found that oribatid mites increased, in
density during the first year after clearcutting, but not
significantly. They attributed this effect to the increased
moisture resulting from slash accumulation puring clearcut-
ting, rather than to food availability. The densities of
oribatid mites dropped significantly below the densities in
the control plots after the second year, and remained low.
5
'Other Acarina' in the study, considered as a group, follow-
ed a similar pattern. Huhta et al (1967) concluded th~t.the
taxa of Acari are too heterogenous to serve as a basis for
conclusions. They noted however that the same species ap
peared to dominate in the controls and clearcuts, but the
number of species increased due to influx of different ones
into the clearcut area. Moritz (1965) found that dominant
species of oribatid mites change after clearcutting, and
Szujecki (1971, 1972) noted a change of staphylinid beetles
fro~ specific feeders to eurytopic species after clearcut-
ting.
Vlug and Borden (1973) examined a site in British
Columbia one.year after clearcutting, and emphasized verti-
cal migration through the first 10 cm of soil. Density de
crased in logged areas in all four levels of soil studied.
The family Oribatulidae of oribatid mites showed the great-
est increase in abundance, from 3.7% in the controls to
17.7% in the clearcuts. Correlations of densities with
physical parameters (moisture, temperature, and pH) were
not significant, and they indicated that such factors as
food supply may be important.
Huhta (1976) examined numbers, biomasp, and community
respiration of various soil invertebrates t~ clearcuts
3-13 years of age. Only enchytraeid annelids showed a dis
tinctly greater biomass than controls, and only in sites
8-13 years old. The total biomass increased strongly after
clearcutting, mainly due to lumbricid and enchytraeid popu
lation increases. The total biomass of ar~hropods did not
exceed controls at any stage. Increases in community res
piration followed that of biomass, but was more evident.
This was attributed to the higher average temperatures in
the soils of clearcut areas; again, enchytraeids made the
largest contribution. Huhta concluded that.t~e·temporary
increase was due to slash decomposition at the time of
clearcutting, but that a very limited number of species
appear to use most of the extra resources. As the organic
matter is consumed, the animal biomass diminishes, and
micr9arthropods evidently flourish at an earlier stage of
decomposition- than the enchytraeids.
Purpose of Study
6
BecaQse mites play an important role in soil-formation
processes, and subsequent nutrient release, representative
macrophytophagous, microphytophagous, and predatory genera
or ~pecies were studied in a qlearcut area, The population
densities were followed during the first·year after logging
in adjacent sites to determine if the practice of clearcut
ting has an effect on them, and, 'if so, .to determine what
type of population changes occur, and why.
T ,
MATERIALS AND METHODS
Site Description
Soil-litter samples were taken from a northwest-facing
ridge on the Weyerhaeuser St. Helens Tree Farm in the Kalama
River district of Washington, Cowlitz County, T7N-R3E, Sec
tion 13. See Figur~ 1. ~he tree farm is in the Tsuga
heterophylla Zone of the mesic temperate conferous forests
(Franklin and Dyrness 1973). The study area is an old
growth stand which includes Douglas Fir, Pseudotsuga
menziesii (Mirb.) Franco; Western Hemlock, Tsuga heterophyl
la (Raf.) Sarg.; Pacific Silyer Fir, Abies amabilis (Dougl.)
Forbes; Western White Pine, Pinus monticola Dougl. ex D.
Don; Vine Maple, Acer circinatum Pursh; Salal, Gaultheria
shallon Pursh; Red Huckleberry, Vaccinium parvifolium Smith;
Blue Huckleberry, Vaccinium membranaceum Dougl. ex. Hook.;
Oregon Grape, Berberis nervosa Pursh; .comm0n Beargrass,
Xerophyllum tenax Nutt., and numerous lichens and mosses.
The ridge has a slope of 20%. The soil belongs to the Yale
series, which are deep, medium-textured, w~ll-drained red
dish-brown Laterites developed from deep deposits of volcan
ic ash and pumice. The 50-year site index is 120' for
Douglas Fir and 110' for Western Hemlock (Duncan and Stein
brenner 1973). Elevation is 731.5 m. Mean annual precipi
tation is 250 cm; mean annual ·temperature ip 8-9 degrees
NL..J..
NSJ..
8
,, 0 c ft a o .. ( < ,.
a
Centigrade, with a January mean minimum temperature of -2.5
degrees Centigrade, and a July mean maximum temperature of
24.5 degrees Centigrade {Franklin and Dyrness 1973)·.
9
On April 15, 1978 a study area was selected on the
ridge where a cut line had already been surveyed and marked
by the Weyerhaeuser Corporation. The cut line ran northeast
to southwest. The forest to the.southeast of the line was
not to be logged, and was used as the control site. The
forest to the northwest of the line was part of a 95-acre
unit logged by Weyerhaeuser between April 17 and May 20,
1978, and was used as the experimental site. The unit was
not sprayed with herbicides, since Red Alder, Alnus rubra
Borg., and other plant competitors of seedling Douglas Fir
were absent, and since shrubs such as Vaccinium sp. shade
soils. The unit was not slash-burned since little slash was
left after logging {R. Gooding, pers. comm.)._ The 95-acre
unit had an average yield of 150 cunits per acre; however,
the ridge averaged only 85 cunits per acre. Most of the
timber from the ridge was used for pulp.
Sampling Procedure
Samples were collected April 16 (pre-logging), May 20,
July 29, October 7, 1978, and March 29, 1979, approximately
35 m so~theast of the cut line in the unlo9ged site, and
approximately 20 m northwest of the cut lin~ in the logged
site. Each site was divided into four plot~, and' ea·ch plot
10
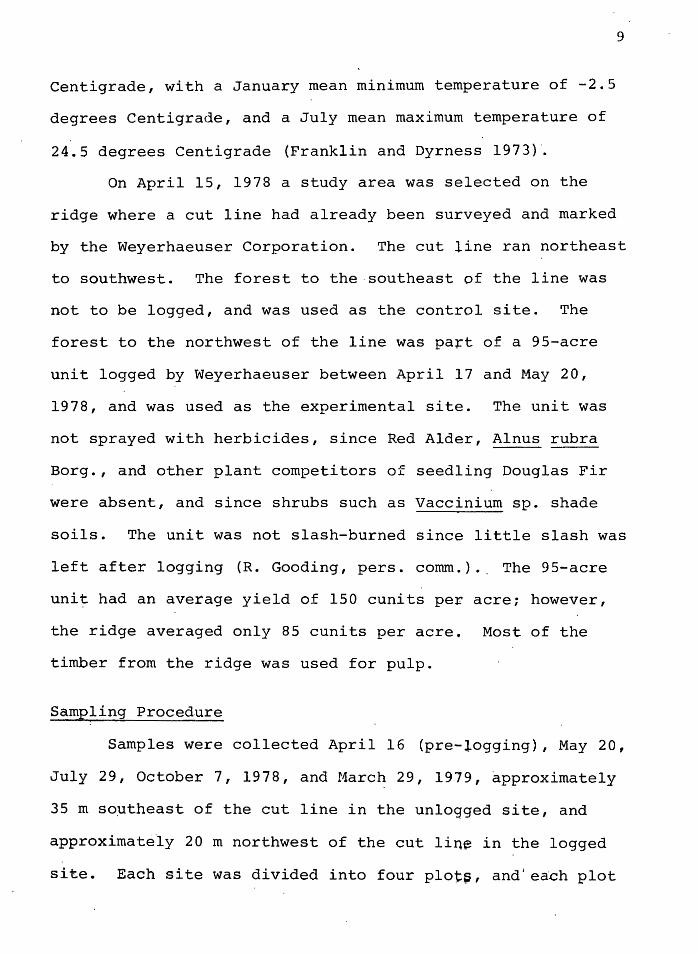
was marked into 28 stations spaced at 3.33 m intervals
(Figure 2). On each sampling day, litter and soil were
collected from four randomly-sampled stations per plot.
Each soil-litter sample measured 13 cm deep and 10 cm in di-
ameter, and was trowel-collected and placed in an individual
plastic bag. Each sample bag was numbere~ consecutively and
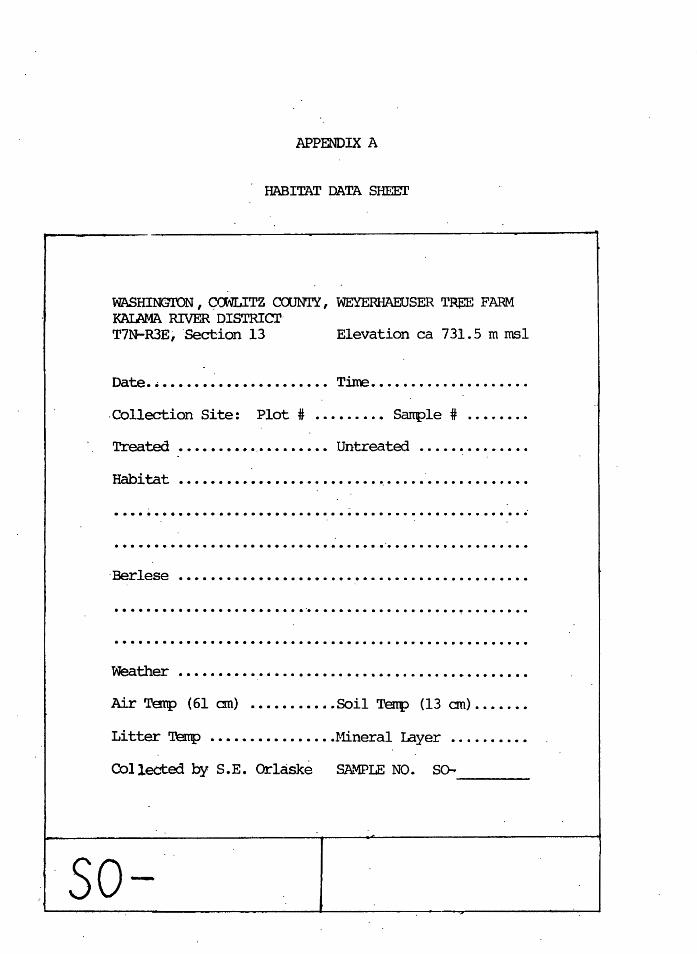
habitat data (Appendix A) were recorded fo~ each. Two of
the four samples were randomly-selected from each plot to
be divided into upper and lower core halves; these were
bagged and numbered ~eparately.
In each plot, temperatures were measured using a Yel-
low Springs Tele-Thermometer (Model 46) attached to thermi-
stors placed 61 cm above the soil surface, 1 cm below the
I l• 8• . 9• 16• .. . 17• 24• . 2s•
23• 26. 2• 7• io· . . 15• . is· . .
~ ~
0 M 3• 6• 11· . 14· 19• . 22• 27• .
L 4• 5• 12• . . 13• 20• . 21• 28•
20 ~ters
Figure 2. Illustration of plot and numberb)s system used for sampling; four plots were designated in botll 'the control and in the clearcut areas.
11
soil surface (re~erred to as 'surface' or 'littor' tempcri1-
ture in the text), and 13 cm below the soil surface.
Soil moisture readings were taken only in Octob~r and
March using a Soiltest MC300A Moisture meter.
Soil organisms were extracted from each sample into
70% ethyl alcohol using individual Berlese funnels equipped
with 25-watt light bulbs as described by Wallwork (1970).
The samples were sorted and statistically analyzed as
follows: some groups of mites were analyzed for relative
abundance, using the negative binomial transformation
x' = log10 (X + k)
were X is the density of the sample, and k is equal to one
(Anscombe 1949, Berthet and Gerard 1965, Gerard and Berthet
1966); other groups of mites were sorted for frequency of
occurrence using the angular transformation
x' = arcsinv'p
where p is the proportion of samples per site in which the
group occurs (Sokal and Rohlf 1969). The negative binomial
transformation and the angular transformation allow analysis
of variance to be utilized on contagious, or clumped, popu
lation distributions.
RESULTS AND DISCUSSION
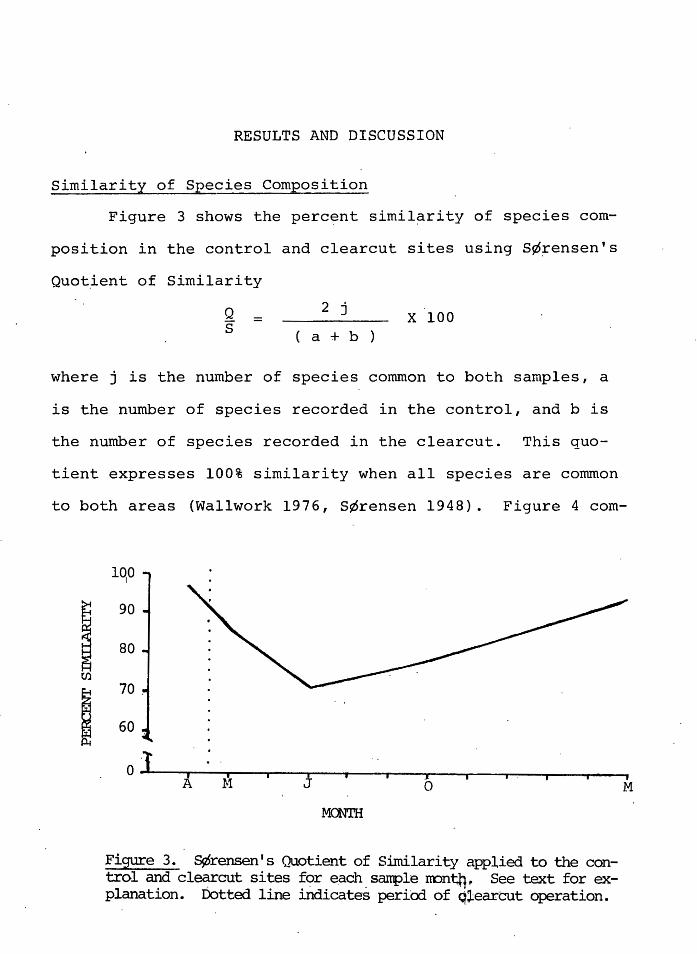
Similarity of Species Composition
Figure 3 shows the perc~nt simil~rity of species com-
position in the control and clearcut sites using S¢~ensen's
Quot~ent of Similarity
Q s =
2 j x 100 a + b
where j is the number of species common to both samples, a
is the number of species recorded in the control, and b is
the number of species recorded in the clearcut. This quo-
tient expresses 100% similarity when all species are conunon
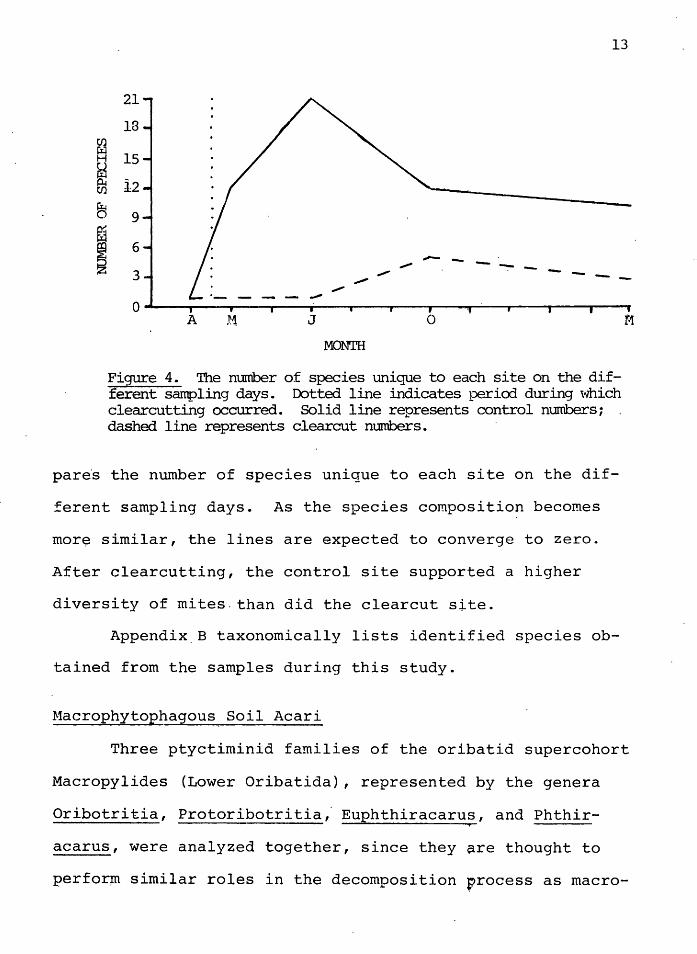
to both areas (Wallwork 1976, s¢rensen 1948). Figure 4 com-
I CJ)
~
lqo
90
80
70.
60
oJ I ' J I I . ' I A I ' I
M J 0
MONTH
Fi~e 3. S¢rensen's Quotient of Similarity applied to the control and clec:rrcut sites f<:>r ~ach.sanple rron'tj'f~ See text for explanation. Dotted line indicates periOd of q~earcut operation.
' M
13
21
18 U) ~
15 H
~ i2 U)
f:!;.; 0 9 ffi
6 .,,,,,.,. ~ 3.J /: - ~ --- -.,,..,, - - -~
0 A M J 0
.MONTH
Figure 4. The number of species unique to each site on the different sarrpling days. Dotted line indicates pericxl during which clearcutting occurred. Solid line represents control mrrnbers; dashed line represents clearcut numbers.
pare·s the number of species unique to each site on the dif-
ferent sampling days. As the species composition becomes
mor~ similar, the lines are expected to converge to zero.
After clearcutting, the control site supported a higher
diversity of mites.than did the clearcut site.
Appendix_B taxonomically lists identified species ob-
tained from the samples during this study.
Macrophytophagous. Soil Acari
f1
Three ptyctiminid families of the oribatid supercohort
Macropylides (Lower Oribatida), represented by the genera
Oribotritia, Protoribotritia, Euphthiracarus, and Phthir-'
acarus, were analyzed together, since they ~re thought to
perfor7Jl similar roles in the decomposition process as macro-
4.5
-N
b r-1 3.0 c.
M
~ ~ ~
1.5
0
I :--
J I
A
14
' ....... .....
....... - - - -i I r I f M J 0
------M
MONTH
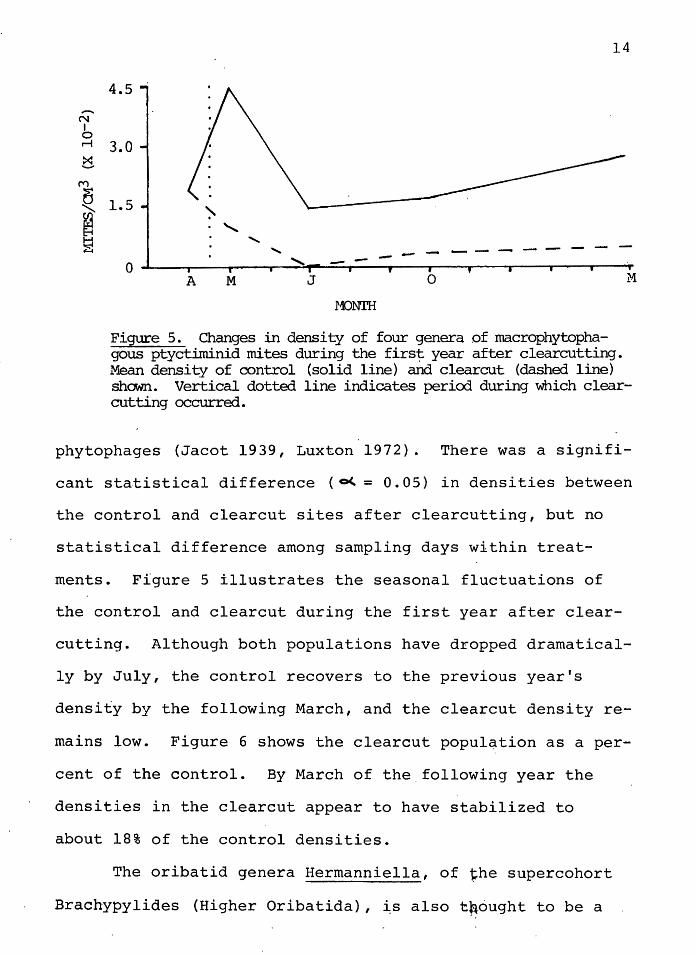
Figure 5. Changes in density of four genera of macrophytophagous ptyctiminid mites during the first year after clearcutting. Mean density of control (solid line) and clearcut (dashed line) shown. Vertical dotted line indicates period during which clearcutting occurred.
phytophages (Jacot 1939, Luxton 1972). There was a signifi-
cant statistical difference ( o<.. = 0. 05) in densities between
the control and clearcut sites after clearcutting, but no
statistical difference among sampling days within treat-
ments. Figure 5 illustrates the seasonal fluctuations of
the control and clearcut during the first year after clear-
cutting. Although both populations have dropped dramatical-
ly by July, the control recovers to the previous year's
density by the following March, and the clearcut density re-
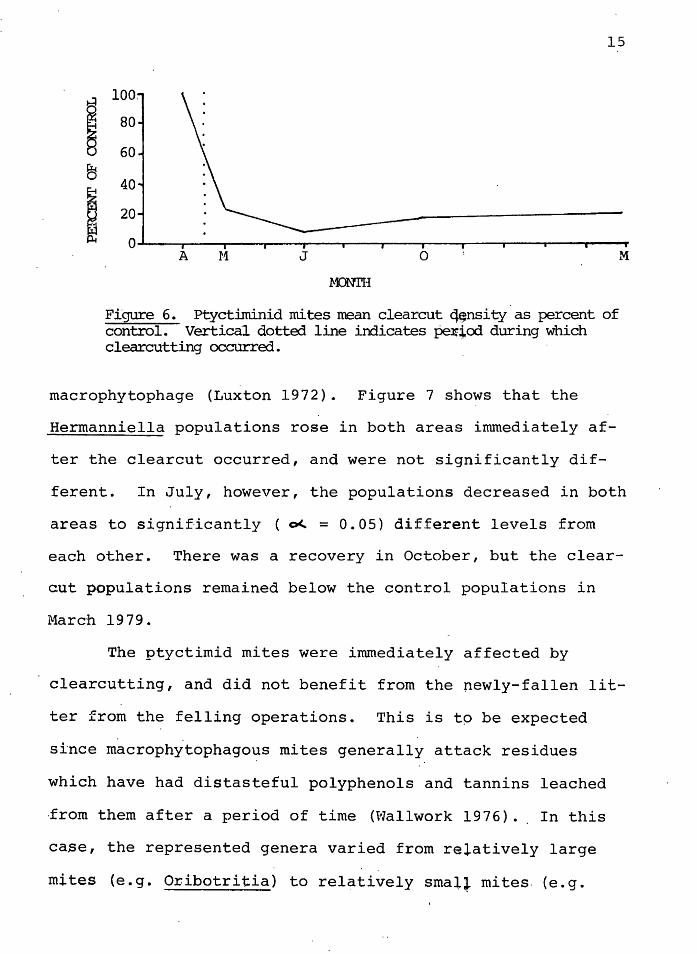
mains low. Figure 6 shows the clearcut population as a per-
cent of the control. By March of the.following year the
densities in the clearcut appear to have stabilized to
about 18% of the control densities.
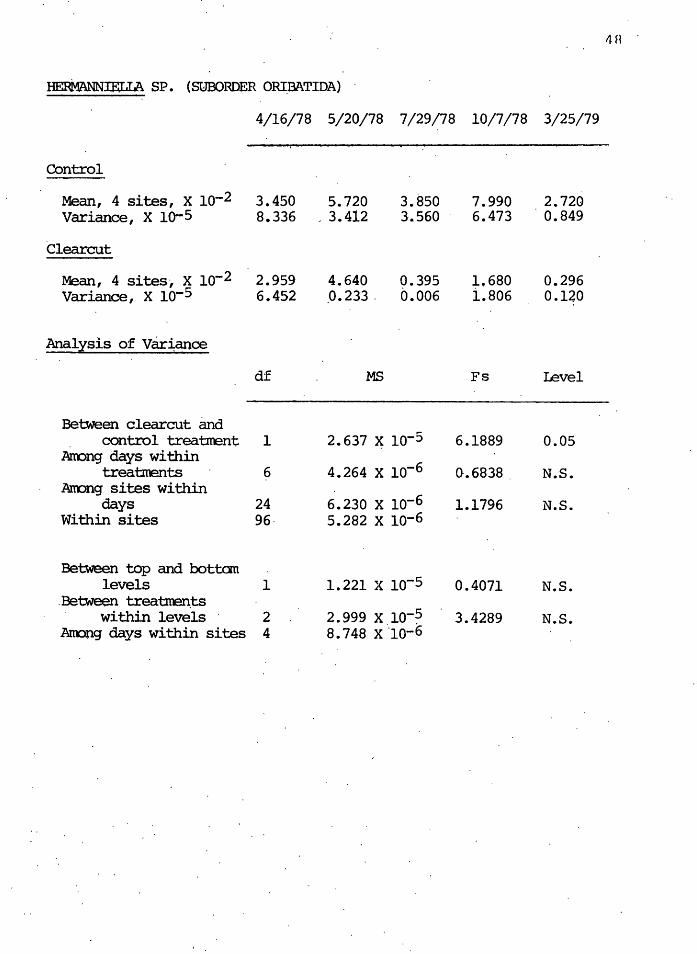
The oribatid genera Hermanniella, of ihe supercohort
Brachypylides (Higher Oribatida), ~s also t~ought to be a
15
i ~
~ i'.l.i
100.
80
60
40
20
0 A M J 0
MONTH
Figure 6. Pcyctiminid mites mean clearcut q~nsi ty as percent of control. Vertical dotted line indicates pe11~od during which clearcutting occurred.
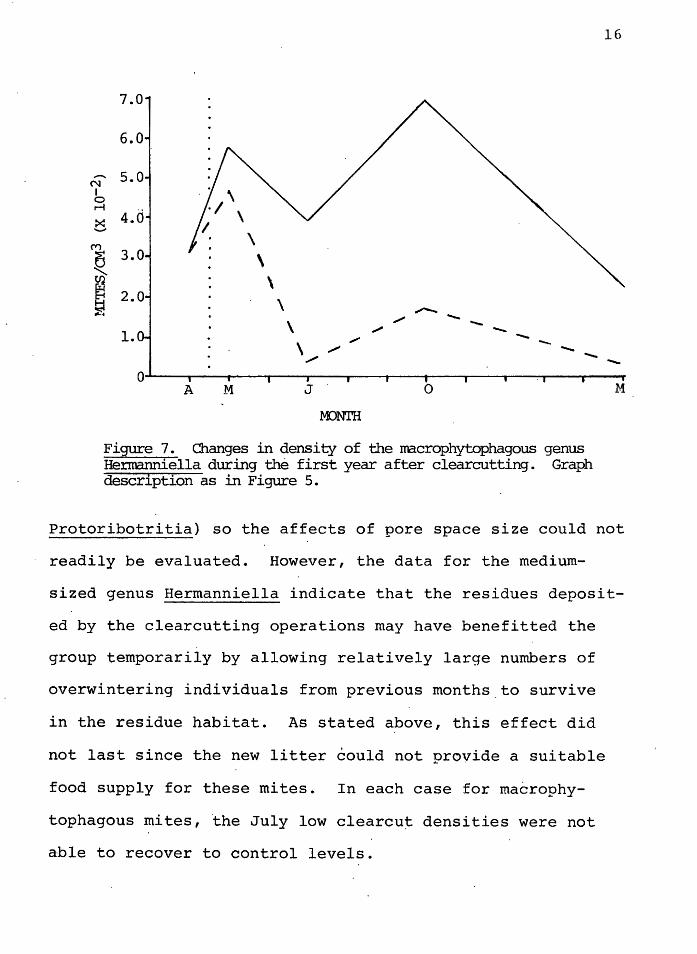
macrophytophage (Luxton 1972). Figure 7 shows that the
Hermanniella populations rose in both areas immediately af-
ter the clearcut occurred, and were not significantly dif-
M
ferent. In July, however, the populations decreased in both
areas to significantly o<.. = 0.05) different levels from
each other. There was a recovery in October, but the clear-
cut populations remained below the control populations in
March 1979.
The ptyctimid mites were immediately affected by
clearcutting, and did not benefit from the newly-fallen lit-
ter from the felling operations. This is tp be expected
since macrophytophagous mites generally attack residues
which have had distasteful polyphenols and tannins leached
.from them after a period of time (Wallwork 1976) •. In this
case, the represented genera varied from relatively large
mites (e.g. Oribotritia) to rel?tively sma:L:J. mites. {e.g.
l . (
:
7.0
6.0
N' 5.0 I 0 ,......
>:: 4.d -(V')
~ 3.0 U)
~ 2.0
1.0
\ .....-... / ......
\ ..._ ,,,,. ...._
_,,.. ...._ \ -/ ..._
/ ...._
0 A M J 0
MONTH
Figure 7. Changes in density of the macrophytophagous genus Hermanniella during the first year after clearcutting. Graph description as in Figure 5.
16
..._
-.M
Protoribotritia) so the affects of pore space size could not
readily be evaluated. However, the data for the medium-
sized genus Hermanniella indicate that the residues deposit-
ed by the clearcutting operations may have benefitted the
group temporarily by allowing relatively large numbers of
overwintering individuals from previous months to survive
in the residue habitat. As stated above, this effect did
not last since the new litter could not provide a suitable
food supply for these mites. In each case for macrophy-
tophagous mites, the July low clearcut densities were not
able to recover to control levels.
17
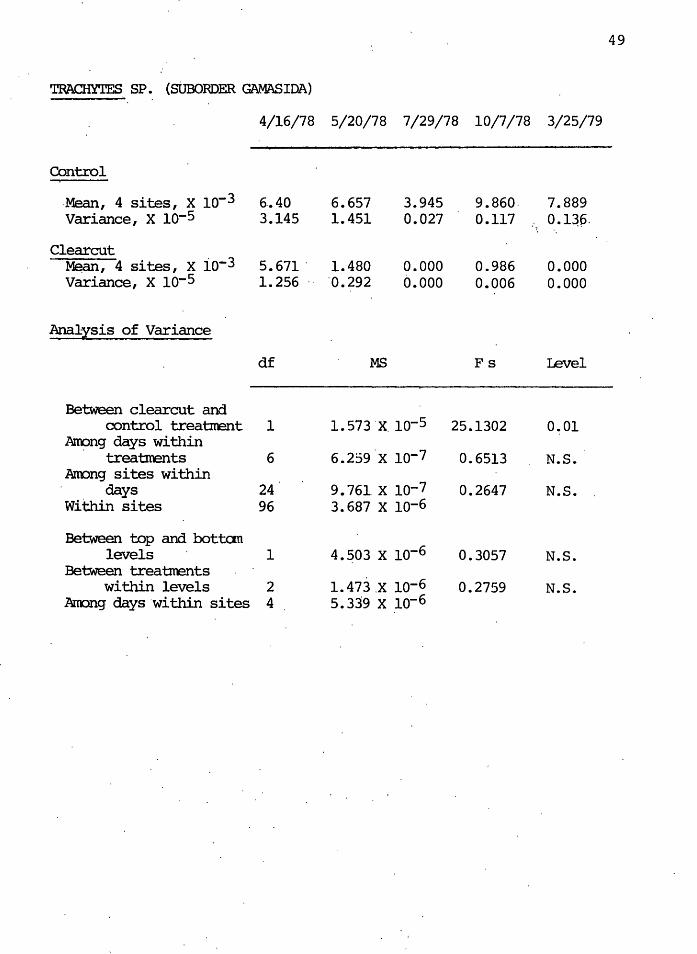
Microphytophagous Soil Acari
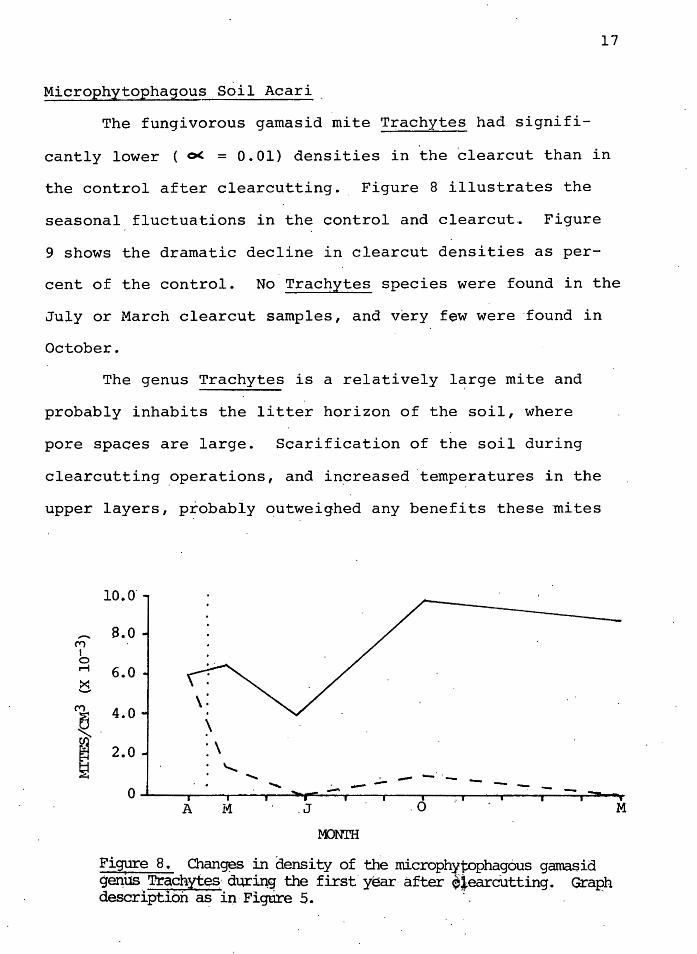
The fungivorous gamasid mite Trachytes had signifi-
cantly lower ( 0( = 0.01) densities in the clearcut than in
the control after clearcutting. Figure 8 illustrates the
seasonal fluctuations in the control and clearcut~ Figure
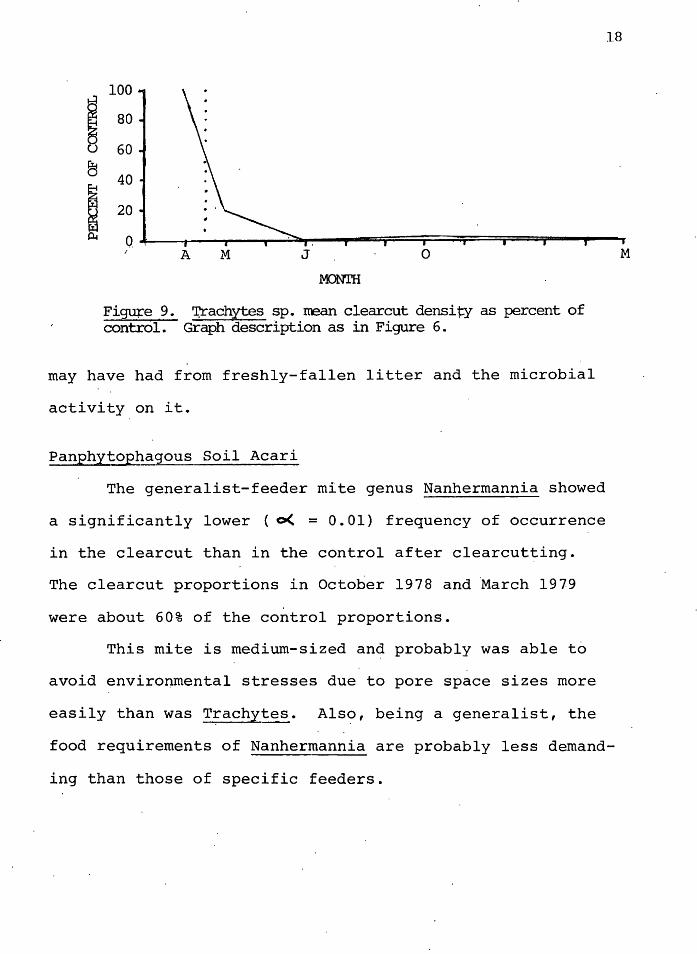
9 shows the dramatic decline in clearcut densities as per-
cent of the control. No Trachytes species were found in the
July or March clearcut samples, and v~ry few were ·found in
October.
The genus Trachytes is a relatively l~rge mite and
probably inhabits the litter horizon of the soil, where
pore spaces are large. Scarification of the soil during
clearcutting _operations, and in~reased ·temperatures in the
upper layers, probably qutweighed any benefits these ·mites
-M I 0 r-1
::< -M a i ~
10.ff
8.0
6.0
4.0 \:
\
2.0 : \ ""
0 .......
....... I I I
- - - - - ---- - -A M .J .o
MONTH
Figure 8. Chan~s in density of the microph~toph~gous gama~id g~us.Trachyt~s· dur~'!f the first'ysar after e•earcutting. Graph description a~ in· Figures. ·
M
1.8
~ u
~
;
100
80
60
40
20
0.
Figul="e 9. control.
A M J 0
MONTH
'J;,'rachytes sp. mean clearcut density as percent of Graph description as in Figure 6.
may have had from freshly-fallen litter and the microbial
activity on it.
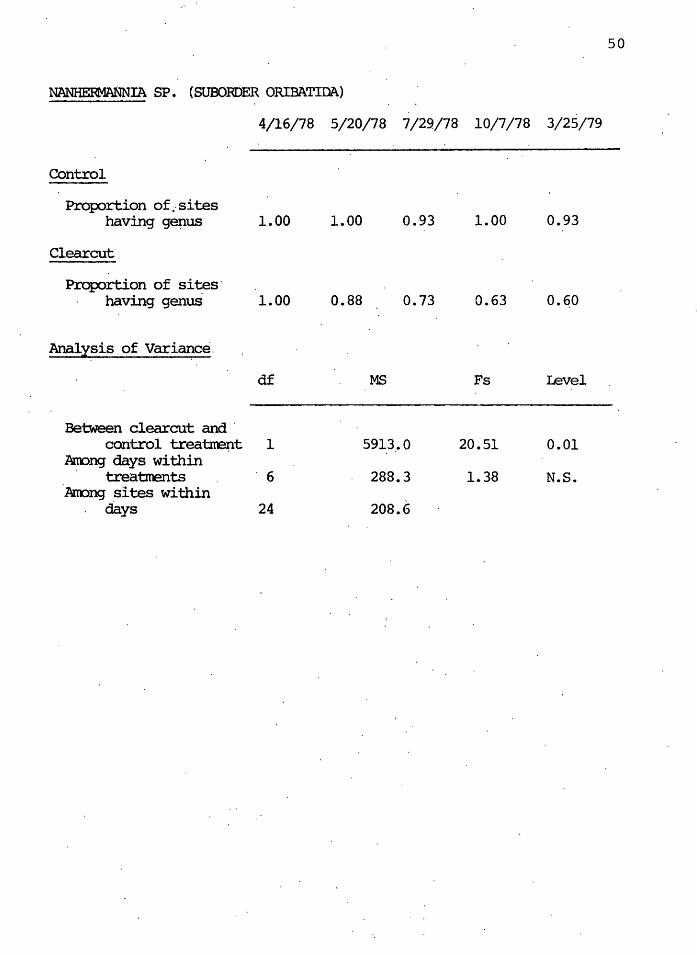
Panphytophagous Soil Acari
The generalist-feeder mite genus Nanhermannia showed
a significantly lower ( o<. = 0. 01) frequency of occurrence
in the clearcut than in the control after clearcutting.
The clearcut proportions in October 1978 and ·March 1979
were about 60% of the control proportions.
This mite is medium-sized and probably was able to
avoid enviro~mental stresses due to pore space sizes more
easily than was T~achyt~s. Also, being a generalist, the
food requirements of Nanhermannia are probably less demand-
ing than those of specific feeders.
M
19
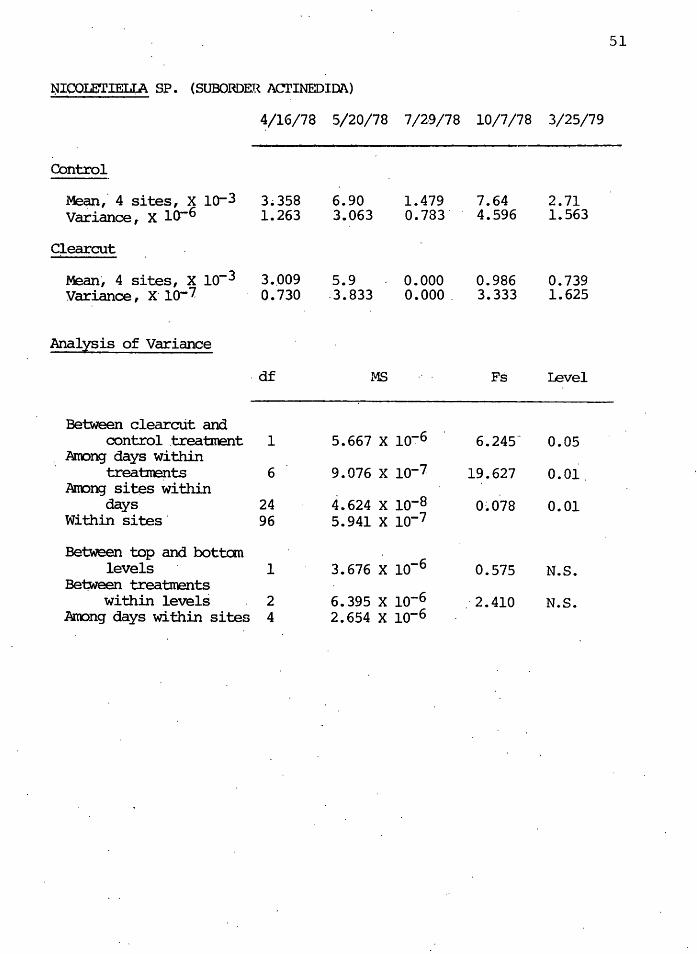
Predatory Soil Acari
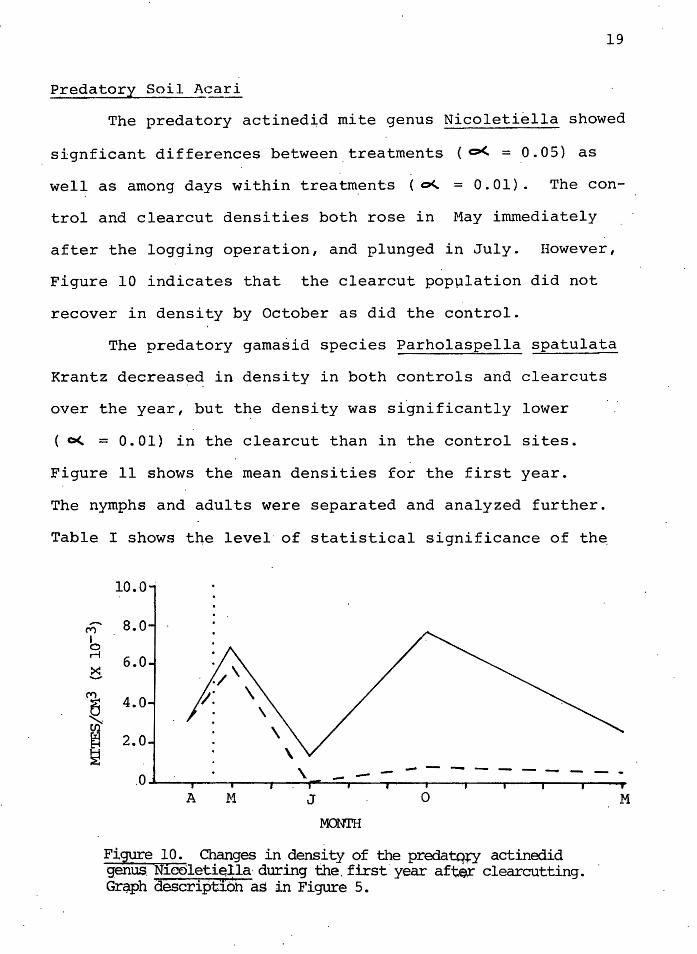
The predatory actined~d mite genus Nicoletiella showed
signficant differences between.treatments ( o<. = 0.05) as
well as among days within treatm,ents ( o<.. = 0. 01). The con
trol and clearcut densities both rose in May immediately
after the logging operation, and plunged in July. However,
Figure 10 indicates that the clearcut popµlation did not
recover in density by October as did the control.
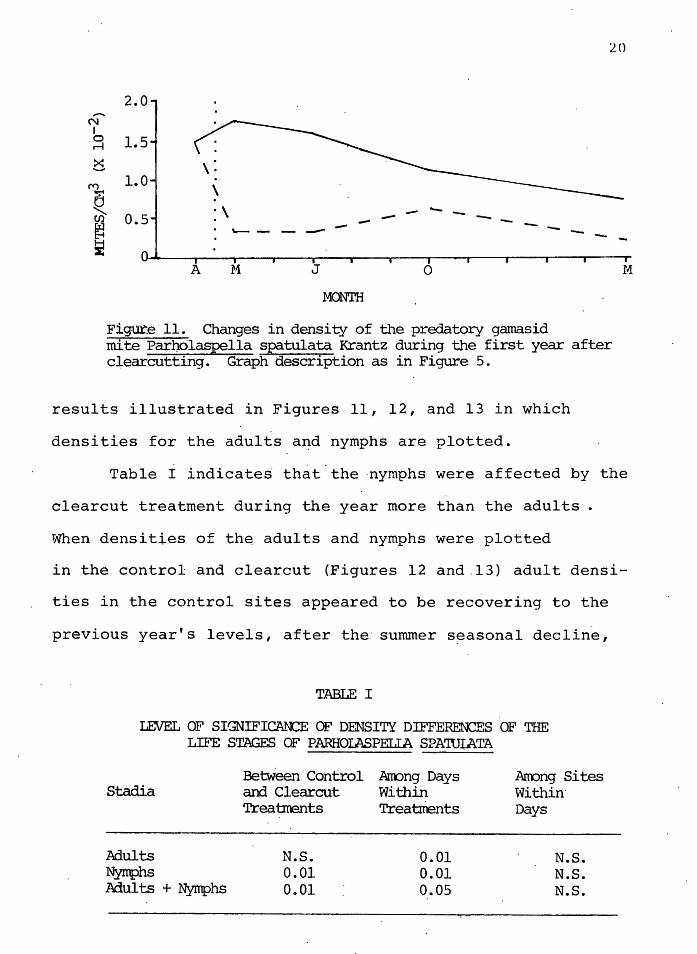
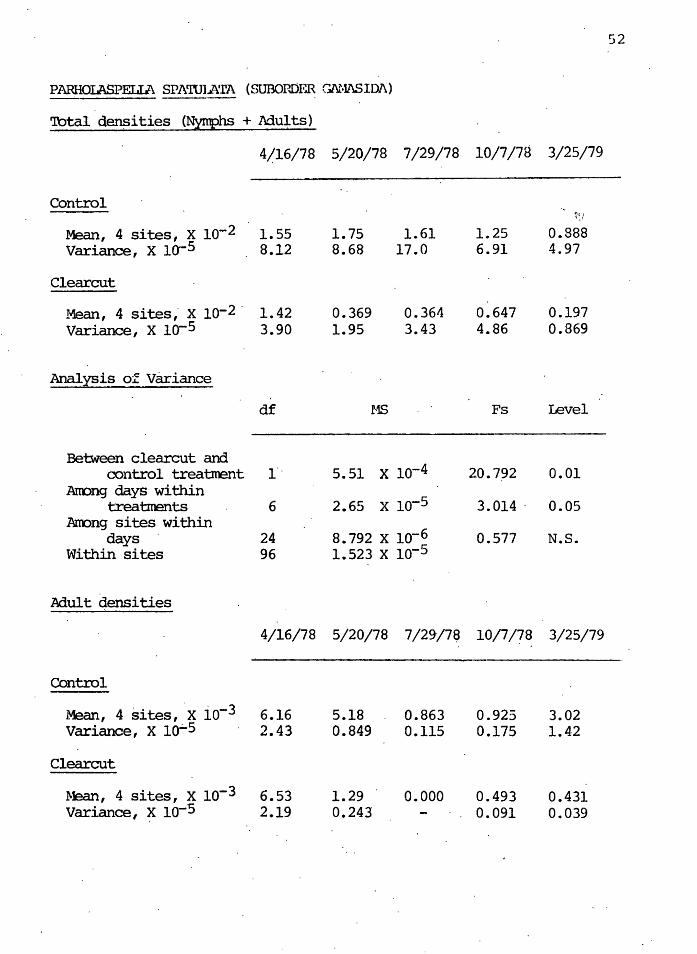
The predatory gamasid species Parholaspella spatulata
Krantz decreased in density in both controls and clearcuts
over the year, but the density was si~nificantly lower
( o<. = 0.01) in the clearcut than in the control sites.
Figure 11 shows the mean densities for the first year.
The nymphs and adults were separated and analyzed further.
Table I shows the level· of statistical significance of th~
-M I 0 ~
c M
~ ~ tl.l
~
10.0
8.0
6.0
4.0
2.0
.0.l \. ------~----. A ~·1 J 0
MONTH
F:lgure 10. CI;anges in .dens.i ty ~f tl?e predatqcy actinedi~ genus. Nieolet1~lla·during the.first year afte~ clearcutting. Grq.ph descriptibh as in Figure 5.
M
:rn
2.0 .......
N I 0 1.5 r-l
c. CV) \ 1.0 ~ B ~ 0.5 : \ - - - - --~ ~
-'-'-- - - __..
0 A ~1 J 0
MONTH
~,ig:ur.e 11. Changes in density of the predatory gamasid mite Par}Jrilaspella spatulata Krantz during the first year after clearcutting. Graph description as in Figure 5.
results illustrated in Figures 11, 12, and 13 in which
densities for the adults a~d nymphs are plotted.
M
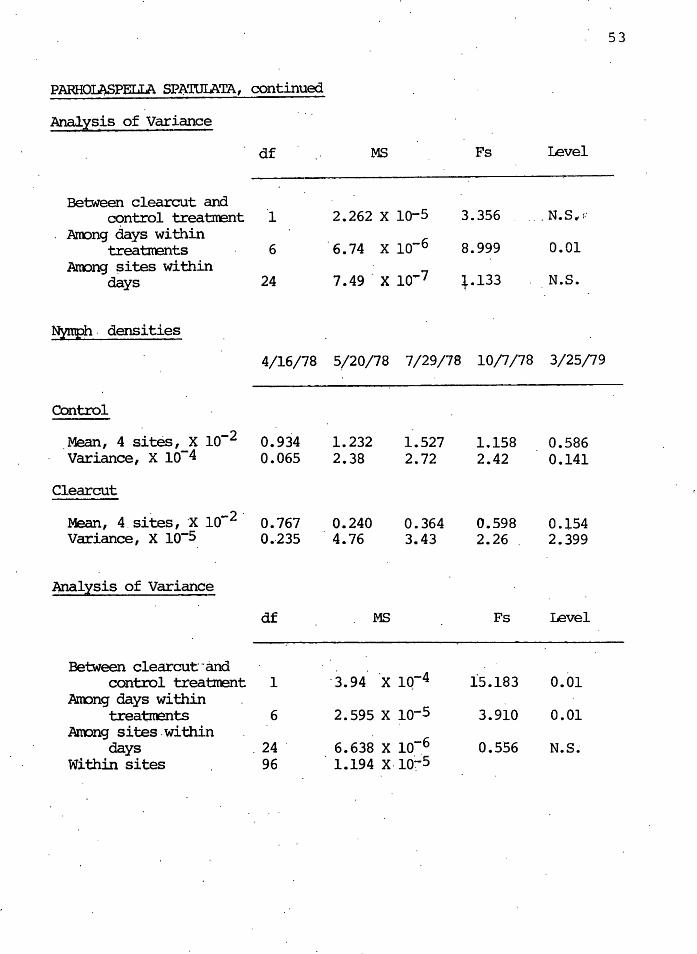
Table I indicate~ th~t.the ·nymphs were affected by the
clearcut treatment during the year more than the adults .
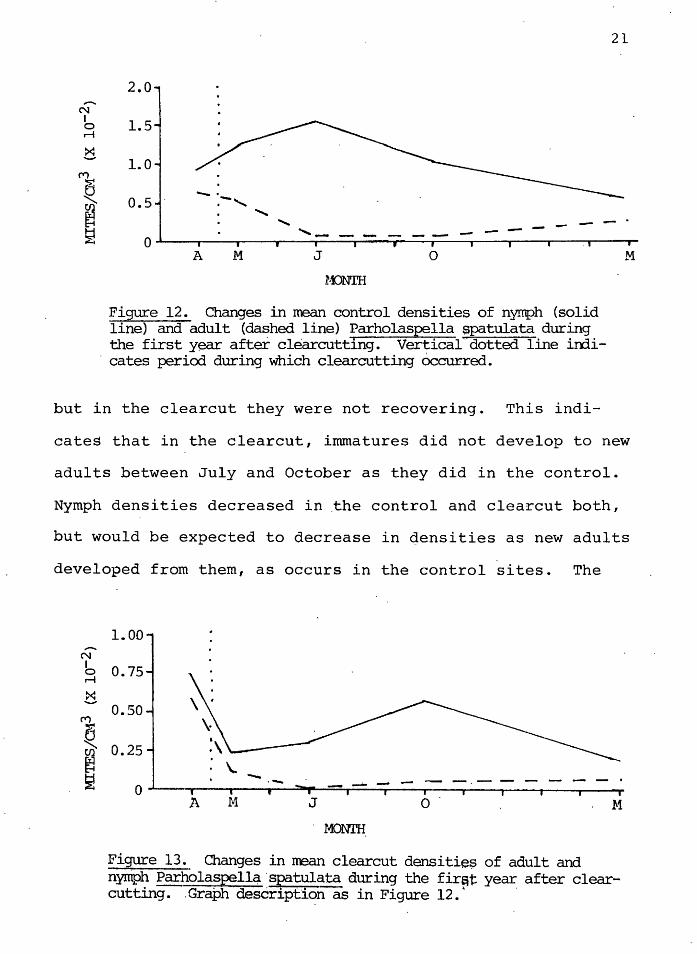
When densities of th~ adults and nymphs were plotted
in the control and clearcut (Figures 12 and.13) adult densi-
ties in the control sites appeared to be recovering to the
previous year's levels, after the· summer seasonal decline,
TABLE I
LEVEL OF SIGNIFICA..~E OF DENSITY DIFFERENCES OF THE LIFE STAGES OF PARHOIASPELIA SPA'IUI.ATA
BetWeen Control Anong Days Airong Sites Stadia and Clearcut Within Within·
Treatments Treatments Days
Adults N.S. 0.01 N.S. Nymphs 0.01 0.01 N.S. Adults + Nymphs 0.01 0.05 N.S.
21
-N
b r-1
0 "'i.c 6
~ ~
2.0
1.5
1.0
.._ ·- ...... . ........ ...... - - - - -
0
MONTH
Figure 12. Changes in mean control densities of nymph (solid line} and adult (dashed line) Parholaspella spatulata during the first year after clearcutting. Vertical dotted line irrli-
. cates period during which clearcutting 6ccur-red.
but in the clearcut they were not recovering. This indi-
M
cates that in the clearcut, immatures did not develop to new
adults between July and October as they did in the control.
Nymph densities decreased in .the control and clearcut both,
but would be expected to decrease in densities as new adults
developed from them, as occurs in the control sites. The
-N I 0 r-1
0 M
0 ~ ~
1.00
0.75
0.50
0.25 . \.
0 ..._ ·- - _.... - __ .......... __ __ A M J 0 M
MONTH
Figure 13. Changes in mean clearcut densitie$ of adult and nymph Parholaspell~·spatulata during the fir~t: year after clear-cutting. . Graph description as in Figure 12. 1
·
22
lack of recovery of adult densities in the clearcut may be
due to lack of prey availability, to increased predation. by.
organisms which feed on ~. spatulata, or to environmental
stress caused by increased temperatures during the summer
months.
Other studies indicate that prey availability does not
appear to be a factor in these cases, since Collembola popu-
lations do not significantly decrease after clearcutting
(Huhta et al 1967, Huhta et al 1971). Huhta (1971) attri-
buted predatory spider decreases in pop~lation to high temp-
eratures during summer months, not to predation. If this is
the case, nymph populations, which are often found deeper in
the soil hoiizon than adults (Mitchell 1978), may have been
able to avoid temperature stresses by virtue of their micro-
habitat, and consequently survived in higher numbers.
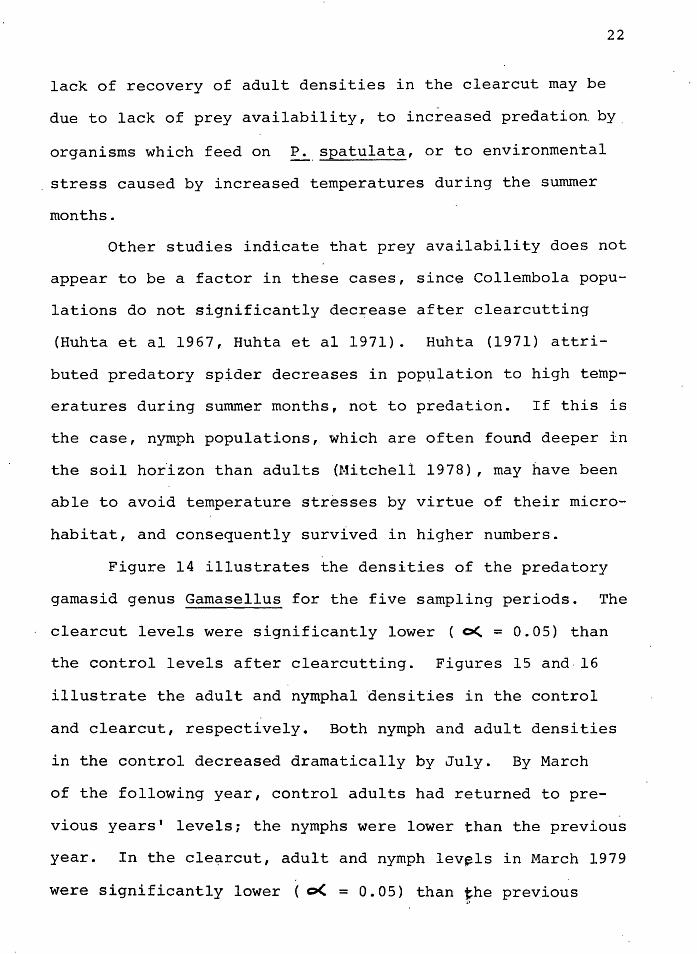
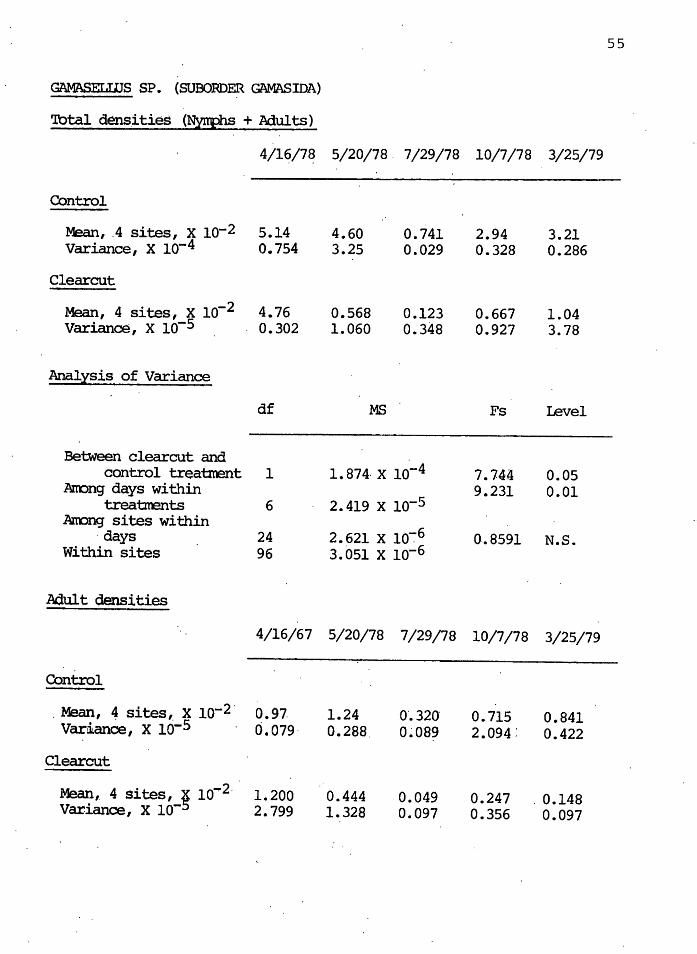
Figure 14 illustrates the densities of the predatory
gamasid genus Gamasellus for the five sampling periods. The
clearcut levels were significantly lower ( o<. = 0.05) than
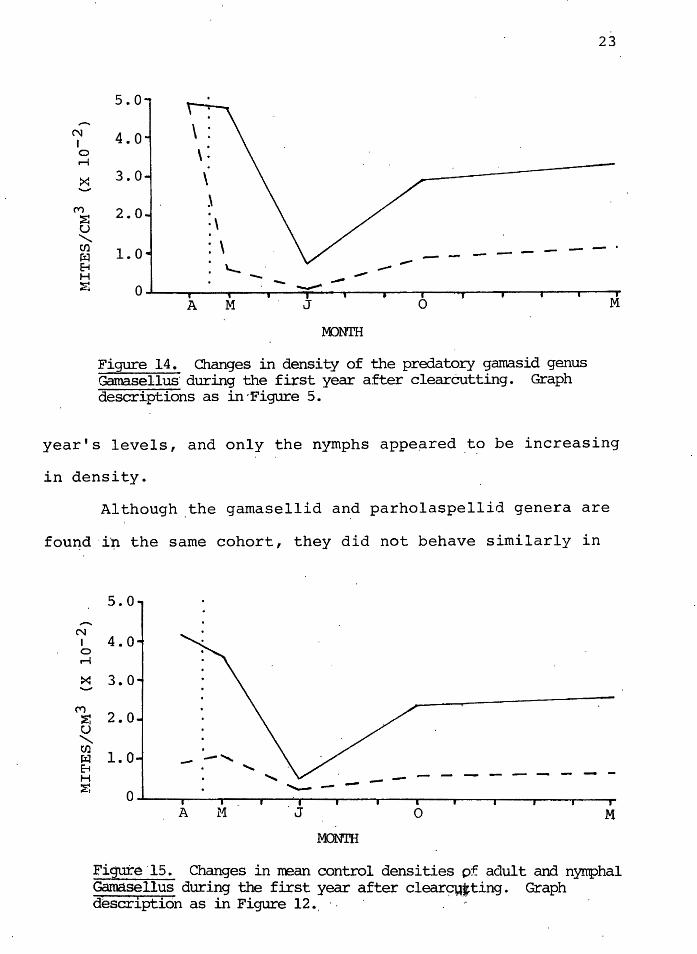
the control levels after clearcutting. Figures 15 and.16
illustrate the adult and nymphal 'densities in the control
and clearcut, respectively. Both nymph and adult densities
in the control decreased dramatically by July. By March
of the following year, control adults had returned to pre-
vious years' levels; the nymphs were lower than the previous
year. In the cle~rcut, adult and nymph lev~ls in March 1979
were significantly lower ( o( = 0. 05) than the previous ,.
,........ N I 0 M
>::: -M ~ u ......... Ul i::x:l E-t H ~
23
5.0
4.0 \:
3.0 \ ~
2.0 . \
1. 0 . \
__.. ---- ,_..... _. - .
0
\.._ -A M
....- ------- ___.. J 0
MONTH
Figure 14. Changes in density of the predatory garnasid genus Gamasellus· during the first year after clearcutting. Graph descriptions as in·Figure 5.
M
year's levels, and only the nymphs appe~red to be increasing
in density.
Although _the gamasellid a~d parholaspellid genera are
fou~d·i~ the same cohort, they did not behave similarly in
5.0 ,........
N I 4.0 0 M
>::: 3.0 -M
2.0 ~ u .......... Ul ~ E-t H ~ 1. :1 - _,
......
' . ""-I I I I
----------- - - -A M J 0 M
MONTH
Fiqu:te·1s. Changes in rrean control densities pf. adult and nymphal Gama.sellus during the first year after clear~~jting. Graph description as in Figure 12.. ·
24
N I
4.Q
~ 3. 0
:x:
('I')
~ () ......... Ul rx:i 8 H ~
2.0
l.O
-~-----0 J ! - b a=--- I I
A 0
MONTH
Figure 16. Changes in mean clearcut densities of adult and· nymphal Gamasellus during the first year after clearcutting .. Graph description as in· Figure 12.
M
the control and clearcut. The total density of ~ spatulata
showed a decreasing trend in density after one year, but the
Gamasellus species were increasing. Immature and adult
stages of the two genera also behaved differently. In the
controls, the nymphs of· the gamasellid genus react~d unfav-
orably to summer s~asonal affects, unlike the parholaspellid
genus. Clearcut nymph _densities of both genera sharply de-
creased immediately after clearcutting; adults of both ·
genera significantly decreased in .densities by July, and did
not recover in the following month to previous (April 1978)
levels. It appeared .that ~or Gamasellusi environmental
stress imposed by high ·summer soil temperat~res prevented a
recovery of adult populations.
25
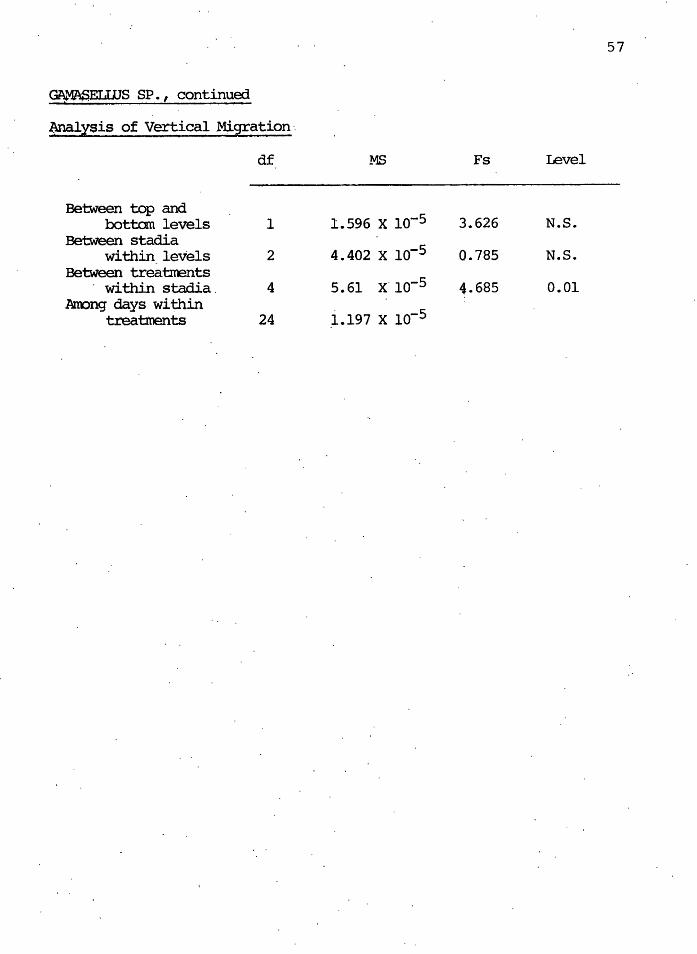
Vertical Migration
The macrophytophagous and microphytophagous mites
studied showed no significant differences in vertical dis-
tribution between clearcut and controls after clearcutting.
There were also no significa.nt differences in Nicoletiella,
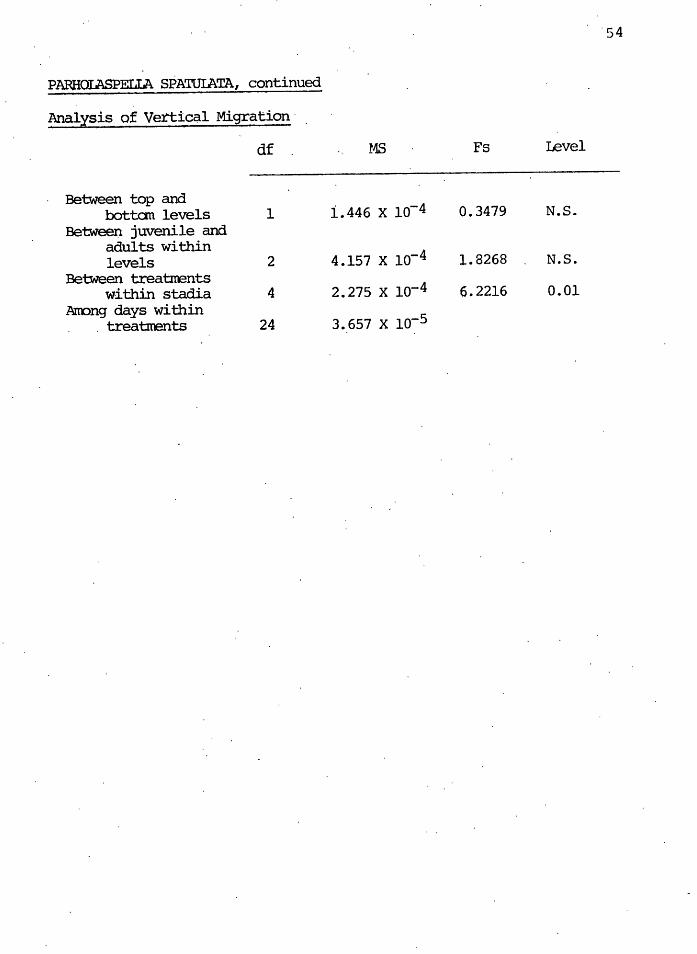
a predatory genus. Significant differences ( o(. = 0.01)
appeared when nymphal and adult st'ages were analyzed in the
predatory m~tes Parholaspella spatulata anq Gamasellus.
The source of ~ariation of these d{f ferences appeared be-
tween the control and experimental populations within adult
and wi~hin juvenile populations. There were no significant
differences however .'between the top and bottom samples over-
all, nor between the juvenile and adult densities within the
top and bottom samples.
Caution must be exercised in drawing conclusions from
these results, however. The top samples were 6 cm deep and
would not detect migrations of less than 6 cm, as may more
likely occur (Mitchell 1978). Therefore vertical migration
may have been detected had different sampling techniques
been used. Vlug and Borden (1973) 'noted that there was no
change in clearcut densities within the first 10 cm of soil
horizons, but rather that densities decreased in all layers.
Soil Compaction and Scarification
After clearcutting, approximately 55% of the logged
site was scarified and/or compacted by heavy machinery .. The
2.6
soil samples from these areas were sandy to gravelly, high
in mineral content, and low in organic matter. Approximate-
ly 5% of the site was relatively undisturbed, similar to the
control except for increased insolation. The remaining 40%
of the area contairieq added debris, such as sawdust, chips,
fallen branches, etc., which were a result of the clearcut-
ting operations.
Soil compaction and scarification (i.e., removal of
the organic layers from the soil) which result from tractor
logging and skid roads formed during clearcutting operations
may have biological implicat_ions. Microarthropods generally
occupy small spaces between soil particles in the surf ace
layers, and the diameter of the pore spaces may be limiting
to their distribution (Wallwor~ ·1970). Steinbrenner and
Gessel (1955) found a 10% reduction of macropore space in
soils compacted by tractor logging, and a 53% reduction in
pore space in tractor skid roads. The bulk density of soils
compacted by tractor logging and skid roads increased·2.4%
and 15%, respectively.
Macropore space allows ready movement of air and per-
colating water. Soil compaction may reduce microbial activ
ity by impeding aeration and allowing carbon dioxide concen-
trations to increase (Bollen 1974). Since bacteria and
fungi are the food source of many soil mite~, this effect
may have implications for their survival.
Organic matter is important in maintaining large
27
macropore spaces (Buckman and Brady 1969); therefore scari
fication of soil can also result in.loss of larger pore
sizes, and to the effects mentioned above.
·Steinbrenner and Gessel (1955) found a permeability
rate decrease of 35% resulting from tractor logging, and a
93% decrease in.tractor skid roads.· Dyrness et al (1957)
found lowered moisture equivalents and percent aggregations
in clearcut soils, but these were not significant; he attrib
uted the· reductions to structural oreakdown due to compac
tion. Isaac and Hopkins (1937) noied that duff has a very
high water-holding capacity. ·since competition for water
may be limiting.to soil microbes (Bollen 1974), these effects
may result in less food for microphytophagou? acari in
scarified areas. However, Griffin (1972) said that since
the volume of water necessary for microb.ial.activity is very
small, its significance is probably correlated with other
properties, such as aeration. Williams (1963) found that
moisture is important in fungal distribution in a podsol
soil, and that colonization of mineral soil is partly depen
dent on particle size; colonization of mineral soil is less
than. that of orga~ic matter. These findings also indicate
that compac.tion a~d scarificatio~ have biological implica
tions for m~crophytophages arid microphytophages.
Tempera.tu.re .
Analysis shows that soil. temperatures at 13 cm in
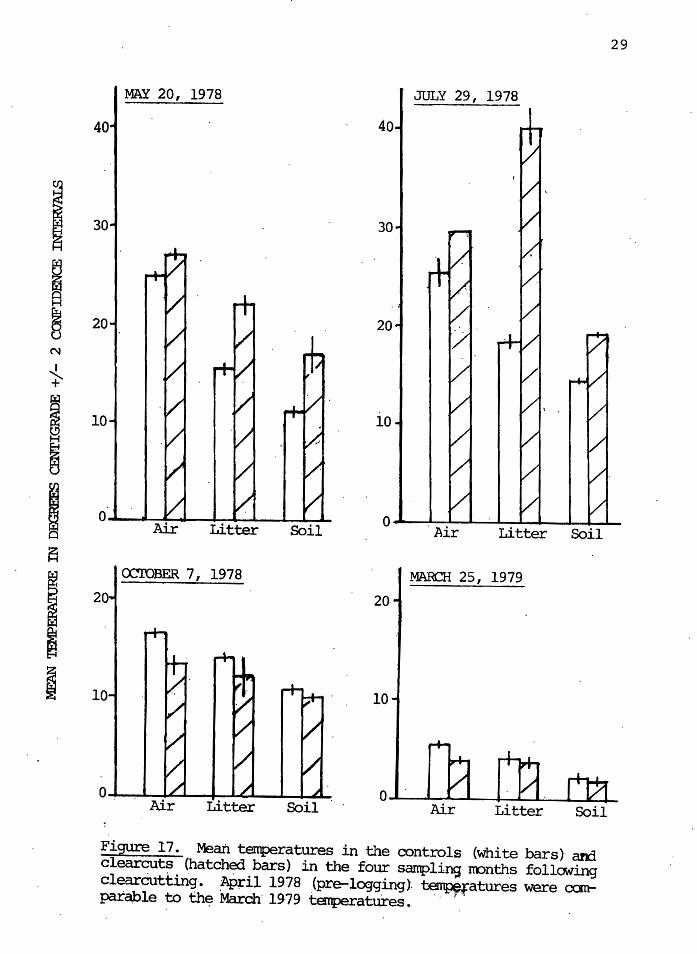
28
depth were not significantly ~ifferent in the control and
clearcut sites overall, but that there were highly signifi-
cant ( o<. = 0.01) differences among sampling months within
treatments. Figure 17 shows that in May and July, signifi-
cantly higher ( o< = 0.05) soil temperatures occurred in the
clearcut than in the control. No differences appear in Oc-
tober and March. The same results occur for the litter
temperatures. The air temperatures were significantly dif-
ferent for the control and clearcut in all four months afte~
logging; Figure 17 shows that the air temperature was lower
in the control during May and July; and higher in the co~-
trols during October and March. The same pattern, not al-
ways statistically significant~ occurred for the soil and
litter temperatures.
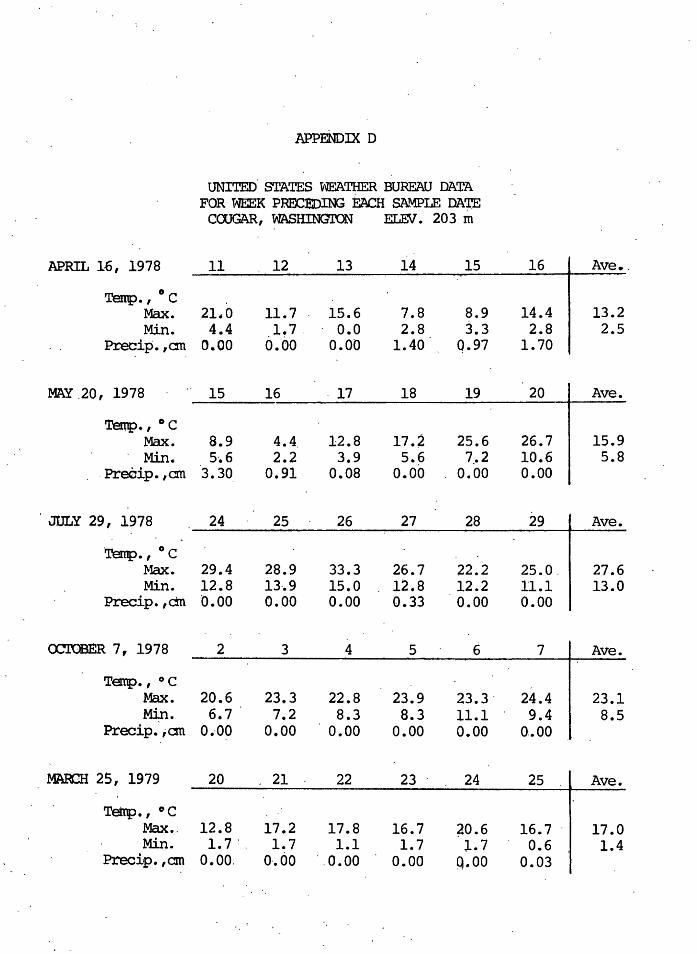
U.S. Weather Bureau. data for Cougar, Washington (ele-
vation 203 meters) for.the week preceding each sample date,
and corrected for elevation by the ~nvironmental temperature
lapse rate of 6.4 degrees Centigrade per 1000 meters
(Strahler 1975) showed that the average air temperature
prior to April 16, 1978 was 9~7~C maximum and -0 .. 8°C mini
mum; prio.r to May 20, 1978 was 12.7°C maximµm and 2.7°C min-
imum; prior to July 29, 1978 was 24.2°C maximum and 9.7°C
minimum; prior to October 7, 1978 was 19.7°C maximum and
5. 2 °C minimum; ~nd prior to March 29, 1979 was 13·. 7° c maxi
mum and -l.8°C minimum. Monthly temperatures were normal
prior to each of the saJ;npling .dates. See AJwendix D.
I i ~ N
~ +
~ d
~
I ~
I I I
MAY 20, 1978 JULY 29, 1978
40 40
30 30
20 20
I
10 10
0d " , I I I I I I J Air Litter - . - 0... I I I I I I I I I
·Air Litter Soil
OCTOBER 7, 1978 MARCH 25, 1979 20 20
10 10
Air Litter O· I A I I I •. I YI
Soil o.
· Air Litter Soil
Figure 17. Mean tenperatures in the controls (white bars) and clear~~ (hatch~ bars) in the four samplins nonths following clearcutting. April 1978 (pre-logging). temperatures were can-pa:table to th~ March· 1979 temperatures. · · ~. · .
29
30
Vegetation can affect soil temperatures by decreasing
heat inflow through shading, preventing radiation of heat
at night, and hindering air turbulence at the soil surface.
Clearcutting, by destroying the vegetative overstory, in-
duces greater daily temperature fluctuations and seasonit
extremes than it). vegetated areas, .and subjects the surface
layers to drying by wind as well as by inc~easing tempera-
tures (Huhta et al 1~67, Buckman and Brady 1969).
Wallwork (1959, 1960) examined temperature tolerance
for various oribatid mites in the laboratory and field.
The.upper tolerance was 30-32°C, the tolerable range.was
16-28°C, and the preferred range was 21-26°C for the species
observed. He noted that there was a greater tolerance for
relatively cold temperatures than relatively warm ones, and
mortality was observed at temperatures starting at 30°C.
The U.S. Weather Bureau data indicates that mortality-induc-
ing litter temperature~ probah,ly existed fo~ at least one
week in July~ 1978.
Griffin (1972), commenting on microbial activity,
noted that there is no support for the ·assuroption that tem
perature fluctuation per se affects activity, but that
growth is deterred some time ~fter ~aximum ·temperatures are
reached. Bollen (1974) correlated: soil temperatures with
.moisture, sta:ting .that in the Pacific North,west hi_gh summer
seasonal t_emperatures and low summer and fall precipitation . .
are the ~ajor limitin~ factors for microbe~. In winter,
I
r
31·
microbes are not active and are limited by low temperatures,
not by moisture,. unless it is excessive.
The data in this study (Figure 17) indicate that
temper~ture extremes on the s9il surface are greatest in the
.July samples, when temperatures of 40°C. were.measured in 'the
clearcut,·compared to 18.5°C in the contra~. Mortality would
be expected then in the clearcut sites. Also, microbial
activity would be reduced at these temperatures, resulting
in lowered fooq supplies for microphytophagous ~ites.
Signific·ant differences in temperature, al though not as ex
treme as in July, were also observed in May. In the Octo
ber and March samples, litter temperatures were not signifi
cantly different between the controls and clearcuts, and
therefore were probabl¥ not important to differences in
densitie~ at those times. Soil temperatures at 13 cm in
depth were also significantly higher only in May and July.
Moisture
Soil moistur~ in March 1979 was significantly higher
( o-' = 0.01) in the controls than in the clearcuts, but the
sites were not s{gnificantly different from each other in
October, 1978.
U.S. Weather Bureau data for Cougar, Washington (see
Appendix D) stated that the precipitation one week prior to
April 16, 1978 totaled 4.1· cm; prior to May 20, 1978 totaled
4.~ cmr prior to.July 29, 1978 totaled 0.33 cm; prior to
32
October 7, 1978 no precipitation fell; and prior to March
25, 1979 totaled 0.03 cm. Mdnthly average precipitation in
all cases was normal. There appears to be no correlation
between the amount of ·precipitation and the monthly acari
densities in the control or clearcut, based· on this data.
Increased insolation as a result of clearcutting
changes moisture conditions of the soil. $pme of these
effects have been discussed.previously. After clearcutting,
tree and plant roots will no longer remove water from. the
soil, but evaporation will increase, unl~ss prevented by a
cover of felling residues.
Mitchell (1978) found that only acari inhabiting the I
fermentation and humus layers of the soil horizon show a
·positive correlation to moisture, and that litter inhabit-
ants are not sensitive to moisture. Huhta (1971) found that
moisture is not important for litter-dwelling spiders ·in
clearcuts, but temperature is. Huhta et al (1967) found
that oribatids react slowly to changes in moisture because
their thick cuticle is resistant· to desiccation; other
~ites, however, may be affected by abundant precipitation.
Madge (1964) ·found that the higher the temperature, the
higher the preferred relative humidity by ~oil acari, in
laboratory experiments.
Excess moisture may be limiting to microbes by reduc
ing oxygen concentrations in the soil pore ~paces (Bollen
1974). Moreover, competition for water may be limiting to
!"
I
33
microbes in dry periods (Bollen 1974~ Parkinson and Coups
1963), especially to bacteria and actinomycetes which are ' '
more sensitive to drought than are fungi (Steubing 1970).
Most fungi are found in the litter and fermentation
layers of the· soil horizon (Parkinson and Cpups 1963), and
most bacteria are found in the fermentatiop layers (Bollen
1974).· The distribution of fungi in the soil appears to
depend on moisture, mineral grain size, and depth (Williams
1963). Buckman and Brady (1969) state that fungi and bac
teria can use hygro~copic soil-wat~r, although sub-optimal-
ly. .This supports Griffin's comment (1972) that the volume
of water needed for microbial activity is so small that it,
in itself, should not be limiting.·
Vlug and Bord~n (1973) .found rio correlations with
soil moisture and mite densities in a clearcut.· Since soil
moistu+e readings were not taken during.every sampling
month.duririg this study, general conclusiops cannot be
drawn. However, the data for March 1979 and October 1978
and the U.S. Weather Bureau data, when compared to densities
of the v~rious mites stridied, do not support the idea that
moisture of itself is significant to the acari densities.
This is in agreement with the findings.of V~ug and Borden
(1973).
CONCLUSIONS
Generally, soil acari densities decreased significant
ly in the clearcut site almost immediately after the clear
cutting operation occurred. Both control ~pd clearcut
densities decreased to very low levels by midsummer (July),
and the clearcut densities were ~uch lower than the control
densities. By October, however, the control densities had
recovered to higher densities than the ~learcut. The lower
summer, densities ·occurring in the clearcut were attributed
to the high temperatures of the litter horizon as a result
of increased insolation after the cover story was removed.
Wallwork (1959, 1960) f9und that temperatures in excess of
30°c· induce mortality in soil acari; in this study, soil
surface temperatures in.excess of 40°C were recqrded. In
direct effects of temperature on food may also be important
for microphytophagous mites; although not measured in this
study, food availability may have been significant.
Soil moisture did not show correlations with densities
ties. Oribatid mites are ~eavily-sclerotized so that mois
ture may not be· important to them, but mit~s less-sclerotiz~
ed than oribatids (primarily in other sub-orders and juven
ile. stages) and those inhab~ting·lower hor~zons may be af
fected by moist~re changes (Mitchell 1978)~
Food supp~ies were not measured directly, but were
35
probably limited for all trophic levels. Macrophytophagous
mites cannot utilize freshly-fallen.litter, microphytophag
ous mites may have had food shortages due to physical ef
fects on microbial activity, and predators may have been
affected by decreases in populations in other· organisms, in
cluding mites.
Pore spaces may have been important for. larger ·mites,
espec~ally in areas· which were sca~ified by heavy machinery.
Mites live in existing pore spaces, so a r~duction in pore
space size could affect their survival.
When predatory mites were divided into, juvenile and
adult stadia and statistically analyzed, it appeareq that
adults were·more affected by increased insolation and
con~equent ·higher temperatures than juveniles. This may
be because nymphs often· occupy lower soil horizons than
the adults (Mitchell 1978)~ and so would e~cape the highest
temperatures at the soil surface. The October juvenile
densities of the clearcut were not as high as the control
juvenile densities, and this would also have. an impact on
future generations; this was reflected in the March 1979
sample.
The results of this study differed in some respects
from Huhta et al {1967), since the,.oribatid clearcut densi
ties were not near as bigh as· th~ qont~ol ~erisities after
one year, as was reported by them.
Verticc;il migration was no.t detected bµt that may have
beeri due to technique. Vlug and· Borden (1973) found no
·vertical migration in the first 10 cm after clearcutting.
36
BIBLIOORAPHY
Anscatibe, F.J~ 1949. The statistical analysis of insect counts based on the negative binomial distribution. Biometrics 5(2): 165-179 .
Berthet, P. and G. Gerard. 1965. bution of Oribatei (Acari). Oikos 16: 214-227. --
. A statistical study of microdistriPart I: The distribution pattern.
Bollen, W.B.· 1974. Soil Microbes. Pages Bl-B41 in O.P. Cramer, editor. Environrrental Effects of Fbrest Residue Ma.nagem:mt in the Pacific Northwest: A State-of-Knowledge ·c~ium. USDA Forest
· Service Gerieral Technical Re:p::>rt PNW-24, Paci'fic Northwest Forest and Range Experilrental Station. '
Buckman, H.O. and N.C. Brady. 1969 .. The Nati.ire and Properties of Soils. The Madilllan canpany, New York. 653 pp.
Cornaby, B. W. 1977. Saprophagous organisms and problems in applied resource parti,tioning. Pages 96-100 in W.J. Mattson, editor. The ~le of Arthropods in Forest Ecosystems. Springer-Verlag, New York.
Crossley, D.A., Jr. 1977a. Oribatid mites and nutrient cycling. Pages 71-85 in .D.L. Dindal, ·editor. Biology ·of Oribatid Mites. State University of New York,· College of Environmental Science and Forestry, Syracuse, New York.
. 1977b. The roles of terrestrial saprophagous ~~~~~~~~~
arthropods in forest soils: current status of concepts. In W. J. Mattson, ed.. The Role of Art.h:i:-opods in forest F.cosytems. Springer-Verlag, New York. '
Duncan, S.H. and E.C. Steinbrenner. 1973. Soil SttrVey of the St. Helens Tree Fann. Weyerhaeuser Company, Tacqna, Washington.
Dyrnes::;;, C.T., C.T. Youngberg, and R.H.. Ruth. 1957, Sane effects of· logging and slash burning on physical soil p~operties in the Corvallis watershed. USDA Forest Service Research Paper #9, Pacific Northwest Forest and Range Experim:mtal Station.
Edwards, C.A. and G.W. Heath. 1963. The role of soil aninals in breakdown of leaf material. Pages 76-84. in J. Doejcsen and J. van der Drift, editors. SOil Organisms: · Proceeding~ of the Colloquim on Soil Fauna, Soil Microfauna.1 :and their· Relati."'6hships. Nbrth-Hol-·1ana PUblishing Conpany, Amsterdam. ••·
Engelmann, M.D. 1961. The role of soil arthrop::rls in the energetics of an old field carmunity. Ecological !vbnographs 31: 221-238.
Francke'"-Grosmann, H. 1963. sane new aspects of· forest entarology. · Ann. Rev. Entan. 8: 415-438.
38
Franklin, J.F. and C.T. Dyrness. 1973. Natural Vegetation of Oregon and Washington. USDA Forest Service General Technical Report # 8, Pacific Northwest Forest and Range Experimental Station.
Gerard, G. and P. Berthet •. 1966. A statistical stµdy of microdistribution of· Oribatei {ACari) • Part II: 'Ihe transfo:rmation of the
· data. Oikos i7: 142-14'9. '
Ghilarov, M."S. 1963. On the interrelationships between soil-dwelling invertebrates and soil microorganisms. Pages 255-259 in J. Doeksen and J. van der Drift, eds. Soil Organisms. North-Holland Publishing Canpany, Amsterdam.
1971. Invertebrates which destroy the forest litter and ways to raise their ?tCtiv;Lty. Page9 433-442 in Productivity of Forest Ecosystem.c:;: Proceedings of the ·Brussels Syrnfx)sium, 1969. UNESCO.
Gist,. C.S. and D.A. Crossley, Jr. 1975. The litter arthropod conmunity in a southern ·Appalachian har~ forest: numbers, bianass, and mineral element content.· Anerican Midiand Naturalist 93: 107-122.
Gray, T.R.G. ·and S.T. Williams. 1971. Soil Micro-Organism$. Oliver arrl Boyd, Edinburgh.
Griffin~ D.M. 1972. ·F.colpgy of Soil Fungi. Chap!llan and Hall, IDndon. 193 pp. '
Hartenstein, R. 1961. On the distribution of forest soil microarthropods and their fit tO I COntagiOUS I distribution funCtiOnS • E'.cOl-~ 42: 190-194. '
Hinshelwocrl, c. 1951. Decline and death.of bacterial populations. Nature l67: 666~669.
Huhta, V. · 1971. Succession in the spider ccmnunities of the forest floor after clear'"'."cutting and prescribed burning. Ann. Zool. Fennici 8(4): 483-542.
1976. Effects of clearcutting on numbers, biooass, and canmunify respiration of soil invertebra.tes. Arm· zool. Fennici 13: 63-80. .
. , E. ~pinen, M. Nurminen, and A. Valpaq. 1967. Effect of ---s..,,...ilvicultural practi9es upon arthroi?od; annel.W, and nematode pop
ulations in coniferou8 forest s6il. Ami. z.oq1 .• Ferinici 4: 87-145.
r j
39
, .M. Nunninen, and A. Valpas. 1969. Further notes on the ef~~--f-ec-t of silvicultural practices upon.fauna of coniferous forest
.soil. Arin. Zoo!. Fennici 6: 327-334. ·
Isqac, L.A. and H.G. Hopkins. 1937. The forest soil of the Douglas Fir region, and changes wrought upon it by logging and slash burning. :Ecology 8(2): 264-279.
Jacot, A.P. mals.
1939. Reduction of spruce and fir litter by minute ani~ Journal of Fore~ 37: 858-860. ·. ·
Krantz, G.W. 1978. A Manual of Acar:o~. Oregon.State University 509 pp. Book Stores, Inc. Corvalli~, Oregon.
· Kurcheva, G.F. 1960. The role of invertebrates in the decomp0$ition of oak leaf litter. Pocroredenie 4: 16-23.
Luxton, M. 1972. Studies on the oribatid mites of a Danish beech wood soil. I. Nutritional biology. Pedobiologi?l 12: 434-463.
MacFadyen, A. 1961. soil fertility .•
~1etabolism of soil invertebrates in relation to Ann. Appl. Biology 49: 215-218.
1962. Soil arthropod sampling. Adv. Ecol. Research 1: 1-34.
1963. The contribution of the microfauna to total soil netabolism. Pages 3-17 in J. Doeksen and J. ·van der Drift, eds. Soil Organisms. North-Holland Publishing Co., Amsterdam.
1968. The rreasurement of climate in studies of soil and litter animals. Pages 59-67 in R. Wadsworth, editor. The Measurerrent of Environmental Factors in Terrestrial Ecology. Oxford, Edinburgh.
Madge, D.S. 1964. ·The humidity reactions of oribatid mites. Acaro-logia 6: 566-594. · --
----·-· ·• 1965. The behaviour .of Belba geniculosa Oudms. and certain other species of oribatid mites in controlled temperature gradients. Acar~locjia 7: 389-406.
l1c13rayer, J .F. 1973. Exploitation of deciduous leaf litter by .t\pheloria rrr;mtana (Diplopod~: Eucydesmidae). Pedobiologia 13: 90-98.
Mitchell, M. 1978. Vertical and horizontal distributions of oribatid mites (Acari: C:ryptostigmata) in an aspen ·wooa1and soil. Ecol~ 59 (3') : 516-525.
40
Mitchell, R.G. ·and C. Sartwell. . 1974. Insects and other arthropods. Pages Rl-R22 in O.P. Cramer, ed. Enviroruoontal Effects of Forest Resi.~e ~~ge!nent in the Pa,cific.Northwest. USDA-FS Gen. Tech. Repert PNW-24, Pacific NOrt.11\vest Forest and Range Experitrental Station.
r.rore, D.G. and L.A. Norris. 1974. Soil processes and introduced chemicals. Pages Cl-C33 in O.P. Cramer, ed. Environmental Effects of Forest Residues Management in the Pacific Northwest. USDA-FS Gen. Tech. Report PNW-24·, Pacific Northwest Forest and Range Experimental Station.
~Dri tz, V .M. 1965. Untersuchungen Uber den Einflu?s von Kahlschlagmassnahmen auf die zusantnensetzung von Hornm.il.bengemeinschaften (Acari: ·Oribatei) norddeutscher Laub- und Kiefernmischwalder. Pedobiologia 5: 55-101. ·
Parkinson, D. and E. Coups. 1963. Microbial activity in a podzol. Pages 158-166 in J. lbeksen and J. van der Drift, eds. Soil Organisms. North-Holland Publishing Canpany, Amsterdam.--
Smith, D~ 1962. The Practice of Silviculture. John Wiley and Sons, Inc., New York •. 758 pp •
. Sokal, R.R. and F.J. Rohlf. 1969 •. Biorretry: 'Ihe Principles and Prac.. tice of Statistics in. Biological ·Research. W.H. Freeman and ~y, .san Francisco. 776 pp.
s¢rensen, T. 1948. A method of establishing groups of equal amplitude in plant saciolpgy basE;rl on the similarity of speci~s content and its applicati0n to analyses of the vegetation on Danish camons. Biol. ·skr. 5: · 1-34. ·
Steinbrenner, E.C. and S.P. Gessel. 1955. The effect of tractor logging.on physical propert~es of sane forest soils in southwestern Washington. .Soil Sci. Soc. Amer. ·Proc. 19: 372-376.
Steubing, L. 1970. Soil flora: Studies of the number and activity of niicroorganisms :in woodland soil~. Pages 131':"'146 in D.E. Reichle~ editor·~ Analysis of TemPeJ:ate Forest F.cosystems. Springer, New York.
Strahl.er, A:.N. 1975. Physical Geography. .John Wiley and Sons, Inc., New York. 643 pp.
Szujecki, A. 1971. The effect of clearcutting upon the carmunity of litter-i~iting staphylin~ds (Coleoptera: ptaphylinidae) in fresh pine forests." Folj.a Forestalia PoloniQa, Ser. A. 18: 5-45~
!·
• 1972. Impact of clearcutting .Qn the soil entorrofauna. ___ P_a_g-es""""· 4305-4309 in Proceedings, Wqrld Forestry Congress.
Buenos Aires, 7th Congress.
Vitousek, P • .M. , J. R. Gosz, C .C Grier, J •. M. Melillo, W .A. Reiners, and R.L. Todd. 1979. Nitrate losses from disturbed ecosystems. science 204: 469-474.
Vlug, H. and J. Borden. 1973. Soil acari and collembola popul~tions affected by logging and slash burning in a ooastal British Colun:bia coniferous forest. Environ. Entom. 3(6): 1016-1023.
Wallwork, J.A •. 1958. Notes on the feed:i,ng behaviqµr of sate forest soil acarina. Oikos 9: 260-271.. ·
1959. · '!he distribution and dynamics of scne forest soil mites. F.cology 40: 557"'.'"563.
41
1960. Observations on the behaviour of some oribatid mites in experimeritally-coz:itrolled temperature gradients. Proc. Zool. Soc. IDndon. 135: 619-629. --
1970. :Ecology of Soil Animals. McGraw-Hill, IDndon. 283 pp •.
1976. The Distribution and Diversity of Soil Faun.a. Acadenuc Press, IDndon. 355 pp.
Williams, S. T. 1963.. The distribution of fungi in the horizons of a podsolized soil. Pages 158-166 in J. ~sen and J. van· der Drift, eds. ·Soil Organisms. North-Holland Pµblishirig Co., Amsterdam.
Witkarrp, M. 1960. Seasonal fluctuations of the fungus flora in mull and nor of an oak forest. Meded Inst. toegep. biol. Onderz. Nat. 46 (Arnhem) .•
• , and D.A. Crossley, ·Jr. 1966. The role of arthropods and ---nu.---c-roflora in breakdam of white oak litter. Pedobiologia. 6:
293-303.
APPENDIX A
HABITAT DATA SHEEr
WASHINGTON , <;CX"1I..ITZ COONTY', WEYERHAEUSER TREE FARM KAIAMA RIVER OISTRicr· T7N-R3E~ 'Section 13 Elevation ca 731. 5 m msl
Date.• ••••• T.i.n'e ••••••••••
.collection Site: Plot # Sarrple #
Treated ......... • ......... . Untreated
Habitat
..................................................... ·Berlese
.....................................................
. . . . . . . . . . . . . . . . . . . . . . . . . . . . . . . . . . . . . . . . . . . . . . . . . . . . Weather ............................................ Air Temp (61 an) ... Soil Temp (13 an) •••••••
Litter Temp •••••.•••••••••• r1.ineral I.ayer
eo11ected by s.E. 0r1aske SA\1PLE NO. so-
so-
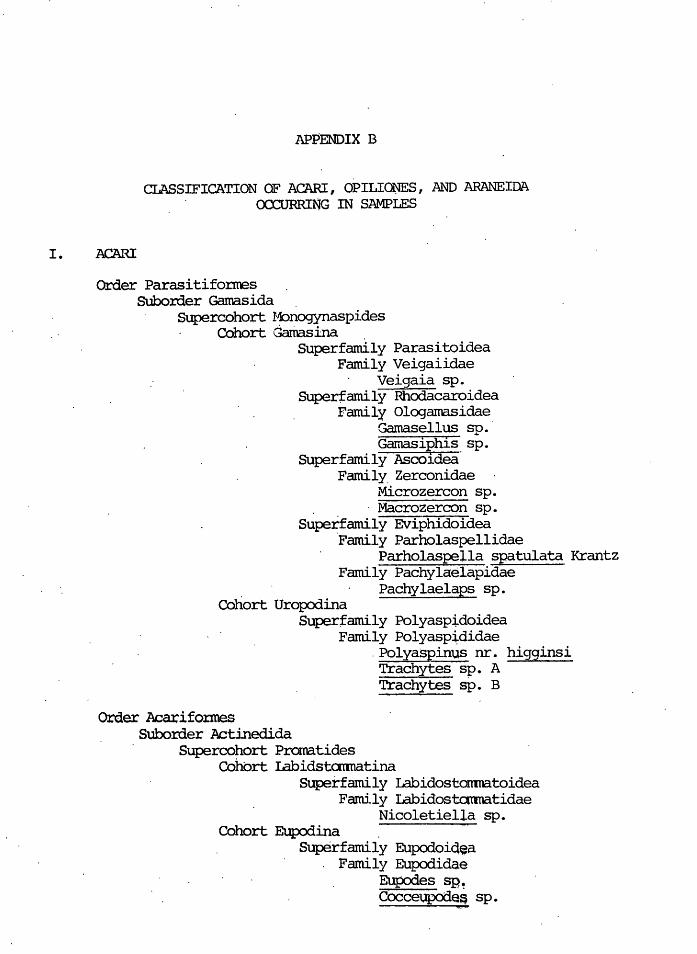
I. ACARI
APPENDIX B
CLASSIFICATION OF ACARI I OPILIOJNES I AND ARANEIDA OCCURRI~G IN SAMPLES
Order Parasitifornes Suborder Gama.sida .
Supercohort Monogynaspides Cohort darilasina .
Superfamily Parasitoidea Family Veigaiidae
Veigaia sp. SUpertamily Rhodacaroidea
Family Ologarnasidae Gamasellus sp. · Garnasiphis sp.
Superfamily Ascoidea· Family. Zerconidae
Microzercon sp. . Macrozercon sp.
Superfamily Eviphidoidea ·Family Parholaspellidae
Parholaspella spatulata Krantz Family Pachylaelapidae
Cohort Uropodina Pachylaelaps sp.
Order Acariformes Subo:rder Actinedida
Super~amily Polyaspidoidea Family Polyasp~didae
. Polyaspinus nr. higginsi Trachytes sp. A Trachytes sp. B
Supercohort Proma.tides Cohort Labidstoomatina
Superfamily Labidostonmatoidea Family Labidostarmatidae
Nicoletiella sp. Cohort Eupodina .
Superfarnily Eupodoiqea Family Eupodidae
Eupodes sg. Cocceupode~ sp.
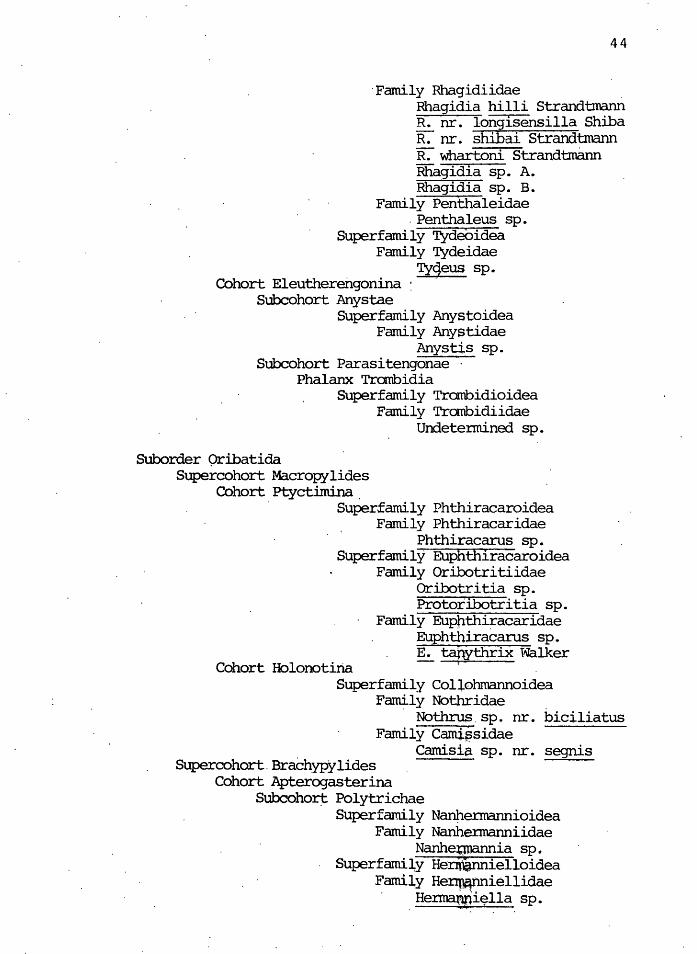
44
·Family Rhagidiidae . Rhagidia hilli Strandtmann R. nr. longisensilla Shiba R. nr. shibai Strandtmann R. whartoni Strand:tmann Rhagidia sp. A. Rhagidia sp. B.
Family Penthaleidae . Penthaleus sp.
Superfamily Tydeoidea Family Tydeidae
Tygeus sp. Cohort Eleuthere:hgonina '.
Subcohort Anystae Superfamily Anystoidea
Family Anystidae Anystis sp.
Subcohort Parasitengonae · Phalanx Tranbidia
Superfamily Trombidioidea Family Tranbidiidae
Undetermined sp.
Suborder Qribatida Supercohort Macropylides
Cohort ptyct.imina . Superfamily Phthiracaroidea
Family Phthiracaridae Phthiracarus sp.
Superf amily Euphthiracaroidea Family Oribotritiidae
Oribotritia sp. Protoribotritia sp.
Cohort Holonotiria
Family Euppthiracaridae Euphthiracarus sp. ~ tapy~rix Walker
Superfamily Col+ohmannoidea Family Nothridae
· Nothrus.sp. nr. biciliatus Family Camipsidae
Supercohort.Brachyp}'lides Cohort Apterogasterina
Camisia sp. nr. segnis
Subcohotj: Polytrichae Superfarnily Nanp.ennannioidea
Family Nanhennanniidae Nanhet;mannia sp.
Superf ami~y HeDUannielloidea Family He~iellidae · He~i~lla sp.
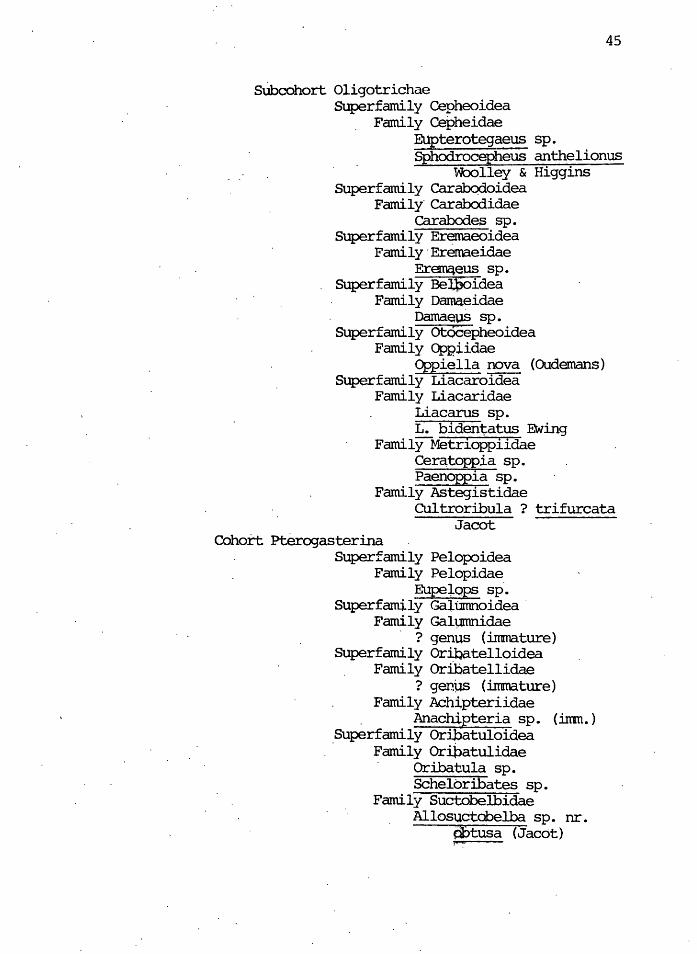
45
SUbcohort Oligotrichae Superfamily Cepheoidea
Family Cepheidae Eupterotegaeus sp. Sphodrocepheus anthelionus
Woolley & Higgins Superfami.ly Carabqdoidea
Family· Carabodidae carabcx:les sp.
Superfamily Eremaeoidea Family·Erenaeidae
Eremqeus sp. Superfamily Bel,?oidea
Family Damaeidae DamaeµS sp.
Superfamily otocepheoidea Family Oppiidae
Oppiella nova (Oudemans) Superf amily Liacaroidea
Family Liacaridae Liacarus sp. L. bidentatus Ewing
Family-1'1etr1opp1idae Cera,toppia sp. Paenopp1a sp.
Family Astegistidae Cultroribula ? trifurcata
Jacot Cohort pterogasterina
Superfamily Pelopoidea Family Pelopidae
Eupe:J.ops sp·. Superfamily GalUmI1oidea ·
Family Galµmnidae · ? genus (immature)
Superfamily Or~telloidea Family Oribatellidae
? genW; (immature) Family Achipteriidae
. Anachipteria sp. (inrn.) Superfamily Oribatuloidea · Family Orihatulidae
Oribatula sp. Schelbribates sp.
Family Suctobelbidae Allosuctobelba sp. nr.
Obtusa (Jacot)
:
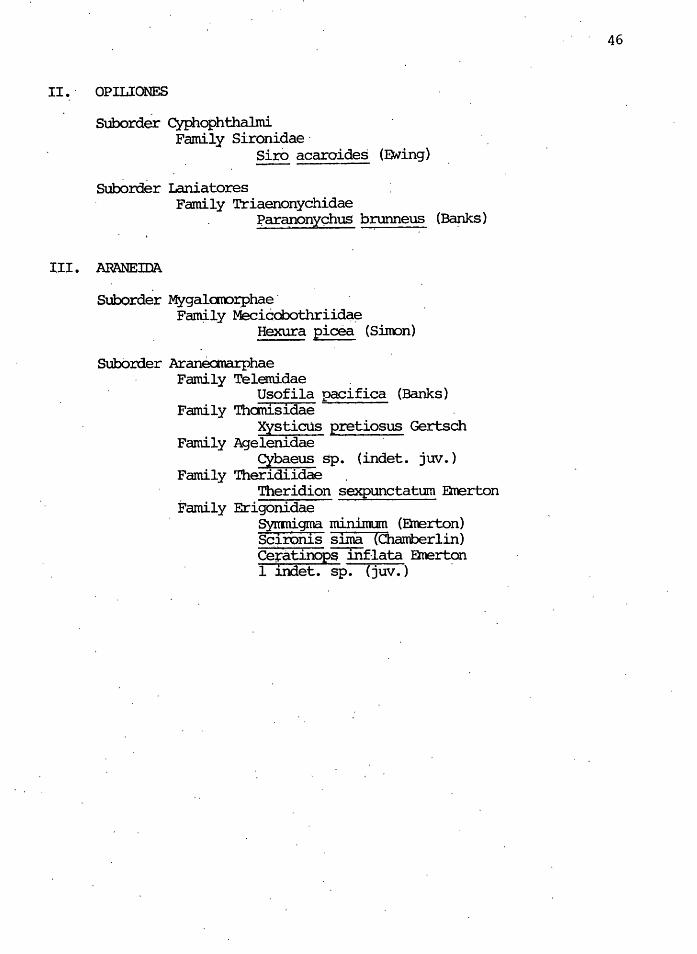
II.· OPILIONES
Suborder Cyphophthalmi Family Sironidae·
Siro acaroides (Ewing)
SUbOrder Laniatores Family Triaenonychidae
J?aranony<;::hus brunneus (Bapks)
III. ARANEIDA
Suborder Mygalaoorphae· Fam;i.ly Mecicobothriid~e
Hexura picea (Sinon)
Subbrder Arane<inarphae Family Telemidae
Usofila pacifica (Banks) Family Tham.sidae
Xysticus pretiosus Gertsch Family Agelenidae
eybaeus sp. ( indet. juv. ) Family Theridiidae . . Theridion sexpunctatum Emerton Family Erigonidae
· Symni.gma minimum (Emerton) Scironis sima (Chamberlin) Ce:r:atinopSllif-lata Emerton 1 indet. sp. (juv.) ·
46
-
,,
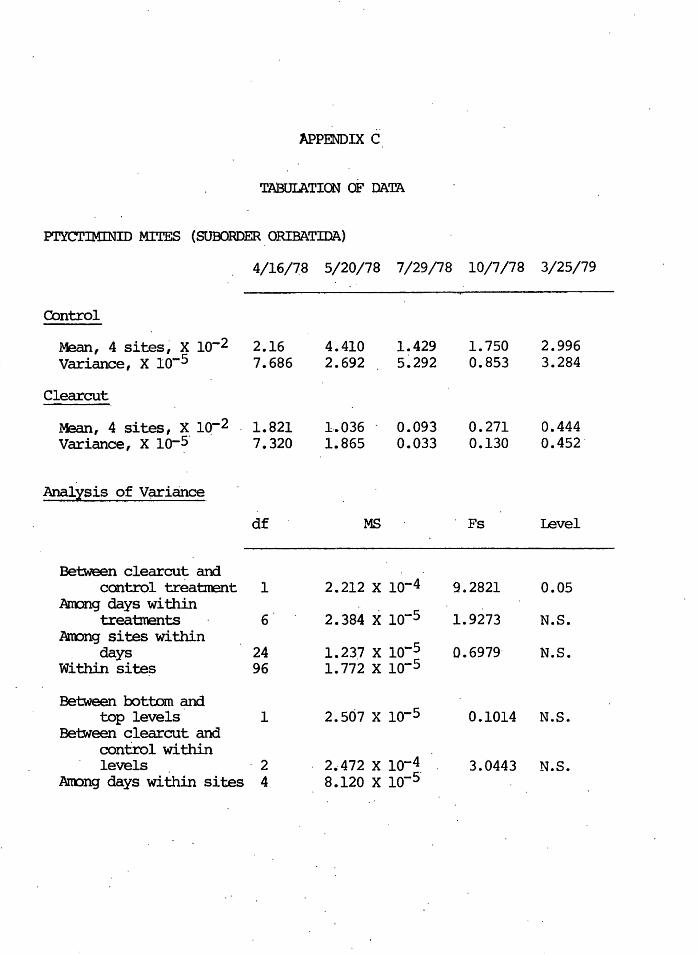
M>PENDIX C
TABUI.ATION oF DATA
Pl'YCTlMINID MITES (SUBORDER ORIBATIDA)
4/16/78 5/20/78 7/29/78 10/7/78 3/25/79
-Control
4 . ' 2 2.16 4.410 1.429 1. 750 2.996 Mean, sites, x io-Variance, x io-5 7.686 2.692 5~292 0.853 3.284
Clearcut
Mean, 4 sites, x iq-2 1.821 1 .• 036 0.093 0.271 0.444 Variance, X 10-~· 7.320 1.865 0.033 0.130 0.452'
Analysis of V~iance
df MS . Fs level
-Between clearcut and
control treabrent 1 2.212 x lo-4 9.2821 0.05 Arrong days within
2.384 x 10⁻⁵ treatments 6 1. 9273 N.S. Annng sites within
1.237 x 10⁻⁵ days 24 0.6979· N.S. Within site~ 96 1.112 x lo-5
Between bottom and top levels 1 2.507 x lo-5 0.1014 N.S.
Between clearcut and control within levels ·2 2.412 x lo-4 3.0443 N.S.
Annng days within sites 4 a.120 x lo-5·
tl n
liERMANNIELLA SP. (stJBORDER ORI_BATIDA)
4/16/78 5/20/78 7/29/78 10/7/78 3/25/79
Control
Mean, 4 sites, x lo-2 3.450 5.720 3.850 7.990 2.720 Variance, X 10-5 8.336 - 3.412 3.560 6.473 0.849
Clearcut
Mean, 4 sites, x io-2 2.959 4.640 0.395 1'!680 0.296 Variance, x lo-5 6.452 o. 233 , b.006 i.806 0.1~0
Analxsis of Var~ance
df MS Fs revel
Between clearcut and control treatment 1 2.637 x io-s 6.1889 0.05
Anong days within 4.264 x io-6 treatm:mts 6 0.6838 N.S.
Anong sites within 6.230 x lo-6 days 24 1.1796 N.S.
Within sites 96· 5.282 x io-6
Between top and bottan levels 1 i.221 x lo-5 0.4071 N.S •
. Between treatm:m:ts within levels 2 2.999 x 10⁻⁵ 3.4289 N.S.
Anong days within sites 4 8. 748 x '·10-6
I i
49
TRACHYTES SP. (siJBoRDER GAMASIDA)
4/16/78 5/20/78 7/29/78 10/7/78 3/25/79
-~ Control j 1
-Mean, 4 sites, x io-3 6.40 6.657 3.945 9.860. 7.889 Variance, x lo-5 3.145 1.451 0.027 0.117 O.l~p.
Clearcut Mean, 4 sites, x io-3 5.671 . 1.480 0.000 0.986 0.000 Variance, x io-5 L 256 .. ·o. 292 0.000 0.006 0.000
Analxsis of Variance
df MS Fs level
Between clearcut and control treatmmt 1 1.573 x lo-s 25.1302 0.01
Airv?ng days within 6.259.X lo-7 treatinents 6 0.6513 N.S.
Am:>ng sites within days 24 9.761 x lo-7 0.2647 N.S.
Within sites 96 3.687 x lo-6
Between.top and bottan 4.503 x lo-6 levels 1 0.3057 N.S.
Between treatments within levels 2 1. 473 .X lo-6 0.2759 N.S.
Anong days within sites 4 5.3j9 x lo-6
50
NANHERMANNIA SP. (SUBORDER ORIBATIDA)
4/16/78 5/20/78 7/29/78 10/7/78 3/25/79
-Control
Proportion of .-sites having g~us 1.00 1.00 0.93 1.00 0.93
Clearcut
Proportion of sites· having genus 1.00 0.88 0.73 0.63 o.~o
Analysis of Variar:ice.
df MS Fs revel
Between clearcut and · control trea~t 1 5913 .• 0 20.51 0.01
Annng days within . I treatments 6 288.3 1.38 N.S.
Am:mg sites within aays 24 208.6
'.
I ' '
~ICOLETIELLA SP. (SUBORDER ACTINEDIDA)
4/16/78 5/20/78 7/2·9/78
-Control --·
Mean,· 4 sites, X 10-3 3.358 6.90 1.479 variance, x io~6 1.263 3.063 0.783'
c;tearcut
Mean~ 4 sites, x io-3 3 •. 009 5.9 0.000 Variance, x· io-7 0.730 .3.833 0.000 .
Anal~is of Variance
. df MS
Between clearC'lit and control .treatment 1 5.667 x 10"'.""6
Aroong days within treatments 6 9.076 x io-7
Am:>ng sites within 4.624 x io-8 days 24
Within sites · 96 s.941 x io-7
Between top and bottan 3.676 x lo-6 levels 1
Bet;ween treatments within levels 2 6.395 x io-6
Anong days within sites 4 2.654 x io-6
51
10/7/78 3/25/79
7.64 2.71 4.596 1.563
0.986 0.739 3.333 1.625
Fs revel
6. 245- 0.05
19.627 0.01
0~078 0.01
0.575 N.S.
.. 2.410 N.S.
52
PARHOU\SPELIA SPl\WIA'rA (SUBOHDifil Gl\Ml\SIDJ\)
'lbtal densities (Nymphs + Adults)
4/16/78 5/20/78 7/29/78 10/7/78 3/25/79
-Control
~:1
Mean, 4 sites, x lo-2 1.55 1. 75 1.61 1.25 0.888 Variance, x lo·-5 8.12 8.68 17.0 6.91 4.97
Clearcut
Mean, 4 sites,· x lQ-2 · 1.42 0.369 0.364 0.647 0.197 Variance, x io-5 3.90 1.95 3.43 4.86 0.869
Analysis of Variance
df MS Fs Level
-Between clearcut and
control treatment 1" 5.51 x lo-4 20.792 0.01 Arcong days within
x lo-5 treatments 6 2.65 3. 014 . 0.05 Am:mg sites within
8.792 x lo-6 days 24 0.577 N.S. Within sites 96 1.523 x lo-s
Adult densities
4/16/78 5/20/78 7/29/7ij 10/7/?8 3/25/79
Control
Mean, 4 sites, 'x io-3 6.16 5.18 0.863 0.923 3.02 Variance, X 10.;..5 2.43 0.849 0.115 0.175 1.42
Clearcut
~lean, 4 sites, x lo-3 6.53 1.29 0.000 0.493 0.431 Variance, x lo-5 2.19 0.243 - 0.091 0.039
53
PARHOIAf3PELIA SPJ\TUIATA, continued
An.allsis of Variance
df MS Fs Level
-Between clearcut and
control treatrrent 1 2.262 x io-5 3.356 Am:>ng days within
x lo-6 treatments 6 6.74 8.999 0.01 Am:>ng ~ites within
days 24 7 .49 . x 10.,.7 +.133 N.S.
Nymph . densities
4/16/78 5/20/78 7/29/78 10/7/78 3/25/79
Control
_Mean, 4 sites, x lo-2 0.934 1.232 1.527 1.158 0.586 Variance, X 10-4 0.065 2.38 2.72 2.42 0.141
Clearcut
.· -2. Mean, 4.sites, X 10 0.767 0.240 0.364 0.598 0.154 variance, x io-s 0.·235 4.76 3.43 2.26 . 2.399
Mal~sis of Variance
df MS Fs Level
-Between clearcut~aria
· 3. 94. ·x lq-4 control treatmmt 1 15.183 0.01 Anong days within
2.595 x lo-5 treai;m:mts 6 3.910 0.01 Anong sites.within
6.638 x lo-6 days . 24 . 0.556 N.S~
Within sites 96 . 1.194 X· 10~5
·54
PARHOIASPELIA SPATUIATA, continued
Analysis of Vertical Migration·
df MS Fs Level l -I I Between top and
bottan levels 1 i.446 x lo-4 0.3479 N.S. Between juvenile and
adults within levels 2 4.157 x lo-4 1.8268 N.S.
Between treatrrents within stadia 4 2.21s x lo-4 6.2216 0.01
Arrong days within 3.657 x lo-5 treatrcents 24
55
GAMASELWS SP. (SUBORDER GAMASIDA)
'lbtal densities (Nynphs + Adults)
4/16/7~ 5/20/78. 7/29/78 10/7/78 3/25/79
Control
Mean, .4 sites, x lo-2 5.14 4.60 0.741 2.94 3.21 Variance, x lo-4 0.754 3.25 0.029 0.328 0.286
Clearcut
Mean, 4 sites, x lo-2 4.76 0.568 0.123 0.667 1.04 Variance, x lo-5 . 0.302 1.060 0.348 0.927 3.78
Analysis of Variance
df MS Fs revel
Between clearcut and control treatrrent 1 1. 874· x lo-4 7.74~ 0.05
Anong days within 9.231 0.01 trea'brents 6 2.419 x lo-5
Anong sites within 2.621 x lo-:-6 ·days 24 0.8591 N.S.
Within sites 96 3.051 x lo-6
Adult c:lensities
4/16/67 5/20/78 7/29/78 10/7/78 3/25/79
Control
. Mean, 4 sites,. x lo-2 · 0.97. 1.24 0'.320 0.715 0.841 Var~ance, x lo-5 0.079· o. 288. 0~089 2.094: 0.422
Clearcut ..
Mean, 4 Sites, g 10~2 · 1.200 0.444 0.049 0.247 . 0.148 Variance, x 10- 2.799 1.328 0.097 0.356 0.097
I I 56
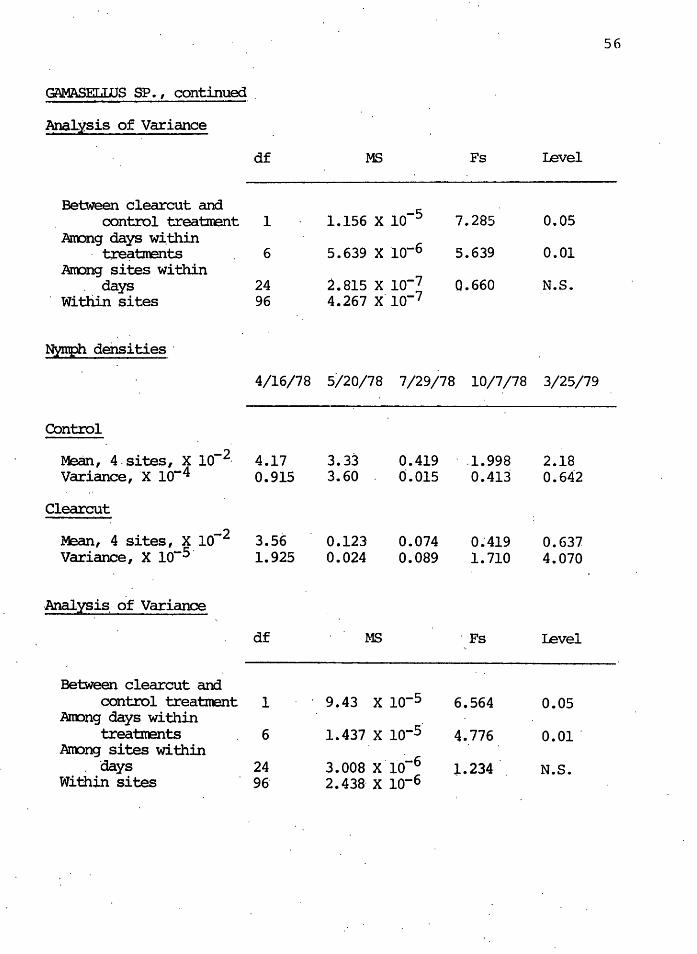
GAMASELllJS SP. , continued ..
Anal.:lsis of Variance
df MS Fs Level
-Between clearcut and
1.156 x 10-s control treatm:mt 1 7.285 0.05 Anong days w~thin
5.639 x io-6 . tx-e~tirents 6 5.639 0.01 Anong sites within
2.815 x lo-7 days 24 0.660 N.S. Within sites 96 4.267 x· lo-7
Nyxtph derisi ties_ ·
4/16/78 5/20/78 7/29/78 10/7/78 3/25/79
Control
Mean, 4. sites, x io-2. 4.17 3.33 0.419 .. 1.998 2.18 Variance, ·x io-4 0.915 3.60 0.015 0.413 0.642
Clearcut
Mean, 4 sites, x lo-2 3.56 0.123 0.074 0~419 0.637 Variance, X lo-5· 1.925 0.024 o.·oa9 1. 710 4.070
·Ana.l:tsis. of Variance
df MS · Fs Level
Between clearcut and control treatmant 1 9.43 x lo-5 6.564 0.05
Anong days within 1.437 x lo-s treatmants 6 4.776 0.01.
Anong sites within 3. 008 x · 1«)-6 days 24 l.234 N.S.
Within sites 96' 2.438· x lo-6
57
GA.."1\SELUJS SP. , continued
lmalysis of Vertical Migration·.
df MS Fs Level
-Between top and
1.596 x io-5 bottan levels 1 3.626 N.S. Between stadia
. . within levels 2 4.402 x 10⁻⁵ Q.785 N.S • Between treatlrents
· within stadia. 4 5.61 x- io-5 4.685 0.01 Anong days within
_i.197 x io-5 treatments 24
I APPENDJX D
l UNITED. STATES WEATHER BUREAU DATA l. l FOR WEEK PRECEDING ~ SA~LE DA~
COOGAR, WASHINGTON ELE.V. 203 m
APRIL 16, 1978 11 12 13 14 15 16 I Ave •.
Temp.' 0 c Max. 21.0 11. 7 15.6 7.8 8.9 14.4 I 13.2 Min. 4.4 .l! 7. . o.o 2.8 3.3 2.8 2.5
Precip. ,cm 0.00 o.oo 0.00 1.40 Q.97 1. 70
MAY .20, 1978 15 16 . 17 18 19 20 I Ave •
Tentp.' 0 c Max. 8.9 4.4 12.8 17.2 25.6 26.7 I 15.9 Min. 5-.6 2.2 3.9 5.6 7.!'2 10.6 5.8
. Preeip. 'cm 3.30 0.91 0.08 0.00 0.00 0.00
JULY 29, 1978 24 25 26 27 28 29 I Ave.
·Temp.' 0 c Max. 29.4 28.9 33.3 26.7 22.2 25.o. I 27.6 Min. 12.8 13-.9 15.0 12.8 12.2 11.1 13.0
Precip. , ctn 0.00 0.00 0.00 0.33 0.00 0.00
ccroBER 7, 1978 2 3 4 5 6 7 I Ave.
Temp.' oc Max. 20.6 23.3 22.8 23.9 23.3 - 24.4 I 23.1 Min. 6.7 7.2 8.3 8.3 11.l 9.4 8.5
Precip.';cm o .. oo o.oo 0.00 o.oo o.oo o .• oo
MARCH 25, 1979 20 21 22 23 . 24 25 . l Ave.
Tetrp., ° C Max •. 12.8 17.2 17.8 16.7 ~0.6 16. 7 · 1 17.0 Min. 1. 7 .. 1. 7 1.1 1. 7 l.7 0.6 1.4
Preciip. ,cm 0.00. 0·.00 . .0.00 0.00 Q.00 0.03