Embed Size (px)
Citation preview

Changes in precipitation extremes in a warming climate
Pao-Shin Chu Department of Meteorology School of Ocean & Earth Science & Technology University of Hawaii-Manoa Honolulu, HI, U.S.A.

IPCC AR4 (2007)
Giambelluca et al., (2008)

Extreme events in temperature and precipitation such as summer heat waves, cold spells in winter, heavy
rainfall/flooding, and drought are changing over time The occurrence of extreme events is a serious concern for society because of their potential damage to humans, property, public infrastructure, agriculture, transportation, and others.
To better monitor and understand the variations of extreme events, the Climate Variability and Predictability (CLIVAR) program has developed a suite of climate change indices for a standard comparison.
• In this study, five of the relevant climate change indices suggested by WMO/WCRP/CLIVAR are applied to Hawaii daily precipitation data to investigate the possible changes of extremes.
• Their relationships with the El Nino-Southern Oscillation (ENSO) and the Pacific Decadal Oscillation (PDO) are examined.
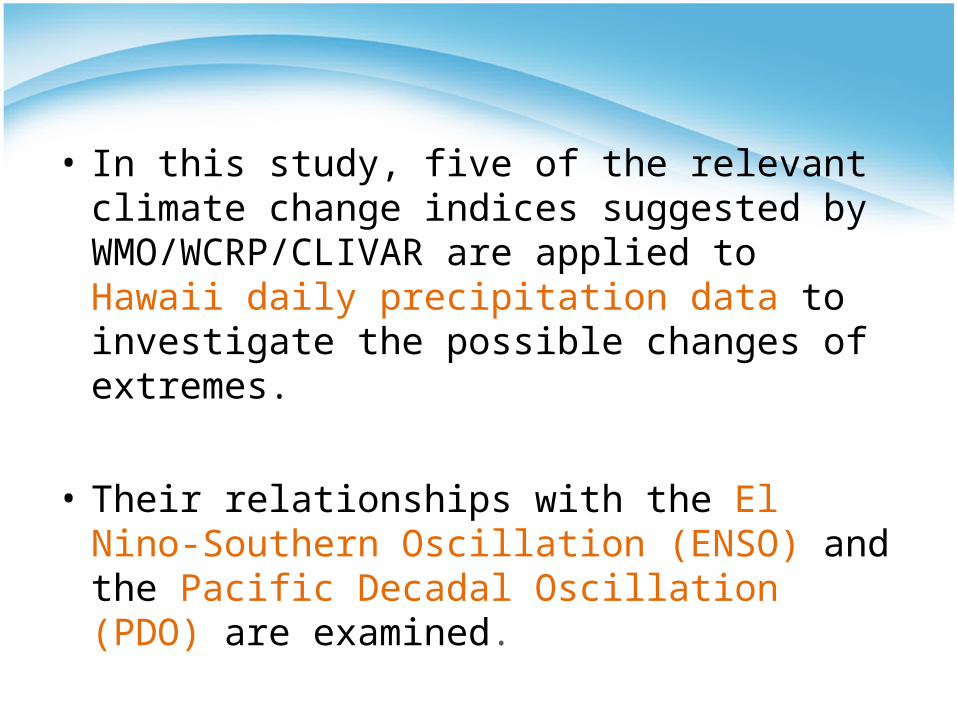
Observational data: COOP data from NCDC water year : July to June of the next year winter season: November through April of the next year
In order to maintain data quality, some criteria are applied to the data sets.
1. A month is considered as having complete data if there are 5 missing days.2. A year is considered as complete if all months are complete according to (1).3. A station series is considered as complete if it has 65% complete years
according to (2).
COOP stations Numbers
The 1950s-2007 The 1960s-2007 The 1970s-2007 The 1980s-2007
37 41 50 65
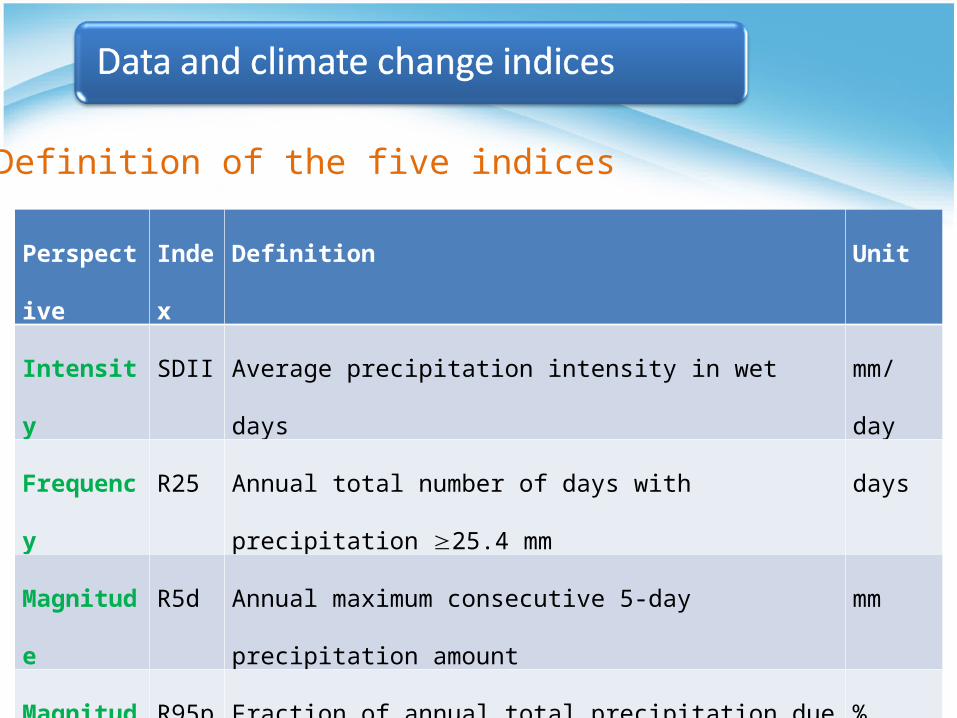
Perspective Index Definition Unit
Intensity SDII Average precipitation intensity in wet days mm/day
Frequency R25 Annual total number of days with precipitation 25.4 mm days
Magnitude R5d Annual maximum consecutive 5-day precipitation amount mm
Magnitude R95p Fraction of annual total precipitation due to events
exceeding the 1961-90 95th percentile
%
Drought CDD Annual maximum number of consecutive dry days days
Definition of the five indices
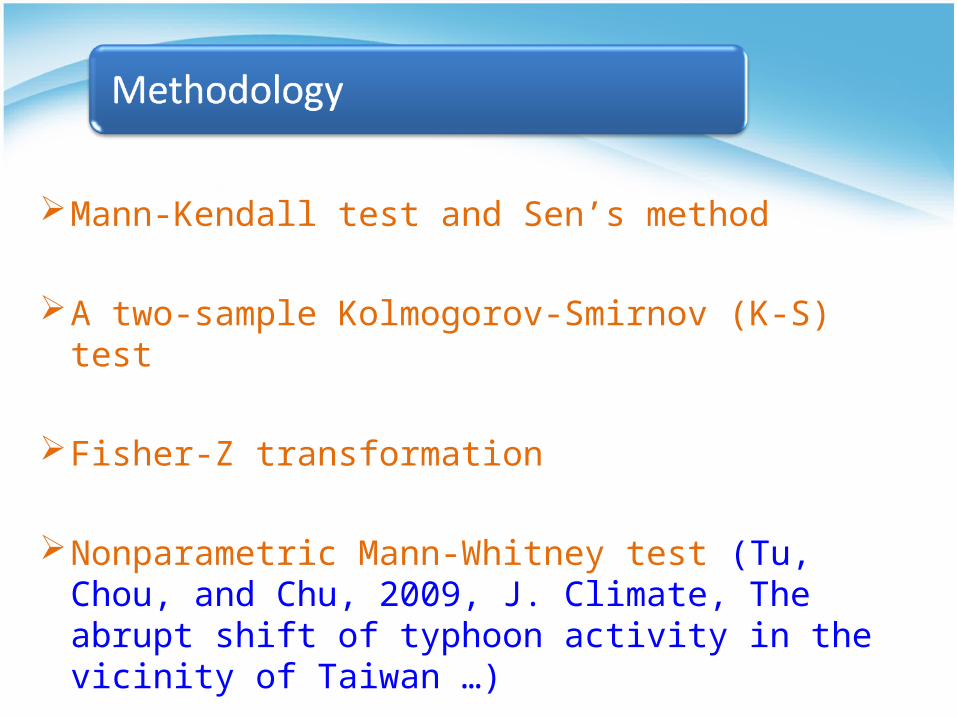
Mann-Kendall test and Sen’s method
A two-sample Kolmogorov-Smirnov (K-S) test
Fisher-Z transformation
Nonparametric Mann-Whitney test (Tu, Chou, and Chu, 2009, J. Climate, The abrupt shift of typhoon activity in the vicinity of Taiwan …)
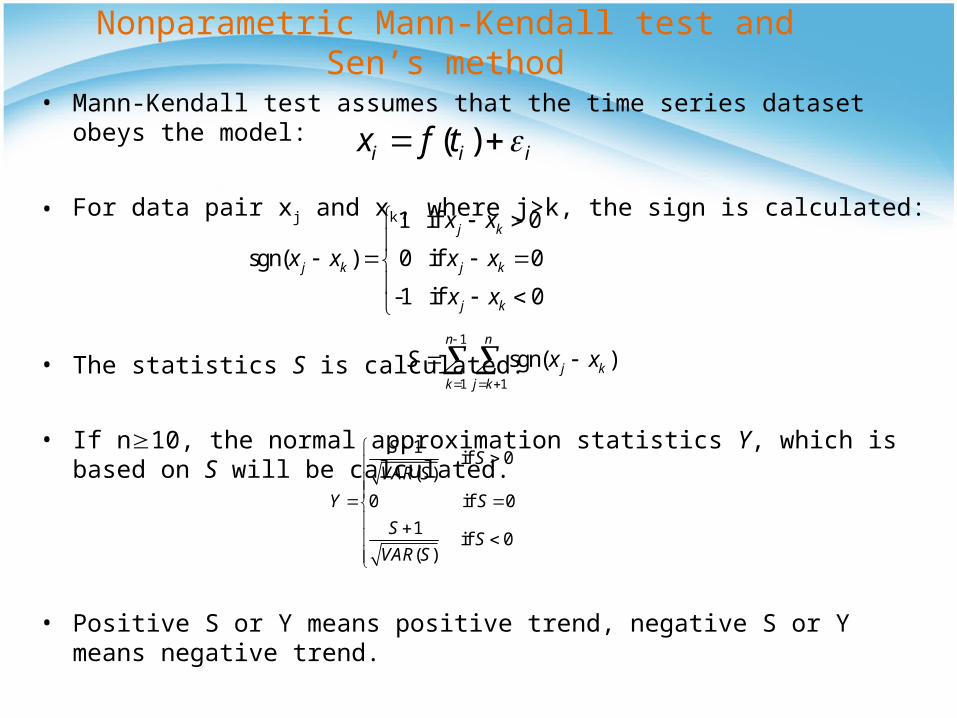
Nonparametric Mann-Kendall test and Sen’s method
• Mann-Kendall test assumes that the time series dataset obeys the model:
• For data pair xj and xk, where j>k, the sign is calculated:
• The statistics S is calculated:
• If n10, the normal approximation statistics Y, which is based on S will be calculated.
• Positive S or Y means positive trend, negative S or Y means negative trend.
( )i i ix f t
1
1 1
sgn( )n n
j kk j k
S x x
1 if 0
sgn( ) 0 if 0
-1 if 0
j k
j k j k
j k
x x
x x x x
x x
1 if 0
( )
0 if 0
1 if 0
( )
SS
VAR S
Y S
SS
VAR S

Nonparametric Mann-Kendall test and Sen’s method• When using Sen’s method to estimate the slope of the trend, first assume that
f(t) in can be represented by:
where Q is the slope to be estimated and B is a constant. • The slopes of all data pairs are calculated using
where j>k. The median of all these slopes of data pairs is the Sen’s estimator of slope.
• Mann-Kendall method tests whether the trend is increasing or decreasing and estimates the significance of the trend.
• Sen’s method quantifies the slope of this trend.• Missing values are allowed in these two methods, and the data need
not conform to any particular distribution. Besides, the Sen’s method is not greatly affected by single data errors or outliers.
( )f t Qt B ( )i i ix f t
j ki
x xQ
j k

• Using monthly precipitation data, Chu and Chen (J. Climate, 2005) suggested there is a downward trend in Hawaiian rainfall during the last century.
HRI: Hawaii Rainfall Index, 27 gages from 3 islands.
Data have been standardized.

In addition to the significance test applied to individual stations, field significance is
tested. • In a given dataset, one would expect a certain
number of stations or grids to pass a significance test at random. To ensure the significance at individual stations is not due to random chance, multiple testing is performed to investigate the field significance (multiplicity problem).
• Assuming spatial independence, a binomial probability distribution is used to evaluate the overall significance of the trends.
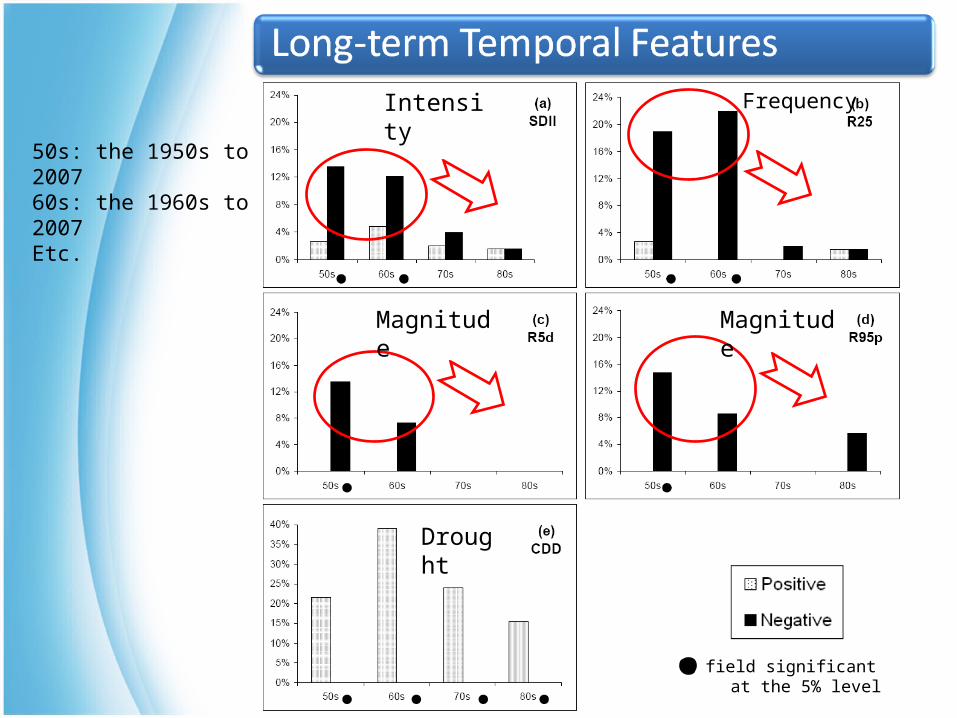
field significant at the 5% level
50s: the 1950s to 200760s: the 1960s to 2007Etc.
Intensity Frequency
Magnitude Magnitude
Drought

• Downward trends in SDII, R25, and R5d for Kauai and Oahu
• Upward trends in Hawaii
trends from the 1950s to 2007
Intensity
Frequency
Intensity
Frequency
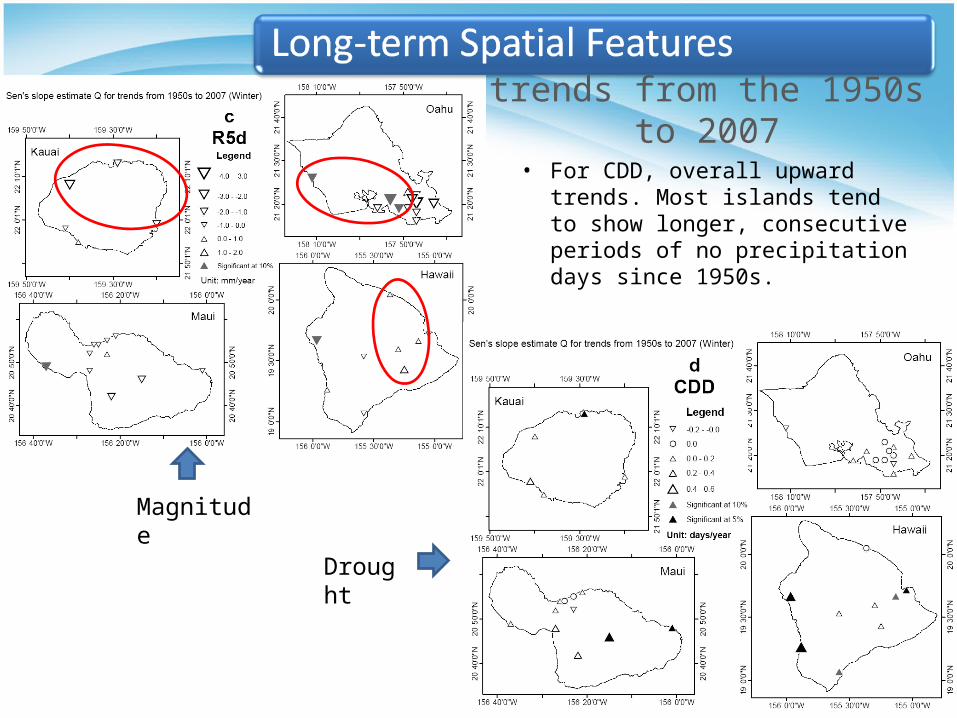
trends from the 1950s to 2007
• For CDD, overall upward trends. Most islands tend to show longer, consecutive periods of no precipitation days since 1950s.
Magnitude
Drought

30-year running series are considered. Time-dependent changes in extreme rainfall events are
examined for a 30-yr interval, but the series are moving forward one year at a time.
• 1950-1979, 1951-1980, until 1978-2007 (29 series). Analyze the trends of every 30-year window. Calculate the time derivatives of the trends (this allows us
to determine whether the trends are stable or changing with time).

Time series at Honolulu International Airport
SDII
trends of 30-year running series
Long-term downward trend positive time derivative of trendLong term trend is changing in time (gentle or even changing sign).
Trend of 1950-1979 is plotted in the 1964, trend of 1951-1980 is plotted in the 1965, etc.
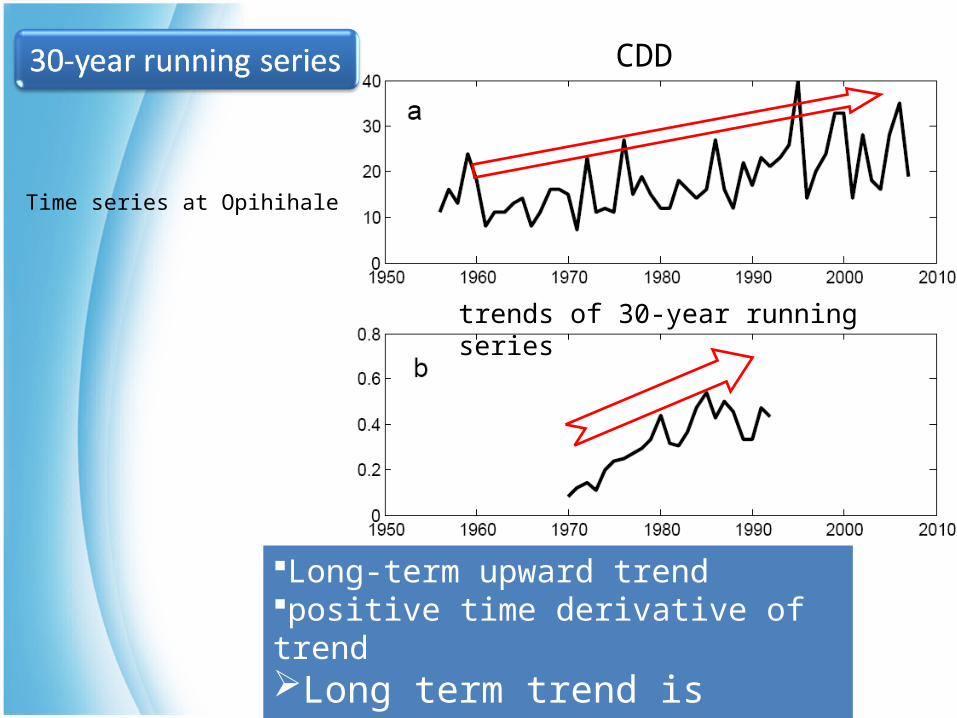
Time series at Opihihale
CDD
trends of 30-year running series
Long-term upward trend positive time derivative of trendLong term trend is stable.
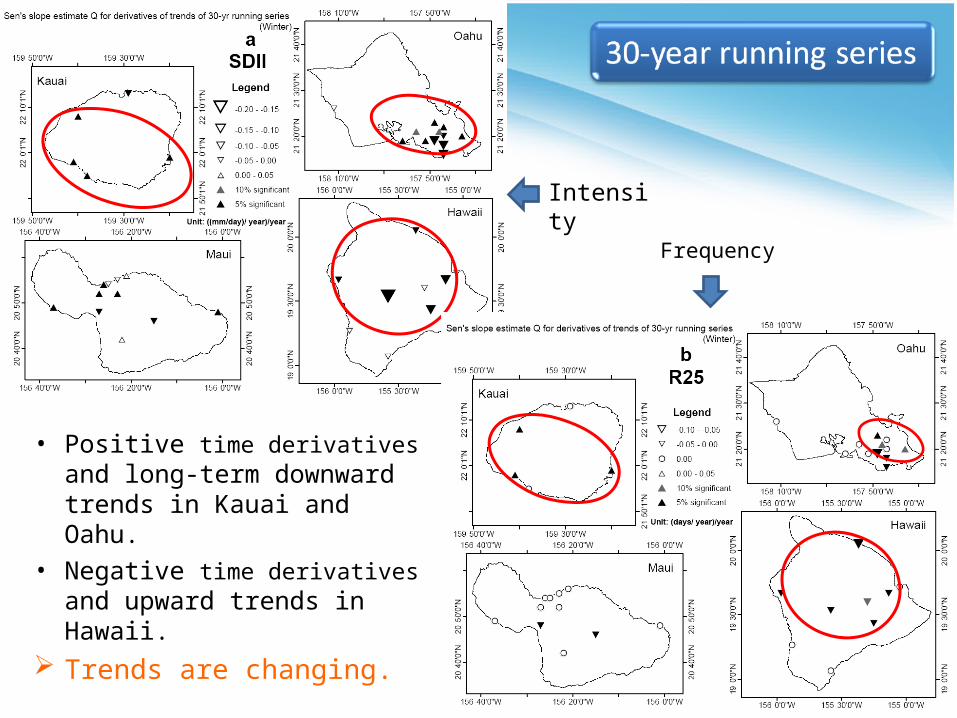
• Positive time derivatives and long-term downward trends in Kauai and Oahu.
• Negative time derivatives and upward trends in Hawaii.
Trends are changing.
Intensity
Frequency

• For CDD, positive time derivatives and positive trends.
Trends are stable.
Magnitude
Drought
• Chu (1995) proposed a mechanism that associates deficient precipitation in Hawaii during winter with El Niño .
• Chu and Chen (2005) suggested deficient precipitation in El Niño /+PDO phase, while abundant precipitation during La Niña /-PDO phase in Hawaii using monthly precipitation data.

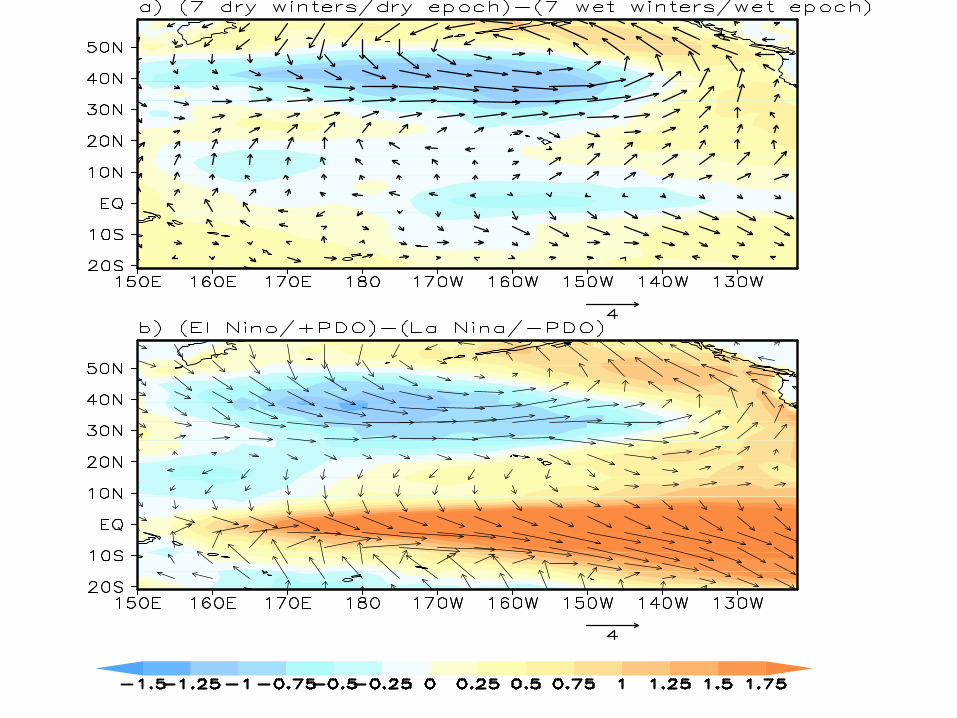
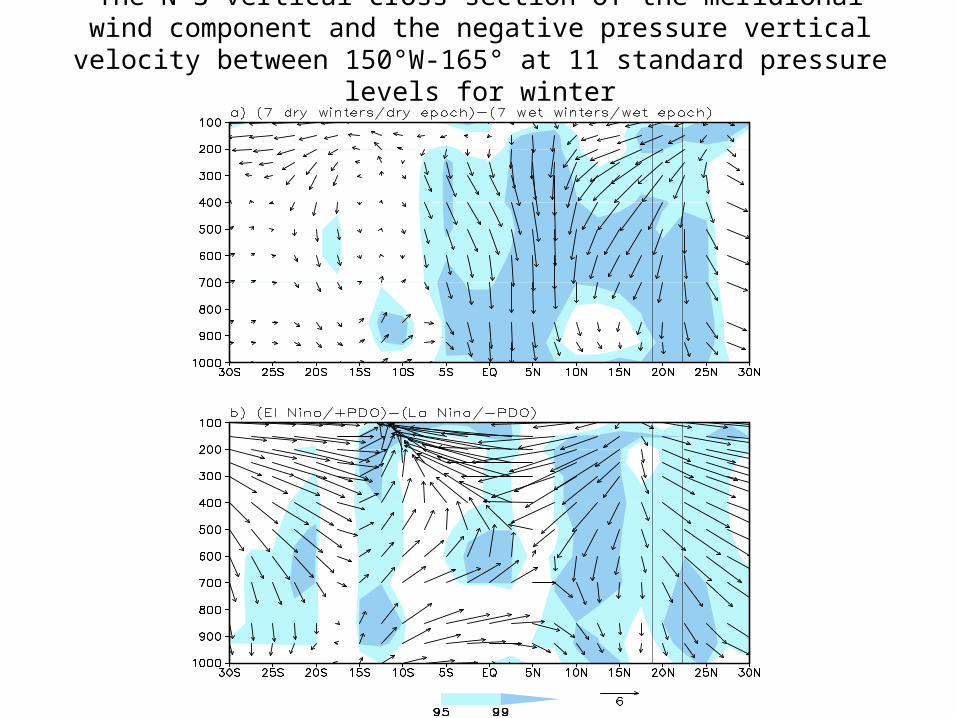
The N-S vertical cross section of the meridional wind component and the negative pressure vertical velocity between 150°W-165° at 11 standard
pressure levels for winter

• Positive correlations between four precipitation-related indices and SOI, and negative correlations between CDD and SOI (the Fisher Z transformation is applied to the original correlation coefficients).
• For La Niña event (large and positive SOI), Hawaii not only tends to have more seasonal rainfall, but also receives more frequent heavy rainfall. For El Niño years, there are fewer extreme events. For CDD, shorter annual maximum consecutive dry days during La Niña events while they are longer for El Niño years.
0%
20%
40%
60%
80%
100%
SDII (+) R25 (+) R5d (+) R95p (+) CDD (-)

Return periods of rain storms
• Assessing the vulnerability of a region to extreme rainfall and associated flood events is an important step in disaster prevention plans.
• The Generalized Extreme Value (GEV) distribution and its L-moment estimation
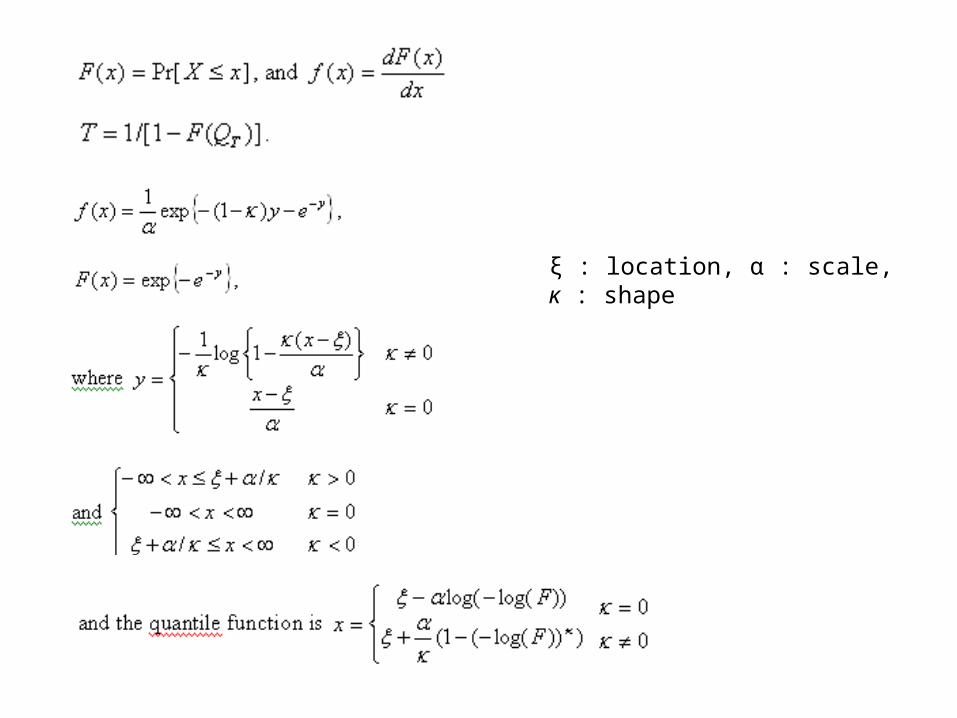
ξ : location, α : scale, ĸ : shape

Oahu

• Previous analysis is based on a stationary GEV model by assuming climate does not change (stationary). Recently we have applied a non-stationary GEV method so that the parameters are allowed to vary with time. Return levels are changing with time.


Dynamical downscaling for future rainfall variations for an island (C. Norton)
• IPCC AR4 GCMs• WRF 3.2 model Two-way nesting, very high-resolution (1 km)
resolution (super-computer) Noah land surface CAM radiation scheme (NCAR community Atmosphere model)
Yonsei University boundary layer scheme Tiedtke cumulus parameterization Cloud microphysics (WSM6)

Domain
4 nested:
Parent: 50km2nd: 25km3rd: 5km4th: 1km28 Vertical layers
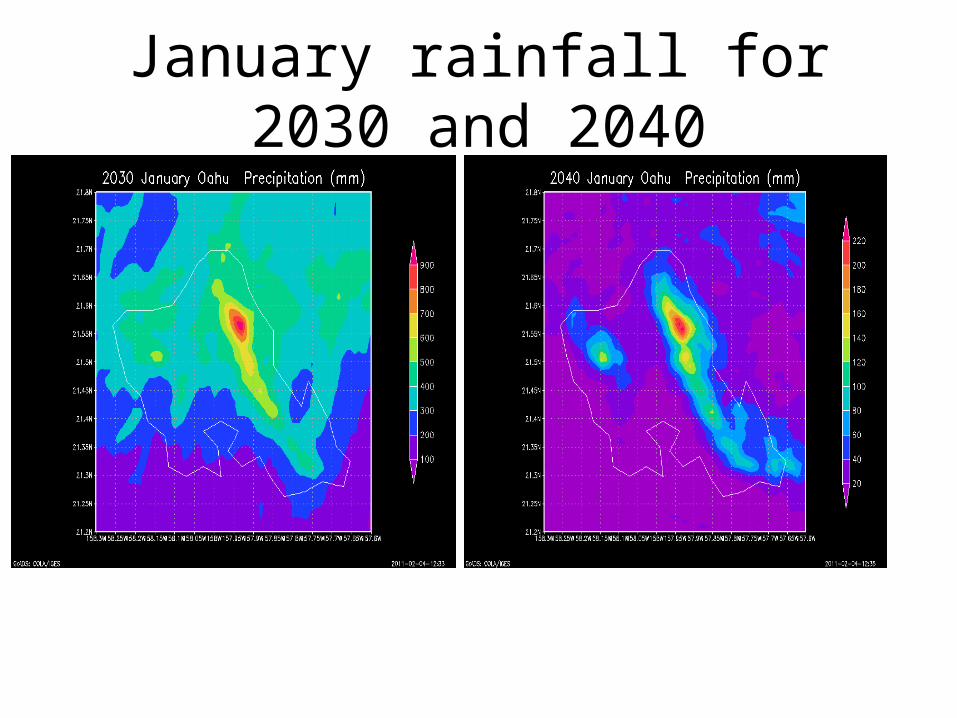
January rainfall for 2030 and 2040
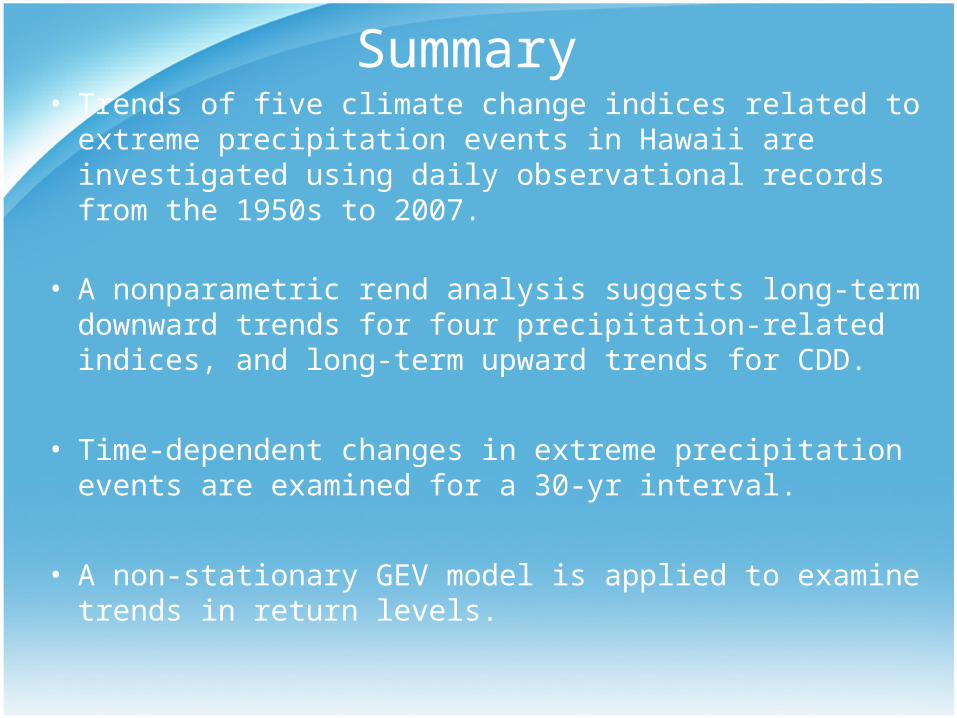
Summary • Trends of five climate change indices related to extreme
precipitation events in Hawaii are investigated using daily observational records from the 1950s to 2007.
• A nonparametric rend analysis suggests long-term downward trends for four precipitation-related indices, and long-term upward trends for CDD.
• Time-dependent changes in extreme precipitation events are examined for a 30-yr interval.
• A non-stationary GEV model is applied to examine trends in return levels.
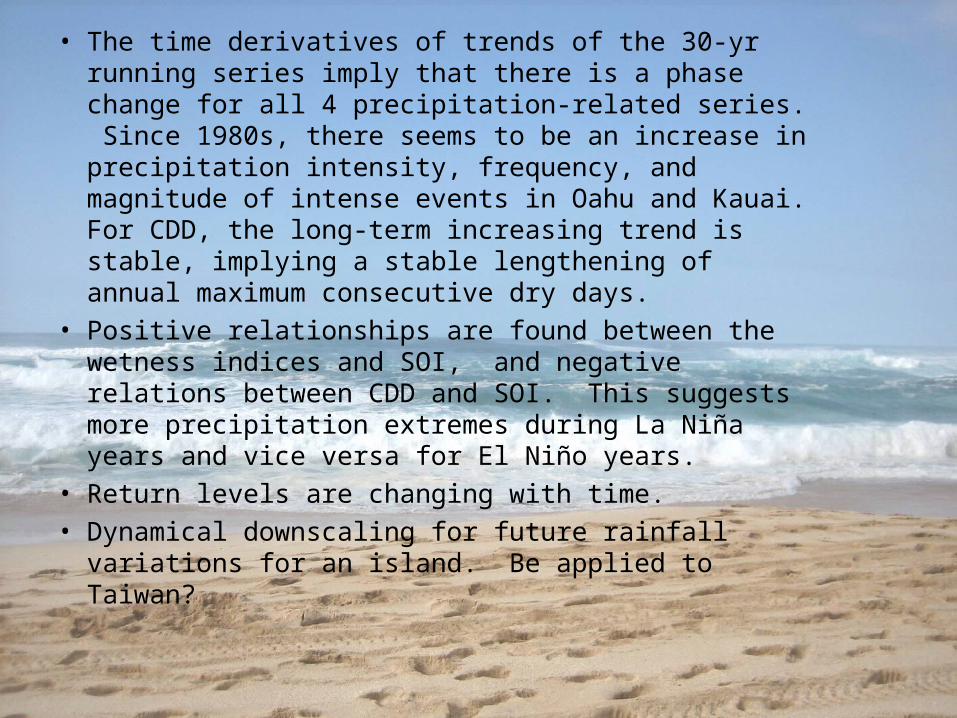
• The time derivatives of trends of the 30-yr running series imply that there is a phase change for all 4 precipitation-related series. Since 1980s, there seems to be an increase in precipitation intensity, frequency, and magnitude of intense events in Oahu and Kauai. For CDD, the long-term increasing trend is stable, implying a stable lengthening of annual maximum consecutive dry days.
• Positive relationships are found between the wetness indices and SOI, and negative relations between CDD and SOI. This suggests more precipitation extremes during La Niña years and vice versa for El Niño years.
• Return levels are changing with time.• Dynamical downscaling for future rainfall variations for
an island. Be applied to Taiwan?

• Chen, Y., P.-S. Chu, and T. Schroeder, 2011: Trends in precipitation extremes and return levels in the Hawaiian Islands under a changing climate. In preparation.
• Chu, P.-S., Y. Chen, and T. Schroeder, 2010: Changes in precipitation extremes in the Hawaiian Islands in a warming climate. J. Climate, 23, 4881-4900.
• Chu, P.-S., X. Zhao, Y. Ruan, and M. Grubbs, 2009: Extreme rainfall events in the Hawaiian Islands.
J. Appl. Meteor. Climatol., 48, 502-516.
• Chu, P.-S. and H. Chen, 2005: Interannual and interdecadal rainfall variations in the Hawaiian Islands. J. Climate, 18, 4796-4813.
Thank You!


![Ester Base Stocks for Marine Lubricants · PAO 4 PAO 6 PAO 8 PAO 10 ® 4064 180 160 140 120 100 PAO 8 DEHYLUB ® 4022 4071 4030 4060 4059 DEHYLUB PAO 4 PAO 6 PAO 10 ® 4064 [°C]](https://img.pdfslide.net/doc/110x75/5f6e94174941fc7b2b485d56/ester-base-stocks-for-marine-lubricants-pao-4-pao-6-pao-8-pao-10-4064-180-160.jpg)