Embed Size (px)
Citation preview
PRENATAL DIAGNOSISPrenat Diagn 2003; 23: 909–916.Published online in Wiley InterScience (www.interscience.wiley.com). DOI: 10.1002/pd.723
Changes in the frequency power spectrum of fetal heart ratein the course of pregnancy
Peter Van Leeuwen1*, Daniel Geue2, Silke Lange2, Wolfgang Hatzmann3 and Dietrich Gronemeyer2
1Department of Biomagnetism, Research and Development Center for Microtherapy (EFMT) Bochum, Germany2Department of Radiology and Microtherapy, University of Witten/Herdecke, Bochum, Germany3Department of Obstetrics, University of Witten/Herdecke, Marienhospital, Witten, Germany
Objective The aim of this study was to examine changes in the heart rate variability based on the frequencypower spectrum of healthy fetuses during the second and third trimester of pregnancy.
Methods We analyzed 222 fetal magnetocardiograms recorded in 49 healthy singleton pregnancies betweenthe 16th and 42nd week. Discrete Fourier transformation was performed on the time-based step function of theRR-intervals. Changes of spectral density in the frequency spectrum in various bands between 0.003 to 1 Hz,including low-frequency (LF: 0.04–0.15 Hz) and high-frequency (HF: 0.15–0.40 Hz) bands, were examinedas a function of gestational age.
Results Spectral density between 0.003 to 1.0 Hz increased with gestational age with large changes, inparticular, at lower frequencies. At approximately the 32nd week, the rate of increase in power slowedsubstantially. Prior to this time, the rates of change in power were different for the bands 0.003 to 0.40 Hz,0.40 to 0.60 Hz and 0.60 to 1.0 Hz. LF and HF showed similar development, with HF increasing slightly morerapidly.
Conclusion We conclude that characteristic spectral bands that increase in spectral density at different ratesduring the second and third trimester may be identified. They most likely reflect developmental changes andbehavioral states during pregnancy. Copyright 2003 John Wiley & Sons, Ltd.
KEY WORDS: fetal heart rate variability; magnetocardiography; spectral analysis; gestational age
INTRODUCTION
In the examination of heart rate variability, the analysisof the power spectral density has been used to quantifyperiodic changes in the basal heart rate. In adults,frequency bands have been identified, which can berelated to the activity of the autonomic nervous systemon physiological rhythms such as respiration, changes inblood pressure or thermoregulation (Cerutti et al., 1995).In particular, the low-frequency band (LF) between 0.04and 0.15 Hz is often associated with sympathetic as wellas parasympathetic activity, whereas the high-frequencyband (HF) in the range from 0.15 to 0.4 Hz is mediatedby parasympathetic activity (Camm et al., 1996).
The application of spectral analysis to fetal heartrate has been sparse. However, changes in the powerspectrum with respect to fetal age (Hirsch et al., 1995),growth retardation and fetal movement (Breborowiczet al., 1988) have been reported. Most studies applyingspectral analysis have focussed on fetal respiratoryactivity and have identified spectral peaks in the rangebetween 0.4 and 1.0 Hz, which seem to reflect theactivity of fetal breathing movements (Divon et al.,1985; Ferrazzi et al., 1989; Karin et al., 1993; Wakaiet al., 1993; Groome et al., 1994). A few studies haveexamined frequency bands below 0.4 Hz, noting that
*Correspondence to: Dr Peter Van Leeuwen, Dept. of Biomag-netism, EFMT, Universitatsstr. 142, 44799 Bochum, FederalRepublic of Germany. E-mail: [email protected]
most of the power lay at lower frequencies (Ferrazziet al., 1989; Wakai et al., 1993; Groome et al., 1994).To date, however, there is no agreement on bandwidthsthat are appropriate to assess fetal state or development.Also, the number of fetal traces examined in previousstudies has been relatively small, usually below 20. Thisis problematic particularly when developmental aspectsare considered and the traces are acquired over a widerange of gestational ages.
Spectral analysis of fetal heart rate variability isgenerally based on fetal ECG registration. However,apart from recordings made after the rupture of mem-branes using scalp electrodes, fetal ECG is not a routinemethod, due to the difficulties in extracting the signal(Cicinelli et al., 1994). On the other hand, phonocar-diography and Doppler-ultrasonography, although occa-sionally implemented in spectral analysis, are not accu-rate enough to produce reliable results (Hirsch et al.,1995). A further method is fetal magnetocardiography,which registers the magnetic component of electric car-diac activity. It produces a high quality fetal cardiacsignal, which can be registered as early as the 13th weekof gestation (Dunajski and Peters, 1995) and has beenapplied in a number of studies examining fetal heart ratevariability (Wakai et al., 1993; Rassi and Lewis, 1995;Van Leeuwen et al., 1999b).
The goal of this study was to examine the frequencyspectrum of heart rate time series of a substantial numberof healthy fetuses at regular intervals during pregnancyin order to determine whether consistent changes in
Copyright 2003 John Wiley & Sons, Ltd. Received: 9 May 2003Revised: 9 May 2003
Accepted: 21 July 2003
910 P. VAN LEEUWEN ET AL.
the power of specific frequency bands exist. Fetalmagnetocardiography was used to record fetal cardiacactivity as of the second trimester and attempts weremade to examine a sufficient number of subjects topermit the analysis of changes on a weekly basis.
METHODS
Subjects
In this study, we examined a total of 49 women aged26 to 39 years (32 ± 3, mean ± SD) who presentedwith healthy singleton pregnancies. Informed consentwas obtained from all the subjects and the studywas approved by the local ethics committee. In 44subjects, noninvasive magnetocardiographic recordingsof fetal cardiac activity were performed between 1 and9 times during pregnancy (4.0 ± 2.4 per subject fora total of 174 subjects), multiple recordings usuallyoccurring at regular intervals of roughly 4 weeks upto the time of birth. In the remaining 5 subjects, fetalmagnetocardiograms were obtained at weekly intervalsresulting in 10, 13, 14, 15 and 24 recordings per subjectrespectively. Altogether, 250 recordings were acquiredbetween the 13th and 42nd week of gestation. Thequality of 28 recordings, all before the 20th week ofgestation, was poor and they could not be evaluated.Of the 222 recordings that remained, the earliest wasin the 16th week of gestation. On average, 8.2 ± 4.0recordings were available per week of gestation, slightlyfewer before the 20th and after the 39th week (Table 1).
Measurements
Fetal magnetocardiogram recordings were performedwith one of two biomagnetometer systems: a 37-channelKrenikon (Siemens, Erlangen) or a 67-channel Magnes1300C (4D Neuroimaging, San Diego). The formerhas a probe diameter of 19 cm and the sensors areconfigured as first order gradiometers. The latter has adiameter of 33 cm with magnetometer sensors as wellas a configuration of 11 reference coils used to detect
Table 1—Change in RR-interval and time domain heart ratevariability (mean ± SD) over recordings in defined periodsof gestation: 5-min mean fetal RR-interval (mRR), standarddeviation (SDRR) and the root mean square of successivedifferences (rmsSD) of the RR-intervals
Gestationalage (weeks) n
mRRms
SDRRms
rmsSDms
16–19 14 400 ± 14 7.9 ± 2.4 2.2 ± 0.520–23 35 401 ± 14 9.9 ± 4.2 2.5 ± 0.724–27 39 403 ± 16 15.4 ± 5.5 4.3 ± 2.428–31 45 407 ± 15 18.2 ± 7.5 5.3 ± 2.532–35 35 408 ± 13 17.4 ± 4.9 5.6 ± 2.336–39 44 410 ± 11 20.4 ± 6.8 6.3 ± 3.040–42 10 410 ± 11 19.5 ± 9.8 7.2 ± 3.2
n , number of data sets.
ambient noise. System noise is less than 10 fT/√
Hzfor frequencies >10 Hz for both systems. Subjects werein a resting, supine condition. For data acquisition, theprobe was placed over the maternal abdomen such thatfetal signal amplitude was optimized. After an adaptationperiod of 10 to 15 min, data were recorded for 5 minwith a bandpass of 1 to 200 Hz at a sampling rateof 1 kHz. To reduce the influence of electromagneticartifacts, the measurements were performed in a shieldedroom (Vakuumschmelze AK3b, Hanau, Germany). Allrecordings took place between 10 a.m. and 4 p.m.
Data analysis
Signal analysis was performed in three steps follow-ing accepted standards (Camm et al., 1996) and isdescribed in more detail below: (1) determination ofa discrete event series (DES) of beat-to-beat intervals,(2) transformation of the DES into a time vector and(3) implementation of the Fourier transformation. Inorder to facilitate the identification of fetal cardiac activ-ity, the mother’s cardiac signal was first removed. Allmaternal beats were identified using a maternal QRS sig-nal template and the averaged maternal PQRST signalwas then digitally subtracted in all channels. Subse-quently, the fetal heartbeats were identified on the basisof a fetal QRS template. Complexes not automaticallyrecognized were visually identified and added manu-ally; similarly, falsely marked artifacts were removed.Heart period was determined with an accuracy of 1 msas the time between consecutive QRS complexes. Whenthey occurred, ectopic beats as well as short bradycardicepisodes (Van Leeuwen et al., 1999) were removedand replaced by linearly interpolated beats (Geue et al.,2000). The DES of a complete set of fetal heart periodsover 5 min, thus extracted from each recording, servedas the basis for further analysis.
As the use of the Fourier transformation on data inthe time domain, that is, avoiding the use of event steps,is more appropriate and easier to interpret (Camm et al.,1996; Janssen et al., 1993), we transformed the DESas follows. The event-based ordinal scale (beats) waschanged to a time-based scale by defining a step functionin which step height and duration were determinedby beat-period length. This function was sampled at1 kHz and a discrete Fourier transformation was thenperformed on this time vector.
In the resulting frequency spectra, changes in the fre-quency range between 0.003 and 1.0 Hz were examinedwith respect to week of gestation. In this range, thepower in each spectrum was integrated over 20 consec-utive bands with a bandwidth of 0.05 Hz between 0.003and 1.0 Hz. Each of these bands was examined visuallywith respect to the continuity of change in power overgestational age. Consecutive bands that demonstrated asimilar development over time were grouped together.These empirically determined bands reflecting specificrates of change in power over gestational age were:0.003 to 0.40 Hz, 0.40 to 0.60 Hz and 0.60 to 1.0 Hz.Finally, the power in standard bands considered to reflectautonomic function in adults, LF (0.04–0.15 Hz) and HF
Copyright 2003 John Wiley & Sons, Ltd. Prenat Diagn 2003; 23: 909–916.
SPECTRAL ANALYSIS OF FETAL HEART RATE 911
(0.15–0.40 Hz), as well as their quotient LF/HF werecalculated. The rate of change of these bands during dif-ferent gestational periods was assessed using regressionanalysis.
Statistics
Group values were expressed as means ± SD or medi-ans, where appropriate. In examining the changes inpower in specific bands, the data were transformed log-arithmically in order to account for the skewed distri-bution resulting from the squared units of power (ms2).Simple linear regression was used to estimate the regres-sion parameters of the bands over gestational age. Non-linear regression analysis was used to characterize thevarying rates of change in power in the period beforethe 32nd week of gestation. For all regressions, thevarying number of data sets per subject were consid-ered by performing a robust regression using a modi-fied Huber/White/Sandwich estimator of variance, whichtakes the dependency of repeated measurements intoaccount (Williams, 2000). Statistical significance wasassumed at a level of 0.05.
RESULTS
Over the observed period of gestation, fetal RR-intervalincreased slightly, corresponding to a change in heartrate from 150 ± 5 to 139 ± 11 bpm (Table 1). Heart ratevariability in the time domain increased considerably,both in terms of the standard deviation of the RR-intervals (SDRR) and the root mean square of successive
RR-interval differences (rmsSD), both calculated overthe 5 min of data per recording (Table 1).
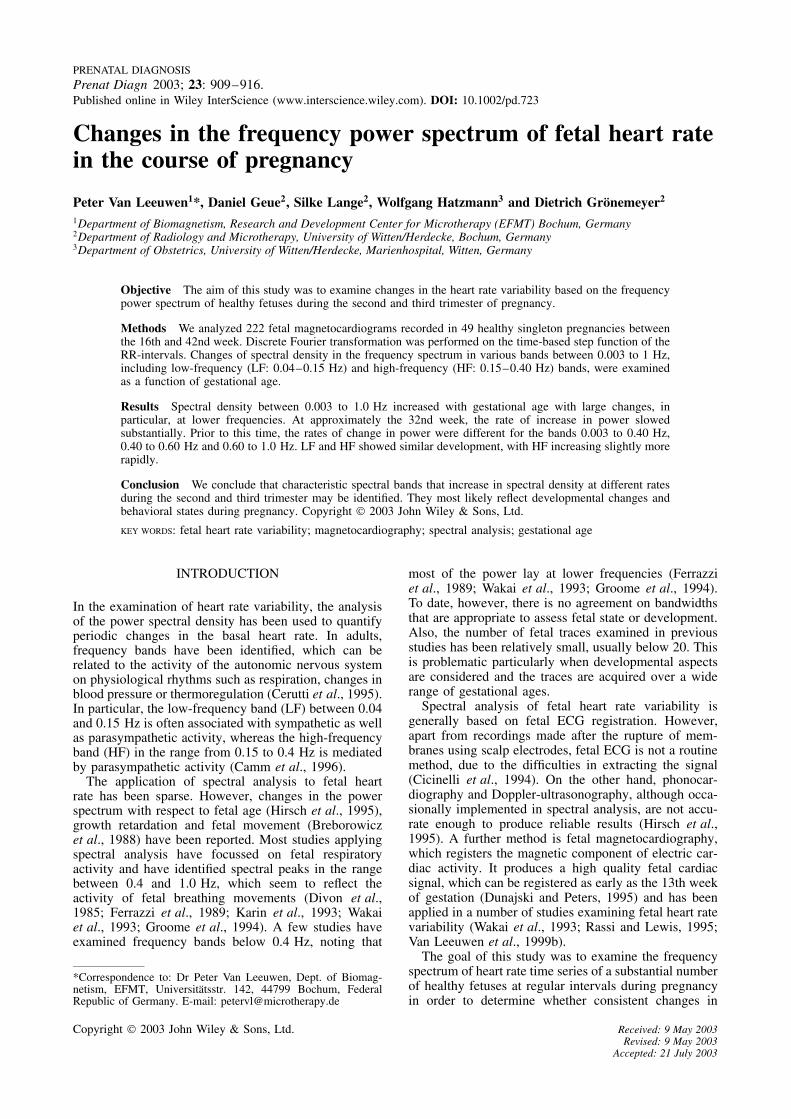
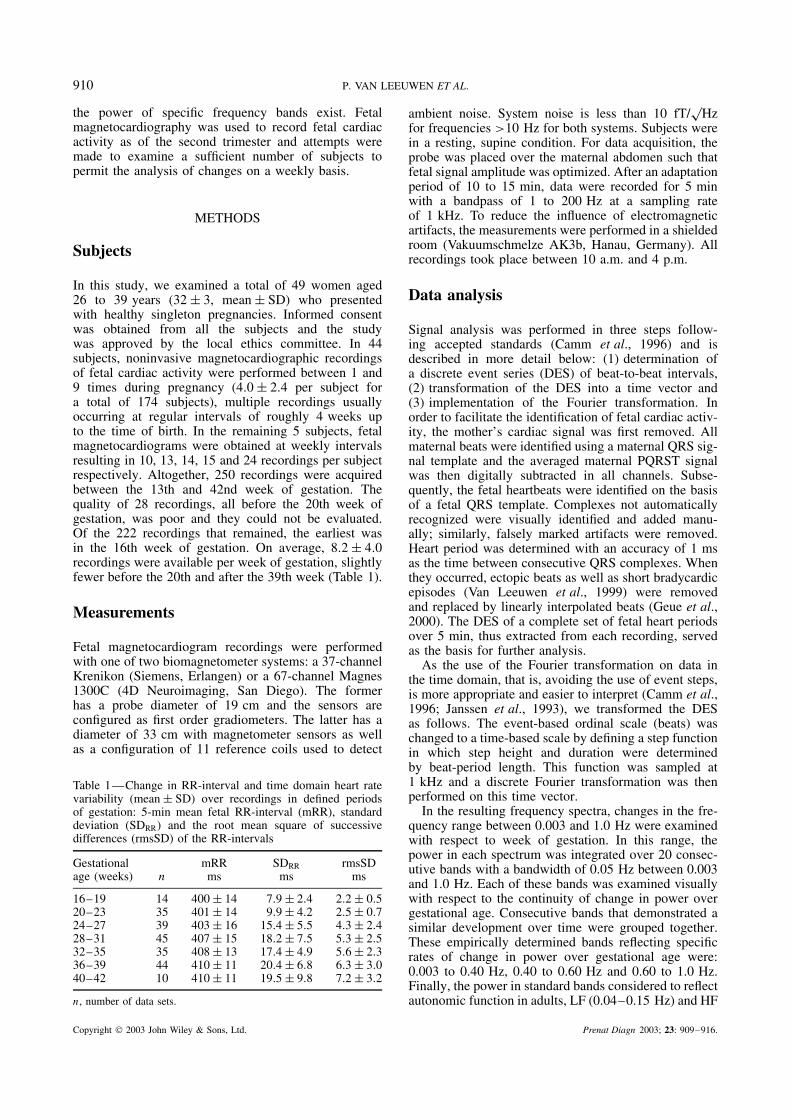
Visual inspection of the individual spectra between0.003 and 1.0 Hz revealed overall that power tendedto increase with advancing gestational age (example inFigure 1). This increase was greater at lower frequenciesand particularly extensive before the 32nd week. In theperiod of gestation observed, the power below 1 Hzincreased on average roughly fivefold over a wideningrange of values (Figure 2, top panel). Most of theincrease in power in this band was more or less uniformup to the 31st week, after which the values varied withina constant range. Regression analysis revealed a clearshift in the rate of increase in power during that week:the parameters of the regression based on the data up tothe 31st week show a steeper slope and better fit (basedon r2) than those based on all data (Table 2). Also, theparameters of regression after the 31st week indicate nodependency on gestational age.
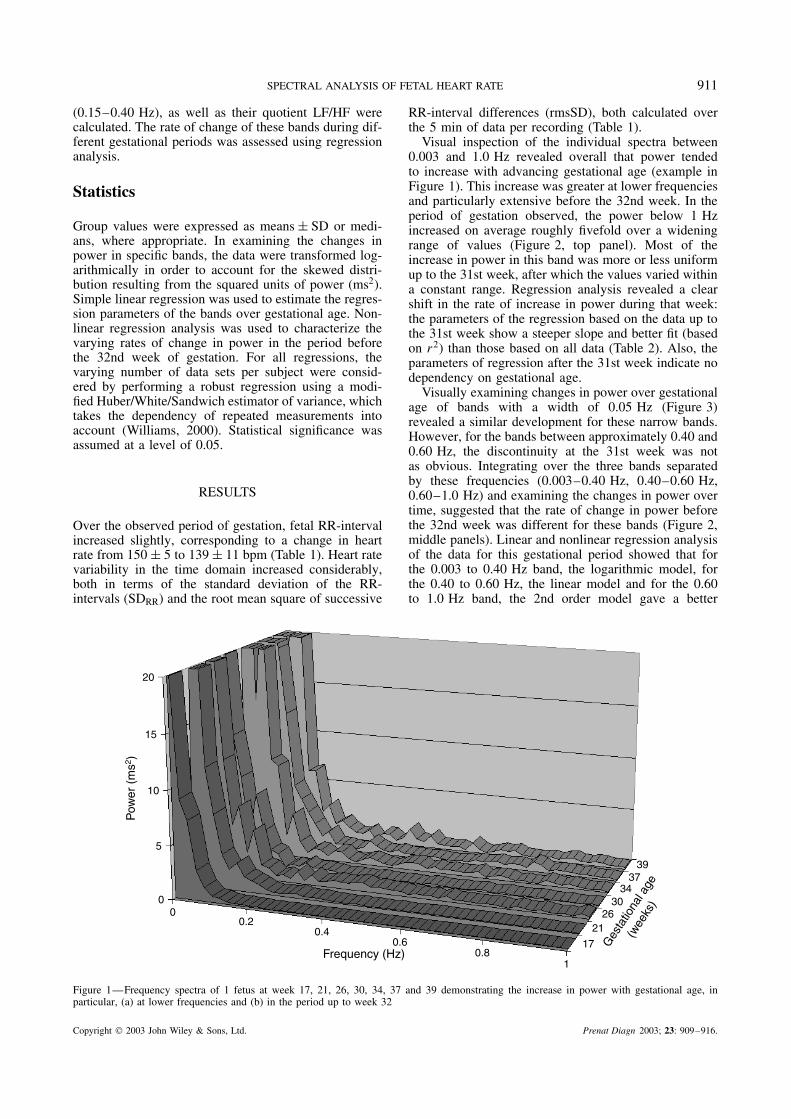
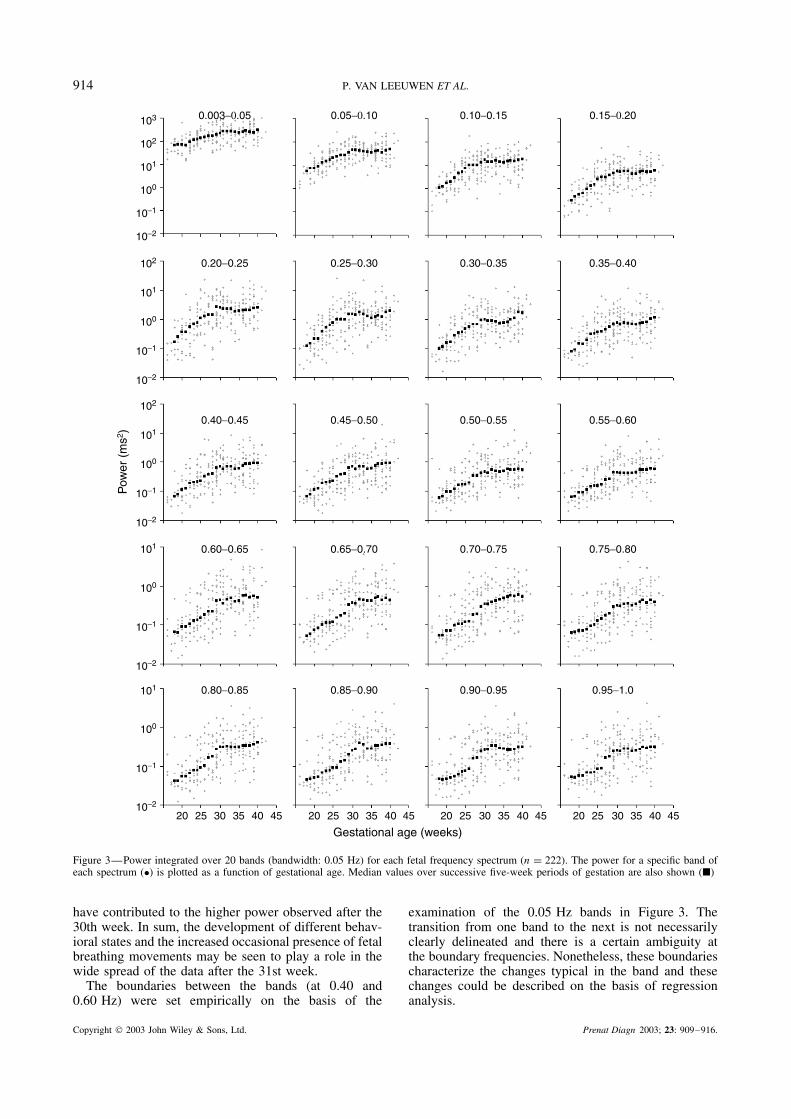
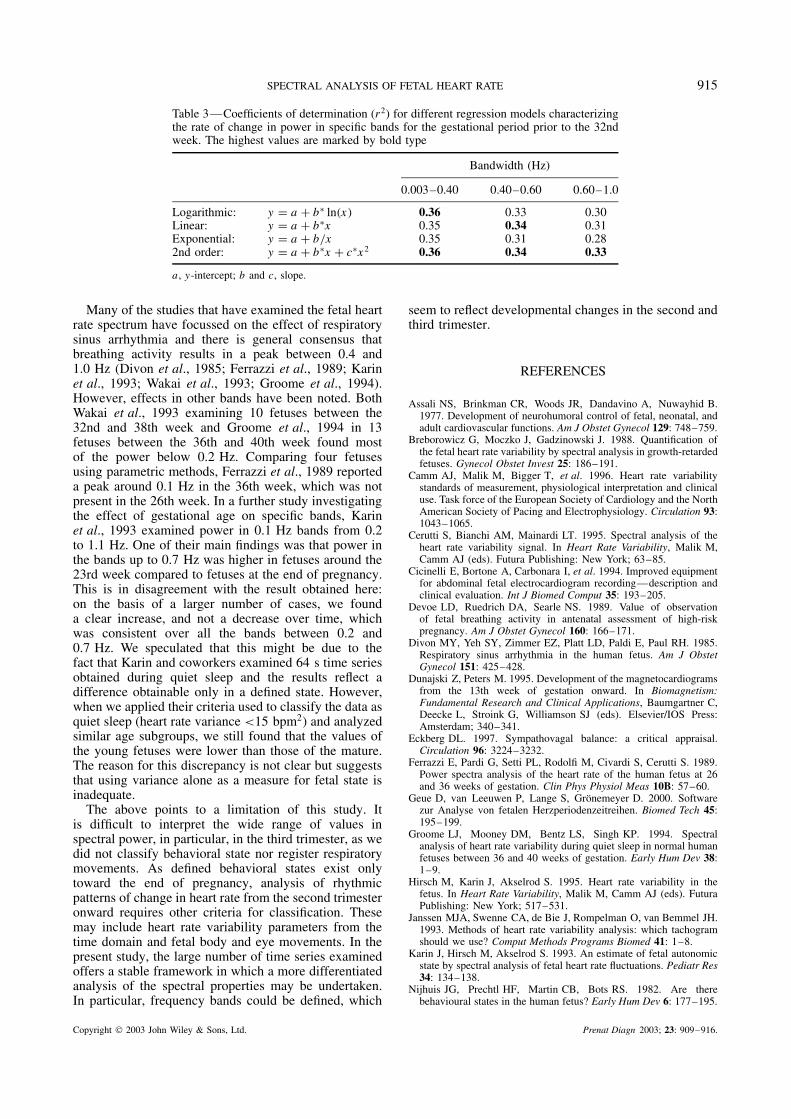
Visually examining changes in power over gestationalage of bands with a width of 0.05 Hz (Figure 3)revealed a similar development for these narrow bands.However, for the bands between approximately 0.40 and0.60 Hz, the discontinuity at the 31st week was notas obvious. Integrating over the three bands separatedby these frequencies (0.003–0.40 Hz, 0.40–0.60 Hz,0.60–1.0 Hz) and examining the changes in power overtime, suggested that the rate of change in power beforethe 32nd week was different for these bands (Figure 2,middle panels). Linear and nonlinear regression analysisof the data for this gestational period showed that forthe 0.003 to 0.40 Hz band, the logarithmic model, forthe 0.40 to 0.60 Hz, the linear model and for the 0.60to 1.0 Hz band, the 2nd order model gave a better
00
5
10
15
20
0.20.4
0.60.8
1
17
2126
3034
3739
Frequency (Hz)
Ges
tatio
nal a
ge
(wee
ks)
Pow
er (
ms2 )
Figure 1—Frequency spectra of 1 fetus at week 17, 21, 26, 30, 34, 37 and 39 demonstrating the increase in power with gestational age, inparticular, (a) at lower frequencies and (b) in the period up to week 32
Copyright 2003 John Wiley & Sons, Ltd. Prenat Diagn 2003; 23: 909–916.
912 P. VAN LEEUWEN ET AL.
10−1
100
101
102
103
10−1
100
101
102
103
101
102
103
104
101
102
103
104
10−1
100
101
102
10−1
100
101
102
020 25 30 35 40 4520 25 30 35 40 4520 25 30 35 40 45
10
20
30
40
50
0.003−1.0
0.003−0.40 0.40−0.60 0.60−1.0
LF:0.04−0.15 HF:0.15−0.40 LF / HF
Gestational age (weeks)
Arb
itrar
y un
its
Pow
er (
ms2 )
Pow
er (
ms2 )
Pow
er (
ms2 )
Figure 2—Power integrated over the 0.003 to 1.0 Hz band (top panel), empirically determined bands (0.003–0.40 Hz, 0.40–0.60 Hz,0.60–1.0 Hz; middle panels) and the LF and HF bands as well as the LF/HF ratio (lower panels) for each fetal frequency spectrum (n = 222).The power for a specific band of each spectrum (•) is plotted as a function of gestational age. Median values over successive five-week periodsof gestation are also shown (�)
fit (Table 3). That, for the two lower bands, the 2ndorder model fit was as good, results from the fact that,all things being equal, higher-order models improveexplanatory power simply by the addition of anothervariable.
The values in the LF and HF bands correspondedroughly to those obtained in the 0.003 to 0.40 Hzband, both showing the change in rate of increase inpower around the 31st week (Figure 2). The LF/HFratio displayed a trend to lower value as pregnancyprogressed, indicating that the increase in power in theHF band was greater than that in the LF band. Thevisually determined thresholds at 31 weeks’ gestationalage were confirmed by linear-regression analysis forthe LF and HF bands: the values in Table 2 show thatthe slopes of the earlier and later gestational periodsare clearly distinguishable on the basis of their values,variance and p-values. Only the LF/HF ratio showed nodiscontinuity at week 31.
DISCUSSION
It has been known for over 20 years that fetal heart ratevariability increases as pregnancy progresses (Wheeler
and Murrils, 1978; Visser et al., 1981). This studyconfirmed that this was true for variables both fromthe time and the frequency domain. The main findingof the study is that, in the frequency spectrum between0.003 and 1.0 Hz of short fetal heart period time series,specific bands can be found, which display particularchanges in power during the second and third trimesterof pregnancy. Overall, between the 16th and 42nd week,the absolute power of the spectra between 0.003 and1.0 Hz increased with a concomitant enhancement ofvariance in the period. Furthermore, a period in gestationaround the 31st week could be identified where analteration in the rate of change in spectral densityoccurred. Inspecting the 0.05 Hz bands showed thatthis alteration was particularly distinct for frequencies<0.40 Hz and >0.60 Hz. Integrating over the bandsseparated by these frequencies and examining the periodbefore the 32nd week indicated that the rates of changein power for these three bands were different.
As the values in the band below 0.40 Hz containedproportionally the most power, their development overtime was very similar to that of the 0.003 to 1.0 Hzband (cf. the regression parameters in Table 2). Thehigher correlation of the logarithmic fit for the period
Copyright 2003 John Wiley & Sons, Ltd. Prenat Diagn 2003; 23: 909–916.
SPECTRAL ANALYSIS OF FETAL HEART RATE 913
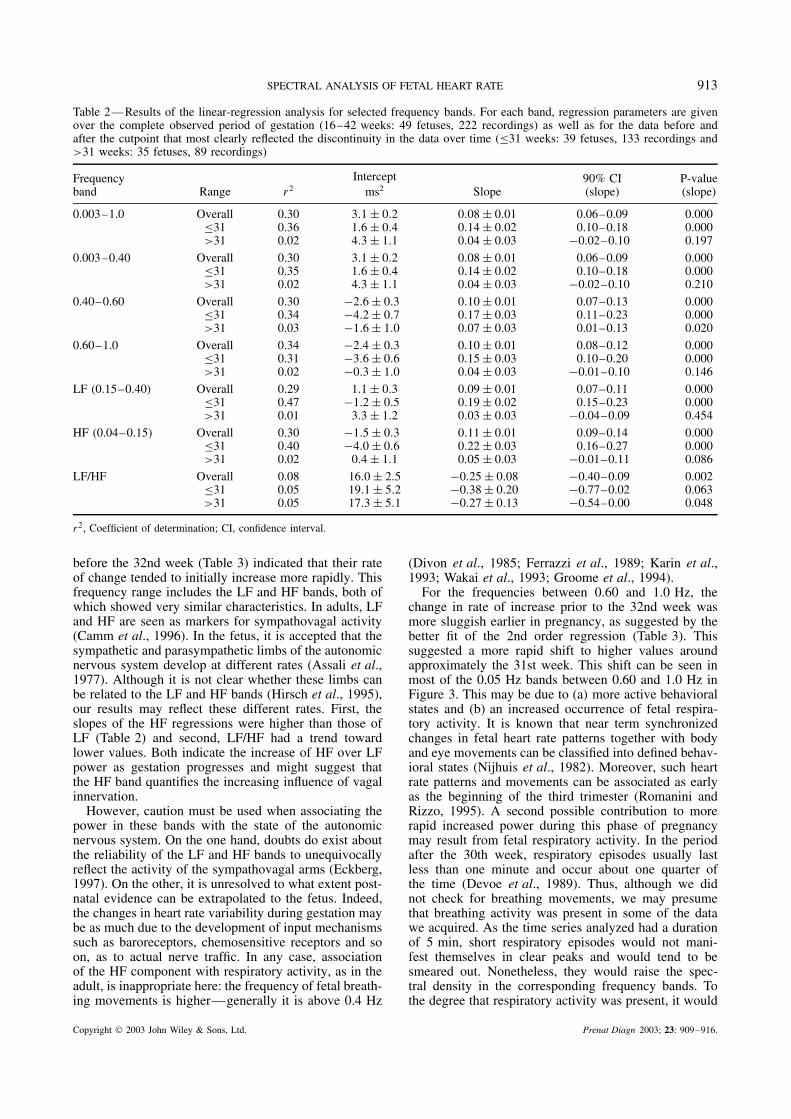
Table 2—Results of the linear-regression analysis for selected frequency bands. For each band, regression parameters are givenover the complete observed period of gestation (16–42 weeks: 49 fetuses, 222 recordings) as well as for the data before andafter the cutpoint that most clearly reflected the discontinuity in the data over time (≤31 weeks: 39 fetuses, 133 recordings and>31 weeks: 35 fetuses, 89 recordings)
Frequencyband Range r2
Interceptms2 Slope
90% CI(slope)
P-value(slope)
0.003–1.0 Overall 0.30 3.1 ± 0.2 0.08 ± 0.01 0.06–0.09 0.000≤31 0.36 1.6 ± 0.4 0.14 ± 0.02 0.10–0.18 0.000>31 0.02 4.3 ± 1.1 0.04 ± 0.03 −0.02–0.10 0.197
0.003–0.40 Overall 0.30 3.1 ± 0.2 0.08 ± 0.01 0.06–0.09 0.000≤31 0.35 1.6 ± 0.4 0.14 ± 0.02 0.10–0.18 0.000>31 0.02 4.3 ± 1.1 0.04 ± 0.03 −0.02–0.10 0.210
0.40–0.60 Overall 0.30 −2.6 ± 0.3 0.10 ± 0.01 0.07–0.13 0.000≤31 0.34 −4.2 ± 0.7 0.17 ± 0.03 0.11–0.23 0.000>31 0.03 −1.6 ± 1.0 0.07 ± 0.03 0.01–0.13 0.020
0.60–1.0 Overall 0.34 −2.4 ± 0.3 0.10 ± 0.01 0.08–0.12 0.000≤31 0.31 −3.6 ± 0.6 0.15 ± 0.03 0.10–0.20 0.000>31 0.02 −0.3 ± 1.0 0.04 ± 0.03 −0.01–0.10 0.146
LF (0.15–0.40) Overall 0.29 1.1 ± 0.3 0.09 ± 0.01 0.07–0.11 0.000≤31 0.47 −1.2 ± 0.5 0.19 ± 0.02 0.15–0.23 0.000>31 0.01 3.3 ± 1.2 0.03 ± 0.03 −0.04–0.09 0.454
HF (0.04–0.15) Overall 0.30 −1.5 ± 0.3 0.11 ± 0.01 0.09–0.14 0.000≤31 0.40 −4.0 ± 0.6 0.22 ± 0.03 0.16–0.27 0.000>31 0.02 0.4 ± 1.1 0.05 ± 0.03 −0.01–0.11 0.086
LF/HF Overall 0.08 16.0 ± 2.5 −0.25 ± 0.08 −0.40–0.09 0.002≤31 0.05 19.1 ± 5.2 −0.38 ± 0.20 −0.77–0.02 0.063>31 0.05 17.3 ± 5.1 −0.27 ± 0.13 −0.54–0.00 0.048
r2, Coefficient of determination; CI, confidence interval.
before the 32nd week (Table 3) indicated that their rateof change tended to initially increase more rapidly. Thisfrequency range includes the LF and HF bands, both ofwhich showed very similar characteristics. In adults, LFand HF are seen as markers for sympathovagal activity(Camm et al., 1996). In the fetus, it is accepted that thesympathetic and parasympathetic limbs of the autonomicnervous system develop at different rates (Assali et al.,1977). Although it is not clear whether these limbs canbe related to the LF and HF bands (Hirsch et al., 1995),our results may reflect these different rates. First, theslopes of the HF regressions were higher than those ofLF (Table 2) and second, LF/HF had a trend towardlower values. Both indicate the increase of HF over LFpower as gestation progresses and might suggest thatthe HF band quantifies the increasing influence of vagalinnervation.
However, caution must be used when associating thepower in these bands with the state of the autonomicnervous system. On the one hand, doubts do exist aboutthe reliability of the LF and HF bands to unequivocallyreflect the activity of the sympathovagal arms (Eckberg,1997). On the other, it is unresolved to what extent post-natal evidence can be extrapolated to the fetus. Indeed,the changes in heart rate variability during gestation maybe as much due to the development of input mechanismssuch as baroreceptors, chemosensitive receptors and soon, as to actual nerve traffic. In any case, associationof the HF component with respiratory activity, as in theadult, is inappropriate here: the frequency of fetal breath-ing movements is higher—generally it is above 0.4 Hz
(Divon et al., 1985; Ferrazzi et al., 1989; Karin et al.,1993; Wakai et al., 1993; Groome et al., 1994).
For the frequencies between 0.60 and 1.0 Hz, thechange in rate of increase prior to the 32nd week wasmore sluggish earlier in pregnancy, as suggested by thebetter fit of the 2nd order regression (Table 3). Thissuggested a more rapid shift to higher values aroundapproximately the 31st week. This shift can be seen inmost of the 0.05 Hz bands between 0.60 and 1.0 Hz inFigure 3. This may be due to (a) more active behavioralstates and (b) an increased occurrence of fetal respira-tory activity. It is known that near term synchronizedchanges in fetal heart rate patterns together with bodyand eye movements can be classified into defined behav-ioral states (Nijhuis et al., 1982). Moreover, such heartrate patterns and movements can be associated as earlyas the beginning of the third trimester (Romanini andRizzo, 1995). A second possible contribution to morerapid increased power during this phase of pregnancymay result from fetal respiratory activity. In the periodafter the 30th week, respiratory episodes usually lastless than one minute and occur about one quarter ofthe time (Devoe et al., 1989). Thus, although we didnot check for breathing movements, we may presumethat breathing activity was present in some of the datawe acquired. As the time series analyzed had a durationof 5 min, short respiratory episodes would not mani-fest themselves in clear peaks and would tend to besmeared out. Nonetheless, they would raise the spec-tral density in the corresponding frequency bands. Tothe degree that respiratory activity was present, it would
Copyright 2003 John Wiley & Sons, Ltd. Prenat Diagn 2003; 23: 909–916.
914 P. VAN LEEUWEN ET AL.
10−2
10−1
100
101
10−2
10−1
100
101
10−2
10−1
100
101
102
10−2
10−1
100
101
102
10−2
10−1
100
101
102
103
20 25 30 35 40 45 20 25 30 35 40 45 20 25 30 35 40 4520 25 30 35 40 45
Gestational age (weeks)
0.003−0.05 0.05−0.10 0.10−0.15 0.15−0.20
0.20−0.25 0.25−0.30 0.30−0.35 0.35−0.40
0.40−0.45 0.45−0.50 0.50−0.55 0.55−0.60
0.60−0.65 0.65−0.70 0.70−0.75 0.75−0.80
0.80−0.85 0.85−0.90 0.90−0.95 0.95−1.0
Pow
er (
ms2 )
Figure 3—Power integrated over 20 bands (bandwidth: 0.05 Hz) for each fetal frequency spectrum (n = 222). The power for a specific band ofeach spectrum (•) is plotted as a function of gestational age. Median values over successive five-week periods of gestation are also shown (�)
have contributed to the higher power observed after the30th week. In sum, the development of different behav-ioral states and the increased occasional presence of fetalbreathing movements may be seen to play a role in thewide spread of the data after the 31st week.
The boundaries between the bands (at 0.40 and0.60 Hz) were set empirically on the basis of the
examination of the 0.05 Hz bands in Figure 3. Thetransition from one band to the next is not necessarilyclearly delineated and there is a certain ambiguity atthe boundary frequencies. Nonetheless, these boundariescharacterize the changes typical in the band and thesechanges could be described on the basis of regressionanalysis.
Copyright 2003 John Wiley & Sons, Ltd. Prenat Diagn 2003; 23: 909–916.
SPECTRAL ANALYSIS OF FETAL HEART RATE 915
Table 3—Coefficients of determination (r2) for different regression models characterizingthe rate of change in power in specific bands for the gestational period prior to the 32ndweek. The highest values are marked by bold type
Bandwidth (Hz)
0.003–0.40 0.40–0.60 0.60–1.0
Logarithmic: y = a + b∗ ln(x) 0.36 0.33 0.30Linear: y = a + b∗x 0.35 0.34 0.31Exponential: y = a + b/x 0.35 0.31 0.282nd order: y = a + b∗x + c∗x 2 0.36 0.34 0.33
a , y-intercept; b and c, slope.
Many of the studies that have examined the fetal heartrate spectrum have focussed on the effect of respiratorysinus arrhythmia and there is general consensus thatbreathing activity results in a peak between 0.4 and1.0 Hz (Divon et al., 1985; Ferrazzi et al., 1989; Karinet al., 1993; Wakai et al., 1993; Groome et al., 1994).However, effects in other bands have been noted. BothWakai et al., 1993 examining 10 fetuses between the32nd and 38th week and Groome et al., 1994 in 13fetuses between the 36th and 40th week found mostof the power below 0.2 Hz. Comparing four fetusesusing parametric methods, Ferrazzi et al., 1989 reporteda peak around 0.1 Hz in the 36th week, which was notpresent in the 26th week. In a further study investigatingthe effect of gestational age on specific bands, Karinet al., 1993 examined power in 0.1 Hz bands from 0.2to 1.1 Hz. One of their main findings was that power inthe bands up to 0.7 Hz was higher in fetuses around the23rd week compared to fetuses at the end of pregnancy.This is in disagreement with the result obtained here:on the basis of a larger number of cases, we founda clear increase, and not a decrease over time, whichwas consistent over all the bands between 0.2 and0.7 Hz. We speculated that this might be due to thefact that Karin and coworkers examined 64 s time seriesobtained during quiet sleep and the results reflect adifference obtainable only in a defined state. However,when we applied their criteria used to classify the data asquiet sleep (heart rate variance <15 bpm2) and analyzedsimilar age subgroups, we still found that the values ofthe young fetuses were lower than those of the mature.The reason for this discrepancy is not clear but suggeststhat using variance alone as a measure for fetal state isinadequate.
The above points to a limitation of this study. Itis difficult to interpret the wide range of values inspectral power, in particular, in the third trimester, as wedid not classify behavioral state nor register respiratorymovements. As defined behavioral states exist onlytoward the end of pregnancy, analysis of rhythmicpatterns of change in heart rate from the second trimesteronward requires other criteria for classification. Thesemay include heart rate variability parameters from thetime domain and fetal body and eye movements. In thepresent study, the large number of time series examinedoffers a stable framework in which a more differentiatedanalysis of the spectral properties may be undertaken.In particular, frequency bands could be defined, which
seem to reflect developmental changes in the second andthird trimester.
REFERENCES
Assali NS, Brinkman CR, Woods JR, Dandavino A, Nuwayhid B.1977. Development of neurohumoral control of fetal, neonatal, andadult cardiovascular functions. Am J Obstet Gynecol 129: 748–759.
Breborowicz G, Moczko J, Gadzinowski J. 1988. Quantification ofthe fetal heart rate variability by spectral analysis in growth-retardedfetuses. Gynecol Obstet Invest 25: 186–191.
Camm AJ, Malik M, Bigger T, et al. 1996. Heart rate variabilitystandards of measurement, physiological interpretation and clinicaluse. Task force of the European Society of Cardiology and the NorthAmerican Society of Pacing and Electrophysiology. Circulation 93:1043–1065.
Cerutti S, Bianchi AM, Mainardi LT. 1995. Spectral analysis of theheart rate variability signal. In Heart Rate Variability, Malik M,Camm AJ (eds). Futura Publishing: New York; 63–85.
Cicinelli E, Bortone A, Carbonara I, et al. 1994. Improved equipmentfor abdominal fetal electrocardiogram recording—description andclinical evaluation. Int J Biomed Comput 35: 193–205.
Devoe LD, Ruedrich DA, Searle NS. 1989. Value of observationof fetal breathing activity in antenatal assessment of high-riskpregnancy. Am J Obstet Gynecol 160: 166–171.
Divon MY, Yeh SY, Zimmer EZ, Platt LD, Paldi E, Paul RH. 1985.Respiratory sinus arrhythmia in the human fetus. Am J ObstetGynecol 151: 425–428.
Dunajski Z, Peters M. 1995. Development of the magnetocardiogramsfrom the 13th week of gestation onward. In Biomagnetism:Fundamental Research and Clinical Applications, Baumgartner C,Deecke L, Stroink G, Williamson SJ (eds). Elsevier/IOS Press:Amsterdam; 340–341.
Eckberg DL. 1997. Sympathovagal balance: a critical appraisal.Circulation 96: 3224–3232.
Ferrazzi E, Pardi G, Setti PL, Rodolfi M, Civardi S, Cerutti S. 1989.Power spectra analysis of the heart rate of the human fetus at 26and 36 weeks of gestation. Clin Phys Physiol Meas 10B: 57–60.
Geue D, van Leeuwen P, Lange S, Gronemeyer D. 2000. Softwarezur Analyse von fetalen Herzperiodenzeitreihen. Biomed Tech 45:195–199.
Groome LJ, Mooney DM, Bentz LS, Singh KP. 1994. Spectralanalysis of heart rate variability during quiet sleep in normal humanfetuses between 36 and 40 weeks of gestation. Early Hum Dev 38:1–9.
Hirsch M, Karin J, Akselrod S. 1995. Heart rate variability in thefetus. In Heart Rate Variability, Malik M, Camm AJ (eds). FuturaPublishing: New York; 517–531.
Janssen MJA, Swenne CA, de Bie J, Rompelman O, van Bemmel JH.1993. Methods of heart rate variability analysis: which tachogramshould we use? Comput Methods Programs Biomed 41: 1–8.
Karin J, Hirsch M, Akselrod S. 1993. An estimate of fetal autonomicstate by spectral analysis of fetal heart rate fluctuations. Pediatr Res34: 134–138.
Nijhuis JG, Prechtl HF, Martin CB, Bots RS. 1982. Are therebehavioural states in the human fetus? Early Hum Dev 6: 177–195.
Copyright 2003 John Wiley & Sons, Ltd. Prenat Diagn 2003; 23: 909–916.

916 P. VAN LEEUWEN ET AL.
Rassi D, Lewis MJ. 1995. Power spectral analysis of the fetalmagnetocardiogram. Physiol Meas 16: 111–120.
Romanini C, Rizzo G. 1995. Fetal behaviour in normal andcompromised fetuses. An overview. Early Hum Dev 43: 117–131.
Van Leeuwen P, Hailer B, Bader W, Geissler J, Trowitzsch E,Gronemeyer DH. 1999. Magnetocardiography in the diagnosis offetal arrhythmia. Br J Obstet Gynaecol 106: 1200–1208.
Van Leeuwen P, Lange S, Bettermann H, Gronemeyer D, Hatz-mann W. 1999. Fetal heart rate variability and complexity in thecourse of pregnancy. Early Hum Dev 54: 259–269.
Visser GH, Dawes GS, Redman CW. 1981. Numerical analysis of thenormal human antenatal fetal heart rate. Br J Obstet Gynecol 88:792–802.
Wakai RT, Wang M, Pedorn SL, Reid DL, Martin CB. 1993. Spectralanalysis of antepartum fetal heart rate variability from fetalmagnetocardiogram recordings. Early Hum Dev 35: 15–24.
Wheeler T, Murrils A. 1978. Patterns of fetal heart rate during normalpregnancy. Br J Obstet Gynaecol 85: 18–27.
Williams RL. 2000. A note on robust variance estimation for cluster-correlated data. Biometrics 56: 645–646.
Copyright 2003 John Wiley & Sons, Ltd. Prenat Diagn 2003; 23: 909–916.