Embed Size (px)
Citation preview


CHANGES IN THE LAKE TROUTPOPULATION OF SOUTHERN
LAKE SUPERIOR IN RELATION TOTHE FISHERY, THE SEA LAMPREY,
AND STOCKING, 1950-70
RICHARD L. PYCHAU.S. Fish and Wildlife Service
Ashland, Wisconsin 54806
And
GEORGE R. KINGWisconsin Department of Natural Resources
Bayfield, Wisconsin 54814
TECHNICAL REPORT NO. 28
Great Lakes Fishery Commission1451 Green Road
P.O. Box 640Ann Arbor, Michigan 48107
July 1975

References . . . . . . . . . . . . . . . . . . . . . . . . . . . . . . . . . . . . . . . . . . . 33
Dedication . . . . . . . . . . . . . . . . . . . . . . . . . . . . . . . . . . . . . . . . . . . .
Abstract . . . . . . . . . . . . . . . . . . . . . . . . . . . . . . . . . . . . . . . . . . . . .
Introduction . . . . . . . . . . . . . . . . . . . . . . . . . . . . . . . . . . . . . . . . . .
Lake trout population and fishery . . . . . . . . . . . . . . . . . . . . . . . . . . .
Characteristics of the population in the early 1950’s . . . . . . . . . . .
Fishing methods . . . . . . . . . . . . . . . . . . . . . . . . . . . . . . . . . . .
Assessment methods . . . . . . . . . . . . . . . . . . . . . . . . . . . . . . . . .
State of the stocks, 1929-70 . . . . . . . . . . . . . . . . . . . . . . . . . . .
The sea lamprey . . . . . . . . . . . . . . . . . . . . . . . . . . . . . . . . . . . . . . .
Life history . . . . . . . . . . . . . . . . . . . . . . . . . . . . . . . . . . . . . . .
Abundance . . . . . . . . . . . . . . . . . . . . . . . . . . . . . . . . . . . . . . .
Predation on lake trout . . . . . . . . . . . . . . . . . . . . . . . . . . . . . . .
Stocking of lake trout . . . . . . . . . . . . . . . . . . . . . . . . . . . . . . . . . . .
Numbers and source . . . . . . . . . . . . . . . . . . . . . . . . . . . . . . . . .
Contribution to the population and fishery . . . . . . . . . . . . . . . . .
Changes in size composition and abundance of lake trout, 1959-70 . . . . .
Causes of the changes in the lake trout population . . . . . . . . . . . . . . . .
V
1
23
35
68
13
1313
14222224
26
29
CONTENTS
DEDICATION
We dedicate this report to the memory of the late Robert W. Saalfeld,Executive Secretary of the Great Lakes Fishery Commission from 1971 untilJune 9, 1974, and Assistant Executive Secretary from 1957 to 1971. In theearlier years Bob coordinated activities of state, provincial, and federalagencies related to rehabilitation of lake trout stocks in the Great Lakes. Laterhe dealt mainly with sea lamprey control, contracting of research, and themany administrative functions of the office.
Although Bob had no direct authority over any agency, his influence wasfelt by almost everyone engaged in rearing, marking, and stocking lake trout;in research on lake trout; and in setting policies and regulations for manage-ment of the fisheries. Many of us valued him as a close personal friend. As acoordinator he created a climate that fostered outstanding accomplishmentsby others. He never sought personal credit.
This report summarizes the lake trout rehabilitation program of theCommission and cooperating agencies in Lake Superior-only part of a broaderoperation that has yielded immense benefits to fishermen there and in LakeMichigan as well. That success stands as a monument to Bob’s memory.
CHANGES IN THE LAKE TROUT POPULATION OFSOUTHERN LAKE SUPERIOR IN RELATION TO THE
FISHERY, THE SEA LAMPREY, AND STOCKING, 1950-701
Richard L. Pycha and George R. Ring
ABSTRACT
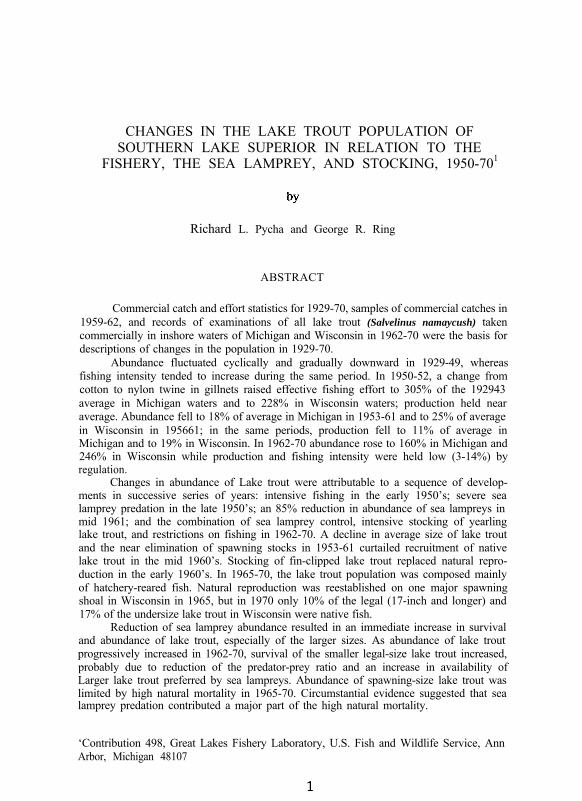
Commercial catch and effort statistics for 1929-70, samples of commercial catches in1959-62, and records of examinations of all lake trout (Salvelinus namaycush) takencommercially in inshore waters of Michigan and Wisconsin in 1962-70 were the basis fordescriptions of changes in the population in 1929-70.
Abundance fluctuated cyclically and gradually downward in 1929-49, whereasfishing intensity tended to increase during the same period. In 1950-52, a change fromcotton to nylon twine in gillnets raised effective fishing effort to 305% of the 192943average in Michigan waters and to 228% in Wisconsin waters; production held nearaverage. Abundance fell to 18% of average in Michigan in 1953-61 and to 25% of averagein Wisconsin in 195661; in the same periods, production fell to 11% of average inMichigan and to 19% in Wisconsin. In 1962-70 abundance rose to 160% in Michigan and246% in Wisconsin while production and fishing intensity were held low (3-14%) byregulation.
Changes in abundance of Lake trout were attributable to a sequence of develop-ments in successive series of years: intensive fishing in the early 1950’s; severe sealamprey predation in the late 1950’s; an 85% reduction in abundance of sea lampreys inmid 1961; and the combination of sea lamprey control, intensive stocking of yearlinglake trout, and restrictions on fishing in 1962-70. A decline in average size of lake troutand the near elimination of spawning stocks in 1953-61 curtailed recruitment of nativelake trout in the mid 1960’s. Stocking of fin-clipped lake trout replaced natural repro-duction in the early 1960’s. In 1965-70, the lake trout population was composed mainlyof hatchery-reared fish. Natural reproduction was reestablished on one major spawningshoal in Wisconsin in 1965, but in 1970 only 10% of the legal (17-inch and longer) and17% of the undersize lake trout in Wisconsin were native fish.
Reduction of sea lamprey abundance resulted in an immediate increase in survivaland abundance of lake trout, especially of the larger sizes. As abundance of lake troutprogressively increased in 1962-70, survival of the smaller legal-size lake trout increased,probably due to reduction of the predator-prey ratio and an increase in availability ofLarger lake trout preferred by sea lampreys. Abundance of spawning-size lake trout waslimited by high natural mortality in 1965-70. Circumstantial evidence suggested that sealamprey predation contributed a major part of the high natural mortality.
‘Contribution 498, Great Lakes Fishery Laboratory, U.S. Fish and Wildlife Service, AnnArbor, Michigan 48107
INTRODUCTION
The decline of lake trout (Salvelinus namaycush) and other valuablefishes in the upper Great Lakes has been generally attributed to predation bythe sea lamprey (Petromyzon marinus). Hile (1949) considered it to be theonly significant factor in the decline of lake trout in Lake Huron, and Fry(1953) presented strong evidence that it nearly exterminated lake trout inSouth Bay, Lake Huron, where commercial fishing had not been permitted formore than 20 years. The sea lamprey was held to be the sole cause of thecollapse of the fishery in Lake Michigan by Hile et al. (1951a), but Smith(1968) suggested that an increase in fishing in Illinois waters could possiblyhave initiated the decline in that lake. Eschmeyer (1957) showed that thepopulation in Lake Michigan continued to decline in the presence of sealampreys after the fishery collapsed. Although the relative effects of fishingand sea lamprey predation were never determined, the decline of formerlystable fisheries shortly after establishment of sea lamprey populations wasstrong circumstantial evidence that the imposition of sea lamprey predationupon intensively fished populations caused the declines of lake trout in LakesHuron and Michigan. Fry’s and Eschmeyer’s studies indicated that sealampreys were capable of exterminating lake trout even in the absence offishing.
The respective roles of sea lamprey predation and fishing in the declineof lake trout in Lake Superior were less clear than in Lakes Michigan andHuron. Sea lampreys established spawning runs in several tributary streams ofeastern Lake Superior before 1950, and spread throughout the lake andincreased rapidly in abundance during the 1950’s. Loftus (1958) showed thatmortality of river-spawning lake trout in Ontario waters of eastern LakeSuperior increased greatly as the incidence of lamprey scars increased in1951-55, and concluded that sea lampreys caused the rapid decline in numbersof river-spawning fish. Hile et al. (1951b), however, showed that in Michiganwaters of Lake Superior, abundance of lake trout fell from 107% of the1929-43 average in 1944 to only 77% in 1946, the year the first sea lampreywas reported in the lake, and continued to decline to a record low of 65% in1949; they pointed out further that the decline in abundance wasaccompanied by progressive increases in fishing effort to record high levels andwarned that the lake trout stocks were in poor condition to withstand theexpected ravages of the sea lamprey.
Regardless of the relative importance of the sea lamprey and the fisheryas causative factors, steady declines in production that were disastrous to theLake Superior fishery began in 1951 in Ontario and Michigan, in 1953 inMinnesota, and in 1956 in Wisconsin (Baldwin and Saalfeld 1962). Lakewideproduction dropped from a 4.7 million pounds in 1949 to 371,000 pounds in1961-a 92% decline in little more than a decade. No measures were taken toreduce or curtail fishing during the decline because the evidence from LakesHuron and Michigan indicated that lake trout were doomed unless the sealamprey was controlled.
Effective control of sea lampreys became possible with the developmentof a selective chemical that destroyed lamprey larvae in streams (Applegate etal. 1961). After all known sea lamprey-producing tributaries of Lake Superior
2
were treated with the larvicide in 1958-60, abundance of parasitic-phaselampreys abruptly fell about 85% in mid 1961 (Lawrie 1970).
When development of the selective larvicide made sea lamprey controlfeasible, large-scale stocking of fin-clipped lake trout was begun in the hopethat lake trout stocks would be rehabilitated quickly after lamprey controlbecame effective. Nearly all the fish were stocked as yearlings becauseexperimental plantings of fin-clipped and tagged lake trout in the early 1950’shad indicated this to be the best age for release (Buettner 1961). Stocking wasincreased rapidly after 1957 and was intensive throughout the 1960’s.
The Fisheries Research Board of Canada, the Wisconsin Department ofNatural Resources, and the U.S. Fish and Wildlife Service began intensivesampling of commercial lake trout catches in Ontario, Wisconsin, and Michiganin 1958-59 (the fishery in Minnesota had collapsed almost completely by1959). In mid 1962, commercial lake trout fishing was banned in all U.S.waters, except for a small amount continued for scientific purposes byselected “assessment” fishermen under contracts or permits. The fishery wasnot closed in Ontario, but was restricted to area quotas large enough to providefish for the needed biological information.
The program to control the sea lamprey and restore the lake troutpopulation of Lake Superior involved work by state, provincial, federal, andinternational agencies. Sea lamprey control and research were carried out bythe U.S. Fish and Wildlife Service and the Fisheries Research Board of Canada(now the Canadian Department of the Environment) under contract to theinternational Great Lakes Fishery Commission. Lake trout research, develop-ment of hatchery brood stocks, and rearing and stocking of lake trout weredone by state, provincial, and federal conservation agencies; the work wascoordinated by the Commission. Fishery regulation is the responsibility ofindividual state and provincial conservation agencies. Coordination of manage-ment policies was achieved to some degree through committees organizedunder the auspices of the Commission. This loose assemblage of agencies wasable, by cooperative effort, to develop lake trout brood stocks and rearingfacilities during the late 1950’s in anticipation of control of the sea lamprey;to act ‘decisively when protection of lake trout stocks was recommended bythe Commission in 1962; and to maintain assessment fisheries for biologicalsampling through 1970.
We describe here the major changes in the lake trout population insouthern Lake Superior during the period of maximum decline (1950-61) andthe first 9 years of recovery (1962-70), with particular emphasis on the 12years, 1959-70. We also describe associated changes in the fishery, the sealamprey population, and stocking rates and examine their relations to the laketrout population.
LAKE TROUT POPULATION AND FISHERY
Characteristics of the population
The lake trout population of Lake Superior is composed ofan unknown number of subpopulations. Two forms have commonly beengiven subspecific ranking, the “lean” or typical lake trout (Salvelinus n.
namaycush) and the siscowet or “fat” trout (Salvelinus n. siscowet). Several,perhaps many, races exist within these groups.
Lean lake trout are found in inshore waters and on the banks of mostoffshore islands, generally at less than 50 fathoms. They have the fastestgrowth rate of any of the main subpopulations of lake trout in Lake Superior(usually 3-4 inches per year-Rahrer 1967), mature at a relatively advancedage and large size (generally at ages VII-IX and a length of 25 inches or longerfor females-Eschmeyer 1955), have a long life span (28 years in a hatchery-Eschmeyer 1964) and some grow to large sizes (the angling record is 63pounds, 2 ounces, and larger fish have been taken commercially). Theycongregate for spawning from late September through early November. Mostspawning is in mid to late October on rock and rubble reefs at depths of l-10fathoms, but storms occasionally force them to move deeper and spawn atdepths down to 20 fathoms. Several subpopulations of lean lake troutspawned in Ontario rivers tributary to eastern Lake Superior (Loftus 1958)but some of these groups may now be extinct.
The siscowet is concentrated on steep banks in deep water (generally50-120 fathoms) in many areas throughout the lake. Although relatively littlehas been published on the life history of the siscowet, unpublished data andfield observations indicate that its growth is somewhat slower than that of
lean trout and length at maturity is shorter (probably 22-23 inches). Siscowetsalso reach a large size (fish weighing 25-30 pounds were not uncommon).They spawn on reefs, generally (but not always) in deeper water (usually20-50 fathoms) than do lean trout. Spawning season varies greatly; variousraces spawned on dates extending from June to late November in the early1950’s (Eschmeyer 1955). The fat or oil content of the flesh of siscowetsincreases with length and ranges up to nearly 80% for large specimens. Thesmaller, less oily siscowets usually bring a higher price than large siscowets andare called “halfbreeds” by commercial fishermen (Eschmeyer and Phillips,1965).
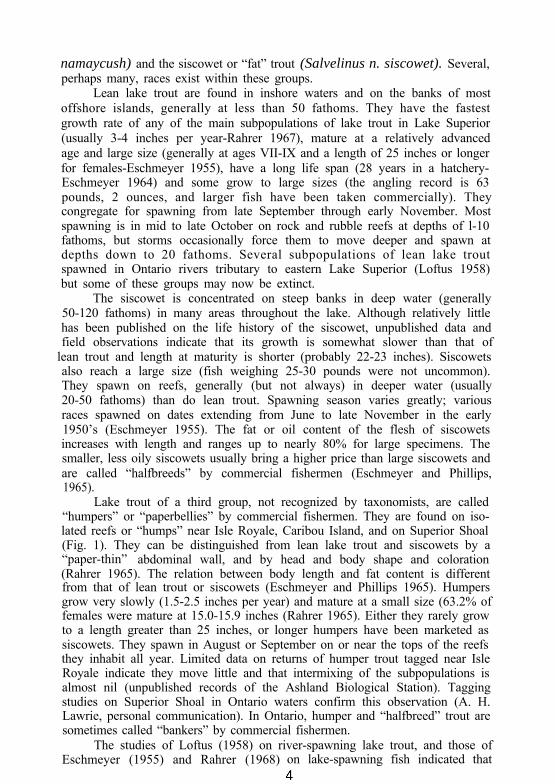
Lake trout of a third group, not recognized by taxonomists, are called“humpers” or “paperbellies” by commercial fishermen. They are found on iso-lated reefs or “humps” near Isle Royale, Caribou Island, and on Superior Shoal(Fig. 1). They can be distinguished from lean lake trout and siscowets by a“paper-thin” abdominal wall, and by head and body shape and coloration(Rahrer 1965). The relation between body length and fat content is differentfrom that of lean trout or siscowets (Eschmeyer and Phillips 1965). Humpersgrow very slowly (1.5-2.5 inches per year) and mature at a small size (63.2% offemales were mature at 15.0-15.9 inches (Rahrer 1965). Either they rarely growto a length greater than 25 inches, or longer humpers have been marketed assiscowets. They spawn in August or September on or near the tops of the reefsthey inhabit all year. Limited data on returns of humper trout tagged near IsleRoyale indicate they move little and that intermixing of the subpopulations isalmost nil (unpublished records of the Ashland Biological Station). Taggingstudies on Superior Shoal in Ontario waters confirm this observation (A. H.Lawrie, personal communication). In Ontario, humper and “halfbreed” trout aresometimes called “bankers” by commercial fishermen.
The studies of Loftus (1958) on river-spawning lake trout, and those ofEschmeyer (1955) and Rahrer (1968) on lake-spawning fish indicated that
Figure 1. Lake Superior, showing statistical districts and localities mentioned in the text.
lean lake trout disperse widely between spawning seasons but have a strongtendency to return to the same sites to spawn in successive seasons. Theevidence for homing of lean trout, the sedentary nature of humper trout, andthe great variation in time of spawning among different groups of siscowetssuggest that the lake trout population of Lake Superior is composed of a largenumber of races that are partially or wholly isolated during spawning, butintermingle to various degrees between spawning seasons.
Some, possibly many, of the races of lake trout in Lake Superior becameextinct in 1959-61. Generally, abundance of the deepwater siscowet and off-shore humper trout declined less during that period than that of the inshore leantrout. Whether the races of lean lake trout differed significantly in characteristicsother than spawning locally is unknown.
Details on fishing methods and procedures are given in the followingtwo sections.
Fishing methods
Several types of gear and methods of fishing were employed in the commercialfishery.. Since 1929, when data on gear and fishing effort became available, thelargemesh (4 1/2- to 7-inch, stretch-measure) gillnet was the gear most commonlyused. During most of the year, 4 1/2-inch nets set on the bottom were used in mostareas, but Larger-mesh nets were fished at less than 20 fathoms for spawning concen-trations. of large lake trout in late September and early November. (The season wasclosed during all or most of October in all U.S. waters.) Longlines with baited hooks,usually suspended by floats at about 30 feet from the surface in 70-80 fathoms ofwater, produced many lake trout in the 1930’s, but their use diminished in the 1940’sand almost none were fished after 1955. These “‘float hooks,” which were fished inApril-July, caught much larger lake trout than gillnets fished on the bottom. Some“bottom hooks” were fished in Wisconsin waters. A few fishermen fished “float nets”
(large-mesh gillnets suspended like the longlines), especially in the nearshore watersaround Isle Royale. Large-mesh gillnets were also fished on bottom under the ice inthe Apostle Islands region of Wisconsin Pound nets and trap nets were fished inseveral areas where lake whitefish (Coregonus cZupe4fomis) and lake trout could betaken together. Although their use declined with the general depression of theindustry in the 1950’s, pound nets were still being used in the Apostle islands regionin 1970, and trap nets were still in use near Marquette, Michigan, and in WhitefishBay. Small-mesh (2 1/2- to 3-&h) gillnets fished for other species, trolling, and“bobbing” (jigging through the ice) accounted for a very small portion of the totalcommercial catch.
Changes in materials that affected the efficiency of gillnets were made duringthe years (1929.70) when fishing effort data were collected (Pycha 1962). In the1930’s cotton twine largely replaced linen twine. The more elastic cotton twine wasprobably slightly more efficient than linen, but the difference was apparently notgreat (quantitative data are not available). In the late 1940’s, some fishermen beganusing cotton twine so fine the nets were called “spider webs.” These nets werereputed to have been as efficient as the nylon nets that replaced them, but fewfishermen used them because they were not durable. The fast spun nylon nets wereused in late 1949, and by 1952 nearly all nets in use were of this material. Thecommon 4 1/2-inch-mesh nets were about 2.25 times as efficient as the typical cottonnets of the 1940’s (Pycha 1962). A few monofilament nylon nets were fished in theearly 1960’s but they never came into general use.
Gillnets were commonly fished for 5-7 nights in the spring and in late fall andwinter. As the water warmed in the summer, they were fished for shorter periods; 2-and 3-night sets were common in September, when the water was warmest.
Minimum size limits for lake trout were imposed through Lake Superior. InWisconsin, the minimum legal size was 17 inches (total length). In Michigan, legal sirewas based on weight (1 1/4 pounds, dressed) through 1967, but was changed to 17inches in 1968. (In terms of size of fish, the two values were nearly identical.)
Assessment methods
All assessment fishing under contract or permit in 1959-70 was done with spunnylon gillnets, nearly all of which were 4 1/2-inch mesh, set on the bottom. Some6-inch mesh float nets were fished off southern Isle Royale in the manner traditionalto that area. Catch and effort data from this fishery were used for computation of theindices of production, abundance, and fishing intensity, but data on size compositionwere not included with those from other areas. Biologists sampled pound-net catchesin Wisconsin, but only enough to determine that the size composition was almostidentical to that of catches from 4 1/2-inch-mesh gillnets.
Methods of sampling commercial lake trout catches in 1959-62 were describedby Pycha and Ring (1967). The same methods were used from mid 1962 through1970, but the amount of fishing was restricted, and all lake trout were measured (tothe nearest 0.1 inch, total length) and checked for clipped fins and lamprey woundsor scars. Scale samples were taken periodically. Data were recorded on amount ofgear, depth, and location of fishing; number of legal-size and dead undersize fish; andweight of legal catch. Live undersize fish were returned to the lake immediately and nodata were recorded for them. Fish lengths were summarized by l-inch groups forcomputations The study is based primarily on lean lake trout taken in waters nearthe south shore and the adjacent islands of southern Lake Superior.
Data on commercial fishing effort and landings were collected by the Michiganand Wisconsin Departments of Natural Resources and were compiled by the U.S. Fishand Wildlife Service at the Great Lakes Fishery Laboratory, Ann Arbor, Michigan.Although indices of production, abundance, and fishing intensity were based on catchand effort data for all Michigan and Wisconsin waters, and thus included landings ofsiscowets and humper trout from deep and offshore waters, total production ofgroups other than typical lean trout was not large enough to affect the indices greatly.
Hile (1962) and Pycha (1962) both concluded that little purpose would beserved by publishing lake trout abundance indices corrected for use of nylon nets in
the 1950’s because the fishery appeared unlikely to ever return to its former characteror magnitude. Nevertheless, an index of lake trout abundance was needed to followthe progress of stock rehabilitation, and comparisons of abundance in the 1960’s withthat in the years before the invasion of the sea lamprey and use of nylon nets(pre-1950) could not be avoided. In calculating indices of abundance and fishingintensity for 1950-70 we used corrections and adjustments of data that preservereasonable comparability with the indices for 1929-49 published by Hile et al.(1951b).
The indices of production, abundance, and fishing intensity for Michigan watersin 1929-49 are from Hile et al. (1951b), and follow the terminology and methodsgiven by Hile (1962). The change from a multiplegear fishery in 1929-49 to anessentially single-gear (large-mesh gillnet) fishery by the mid 1950’s precluded the needto consider catches from several types of gear after 1949. Although use of gears otherthan gillnets declined in the 1940’s, the other gears still accounted for 23% of the totalproduction of lake trout in 1949. Thereafter the use of other gears declined rapidly andin 1956-70 large-mesh gillnets accounted for more than 96% of the production. Abun-dance indices for 1950-70 were calculated only from the annual average catch (pounds)per unit (1,000 linear feet) of large-mesh gillnet. All gillnet effort in 1952-70 was adjustedupward by the 2.25 efficiency factor of nylon to cotton twine for calculation of catchper unit effort (CPE). It was assumed (on the basis of conversations with many commer-cial fishermen) that one-fourth of the gillnets fished in 1950 and one-half of the netsfished in 1951 were nylon.
Selected “assessment” fishermen provided data on their catches in 1959through mid 1962 and were the only fishermen who fished for lake trout in inshorewaters from mid 1962 through 1970. Most of the assessment fishermen were selectedbecause they had been major producers of lake trout. Comparisons of their annualaverage CPE’s in 195961 with the average CPE’s for all fishermen in their statisticaldistricts showed clearly that all but one of the assessment fishermen were moreefficient than the average for their districts.
Several adjustments were made in data for 1963-70 to maintain com-parability with data from earlier years. CPE’s of assessment fishermen were adjustedto “average” by application of factors derived from the relation of their average CPE’sto the average CPE for all fishermen in their statistical districts in 195961 before thecommercial fishery was closed. In 1967-70, several additional assessment fishermenwere allowed to fish under permit in offshore waters of districts MS-5 near CaribouIsland and MS-l near Isle Royale. Catches by these “new” assessment fishermen wereincluded in production summaries, but abundance indices were based only on therecords of “old” assessment fishermen who fished those areas. Because CPE wastypically much higher in offshore than in inshore waters of MS-S, the increase inproduction in offshore waters in 1967-70 sharply increased the average CPE for thedistrict. An adjusted average CPE was derived by calculating separate CPE’s forinshore and offshore waters which were then combined by weighting each according tothe proportion of production in the two areas in 1959-60, before the fishery was closed,
The corrected and adjusted-CPE values for each statistical district were thenexpressed! as percentages of the 192943 district means and were weighted and combinedto form a single index for Michigan waters in the manner of Hile (1962). Since noassessment fishing was done in district MS-2 in 1963-70 and no fishing was done bythe “old”’ assessment fishermen in MS-1 in 1969-70, weighting factors that excludedthese districts were applied for the appropriate years.
The indices of production are simply total production expressed as percentagesof the 1929-43 average total production.
The indices of intensity were calculated from the relation: total productionindex X 100/combined abundance index = percentage intensity. Although thismethod of calculation yields an index that is not identical with the "intensity” indexdefined by Hile (1962), the differences between the two indices (as applied to thelake trout fishery) were, at most, only a few percentage points. Such small differencesare of no significance in view of the large changes in the fishery in 1950-70. Use ofthe term ‘“intensity” is retained only because 1929-49 data of Hile et al. (1951b) areincluded in this study.
Data from Wisconsin waters were treated in essentially the same manner as
7
those from Michigan, but data on effort were not available for the 1929-43 baseperiod used by Hile et al. (1951b) for Michigan waters (edited and compiled datawere available only for 1949-70). Summaries made by the Wisconsin Department ofNatural Resources-indicated that the CPE in Wisconsin waters in 193748 was almostidentical to that in the adjacent Michigan district MS-2. The 1929-43 mean CPE inMS-2 was therefore used as-the base for-calculation of abundance indices in Wisconsinfor 1949-70.
The indices calculated from the corrected and adjusted data are by no meansunbiased. Several unavoidable biases remain and, for some, only the direction of thebias is known. Possible underestimation of abundance may be due to: (1) Calculationof abundance indices from gillnet CPE alone (this bias was small for 1950 [lS%] andwas almost nil for 1956-70). (2) Reduction in the number of nights between lifts ofthe nets in the spring, as abundance rose in 1962-70 (from 5-7 nights in 1962 to 3nights in 1968-70). (3) The assumption that all nets fished in 1952-70 were nylon (afew cotton nets were still fished into the mid 1950’s). Possible biases towardoverestimation of abundance were probably much greater than those toward under-estimation and included: (1) Use of finetwine “spider web” nets by some fishermenin the late 1940’s. (2) Progressive reduction or cessation of operations by fishermen attimes of the year when availability was low in 195261. (3) Drastic reduction offishing effort in 195262, which reduced gear competition. (4) Abandonment ofcertain grounds and complete cessation of fishing by many, possibly less efficient,fishermen. (5) Cessation (due to decreases in size of lake trout in the population) ofthe float hook and float net fisheries that caught large pelagic lake trout. (6) Theeffects of these size changes on vulnerability to 4 1/2-inch bottom nets.
Had the monthly distribution of fishing effort in 1959 been the same as it wasin 192943, the 1959 average CPE would have been lowered about 15%. Gearcompetition (types 2 and 3 of Ricker 1958) probably existed during the 1940’s and1950’s but its reduction could not be quantitatively evaluated. When the fishery wasclosed in 1962, CPE’s of the few remaining assessment fishermen did not increaseimmediately. The effects of abandonment of certain grounds and attrition of fishermenare not entirely clear. Individual fishermen tended to concentrate a greater proportionof their effort on the better grounds within their usual areas of operation asabundance and effort declined. However, effort was reduced more on some of thebest grounds in the lake than on others because many of the best grounds were farfrom ports and were fished only by large, efficient operators who were forced byadverse economic factors to cease operations Many factors besides fishing skis, suchas family ties, age of the fisherman (younger men tended to leave the industry first),size of the operation, and business acumen (some survived by establishing local retailmarkets) were involved in attrition of fishermen.
In late spring and early summer many of the larger lake trout in the populationrise off the bottom and are pelagic over deep water. The float hook and float netfisheries were dependent on these large trout. As abundance and average size of laketrout declined in the 1950’s, the fisheries for pelagic lake trout collapsed. Probably agreater proportion of the population was composed of sizes that remained nearbottom, where they were vulnerable to the bottom nets.
As abundance of lake trout rose in 196267, the imposition of fixed samplingquotas resulted in reductions of fishing effort that made estimates of abundanceprogressively less reliable (in 1968-70, effort was held at about the 1967 level).Confidence limits (95%) for the mean annual CPE’s of individual fishermen indicatedthat sampling errors should usually have been no greater than 15%. Errors in theabundance indices (based on combined data from ah fishermen) due to sampling aloneshould be less than 15%.
State of the stocks, 1929-70
In their analysis of the commercial lake trout fishery in Michiganwaters of Lake Superior in 192949, Hile et al. (1951b) showed that, incontrast to the relation in most other Great Lakes fisheries, abundance and
8
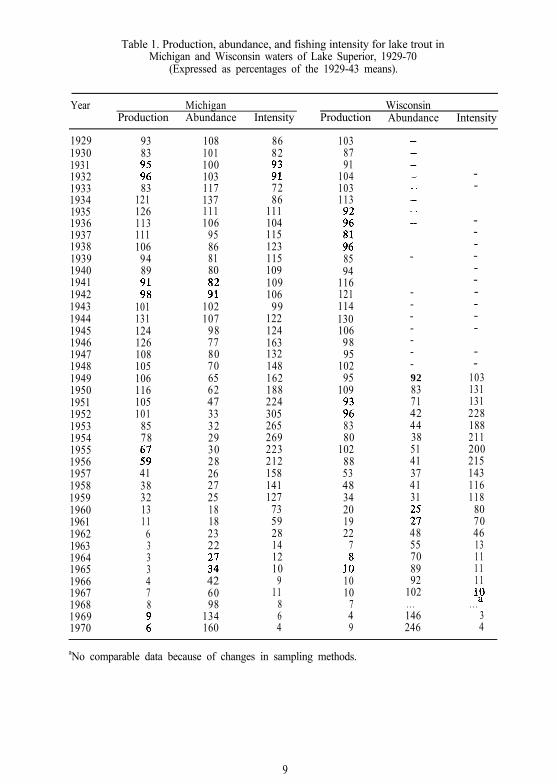
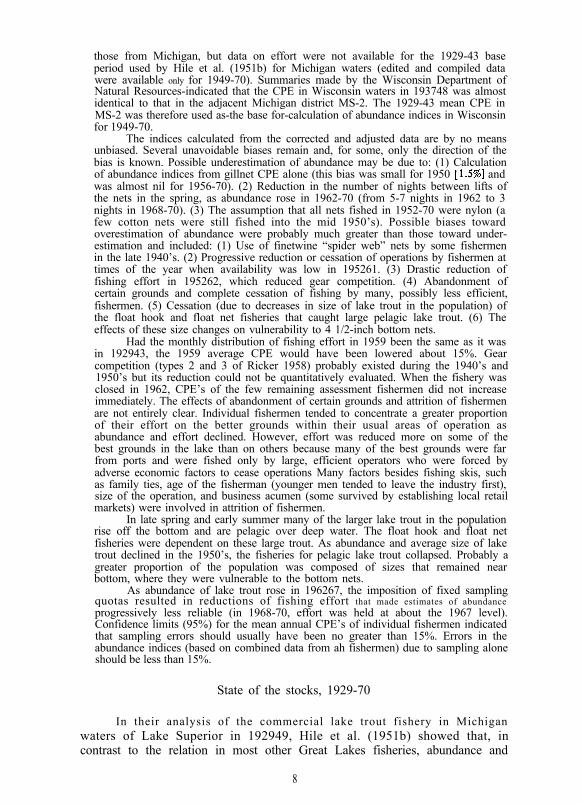
Table 1. Production, abundance, and fishing intensity for lake trout inMichigan and Wisconsin waters of Lake Superior, 1929-70
(Expressed as percentages of the 1929-43 means).
Year Michigan WisconsinProduction Abundance Intensity Production Abundance Intensity
192919301931193219331934193519361937193819391940194119421943194419451946194719481949195019511952195319541955195619571958195919601961196219631964196519661967196819691970
9383
El83
1211261131111069489
E101131124126108105106116105101
8578
f;4138321311
6333478
z
108101100103117137111106
95868180
8102107
98778070656247333229302826272518182322
ii426098
134160
8682
;:7286
111104115123115109109106
99122124163132148162188224305265269223212158141127
735928141210
911
864
1038791
104103113
t if
28594
1161211141301069895
10295
109
E8380
10288534834201922
7
1:1010
749
-
-------9283714244385141374131
i:4855708992
102. . .146246
--
----------
--
103131131228188211200215143116118
80704613111111
l,o. . .34
aNo comparable data because of changes in sampling methods.
9
Commercial fishery statistics for lake trout in Michigan waters of LakeSuperior, 1929-70: production (solid line), abundance (short dashes), andfishing intensity (long dashes) are expressed as percentages of the 1929-43means (scale at left); production in pounds is shown by scale at right. (Data for1929-43 are from Hile et al. [1951b] .)
fishing intensity fluctuated inversely (Table 1, Fig. 2). Abundance fluctuatedbetween highs of 137 and 107% of the 1929-43 average in 1934 and 1944and lows of 80 and 65% in 1940 and 1949. The trend of abundance wasdistinctly downward and that of fishing intensity was definitely upward.Although Hile et al. (1951 b) only speculated that increasing fishing pressure anddeclining abundance might have been causally related, they warned of theprecarious status of the fishery in 1949.
In 1949-52 the trends in production, fishing intensity, and abundancewere continued or intensified. Adjustments made in the data to allow for theconversion from cotton to nylon gillnets in 1950-52 increased the fishingintensity index from 162 in 1949 to 305 in 1952. The abundance index fellfrom 65 in 1949 to only 33 in 1952. Production remained slightly above the1929-43 average of 2.1 million pounds.
Low and steadily declining abundance of lake trout in 1953-61 resultedin near collapse of the Michigan fishery before the mid 1962 closure, butabundance recovered sharply in 1962-70. Production fell from an index of101 in 1952 to only 11 in 1961 and was held between values of 3 and 9 in1962-70. Intensity fell from a value of 305 in 1952 to only 59 in 1961. Itwas reduced to 28 by the midseason closure of fishing in 1962 and was heldbetween 4 and 14 by regulation in 1963-70. Abundance declined gradually
10
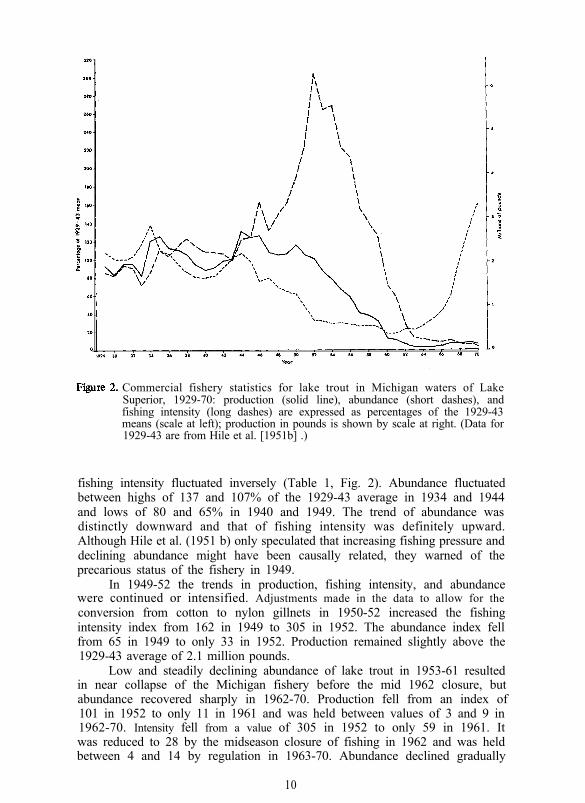
Figure 3. Commercial fishery statistics for lake trout in Wisconsin waters of LakeSuperior, 1929-70: production (solid line), abundance (short dashes), and fish-ing intensity (long dashes) are expressed as percentages of the 192943 means(scale at left); production in pounds is shown by scale at right. (The abundanceindices are based on the 1929-43 mean in Michigan district MS-2; see text forexplanation.)
from an index of 33 in 1952 to only 18 in 1960. It remained at 18 in 1961,increased slightly in 1962-63, and then increased steadily and rapidly from anindex of 22 in 1963 to 160 in 1970.
Fluctuations in commercial production in Wisconsin in 1929-49 weresimilar to those in Michigan (Table 1, Fig. 3), but production, fishingintensity, and abundance were still near the 1929-43 average in 1949 (meanproduction was 543,000 pounds). Production fluctuated irregularly downwardin 1949-54, increased sharply to average in 1955 (index 102), and was still atan index of 88 in 1956. The effort adjustment for nylon nets resulted in asharp rise in fishing intensity, from an index of 103 in 1949 to 228 in 1952.Intensity remained near or above an index of 200 through 1956. Theabundance index fell from 92 in 1949 to 42 in 1952 and fluctuated withouttrend near this level through 1956.
After 1956, the Wisconsin fishery declined disastrously. Production fellfrom an index of 88 in 1956 to only 19 in 1961. It rose slightly to 22 in1962 in spite of the midseason closure of fishing, but was held at indices ofonly 4-10 by regulation in 1963-70. Intensity fell from an index of 215 in1956 to 70 in 1961, was reduced to 46 by the mid 1962 closure of fishing,and was held at values of 3-13 by regulation in 1963-70. Abundance fell froman index. of 41 in 1956 to its low of 25 in 1960. It recovered slightly to 27 in1961 (due to a sharp increase in the fall of that year) and rose rapidly andsteadily to an index of 246 in 1970.
11
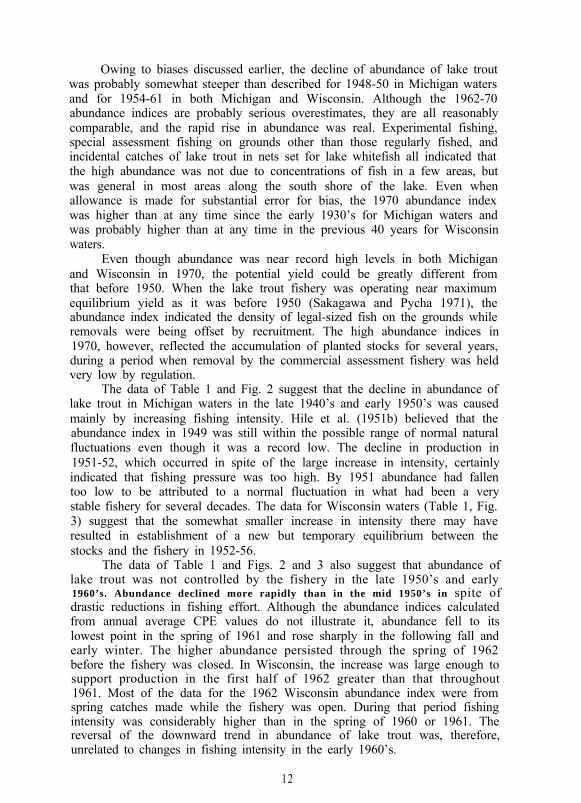
Owing to biases discussed earlier, the decline of abundance of lake troutwas probably somewhat steeper than described for 1948-50 in Michigan watersand for 1954-61 in both Michigan and Wisconsin. Although the 1962-70abundance indices are probably serious overestimates, they are all reasonablycomparable, and the rapid rise in abundance was real. Experimental fishing,special assessment fishing on grounds other than those regularly fished, andincidental catches of lake trout in nets set for lake whitefish all indicated thatthe high abundance was not due to concentrations of fish in a few areas, butwas general in most areas along the south shore of the lake. Even whenallowance is made for substantial error for bias, the 1970 abundance indexwas higher than at any time since the early 1930’s for Michigan waters andwas probably higher than at any time in the previous 40 years for Wisconsinwaters.
Even though abundance was near record high levels in both Michiganand Wisconsin in 1970, the potential yield could be greatly different fromthat before 1950. When the lake trout fishery was operating near maximumequilibrium yield as it was before 1950 (Sakagawa and Pycha 1971), theabundance index indicated the density of legal-sized fish on the grounds whileremovals were being offset by recruitment. The high abundance indices in1970, however, reflected the accumulation of planted stocks for several years,during a period when removal by the commercial assessment fishery was heldvery low by regulation.
The data of Table 1 and Fig. 2 suggest that the decline in abundance oflake trout in Michigan waters in the late 1940’s and early 1950’s was causedmainly by increasing fishing intensity. Hile et al. (1951b) believed that theabundance index in 1949 was still within the possible range of normal naturalfluctuations even though it was a record low. The decline in production in1951-52, which occurred in spite of the large increase in intensity, certainlyindicated that fishing pressure was too high. By 1951 abundance had fallentoo low to be attributed to a normal fluctuation in what had been a verystable fishery for several decades. The data for Wisconsin waters (Table 1, Fig.3) suggest that the somewhat smaller increase in intensity there may haveresulted in establishment of a new but temporary equilibrium between thestocks and the fishery in 1952-56.
The data of Table 1 and Figs. 2 and 3 also suggest that abundance oflake trout was not controlled by the fishery in the late 1950’s and early1960’s. Abundance declined more rapidly than in the mid 1950’s in spite ofdrastic reductions in fishing effort. Although the abundance indices calculatedfrom annual average CPE values do not illustrate it, abundance fell to itslowest point in the spring of 1961 and rose sharply in the following fall andearly winter. The higher abundance persisted through the spring of 1962before the fishery was closed. In Wisconsin, the increase was large enough tosupport production in the first half of 1962 greater than that throughout1961. Most of the data for the 1962 Wisconsin abundance index were fromspring catches made while the fishery was open. During that period fishingintensity was considerably higher than in the spring of 1960 or 1961. Thereversal of the downward trend in abundance of lake trout was, therefore,unrelated to changes in fishing intensity in the early 1960’s.
12
THE SEA LAMPREY
Life history
The life history of the sea lamprey in Lake Superior is closely similar inmost details to that of the lamprey in the other Great Lakes, as described byApplegate (1950). Most newly transformed adults are believed to move down-stream to the lake in late fall in the Lake Superior drainage (Patrick J.Manion, manuscript in preparation) rather than in spring as reported byApplegate (1950) and Applegate and Brynildson (1952) for northern LakesHuron and Michigan. Field conditions in winter and early spring are so severein the Lake Superior drainage, however, that it is extremely difficult to makeaccurate observations. The newly transformed adults that move downstreaminto Lake Superior in the fall remain there for 16-20 months and enterspawning streams in April-July (mainly in late May and early June in the LakeSuperior drainage).
The parasitic phase of the sea lamprey’s life history in Lake Superior isincompletely known. Most of our information comes from field observationsmade before 1962, when lampreys were abundant. In the late 1950’s, manycommercial fishermen reported catching hundreds of small (5 1/2- to 61/2-inch) recently transformed lampreys attached to lake herring (Coregonusartedii) during herring spawning runs in late November and early December.These small lampreys made no readily detectable wounds on the herring.From mid December to mid July extremely few small lampreys or fish withsmall lamprey wounds were observed; we have virtually no information on thelocation or prey of small parasitic-phase sea lampreys during that 7-monthperiod. All lampreys seen on lake trout in the winter and spring were matureprespawning adults 10-24 inches long (average, about 17 inches) and freshwounds on lake trout were large. Very few lampreys were seen on lake troutin late June and early July. By late July, feeding lampreys 10-13 inches longwere caught attached to lake trout. All fresh wounds on lake trout taken inlate July were small. The size of lampreys and the size of wounds on laketrout increased in August and September, and by late October the lampreysseen on lake trout were nearly as large as those in the spring spawning runs.The greatest numbers of large lampreys seen were on whitefish and lake troutcaught in December near the mainland shore. Although fewer lampreys of allsizes were seen after 1962, more recent observations match those during theearlier period.
The incidence of fresh wounds on lake trout, siscowets, and the largerhumper trout caught at Stannard Rock, Isle Royale, Caribou Island, andSuperior Shoal (Fig. 1) indicates that substantial numbers of sea lampreysreach these remote areas. How they reach these areas and how long theyremain there are unknown.
Abundance
Information on abundance of sea lampreys in Lake Superior is lackingfor the early years of the invasion; later it was obtained from counts atelectrical barriers that were installed in tributary streams to prevent adults
13
from reaching their spawning grounds. Information on lamprey counts at thebarriers was published by Smith et al. (1974). The first sea lamprey wasreported in 1946, but no measure of abundance of lampreys was available until1953, when electrical barriers and traps were installed in 11 streams along theeastern third of the south shore (5 of these were later designated as indexstreams for annual counts of lampreys in spawning runs.) Additional barrierswere constructed in other streams as soon as it became known that sealampreys spawned in them; by 1958, a total of 45 barriers and traps were inoperation along the south shore (McLain et al. 1965), and a system of barrierswas in operation along the Canadian shore (Lawrie 1970). After the treatmentof streams with larvicide proved to be an effective control measure, thenumber of barriers was reduced; barriers were operated in 16 index streamsfor assessment of abundance of lampreys in 1963-70.
If construction of barriers had kept pace with the spread of the sealamprey, the total catches of lampreys at the 16 index-stream barriers (or asmany of the 16 as were in operation in 1953-57) would represent comparableestimates of abundance in all years, 1953-70. Reports of local residents tocrews constructing the first barriers in Wisconsin, however, suggest that barrierconstruction did not keep abreast of the spread of the lamprey in Wisconsin;lampreys may have been present there several years before barriers wereinstalled (Smith et al. 1974). Catches of sea lampreys at index-stream barriersin Michigan in 1953-57 probably represent reasonable estimates of relativeabundance of lampreys during their initial increase in Michigan waters of thelake, but barrier counts may not give a true picture of the increase of sealampreys in Wisconsin waters. Other errors in estimation of sea lampreyabundance were caused by variations in weather. In 1960, particularly, floodsprevented operation of the barrier traps during most of May just before thepeak of the spawning run; consequently that year’s count was scarcelyindicative of lamprey abundance.
Despite some deficiencies of the data, catches of sea lampreys at the 16index-stream barriers, or at those operating in 1953-57, are the most compre-hensive record of relative abundance available. The total catch increasedrapidly in 1953-58, declined in 1959-60, reached its highest point (66,701) in1961, and fell sharply to 8,826 in 1962 (Table 2). The 1962 decline reflecteda reduction in the lamprey population that occurred in mid 1961,immediately after the 1961 spawners entered the streams. Catches in 1962-70ranged from 7 to 23% of the 1958-62 mean; they were smallest in 1967 inboth Michigan and Wisconsin.
Predation on lake trout
Sea lamprey predation on lake trout is not well understood because,with few exceptions, only the survivors of lamprey attacks are seen in thefield. The survivors bear marks ranging from open bleeding wounds to scarsthat are completely healed. The time required for healing is unknown andprobably varies greatly. An aquarium study of sea lamprey feeding by Len-non (1954), one of the few sources of information on the mechanism andeffects of sea lamprey attacks, includes little information on healing ofwounds.
14
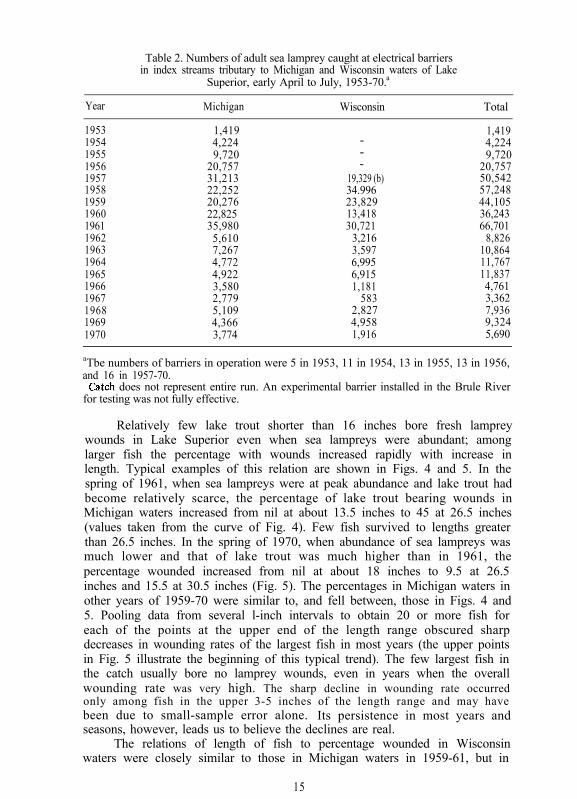
Table 2. Numbers of adult sea lamprey caught at electrical barriersin index streams tributary to Michigan and Wisconsin waters of Lake
Superior, early April to July, 1953-70.a
Year Michigan Wisconsin Total
1953 1,4191954 4,2241955 9,7201956 20,7571957 31,2131958 22,2521959 20,2761960 22,8251961 35,9801962 5,6101963 7,2671964 4,7721965 4,9221966 3,5801967 2,7791968 5,1091969 4,3661970 3,774
---
19,329 (b)34.99623,82913,41830,721
3,2163,5976,9956,9151,181
5832,8274,9581,916
1,4194,2249,720
20,75750,54257,24844,10536,24366,701
8,82610,86411,76711,8374,7613,3627,9369,3245,690
aTbe numbers of barriers in operation were 5 in 1953, 11 in 1954, 13 in 1955, 13 in 1956,and 16 in 1957-70.
Catch does not represent entire run. An experimental barrier installed in the Brule Riverfor testing was not fully effective.
Relatively few lake trout shorter than 16 inches bore fresh lampreywounds in Lake Superior even when sea lampreys were abundant; amonglarger fish the percentage with wounds increased rapidly with increase inlength. Typical examples of this relation are shown in Figs. 4 and 5. In thespring of 1961, when sea lampreys were at peak abundance and lake trout hadbecome relatively scarce, the percentage of lake trout bearing wounds inMichigan waters increased from nil at about 13.5 inches to 45 at 26.5 inches(values taken from the curve of Fig. 4). Few fish survived to lengths greaterthan 26.5 inches. In the spring of 1970, when abundance of sea lampreys wasmuch lower and that of lake trout was much higher than in 1961, thepercentage wounded increased from nil at about 18 inches to 9.5 at 26.5inches and 15.5 at 30.5 inches (Fig. 5). The percentages in Michigan waters inother years of 1959-70 were similar to, and fell between, those in Figs. 4 and5. Pooling data from several l-inch intervals to obtain 20 or more fish foreach of the points at the upper end of the length range obscured sharpdecreases in wounding rates of the largest fish in most years (the upper pointsin Fig. 5 illustrate the beginning of this typical trend). The few largest fish inthe catch usually bore no lamprey wounds, even in years when the overallwounding rate was very high. The sharp decline in wounding rate occurredonly among fish in the upper 3-5 inches of the length range and may havebeen due to small-sample error alone. Its persistence in most years andseasons, however, leads us to believe the declines are real.
The relations of length of fish to percentage wounded in Wisconsinwaters were closely similar to those in Michigan waters in 1959-61, but in
15
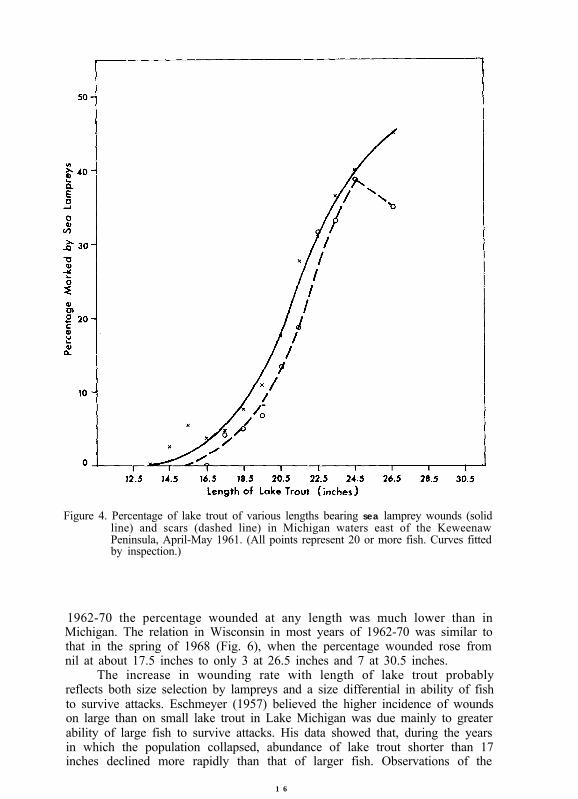
Figure 4. Percentage of lake trout of various lengths bearing sea lamprey wounds (solidline) and scars (dashed line) in Michigan waters east of the KeweenawPeninsula, April-May 1961. (All points represent 20 or more fish. Curves fittedby inspection.)
1962-70 the percentage wounded at any length was much lower than inMichigan. The relation in Wisconsin in most years of 1962-70 was similar tothat in the spring of 1968 (Fig. 6), when the percentage wounded rose fromnil at about 17.5 inches to only 3 at 26.5 inches and 7 at 30.5 inches.
The increase in wounding rate with length of lake trout probablyreflects both size selection by lampreys and a size differential in ability of fishto survive attacks. Eschmeyer (1957) believed the higher incidence of woundson large than on small lake trout in Lake Michigan was due mainly to greaterability of large fish to survive attacks. His data showed that, during the yearsin which the population collapsed, abundance of lake trout shorter than 17inches declined more rapidly than that of larger fish. Observations of the
1 6
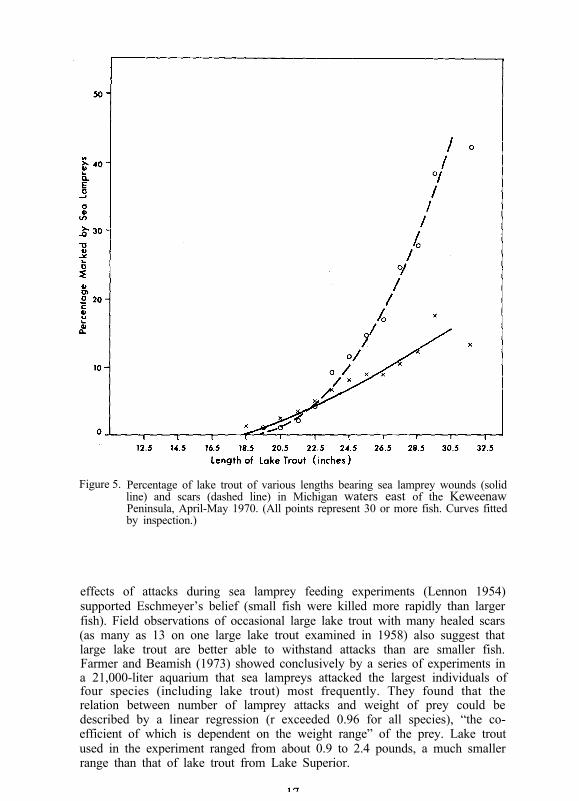
Figure 5. Percentage of lake trout of various lengths bearing sea lamprey wounds (solidline) and scars (dashed line) in Michigan waters east of the KeweenawPeninsula, April-May 1970. (All points represent 30 or more fish. Curves fittedby inspection.)
effects of attacks during sea lamprey feeding experiments (Lennon 1954)supported Eschmeyer’s belief (small fish were killed more rapidly than largerfish). Field observations of occasional large lake trout with many healed scars(as many as 13 on one large lake trout examined in 1958) also suggest thatlarge lake trout are better able to withstand attacks than are smaller fish.Farmer and Beamish (1973) showed conclusively by a series of experiments ina 21,000-liter aquarium that sea lampreys attacked the largest individuals offour species (including lake trout) most frequently. They found that therelation between number of lamprey attacks and weight of prey could bedescribed by a linear regression (r exceeded 0.96 for all species), “the co-efficient of which is dependent on the weight range” of the prey. Lake troutused in the experiment ranged from about 0.9 to 2.4 pounds, a much smallerrange than that of lake trout from Lake Superior.
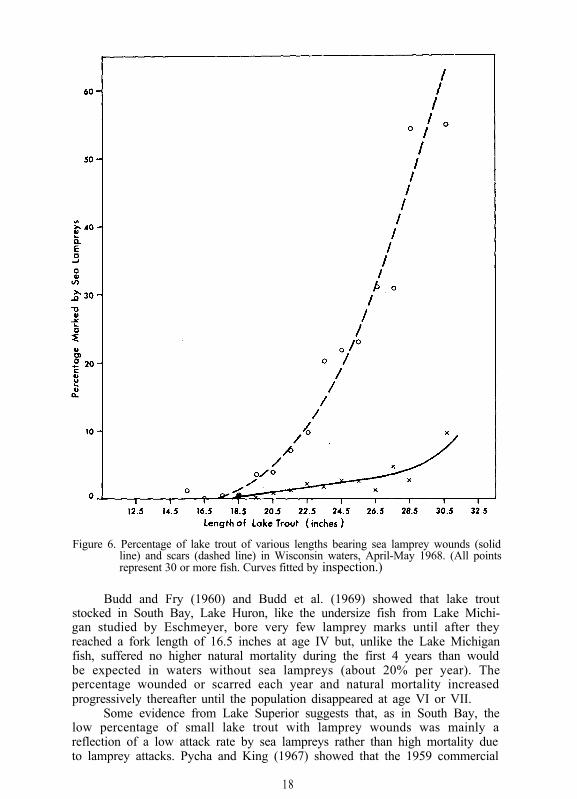
Figure 6. Percentage of lake trout of various lengths bearing sea lamprey wounds (solidline) and scars (dashed line) in Wisconsin waters, April-May 1968. (All pointsrepresent 30 or more fish. Curves fitted by inspection.)
Budd and Fry (1960) and Budd et al. (1969) showed that lake troutstocked in South Bay, Lake Huron, like the undersize fish from Lake Michi-gan studied by Eschmeyer, bore very few lamprey marks until after theyreached a fork length of 16.5 inches at age IV but, unlike the Lake Michiganfish, suffered no higher natural mortality during the first 4 years than wouldbe expected in waters without sea lampreys (about 20% per year). Thepercentage wounded or scarred each year and natural mortality increasedprogressively thereafter until the population disappeared at age VI or VII.
Some evidence from Lake Superior suggests that, as in South Bay, thelow percentage of small lake trout with lamprey wounds was mainly areflection of a low attack rate by sea lampreys rather than high mortality dueto lamprey attacks. Pycha and King (1967) showed that the 1959 commercial
18
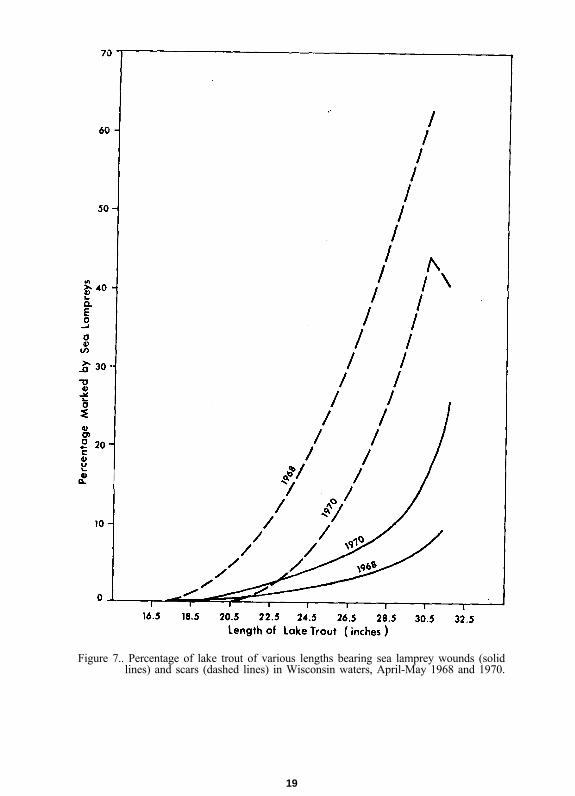
Figure 7.. Percentage of lake trout of various lengths bearing sea lamprey wounds (solidlines) and scars (dashed lines) in Wisconsin waters, April-May 1968 and 1970.
19
return of the lake trout planted as yearlings in Wisconsin in 1955 would nothave been attained if annual natural mortality n had exceeded a constant rateof 10% at ages I-IV in 1955-58 unless fishing mortality m was at least 33% in1959 (a very high figure for a year in which fishing effort was only slightlymore than half that in 1952-56). Mortality of these fish was apparently nothigh while they were less than 17 inches long, even though sea lampreys wereabundant in 1956-58 in Wisconsin waters (as indicated by the spawning runsin Wisconsin in 1957-59, Table 2).
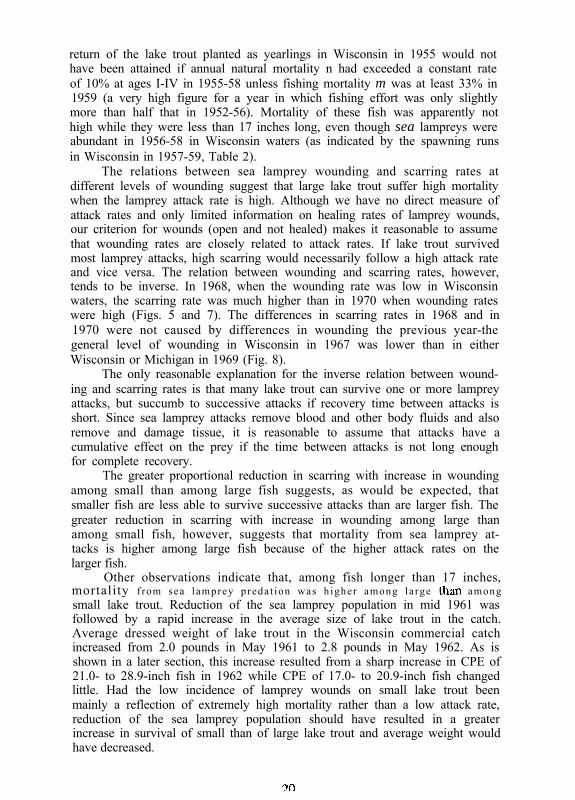
The relations between sea lamprey wounding and scarring rates atdifferent levels of wounding suggest that large lake trout suffer high mortalitywhen the lamprey attack rate is high. Although we have no direct measure ofattack rates and only limited information on healing rates of lamprey wounds,our criterion for wounds (open and not healed) makes it reasonable to assumethat wounding rates are closely related to attack rates. If lake trout survivedmost lamprey attacks, high scarring would necessarily follow a high attack rateand vice versa. The relation between wounding and scarring rates, however,tends to be inverse. In 1968, when the wounding rate was low in Wisconsinwaters, the scarring rate was much higher than in 1970 when wounding rateswere high (Figs. 5 and 7). The differences in scarring rates in 1968 and in1970 were not caused by differences in wounding the previous year-thegeneral level of wounding in Wisconsin in 1967 was lower than in eitherWisconsin or Michigan in 1969 (Fig. 8).
The only reasonable explanation for the inverse relation between wound-ing and scarring rates is that many lake trout can survive one or more lampreyattacks, but succumb to successive attacks if recovery time between attacks isshort. Since sea lamprey attacks remove blood and other body fluids and alsoremove and damage tissue, it is reasonable to assume that attacks have acumulative effect on the prey if the time between attacks is not long enoughfor complete recovery.
The greater proportional reduction in scarring with increase in woundingamong small than among large fish suggests, as would be expected, thatsmaller fish are less able to survive successive attacks than are larger fish. Thegreater reduction in scarring with increase in wounding among large thanamong small fish, however, suggests that mortality from sea lamprey at-tacks is higher among large fish because of the higher attack rates on thelarger fish.
Other observations indicate that, among fish longer than 17 inches,mortality f rom sea lamprey preda t ion was h igher among la rge &II amongsmall lake trout. Reduction of the sea lamprey population in mid 1961 wasfollowed by a rapid increase in the average size of lake trout in the catch.Average dressed weight of lake trout in the Wisconsin commercial catchincreased from 2.0 pounds in May 1961 to 2.8 pounds in May 1962. As isshown in a later section, this increase resulted from a sharp increase in CPE of21.0- to 28.9-inch fish in 1962 while CPE of 17.0- to 20.9-inch fish changedlittle. Had the low incidence of lamprey wounds on small lake trout beenmainly a reflection of extremely high mortality rather than a low attack rate,reduction of the sea lamprey population should have resulted in a greaterincrease in survival of small than of large lake trout and average weight wouldhave decreased.
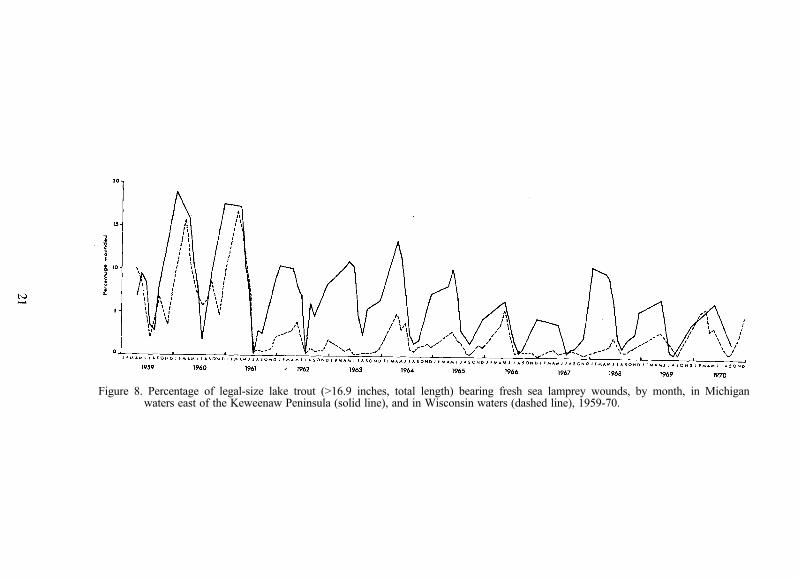
Figure 8. Percentage of legal-size lake trout (>16.9 inches, total length) bearing fresh sea lamprey wounds, by month, in Michiganwaters east of the Keweenaw Peninsula (solid line), and in Wisconsin waters (dashed line), 1959-70.
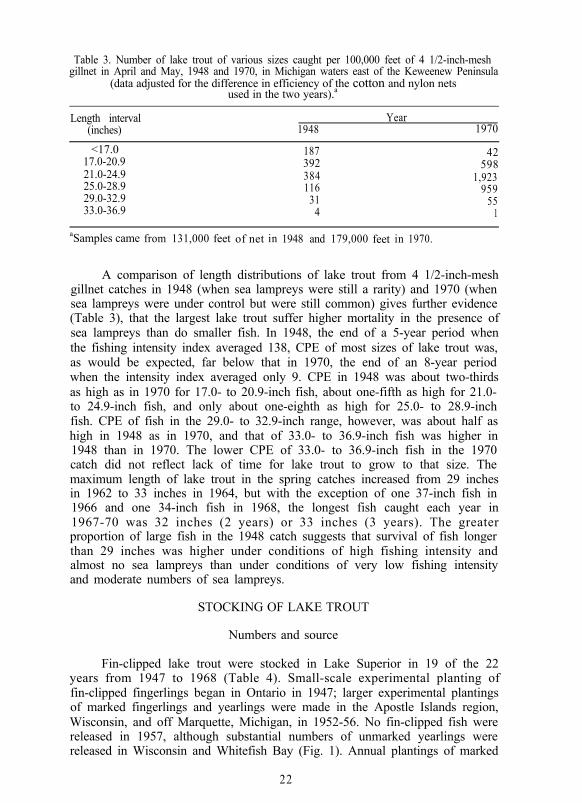
Table 3. Number of lake trout of various sizes caught per 100,000 feet of 4 1/2-inch-meshgillnet in April and May, 1948 and 1970, in Michigan waters east of the Keweenew Peninsula
(data adjusted for the difference in efficiency of the cotton and nylon netsused in the two years).a
Length interval(inches) 1948
Year1970
<17.0 187 4217.0-20.9 392 59821.0-24.9 384 1,92325.0-28.9 116 95929.0-32.9 31 5533.0-36.9 4 1
aSamples came from 131,000 feet of net in 1948 and 179,000 feet in 1970.
A comparison of length distributions of lake trout from 4 1/2-inch-meshgillnet catches in 1948 (when sea lampreys were still a rarity) and 1970 (whensea lampreys were under control but were still common) gives further evidence(Table 3), that the largest lake trout suffer higher mortality in the presence ofsea lampreys than do smaller fish. In 1948, the end of a 5-year period whenthe fishing intensity index averaged 138, CPE of most sizes of lake trout was,as would be expected, far below that in 1970, the end of an 8-year periodwhen the intensity index averaged only 9. CPE in 1948 was about two-thirdsas high as in 1970 for 17.0- to 20.9-inch fish, about one-fifth as high for 21.0-to 24.9-inch fish, and only about one-eighth as high for 25.0- to 28.9-inchfish. CPE of fish in the 29.0- to 32.9-inch range, however, was about half ashigh in 1948 as in 1970, and that of 33.0- to 36.9-inch fish was higher in1948 than in 1970. The lower CPE of 33.0- to 36.9-inch fish in the 1970catch did not reflect lack of time for lake trout to grow to that size. Themaximum length of lake trout in the spring catches increased from 29 inchesin 1962 to 33 inches in 1964, but with the exception of one 37-inch fish in1966 and one 34-inch fish in 1968, the longest fish caught each year in1967-70 was 32 inches (2 years) or 33 inches (3 years). The greaterproportion of large fish in the 1948 catch suggests that survival of fish longerthan 29 inches was higher under conditions of high fishing intensity andalmost no sea lampreys than under conditions of very low fishing intensityand moderate numbers of sea lampreys.
STOCKING OF LAKE TROUT
Numbers and source
Fin-clipped lake trout were stocked in Lake Superior in 19 of the 22years from 1947 to 1968 (Table 4). Small-scale experimental planting offin-clipped fingerlings began in Ontario in 1947; larger experimental plantingsof marked fingerlings and yearlings were made in the Apostle Islands region,Wisconsin, and off Marquette, Michigan, in 1952-56. No fin-clipped fish werereleased in 1957, although substantial numbers of unmarked yearlings werereleased in Wisconsin and Whitefish Bay (Fig. 1). Annual plantings of marked
22
Table 4. Numbers of fin-clipped lake trout planted in the four jurisdictional areasof Lake Superior, 1947-68.
Yeara
Minnesota Wisconsin Michigan Ontario Total
Fingerlings Yearlings Fingerlings Yearlings Fingerlings Yearlings Fingerlings Yearlings Fingerlings Yearlingsor older or older or older or older or older
1947194819501952195319.541955195619581959196019611962196319641965196619671968
Total, 1947-56Total, 1958-68
Grand total
---
-
27,57432,46949,888
49,915
27,57432,46949,888
210,366321,968263,619
---
--
- - -- - - -- 145:ooo 102,097 65,366 - 102,097- 132,980 80,137 139,973 69,439 149,576
142,323 102,016 121,296 134,318 236,334102,794 - 60,744 - 163,538
- 200,731 - - - 200,731- - 183,964 298,148 537,870 1,019,982
- 151,060 43,465 472,590 667,11549,400 161,350 393,108 50,250 395,641 950,099
314,021 - 392,100 60,200 493,980 1,200,10176,559 - 493,168 - 775,161 - 508,175 1,776,50437,846 311,469 - 1,185,755 - 476,709 1,973,933
743,435 1,195,770 472,400 2,593,605447,500 - 826,900 467,740
151,4791,843,840
105,290376,900 - 2,217,700 - 450,000 3,152,100
153,700 243,767 - 2,059,357 499,600
420,303239,075
3,030,804- 2,260,375 - 499,740 3,222,320
- 587,775 325,735 264,501 159,846a -419,584
852,276154,690 3,665,709 - 11,647,839 110,450 5,274,445
419,58421,430,403
574,993 4,253,484 325,735 11,912,340 270,296a 5,274,445 22,282,679
aNo plantings in 1949, 1951, and 1957.
-182,000101,700107,500228,080223,130
-842,410842,410
-99,65060,20076,55937,846
151,479258,990
905,884a
684,724l,590,698a
fish (mostly yearlings) then increased to more than 1 million in 1958-65(1959 and 1960 excepted ) and more than 3 million in 1966-68. (Because fewplanted lake trout enter the assessment or sport catches for at least 2 yearsafter release, fish planted after 1968 contributed little to catches in 1969-70and are not included in Table 4).
The intensity of stocking (number planted per unit area of water) was notuniform throughout U.S. waters. No lake trout were planted in Michigan waterswest of the Keweenaw Peninsula until 1961 and none were planted in Minnesotauntil 1962. Numbers planted were relatively small in both areas until 1964. Allstocking was done near or from the mainland shore in waters inhabited mainlyby “lean” lake trout. Stocking intensity was based on the areas of water lessthan 40 fathoms deep because most lake trout are caught at 1040 fathoms.Stocking intensity was highest in Wisconsin in 1952-65 and in Michigan andMinnesota in 1966-68.
The origin of most of the lake trout stocked in Lake Superior can betraced to that lake. Some were from eggs obtained from hatchery broodstocks, which in turn came from eggs stripped from lake trout caught insouthern Lake Superior, and others (including most of those stocked before1958) were from eggs stripped from spawning fish caught in the lake. In theearly 1960’s, a few were reared from eggs of fish caught in inland lakes ofMichigan and Ontario.
Contribution to the population and fishery
The contribution of planted lake trout to the stocks available insouthern Lake Superior generally increased rapidly in 1959-66 and remainedhigh in 1967-70 (Table 5). Survival of the fish stocked in different years hasvaried greatly. Before the lake trout fishery was closed in 1962, returns to thecommercial fishery from various releases ranged from 1 to 37% (Pycha andKing 1967). Plantings in Wisconsin generally yielded greater returns than thosein Michigan, but Dryer and King (1968) reported that survival during the firstyear after release of fish planted in Wisconsin declined after 1961. Dispersal oflake trout from planting sites was not random, but tended to follow thecounterclockwise currents in the lake (Pycha et al. 1965). Lake trout plantedin Wisconsin thus made a strong contribution to stocks in Michigan waterswest of the Keweenaw Peninsula and a small contribution to those in waterseast of the peninsula; few fish moved in the opposite direction.
The experimental plantings made before 1957 added little to stocks of legal-size lake trout, except in western Lake Superior where, in 1959, more than 35%of the legal commercial catch in Wisconsin and 11.5% of that in Michigan waterswest of the Keweenaw Peninsula were of hatchery origin (Table 5). A major por-tion of the catch of marked fish in 1959 was from the extraordinarily successful1955 Wisconsin planting (Pycha and King 1967). The percentages of fin-clippedfish in the catches declined in 1959-61 in Wisconsin and in 1960-61 in westernMichigan as fish of the 195 5 planting disappeared.
The contribution of planted lake trout to the legal-size stocks increasedagain after 1961 as a result of the increasing annual plantings in 1958-64. InWisconsin, the percentage of fin-clipped fish increased rapidly in 1962-66,reached a peak of 96% in 1968, and declined slightly to 90% in 1970. In
2 4

Table 5. Percentage of undersize and legal lake trout with clipped finslanded by commercial assessment fishermen from inshore waters of Lake Superior,
1959-70 (numbers of fish in parentheses).a
Year Wisconsin MichiganWest of Keweenaw East of Keweenaw
_ _ U n d e r s i z e d Legal Undersized Legal Undersized Legal
1959
1960
1961
1962
1963
1964
1965
1966
24.6(1,647)
27.8(1.154)
51.2(934)66.1(705)
90.5(1,134)
95.7(1,277)
97.3(1,079)
97.9
35.3(9,013)
28.8(7,597)
21.1(9,376)32.8
(8.478)5 3 . 5
(13,155)69.7
(14,580)83.5
(19,277)89.7
32.0(823)5.1
(314)30.5(26%57.3(103)79.4(112)93.6(549)95.9(446)97.6
11.5(3,441)
18.3(1,780)
16.1(2,783)
22.7(1,274)
29.7(1,399)
47.7(1,572)
72.4(1,306)
91.5
(7,571)8.3
(92%4)i.5
(1,382)
(4,739)
90.7
23.2(3,229)
83.4
(2,430)91.2
(3,443)98.7
(3,420)91.9
(11,718)
(45,878)
40.3(14,883)
70.6(15,319)
(248;:s)
88.8(14,811)
27.1
95.4(1,073) (17,537) (337) (1,905) C&828) (15,118)
1967 92.8 93.1 97.3 96.4 98.5 98.5CVW (17,012) (295) (1,046) (801) (15,596)
1968 91.0 95.6 95.4 97.3 96.9 99.5(2,666) (14,007) (108) (1,097) (519) (16,888)
1969 85.0 94.3 92.5 97.6 98.1 99.3(688) (5,923) (67) (1,065) (577) (19,444)
1970 82.6 89.8 93.5 98.1 96.3 98.4(944) (15,784) (46) (1,058) (297) (11,377)
aMinimum legal size is assumed to have been 17 inches in all areas in all years even thoughthe Michigan limit was based on weight in 1959-67 (see text).
western Michigan, the percentage increased rapidly in 1962-66 and continuedgradually upward to 98% in 1970.
The percentage of fin-clipped fish in the undersize portion of theWisconsin catch increased steadily in 1959-66 to a high of 98%. Naturalreproduction in Wisconsin in 1965-66 (described by Dryer and King 1968)and reduced stocking in 1967-68 combined to reduce the percentage to 83%in 1970. In western Michigan waters the contribution of planted fish to stocksof undersize lake trout reached a peak of 98% in 1966, but declined slightlyto 94% in 1970. This slight decline could have been due to migration ofjuvenile native fish from Wisconsin waters rather than to natural reproductionlocally.
Hatchery fish made up only 1.2 to 1.5% of the legal-size catch inMichigan waters east of the Keweenaw Peninsula in 1959-60, but the per-centage then rose steadily to 99.5% in 1968 and remained very high through1970-perhaps 100%, since some clipped fins regenerate and occasional fishare missed during the fin-clipping process.
Hatchery fish made up a rapidly increasing proportion of the catch ofundersize lake trout in eastern Michigan waters, from only 3% in 1959 to 99%in 1965; the percentage fluctuated slightly, but remained above 96% in1966-70 (Table 5). The small fluctuations in percentages in 1966-70 and thedifference between the peak percentages for undersize and legal-size fish mayhave resulted from occasional catches of small native siscowets, many ofwhich are difficult to distinguish from lean lake trout until they attain alength of 12 to 16 inches.
Most of the lake trout stocks along the south shore of Lake Superiorwere of hatchery origin in 1964-70. Although native lake trout made up asteadily increasing proportion of the undersize fish in Wisconsin in 1967-70,much of that increase was directly attributable to the reduction in thenumbers of fish planted after 1964 (Table 4). Recruitment remained stronglydependent on stocking. In Michigan inshore waters, the stocks of lean laketrout were composed almost entirely of hatchery fish through 1970.
CHANGES IN SIZE COMPOSITION AND ABUNDANCEOF LAKE TROUT, 1959-70
Lake trout taken in commercial or assessment catches were grouped bylength to illustrate changes in important size segments of the population (Table6). Since the data originated from catches in 4 1/2-inch-mesh gillnets, catch ratesof the various size groups reflect to some degree selectivity of the nets as well asabundance of the various sizes of lake trout. Selectivity of the 4 1/2-inch netshas not been accurately determined for all sizes of lake trout, but recentlyavailable data (unpublished) from experimental fishing enable us to give anapproximate description, Selectivity is not as sharply defined for lake trout asfor many species due to a propensity of lake trout to become entangled in thenets by their teeth or mouth parts. Efficiency of the nets is low for lake troutless than 17 inches long, and increases rapidly with length of fish between 17and 20 inches. The 4 1/2-inch nets appear to have about the same efficiency forall lengths of trout in the 20- to 30-inch range. Efficiency then falls off rapidlyfor 31-&h and larger fish. Out data permit only rough estimates of efficiencyfor fish outside the 20- to 30-inch length range. The nets appear to be about halfas efficient for fish 18.5 inches long and about one-third to one-fourth as effi-cient for 33-inch fish as for those 20 to 30 inches long.
Among the length groups in Table 6, undersize lake trout (less than 17inches long) seldom made up a large part of the catch. Because the proportion ofundersize fish returned to the water depended on the length of time the gear wasfished and on the individual fisherman’s methods and handling of the fish, thecatch rates for undersize fish are not dependably comparable in all years. Nodetectable changes in fishing practices occurred in 1959-63, but in 1964-70 thereduction in the time the nets were fished and other more subtle changes in-creased the proportion of undersize fish returned alive to the water and biasedthe data. Lake trout in the “17- to 20-inch group” (i.e., fish 17-O-20.9 incheslong) made up most of the annual recruitment. Fish in this length range had arelatively low incidence of sea lamprey wounds and those shorter than 20 incheswere not fully vulnerable to the commercial gillnets. Fish in the 21- to 24-inchgroup had moderately high lamprey wounding rates and were fully vulnerable tothe fishing gear. Lake trout 25-28 inches long had much higher lamprey
2 6
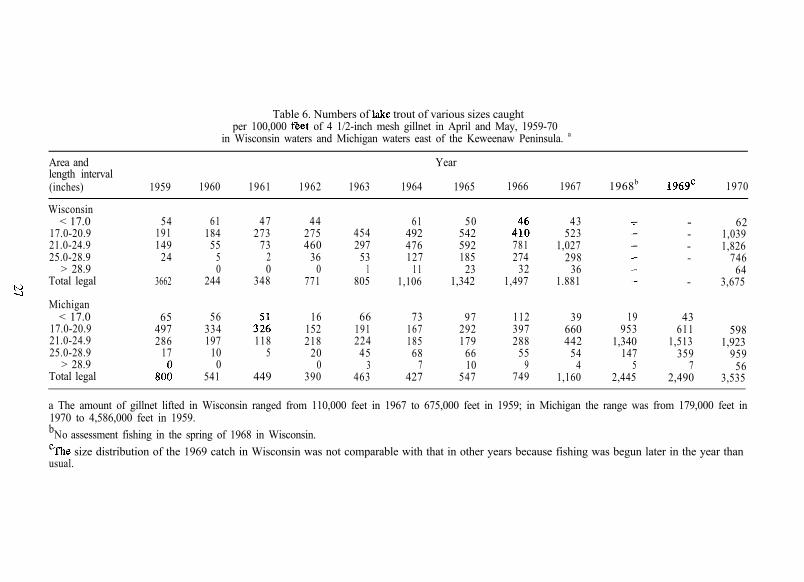
Table 6. Numbers of !a& trout of various sizes caughtper 100,000 Feet of 4 1/2-inch mesh gillnet in April and May, 1959-70
in Wisconsin waters and Michigan waters east of the Keweenaw Peninsula. a
Area andlength interval(inches) 1959 1960 1961 1962 1963
Year
1964 1965 1966 1967 1968b 1969’ 1970
Wisconsin< 17.0
17.0-20.921.0-24.925.0-28.9
> 28.9Total legal
54 61 47 44191 184 273 275149 55 73 460
24 5 2 36
36620 0 0
244 348 771
45461
492297 476
53 1271 11
805 1,106
50542592185
231,342
781274
321,497
43523
1,027298
361.881
- 62- 1,039- 1,826- 746
64- 3,675
Michigan< 17.0
17.0-20.921.0-24.925.0-28.9
> 28.9Total legal
65 56497 334286 197 118
17 10 50
541 449
16 66 73 97 112 39 19 43152 191 167 292 397 660 953 611 598218 224 185 179 288 442 1,340 1,513 1,923
20 45 68 66 55 54 147 359 9590 3 7 10 9 4 5 7 56
390 463 427 547 749 1,160 2,445 2,490 3,535
a The amount of gillnet lifted in Wisconsin ranged from 110,000 feet in 1967 to 675,000 feet in 1959; in Michigan the range was from 179,000 feet in1970 to 4,586,000 feet in 1959.bNo assessment fishing in the spring of 1968 in Wisconsin.
%‘he size distribution of the 1969 catch in Wisconsin was not comparable with that in other years because fishing was begun later in the year thanusual.
wounding rates than the smaller fish and were also fully vulnerable to the gear.Since the smallest mature females were about 25 inches long (Eschmeyer 1955),this group partially reflected abundance of spawning stocks. Fish longer than28.9 inches (very few were longer than 33 inches in 1959-70) generally had thehighest incidence of lamprey wounds, but the few largest fish in the groupfrequently had lower wounding rates than smaller fish, and commonly bore nowounds. The larger fish within this size group were less than fully vulnerable tothe fishing gear. Lake trout longer than 28.9 inches made up the bulk of thespawning stocks before the mid 1950’s (Eschmeyer 1955).
Year-to-year comparisons of relative abundance of lake trout within anygiven size group of Table 6 are not invalidated by net selectivity. Directcomparisons between size groups, whether within or between years, are validonly for the 21- to 24-inch and the 25- to 2%inch groups. Although directcomparisons of abundance of lake trout in groups outside the 21- to 2%inchrange with that of fish in this range are biased by net selectivity, changes inthe proportions of the catch falling within the various size groups reflectchanges in growth rate, survival rate, or rate of recruitment. Average growthincrements of lake trout 17-30 inches long caught in the mid 1960’s weregenerally close to the 3- to 4-inch average of the early 1950’s found byRahrer (1967). Growth rate declined slightly in the late 1960’s but the declinewas gradual. Year-to-year changes in the catch rates of the various size groups,therefore, reflect mainly changes in rates of recruitment and survival.
In 1959-61, abundance of all sizes of lake trout declined in Michiganwaters and all sizes 21 inches and longer declined in Wisconsin waters (Table6). Spawning stocks were very low in both states in 1959 and, by 1960, fish25-28 inches long were scarce and those longer than 28.9 inches were almostgone. Although vulnerability of fish less than 17 inches was low and 17- to20-inch fish were incompletely vulnerable, the declines in these groups inMichigan were real and reflected declining recruitment. The 1961 increase inthe 17- to 20-inch group in Wisconsin was also real and was caused either byunusual strength of the 1956 year class of native lake trout or byexceptionally high survival of the unclipped lake trout of the same year classplanted in 1957.
In 1962, abundance of 21- to 24-inch and 25- to 28-inch fish increasedsharply in both Wisconsin and Michigan. These increases reflected sharpincreases in survival rate. Most growth of lake trout in Lake Superior occursafter midsummer (Rahrer 1967); the increases in abundance were almostentirely due to reduced mortality of the fish that advanced to larger size groupsduring the fall and early winter of 1961. In Wisconsin, abundance of undersizefish declined slightly and that of 17- to 20-inch fish held at the 1961 level. InMichigan, abundance of 17- to 28-inch fish declined even more rapidly than in1959-61 and fish less than 17 inches long became scarce. Of the few undersizefish caught in Michigan in 1962, 83% were fin-clipped (Table 5).
In Wisconsin, recruitment was much higher in 1963-70 than in 1959-62.Abundance of 17- to 20-inch fish increased sharply in 1963 and rose to nearlyfour times the 1961-62 level by 1970. The catch rate of undersize fish alsoincreased in 1963 but the data for undersize fish after 1963 are not reliableand are almost certainly underestimates. Except for the 21- to 24-&h groupin 1963, abundance of all sizes of lake trout 21 inches long and longer
28
increased steadily after 1962. By 1964, abundance of 25-&h and larger fishhad increased to 3.5 times that in 1959 and a substantial spawning run wasreestablished on one major spawning ground. In 1965, native young-of-the-year lake trout were taken in experimental trawls by the Service’s researchvessel Siscowet for the first time in 6 years (Dryer and King 1968).
The proportion of the Wisconsin catch made up of 21-inch and largerlake trout declined somewhat in 1963, but increased more than threefold in1963-67. This increase can be accounted for only by a substantial increase insurvival rate, but increased-survival was confined mainly to fish less than 25inches long. The increase in abundance of 25-inch and larger fish in 1963-67was therefore due mainly to growth of the increasing numbers of fish in the21- to 24-inch group while survival rate of 25-inch and larger fish apparentlychanged little. Lack of data for 1968-69 prevents evaluation of changes insurvival in 1967-70, but the high abundance of 17- to 20-inch and 21- to24-inch fish in 1970 suggests that increasing recruitment rather than anymajor change in survival accounted for most of the continued increase inabundance of fish 25 inches long and longer.
The changes in abundance of the various size groups in Michigan watersin 1963-70 were similar to those in Wisconsin, except that recruitment intothe 17- to 20-inch group declined through 1964 and was relatively low until1967. Low abundance of 17- to 20-inch fish in 1962-64 caused low recruit-ment into the 21- to 24-&h group in 1963-65. A steady increase inrecruitment of 17- to 20-inch fish in 1965-68 was followed by a greater thanproportional increase in the 21- to 24-inch group in 1966-70. The increase of21- to 24-inch fish in Michigan, as in Wisconsin, indicates that survival as wellas recruitment was increasing. Lake trout 25 inches long and longer increasedapproximately in proportion to the abundance of 21- to 24-inch fish a yearearlier in 1963-69, but in 1970 abundance of 25- to 28-inch fish almosttrebled and that of fish longer than 28.9 inches increased eightfold. This sharpincrease of 25-inch and larger fish could have occurred only if survival ofthese large fish increased substantially.
CAUSES OF THE CHANGES IN THE LAKE TROUT POPULATION
The available information on changes in fishing effort and on abundanceof lake trout in the late 1940’s and early 1950’s strongly favors the belief thatintensive fishing, aided by the introduction of nylon gillnets, was the principalfactor involved in the early years of the post-World War II decline of laketrout in Lake Superior. The point at which sea lamprey predation became aserious source of lake trout mortality is not known, but it was probablysometime in the early to mid 1950’s in Michigan waters of the lake. Smith(1968) showed that the intensively fished lake trout stocks of lakes Huronand Michigan began to decline within a few years after the sea lamprey wasfirst recorded in each of those lakes and long before the lampreys reachedtheir peak abundance. Irrespective of the relative importance of the fisheryand sea lamprey predation in the early and mid 1950’s, together they caused aserious depletion of the stocks-most importantly those of large spawning-sizefish. Reports of many commercial fishermen indicated that spawning stockswere drastically depleted by 1956 or 1957 in Michigan waters and by 1957 or
29
1958 in Wisconsin waters. By the end of the 1950’s natural reproductionranged from poor to almost nonexistent, and by the mid 1960’s, the recruit-ment of legal-size native fish was severely curtailed.
In 1959-61, the population of native lake trout fell rapidly, due both todeclining recruitment and high mortality of legal-size fish. Even though fishingeffort had been reduced greatly during the late 1950’s, total mortalityremained so high that all previous accumulations of spawning stocks weregone by 1960 and almost no female lake trout survived to maturity in 1960or 1961. The sharp increases in survival and abundance that occurred in thefall of 1961 and in 1962, immediately after the reduction in abundance of sealampreys, while the commercial fishery was still open and the contribution ofplanted lake trout was still minor, clearly indicated that sea lampreys hadbecome a greater source of mortality than the fishery by the 1960’s.
In 1962-70, abundance of lake trout was dependent mainly on theintensity of stocking 3 to 7 years earlier and on the mortality rate of legal-sizefish. The intensive and Increasing rate of stocking in Wisconsin during the1950’s slowed the decline in recruitment in 1959-60 and reversed the declinethere in 1961. Recruitment increased slightly in 1961 and 1962 and sharply in1963, and was maintained at a high level throughout the remainder of the1960’s. Although the natural reproduction of the mid 1960’s made an increas-ing contribution to the total catch of undersize and legal fish in the late1960’s, almost 90% of the legal-size catch was still made up of stocked fish in1970. In Michigan, stocking rates were much lower than in Wisconsin in the1950’s and were not increased substantially until 1960. The decline in recruit-ment was not reversed there until 1965, by which time almost all small nativelake trout were gone (99% of the undersize fish were fin-clipped). Recruit-ment then increased rapidly in 1965-68. In both Wisconsin and Michigan,recruitment of stocked fish was high enough during the middle and late1960’s to increase the abundance of legal-size fish rapidly through 1970.
Although the mid 1961 reduction of sea lamprey abundance resulted Inimmediate reduction of sea lamprey wounding rates and in clearly discernibleincreases in survival of lake trout, recovery of spawning stocks was limitedthrough 1970. The available evidence indicates that increase in the average ageand size of spawners was restricted by high mortality. Even in Wisconsin,where some natural reproduction was reestablished by the fall of 1964(minimum age for maturity of females was VII), relatively few fish survivedpast age IX in 1965-70. Age IX was probably the youngest age at which all ornearly all females were mature, on the basis of the studies of Eschmeyer(1955) and Dryer and King (1968) and our subsequent unpublished datafrom Gull Island Shoal, Wisconsin.
Relative abundance data from several successive year classes in the1965-69 spawning runs at Gull Island Shoal indicated that total annualmortality from age IX to age X was about 0.75. The tagging study of Rahrer(1968) and subsequent tagging and returns from this population (unpublished)indicated that the rate of exploitation by commercial and sport fishingcombined was no greater than 0.10 in 1965-70. The instantaneous rate ofnatural mortality, M, derived from the figures above is 1.21. This value of Mfor age IX-X fish in the late 1960’s is much higher than the value Sakagawaand Pycha (1971) found for total mortality of lake trout of the same ages in
30
1948 (Z = .70) when the commercial fishery was operating at far abovenormal intensity and the sea lamprey was still rare in Lake Superior. This highnatural mortality accounts for the scarcity of fish over 33 inches long in thecommercial catches mentioned earlier.
The cause of the high natural mortality has not been positively deter-mined. Circumstantial evidence, however, suggests strongly that sea lampreypredation is a major cause of the mortality of large lake trout. The incidenceof fresh lamprey wounds on lake trout taken during the spawning run on GullIsland Shoal was not high in 1965-70, but the incidence of wounded fish inthe October spawning run perhaps does not reflect the true extent of sealamprey predation. Lamprey wounding rates were invariably highest in thespring (Fig. 8). In addition, wounding rates on large lake trout caught in lateSeptember within a few miles of Gull Island Shoal were much higher thanon the same sizes of fish caught on the spawning reef in mid October. Thelow incidence of both fresh and partially healed wounds on spawning laketrout suggests that a lamprey attack and the resulting wound inhibit the urgeor capacity to spawn, and that feeding adult sea lampreys are rare or absenton the shallow shoals used by spawning lake trout.
High rates of attack in the late 1960’s were apparent, however, from theincidence of healed scars. In 1969, for example, 5% of 160 spawners25.0-28.9 inches long, 83% of 149 fish 29.0-32.9 inches long, and all 26 fish33 inches and longer bore healed scars. Fish in the smallest of these sizegroups bore an average of 0.7 scar per fish and those in the largest groupaveraged 4.2 scars per fish. Back-calculated annual growth increments ofindividual 8- to 10-year-old fish caught in 1970 ranged from 1.3 to 4.0 inchesand averaged 2.5 inches. The time required for lake trout to grow from 27inches (the midpoint of the 25.0- to 28.9-inch interval) to well over 33 incheswas, therefore, 2-4 years. During that time, the average number of scars perfish increased sixfold and the fish over 33 inches long had survived an averageof 3.5 attacks per fish. Although the evidence is clear that some large laketrout can survive several lamprey attacks, the inverse relation between wound-ing and. scarring rates illustrated in an earlier section is evidence that manylake trout must also have succumbed.
Unlike most lake trout in southern Lake Superior, most of the GullIsland Shoal spawners were native rather than stocked fish. Their growthrate in the late 1960’s was somewhat slower at ages VIII-X than that reportedby Rahrer (1967) for lake trout in eastern Lake Superior in 1953. Highmortality and short life span often associated with unusually fast growthshould not apply to this group.
Mortality at ages below IX has not been determined for the Gull IslandShoal fish. Total mortality determinations on several groups of stocked laketrout in Michigan waters, however, indicated that total mortality of fullyvulnerable fish (20 inches and longer) increased with age and size in a manner&nd~ to the increase in sea lamprey wounding wi th s ize . Tota l mor ta l i ty a tage IX was as high as or higher than that for the Gull Island Shoal spawners.As with the Gull Island Shoal fish, no other major cause of mortality wasapparent.. Rate of exploitation from the assessment and sport fisheriescombined, estimated from tag returns, was only about 0.10. Changes in thefishery in prior years could not account for the inordinately high mortality of
31
the older, larger fish. Assessment fishing intensity declined during the late1960’s and sport fishing increased. Although the sport catch was estimated tobe several times as large as the assessment catch by 1970 (Asa T. Wright,personal communication), field observations and tag returns indicated that thesize composition of the sport and assessment catches was similar. The totalestimated catch from sport and assessment fishing increased almost directly inproportion to the relative abundance of legal-sized fish. Fishing mortality rate,therefore, probably changed little in 1965-70; only the apportionment amongusers changed.
Spawning stocks were limited both by increasing mortality with sizeamong the larger immature fish, which reduced recruitment of spawners, andby very high mortality within the spawning stocks. Fishing mortalityaccounted for only a small part of the total mortality, and natural mortalityappeared to be nearly as high on the native stocks of Gull Island Shoal as onstocks of planted fish. Differences in mortality and maximum size of fish inthe assessment catches were generally associated with sea lamprey woundingrates. Although the evidence linking sea lamprey wounding to this highmortality is largely circumstantial, the consistency of the relation betweenlamprey wounding rates and mortality, the inverse relation between lampreywounding and scarring rates, and the lack of evidence of any other source ofhigh mortality of lake trout leads us to conclude that sea lamprey predationwas a major factor and probably the principal factor limiting abundance andsize of lake trout spawners in 1962-70.
The progressive increase in survival of 21- to 24-inch lake trout in themiddle and late 1960’s was probably a result of reduction of sea lampreypredation on fish of that size. Abundance of legal-size lake trout almosttripled in Wisconsin and increased sixfold in Michigan (Table 6) whileabundance of sea lampreys declined somewhat in 1965-70 (Table 2). Theresultant reduction of the predator-prey ratio and the preference of sealampreys for larger prey resulted in an upward shift in the size of lake troutattacked by lampreys and lower mortality of the small legal-size fish. Sincefishing mortality appears to have changed little in 1965-70, this increase insurvival was probably unrelated to fishing.
The relative importance of the various factors that affected theabundance and size composition of lake trout can, at present, be onlyqualitatively estimated. The combination of limitations on fishing effort, sealamprey control, and stocking, however, clearly resulted in roughly a tenfoldincrease in numerical abundance of legal-size fish and in a substantial increasein the average size of lake trout in 1961-70. Insufficient natural reproductionto sustain the population was the main weakness in an otherwise strongrecovery of the population. We believe that predation by sea lampreys was amajor factor limiting abundance and size of mature lake trout in the late1960’s. Further reduction of sea lamprey abundance should increaseabundance of lake trout spawning stocks. Since the population was composedmainly of hatchery-reared fish by 1970, other unknown or ill-definedproblems induced by hatchery rearing or stocking could also have affected thepopulation.
Recent observations, for instance, indicate that relatively few lake troutthat were stocked along the mainland shore used the native lake trout
32
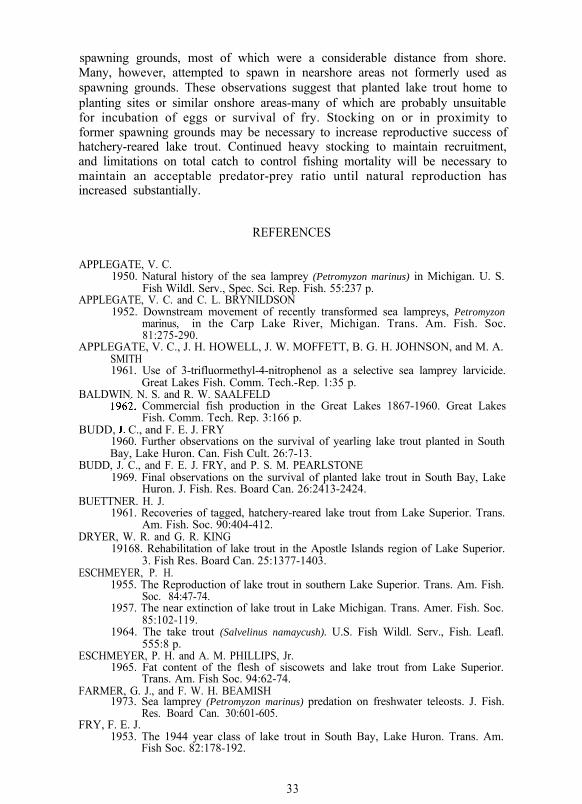
spawning grounds, most of which were a considerable distance from shore.Many, however, attempted to spawn in nearshore areas not formerly used asspawning grounds. These observations suggest that planted lake trout home toplanting sites or similar onshore areas-many of which are probably unsuitablefor incubation of eggs or survival of fry. Stocking on or in proximity toformer spawning grounds may be necessary to increase reproductive success ofhatchery-reared lake trout. Continued heavy stocking to maintain recruitment,and limitations on total catch to control fishing mortality will be necessary tomaintain an acceptable predator-prey ratio until natural reproduction hasincreased substantially.
REFERENCES
APPLEGATE, V. C.1950. Natural history of the sea lamprey (Petromyzon marinus) in Michigan. U. S.
Fish Wildl. Serv., Spec. Sci. Rep. Fish. 55:237 p.APPLEGATE, V. C. and C. L. BRYNILDSON
1952. Downstream movement of recently transformed sea lampreys, Petromyzonmarinus, in the Carp Lake River, Michigan. Trans. Am. Fish. Soc.81:275-290.
APPLEGATE, V. C., J. H. HOWELL, J. W. MOFFETT, B. G. H. JOHNSON, and M. A.SMITH1961. Use of 3-trifluormethyl-4-nitrophenol as a selective sea lamprey larvicide.
Great Lakes Fish. Comm. Tech.-Rep. 1:35 p.BALDWIN. N. S. and R. W. SAALFELD
196i. Commercial fish production in the Great Lakes 1867-1960. Great LakesFish. Comm. Tech. Rep. 3:166 p.
BUDD, 3. C., and F. E. J. FRY1960. Further observations on the survival of yearling lake trout planted in SouthBay, Lake Huron. Can. Fish Cult. 26:7-13.
BUDD, J. C., and F. E. J. FRY, and P. S. M. PEARLSTONE1969. Final observations on the survival of planted lake trout in South Bay, Lake
Huron. J. Fish. Res. Board Can. 26:2413-2424.BUETTNER. H. J.
1961. Recoveries of tagged, hatchery-reared lake trout from Lake Superior. Trans.Am. Fish. Soc. 90:404-412.
DRYER, W. R. and G. R. KING19168. Rehabilitation of lake trout in the Apostle Islands region of Lake Superior.
3. Fish Res. Board Can. 25:1377-1403.ESCHMEYER, P. H.
1955. The Reproduction of lake trout in southern Lake Superior. Trans. Am. Fish.Soc. 84:47-74.
1957. The near extinction of lake trout in Lake Michigan. Trans. Amer. Fish. Soc.85:102-119.
1964. The take trout (Salvelinus namaycush). U.S. Fish Wildl. Serv., Fish. Leafl.555:8 p.
ESCHMEYER, P. H. and A. M. PHILLIPS, Jr.1965. Fat content of the flesh of siscowets and lake trout from Lake Superior.
Trans. Am. Fish Soc. 94:62-74.FARMER, G. J., and F. W. H. BEAMISH
1973. Sea lamprey (Petromyzon marinus) predation on freshwater teleosts. J. Fish.Res. Board Can. 30:601-605.
FRY, F. E. J.1953. The 1944 year class of lake trout in South Bay, Lake Huron. Trans. Am.
Fish Soc. 82:178-192.
33
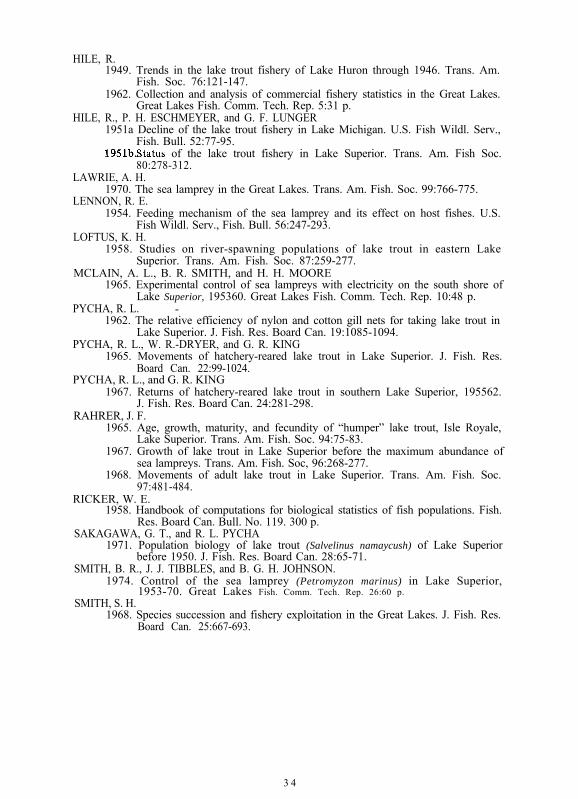
HILE, R.1949. Trends in the lake trout fishery of Lake Huron through 1946. Trans. Am.
Fish. Soc. 76:121-147.1962. Collection and analysis of commercial fishery statistics in the Great Lakes.
Great Lakes Fish. Comm. Tech. Rep. 5:31 p.HILE, R., P. H. ESCHMEYER, and G. F. LUNGER
1951a Decline of the lake trout fishery in Lake Michigan. U.S. Fish Wildl. Serv.,Fish. Bull. 52:77-95.
195lbStatus of the lake trout fishery in Lake Superior. Trans. Am. Fish Soc.80:278-312.
LAWRIE, A. H.1970. The sea lamprey in the Great Lakes. Trans. Am. Fish. Soc. 99:766-775.
LENNON, R. E.1954. Feeding mechanism of the sea lamprey and its effect on host fishes. U.S.
Fish Wildl. Serv., Fish. Bull. 56:247-293.LOFTUS, K. H.
1958. Studies on river-spawning populations of lake trout in eastern LakeSuperior. Trans. Am. Fish. Soc. 87:259-277.
MCLAIN, A. L., B. R. SMITH, and H. H. MOORE1965. Experimental control of sea lampreys with electricity on the south shore of
Lake Superior, 195360. Great Lakes Fish. Comm. Tech. Rep. 10:48 p.-PYCHA, R. L.
1962. The relative efficiency of nylon and cotton gill nets for taking lake trout inLake Superior. J. Fish. Res. Board Can. 19:1085-1094.
PYCHA, R. L., W. R.-DRYER, and G. R. KING1965. Movements of hatchery-reared lake trout in Lake Superior. J. Fish. Res.
Board Can. 22:99-1024.PYCHA, R. L., and G. R. KING
1967. Returns of hatchery-reared lake trout in southern Lake Superior, 195562.J. Fish. Res. Board Can. 24:281-298.
RAHRER, J. F.1965. Age, growth, maturity, and fecundity of “humper” lake trout, Isle Royale,
Lake Superior. Trans. Am. Fish. Soc. 94:75-83.1967. Growth of lake trout in Lake Superior before the maximum abundance of
sea lampreys. Trans. Am. Fish. Soc, 96:268-277.1968. Movements of adult lake trout in Lake Superior. Trans. Am. Fish. Soc.
97:481-484.RICKER, W. E.
1958. Handbook of computations for biological statistics of fish populations. Fish.Res. Board Can. Bull. No. 119. 300 p.
SAKAGAWA, G. T., and R. L. PYCHA1971. Population biology of lake trout (Salvelinus namaycush) of Lake Superior
before 1950. J. Fish. Res. Board Can. 28:65-71.SMITH, B. R., J. J. TIBBLES, and B. G. H. JOHNSON.
1974. Control of the sea lamprey (Petromyzon marinus) in Lake Superior,1953-70. Great Lakes Fish. Comm. Tech. Rep. 26:60 p.
SMITH, S. H.1968. Species succession and fishery exploitation in the Great Lakes. J. Fish. Res.
Board Can. 25:667-693.
3 4
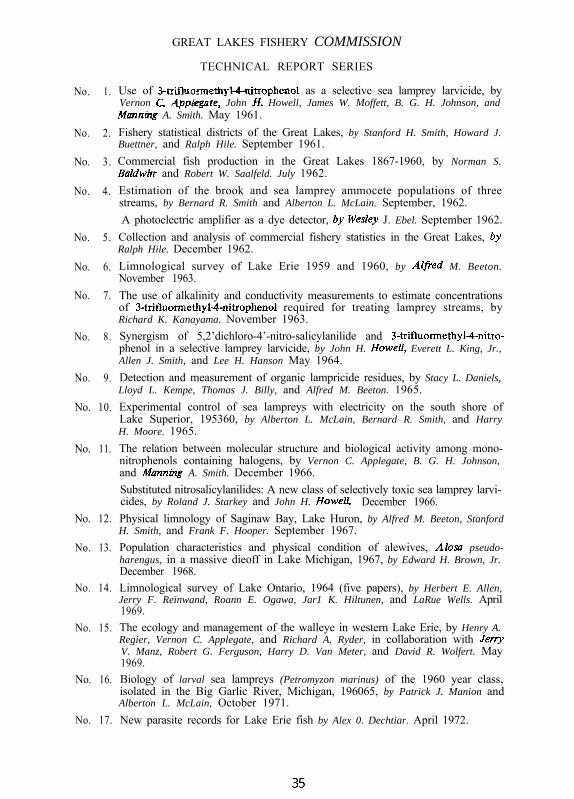
GREAT LAKES FISHERY COMMISSION
TECHNICAL REPORT SERIES
Use of %rifIuormeth+4-nitrophenol as a selective sea lamprey larvicide, byVernon C App&ate, John If. Howell, James W. Moffett, B. G. H. Johnson, andManntig A. Smith. May 1961.
Fishery statistical districts of the Great Lakes, by Stanford H. Smith, Howard J.Buettner, and Ralph Hile. September 1961.
Commercial fish production in the Great Lakes 1867-1960, by Norman S.BaMwin and Robert W. Saalfeld. July 1962.
Estimation of the brook and sea lamprey ammocete populations of threestreams, by Bernard R. Smith and Alberton L. McLain. September, 1962.
A photoelectric amplifier as a dye detector, Zry WesZey J. Ebel. September 1962.
Collection and analysis of commercial fishery statistics in the Great Lakes, 6yRalph Hile. December 1962.
Limnological survey of Lake Erie 1959 and 1960, by Alfled M. Beeton.November 1963.
The use of alkalinity and conductivity measurements to estimate concentrationsof :&trifluormethyl+nitrophenol required for treating lamprey streams, byRichard K. Kanayama. November 1963.
Synergism of 5,2’dichloro-4’-nitro-salicylanilide and 3-trifluormethyWnitro-phenol in a selective lamprey larvicide, by John H. Howe& Everett L. King, Jr.,Allen J. Smith, and Lee H. Hanson May 1964.
Detection and measurement of organic lampricide residues, by Stacy L. Daniels,Lloyd L. Kempe, Thomas J. Billy, and Alfred M. Beeton. 1965.
Experimental control of sea lampreys with electricity on the south shore ofLake Superior, 195360, by Alberton L. McLain, Bernard R. Smith, and HarryH. Moore. 1965.
The relation between molecular structure and biological activity among mono-nitrophenols containing halogens, by Vernon C. Applegate, B. G. H. Johnson,and Marming A. Smith. December 1966.
Substituted nitrosalicylanilides: A new class of selectively toxic sea lamprey larvi-cides, by Roland J. Starkey and John H. HoweN. December 1966.
Physical limnology of Saginaw Bay, Lake Huron, by Alfred M. Beeton, StanfordH. Smith, and Frank F. Hooper. September 1967.
Population characteristics and physical condition of alewives, Rlovl pseudo-harengus, in a massive dieoff in Lake Michigan, 1967, by Edward H. Brown, Jr.December 1968.
Limnological survey of Lake Ontario, 1964 (five papers), by Herbert E. Allen,Jerry F. Reinwand, Roann E. Ogawa, Jar1 K. Hiltunen, and LaRue Wells. April1969.
The ecology and management of the walleye in western Lake Erie, by Henry A.Regier, Vernon C. Applegate, and Richard A. Ryder, in collaboration with JertyV. Manz, Robert G. Ferguson, Harry D. Van Meter, and David R. Wolfert. May1969.Biology of larval sea lampreys (Petromyzon marinus) of the 1960 year class,isolated in the Big Garlic River, Michigan, 196065, by Patrick J. Manion andAlberton L. McLain, October 1971.
New parasite records for Lake Erie fish by Alex 0. Dechtiar. April 1972.
No. 1.
No. 2.
No. 3.
No. 4.
No. 5.
No. 6.
No. 7.
No. 8.
No. 9.
No. 10.
No. 11.
No. 12.
No. 13.
No. 14.
No. 15.
No. 16.
No. 17.
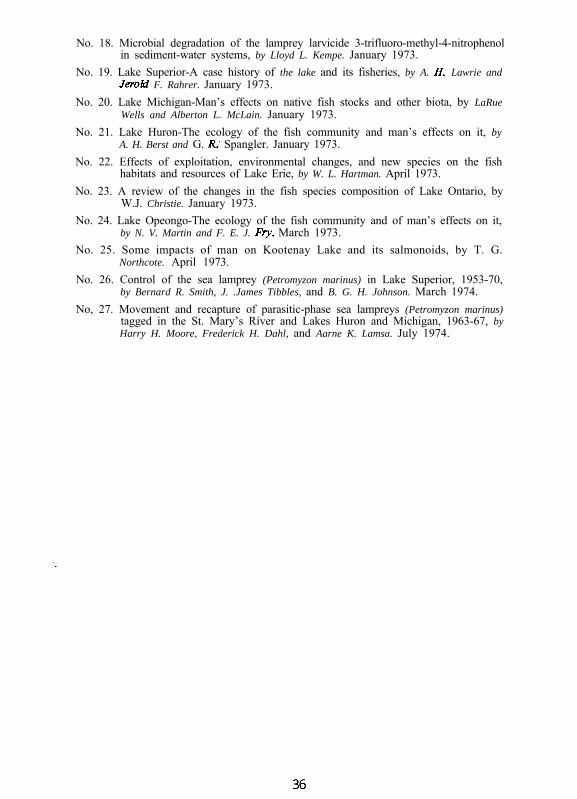
No. 18. Microbial degradation of the lamprey larvicide 3-trifluoro-methyl-4-nitrophenolin sediment-water systems, by Lloyd L. Kempe. January 1973.
No. 19. Lake Superior-A case history of the lake and its fisheries, by A. H: Lawrie andJerokl F. Rahrer. January 1973.
No. 20. Lake Michigan-Man’s effects on native fish stocks and other biota, by LaRueWells and Alberton L. McLain. January 1973.
No. 21. Lake Huron-The ecology of the fish community and man’s effects on it, byA. H. Berst and G. R; Spangler. January 1973.
No. 22. Effects of exploitation, environmental changes, and new species on the fishhabitats and resources of Lake Erie, by W. L. Hartman. April 1973.
No. 23. A review of the changes in the fish species composition of Lake Ontario, byW.J. Christie. January 1973.
No. 24. Lake Opeongo-The ecology of the fish community and of man’s effects on it,by N. V. Martin and F. E. J. l+y. March 1973.
No. 25. Some impacts of man on Kootenay Lake and its salmonoids, by T. G.Northcote. April 1973.
No. 26. Control of the sea lamprey (Petromyzon marinus) in Lake Superior, 1953-70,by Bernard R. Smith, J. .James Tibbles, and B. G. H. Johnson. March 1974.
No, 27. Movement and recapture of parasitic-phase sea lampreys (Petromyzon marinus)tagged in the St. Mary’s River and Lakes Huron and Michigan, 1963-67, byHarry H. Moore, Frederick H. Dahl, and Aarne K. Lamsa. July 1974.