Embed Size (px)
Citation preview

Rüdiger Voss, Myron A. Peck, Jörn O. Schmidt, Hans‐Harald Hinrichsen
Sustainable Fisheries
Kiel University: Sustainable Fishery
Rüdiger Voss, Hans‐Harald Hinrichsen, Jörn O. Schmidt
& Martin F. Quaas

General global warming trendSince mid‐80s accelerated to ca. 0.4°C / decade
Motivation
Also obvious in the Baltic
GB surface
GB vertical mean
Are there spatial / seasonal differences?
How are fish early life stages affected?

3‐D hydrodynamic modelPeriod 1979‐2005Resolution 5x5 km, 42 vertical levelsForced by real wind field & river runoffValidated against field data
Methods
Data analysed • ¼ ICES rectangle (15x15 nm)• Monthly basis• 10 m depth strata

Methods
Year
1980 1985 1990 1995 2000 2005
Tem
pera
ture
(°C
)
3.5
4.0
4.5
5.0
5.5
6.0
6.5e.g. August, 60‐70m depth
For each cell/month/depth stratum: linear regression

Methods
For each cell/month/depth stratum: linear regressionYear
1980 1985 1990 1995 2000 2005
Tem
pera
ture
(°C
)
3.5
4.0
4.5
5.0
5.5
6.0
6.5e.g. August, 60‐70m depth
‐> slope & significance

Cod eggs
Sprat eggs
Cod larvae
Sprat larvae
Fish early life stages:Baltic Sea is highly stratified
Concentrationon depth
strataand month, which are relevant for cod & sprat ELHS
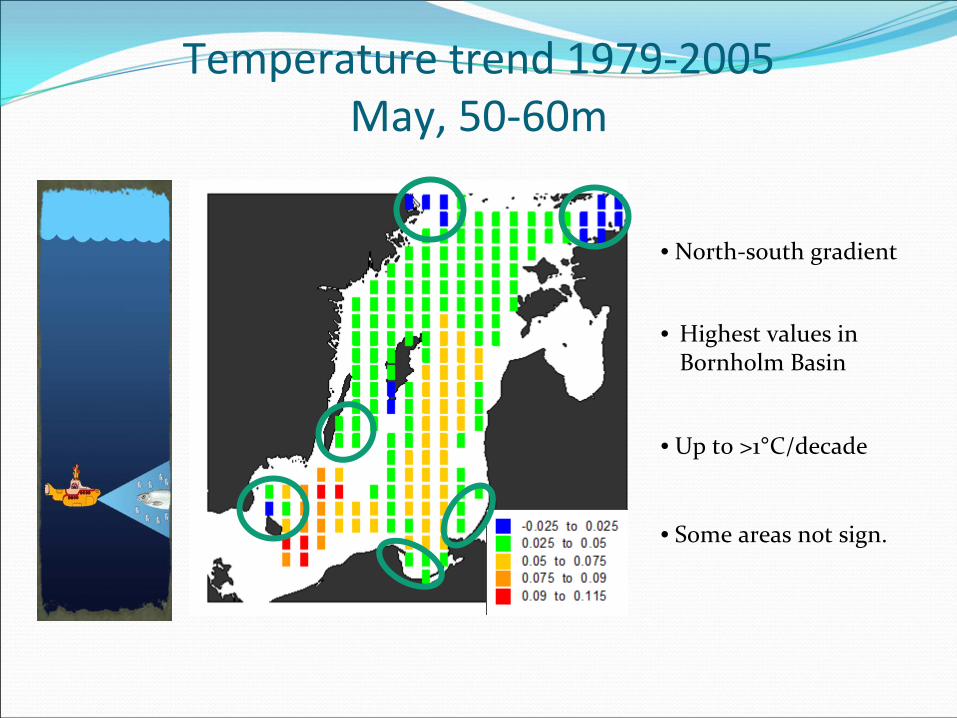
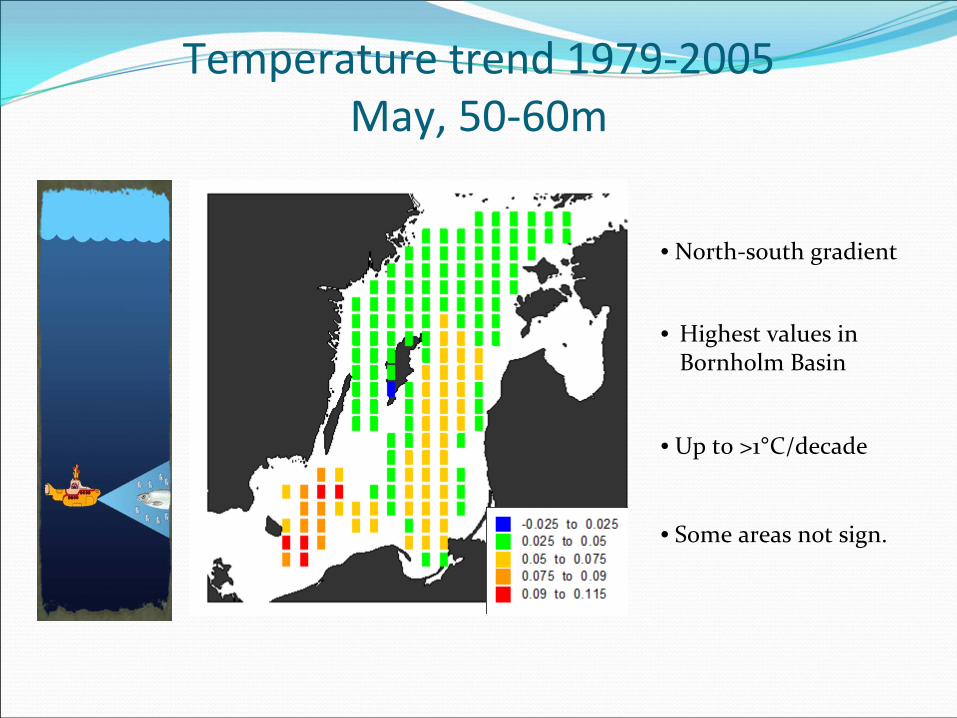
Temperature trend 1979‐2005 May, 50‐60m
• North‐south gradient
• Highest values in
Bornholm Basin
• Up to >1°C/decade
• Some areas not sign.
• North‐south gradient
• Highest values in
Bornholm Basin
• Up to >1°C/decade
• Some areas not sign.
Temperature trend 1979‐2005 May, 50‐60m

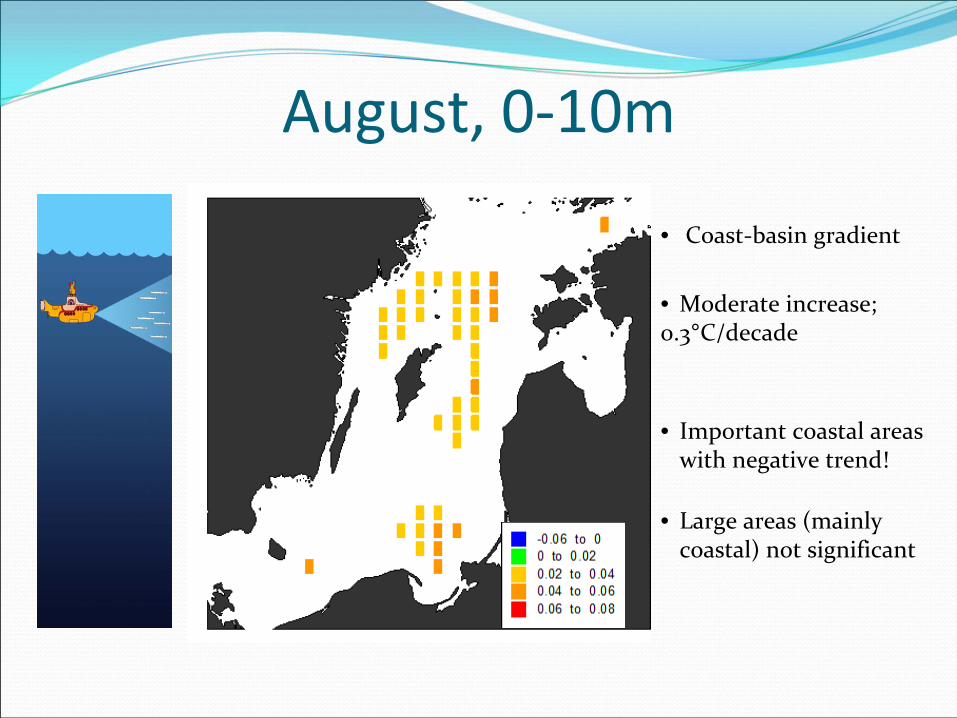
• Coast‐basin gradient
• Moderate increase;0.3°C/decade
• Large areas (mainly
coastal) not significant
• Important coastal areas
with negative trend!
August, 0‐10m
• Coast‐basin gradient
• Moderate increase;0.3°C/decade
• Large areas (mainly
coastal) not significant
• Important coastal areas
with negative trend!
August, 0‐10m

Sprat Recruitment variability
Life stage Important factors
Predation Temp.
Food Temp.Turbulence
Food Temp.Drift
Fishery Temp.

• Example: Sprat management
• Economic‐ecological model
• Age‐structured (8 age‐classes)
• Harvest costs independant of stock size
• Constant price
• Maximise biomass yield (no discounting)
Impact of climate change & species interaction on optimal management?
• Temp.‐dependant stock‐recruitment functions
• Variable natural predation mortality (M2)
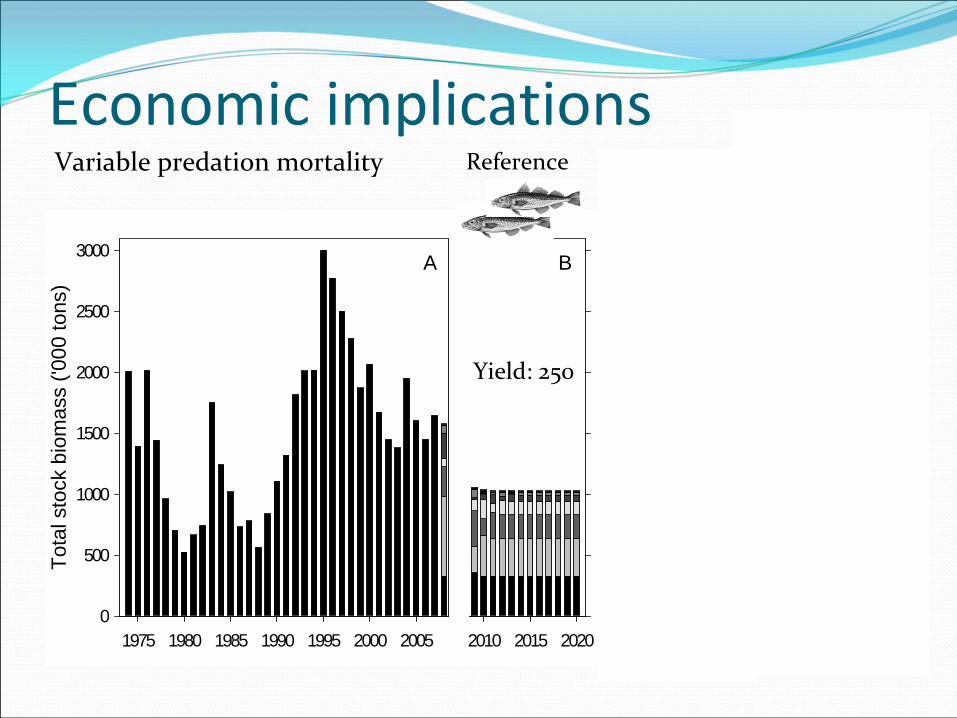
Economic implications

Economic implications
2010 2015 20201975 1980 1985 1990 1995 2000 2005
Tota
l sto
ck b
iom
ass
('000
tons
)
0
500
1000
1500
2000
2500
3000 F
2010 2015 20202010 2015 2020
EBA
Climate change
Yield: 250 Yield: 156 Yield: 406
Reference Low temp. High temp.
2010 2015 20201975 1980 1985 1990 1995 2000 2005
Tota
l sto
ck b
iom
ass
('000
tons
)
0
500
1000
1500
2000
2500
3000 D
2010 2015 20202010 2015 2020
CBA
Economic implicationsVariable predation mortality
Yield: 250 Yield: 310 Yield: 10
Reference Low cod
High cod

Temperature trends are not spatially homogen
Coastal, shallow areas are less predictable, with less
temperature increase
Temperature increase will favour sprat recruitment
Species‐interaction as well as temperature change will
strongly influence optimal fisheries management
Conclusion