Embed Size (px)
Citation preview

Working Paper
HSTP 2021/HCF1
Changes in utilization trends of services at public
hospitals after the launch of Biju Swasthya Kalyan
Yojana & other health initiatives in Odisha.
April 2021
Sudha Chandrasekhar1
Dhananjay Naidu2 1Health Systems Transformation Platform 2Access Health International

2
Contact
Sudha Chandrasekhar | Consultant, HSTP (supported by Tata Trusts) | [email protected]
This document titled ‘Changes in utilization trends of services at public hospitals after the launch of Biju Swasthya Kalyan Yojana & other health initiatives in Odisha’ has been developed by Sudha Chandrasekhar from HSTP in collaboration with Access Health International.
Disclaimer
Health Systems Transformation Platform is a not-for-profit organization registered in the name of Forum for Health Systems Design and Transformation; a company licensed under section 8 of the Indian Companies Act 2013.
Our mission is to enable Indian health systems respond to people’s needs. We do this in collaboration with Indian & Global expertise through research for health systems design, enhancing stakeholders’ capabilities and fostering policy dialogue.
HSTP activities are funded by Sir Ratan Tata Trusts. HSTP is committed to highest standards of ethics and professional integrity in all its endeavours and declares no conflict of interest on account of its funding arrangements. The funders have no role in planning, design, development, and execution of any HSTP activities including organization of meetings/ workshops/ trainings/ research/ publications/ and any other dissemination material developed for the use of health systems stakeholders in India and elsewhere.
The contents of this paper are the sole responsibility of the author, should not be attributed to, and
do not represent the views of HSTP or the funders. All reasonable precautions have been taken by
the author to verify the information contained in this publication. However, the published material is
being distributed without warranty of any kind, either expressed or implied. The responsibility for the
interpretation and use of the material lies with the reader. In no event shall HSTP and its partners be
liable for damages arising from its use.
Acknowledgements
The author is grateful to Rajeev Sadanandan, N Devadasan, Rahul Reddy and Vijayshree Yellappa,
Himani Sethi and Sireesha P for reviewing the manuscript and providing valuable insights.
3
Table of Contents
Abstract 4
1. Introduction 5
2. Health Expenditures 6
2.1 Out of Pocket Expenditures 6
2.2 Estimates of cost of care 6
2.3 Complementary initiatives of the Department of Health, Odisha 7
3.Health care provision in Odisha 8
3.1 Type of provider and specific services 8
3.2 Key health indicators as per National Family Health survey (NFHS-4) 8
4. Methods 10
4.1 Service uptake trends during BSKY scheme launch and implementation in public facilities
10
4.2 OPD and IPD services 10
4.3 Maternal health services 17
4.4 Lab Services 18
4.5 Mortality Data 19
5. Discussion 21
51. Key Insights 21
5.2 Changes in specific services 21
5.3 Reimbursement to Public hospitals 22
5.4 Complementary Governance initiatives 22
6. Conclusion 23
References 24
Annexure 1: NFHS-4 fact sheet of key indicators for Odisha 25
Annexure-2 Districts of Odisha listed Division-wise 28

4
Abstract
Achieving Universal health coverage (UHC) is a defined goal for India and steps are being taken by all
states to move towards this goal. India being diverse each state/Union territory has unique
implementation process to achieve this objective. Some states have gone ahead with an insurance
model, others in an assurance/trust model and few have taken a path of hybrid model. Most of the
states have integrated their state schemes and previous Rashtriya Swasthya Bima Yojana with the
Ayushman Bharat Pradhan Mantri Jan Arogya Yojana (AB PM-JAY). Four states namely Telangana,
Delhi, West Bengal and Odisha have still not joined the national scheme and are implementing and
expanding their own state schemes. Odisha allows government and private facilities to empanel as
service providers. This would require government facilities to be upgraded to compete with private
providers and also provides an additional source of revenue. Odisha has taken significant measures
to improve the public facilities improving services to the people as they are the major providers of
health care in the state. This paper discusses the changing trends in utilization of services from public
facilities after the launch of UHC scheme and other health initiatives
5
1. Introduction
Odisha state has been implementing a universal health coverage scheme Biju Swasthya Kalyan
Yojana (BSKY) since February 2019 for the entire population (estimated to be 4.37 crores), covering
inpatient treatment for specific predefined procedures. The State health assurance society (SHAS),
Department of health and family welfare, is the nodal agency which has converged the existing
schemes like Rashtriya Swasthya Bima Yojana (RSBY), Biju Krushak Kalyan Yojana (BKKY- I, II) and
Odisha State treatment fund (OSTF). RSBY was centrally cosponsored scheme covering BPL
population and unorganized sector, OSTF1 were state run schemes which covered population as
defined by state and BKKY scheme was implemented for farmers2. The scheme is implemented in
an assurance mode (without any premium contribution by the beneficiary or insurance
intermediary, the state assures to cover the beneficiaries for defined conditions as per the scheme
guidelines).
The BSKY scheme has two components: a) Universal Health Care (Free healthcare) to all the people
of Odisha in all the Government health institutions, irrespective of their income status or residence
without paying any charge. b) Annual Cashless health coverage of 5 Lakh per family (Rs.10 Lakh to
women members of family) to 70 lakhs families that belong to the lower socio-economic section of
the society of the State. They can avail the services in both the Government (OP and hospitalization
cover) and empanelled private health institutions (only hospitalization as per the defined packages)
with referral from public facilities.
There are 32 district hospitals, 33 sub-divisional hospitals, 5 medical colleges, 384 Community health
centres (CHCs), 77 First referral units (FRUs), 1375 Primary health centres (PHCs), 6688 Sub-centres
(SCs) and 1616 functional Health and wellness centres in Odisha. The total footfall for OPD care
(2019-20) in above public facilities was 5.46 crore while for IPD care 28.96 lakh people utilized the
services. All public facilities till medical college level in Odisha are deemed empanelled in the
scheme and provide the required services and referral to private empanelled facilities if they do not
have the capacity to provide required treatment to the beneficiaries. Referral system under
insurance/assurance schemes is implemented only in few states effectively ex. Karnataka,
Uttarakhand which has mandatory referral from public facility. Odisha also has implemented
referral system which has helped in increasing public hospital utilization and avoids bypassing of
public system.
1 OSTF provides benefits to in-patient care and critical care benefits to the poor families. Patients belong to the BPL families, having income of 40000 INR in rural and 60000 INR in urban areas or Antyodaya Anna Yojana beneficiaries are mainly benefited by this scheme. 2 There are two streams under BKKY. In stream 1, all eligible farming households get coverage up to 100,000 INR per family per year. Under stream II, all eligible farming households who are RSBY beneficiary get 30,000 coverage from RSBY and another 70,000 is provided by BKKY for meeting expenses of hospitalization or surgical procedure. Antyodaya Anna Yojana (AAY) is a Government of India sponsored scheme to provide highly subsidised food to poor families.

6
2. Health Expenditures
Presently average health expenditure as a percentage of total expenditure for all states is about
5.1% (4.1 -9%). All states except Meghalaya (9%) spends less than the recommended 8% while
Odisha spends about 5.2 % (2019) and as a share of GSDP (Gross state domestic product) is around
1.2-1.3%. The per capita expenditure for health for all states was Rs. 1218 (616-6937) while the
Odisha figures are higher than national average amounting to Rs. 1308.3 As per the national health
accounts statistics total out of pocket expenditure (OOPE) stands at 68.9%.
2.1 Out of Pocket Expenditures
The average out of pocket expenditure for non-hospitalization is about ₹ 547, (₹.534 -in case of
Urban and -₹ 550- Rural) while for in-patients it was found to be ₹. 12,295 (₹ 5,283-public to
₹30,947-private) as per the NSSO, 75th round. The NSSO data showed an OOPE for normal delivery in
public hospitals as₹ 2700 while private it was ₹15,445. NFHS-4 estimates of OOPE for delivery in
public facility was ₹ 4,225 (Rural-4125, Urban-4900) as against the national average of Rs. 3,198.
The main component of this expenditure is medicines and diagnostics as shown in Table-1,
especially in the public facilities. The launch of the free drugs (Niramaya) and diagnostics (Nidaan)
scheme is hoped to address this issue and its impact may be seen in the subsequent rounds of the
surveys. The average OOPE for surgery-related hospitalization in another study in Odisha (2016) was
₹ 3081 (1859–4304) and was ₹ 1814 (1625–2003) for nonsurgical conditions. The mean OOPE on
surgery was approximately 1.7 times more than the nonsurgical conditions6.
2.2 Estimates of cost of care
Further a recent costing study to estimate costs of providing secondary care in public facilities
ranged from ₹134 (104–160) for an outpatient consultation to ₹3833 (2668–5839) for institutional
delivery at Community health centre level. Similarly, at DH level, the unit cost varied from ₹183
(124–248) for an outpatient consultation in an orthopaedics department to ₹4764 (3268–6960) for
an operation7. Reduction of out-of-pocket expenditure and improving access to care to the people of
Odisha is the main objective of launching of BSKY scheme.
Table-1: Break up of OOPE by type of health care provider (%)
Type of facility
Package component*
Doctors/ surgeon fee
Medicines Diagnostics tests
Bed charges
others Total
Public-R 2.2 2.3 68.3 18.5 1 7.7 100
Private-R 36.3 16.1 22.3 8.8 12.3 4.2 100
Public-U 26.5 1.3 43.9 17.1 2 9.2 100
Private-U 31.6 22.7 23.4 9 8.9 4.4 100
* Package component includes costs like OT charges, consumables, oxygen, blood, nursing services
3 Report of the fifteenth finance commission, Oct 2020, https://fincomindia.nic.in

7
The state has evolved a different method of financing public hospitals in the light of launch of BSKY
scheme. The empanelled private providers are paid/ reimbursed for services through package rates
whereas government hospitals receive bulk payments indexed on a few parameters. with specified
line items and an additional sum to adjust for abolition of user fees after launch of BKSY. The user
fee adjustment is calculated using historical figures for user fees collected. Apart from the regular
budget provided to the institution, the user fees, collected during the preceding year, is reviewed
and based on In-patient (IP) and Out-patient (OP) data of the hospital they are reimbursed In case
the hospital treats more patients than the preceding year, additional grants are paid on request.
2.3 Complementary initiatives of the Department of Health, Odisha
The state along with planning for the BSKY scheme launch strengthened effective implementation
of central cosponsored schemes also like the free drugs (Niramaya scheme) and free diagnostics
(Nidaan) scheme and also initiated free dialysis scheme (Sahay) in a public-private partnership (PPP)
mode to improve access to drugs, diagnostics and dialysis in public hospitals. Niramaya scheme
supports 593 types of quality essential free drugs including high cost drugs to treat conditions like
cancer, diabetes, hypertension, psychiatric ailments, medical consumables including for surgeries
etc., for all patients attending public facilities.
The state government has launched free dialysis service (Sahay scheme) to all patients in the public
health facilities from January 1, 2018 to benefit about 50,000 patients annually. Initially dialysis
machines are installed in PPP mode at 25 district headquarters hospitals and one community health
centre at Narasinghpur in Cuttack district. The state government has made required budgetary
provision over five years to provide free diagnostic and free dialysis services in the state. Additional
services in urban clinics (Ama clinics) including fixed day specialists services in Obstetrics and
gynaecology, Paediatrics, Medicine and Geriatrics, Eye-care, Physiotherapy and Psychiatric services
have been initiated. Urban population over 45 lakhs in 27 towns will benefit from the scheme. Under
Ama Clinic, the packages of services will be rendered in the regular OPD timings at 85 UPHCs in 27
cities in a phased manner. The Nirmal scheme to support sanitation, security, laundry and lift
services has provided impetus in both maintaining hygiene and attempted to reduce hospital
acquired infections along with intent to improve patient satisfaction while accessing health care
services in the public sector1. These precursor and complementary initiatives of the state
government would be an enabler to further increase uptake of services in public sector with the
subsequent launch of the BSKY scheme.2

8
3. Health care provision in Odisha
State specific Report of National sample survey organization (NSSO)3, 75th round and National Health
Family Survey (NFHS-IV)4 have provided key insights.
3.1 Type of provider and specific services
Healthcare provision has been more public sector focussed in Odisha mainly due to the limited
presence of private facilities across the state except for few urban pockets. The proportion of people
who reported ailing in the last 15 days was 9.2% (R-8.7; U-11.7) for Odisha which is higher compared
to all India average of 7.5%. The in-patient hospitalization cases per 1000 persons was 33 (All India-
29). As per the NSSO (2017) findings4, public facilities are the main source of medical care in Odisha.
Public hospitals utilization is to an extent of 56.8% under out-patient care and 72.2% for in-patient
care in Odisha (Table-2). The private clinics are also an important source of out-patient health care
contributing 31.7%. Allopathy is the predominant system of medicine in Odisha (95.3%) followed by
Ayush system (4.4%).
Table- 2: OPD and In-Patient services utilization in Odisha by type of health care provider
Healthcare service provider Out-patient care In-Patient care
Rural Urban Total Rural Urban Total
Government/public hospital 55.2 62.3 56.8 75.1 55.5 72.2
Charitable/trust/NGO-run
hospital 0.2 0 0.1 1 0.3
0.9
Private hospital 5 12.6 6.7 23.9 44.2 26.9
Private doctor/ in private clinic 33.6 24.9 31.7 NA NA NA
Informal health care provider 6 0.2 4.7 NA NA NA
Total 100 100 100 100 100 100
*(NSS0) 75th round
3.2 Key health indicators as per National Family Health survey (NFHS-4)
The National Family health survey (NFHS-4), 2015-16 provides information on population, Health
and nutrition for India and each state/Union territory and this round for the first time provides
district-level estimates for many important indicators. Odisha has seen key improvements especially
in areas of institutional delivery, utilization of public health facilities for institutional delivery,
antenatal and post-natal care, full immunization coverage, reduction in anaemia and reduction in
IMR (25-point decline by reducing IMR from 65 (NFHS-3) to 40 (NFHS-4) and U5 Mortality rate
(Annexure-1). 62% have had at least four antenatal care (ANC) visits during their last
4 National sample survey organization (NSS0), 75th round covered about 390 villages and 143 urban blocks consisting of 4,264 households with 19,078 persons surveyed.

9
pregnancy, against national average of 51.2%, which has been substantially increased from 36.9% in
NFHS-3. About 64 percent received antenatal care in the first trimester of pregnancy.
Institutional delivery rates have substantially increased from 35.6 to 85.4% in the State of Odisha
which is better than national average of 78.9%, of which 75.9% institutional deliveries have been
conducted in public health facilities. This is a 47.1%-point increase in Institutional births in public
facilities from 28.8% in 2005-06 to 75.9% in 2015-16 much above the all-India average of 52.1 %.
Non-communicable disease especially Diabetes is much higher than the national average while
hypertension is almost similar to national figures but regarding cancer screening indicators Odisha
has performed below the national values. In terms of the risk factors for the usage of tobacco and
alcohol Odisha has fared higher compared to all India figure and a lower percentage of them have
tried to modify the risk factor by their attempts to quit its usage.
Hence this paper is an attempt to review the change in utilization of public sector services overtime
with the pre-BSKY launch period (April-Sep 2018-Y1Q1 & Y1Q2), launch phase (Oct 2018-Mar 2019-
Y1Q3 & Y1Q4) and Post-launch (April 2019-Mar 2020 Y2Q1, Q2, Q3, Q4) of the BSKY scheme in
Odisha. The different scenarios of change in utilization of both outpatient and in-patient services
(increases/decreases/remains the same) has been presented in Box-1. Our hypothesis is that both
outpatient (OP) and in-patient (IP) services would increase due to the launch of BSKY and other
initiatives and would provide key learnings to scaling up increased public facilities participation in
providing care to achieve UHC.
Box 1: Different scenarios of change in utilization trends
Government sector
OP increased OP decreased OP same
IP increased Possible cause could be that the patients are coming to the public facilities and are happy with the services there and so continue in the public services
Possible cause is that the patients enter into the public facility through emergency dept and then continue with the public facility because they are satisfied with the services.
Due to removal of user fees and procedures covered under BSKY IP increased but OP same
IP decreased Possible cause could be that the patient comes to the OP dept in the govt facility and then gets a referral slip and goes to the private sector for admission
Possible cause is that the patients enter into the public facility through emergency and then take a referral slip to the private sector for admission
Patients are going directly to the private sector – bypassing the government facilities
IP same This could be due to persistent same constraints of human resources and capacity for in-patient treatment, but OP services improve due to free drugs and diagnostics
Due to low participation of private sector the IP remains the same in public facilities
No effect of BSKY on utilisation of government facilities
10
4. Methods
This analysis is based on multiple data sources that are publicly available as follows:
• Secondary data of service utilization from public facilities was sourced form Health
management information system. The data period for Health management information system
(HMIS)5 data considered is from April 2018 to March 2020 which is split into specific time
period in relation to the BSKY scheme launch. HMIS is the main source of data for this analysis,
which provides both district level and state level consolidated data of different parameters
both OP and IP data, routine monitoring indicators, certain disease specific data that has been
considered. A sub-set of data which is related to in-patient hospitalization, diagnostics,
maternal and Child health services and mortality data has been considered for more in-depth
analysis. The trends, variation district-wise based on the time-periods of interest to our study
are presented.
• Claims data district wise during specified data period of the Biju Swasthya Kalyan Yojana has
been considered to assess any major shift of care from public to private hospitals.
• Contextual data of complementary initiatives has been sourced from publicly available
information in health department websites, National health mission Odisha official sites, press
releases/statements and those available in the public domain. Excel and SPSS software has
been used for analysis.
In this paper, we tried to analyze the routinely available data which provides useful insights to
policy makers but rarely looked into in detail most of the times. We have also attempted to see in
what areas the public hospital utilization has shown changes post launch of the Biju Swasthya
Kalyan Yojana and other major initiatives of the health department.
4.1 Service uptake trends during BSKY scheme launch and implementation in public facilities
To assess the change in trends of few key services, data from the HMIS was reviewed by splitting the
time-period of services into selective quarters. The break-up was done quarter-wise for the financial
years April 2018 to March 2020. The results are presented as year 1 (2018-19) quarter1 and 2 before
announcement of BSKY and quarter 3 and 4 post announcement of BSKY till actual roll out as year 2
(2019-20). The implementation phase is the 4 quarters of year 2. This would give us an idea as to
what services improved in public facilities and which ones did not have any significant change.
Further if any services reduced in public facilities that would give us a chance to explore if these
were the main treatments that were claimed by private empaneled facilities under BSKY.
4.2 OPD and IPD services
The OPD and IPD services were reviewed division wise and presented in Table- 3 & 4. The districts
corresponding to the divisions are presented in Annexure -2. The service uptake in the OPD showed
a clear increase of 18.5% from Y1Q3 (considered as baseline) in year 2 with reaching a peak
performance of 84,52,261 (47.5% people accessing services) in central division in Y2Q2. The increase
in northern division was 46,74,609 (7.3%) and southern division was 45,23,491 (7%) from baseline
OPD services.

11
Table – 3: Out-patient services trend in Public hospital
Region Y1 Q2* Y1Q3 Y1Q4 Y2Q1 Y2Q2 Y2Q3 Y2Q4
Central Division
(HQ-Cuttack) 49,64,354 78,15,176 71,74,884 72,50,293 84,52,261 82,31,311 81,31,919
Northern Division
(HQ-Sambalpur) 26,93,776 36,01,817 37,85,575 36,42,461 46,74,609 42,85,625 42,63,703
Southern Division
(HQ – Berhampur) 25,80,424 34,94,211 36,61,556 37,83,538 45,23,491 43,87,583 43,96,260
Total 1,02,38,554 1,49,11,204 1,46,22,015 1,46,76,292 1,76,50,361 1,69,04,519 1,67,91,882
*first year Quarter 2 details are only for 2 months.
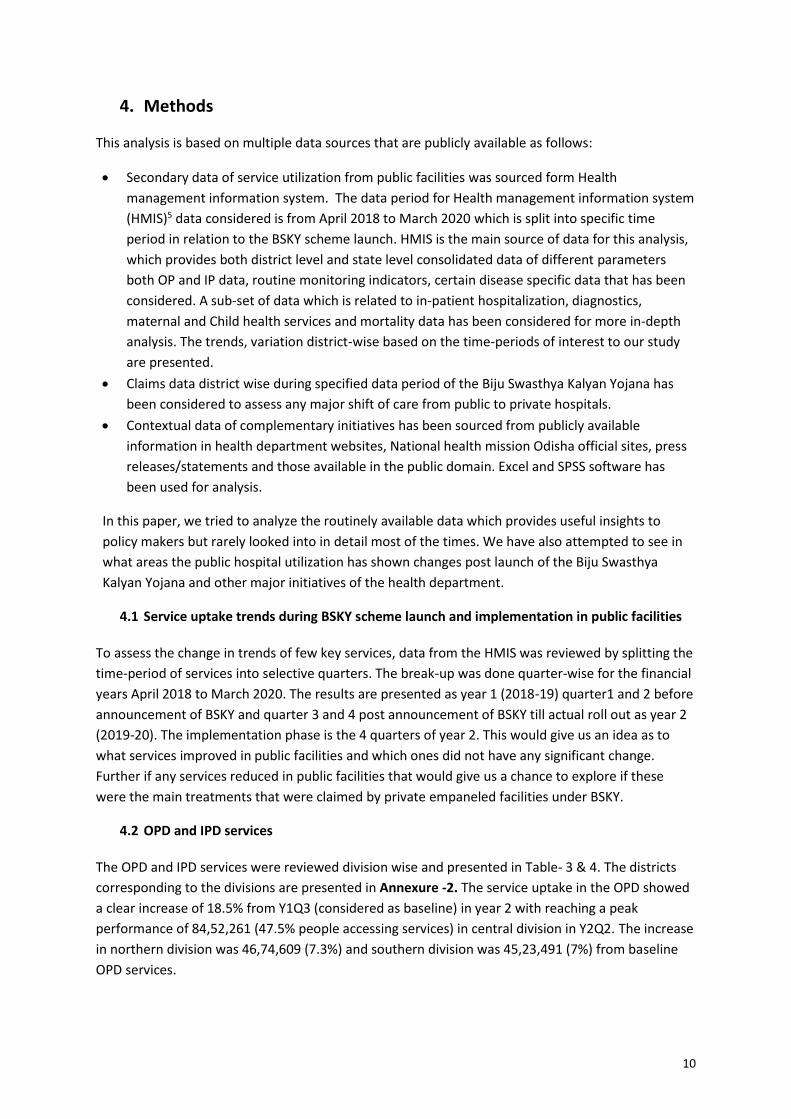
Fig 1: In-patient services trend in Public hospitals SERVICES
Analysis of data over the two years for inpatient admissions in public hospitals, 33% of cases are
recorded as adult inpatient treatments and 42% are recorded as emergency admissions. There has
been a slight increase in overall in-patient admissions from 27.1 lakh (Y1) to 30.3 lakh (Y2) with the
change mainly in emergency admissions category in Y2 (31%) from 31.08 lakh to 40.66 lakh as shown
in Fig 1. The other categories reported in the HMIS for admissions due to infection, procedures and
general have remained almost the same in Y1 and Y2 suggesting there is not much shift of these
procedures from public hospitals to private hospitals.
In 2017-18 total OPD recorded in Odisha was 5.22 crores, whereas we can see an increase of around
26% with a recorded OPD of 6.60 crore for the year 2019-20. Similarly, the adult inpatient
admissions (IPD) recoded in the year 2017-18 was 28.66 lakhs but 2019-20 has shown a slight
increase of 6% with IPD admissions of 30.39 lakhs.
35.2
5
40.3
17.8
1.7
32.1
4.8
43
18.5
1.7
1217
3128
23
0
10
20
30
40
50
Adult inpatienttreatment
Inpatient infection Emergencyadmissions
Procedures-admissions
General
IPD cases analysis in %
Year 1 % Year 2 % % change (Y2-Y1)*100/Y1

12
Table- 4: Emergency admissions cases by specific conditions
Total cases in public hospitals %
Emergency admissions Year 1 year 2 Total %
Patients registered at Emergency
Department 28,03,245 36,48,826 64,52,071 90
Emergency - Trauma (accident, injury,
poisoning etc.,) 2,03,084 3,21,090 5,24,174 7.3
Emergency - CVA (Cerebro-vascular
Disease) 40,175 21,460 61,635 0.8
Emergency - Obstetrics complications 26,235 31,150 57,385 0.8
Emergency - Snake Bite 15,563 19,399 34,962 0.5
Emergency - Acute Cardiac Emergencies 9,658 9,484 19,142 0.3
Emergency - Burn 6,809 7,915 14,724 0.2
Total 31,04,769 40,59,324 71,64,093 100
In case of emergency admissions 90% of the cases were not classified by specific conditions while
7.3% of the cases was recorded as trauma including poisoning followed by cerebrovascular disease
(0.9%), obstetric complications (0.8%), snake bite (0.5%), acute cardiac emergencies (0.3%) and burn
cases (0.2%). The reporting formats could be improved to capture adequate information and make it
mandatory to specify the conditions.
When we cross-check the service uptake under BSKY which registered around 41,118 claims during
the period and in Public hospitals during the roll-out phase, it is clearly seen that in districts where
the private sector presence is limited, the public sector continues to dominate as the main provider
even with the launch of BSKY scheme. In districts where there is significant presence of private
hospitals there is a small dip in utilization in public hospitals. This mainly suggests that where BSKY
has removed the constraints of financing people prefer private hospitals. Especially in districts like
Cuttack (29 empaneled hospitals), Khorda (27), Ganjam (14), Bhadrak (12), Puri (9). Table 5A. The
admissions per 1000 population is shown in Table 5B which clearly highlights the increased
hospitalization per 1000 population across the districts with an overall hospitalization rate of
90.82/1000 population which is significantly higher than 33/1000 as per NSSO 75th round.
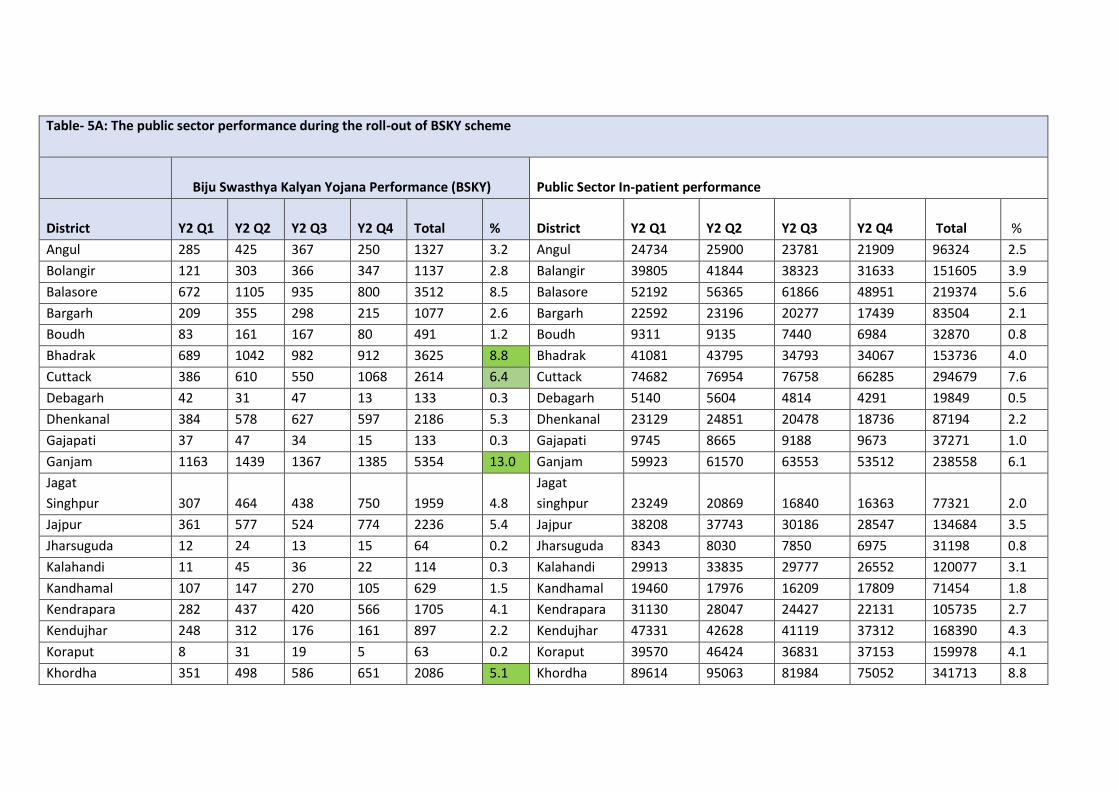
Table- 5A: The public sector performance during the roll-out of BSKY scheme
Biju Swasthya Kalyan Yojana Performance (BSKY) Public Sector In-patient performance
District Y2 Q1 Y2 Q2 Y2 Q3 Y2 Q4 Total % District Y2 Q1 Y2 Q2 Y2 Q3 Y2 Q4 Total %
Angul 285 425 367 250 1327 3.2 Angul 24734 25900 23781 21909 96324 2.5
Bolangir 121 303 366 347 1137 2.8 Balangir 39805 41844 38323 31633 151605 3.9
Balasore 672 1105 935 800 3512 8.5 Balasore 52192 56365 61866 48951 219374 5.6
Bargarh 209 355 298 215 1077 2.6 Bargarh 22592 23196 20277 17439 83504 2.1
Boudh 83 161 167 80 491 1.2 Boudh 9311 9135 7440 6984 32870 0.8
Bhadrak 689 1042 982 912 3625 8.8 Bhadrak 41081 43795 34793 34067 153736 4.0
Cuttack 386 610 550 1068 2614 6.4 Cuttack 74682 76954 76758 66285 294679 7.6
Debagarh 42 31 47 13 133 0.3 Debagarh 5140 5604 4814 4291 19849 0.5
Dhenkanal 384 578 627 597 2186 5.3 Dhenkanal 23129 24851 20478 18736 87194 2.2
Gajapati 37 47 34 15 133 0.3 Gajapati 9745 8665 9188 9673 37271 1.0
Ganjam 1163 1439 1367 1385 5354 13.0 Ganjam 59923 61570 63553 53512 238558 6.1
Jagat
Singhpur 307 464 438 750 1959 4.8
Jagat
singhpur 23249 20869 16840 16363 77321 2.0
Jajpur 361 577 524 774 2236 5.4 Jajpur 38208 37743 30186 28547 134684 3.5
Jharsuguda 12 24 13 15 64 0.2 Jharsuguda 8343 8030 7850 6975 31198 0.8
Kalahandi 11 45 36 22 114 0.3 Kalahandi 29913 33835 29777 26552 120077 3.1
Kandhamal 107 147 270 105 629 1.5 Kandhamal 19460 17976 16209 17809 71454 1.8
Kendrapara 282 437 420 566 1705 4.1 Kendrapara 31130 28047 24427 22131 105735 2.7
Kendujhar 248 312 176 161 897 2.2 Kendujhar 47331 42628 41119 37312 168390 4.3
Koraput 8 31 19 5 63 0.2 Koraput 39570 46424 36831 37153 159978 4.1
Khordha 351 498 586 651 2086 5.1 Khordha 89614 95063 81984 75052 341713 8.8

14
Table- 5A: The public sector performance during the roll-out of BSKY scheme (continued)
Biju Swasthya Kalyan Yojana Performance (BSKY) Public Sector In-patient performance
District Y2 Q1 Y2 Q2 Y2 Q3 Y2 Q4 Total % District Y2 Q1 Y2 Q2 Y2 Q3 Y2 Q4 Total %
Malkangiri 10 9 8 5 32 0.1 Malkangiri 17999 17400 17181 17125 69705 1.8
Mayurbhanj 149 238 192 132 711 1.7 Mayurbhanj 95927 101999 92439 77449 367814 9.5
Nabarangpur 10 55 28 9 102 0.2
Nabaran
gpur 22305 33442 22866 22407 101020 2.6
Nayagarh 344 369 418 249 1380 3.4 Nayagarh 53284 20695 16781 16495 107255 2.8
Nuapada 3 13 39 19 74 0.2 Nuapada 13415 14370 12637 11212 51634 1.3
Puri 476 763 588 541 2368 5.8 Puri 40289 37510 30123 28313 136235 3.5
Rayagada 21 16 27 40 104 0.3 Rayagada 21033 21673 20996 21622 85324 2.2
Sambalpur 131 139 99 133 502 1.2 Sambalpur 36250 43092 41504 37669 158515 4.1
Subaranapur 111 208 242 130 691 1.7 Subarnapur 11763 11207 8967 8717 40654 1.0
Sundargarh 368 263 277 161 1069 2.6 Sundargarh 35195 40170 36191 31566 143122 3.7
Grand Total 7415 11295 11700 10708 41118 100 Grand Total 1036612 1050052 946179 853949 3886792 100

15
Table- 5B: The public sector performance during the roll-out of BSKY Scheme per 1000 population
Biju Swasthya Kalyan Yojana Performance (BSKY) Public Sector In-patient performance
District Population Admission/1000 Utilization 2019-20 % District Population Admission /1000 Utilization 2019-20 %
Angul 1273821 1.04 1327 3.2 Angul 1273821 75.61 96324 2.5
Bolangir 1648997 0.69 1137 2.8 Balangir 1648997 91.94 151605 3.9
Balasore 2320529 1.51 3512 8.5 Balasore 2320529 94.54 219374 5.6
Bargarh 1481255 0.73 1077 2.6 Bargarh 1481255 56.37 83504 2.1
Boudh 441162 1.11 491 1.2 Boudh 441162 74.51 32870 0.8
Bhadrak 1506337 2.41 3625 8.8 Bhadrak 1506337 102.06 153736 4
Cuttack 2624470 1.00 2614 6.4 Cuttack 2624470 112.28 294679 7.6
Debagarh 312520 0.43 133 0.3 Debagarh 312520 63.51 19849 0.5
Dhenkanal 1192811 1.83 2186 5.3 Dhenkanal 1192811 73.10 87194 2.2
Gajapati 577817 0.23 133 0.3 Gajapati 577817 64.50 37271 1
Ganjam 3529031 1.52 5354 13 Ganjam 3529031 67.60 238558 6.1
Jagatsinghpur 1136971 1.72 1959 4.8 Jagat singhpur 1136971 68.01 77321 2
Jajpur 1827192 1.22 2236 5.4 Jajpur 1827192 73.71 134684 3.5
Jharsuguda 579505 0.11 64 0.2 Jharsuguda 579505 53.84 31198 0.8
Kalahandi 1576869 0.07 114 0.3 Kalahandi 1576869 76.15 120077 3.1
Kandhamal 733110 0.86 629 1.5 Kandhamal 733110 97.47 71454 1.8
Kendrapara 1440361 1.18 1705 4.1 Kendrapara 1440361 73.41 105735 2.7
Kendujhar 1801733 0.50 897 2.2 Kendujhar 1801733 93.46 168390 4.3
Koraput 2251673 0.03 63 0.2 Koraput 2251673 71.05 159978 4.1
Khordha 1379647 1.51 2086 5.1 Khordha 1379647 247.68 341713 8.8

16
Table- 5B: The public sector performance during the roll-out of BSKY Scheme per 1000 population (continued)
Biju Swasthya Kalyan Yojana Performance (BSKY) Public Sector In-patient performance
District Population Admission/1000 Utilization 2019-20 % District Population Admission /1000 Utilization 2019-20 %
Malkangiri 613192 0.05 32 0.1 Malkangiri 613192 113.68 69705 1.8
Mayurbhanj 2519738 0.28 711 1.7 Mayurbhanj 2519738 145.97 367814 9.5
Nabarangpur 1220946 0.08 102 0.2 Nabarangpur 1220946 82.74 101020 2.6
Nayagarh 962789 1.43 1380 3.4 Nayagarh 962789 111.40 107255 2.8
Nuapada 610382 0.12 74 0.2 Nuapada 610382 84.59 51634 1.3
Puri 1698730 1.39 2368 5.8 Puri 1698730 80.20 136235 3.5
Rayagada 967911 0.11 104 0.3 Rayagada 967911 88.15 85324 2.2
Sambalpur 1041099 0.48 502 1.2 Sambalpur 1041099 152.26 158515 4.1
Subaranapur 610183 1.13 691 1.7 Subarnapur 610183 66.63 40654 1
Sundargarh 2093437 0.51 1069 2.6 Sundargarh 2093437 68.37 143122 3.7
Grand Total 0.8 41118 100 Grand Total 90.82 3886792 100

4.3 Maternal health services
There has been a significant drop of 43% in home deliveries attended by non-trained birth attendant from Y1 to Y2. The number of institutional deliveries in
public hospitals has been consistent with a slight increase of total caesarian sections by 0.5% and an 8% increase in caesarian section performed during
night times. The normal deliveries have reduced by about 5% which could indicate a small shift to private hospitals under the BSKY scheme. Abortions
(spontaneous) show an increase of about 8% which needs to be looked into further to analyze the causes and take suitable measures
Table 6: Key Maternal Health Indicators
Category Procedure Y1Q1 Y1Q2 Y1Q3 Y1Q4 Total
year 1 Y2Q1 Y2Q2 Y2Q3 Y2Q4
Total
year 2 Variance %
Home deliveries
Number of Home
Deliveries attended by
Non-Trained Birth
Attendant (TBA)
/Relatives/etc.)
4943 4648 3924 3282 16797 3021 2490 2265 1794 9570 -43
Number of Home
Deliveries attended by
TBA (Doctor/Nurse/ANM)
1867 2017 2174 2200 8258 2051 1903 1963 1917 7834 -5
Institutional
deliveries
C-sections, performed at
night (8 PM- 8 AM) 3965 4386 4201 4113 16665 4713 4468 4752 4012 17945 8
Total C -Section deliveries
performed 18664 18685 19682 18648 75679 19696 19479 19410 17451 76036 0.5
Normal deliveries 107461 106682 120105 103502 437750 103678 100519 114924 97636 416757 -5
Abortions Abortion (spontaneous) 11497 11104 9918 10834 43353 12248 11912 10831 11733 46724 8
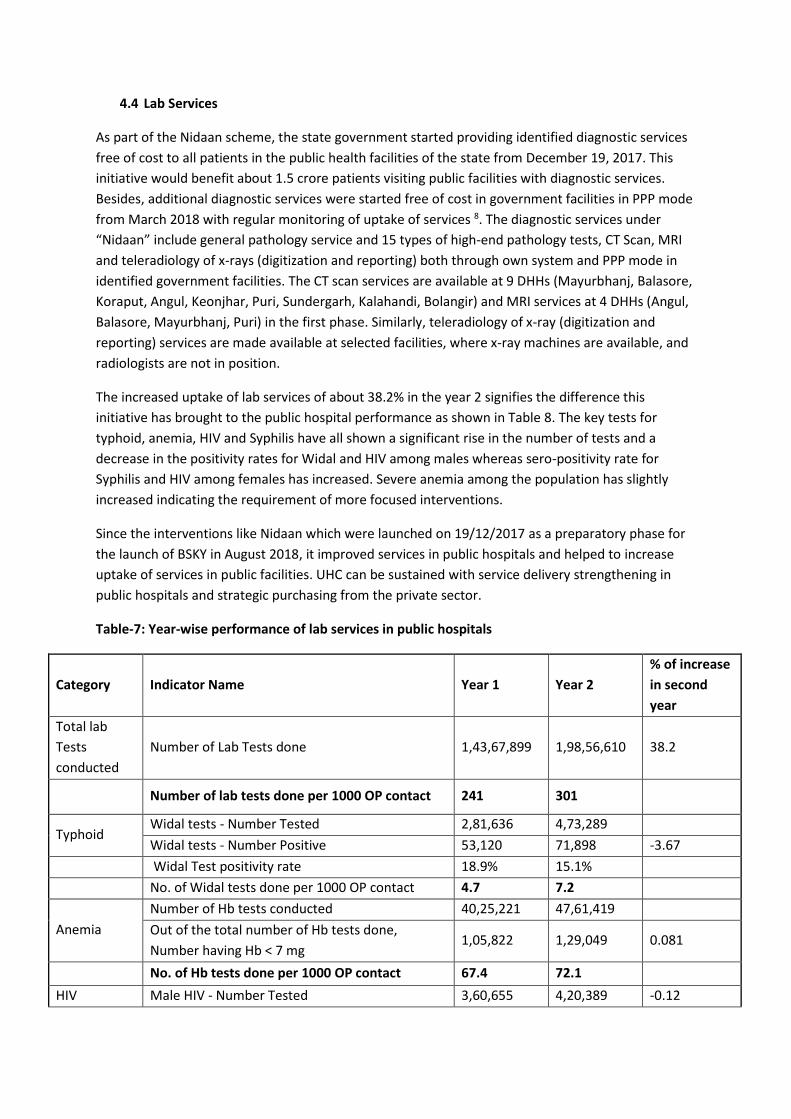
4.4 Lab Services
As part of the Nidaan scheme, the state government started providing identified diagnostic services
free of cost to all patients in the public health facilities of the state from December 19, 2017. This
initiative would benefit about 1.5 crore patients visiting public facilities with diagnostic services.
Besides, additional diagnostic services were started free of cost in government facilities in PPP mode
from March 2018 with regular monitoring of uptake of services 8. The diagnostic services under
“Nidaan” include general pathology service and 15 types of high-end pathology tests, CT Scan, MRI
and teleradiology of x-rays (digitization and reporting) both through own system and PPP mode in
identified government facilities. The CT scan services are available at 9 DHHs (Mayurbhanj, Balasore,
Koraput, Angul, Keonjhar, Puri, Sundergarh, Kalahandi, Bolangir) and MRI services at 4 DHHs (Angul,
Balasore, Mayurbhanj, Puri) in the first phase. Similarly, teleradiology of x-ray (digitization and
reporting) services are made available at selected facilities, where x-ray machines are available, and
radiologists are not in position.
The increased uptake of lab services of about 38.2% in the year 2 signifies the difference this
initiative has brought to the public hospital performance as shown in Table 8. The key tests for
typhoid, anemia, HIV and Syphilis have all shown a significant rise in the number of tests and a
decrease in the positivity rates for Widal and HIV among males whereas sero-positivity rate for
Syphilis and HIV among females has increased. Severe anemia among the population has slightly
increased indicating the requirement of more focused interventions.
Since the interventions like Nidaan which were launched on 19/12/2017 as a preparatory phase for
the launch of BSKY in August 2018, it improved services in public hospitals and helped to increase
uptake of services in public facilities. UHC can be sustained with service delivery strengthening in
public hospitals and strategic purchasing from the private sector.
Table-7: Year-wise performance of lab services in public hospitals
Category Indicator Name Year 1 Year 2
% of increase
in second
year
Total lab
Tests
conducted
Number of Lab Tests done 1,43,67,899 1,98,56,610 38.2
Number of lab tests done per 1000 OP contact 241 301
Typhoid Widal tests - Number Tested 2,81,636 4,73,289
Widal tests - Number Positive 53,120 71,898 -3.67
Widal Test positivity rate 18.9% 15.1%
No. of Widal tests done per 1000 OP contact 4.7 7.2
Anemia
Number of Hb tests conducted 40,25,221 47,61,419
Out of the total number of Hb tests done,
Number having Hb < 7 mg 1,05,822 1,29,049 0.081
No. of Hb tests done per 1000 OP contact 67.4 72.1
HIV Male HIV - Number Tested 3,60,655 4,20,389 -0.12

19
No. of male HIV test done per 1000 OP contact 6 6.3
Male HIV - Number Positive 2,190 2,046
Female HIV - Number Tested 7,62,303 8,46,142 0.04
No. of female HIV test done per 1000 OP contact 12.7 12.8
Female HIV - Number Positive 1,302 1,821
Syphilis
Number of Male STI/RTI attendees tested for
syphilis 38,041 65,104
Number of Male STI/RTI attendees tested for
syphilis per 1000 OP contact 0.6 1
Number of Male STI/RTI attendees found sero-
positive for syphilis 269 2075 2.48
Number of Female (Non-ANC) STI/RTI attendees
tested for syphilis 34,764 63,652
Number of Female (Non-ANC) STI/RTI attendees
tested for syphilis per 1000 OP contact 0.6 1
Number of Female (Non-ANC) STI/RTI attendees
found sero Positive for syphilis 72 4,116 6.25
4.5 Mortality Data
Mortality is a powerful indicator of health care outcome. An analysis of mortality trends can provide
useful insights to policy makers if captured regularly and completely. An average of 68% of deaths
are recorded as adult/Adolescent deaths. The infant deaths, child deaths and maternal deaths have
shown a gradual decline over the quarters to a lower rate at the end of Y2Q4 as seen in Table- 10A.
Table 8A: Mortality trends by age group and specific categories
Indicator Code Y1Q1 Y1Q2 Y1Q3 Y1Q4 Y2Q1 Y2Q2 Y2Q3 Y2Q4
Adolescent and Adult deaths 37,043 42,659 47,959 47,377 38,618 45,132 47,104 48,407
Infant deaths 3,027 3,637 3,523 2,961 2,697 3,276 3,503 3,247
Child death 490 583 517 405 431 538 537 384
Maternal death 173 212 195 130 224 173 191 147
Sterilization death (men and Woman) 0 2 0 0 0 1 0 0
Total 40.735 47,096 52,197 50,879 41,975 49,125 51,340 52,188
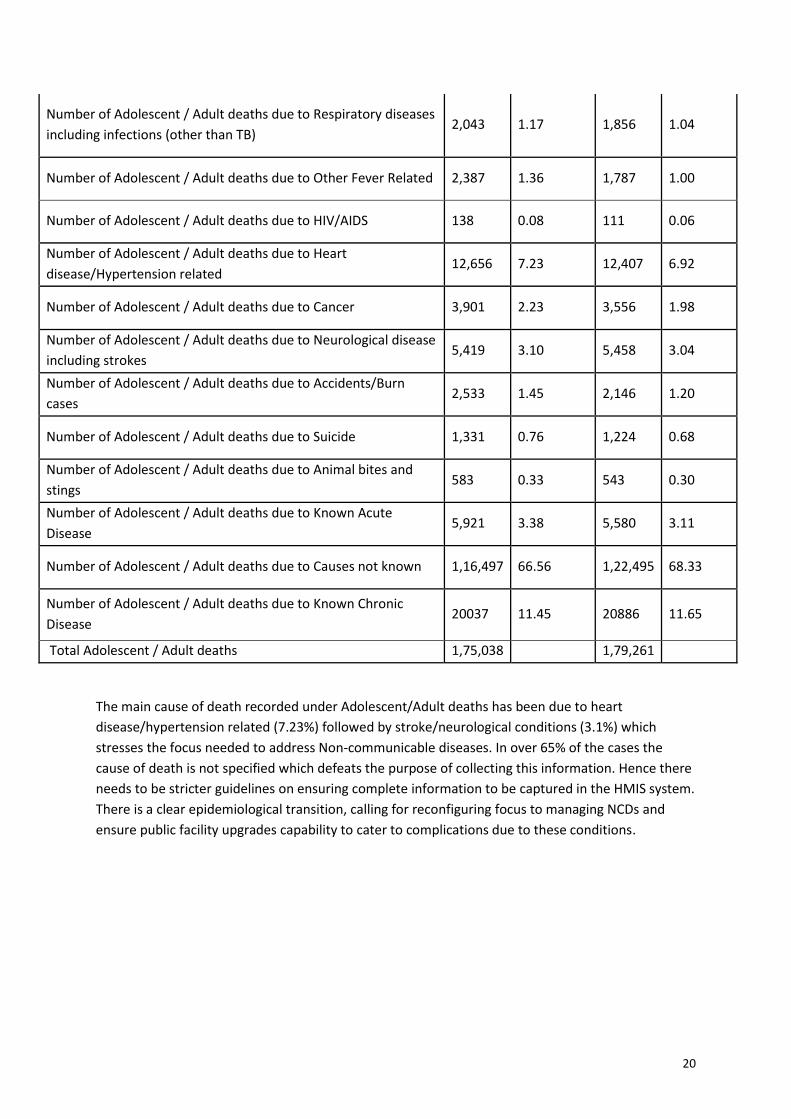
Table-8B: Classification of Adolescent/Adult death due to specific causes
Indicator Name Year 1 Year 1 (%) Year 2 Year 2 %
Number of Adolescent / Adult deaths due to Diarrheal diseases 331 0.19 209 0.12
Number of Adolescent / Adult deaths due to Tuberculosis 1,261 0.72 1,003 0.56
20
Number of Adolescent / Adult deaths due to Respiratory diseases
including infections (other than TB) 2,043 1.17 1,856 1.04
Number of Adolescent / Adult deaths due to Other Fever Related 2,387 1.36 1,787 1.00
Number of Adolescent / Adult deaths due to HIV/AIDS 138 0.08 111 0.06
Number of Adolescent / Adult deaths due to Heart
disease/Hypertension related 12,656 7.23 12,407 6.92
Number of Adolescent / Adult deaths due to Cancer 3,901 2.23 3,556 1.98
Number of Adolescent / Adult deaths due to Neurological disease
including strokes 5,419 3.10 5,458 3.04
Number of Adolescent / Adult deaths due to Accidents/Burn
cases 2,533 1.45 2,146 1.20
Number of Adolescent / Adult deaths due to Suicide 1,331 0.76 1,224 0.68
Number of Adolescent / Adult deaths due to Animal bites and
stings 583 0.33 543 0.30
Number of Adolescent / Adult deaths due to Known Acute
Disease 5,921 3.38 5,580 3.11
Number of Adolescent / Adult deaths due to Causes not known 1,16,497 66.56 1,22,495 68.33
Number of Adolescent / Adult deaths due to Known Chronic
Disease 20037 11.45 20886 11.65
Total Adolescent / Adult deaths 1,75,038 1,79,261
The main cause of death recorded under Adolescent/Adult deaths has been due to heart
disease/hypertension related (7.23%) followed by stroke/neurological conditions (3.1%) which
stresses the focus needed to address Non-communicable diseases. In over 65% of the cases the
cause of death is not specified which defeats the purpose of collecting this information. Hence there
needs to be stricter guidelines on ensuring complete information to be captured in the HMIS system.
There is a clear epidemiological transition, calling for reconfiguring focus to managing NCDs and
ensure public facility upgrades capability to cater to complications due to these conditions.

21
5. Discussion
5.1 Key insights
This analysis has shown positive changes in public sector utilization that may be due to the launch of
BSKY scheme and other supportive initiatives. The availability of free drugs and diagnostics might
have improved the uptake of both OPD, lab services and IPD services in public hospitals. The
medicines and diagnostics which are the key contributor of out-of-pocket expenditure to patients in
public hospitals8 has prompted the strengthening of schemes to make them available and free to the
people in public hospitals.
The impact of these intervention may be visible in the next round of NSSO survey. It is well known
that OOPE especially catastrophic expenditure (>10% of household income) can push people to
poverty9. The poverty gap induced by health payments in Odisha was found to be 4.4%10.
Biju Swasthya Kalyan Yojana that was launched in 2018 provide free in-patient services in
empaneled hospitals through referral from public hospitals since Feb 2019. This has not made any
major shift in the uptake of services by public hospitals especially the in-patient services except a
small reduction in utilization in few districts where there is significant presence of private hospitals.
It has mainly broadened the access to services that are not available/long waiting times in public
hospitals by providing care to eligible beneficiaries in the private sector.
5.2 Changes in specific services
The HMIS analysis has shown that Non-communicable disease burden and mortality are significant
and focused interventions are required especially for chronic diseases, heart conditions,
hypertension related ailments, neurological conditions including stroke and others. The emergency
admissions which are mainly due to trauma (7.3%) has shown a major increase. The high sera-
positivity rate for syphilis underlines the need for population based or opportunistic screening for
syphilis and partner notification.
The Maternal and child health services have shown a positive trend with a significant decrease in
home deliveries (43%) and sustained numbers of institutional deliveries and family planning services.
The state still has a significant challenge especially in reducing the Maternal Mortality rate and
Neonatal mortality rate which are quite high compared to the national average. Caesarean section
rates (13.8%) are comparatively lower than the national average of 17.2% which needs to be
explored whether increasing access to emergency obstetric care could help in reducing maternal
mortality as complications doing delivery is the key factor in maternal mortality. Over 80 per cent of
maternal deaths in India, as elsewhere in the world, are due to six causes: hemorrhage; Eclampsia
(an acute and life-threatening complication of pregnancy) obstructed labor sepsis (blood poisoning)
complications arising out of unsafe abortions and pre-existing conditions such as anemia and
malaria5. Since for all these conditions above mentioned packages are available under BSKY and can
5 WHO 2012 ICD-10 categorization of cause of death versus unweighted distribution of maternal deaths in an early report was hemorrhage (38%, n = 526), other(including indirect deaths) (34%, n = 471), sepsis (11%, n = 152), abortion (8%, n = 111), obstructed labour (5%, n = 69, and hypertensive disorders (5%,n = 69) (18) (PDF) Maternal Mortality in India: Causes and Healthcare Service Use Based on Nationally Representative

22
be accessed even through empaneled private hospitals it is hoped that obstetric services for
beneficiaries will be improved with better health outcomes.
The empanelment of private hospitals under BSKY could contribute to providing this additional
access to the poor both in terms of immediate care to the mother and also advanced neonatal care
to the baby which can have a significant impact in reducing both MMR and NMR to some extent in
the state.
5.3 Reimbursement to Public hospitals
All public hospitals till medical college level are deemed empanelled under the scheme. The
beneficiaries availing services in public hospitals and medical colleges are not documented and no
claims are paid for those services, but the hospitals are reimbursed in a different way. User fees,
collected during the preceding year, is reviewed, and based on In-patients (IP) and Out-patient (OP)
data of the hospital they are reimbursed at the rate of 55 Rs. /IP/day (Average admissions per month
preceding year) and 7Rs. /OP (Average OP/day preceding year data). This is meant to help the public
hospitals to invest in improving infrastructure, buying consumables and for any untied expenses to
upgrade the facilities including HR. In case the hospital treats more patients than the preceding year,
additional grants are paid on request. The additional upfront funding provided by the health budget
based on previous year admission under BSKY scheme for public facilities will help the facilities to
plan and purchase the necessary consumables and implants needed. Since this is the first year a
detailed study could be done to understand how these additional funds support received for BSKY
has been utilized. In a recent study conducted to assess the Rogi Kalyan samiti/Hospital
development fund utilization in two districts for the year 2017-18 prior to launch of BSKY it was
found that in Balasore funds have been utilized well (89%) whereas in another district Rayagada it
was only 8%6.
5.4 Complementary Governance initiatives
There have been several initiatives to enhance governance of public sector performance by the
Government. The Odisha Government has also launched the ‘MO SARKAR’-means My Government,
an initiative started in October 2019 to receive feedback regarding Government programs
directly from citizens which is an attempt to improve governance, address citizen concerns and
bring in professionalism in government offices10. The Chief minister and concerned ministers will
interact with about 10 beneficiaries like who have taken service in hospitals, received medicines
or ambulance services, police stations, and enquire about their experience. In case of any
complaints against officials are mentioned these would be investigated in detail and action
against concerned officials will be initiated. ‘5T initiative (Technology, teamwork, transparency,
timelines, transformation)’ is a program to improve governance in all public sector departments.
These efforts complement to support the routine activities of the department and bring in
Survey.https://www.researchgate.net/publication/262046067_Maternal_Mortality_in_India_Causes_and_Healthcare_Service_Use_Based_on_Nationally_Representative_Survey[accessed Mar 28 2021]. 6 Sarit Kumar Rout, Zakhy Khan, Tapsi Mohanty, A study on fiscal transfer mechanism and public health expenditure analysis at district level in Odisha, IIPH Bhubaneshwar, Aug 2020
23
accountability and connect with the people who are intended beneficiaries of the government
programs.
6. Conclusion
This paper has tried to review the public sector utilization in the background of launch of the flagship
Universal Health care Scheme of Odisha, the Biju Swasthya Kalyan Yojana and other initiatives like
free drugs and diagnostics using routinely available HMIS data and national surveys. The intention
was to understand if that has enhanced the uptake of services in public hospitals and any focus areas
the policy makers should consider improving the health care services.
Public sector is the dominant source of health care provision in Odisha. It is seen that Odisha has
made positive strides in some key indicators compared to National averages but there is still a lot of
effort that is needed in certain indicators especially maternal mortality, Neonatal mortality and Non-
communicable diseases like Diabetes, Hypertension. The routinely available data should be captured
completely and mined adequately to derive policy insights and focused efforts.
The BSKY scheme has mainly complemented the provision of hospitalization services by increasing
access to private hospitals in districts with private sector presence and not in all districts uniformly.
Efforts need to be made to engage all private hospitals to participate in the scheme to have much
wider benefits of this scheme. The trends of service uptake in public hospitals needs to be tracked so
that they could be enhanced by providing the necessary infrastructure and human resources to
realize the potential of the Universal health care scheme launched as a flagship program by the
Government. The next round of NSSO data would provide information on whether there has been a
reduction of the out-of-pocket expenditure due to all these efforts.
There is an improvement of government hospital services due to many central and state government
schemes (Nidaan, Free dialysis etc.,) that have improved the quality of services and increased
offtake. But it appears that where private hospitals are available, financial support provided by BSKY,
has led to substituting government hospitals with private hospitals due to preference of private
hospitals by the beneficiaries. This clearly points that strengthening public hospitals is very much
needed to sustain uptake of services through public facilities and avoid shift to private hospitals. The
public hospitals could be made to compete with private hospital for BSKY funds by paying same (Eg;
similar to Ayushman Bharath Pradhan Mantri Jan Arogya Yojana (AB PM-JAY) or reduced package
rates (followed in Karnataka, where public facilities are paid 50% of the package rate along with their
routine facility grants). As per BSKY the public facilities are paid funds based on services provided in
the previous years. This would entail worse off public facilities continue to get lesser amount and
may not lead to any real change in service provision if the current upfront grant mode of financing is
continued.
Hence, we recommend the better and efficient utilization of BSKY funds through RKS for quality
improvement and providing package amount to government hospitals is an essential area for
government to think through and implement.

24
References
1. https://updateodisha.com/2017/12/19/odisha-govt-launches-health-care-services-nidaan-
sahay-ama-clinic-anmol-55269/ accessed, 15th September 2020
2. Healthcare for all, Each life matters, Vision 2025 document, released by Department of
Health and Family Welfare, Government of Odisha, 2018
https://mio.investodisha.gov.in/img/sessions-pdf/HealthVision.pdf,
3. Key indicators of social consumption health- NSS survey, National statistical office, Ministry
of statistics and programme implementation, Government of India, 2017-18
4. National Family Health Survey Fact sheet of Odisha,
http://rchiips.org/NFHS/factsheet_NFHS-4.shtml
5. Health management Information System, Odisha, https://odisha.data.gov.in/dataset-group-
name/hmis
6. Rout SK, Sahu KS, Swain S, Pati S. Out of pocket expenditure on surgical and nonsurgical
conditions in Odisha. J Family Med Prim Care. 2016;5(2):367-372. doi:10.4103/2249-
4863.192377
7. Prinja S, Chauhan AS, Bahuguna P, Selvaraj S, Muraleedharan VR, Sundararaman T. Cost of
Delivering Secondary Healthcare Through the Public Sector in India. Pharmacoecon Open.
2020;4(2):249-261. doi:10.1007/s41669-019-00176-9
8. Rout, S. K., & Choudhury, S. (2018). Does public health system provide adequate financial
risk protection to its clients? Out of pocket expenditure on inpatient care at secondary level
public health institutions: Causes and determinants in an eastern Indian state. The
International Journal of Health Planning and Management, 33(2), e500–e511.
https://doi.org/10.1002/hpm.2490
9. Garg CC, Karan AK. Reducing out-of-pocket expenditures to reduce poverty: a disaggregated
analysis at rural-urban and state level in India. Health Policy Plan. 2009 Mar;24(2):116-28.
doi: 10.1093/heapol/czn046. Epub 2008 Dec 17. PMID: 19095685
10. Bonu, S., Bhushan, I., & Peters, D. H. (2007). Incidence, intensity, and correlates of
catastrophic out-of-pocket health payments in india (ERD Working Paper No. 102). Retrieved
from www.adb.org/economics
11. https://www.thehindu.com/news/national/other-states/mo-sarkar-initiative-
launched/article29577698.ece
25
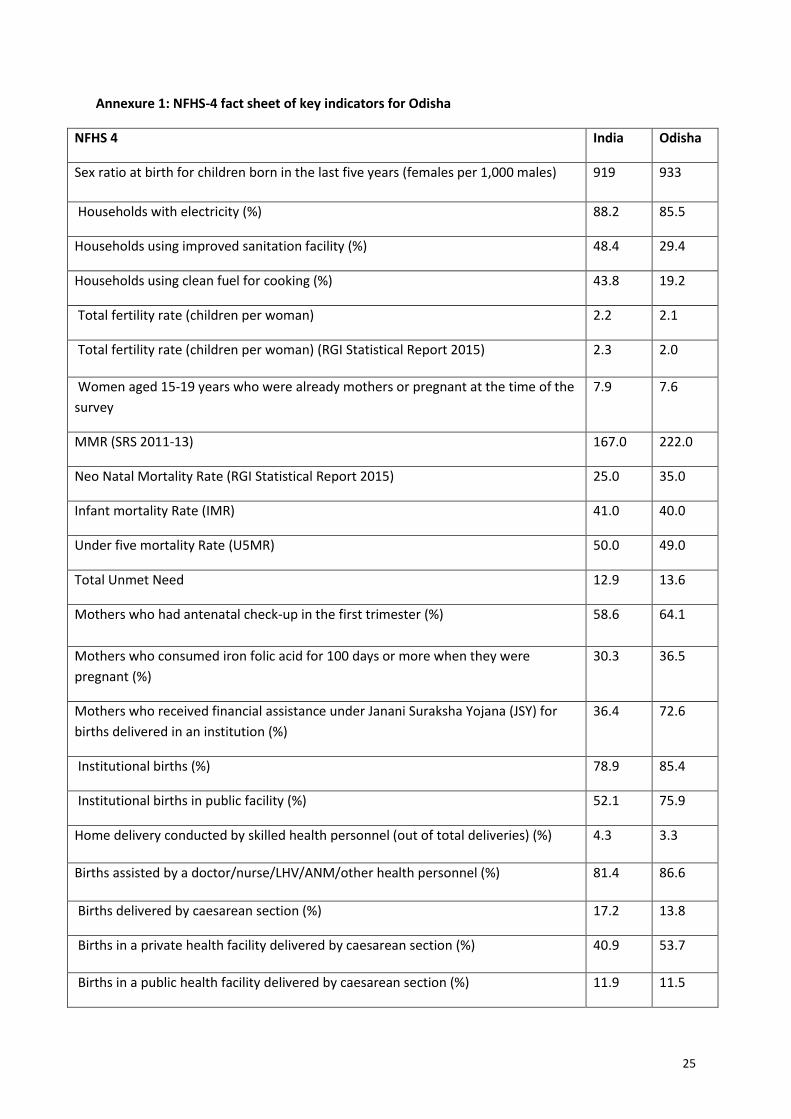
Annexure 1: NFHS-4 fact sheet of key indicators for Odisha
NFHS 4 India Odisha
Sex ratio at birth for children born in the last five years (females per 1,000 males) 919 933
Households with electricity (%) 88.2 85.5
Households using improved sanitation facility (%) 48.4 29.4
Households using clean fuel for cooking (%) 43.8 19.2
Total fertility rate (children per woman) 2.2 2.1
Total fertility rate (children per woman) (RGI Statistical Report 2015) 2.3 2.0
Women aged 15-19 years who were already mothers or pregnant at the time of the
survey
7.9 7.6
MMR (SRS 2011-13) 167.0 222.0
Neo Natal Mortality Rate (RGI Statistical Report 2015) 25.0 35.0
Infant mortality Rate (IMR) 41.0 40.0
Under five mortality Rate (U5MR) 50.0 49.0
Total Unmet Need 12.9 13.6
Mothers who had antenatal check-up in the first trimester (%) 58.6 64.1
Mothers who consumed iron folic acid for 100 days or more when they were
pregnant (%)
30.3 36.5
Mothers who received financial assistance under Janani Suraksha Yojana (JSY) for
births delivered in an institution (%)
36.4 72.6
Institutional births (%) 78.9 85.4
Institutional births in public facility (%) 52.1 75.9
Home delivery conducted by skilled health personnel (out of total deliveries) (%) 4.3 3.3
Births assisted by a doctor/nurse/LHV/ANM/other health personnel (%) 81.4 86.6
Births delivered by caesarean section (%) 17.2 13.8
Births in a private health facility delivered by caesarean section (%) 40.9 53.7
Births in a public health facility delivered by caesarean section (%) 11.9 11.5

26
Children aged 12-23 months fully immunized (BCG, measles, and 3 doses each of
polio and DPT) (%
62.0 78.6
Children with diarrhoea in the last 2 weeks who received oral rehydration salts
(ORS) (%
50.6 68.6
Children with diarrhoea in the last 2 weeks who received zinc (%) 20.3 17.0
Prevalence of symptoms of acute respiratory infection (ARI) in the last 2 weeks
preceding the survey (%)
2.7 2.4
Children under age 3 years breastfed within one hour of birth (%) 41.6 68.6
Children under age 6 months exclusively breastfed (%) 54.9 65.6
Children aged 6-8 months receiving solid or semi-solid food and breastmilk (%) 42.7 54.9
Children under 5 years who are underweight (weight-for-age) (%) 35.7 34.4
Women who are overweight or obese (BMI ≥ 25.0 kg/m2) (%) 20.7 16.5
Men who are overweight or obese (BMI ≥ 25.0 kg/m2) (%) 18.6 17.2
Children aged 6 -59 months who are anaemic (<11.0 g/dl) (%) 58.4 44.6
All women aged 15-49 years who are anaemic (%) 53.0 51.0
Blood sugar level - high (>140 mg/dl) (%) - Women 5.8 7.3
Blood sugar level - high (>140 mg/dl) (%) – Men 7.9 10.7
Blood sugar level - very high (>160 mg/dl) (%) - Women 2.8 3.4
Blood sugar level - very high (>160 mg/dl) (%) – Men 3.8 5.8
Slightly above normal (Systolic 140-159 mm of Hg and/or Diastolic 90-99 mm of Hg)
(%) - Women
6.7 6.9
Slightly above normal (Systolic 140-159 mm of Hg and/or Diastolic 90-99 mm of Hg)
(%) – Men
10.3 9.7
Moderately high (Systolic 160-179 mm of Hg and/or Diastolic 100-109 mm of Hg)
(%) - Women
1.4 1.4
Moderately high (Systolic 160-179 mm of Hg and/or Diastolic 100-109 mm of Hg)
(%) – Men
2.2 2.0
Very high (Systolic ≥180 mm of Hg and/or Diastolic ≥110 mm of Hg) (%) - Women 0.7 0.7
Very high (Systolic ≥180 mm of Hg and/or Diastolic ≥110 mm of Hg) (%) – Men 0.9 0.8
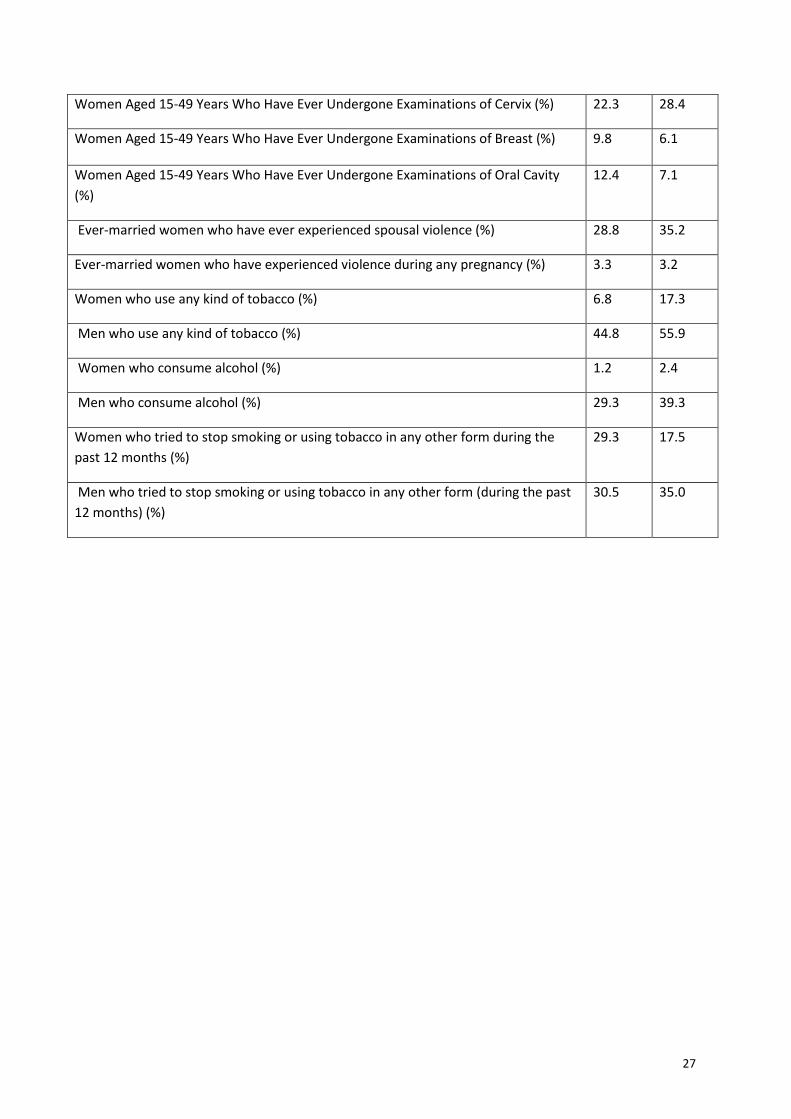
27
Women Aged 15-49 Years Who Have Ever Undergone Examinations of Cervix (%) 22.3 28.4
Women Aged 15-49 Years Who Have Ever Undergone Examinations of Breast (%) 9.8 6.1
Women Aged 15-49 Years Who Have Ever Undergone Examinations of Oral Cavity
(%)
12.4 7.1
Ever-married women who have ever experienced spousal violence (%) 28.8 35.2
Ever-married women who have experienced violence during any pregnancy (%) 3.3 3.2
Women who use any kind of tobacco (%) 6.8 17.3
Men who use any kind of tobacco (%) 44.8 55.9
Women who consume alcohol (%) 1.2 2.4
Men who consume alcohol (%) 29.3 39.3
Women who tried to stop smoking or using tobacco in any other form during the
past 12 months (%)
29.3 17.5
Men who tried to stop smoking or using tobacco in any other form (during the past
12 months) (%)
30.5 35.0
28
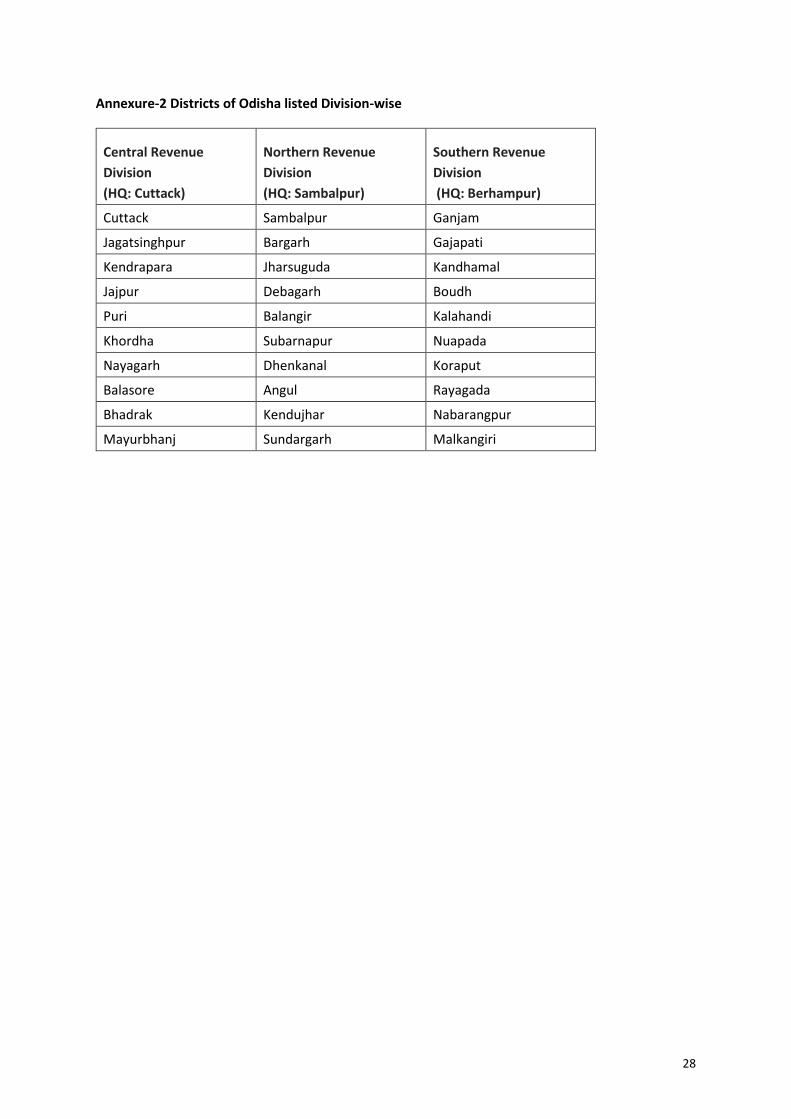
Annexure-2 Districts of Odisha listed Division-wise
Central Revenue
Division
(HQ: Cuttack)
Northern Revenue
Division
(HQ: Sambalpur)
Southern Revenue
Division
(HQ: Berhampur)
Cuttack Sambalpur Ganjam
Jagatsinghpur Bargarh Gajapati
Kendrapara Jharsuguda Kandhamal
Jajpur Debagarh Boudh
Puri Balangir Kalahandi
Khordha Subarnapur Nuapada
Nayagarh Dhenkanal Koraput
Balasore Angul Rayagada
Bhadrak Kendujhar Nabarangpur
Mayurbhanj Sundargarh Malkangiri