Embed Size (px)
Citation preview
Changing Dynamics in the Global Seaborne Thermal Coal Markets & Stranded Asset Risk
“Climate Change poses risks to which financial market regulators
and company boards have, to-date, given little attention.”
Dr Martin Parkinson, August 2015
Tim Buckley, Director of Energy Finance Studies, Australasia
Japan Renewable Energy Foundation (JREF)
March 2016
AGENDA
The Global Electricity Market Transformation
1. Global seaborne thermal coal demand in structural decline China India Japan America
2. Equity Markets show coal companies are increasingly pricing in structural decline risks
3. Renewables are deflationary Technology gains and economies of scale Batteries will transform distributed solar on rooftops from 2018.
4. Stranded Assets Risk is Increasing
2
1. A long cyclical downturn or structural decline?
China, India, the US and Japan are the four largest coal consuming nations globally.
Each are undergoing a rapid electricity transformation, away from coal.
3
1.1 China’s Electricity Sector
4
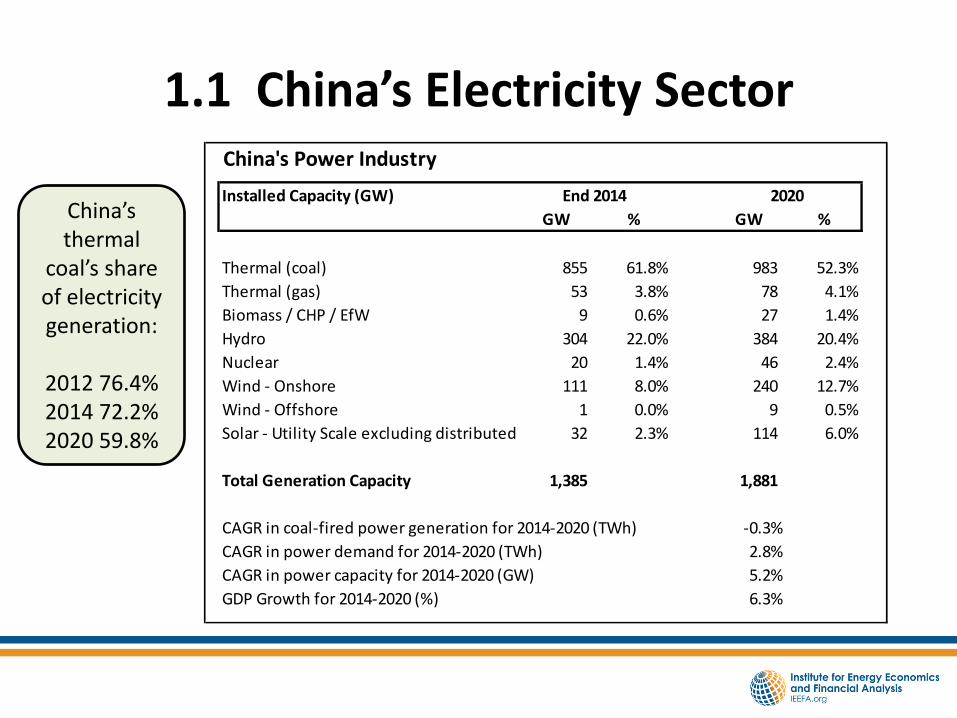
China’s thermal
coal’s share of electricity generation:
2012 76.4% 2014 72.2% 2020 59.8%
China's Power Industry
Installed Capacity (GW)
GW % GW %
Thermal (coal) 855 61.8% 983 52.3%
Thermal (gas) 53 3.8% 78 4.1%
Biomass / CHP / EfW 9 0.6% 27 1.4%
Hydro 304 22.0% 384 20.4%
Nuclear 20 1.4% 46 2.4%
Wind - Onshore 111 8.0% 240 12.7%
Wind - Offshore 1 0.0% 9 0.5%
Solar - Utility Scale excluding distributed 32 2.3% 114 6.0%
Total Generation Capacity 1,385 1,881
CAGR in coal-fired power generation for 2014-2020 (TWh) -0.3%
CAGR in power demand for 2014-2020 (TWh) 2.8%
CAGR in power capacity for 2014-2020 (GW) 5.2%
GDP Growth for 2014-2020 (%) 6.3%
2020End 2014
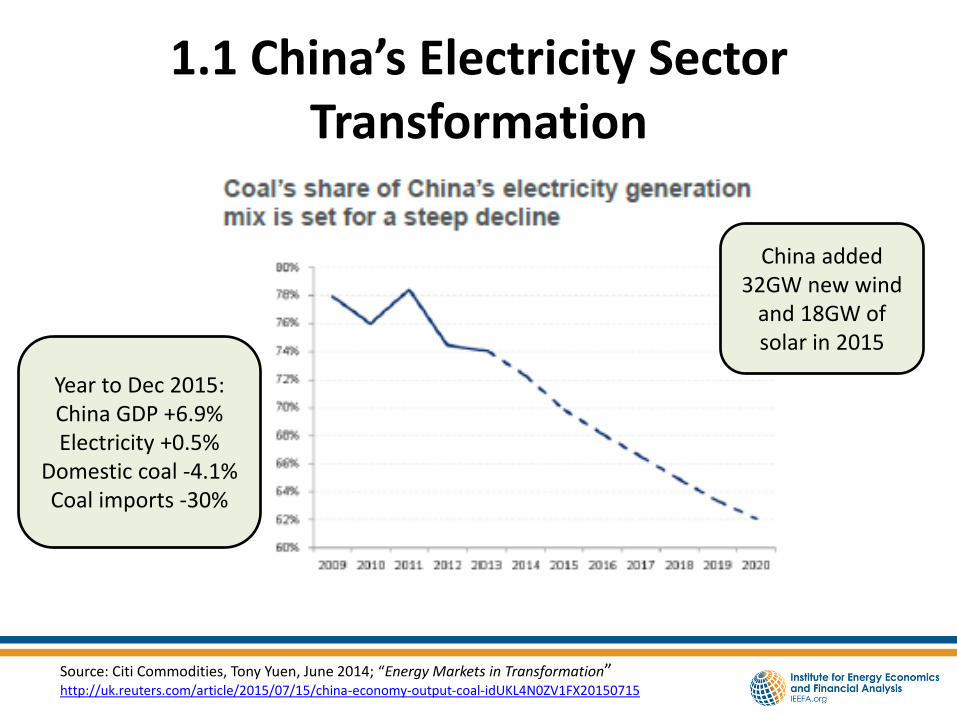
1.1 China’s Electricity Sector Transformation
China added 32GW new wind
and 18GW of solar in 2015
Year to Dec 2015: China GDP +6.9% Electricity +0.5%
Domestic coal -4.1% Coal imports -30%
Source: Citi Commodities, Tony Yuen, June 2014; “Energy Markets in Transformation” http://uk.reuters.com/article/2015/07/15/china-economy-output-coal-idUKL4N0ZV1FX20150715 5
1.2 India India’s Energy Minister Goyal stated November 2014:
1. Plans to transformation of the entire Indian electricity system with
175GW of renewable energy installs by 2021/22. This involves a doubling of wind installs to 6GW and lifting solar installs tenfold to 10GW pa.
2. A plan for a US$50bn national grid upgrade to drive grid efficiency.
3. Plans to more than double India’s domestic coal production to 1.5Bn tpa by 2021, requiring a massive investment in rail infrastructure, coal handling and preparation plants plus major new mine development.
4. Goyal: “I'm very confident of achieving these targets and am very confident that India's current account deficit will not be burdened with the amount of money we lose for imports of coal. Possibly in the next two or three years we should be able to stop imports of thermal coal.“
6
1.2 India • India has seen global firms commit over US$100 billion to the Indian
solar sector in 2015.
• SoftBank (Japan) and Foxconn (Taiwan) tied up with Bharti Enterprises (India) and committed US$20bn to Indian solar over five years.
• The Adani Group has committed US$16bn to numerous solar projects across India in 2015, and is due to commission the world’s largest solar project in Tamil Nadu next month – a US$650m investment to build a 648MW project (only commenced in January 2015).
• Reliance Power has cancelled 14GW of thermal power project proposals to focus on 6GW of solar and 5GW of hydro instead. RattanIndia Group has made a similar move.
http://ieefa.org/wp-content/uploads/2015/11/IEEFA-India-Electricity-Sector-Transformation_Global-Capacity-Building_11112015.pdf
7
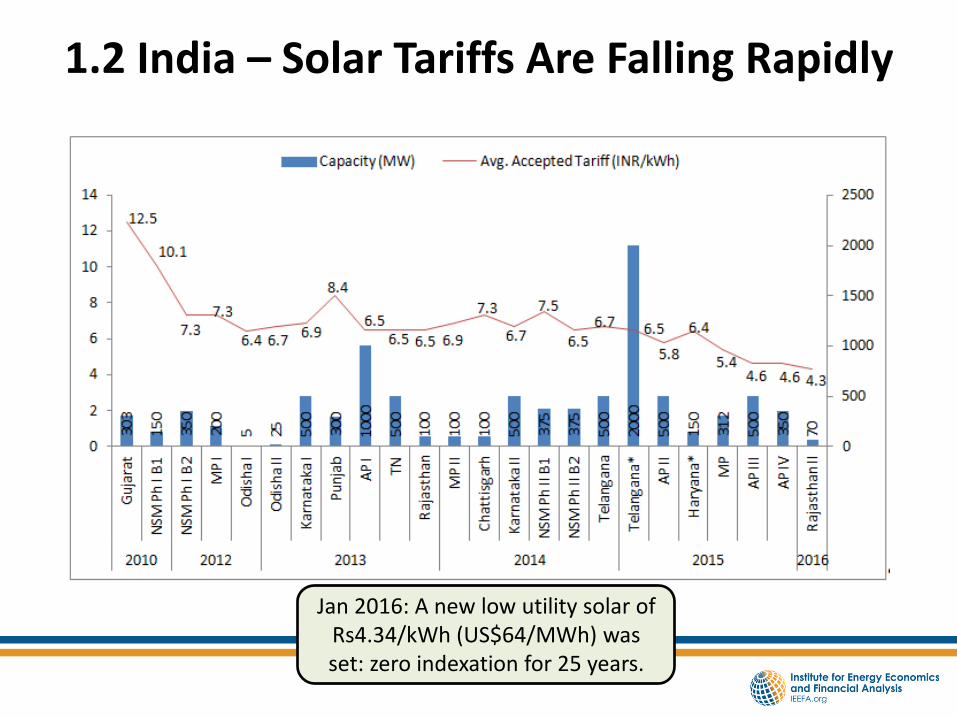
1.2 India – Solar Tariffs Are Falling Rapidly
8
Jan 2016: A new low utility solar of Rs4.34/kWh (US$64/MWh) was set: zero indexation for 25 years.
1.3: Japan
9
Japan’s thermal coal demand outlook: down 3% pa
1. Energy efficiency – 12% decline in electricity demand from 2010-2015 despite 0.6% pa GDP growth (a 3% pa reduction in electricity intensity)
2. Nuclear restart – The key question is the rate of restarts for 42GW of nuclear capacity – US$50bn of idle assets. Third restart done.
3. Solar surge – Japan installed 10GW in 2014 and 9GW in 2015; part of a 50-70GW pipeline of approved projects. Offshore wind plan post 2020.
4. LNG vs coal vs oil – relative price moves, Japanese LNG pricing has halved in US$ terms over 2015. Japan has signed over 1000Bcf/year of new US LNG supply contracts due online by 2020.
1.4 US
10
America’s thermal coal: down 45% by 2016 vs 2008 peak
1. Collapsing US coal exports – too expensive on the global cost curve, and the US$ strength vs all major coal exporters.
2. Coal power plant closures - >70GW of coal-fired power plants slated for closure by 2020 due to EPA air, water and ash pond pollution rules and the Clean Power Plan. 15-20GW of coal plant closures in 2015 alone due to the Mercury and Air Toxics Standard, with no new coal additions.
3. Renewables – US push into wind (9GW in 2015) and solar (9GW in 2015) rapid and accelerating, until 2017 at least (PTC/ITC cliff?). Oct 2015 saw a solar utility PPA in Texas signed at US$40/MWh flat, the lowest ever (yet!).
4. Domestic gas vs coal – the US$ Henry Hub gas price collapse over 2012-2015 has improved gas competitiveness, with over 100GW of new gas-fired capacity in the US planning system. US domestic coal volumes are -30% yoy 2016 YTD. UBS forecasts a 45% decline in coal from 2016-2030.
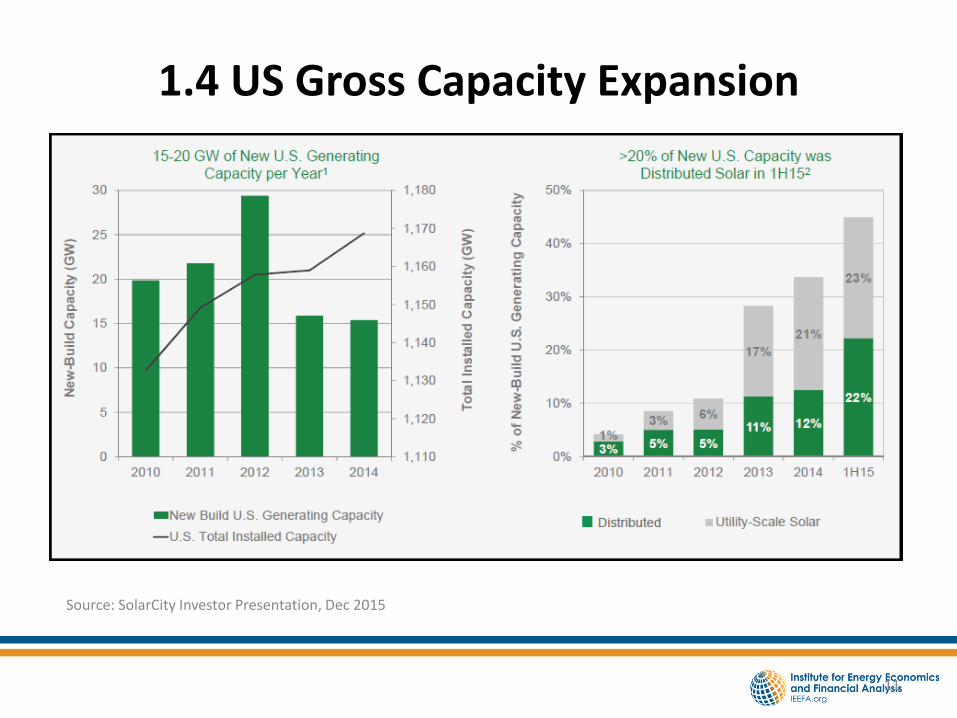
1.4 US Gross Capacity Expansion
11
Source: SolarCity Investor Presentation, Dec 2015
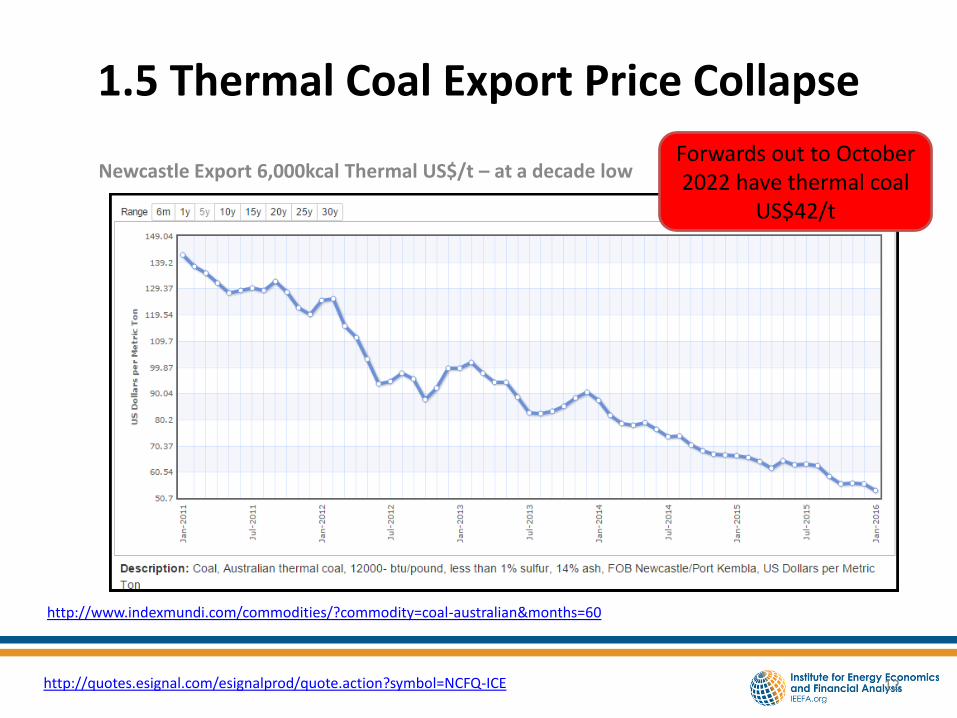
1.5 Thermal Coal Export Price Collapse
Newcastle Export 6,000kcal Thermal US$/t – at a decade low
12 http://quotes.esignal.com/esignalprod/quote.action?symbol=NCFQ-ICE
http://www.indexmundi.com/commodities/?commodity=coal-australian&months=60
Forwards out to October 2022 have thermal coal
US$42/t
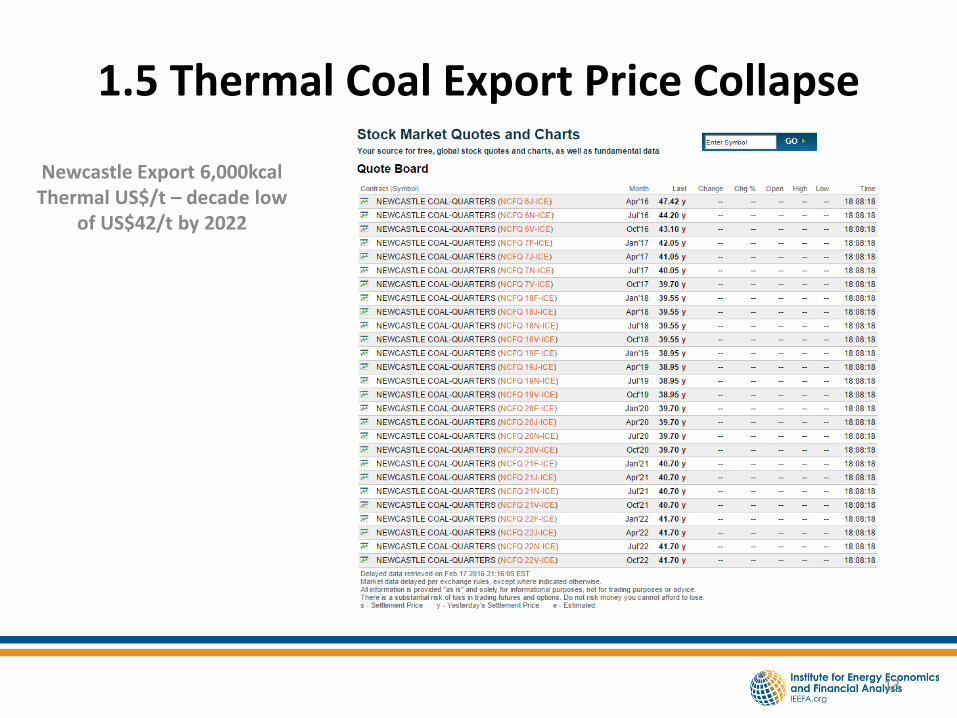
1.5 Thermal Coal Export Price Collapse
Newcastle Export 6,000kcal Thermal US$/t – decade low
of US$42/t by 2022
13
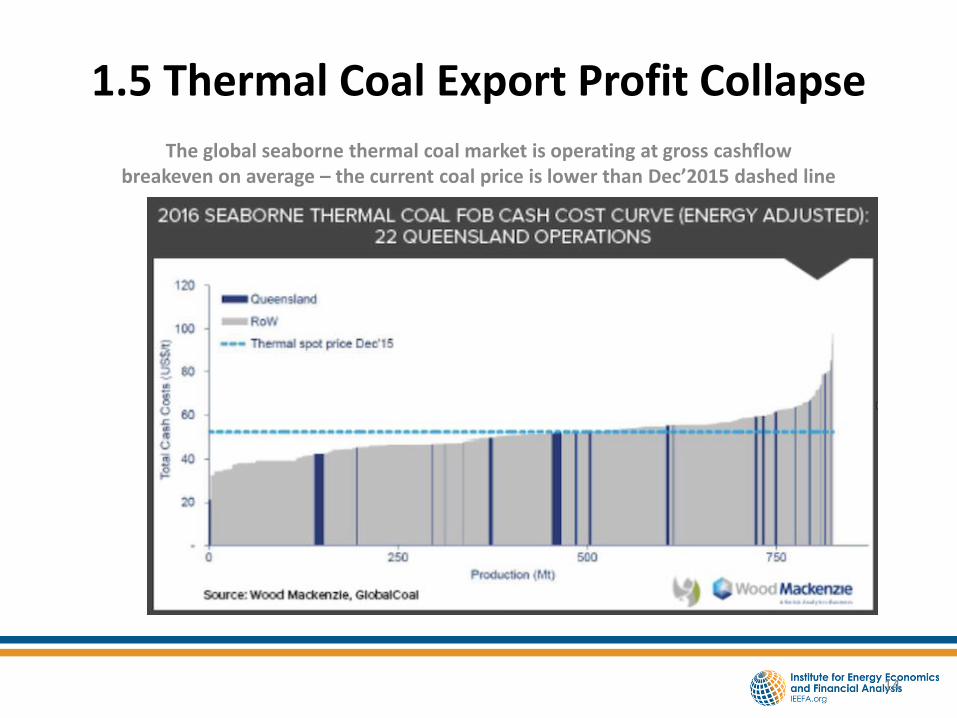
1.5 Thermal Coal Export Profit Collapse
The global seaborne thermal coal market is operating at gross cashflow breakeven on average – the current coal price is lower than Dec’2015 dashed line
14
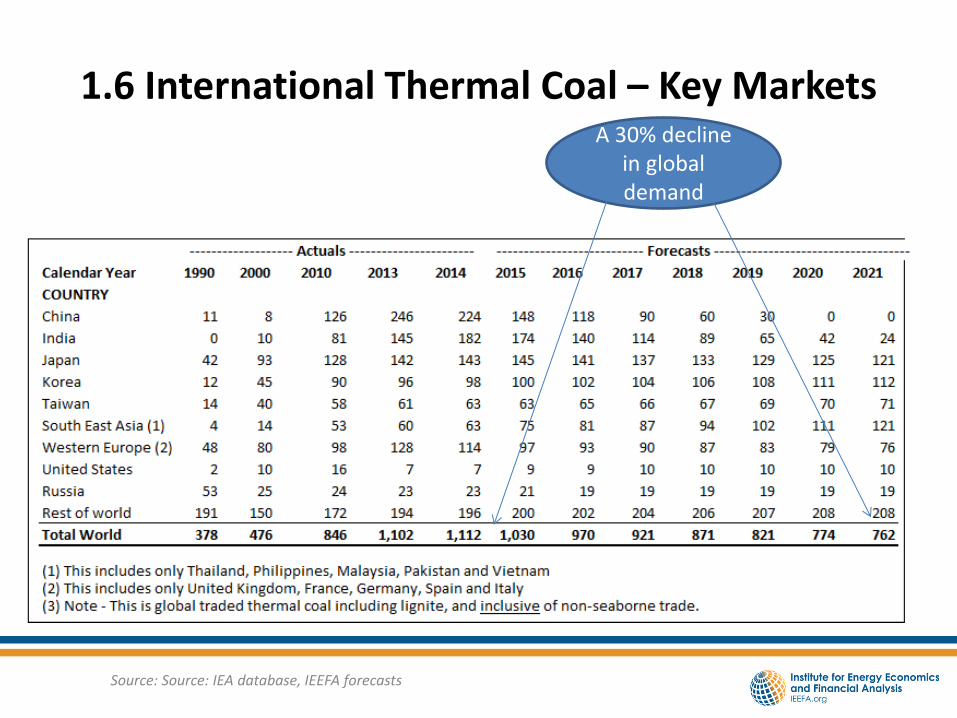
1.6 International Thermal Coal – Key Markets
15
A 30% decline in global demand
Source: Source: IEA database, IEEFA forecasts
2. Structural decline?
The Equity markets are factoring in structural decline as an increasingly likely probability.
Coal Equities are proving to be a wealth hazard!
16
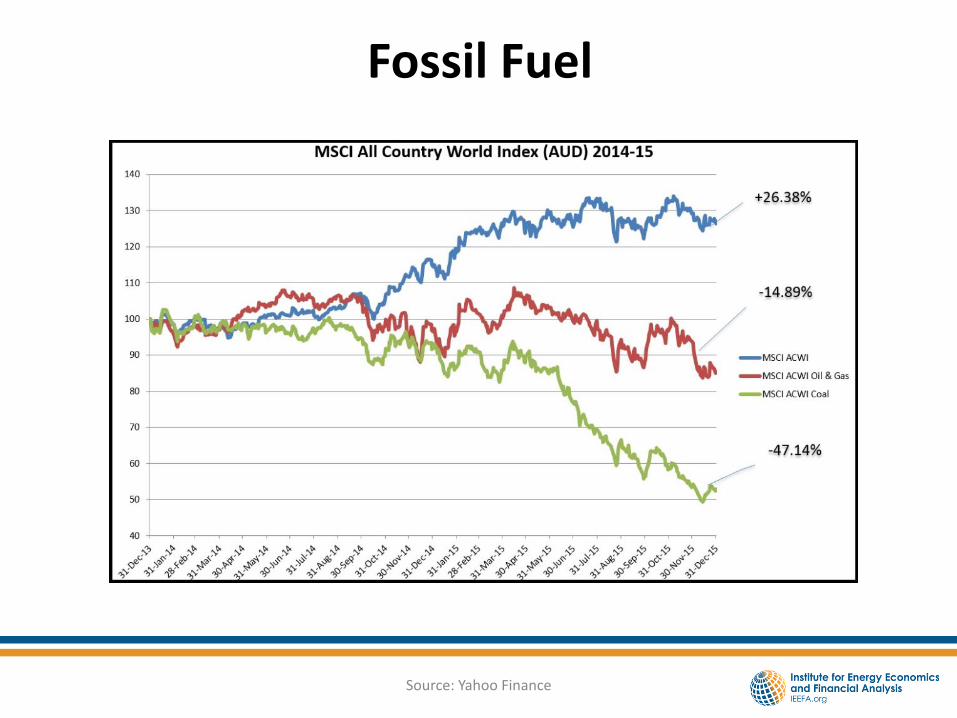
Fossil Fuel
17 Source: Yahoo Finance
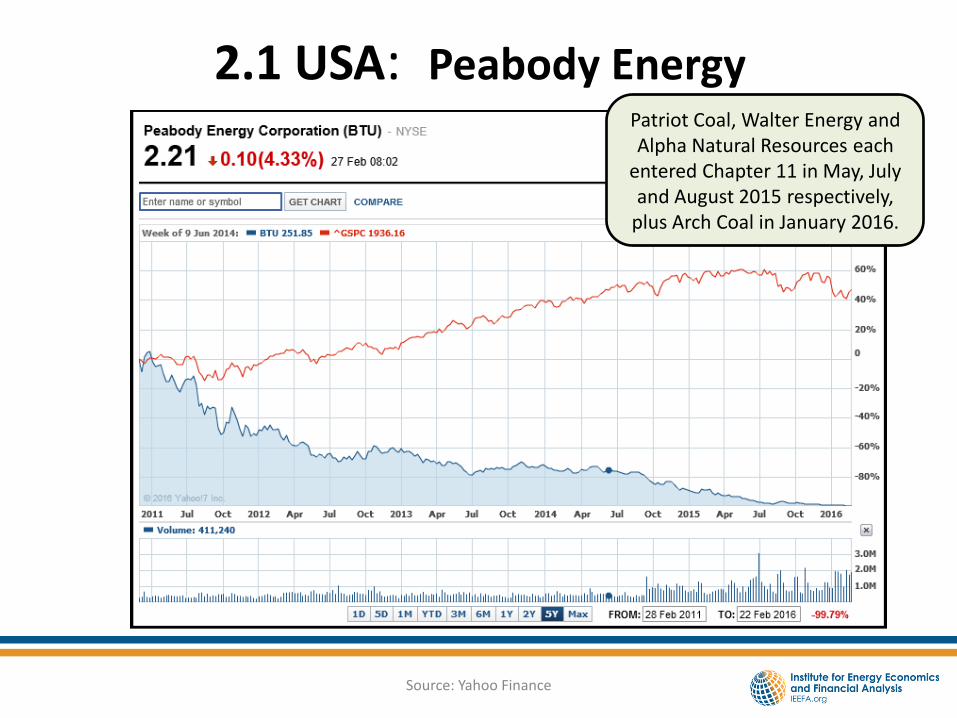
2.1 USA: Peabody Energy
18 Source: Yahoo Finance
Patriot Coal, Walter Energy and Alpha Natural Resources each
entered Chapter 11 in May, July and August 2015 respectively,
plus Arch Coal in January 2016.
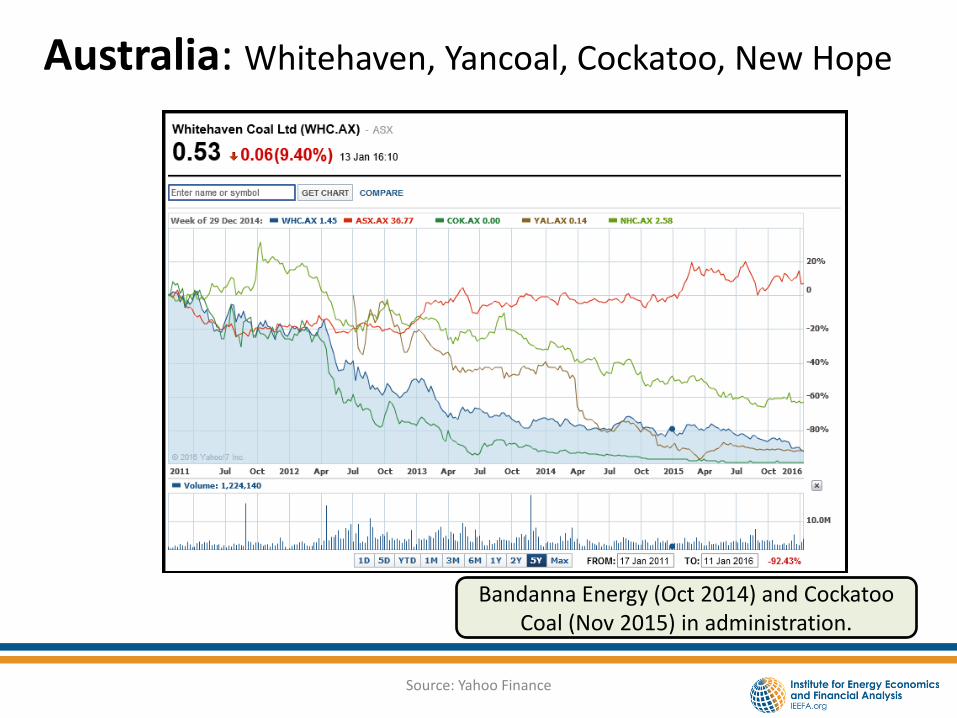
Australia: Whitehaven, Yancoal, Cockatoo, New Hope
19 Source: Yahoo Finance
Bandanna Energy (Oct 2014) and Cockatoo Coal (Nov 2015) in administration.
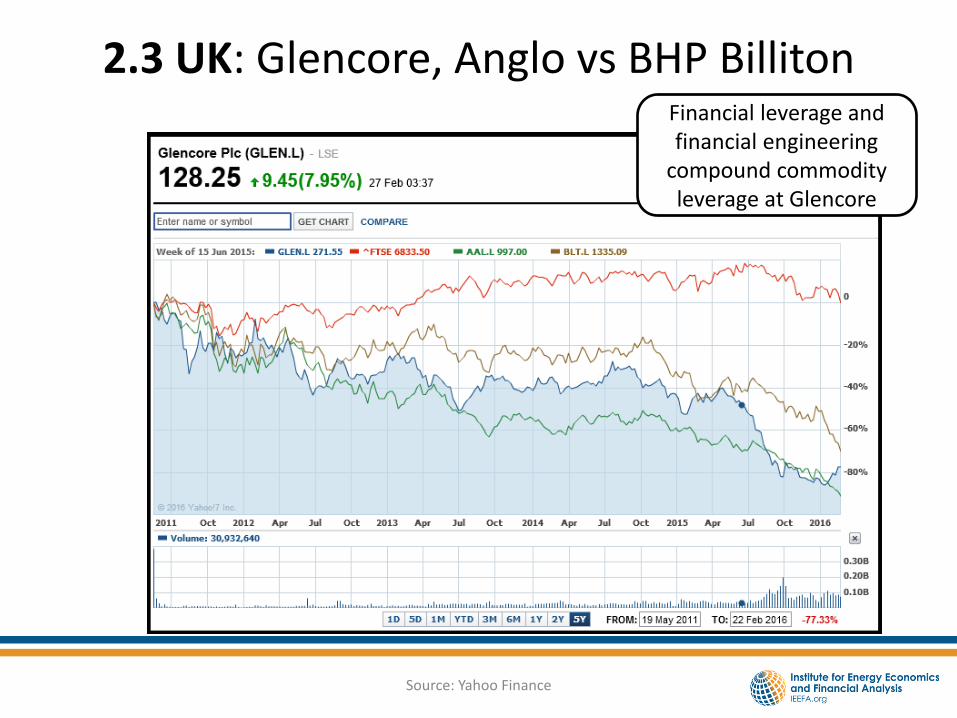
2.3 UK: Glencore, Anglo vs BHP Billiton
20 Source: Yahoo Finance
Financial leverage and financial engineering
compound commodity leverage at Glencore
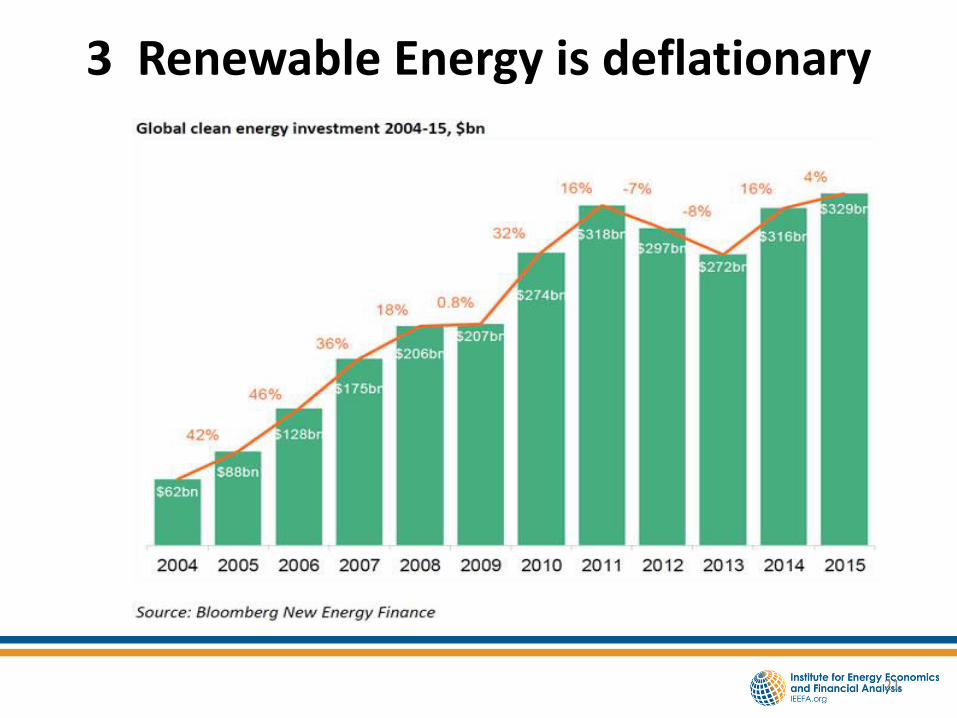
3 Renewable Energy is deflationary
21
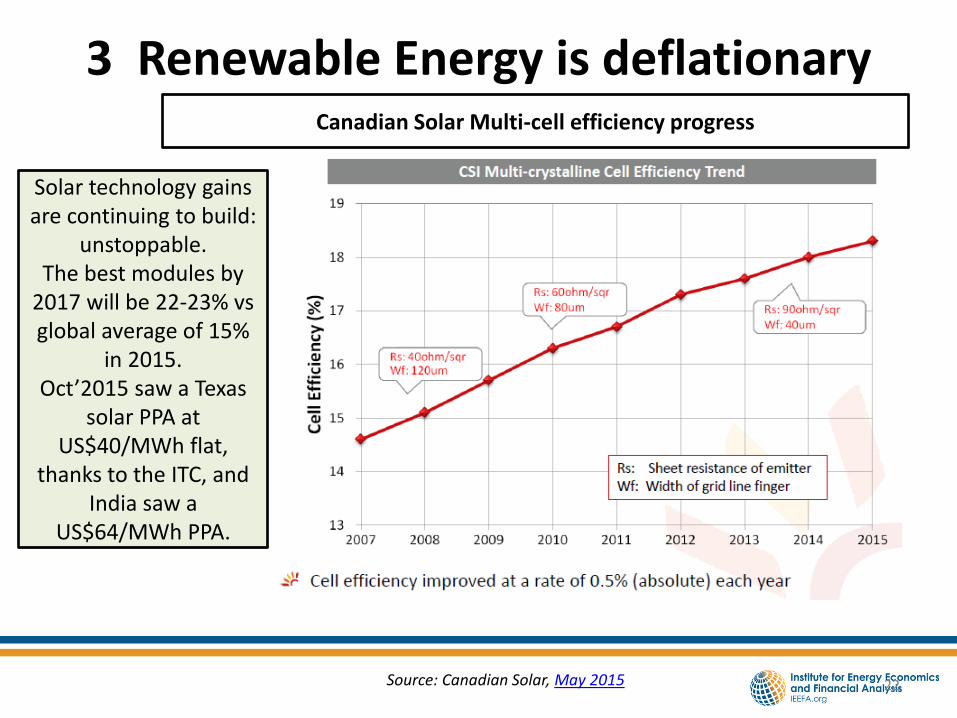
3 Renewable Energy is deflationary
Source: Canadian Solar, May 2015
Solar technology gains are continuing to build:
unstoppable. The best modules by
2017 will be 22-23% vs global average of 15%
in 2015. Oct’2015 saw a Texas
solar PPA at US$40/MWh flat,
thanks to the ITC, and India saw a
US$64/MWh PPA.
Canadian Solar Multi-cell efficiency progress
22
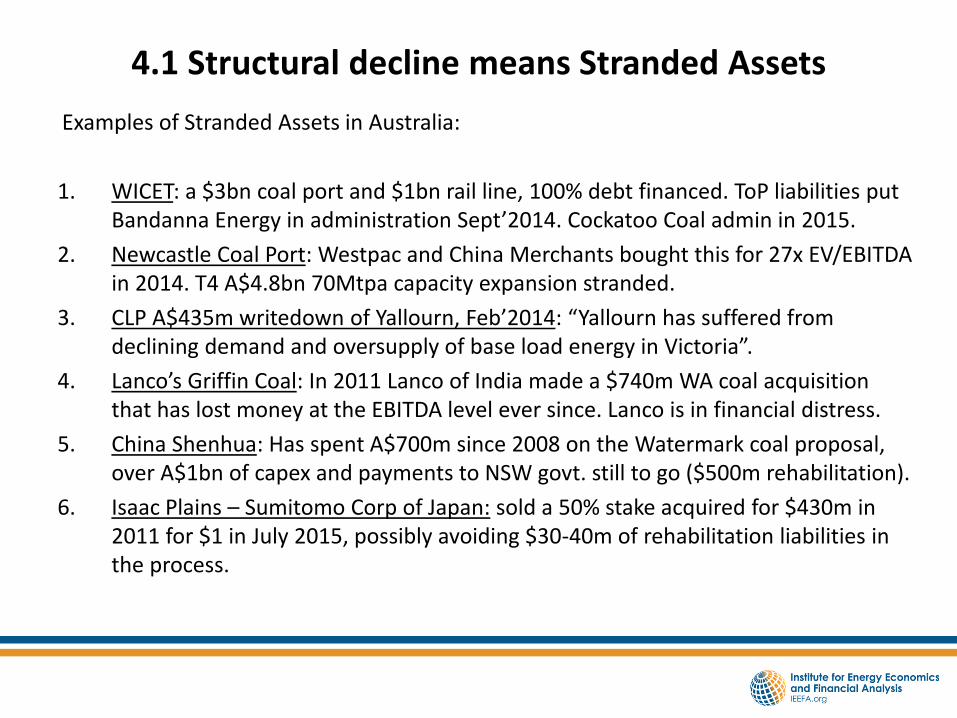
4.1 Structural decline means Stranded Assets
Examples of Stranded Assets in Australia:
1. WICET: a $3bn coal port and $1bn rail line, 100% debt financed. ToP liabilities put Bandanna Energy in administration Sept’2014. Cockatoo Coal admin in 2015.
2. Newcastle Coal Port: Westpac and China Merchants bought this for 27x EV/EBITDA in 2014. T4 A$4.8bn 70Mtpa capacity expansion stranded.
3. CLP A$435m writedown of Yallourn, Feb’2014: “Yallourn has suffered from declining demand and oversupply of base load energy in Victoria”.
4. Lanco’s Griffin Coal: In 2011 Lanco of India made a $740m WA coal acquisition that has lost money at the EBITDA level ever since. Lanco is in financial distress.
5. China Shenhua: Has spent A$700m since 2008 on the Watermark coal proposal, over A$1bn of capex and payments to NSW govt. still to go ($500m rehabilitation).
6. Isaac Plains – Sumitomo Corp of Japan: sold a 50% stake acquired for $430m in 2011 for $1 in July 2015, possibly avoiding $30-40m of rehabilitation liabilities in the process.
23
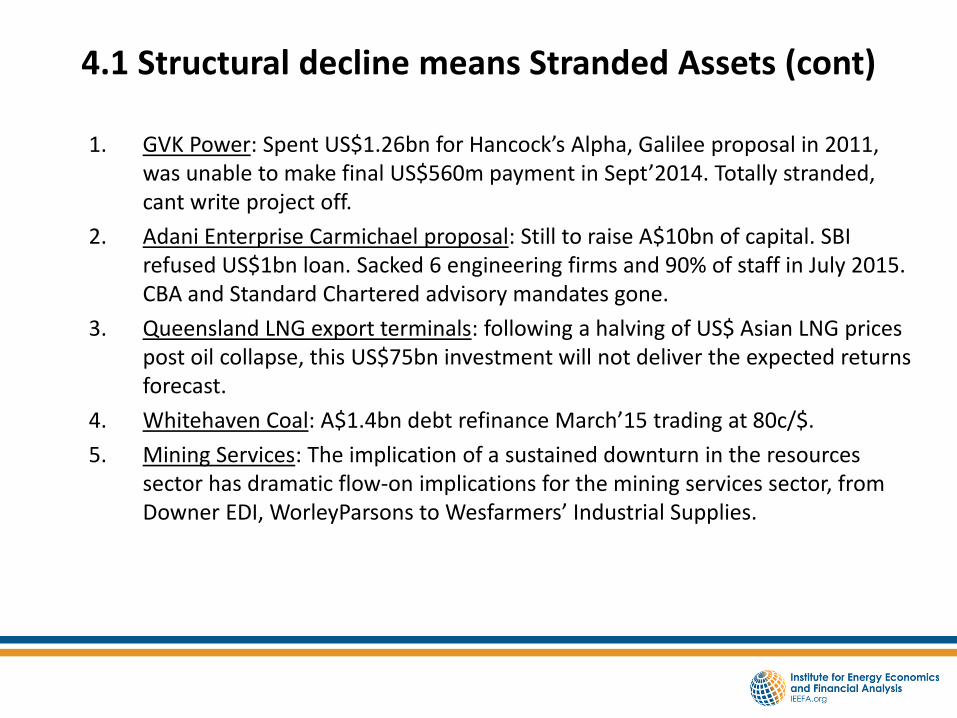
4.1 Structural decline means Stranded Assets (cont)
1. GVK Power: Spent US$1.26bn for Hancock’s Alpha, Galilee proposal in 2011, was unable to make final US$560m payment in Sept’2014. Totally stranded, cant write project off.
2. Adani Enterprise Carmichael proposal: Still to raise A$10bn of capital. SBI refused US$1bn loan. Sacked 6 engineering firms and 90% of staff in July 2015. CBA and Standard Chartered advisory mandates gone.
3. Queensland LNG export terminals: following a halving of US$ Asian LNG prices post oil collapse, this US$75bn investment will not deliver the expected returns forecast.
4. Whitehaven Coal: A$1.4bn debt refinance March’15 trading at 80c/$.
5. Mining Services: The implication of a sustained downturn in the resources sector has dramatic flow-on implications for the mining services sector, from Downer EDI, WorleyParsons to Wesfarmers’ Industrial Supplies.
24
Appendix A: Korea
25
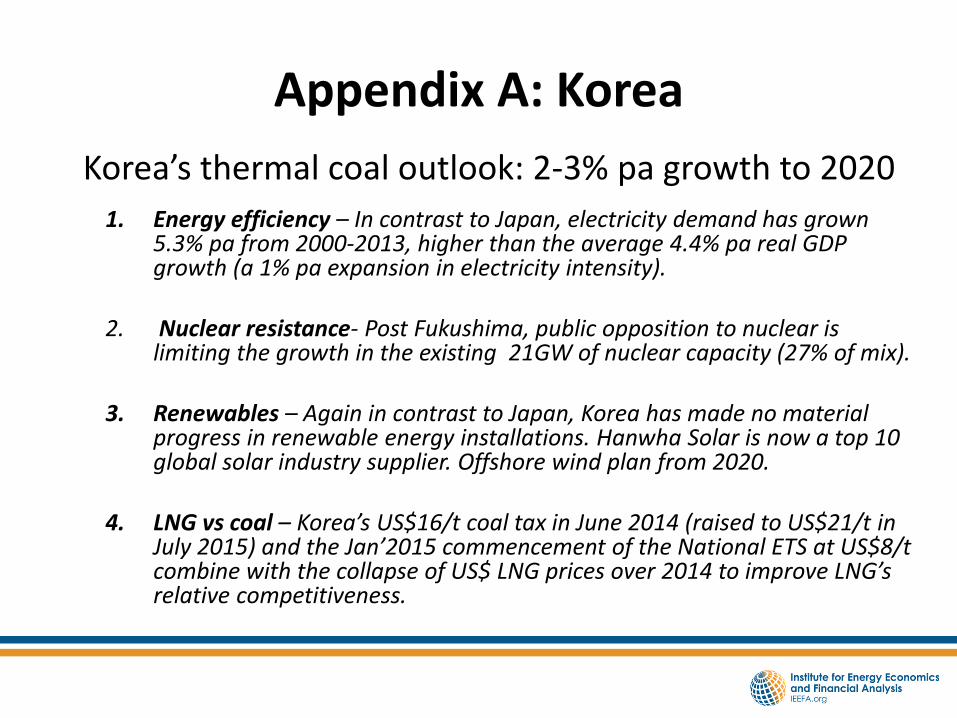
Korea’s thermal coal outlook: 2-3% pa growth to 2020
1. Energy efficiency – In contrast to Japan, electricity demand has grown 5.3% pa from 2000-2013, higher than the average 4.4% pa real GDP growth (a 1% pa expansion in electricity intensity).
2. Nuclear resistance- Post Fukushima, public opposition to nuclear is limiting the growth in the existing 21GW of nuclear capacity (27% of mix).
3. Renewables – Again in contrast to Japan, Korea has made no material progress in renewable energy installations. Hanwha Solar is now a top 10 global solar industry supplier. Offshore wind plan from 2020.
4. LNG vs coal – Korea’s US$16/t coal tax in June 2014 (raised to US$21/t in July 2015) and the Jan’2015 commencement of the National ETS at US$8/t combine with the collapse of US$ LNG prices over 2014 to improve LNG’s relative competitiveness.
Appendix B: EU
26
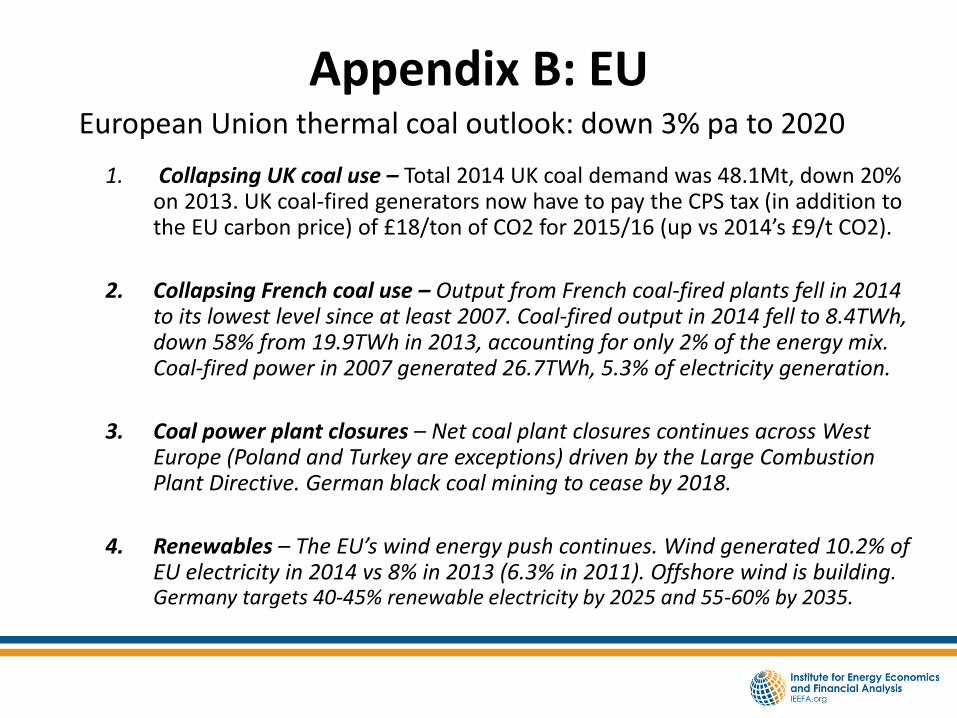
European Union thermal coal outlook: down 3% pa to 2020
1. Collapsing UK coal use – Total 2014 UK coal demand was 48.1Mt, down 20% on 2013. UK coal-fired generators now have to pay the CPS tax (in addition to the EU carbon price) of £18/ton of CO2 for 2015/16 (up vs 2014’s £9/t CO2).
2. Collapsing French coal use – Output from French coal-fired plants fell in 2014 to its lowest level since at least 2007. Coal-fired output in 2014 fell to 8.4TWh, down 58% from 19.9TWh in 2013, accounting for only 2% of the energy mix. Coal-fired power in 2007 generated 26.7TWh, 5.3% of electricity generation.
3. Coal power plant closures – Net coal plant closures continues across West Europe (Poland and Turkey are exceptions) driven by the Large Combustion Plant Directive. German black coal mining to cease by 2018.
4. Renewables – The EU’s wind energy push continues. Wind generated 10.2% of EU electricity in 2014 vs 8% in 2013 (6.3% in 2011). Offshore wind is building. Germany targets 40-45% renewable electricity by 2025 and 55-60% by 2035.
Renewable Energy is deflationary
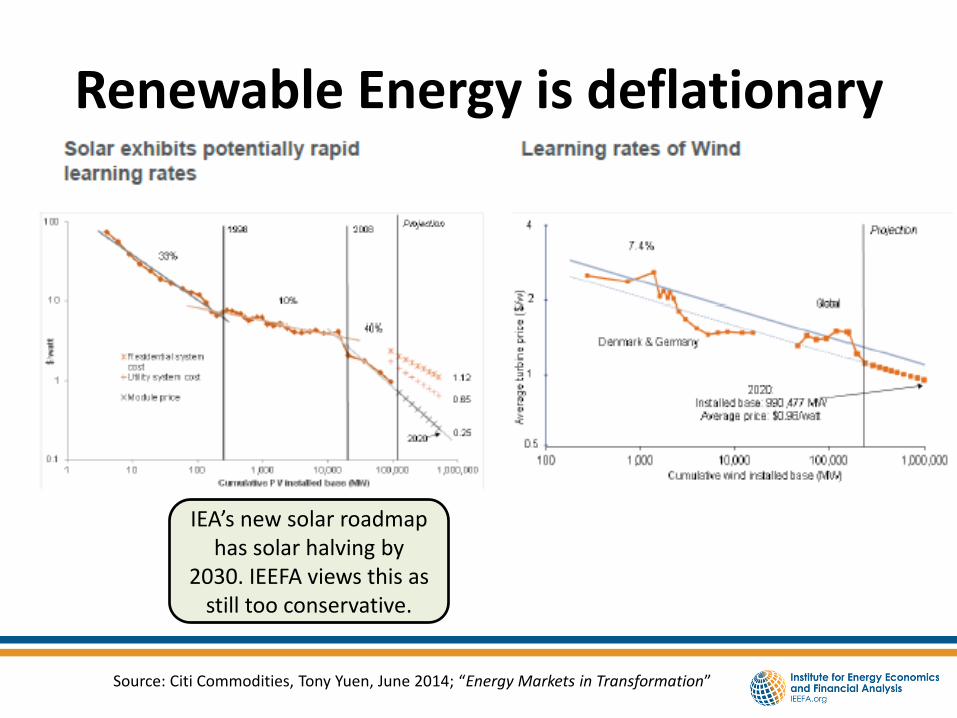
27 Source: Citi Commodities, Tony Yuen, June 2014; “Energy Markets in Transformation”
IEA’s new solar roadmap has solar halving by
2030. IEEFA views this as still too conservative.
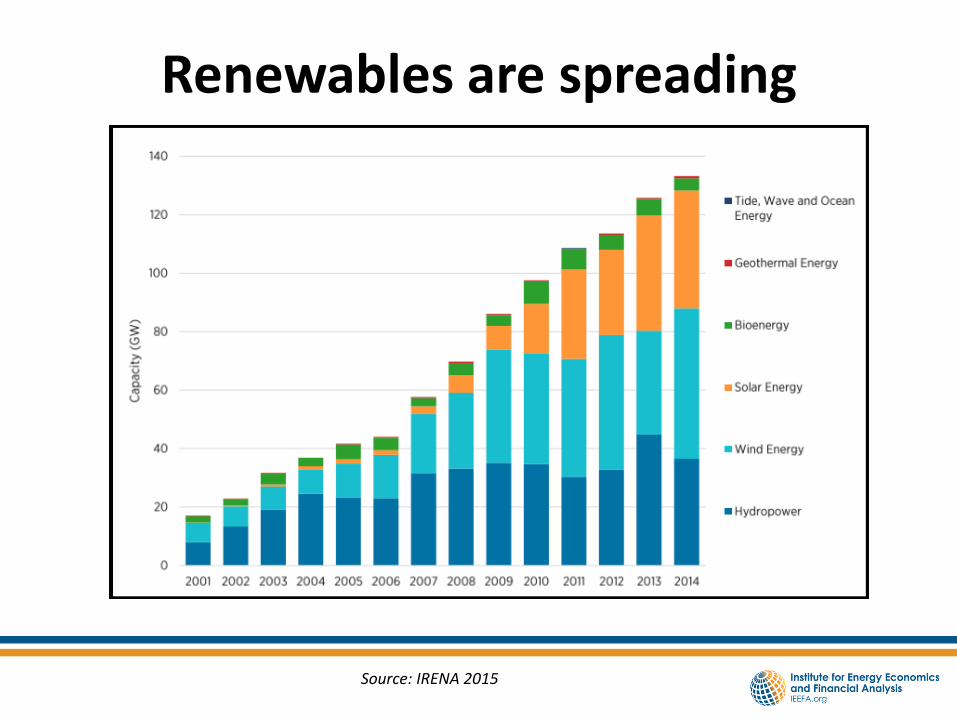
28 Source: IRENA 2015
Renewables are spreading
29
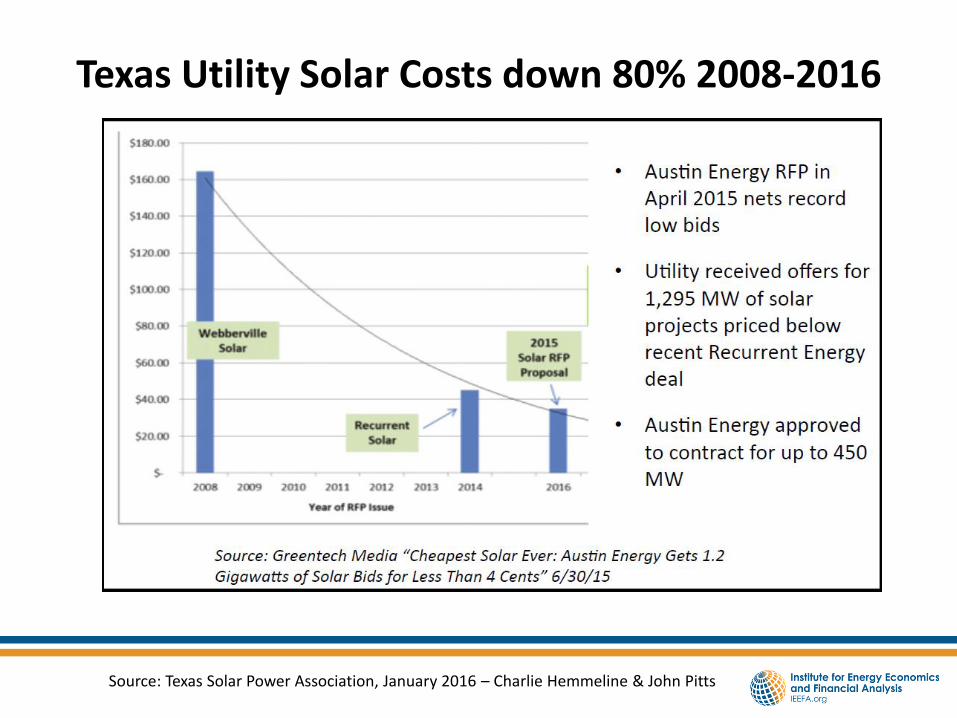
Texas Utility Solar Costs down 80% 2008-2016
Source: Texas Solar Power Association, January 2016 – Charlie Hemmeline & John Pitts
30
• DISCLAIMER
• The Institute for Energy Economics and Financial Analysis (IEEFA) is a not-for-profit research Institution organized under Internal Revenue Code 501(c)(3) of the United States.
• The authors of this presentation are not brokers, dealers or registered investment advisors and do not attempt or intend to influence the purchase or sale of any security.
• This presentation is intended for informational and educational purposes only. This presentation is not a solicitation, an offer, a recommendation to buy, hold, or sell any securities, products, service, investment or participate in any particular trading scheme in any jurisdiction. The presentation is not and shall not be used as part of any prospectus, offering memorandum or other disclosure attributable to any issuer of securities. No individual or entity is authorized to use the information contained herein for the purpose or with the effect of incorporating any such information into any disclosure intended for any investor or potential investor. This presentation is not intended, in part or in whole, as financial advice.
• The information and opinions in the presentation constitute a judgment as at the date of the presentation and are subject to change without notice. The information and opinions contained have been compiled or arrived at from sources believed to be reliable and in good faith, but the authors do not represent and make no warranty, express or implied, as to the accuracy, completeness or correctness contained in this presentation. The authors do not warrant that the information is up to date. All information provided expressly disclaims any and all warranties, express or implied, including without limitation warranties of satisfactory quality and fitness for a particular purpose with respect to the information contained herein.
• All information contained herein is protected by law, including but not limited to Copyright Law, and none of the information contained herein is to be copied or otherwise reproduced, repackaged further transmitted, transferred, or redistributed for subsequent use for any such purpose in whole or in part, in any form or manner or by any means whatsoever, by any person without prior written consent from the authors.
• JURISDICTION • The authors do not make any representations that the use of information contained herein is appropriate for use in other locations or
that may access this information from outside of the United States. • This document is not directed to, or intended for distribution to or use by, any person or entity who is a citizen or resident of or located
in any locality, state country or other jurisdiction where such distribution, publication, availability or use would be contrary to law or regulation or would subject the Institute to any registration or licensing agreement within such jurisdiction.