Embed Size (px)
Citation preview

Changing Flexibility Requirements & New ResourcsDOE Solar Energy Technology Office Summit, Oakland
Logan Goldie-Scot
March 18, 2019

1 March 18, 2019 @LoganGoldieScot
The problem

2 March 18, 2019 @LoganGoldieScot
Source: BloombergNEFSource: BloombergNEF
California Australia
Net load profiles are becoming steeper in many markets
0
10
20
30
40
00:0
002
:00
04:0
006
:00
08:0
010
:00
12:0
014
:00
16:0
018
:00
20:0
022
:00
GW
2011201220132014201520162017
0.0
0.5
1.0
1.5
2.0
00:0
002
:00
04:0
006
:00
08:0
010
:00
12:0
014
:00
16:0
018
:00
20:0
022
:00
GW
2011201220132014201520162017

3 March 18, 2019 @LoganGoldieScot
Source: BloombergNEF
The frequency of annual negative power occurrences is increasing in many markets
0%1%2%3%4%5%6%7%8%9%
2010
2011
2012
2013
2014
2015
2016
2017
2010
2011
2012
2013
2014
2015
2016
2017
2010
2011
2012
2013
2014
2015
2016
2017
2010
2011
2012
2013
2014
2015
2016
2017

4 March 18, 2019 @LoganGoldieScot
United Kingdom California South Australia
Power price profiles are becoming more extreme
0
20
40
60
80
0:00
6:00
12:0
0
18:0
0
23:0
0
Pound/MWh
2017
2016
2015
2010-14 range
0
20
40
60
80
0:00
6:00
12:0
0
18:0
0
23:0
0
$/MWh
2017
20162015
2010-14 range
0
50
100
150
200
250
0:00
6:00
12:0
0
18:0
0
23:0
0
A$/MWh
2017
2016
2015 2010-14

5 March 18, 2019 @LoganGoldieScot
Source: BloombergNEF
A plant’s viability may depend on a small number of high priced hours
0.0%
0.5%
1.0%
1.5%
2.0%
-800 -50 700 1,450 2,200 2,950 3,700 4,450U.K. Germany California South Australia Power prices
South Australia’s power prices show a wide, flat distribution. The U.K.’s prices are least volatile.
Power prices frequency distribution, 2017

6 March 18, 2019 @LoganGoldieScot
Source: BloombergNEF Note: Realized power prices are production-weighted power prices, based on the pairing of hourly price and production profiles
Depending on resource concentration, the impact can be dramatic
-40%-30%-20%-10%
0%10%20%30%40%
2011 2012 2013 2014 2015 2016 2017 1Q 2018
Premium or discount to around-the-clock average
SolarGasWindATC
California realized power prices

7 March 18, 2019 @LoganGoldieScot
Preferred flexible resources

8 March 18, 2019 @LoganGoldieScot
Source: BloombergNEF Note: This assumes a four hour battery at 25% of PV power output.
PV-plus-storage is already competitive in the U.S. against CCGTs
Estimated levelized cost of energy for U.S. Southwest projects

9 March 18, 2019 @LoganGoldieScot
Source: BloombergNEF. Note: based only on disclosed capacity, some projects may not have MW, MWh disclosed. Arizona MWh estimated 1:1 ratio with MW for 2019 850 MW announcement
Power output (MW) Energy Capacity (MWh)
The pipeline for PV-plus-storage projects in the U.S. is growing
985
943
415
300
277
54
28
15
10
9
Arizona
California
Hawaii
Nevada
Colorado
Florida
Texas
Minnesota
Massachusetts
Pennsylvania
MW
1,405
1,270
1,100
581
400
67
30
30
17
16
Hawaii
Arizona
Colorado
California
Nevada
Texas
Minnesota
Puerto Rico
Massachusetts
Florida
MWh

10 March 18, 2019 @LoganGoldieScot
The near term outlook for battery storage looks promising
0
2,000
4,000
6,000
8,000
10,000
12,000
14,000
2015 2016 2017 2018 2019 2020 2021 2022
MW
RoW
EMEA
AMER
APAC

11 March 18, 2019 @LoganGoldieScot
Source: BloombergNEF Note: Exercise run before SB 100 was passed.
Whereas natural gas utilization will begin to fall
0%
5%
10%
15%
20%
25%
30%
35%
40%
2017 2025 2030 2035 2040 2045 2050
Solar
Wind
Gas
Capacity factors in California

12 March 18, 2019 @LoganGoldieScot
What next?

13 March 18, 2019 @LoganGoldieScot
Source: BloombergNEF
A lowest cost build model results in significant clean energy additions but limited retirements
-10
-5
0
5
10
15
20
2018 2025 2030 2035 2040 2045 2050
GW Other flexible capacitySolar thermalSmall-scale PVUtility-scale PVBiomassOffshore windOnshore windBatteryGeothermalHydroNuclearOtherOilPeaker GasGasCoal
14 March 18, 2019 @LoganGoldieScot
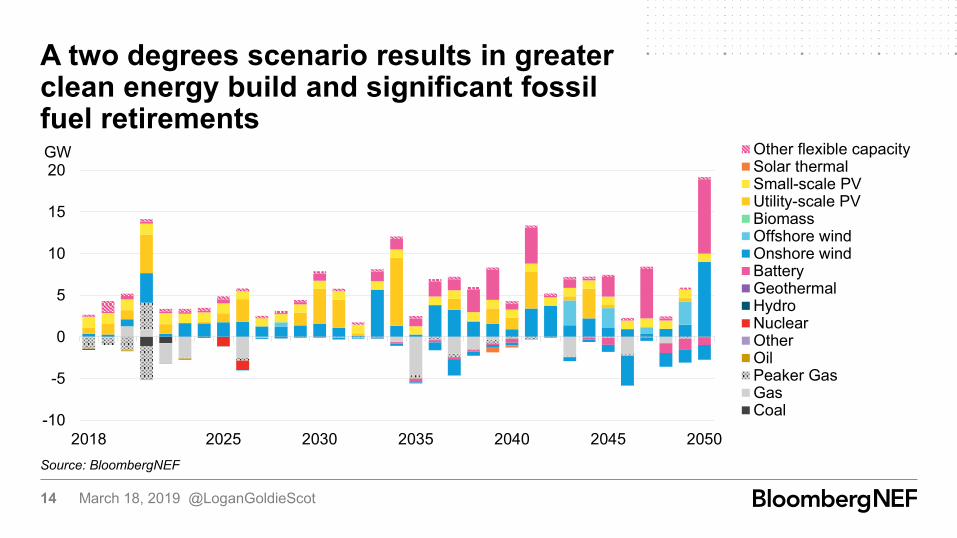
Source: BloombergNEF
A two degrees scenario results in greater clean energy build and significant fossil fuel retirements
-10
-5
0
5
10
15
20
2018 2025 2030 2035 2040 2045 2050
GW Other flexible capacitySolar thermalSmall-scale PVUtility-scale PVBiomassOffshore windOnshore windBatteryGeothermalHydroNuclearOtherOilPeaker GasGasCoal

15 March 18, 2019 @LoganGoldieScot
Source: Bloomberg
What role with solar thermal play?

16 March 18, 2019 @LoganGoldieScot
The Bloomberg NEF ("BNEF"), service/information is derived from selected public sources. Bloomberg Finance L.P. and its affiliates, in providing the service/information, believe that the information it uses comes from reliable sources, but do not guarantee the accuracy or completeness of this information, which is subject to change without notice, and nothing in this document shall be construed as such a guarantee. The statements in this service/document reflect the current judgment of the authors of the relevant articles or features, and do not necessarily reflect the opinion of Bloomberg Finance L.P., Bloomberg L.P. or any of their affiliates (“Bloomberg”). Bloomberg disclaims any liability arising from use of this document, its contents and/or this service. Nothing herein shall constitute or be construed as an offering of financial instruments or as investment advice or recommendations by Bloomberg of an investment or other strategy (e.g., whether or not to “buy”, “sell”, or “hold” an investment). The information available through this service is not based on consideration of a subscriber’s individual circumstances and should not be considered as information sufficient upon which to base an investment decision. You should determine on your own whether you agree with the content. This service should not be construed as tax or accounting advice or as a service designed to facilitate any subscriber’s compliance with its tax, accounting or other legal obligations. Employees involved in this service may hold positions in the companies mentioned in the services/information.
The data included in these materials are for illustrative purposes only. The BLOOMBERG TERMINAL service and Bloomberg data products (the “Services”) are owned and distributed by Bloomberg Finance L.P. (“BFLP”) except that Bloomberg L.P. and its subsidiaries (“BLP”) distribute these products in Argentina, Australia and certain jurisdictions in the Pacific islands, Bermuda, China, India, Japan, Korea and New Zealand. BLP provides BFLP with global marketing and operational support. Certain features, functions, products and services are available only to sophisticated investors and only where permitted. BFLP, BLP and their affiliates do not guarantee the accuracy of prices or other information in the Services. Nothing in the Services shall constitute or be construed as an offering of financial instruments by BFLP, BLP or their affiliates, or as investment advice or recommendations by BFLP, BLP or their affiliates of an investment strategy or whether or not to “buy”, “sell” or “hold” an investment. Information available via the Services should not be considered as information sufficient upon which to base an investment decision. The following are trademarks and service marks of BFLP, a Delaware limited partnership, or its subsidiaries: BLOOMBERG, BLOOMBERG ANYWHERE, BLOOMBERG MARKETS, BLOOMBERG NEWS, BLOOMBERG PROFESSIONAL, BLOOMBERG TERMINAL and BLOOMBERG.COM. Absence of any trademark or service mark from this list does not waive Bloomberg's intellectual property rights in that that name, mark or logo. All rights reserved. © 2018 Bloomberg.
Copyright and disclaimer

Coverage.Clean energyAdvanced transportCommoditiesDigital industry
Bloomberg NEF (BNEF) is a leading provider of primary research on clean energy, advanced transport, digital industry, innovative materials, and commodities.
BNEF’s global team leverages the world’s most sophisticated data sets to create clear perspectives and in-depth forecasts that frame the financial, economic and policy implications of industry-transforming trends and technologies.
BNEF research and analysis is accessible via web and mobile platforms, as well as on the Bloomberg Terminal.
Client enquiries:Bloomberg Terminal: press <Help> key twiceEmail: [email protected]
Learn more: about.bnef.com | @BloombergNEF