Embed Size (px)
Citation preview

Changing landscapes: futurescenarios for variable tuition fees
Research report
44915 UniUK Fees Report:44915 UniUK fees Report 06/03/2009 12:03 Page i

This series of Research reports published byUniversities UK will present the results of researchwe have commissioned or undertaken in support ofour policy development function. The series aims todisseminate project results in an accessible formand there will normally be a discussion of policyoptions arising from the work.
This report was prepared by CRA Internationalworking with Nigel Brown and Sue Boorman ofNigel Brown Associates.
During this project the consultants were guided bya Universities UK steering group led by Sir GraemeDavies. The consultants interviewed severalmembers of Universities UK and representatives ofthe four mission groups about the current highereducation market and how it might change in thefuture. We would like to thank everyone concernedfor their contributions.
Research reports
The copyright for this publication is held by Universities UK. The material may becopied or reproduced provided that the source is acknowledged and the material,wholly or in part, is not used for commercial gain. Use of the material forcommercial gain requires the prior written permission of Universities UK.
44915 UniUK Fees Report:44915 UniUK fees Report 06/03/2009 12:03 Page ii

4 Preface5 Summary
17 Introduction
1.17 The current system and the 2009 review
1.28 The selected scenarios
1.39 The evidence
1.49 Student data for the model
1.510 The structure of the report
211 The impact of tuition fees on the higher education
market2.1
11 The literature2.2
14 The interviews2.3
17 Trends in higher education enrolment2.4
18 Conclusions about the changing market3
19 The model and the methods3.1
19 The base data3.2
20 A micro-simulation based approach3.3
22 Simulating future cohorts3.4
22 The impact of the scenarios on institutions in England4
23 Quantifying the cost of scenarios4.1
23 The base case4.2
23 Summary of the results of scenarios 1 and 24.3
27 How individual institutions could use the model
Contents
Universities UK Changing landscapes 1
Changing landscapes: future scenarios forvariable tuition fees
44915 UniUK Fees Report:44915 UniUK fees Report 06/03/2009 12:03 Page 1

2
28 Appendix ACost centres
29 Appendix BInterview questions
30 Appendix CScenario results
34 Notes
44915 UniUK Fees Report:44915 UniUK fees Report 06/03/2009 12:03 Page 2

Universities UK Changing landscapes
33 Figure 21 Scenario 8 - capped interest-freeloans: private loans with real interest rate, £7,000 fee level
List of tables
9 Table 1 Scenarios to be investigated9 Table 2 HESA dataset – variables
included18 Table 3 Assumptions about elasticity of
demand in the model 19 Table 4 Entry cohort student numbers for
England, by degree type, 2006/0720 Table 5 Entry cohort student numbers for
England, by domicile of student, 2006/07
23 Table 6 The base case – England only24 Table 7 Scenario 1 - breakdown of tuition
fee income, 2014 (base case vs. scenario 1)
26 Table 8 Scenario 2 - breakdown of tuition fee income, 2014 (base case vs. scenario 2)
26 Table 9 Breakdown of tuition fee income, 2014 (base case vs. scenario 2, feerises only to £6,000 in some higher education institutions)
6 Figure 1 Model structure19 Figure 2 Model structure21 Figure 3 Three hypothetical lifetime
student earnings profiles21 Figure 4 Hypothetical real earnings
growth 23 Figure 5 Forecasted income from tuition
fees under base case24 Figure 6 Tuition fee income under
scenario 124 Figure 7 Total tuition fee income: new
regime (scenario 1) vs. base case25 Figure 8 Average total debt on graduation25 Figure 9 Total loan advanced (£m) and
total subsidy25 Figure 10 Tuition fee income under
scenario 226 Figure 11 Total tuition fee income: new
regime (scenario 2) vs. base case
26 Figure 12 Tuition fee income under scenario 2 (where fee rises only to £6,000 in some higher education institutions)
26 Figure 13 Total tuition fee income: new regime (scenario 2, where fee rises only to £6,000 in some higher education instutions) vs. base case
30 Figure 14 Scenario 1 - deferred payment: zero real interest rate (current income contingent loan), £5,000 fee level
30 Figure 15 Scenario 2 - deferred payment: zero real interest rate (current income contingent loan), £7,000 fee level
31 Figure 16 Scenario 3 - upfront payment: means-tested public support, £5,000 fee level
31 Figure 17 Scenario 4 - upfront payment: means-tested public support, £7,000 fee level
32 Figure 18 Scenario 5 - deferred payment: real interest rate (no means-testing), £5,000 fee level
32 Figure 19 Scenario 6 - deferred payment: real interest rate (no means-testing), £7,000 fee level
33 Figure 20 Scenario 7 - capped interest-freeloans: private loans with real interest rate, £5,000 fee level
Index of tables and charts
3
44915 UniUK Fees Report:44915 UniUK fees Report 06/03/2009 12:03 Page 3

4
The project also considers the widerimplications of a change to the fee cap beyondthose affecting member institutions. Theimpact on graduates and the cost toGovernment are also assessed. The reportprovides valuable evidence that will underpinthe forthcoming debate on the future of tuitionfees as well as informing the development ofUniversities UK’s policy position as theindependent enquiry begins its work.
Professor Rick Trainor
President, Universities UK
This report forms an important part of theprogramme of work that Universities UK isundertaking in preparation for theindependent review of variable tuition fees inhigher education in England that will beginthis year.
We are already monitoring annually a range ofquantitative indicators in order to establishthe impact of the introduction of variable feesin England from 2006: three reports have sofar been published. This new report, which isbased on work that CRA International hasundertaken over the past few months, extendsour work in a new direction by exploring theimpact of a possible increase in the fee cap.The aim of the study was to ’construct aneconomic model for a limited range of futurescenarios for variable fees, funding andstudent support that might be adopted inEngland following the Government’sindependent review of fees.’
In constructing the economic models CRAInternational was asked to assess theimplications of various scenarios involvingcombinations of, for example, different feelevels, different payment mechanisms anddifferent support regimes, includingbursaries. The results of the modelling workare summarised in this report but a user-friendly model, available to all Universities UKmembers, which will enable them to modeltheir institution’s financial position underdifferent possible tuition fee regimes, has alsobeen prepared. It should enable UniversitiesUK members (and others) to make informedjudgements about the effect of future fee andfunding regimes, and to assess the impact ontheir own institutions.
Any assessments made will need to takeaccount of rapidly changing economiccircumstances during a recession on all thoseinvolved in funding higher education.Assessments should be sensitive to theimpact of possible changes in the funding ofhigher education on students, graduates andthose parents, partners and others who helpto fund students’ higher education.
Preface
44915 UniUK Fees Report:44915 UniUK fees Report 06/03/2009 12:03 Page 4

Universities UK Changing landscapes
p different variable fee levels ranging from thecurrent position to an uncapped charge; basedon the interviews we have investigated theimpact of an increase in the fee to £5,000 andto £7,000;
p different mechanisms for fee payment and feesupport, which could include:
p deferred payment – loans with a zero realrate of interest with income-contingentrepayments, no means-testing (in otherwords the current mechanism);
p means-tested public support for an upfrontfee payment (that is, the pre-2006 feearrangements);
p deferred payment – loans at a real rate ofinterest with no means-testing. We haveassumed that this effectively removes thegovernment subsidy (other than thatattributable to default or forgiveness after25 years) as it charges for the full cost of itsown borrowing;
p uncapped tuition fees but with cappedtuition fee loans, with institutions providingmeans-tested fee support for the balancebetween the level of the fee and the cappedfee loan.
Based on the interviews we have assumed thatthere will be an associated bursary andmaintenance package that remains equallyimportant in relation to tuition fees as thecurrent arrangements (where on average a thirdof the additional fee income is returned tostudents as bursaries).
Inputs to the model
It is clear from this review that the currentregime has not created an ‘economic market’where price is a significant factor in determininghow students choose the university they go toand where universities compete on price toattract students. Based on our research we haveconcluded that:
p An increase in the fee of up to £5,000 a year iseffectively maintenance of the status quo.With a cap at this level universities would notexpect to change their behaviour by settingdifferential fees by course or in terms ofstudent response. The price elasticity ofdemand for tuition fees below £5,000 a year iseffectively close to zero; students areinsensitive to variations in tuition fees belowthis level. We assume that it is zero for thepurposes of the model.
The terms of reference for this study were to‘construct an economic model for a limitedrange of future scenarios for variable fees,funding and student support that might beadopted in England following the Government’sindependent review of fees in 2009’. The aim wasto develop a user-friendly model, available to allUniversities UK members, to enable them tomodel their institution’s financial position underdifferent possible tuition fee regimes.
The project assessed the implications of eachscenario for the finances of:
p different types of university;
p students; and
p government.
This project will contribute to Universities UK’spreparations for the tuition fee review in 2009.The report and the model cover only institutionsin England providing higher education to full-time students who are liable to pay tuition fees.Higher education programmes covered by thesetuition fee regulations are full-timeundergraduate degrees and postgraduatecourses of initial teacher training. However, themodel has been designed so that it couldrelatively easily be extended to include part-timestudents in England and full- and part-timestudents in the other countries of the UK.
To develop this model we have reviewed theevidence on the current working of the feesmarket today. This includes a review of theliterature in the UK and also internationally. Tocalibrate the sets of assumptions and gauge theresponse of different types of respondents tofactors such as different fee rates and loanthresholds we have undertaken interviews withtwelve vice-chancellors from a range ofuniversities with different perspectives on themarket. The sample was selected in consultationwith Universities UK in order to reflect thediversity of higher education institutions. Wealso commissioned a dataset from the HigherEducation Statistics Agency (HESA) on thestudent population today, covering allinstitutions in England in 2006/07.
The selected scenarios
There are many different scenarios depicting thepossible future financing of higher education.Many have been considered by different reviewsover the last ten years. The scenariosinvestigated in this assignment were developedby the Universities UK steering group and theproject team to cover the range of possiblescenarios in the period 2012–16. The scenariosinvestigated include1:
Summary
5
44915 UniUK Fees Report:44915 UniUK fees Report 06/03/2009 12:03 Page 5

6
Figure 1:
Model structure
Source: CRA analysis
The model is a micro-simulation Monte Carlo-type model. This type of model is used becausein forecasting student financing repaymentbehaviour, it is the profile of earnings (ratherthan average earnings) that determines whenloans are repaid.
The outputs of the model
The model produces outputs relevant for thethree different sets of stakeholders for theperiod 2012–2016:
p higher education institutions: the gross andnet income (after allowing for bursaries) fromtuition fees for different types of student. Thiscan be presented for the sector as a whole orfor different types of institution;
p graduates: the average student debt ongraduation and the repayment profile; and
p government: the impact on the principal paidout in each year and the subsidy associatedwith loans issued in each year taking intoaccount the interest charged on the loan.
The model also allows any institution tocategorise other institutions into usefulcomparator groups (or tiers). A group couldinclude only itself or other institutions withsimilar characteristics. These characteristicscan be defined by the user but could include thenumber of full-time students, the number ofinternational students or the proportion of lowincome students. Alternatively the user cansimply define the particular institutions that itwould like to be in a comparator group. Themodel simulates the impact on studentparticipation and the revenues for the individualinstitution or tier.
p Increasing fees above the £5,000 level wouldlead more and more universities to reviewtheir policy of setting fees below the cap.Between £5,000 and £7,000 we would expectto see a price elasticity of demand that isgreater than zero but remains inelastic (a lessthan proportionate reduction in enrolment foran increase in tuition fee):
p elasticity is clearly higher for institutionswith students who are debt averse. Soinstitutions whose students comedisproportionately from lower incomehouseholds will face a higher elasticity ofdemand;
p universities that draw students from UKdomiciles other than England will face ahigher elasticity of demand. However, theseinstitutions are already focusing onstrategies to compete on quality rather thanprice. The impact of this factor is thoughtlikely to be small.
p The introduction of a real rate of interestwould not immediately have an impact on thenumbers of students enrolled (if it wasincorporated into a public scheme) and weshould assume that students would react tothe headline tuition fees. However, theadoption of a real rate of interest could affectrepayment behaviour.
p The reaction of students to a private loan atcommercial rates could lead to a significantreduction in enrolments.
p Few institutions would exploit the ability toraise fees above the cap if it resulted in theneed for commercial loans from privatefinancial institutions.
Based on this input the model has beencalibrated to allow for student behaviour underthe different scenarios. However, it is alsostraightforward to change the sensitivity ofstudents to different components of the studentfinance regime.
The model
To simulate the cost of different tuition feescenarios we have created a financial model. Themodel explores the financial implications for thethree different sets of stakeholders: students,institutions and the government. A stylisedschematic of this is set out in Figure 1.
Policy parameters: Fee thresholdsReal interest rateMeans-testing
Funding module: Impact of student numbersFee incomeBursary
Graduate labour market module: Stochastic earning profiles by type of studentEmployment transitions
Repayment module: Application of policy parameters on repaymentWrite-offsApplication of interestSubsidy
Tier 2 Tier 3
Scenario testing
Implications forInstitutions
Implications bystudent type
Implications for government
Tier 1
44915 UniUK Fees Report:44915 UniUK fees Report 06/03/2009 12:03 Page 6

Universities UK Changing landscapes 7
p a student loan for maintenance also providedby the Student Loans Company: the maximumloan for maintenance for a full-timeundergraduate student in 2008/09 is £6,475for students studying away from home inLondon. The maximum figure for thosestudying outside London will be £4,625 for2008/09. All eligible full-time students can geta student loan for maintenance. The exactamount students can borrow depends onseveral factors, including household income4,where the student lives while studying andwhether s/he is in the final year of the course.The loan amount is also affected by any helpreceived through the maintenance grant(though not the special support grant)5.
p students may also be eligible for means-tested higher education maintenance grants.New entrants to higher education in 2008/09with an annual household income of £60,005or under will get at least a partial grant. Newentrants to higher education in 2008/09 withan annual household income of £25,000 orunder will get the maximum grant of £2,835for 2008/09. For 2008/09, a third of all newstudents are expected to receive the fullamount of maintenance grant, while a furtherthird will receive a partial grant, depending ontheir household income.
p institutions that charge fees between £2,700and £3,000 have to provide non-repayablebursaries for students eligible for the fullhigher education maintenance grant orspecial support grant of at least £300 for2006/07 and £310 for 2008/09.
Student loans are repayable after students havefinished their course and are earning more than£15,000 a year6. The first repayment is due in theApril after leaving the course (from the start ofthe new tax year). Currently graduates pay 9 percent of any earnings over £15,000 (or themonthly or weekly equivalents) but they canchoose to repay more and clear the loan faster.The loans are charged an interest rate equal tothe rate of inflation in that year; in effect theloans have a zero real interest rate, with theresult that the Government is subsidising theloans compared to its own cost of borrowing.
In practice, although institutions theoreticallyhad the choice whether to charge the full tuitionfee, almost all chose to set the fee at the £3,000cap. A small number of institutions decided tocharge below the cap or to charge a lower fee forparticular courses (for example, sub-degrees).
The terms of reference for this study were to’construct an economic model for a limitedrange of future scenarios for variable fees,funding and student support that might beadopted in England following the Government’sindependent review of fees in 2009’. The aim wasto develop a user-friendly model, available to allUniversities UK members, to enable them tomodel their institution’s financial position underdifferent possible tuition fee regimes.
The project assessed the implications of eachscenario for the finances of:
p different types of university;
p students; and
p government.
This study will contribute to Universities UK’spreparations for the tuition fee review in 2009.The report only looks at institutions in Englandproviding higher education to full-time studentsliable to pay tuition fees2. Higher educationprogrammes covered by these tuition feeregulations are full-time first or undergraduatedegrees and postgraduate courses of initialteacher training.
1.1 The current system and the 2009 review
The current variable fees regime was introducedin 2006/07. The fundamental elements of thecurrent system are:
p a tuition fee with a cap of £3,000 (up-rated byinflation each year3) - for ’home’ and EUstudents admitted from 2006/07 followingfull-time undergraduate programmes at auniversity or college in England. The cap hassince been increased to £3,145 in 2008/09.
p a non means-tested student loan for tuitionfees provided by the Student Loans Company;the maximum loan a full-time highereducation student could be eligible for in2008/09 to cover the cost of tuition fees is£3,145. A student is entitled to a loan for eachyear of their undergraduate course.
1Introduction
44915 UniUK Fees Report:44915 UniUK fees Report 06/03/2009 12:03 Page 7

8
1.2 The selected scenarios
There are many possible scenarios for financinghigher education in the future. Many of thesehave been considered by different reviews overthe last ten years9. The scenarios we investigatedwere developed by Universities UK and theproject team to cover the range of possiblescenarios in the period from 2012 to 2016. Theytherefore take the existing arrangements as thestarting point and adapt the model in severaldirections. The aim is to highlight the merits ofdifferent systems, even if the system theGovernment eventually adopts turns out to havea combination of these features.
The scenarios we selected for investigationinclude10:
p different variable fee levels ranging from thecurrent position to an uncapped charge; basedon the interviews, we have investigated anincrease in the fee to £5,000 and to £7,000;
p different mechanisms for fee payment and feesupport, which could include:
p deferred payment – zero real rate ofinterest loans with income contingentrepayments, no means-testing (i.e. thecurrent mechanism);
p means-tested public support for an upfrontpayment (i.e. as in the pre-2006 feearrangements);
p deferred payment – loans at a real rate ofinterest with no means-testing; we haveassumed that this effectively removes thepublic subsidy (other than that attributableto default or forgiveness after 25 years) asthe Government charges at its own cost ofborrowing;
p uncapped tuition fees but with cappedtuition fee loans, with institutions providingmeans-tested fee support for the balancebetween the level of the fee and the cappedtuition fee loan;
p an associated bursary and maintenancepackage – which we have assumed remains asimportant as the current arrangements (andassumes that on average a third of additionalfee income is returned to students asbursaries).
There has been a much greater degree ofvariability in the implementation of bursariesacross different institutions7. Whereas someinstitutions have effectively offered a flat bursaryto all students, others have targeted bursarieson students from lower income families. Theresult is that the schemes vary considerably intheir complexity and the maximum bursaryoffered.
On 26 January 2004, the then Secretary of Statefor Education and Skills announced during thereport stage of the higher education bill that theGovernment would establish an independentreview in 2009 to report to Parliament on allaspects of the new variable fee arrangements inEngland, based on evidence from the first threeyears of operation and other policies. This reviewwould therefore cover the three academic yearsfrom 2006/07 to 2008/09.
The draft remit of the review covered:
p the impact of the new arrangements on highereducation institutions, including the extent towhich higher education institutions havevaried fees, the additional income raised,provision of bursaries and the effect on theacademic portfolio;
p the impact of the new arrangements onstudents and prospective students, includingthe overall level of applications, participationrates by different socio-economic groups,student support arrangements, choice ofinstitution, choice of mode, completion ratesand level of debt;
p future policy: changes to the graduatecontribution scheme and the upper limit fortuition fees, and changes in the arrangementsfor student support.
Our report focuses on the last of these areas. Wereview evidence on the current working of themarket to see what this tells us about futurechanges in the market. To be pragmatic we focuson how a new regime would change the highereducation sector between 2012 and 2016. Wehave assumed that 2012 will be the earliest datein which any change in the financing of highereducation could be introduced and focus on thefollowing five years to allow us to understandhow the changes would affect the market oncethey settle down. Given the ongoing changes instudent demographics and the evolution ofpolicy, a five-year time frame is also pragmaticfrom a policy perspective8.
44915 UniUK Fees Report:44915 UniUK fees Report 06/03/2009 12:03 Page 8

Universities UK Changing landscapes 9
Interviews were conducted by telephone underChatham House rules on the basis of a commonset of questions (see Appendix B).
1.4 Student data for the model
We commissioned a bespoke dataset from theHigher Education Statistics Agency (HESA) onthe student population today. This covers allinstitutions in England in 2006/07 and includesover a million observations.
Table 2:
HESA dataset – variablesincluded
Variable Categories
Domicile UK / EU
Higher education institutions 169 UK institutions (of which 133 in England)
Gender Male / female
Degree-type First degree / other undergraduate degree
Degree differentiator Segmented in three classes on the basis of cost (set out in Appendix A)
Expected course length 1,2,3,4,5
Year of study Filtered on Year 1
Average student age
Proxy for parental income 9 categories
(1) Managers and senior officials, (2) Professional
occupations, (3) Associate professional and technical
occupations, (4) Administrative and
secretarial occupations, (5) Skilled trades and personal
service occupations, (6) Sales and customer
service occupations, (7) Process, plant and machine operatives,
(8) Elementary occupations, (9) Retired/unemployed
Source: CRA analysis
This report sets out the results for eightscenarios as listed below.
Table 1:
Scenarios to be investigated
Scenario Tuition Loan Bursary/fee cap scheme maintenance
package
Scenario 1: £5,000 No means test, Same asCurrent loan system zero real today
Scenario 2: £7,000 No means test, Same asCurrent loan system zero real today
Scenario 3: £5,000 Means-tested, Same asMeans-tested support zero real today
Scenario 4: £7,000 Means-tested, Same as Means-tested support zero real today
Scenario 5: £5,000 No means test, Same asReal rate of interest real rate today
Scenario 6: £7,000 No means test, Same asReal rate of interest real rate today
Scenario 7: £5,000 Capped public loans Same asCapped loans £3,000 today
Scenario 8: £7,000 Capped public loans Same asCapped loans £3,000 today
Source: CRA analysis
1.3 The evidence
We did a literature review on the impact of tuitionfees on higher education students anduniversities. We considered the evidence on theimpact of the introduction of the £3,000 fee in theUK and how tuition fees have changed studentbehaviour in other countries.
To calibrate the sets of assumptions and gaugethe response of different types of respondents tofactors such as different fee rates and loanthresholds, we interviewed a sample of twelvevice-chancellors from a range of institutionswith different perspectives on the market. Thesample was selected in consultation withUniversities UK to reflect the diversity ofuniversities and differentiating features such as:
p local / national recruitment;
p metropolitan or rural location;
p elite, other pre-1992, post-1992 and post-2004 universities;
p widening participation;
p high ethnic minority recruitment;
p whether principally serving local or nationallabour markets.
44915 UniUK Fees Report:44915 UniUK fees Report 06/03/2009 12:03 Page 9

10
1.5 The structure of the report
The report has three further chapters.
In Chapter 2, we set out how the current highereducation market works, the evidence from theliterature and from the interviews with thesample of vice-chancellors.
In Chapter 3, we explain the model created tocost the eight scenarios.
In Chapter 4, we set out the results of the costingmodel, the implications for differentstakeholders, and how the model could be usedby individual institutions.
44915 UniUK Fees Report:44915 UniUK fees Report 06/03/2009 12:03 Page 10

Universities UK Changing landscapes 11
To understand how the higher education marketin England would react to different tuition feescenarios we have drawn upon:
p evidence on how institutions responded to theintroduction of the £3,000 tuition fee cap andassociated bursaries;
p the existing literature on the UK and relevantinternational markets; and
p interviews with vice-chancellors from asample of higher education institutionsreflecting the range of institutionalcharacteristics in England.
2.1 The literature
It is clear that the current system with amaximum annual fee of around £3,000 has notresulted in an economic market. As Chester andBekhradnia point out, there is little ’variability infee levels and therefore the market in highereducation, which the Government believes isnecessary to improve quality and choice, is notcurrently operating in the way it anticipated’11.Foskett and colleagues found that mostinstitutions charge the maximum fee, whichimplies that the previous announcement of anupper price limit had failed to create a market12.
Price insensitivity of students with respect toenrolment
Although Foskett and colleagues say that thereare no specific estimates of the price elasticity ofdemand for higher education in the UK, theyobserve that the market is generally priceinelastic13. Evidence from the introduction of feesin the UK in the past, along with evidence fromAustralia’s Higher Education ContributionScheme (HECS), shows that students havegenerally been price insensitive when it comesto deciding whether to enrol in higher education.
So far, the limited effect of fee changes onstudent demand for higher education is partlyexplained by the fact that the biggest increasesin fees have been masked by the availability ofpublic funding for full-time undergraduates14.The same paper notes that part-time and post-graduate students, who have very limited accessto public financial support, have not beendiscouraged from participating.
However, it seems likely that individuals fromlower socio-economic groups are more sensitiveto price than those from higher groups. Anarticle in 2005 on the BBC website suggestedthat the higher costs associated with theintroduction of variable fees would lead to aslight increase in those who had regrets abouthaving gone to university, mainly reflecting thehigher level of regret about entry to highereducation among the most financiallydisadvantaged. Moreover, the impact ofprospective debt was even greater for disabledstudents, probably because they are less able towork to pay their bills15. According to Foskett,groups likely to be the most price sensitiveinclude:
p students in London;
p those thinking of studying in London;
p students unsure about the value of a graduateeducation;
p poor students;
p mature students; and
p recent graduates considering postgraduatetraining.
Foskett interviewed potential higher educationapplicants who decided not to go to university.Although respondents were concerned about therisk of the debt they would accumulate if theywent to university, fees and loans were not themain deterrent in their decision against highereducation. These respondents simply did notconsider themselves as ‘ready to embark on acareer path’16.
Evidence from other countries
The evidence above as well as news articlesthrow light on the impact of the introduction ofthe HECS in Australia. Participation in highereducation has continued to rise while socialclass representation has remained broadlystatic.
In 2005, when Australian universities wereallowed to increase fees by 25 per cent, almostall of them did so, and those that did not wereunable to increase their market share. OneAustralian university even reduced its fees tozero, but this did not result in any significantincrease in enrolments. Although thecomposition of the student body is different inAustralia and has different expected behaviourpatterns to the UK, this evidence suggests thatparticipation and enrolment in higher educationare not necessarily affected by increasing feelevels17.
2The impact of tuition fees on the higher educationmarket
44915 UniUK Fees Report:44915 UniUK fees Report 06/03/2009 12:03 Page 11

12
In the United States, where there is a much more‘free market approach’18 to the pricing of highereducation programmes, a high price sometimesincreases the desirability of attending aparticular institution – some argue that eventhough there might be concerns about theaffordability of higher education in the UnitedStates, the fact that a high price is often seen asan indicator of high quality often detersinstitutions from contemplating tuition fee cuts.However, higher education in the United Statesis in many ways very different from the Englishsystem where tuition fees represent a relativelysmall proportion of teaching costs, assumedfamily contributions are low, and government isresponsible for most of the financial support thatstudents receive19. The English system may moreclosely resemble Australian higher education,where perceived quality is influenced by requiredentry grades rather than price or fee levels20.
Impact on widening access
Although there is no established evidence thatan increase in fees will affect the level ofenrolment, Davies and colleagues note concernsabout changes that would shift more of thefinancial burden to students, and which mightwork against stated policy that aims to widenparticipation. Davies also points out that anyincrease in fees disproportionately affects thosefrom lower socio-economic backgrounds, whoare more debt averse, and who have lowerexpected earnings after graduation21.
Fear of debt
Davies refers to research showing that debtaverse students were less likely to enter highereducation than those who were debt tolerant,and that students from financially disadvantagedbackgrounds have been found to be more debtaverse than their wealthier counterparts. InDavies’ own survey, 59 per cent of students fromselected urban areas reported that avoiding debthad ‘much’ or ‘very much’ affected their decisionto enter higher education. It is not just a questionof attitudes to debt, but a question of real anddifferential risk which will be exacerbated if feesrise – students from lower income families takea greater risk when enrolling in higher educationthan their counterparts from wealthierbackgrounds, especially if what they earn atgraduation does not meet their initialexpectations22. Nevertheless, the incomecontingency of the repayment regime and theprovision for loan forgiveness mean in practicethat the risk is shared with Government and allother borrowers.
Lack of appropriate information
It is possible that the fear of debt stems fromlack of information about the benefits of highereducation and the financial support available tostudents. Although potential students do knowabout the key aspects of the higher educationfunding system, they know very little about whatfinancial support (grants and bursaries) they canaccess23. A recent press article suggested thatthe main factor deterring students of low-income families from pursuing a degree, orprompting them to stay at home if they do, is thelack of knowledge about financial support andconfusion about the different types of debt thatthey may incur24.
A report into student finance argues that makingmarginal changes to the current system mightcomplicate it to the extent that students areeither deterred from entering higher educationat all or from claiming their full entitlements25.There is also no doubt that a more complexsystem would be extremely difficult toadminister.
The contrary position, however, has beenarticulated by Professor Nicholas Barr who isoptimistic about students’ ability to access anddigest information about higher education. Heargues that students are largely well informed,and believes that higher fees, which will lead togreater competition in higher education, willultimately benefit them as consumers26.
44915 UniUK Fees Report:44915 UniUK fees Report 06/03/2009 12:03 Page 12

Universities UK Changing landscapes 13
Choice of institution
Social differences influence students’ tendencyto stay at home and attend a local university,instead of going to a university away from home.Among students who are considering going touniversity, their financial background is a strongindicator of whether they will decide to live athome27.
Davies found that students with an Asian ethnicbackground are more likely than other ethnicgroups to plan to live at home while studying.The reluctance to move away has a social as wellas a financial aspect – students from Asianbackgrounds are more likely to live at home,whatever their financial circumstances, to ’drawon their existing social networks’28.
The number of students planning to study atuniversities close by so they can live with theirfamilies has risen from 18 per cent in 1998 to 56 per cent in the beginning of 200829. However,the validity of these figures has been questioned.The reason behind the high percentageconsidering going to a local university may be theready availability of local institutions for theparticipants interviewed. Detailed data on thedistance between home and place of studysuggests that the decline observed in recentyears has now slowed significantly.
Choice of course
With higher fees, one can expect fewer studentsto progress to postgraduate study, fewerstudents to choose longer courses such asarchitecture or engineering, and more studentsto work part-time (not only to cope with higherfees, but also to support a decent studentlifestyle and gain skills and experience)30. Aconcern with debt repayment can affect careerpreferences, which in turn affects the type ofcourse pursued31. Students may choose to studypart-time rather than full-time, especially if theycan continue to work while pursuing a degree32.
Type of student
Students’ perceptions of their future place in thelabour market and their earnings potential can bea disincentive, especially for students from lessadvantaged backgrounds, to enter highereducation. Most studies on the benefits ofparticipating in higher education in the UK suggestthat the rates of return are high enough to provideclear economic incentives to participate – thesestudies base their conclusions on estimates of theaverage rate of return to graduation. However,Adnett and Slack note that this average rate couldoverestimate the returns of higher education to‘marginal entrants, particularly those fromdisadvantaged backgrounds’33.
Gender differences in expected earnings andperceived debt might also influence incentives toparticipate in higher education. Women areexpected to earn less than men upon graduation(the gender pay gap). This, along with the time awoman may take off from work for maternity leaveor to care for children, results in women takinglonger to repay their student loans. On average, awoman stays in debt for a relatively long time –women graduates face 16 years of student debtwhile men can expect to settle the bill for theireducation within 11 years. One might expect thatan increase in fees would therefore adverselyaffect female participation in higher education34.
Bursaries and private loans
Tuition fees are only one factor; institutions offerbursaries and where increased tuition fees are notfunded through public loans, private institutionsmight be used to finance the additional charge.Many institutions offer bursaries on a means-tested basis of considerably more than theminimum requirement specified by government.Chester and Bekhradnia cite the Director of theOffice for Fair Access (OFFA)’s observation thatvariable bursaries, rather than variable fees, arewhere the market place for higher educationcurrently operates35.
Bursaries usually make a difference to a studentonly when they are large and universities withthe fewest poor students can afford to offer thehighest bursaries36. But economicallydisadvantaged students are the ones for whombursaries are most important. Only 6 per cent ofstudents from families with incomes of above£35,000 reported that bursaries would be afactor in choosing a university (compared to 11 per cent for an ‘average’ student). For blackstudents, nearly 30 per cent consider bursariesto be important.
44915 UniUK Fees Report:44915 UniUK fees Report 06/03/2009 12:03 Page 13

14
Evidence on the take-up of bursaries shows thatthere is a significant difference between thenumber of students eligible for bursaries andthe number of bursary awards actually paid. Thisis the primary reason for the differencesbetween universities’ estimated and actualexpenditure37. The OFFA report indicates that, in2006-2007:
p 58 per cent of higher education institutionsspent below 90 per cent of their predictedexpenditure on bursaries;
p 8 per cent spent between 90 and 100 per cent;and
p 33 per cent spent 100 per cent or more thanthey had predicted.
In the same time period, 12,000 students whowere eligible for a bursary did not consent toshare information provided to the Student LoansCompany with their university (by ticking theappropriate box on a form) and therefore couldnot be awarded bursaries.
Private loans and loans with market interestrates
The Institute for Fiscal Studies argues that if it isuncertainty around future earnings that mostdeters potential students from taking on the costof studying at university, then introducing acommercial interest rate for maintenance loanswould require graduates to take on substantiallymore risk38.
The rising use by students of private loans in theUnited States shows clearly that private loanshave extremely high costs (the average annualinterest rate charged was 11.5 per cent), withorigination fees averaging 4.5 per cent of theloan volume.
Institutional funding
The analysis above has focused on whether thedemand for higher education would be affectedby the level of tuition fees or the financingarrangements that students are offered.However, the price that institutions charge isalso determined by their financial constraints.
The higher education sector in the UK is underconsiderable financial pressure. Some highereducation institutions are in debt. All facesignificantly increasing salary and operatingexpenses year on year, which are coupled withthe need for major capital investment to provideestates and facilities that meet disability accessrequirements and provide for a growing andincreasingly diverse student body with risingexpectations. Participation in higher education inthe UK has increased dramatically over the past40 years, but this increase has not beenaccompanied by a proportionate increase infunding. HEFCE reported early in 2008 that thecurrent level of borrowings by higher educationinstitutions, as a proportion of the level of totalinstitution income, is the highest since 199739.
2.2 The interviews
To provide some underpinning of the centralassumptions on tuition fees and student supportthat we have modelled, we asked a sample ofvice-chancellors from 12 universities for theirviews on several key questions.
Because of the small size of the sample and theneed to operate within Chatham House rules sothat the views of individual vice-chancellorswere not disclosed, the responses presentedhere cannot be fully quantified, but offer anoverall but well-informed view of futuredevelopments.
The questions we raised were aimed at:
p identifying a fee level at which undergraduateteaching provision would be sustainable in thelonger-term;
p identifying a fee level at which a real marketwould emerge, with different institutionscharging different fees for differentprogrammes;
p assessing the likely response of institutions toa system in which full-time fees werederegulated (the fee cap removed) but publicsubsidy in terms of public loans was limited toa lower fee;
p assessing the likelihood of the emergence ofdifferential fees by subject;
p assessing the potential impact of changes tothe loan repayment regime, in particular theintroduction of a real rate of interest onstudent loans, on participation andinstitutional behaviour in respect of settingtuition fees and any decision to limit publicfunding support to a fee level below anyassumed cap;
44915 UniUK Fees Report:44915 UniUK fees Report 06/03/2009 12:03 Page 14

Universities UK Changing landscapes
Some were concerned about the impact of anyincrease in the tuition fee because of the natureof their student body. However, as was alsopointed out to us, the income-contingent natureof repayments ought to make individuals lesssensitive to the total size of the fee loan.
The emergence of a tuition fee market
As might be expected, vice-chancellors differedin their estimates of the fee level at which theirinstitution might decide to charge below themaximum permitted fee and the fee level atwhich others would consider charging less thanthe maximum. There was clearly a balance to bestruck between maximising institutional income,providing the appropriate signal on quality, andnot putting off certain groups of potentialstudents.
Some pointed out that, even at the current level,some institutions had decided either to offer afee at £2,700 or below (the maximum fee allowedif statutory bursaries are not available) or to offerbursaries to a very high proportion of theirstudents, based on a high qualifying level ofparental income. Any increase in the fee aboveits present level in real terms would be likely toincrease the number of institutions choosing tocharge less than the maximum, and at amaximum fee level of £7,500 a market wouldbegin to emerge. A full market fee regime would,however, only emerge if maximum fee levelswere above £10,000.
The potential impact on student demand and thebehaviour of competitor institutions were the keyfactors that vice-chancellors identified asaffecting any decision to charge below themaximum permitted fee. For example, levels ofdemand for particular subjects, rather than cost,would be the principal determinant of thesubjects for which institutions would choose tocharge higher fees in a more differentiatedmarket system.
However, some interviewees considered thatprice would be a very important signal of qualityin any market and it would be necessary toexercise due caution in setting fees below thepermitted maximum.
p assessing how bursaries might develop infuture;
p finding out views about the sensitivity ofstudent demand to potential debt levels ongraduation;
p assessing the possible impact of thedemographic decline in demand between2010 and 2019 on institutional decisions aboutfee levels;
p tailoring the model better to offer the kind offeatures institutions would find desirable interms of outputs and the ability to vary theinputs.
Tuition fee levels required for sustainability
Between them interviewees suggested a verywide range in the level of the fee that would berequired to secure the long-term sustainabilityof undergraduate teaching. The median figurewas around £6,500 at 2009 prices.
The variation in the suggested fee level reflectedin part the comparators on which individual vice-chancellors drew and might also reflectdifferences in subject mix and the variation inease of recruitment. Currently all the assumeddifferential in costs by subject is in effect carriedby the HEFCE grant.
In probing vice-chancellors about the fee levelrequired we asked them to assume no change inthe current level of HEFCE funding. Somecommented that they believed that thisassumption was unsafe in the light of the reviewof the teaching funding method and recentlyimposed policies such as the withdrawal offunding for students studying for a second orsubsequent qualification at a level equivalent orlower (ELQ) than one they already held.
All vice-chancellors pointed to the continuingfaster rise in their operating costs than the factorassumed for updating tuition fees in line withinflation. Several also pointed out the one-offincrease in costs (separate from annual paysettlements) that they faced from theintroduction of the new pay framework and thecosts of keeping their infrastructure up-to-dateand competitive.
There was a general recognition of the politicaldifficulties for the Government in going toParliament to seek a substantial increase in thefee cap and the financial difficulties of increasingthe loan subsidy to graduates as would berequired by an increase in the publicly supportedfee loans. Yet, without any increase, muchundergraduate teaching would be increasinglyunsustainable after 2010.
15
44915 UniUK Fees Report:44915 UniUK fees Report 06/03/2009 12:03 Page 15

16
An assumption that students would meet thebalance of the fee from commercial borrowingwould radically change the dynamics of thecurrent system. Such a mixed public/privatefunding system would be socially regressive.Some students from poorer families could findthemselves unable to secure such loans becauseof the lack of any family credit history and theywould thus be forced to enrol at an institutioncharging fees within the publicly funded cap. Itsintroduction would also be strongly contested bystudents and their representatives, who wouldargue that commercial lenders could not betrusted to ensure the availability of finance or tokeep to the conditions attached to loans, such asinterest rates.
Differential fees by subjects
Several vice-chancellors noted that theirinstitutions already charged lower fees forfoundation degrees, sub-degree and foundationprogrammes, but so far they had not chargeddifferent fees to home and EU undergraduatesaccording to what subjects such students werestudying. Fees for international students,however, were not only higher but also oftenalready differentiated by subject of study. Theonly circumstance in which many vice-chancellors would contemplate proposing tocharge differential fees on a subject basis forhome (and EU) undergraduates would be if thefee cap was removed altogether.
Pricing policy would be driven largely by thepopularity of subjects in terms of the number ofapplicants per place. However, it might also beused to convey signals about quality toprospective students.
A real rate of interest on student loans
The absence of a real rate of interest on studentloans made by the Student Loans Companyrepresents the principal element of the publicsubsidy of these loans. Opinions varied onwhether a decision by Government to chargefuture students a real rate of interest would haveany real impact on demand.
Those who believed it should have little or noimpact argued that it would have no effect on therepayment rate, but only on the repaymentperiod. Others believed that it would restore debtaversion as a factor by making the student loansmore similar to commercial loans and thus actas a disincentive to participation.
The impact of introducing a capped publiccontribution to fees
We asked vice-chancellors to consider ascenario in which the public contribution totuition fees was capped through limiting theavailability of publicly subsidised loans, but withinstitutions able to charge fees above this level.Some thought that this was a likely outcome, butthat it would raise very significant issues abouthow students would meet the balance betweenthe publicly supported fee and the fee charged bysome institutions. Some considered that theirinstitution would charge above the publiclyfunded maximum while others considered theirinstitution would only charge at the maximumpublicly funded level assuming that this was setat a level that they felt able to charge within theirparticular market.
The presumption that the balance of the feeabove the publicly funded element would have tobe paid upfront would be a significantdisincentive to participation by some types ofstudent. This alone would limit the willingness ofsome institutions to charge fees above thepublicly funded fee cap.
Those vice-chancellors who considered thattheir institutions would decide to charge feesabove the maximum eligible for public fundingsupport recognised that they would need toextend their bursary arrangements or introducea scheme of fee waivers. This would need toinclude students from a wider range of familyincomes than the current means test because ofthe difficulties students from middle-incomefamilies would face in raising the balance of thefee. Bursaries would also need to be moretargeted towards supporting fees. Fee waiverswere not generally supported, however, as theyhad a significant administration cost. Studentbursaries on the other hand were currentlycentrally administered by the Student LoansCompany (for most institutions).
It was also inevitable that such a system wouldbe more complex than the current system offinancial support and even this system is notwell-understood by many students or theiradvisers. The increased complexity mightcompletely deter some students from enteringhigher education.
44915 UniUK Fees Report:44915 UniUK fees Report 06/03/2009 12:03 Page 16

Universities UK Changing landscapes
Price sensitivity of student demand
Arguably, with the current deferred paymentarrangements for full-time undergraduatetuition fees, demand should not be sensitive tothe fee level, but the fact that potential studentstend not to understand the deferred paymentsystem means that some still worry about feelevels and graduate debt. Nevertheless, inpractice, since the introduction of the variabletuition fee arrangements in 2006 there has beenlittle impact on overall demand. A few vice-chancellors felt that it has had some impact onsubject choices by students.
On the other hand many of the intervieweesthought that prospective changes to the financialregime in terms of fee levels, debt incurred orloan repayment terms could have a significantimpact on students’ choice of institution orsubjects. Vice-chancellors perceived thatdemand was no longer price-inelastic. Theemergence of a differential fee regime either byinstitution or subject would be likely in their viewto distort the pattern of demand.
2.3 Trends in higher education enrolment
The academic literature and the interviews bothhighlighted the need to take into accountdemographic changes within the UK andworldwide.
Demographers and others have warned that thelow birthrate in the 1990s means that thenumber of 18-year-olds in the UK will falldrastically between the years 2010 and 201940. Itfollows that unless participation rates go up, thenumber of entrants to UK universities over thenext decade appears likely to decline whateverthe prevailing higher education fee arrangements.Universities are facing increasing competitionfrom private colleges which are now accreditedto award qualifications and in some cases havereceived degree-awarding powers. These couldcompete for traditional undergraduates41.Several of the vice-chancellors considered thattheir institution would be shielded from theimpact of the projected demographic declineeither because of the region they served or thetypes of student that they mainly recruited. A fewacknowledged, however, that the demographicdecline would significantly affect theirrecruitment and have implications for the tuitionfee levels that they were able to charge.
A real rate of interest would increase totalrepayments (although not the repayment rate)and therefore affect the net benefit of full-timeundergraduate higher education to individuals.This could shift the balance against participationfor people wishing to study certain subjects wherethe financial benefit was already below average orfor certain types of individuals, such as olderstudents, whose earning potential was lower.
Some vice-chancellors saw the option ofcharging a real rate of interest on part of thestudent loan as a solution that would allow theremoval of the cap on tutition fees while keepinga cap on the public spending contribution; feeloans with a zero real rate of interest wouldcontinue to be available up to a specified fee level,with loans at a real rate of interest also availableto meet the cost of the balance of a higher fee.Such an option, although complex, would bepreferable to involving commercial banks.
The future development of bursaries
Most of the vice-chancellors interviewed did notconsider that the current bursary scheme wasfulfilling its stated aim – to remove the financialbarrier to higher education for students from low-income families. Even institutions that had simplebursary schemes had experienced lower take-upthan expected, reflecting in part the forms thatstudents had to fill in when applying for nationalstudent support. Opinion was, however, divided onwhether a national minimum bursary scheme,funded by top-slicing institutions’ additional feeincome, was a desirable way forward.
Several interviewees observed that theavailability of bursaries does not appear to be amajor factor in student decisions to apply for aparticular institution. Although there was somelimited support for the alternative of a feewaiver, most believed that it would have similarlylittle effect on the choice of institution within thecurrent fee regime and would have to beadministered locally.
Despite the general view that the currentbursary scheme had not served its intendedpurposes, most vice-chancellors consideredthat, in higher fee scenarios and especially thoseinvolving limits on public funding support,institutional bursary and student supportschemes would have a vital role to play inencouraging applications from poorer students.However, unless there were funds available inaddition to the increased fee itself, such asalumni funds, institutions themselves would notbe able to provide sufficient financial incentives.
17
44915 UniUK Fees Report:44915 UniUK fees Report 06/03/2009 12:03 Page 17

18
p institutions that draw from domicilesoutside England will face a higher elasticityof demand. However, these institutions arealready focusing on strategies to competeon quality rather than price. The impact ofthis is thought likely to be small.
p the introduction of a real rate of interest wouldnot immediately affect the numbers ofstudents enrolled (if it was incorporated into apublic scheme) and we should assume thatstudents would react to the headline tuitionfees. However, this could affect repaymentbehaviour.
The reaction of students to a private loan atcommercial rates would be significant and couldlead to a significant reduction in enrolment. Fewinstitutions would exploit the ability to raise feesabove the cap if it resulted in commercial loansfrom private financial institutions.
Table 3:
Assumptions about elasticity ofdemand in the model
Characteristics Type of Elasticity of the scenarios student of demand
Tuition fee < £5,000, All 0public loans
Lower socio-economic -0.1households
(with parental household Tuition fee > £5,000, income <£50,000)
public loans Mid-upper socio-economic 0households
(parental income >£50,000)
Lower socio-economic -0.1households
Tuition fee > £5,000, (parental income <£50,000)public loans and real
Mid-upper socio-economic 0rate of interesthouseholds
(parental income >£50,000)
Lower socio-economic -0.3households
Tuition fee > £5,000, (parental income <£50,000)capped public loans Mid-upper socio-economic -0.1
households (parental income > £50,000)
Source: CRA analysis
International students are charged much higherfees than UK and EU domiciled students, as theirfees are not subject to regulation; such feesaccounted for around 8 per cent of totaluniversity income in 2006/07. There has been agrowth of e-learning (distance learning) incountries such as India, which may significantlyaffect enrolment of international students fromsuch countries. There has been a considerableslowing down of growth in internationalapplications to universities in the United States.Most of this decline is from India, China andKorea, partly reflecting difficulties in obtainingUS visas, but also more importantly theexpansion of these countries’ own highereducation systems, encouraging students to stayin their home countries. In China, for example,the number of graduate students has more thandoubled since 199842. Against this background,UK universities can no longer rely on a steadyinflux of international students to sustain theiroverall fee income in the future.
2.4 Conclusions about the changing market
It is clear from the literature review and theinterviews that the current fee arrangementshave not created an ‘economic market’ in whichthe price of an institution is a significant factor inhow potential students choose the institutionthey want to go to and in which institutionscompete on price to attract students.
Looking at the evidence described above:
p an increase to £5,000 a year is effectively themaintenance of the status quo. Institutionswould not start setting differential fees bycourse and students would behave in muchthe same way. The price elasticity of demandfor tuition fees below £5,000 a year iseffectively close to zero – students areinsensitive to tuition fees below this level. Weassume that it is zero for the purposes of themodel.
p increasing fees above £5,000 would lead moreand more institutions to review their practiceof setting fees below the cap. Between £5,000and £7,000 we would expect to see a priceelasticity of demand that is greater than zerobut remains inelastic (less than proportionatereduction in enrolment for an increase intuition fee):
p the elasticity is clearly higher forinstitutions with students who are debtaverse. So institutions whose studentscome disproportionately from lower-income households will face a higherelasticity of demand.
44915 UniUK Fees Report:44915 UniUK fees Report 06/03/2009 12:03 Page 18

Universities UK Changing landscapes
p the socio-economic classification (SEC) andStandard Occupational Classification 2000(SOC2000), which both throw light on thesocio-economic background of the studentand give us some idea of their parentalincome;
p ethnicity of the student;
p year of the programme in which the student isenrolled;
p the country in which the higher educationinstitution is located, that is whether theinstitution is in England, Northern Ireland,Scotland or Wales;
p a cost centre variable, which providesinformation on the type of course which thestudent is pursuing, for example mathematics,social studies, clinical medicine, physics.
For every combination of the above variables, thedataset gives us information on the number ofstudents in each category44.
For the purpose of the model, we are mainlyconcerned with an entry cohort of students inEnglish institutions. Summaries focusing on thedegree type and domicile of students are shownbelow:
Table 4:
Entry cohort student numbersfor England, by degree type,2006/07
Number PercentageMode Degree type of students of total
Full-time First degree 293,869 70%
Other undergraduate 46,235 11%degree
PGCE 22,076 5%
Part-time First degree 13,749 3%
Other undergraduate 45,004 11%degree
PGCE 1,544 0%
Total 422,477 100%
Source: HESA data, CRA calculations
The model also takes into account the domicileof the students as this affects loan eligibility.
To simulate the cost of different tuition feescenarios we have created a financial model.This looks at the financial implications for thethree different stakeholders: students,institutions and the Government. A stylisedschematic of this is set out in Figure 2.
Figure 2:
Model structure
Source: CRA analysis
3.1 The base data
The data that we have used for our model andwhich allows us to generate a student samplethat is representative of the current studentpopulation is the HESA student data set43.
The dataset contains information on studentsfrom 169 UK higher education institutions, ofwhich 133 are in England. It gives us informationon students enrolled in these institutions for thereporting period from 1 August 2006 to 31 July2007, inclusive.
The variables contained in the dataset include:
p the name of the higher education institution;
p the gender of the student;
p type of degree in which the student is enrolled,which indicates whether the student isenrolled in a first degree, other undergraduatedegree, postgraduate or PGCE;
p mode of study, which indicates whether thestudent is full-time or part-time;
p domicile of the student, which tells uswhether the student is from the UK, outsidethe UK but in the EU, or outside the EU;
p the age of the student;
19
3The model and the methods
Policy parameters: Fee thresholdsReal interest rateMeans-testing
Funding module: Impact of student numbersFee incomeBursary
Graduate labour market module:Earning profiles by type of studentEmployment transitions
Repayment module: Application of policy parameters on repaymentWrite-offsApplication of interestSubsidy
Tier 2 Tier 3
Scenario testing
Implications forInstitutions
Implications bystudent type
Implications for Government
Tier 1
44915 UniUK Fees Report:44915 UniUK fees Report 06/03/2009 12:03 Page 19

20
p parental income proxy variable – the StandardOccupational Classification (SOC2000) fromthe HESA dataset gives us some informationon the occupation of the student’s parents andenables the model randomly to generate aparental income from a distribution, whicheventually determines the means-testedfinancial support for the student;
p the number of students is variable dependingon which cross-tabulation is summarised.
The result of this is a dataset containingthousands of observations (the actual lengthdepends on how the higher education tiers aredefined) – which means it can account forthousands of students based on combinations ofthe above variables. The cross-tabulation allowsus to generate a cumulative probability for eachtype of student, which dictates the probability ofthat particular type of student being picked up byour simulation when it is run.
3.2 A micro-simulation based approach
Fundamentally, this is a micro-simulation MonteCarlo-type model. This type of model is usedbecause, in forecasting student financingrepayment behaviour, it is the profile of earningsthat determines when loans are repaid (ratherthan the average). For this reason, it is best tomodel student borrower repayment profiles as arandom process and to create multiple sets ofstudents with varying demographic andbehavioural characteristics that arerepresentative of the students who have takenout loans (or other sources of finance) – hencecapturing reality through a process ofsimulation.
Figure 3 shows the rationale behind thisapproach by illustrating hypothetical lifetimeearnings profiles for three very differentgraduate borrowers. While none of theseindividual borrower’s profiles is whollyrepresentative of the typical student borrower,nonetheless, through a process of simulationand aggregating over many thousands ofindividual profiles, it is possible to build up arepresentative distribution of the earningsprofile for a population of graduate studentborrowers, and approximate model repaymentbehaviour for the entire student population.Student types will be differentiated on the basisof characteristics such as age, gender,qualification type and domicile.
Table 5:
Entry cohort student numbersfor England, by domicile ofstudent, 2006/07
Mode Domicile No. of students % of total
Full-time UK 321,531 76%
Other EU 16,031 4%
Non-EU 24,618 6%
Part-time UK 55,307 13%
Other EU 1,635 0%
Non-EU 3,354 1%
Total 422,476 100%
Source: HESA data, CRA calculations
The cross-tabulation, which is the cornerstone ofour model, is based on the described HESA data.The cross-tabulation is effectively a partialsummary of the HESA data, and includes thefollowing variables which are the key ways todescribe a particular student, for the purpose ofour model:
p domicile of the student – indicates whetherthe student is from the UK, elsewhere in theEU, or outside the EU; domicile dictates whatfees students are charged, as well as theireligibility for funding support;
p higher education tier – this variable groupshigher education institutions into three tiers,providing much flexibility in groupinginstitutions;
p student gender – whether the student is maleor female becomes important when the modelgenerates earnings profiles for each student;
p type of degree – first degree, otherundergraduate degree or PGCE. Post-graduate students are not included in that partof the model which analyses earning profilesas a random process;
p course differentiator – we have grouped the‘cost centre’ variable in the HESA dataset intothree bands, based on how costly the courseis45;
p expected course length – how many years thecourse is expected to be;
p age bracket and average age – the age bracketvariable indicates whether the student istraditional (age 18–21), or non-traditional (age22–25, 26–40, or over 40); the average agevariable is the average age for each type ofstudent within the particular age bracket –important for simulating student earningsprofiles;
44915 UniUK Fees Report:44915 UniUK fees Report 06/03/2009 12:03 Page 20

Universities UK Changing landscapes
Earnings growth
Studies of individual earnings growth show thatearnings rise rapidly immediately aftergraduation and then the rate of growth declinesgradually over the course of the individual’s life.We use real earnings growth estimates based onthe British Household Panel Survey (BHPS).Figure 4, for instance, shows the hypotheticalreal earnings growth for a potential malegraduate.
Figure 4:
Hypothetical real earningsgrowth
Source: CRA analysis
We can see that earnings growth effects aregreatest at the beginning of a graduate’s career,before gradually tailing off and stabilising whenan individual is in their mid-40s. Combining theemployment transition profiles and realearnings effects for different types of studentborrower will enable us to construct the path-dependent lifecycle earnings profiles illustratedin Figure 4 (above).
By capturing all the relevant assumptions for aparticular funding scenario, and then matchingthem with randomly generated earnings profilesrepeated over many simulations to reflect thesocio-economic and behavioural diversity ofdifferent types of student borrowers, the actualcost to borrowers and Government of thedifferent scenarios can be projected.
To get meaningful results the model needs to berun a reasonable number of times. The earningsmodule is important to calculate the repaymentprofile and hence the cost to Government.Looking at the results on an institutional basis,the model will take into account thedemographics of the institution or the type ofinstitution. However, it will not allow for locallabour markets. This will need to be adjusted bythe institution.
Figure 3:
Three hypothetical lifetimestudent earnings profiles
Source: CRA analysis
To capture the differences in the repaymentbehaviour between different types of studentrepayment profiles we use an established labourmarket employment model. This developsindividual randomly generated income profilesfor different student types conditional on socio-economic and behavioural assumptions. Keyfeatures of this approach are the way itdifferentiates between:
p employment state transitions – wheredifferent employment paths depend on theindividual’s characteristics and their previousemployment status; and
p individual patterns of growth in real earnings.
When students complete their courses (or dropout), they are assigned an initial employmentstatus which determines whether they enter thelabour market following graduation and, if so, inwhat capacity. Depending what type of degreethey have, the model assumes that they areemployed (full-time or part-time), unemployedor inactive.
To forecast an individual’s lifetime earningsprofile it is necessary to estimate the individual’semployment behaviour over the course of theirworking life. We have used the individualborrower’s characteristics – age, gender andprevious employment state – to estimate theprobability of the individual currently being:
p employed;
p unemployed;
p inactive;
p permanently disabled; or
p dead.
21
100
65Age
Inco
me
(’00
0s)
220
0%22
Rea
l inc
ome
grow
th (%
)
26 30 34 38 42 46 50 54 58 62Age
2%
4%
6%
8%
10%
12%
14%
16%
44915 UniUK Fees Report:44915 UniUK fees Report 06/03/2009 12:03 Page 21

22
p the impact of individual student net income(tuition fee less bursary) is then aggregated toshow the impact on institutional finances;
p the repayments based on the graduates’earnings profiles are calculated and the costto the Government in cash outlay and assubsidy is calculated.
The model allows scenarios to be applied toEngland as a whole, types of institutions (that werefer to as tiers) and to individual institutions.There are many different ways to categorise thehigher education sector and institutions willwish to determine the comparator institutions intheir own way.
To reflect this we have made it possible for thetiers to be defined by characteristics of theinstitution. The model can be set up to definetiers in terms of characteristics that we can linkto the higher education identifier within theHESA data. For example, following discussionwith Universities UK we have included:
p total home/EU full-time equivalents (FTEs)
p total international FTEs
p total full-time FTEs
p total part-time FTEs
p total undergraduate FTEs
p total postgraduate taught FTEs
p total postgraduate research FTEs
p total HEFCE teaching and research funding
p total HEFCE teaching funding
p total HEFCE research funding
p proportion of low-income students.
For the purposes of the report, the mostsignificant impact on the price elasticity ofdemand identified in the literature review is theparental income of the potential student’shousehold. To see the impact of the differentprice elasticities discussed in the literature andthe interviews, we have segmented institutionsaccording to the composition of their studentbodies.
The results of this module are most importantfor Government; it is therefore possible to runthe model without simulating future labourmarket income or repayment to Government.This clearly significantly reduces the time takento run the model.
The model is estimated using recent publicsurvey datasets. It is important to relate this torecent academic studies. For example, Daviesand colleagues note that, on the whole,graduates receive a higher wage relative to non-graduates, and university graduates arealso more likely to have quality jobs and lesslikely to experience unemployment46. Forexample:
p the median of lifetime earnings distributionfor male graduates is around £325,000 higherthan that for male non-graduates;
p among female graduates, the difference isaround £430,000.
3.3 Simulating future cohorts
To simulate future cohorts we use the HESA dataas a representative sample of a new graduatecohort.
The outputs of the model are scaled up to reflectchanges in the aggregate number of students.Student numbers can be generated in two ways:
p deterministic student number inputs into themodel; and
p student numbers based on changes in tuitionfees and assumed price elasticity of demand(where the price elasticity of demand isassumed to be that suggested in theinterviews and literature (as set out in Table 3above)).
3.4 The impact of the scenarios on institutions inEngland
The scenarios are applied to the model in anumber of ways:
p changes in tuition fees and correspondingchanges in loan size are applied to individualstudent types taking into account theircharacteristics (for example, length and typeof course, whether they drop out, whether theytake out available loans) and the type (tier) ofinstitution they attend;
p the number of students in aggregate and fordifferent tiers is determined by the change inthe tuition fee using the elasticities discussedabove;
44915 UniUK Fees Report:44915 UniUK fees Report 06/03/2009 12:03 Page 22

Universities UK Changing landscapes
This can then be projected for the period2012–16 to establish the total tuition fee incomegenerated assuming that the existing scheme ismaintained. The figures in this report depicttuition fee income starting from 2011, whenstudent numbers reach equilibrium, and endingin 2016, five years from when the new regime isintroduced in 2012.
Figure 5:
Forecasted income from tuitionfees under base case
Source: CRA Analysis
4.2 Summary of the results of scenarios 1 and 2
To illustrate the outputs of the model, we showthe aggregate results of scenario 1 and scenario2 below.
p Scenario 1 deferred payment – zero real rateof interest loans with income contingentrepayments, no means-testing (i.e. thecurrent mechanism) with a cap at £5,000;
p Scenario 2 deferred payment – zero real rateof interest loans with income contingentrepayments, no means-testing (i.e. thecurrent mechanism) with a cap at £7,000.
Scenarios 1 and 2: current loan system
Scenarios 1 and 2 are both based on the currentloan system, where public loans are available tostudents at no real rate of interest. Evidencesuggests that, at a fee of £5,000, students on thewhole remain relatively price insensitive, but ifthe fee were to rise this would start to influencestudents’ decisions about whether to enrol inhigher education.
For each scenario, the model inputs entrycohorts into the higher education system, from2008 until 2016 – and assumes that the newregime begins in 2012.
The model is designed to investigate thefinancial implications of each scenario for:
p different types of higher education institution;
p students entering into education in the period2012–16; and
p Government to see the resource and cashimplications and the impact on highereducation policies.
In this chapter, we set out the results in the basecase and for scenarios 1 and 2. The results forthe other scenarios are set out in Appendix C.
4.1 The base case
To look at scenarios we need to have a base case.This is the model forecasts for the financialimplications of continuing the current regime (asset out in Chapter 1). To do this we model entrycohorts from 2008. So in 2008 we have only first-year students; the model then introduces newstudents in each subsequent year. As can beseen in Table 6 the result of this is that incomebuilds up quickly in the first three years until themodel has reached close to equilibrium, wherethe number of students entering highereducation is similar to the number graduating inthe model.
Table 6:
The base case – England only
Type of student Tuition fee income (£ million)
2008 2009 2010 2011
UK and EU 1,133.6 2,057.3 2,930.9 3,223.5domiciled students in English institutions
Full-time – undergraduate 868.4 1,633.2 2,427.2 2,656.2(first degree)
Full-time – other 195.0 322.0 366.2 397.4undergraduate degree
Full-time – PGCE 70.2 102.1 137.5 169.9
International
Full-time – undergraduate 316.9 558.6 847.8 964.2
Source: CRA analysis
By 2011 the model is predicting that (before thenew regime) total tuition fee income for Englishinstitutions would be around £4.2 billion a year.This is consistent with income today largelyuprated by inflation.
4Quantifying the cost of scenarios
23
1,000
02011
Base Case
Tuit
ion
fee
inco
me
(GB
P m
illio
n)
2012 2013 2014 2015 2016
2,000
3,000
4,000
5,000
6,000
7,000
8,000
9,000
10,000
44915 UniUK Fees Report:44915 UniUK fees Report 06/03/2009 12:03 Page 23
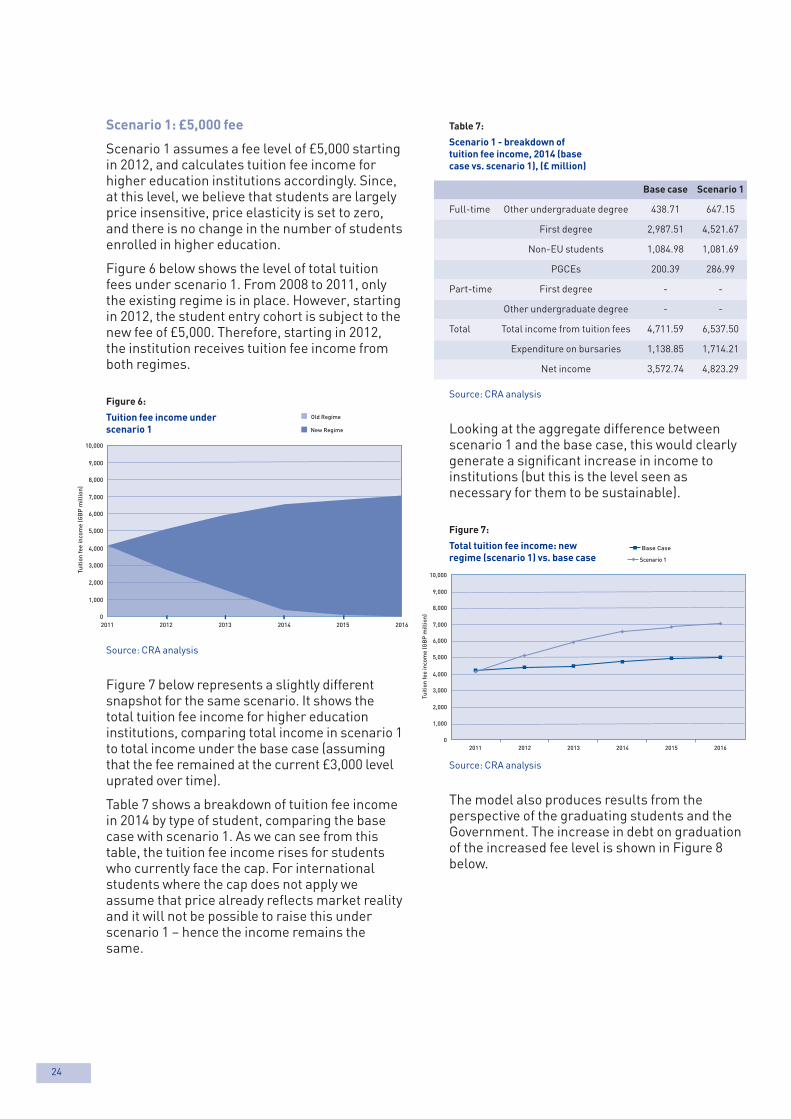
24
Table 7:
Scenario 1 - breakdown oftuition fee income, 2014 (basecase vs. scenario 1), (£ million)
Base case Scenario 1
Full-time Other undergraduate degree 438.71 647.15
First degree 2,987.51 4,521.67
Non-EU students 1,084.98 1,081.69
PGCEs 200.39 286.99
Part-time First degree - -
Other undergraduate degree - -
Total Total income from tuition fees 4,711.59 6,537.50
Expenditure on bursaries 1,138.85 1,714.21
Net income 3,572.74 4,823.29
Source: CRA analysis
Looking at the aggregate difference betweenscenario 1 and the base case, this would clearlygenerate a significant increase in income toinstitutions (but this is the level seen asnecessary for them to be sustainable).
Figure 7:
Total tuition fee income: newregime (scenario 1) vs. base case
Source: CRA analysis
The model also produces results from theperspective of the graduating students and theGovernment. The increase in debt on graduationof the increased fee level is shown in Figure 8below.
Scenario 1: £5,000 fee
Scenario 1 assumes a fee level of £5,000 startingin 2012, and calculates tuition fee income forhigher education institutions accordingly. Since,at this level, we believe that students are largelyprice insensitive, price elasticity is set to zero,and there is no change in the number of studentsenrolled in higher education.
Figure 6 below shows the level of total tuitionfees under scenario 1. From 2008 to 2011, onlythe existing regime is in place. However, startingin 2012, the student entry cohort is subject to thenew fee of £5,000. Therefore, starting in 2012,the institution receives tuition fee income fromboth regimes.
Figure 6:
Tuition fee income underscenario 1
Source: CRA analysis
Figure 7 below represents a slightly differentsnapshot for the same scenario. It shows thetotal tuition fee income for higher educationinstitutions, comparing total income in scenario 1to total income under the base case (assumingthat the fee remained at the current £3,000 leveluprated over time).
Table 7 shows a breakdown of tuition fee incomein 2014 by type of student, comparing the basecase with scenario 1. As we can see from thistable, the tuition fee income rises for studentswho currently face the cap. For internationalstudents where the cap does not apply weassume that price already reflects market realityand it will not be possible to raise this underscenario 1 – hence the income remains thesame.
1,000
02011 2012 2013 2014
New Regime
2015 2016
2,000
3,000
4,000
5,000
6,000
7,000
8,000
9,000
10,000
Tuit
ion
fee
inco
me
(GB
P m
illio
n)
Old Regime
1,000
02011
Tuit
ion
fee
inco
me
(GB
P m
illio
n)
2012 2013 2014 2015 2016
2,000
3,000
4,000
5,000
6,000
7,000
8,000
9,000
10,000
Base Case
Scenario 1
44915 UniUK Fees Report:44915 UniUK fees Report 06/03/2009 12:03 Page 24
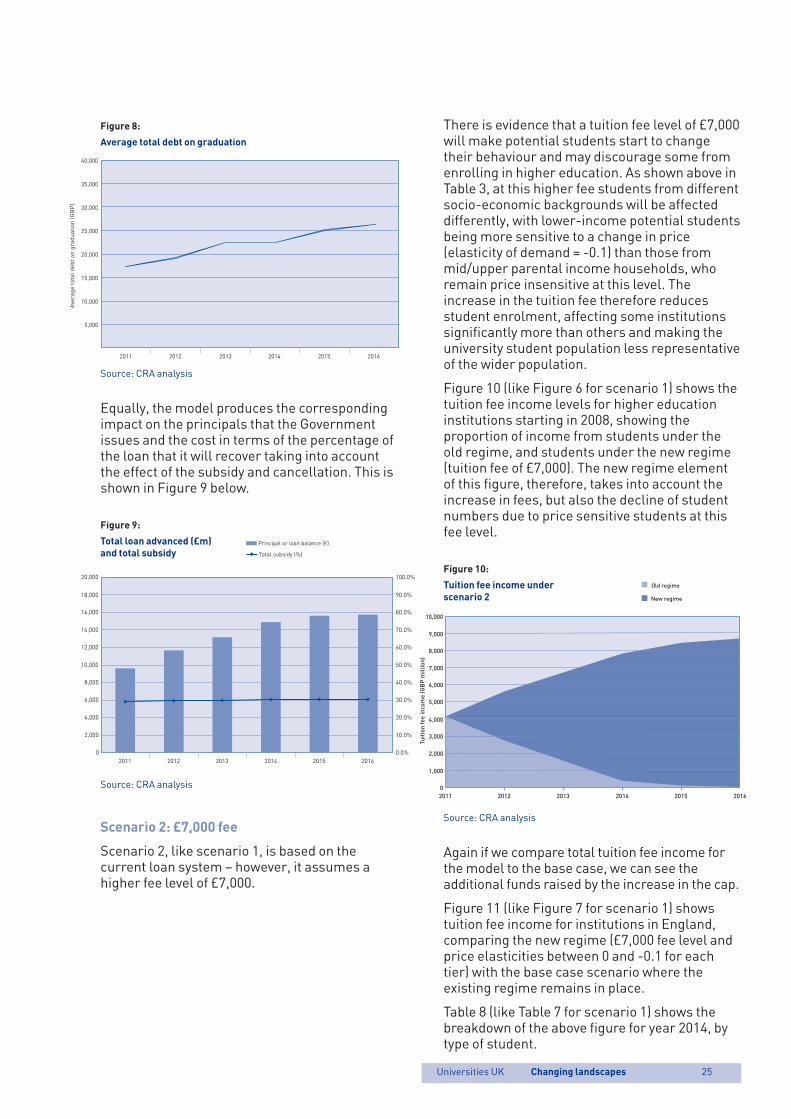
Universities UK Changing landscapes
There is evidence that a tuition fee level of £7,000will make potential students start to changetheir behaviour and may discourage some fromenrolling in higher education. As shown above inTable 3, at this higher fee students from differentsocio-economic backgrounds will be affecteddifferently, with lower-income potential studentsbeing more sensitive to a change in price(elasticity of demand = -0.1) than those frommid/upper parental income households, whoremain price insensitive at this level. Theincrease in the tuition fee therefore reducesstudent enrolment, affecting some institutionssignificantly more than others and making theuniversity student population less representativeof the wider population.
Figure 10 (like Figure 6 for scenario 1) shows thetuition fee income levels for higher educationinstitutions starting in 2008, showing theproportion of income from students under theold regime, and students under the new regime(tuition fee of £7,000). The new regime elementof this figure, therefore, takes into account theincrease in fees, but also the decline of studentnumbers due to price sensitive students at thisfee level.
Figure 10:
Tuition fee income underscenario 2
Source: CRA analysis
Again if we compare total tuition fee income forthe model to the base case, we can see theadditional funds raised by the increase in the cap.
Figure 11 (like Figure 7 for scenario 1) showstuition fee income for institutions in England,comparing the new regime (£7,000 fee level andprice elasticities between 0 and -0.1 for eachtier) with the base case scenario where theexisting regime remains in place.
Table 8 (like Table 7 for scenario 1) shows thebreakdown of the above figure for year 2014, bytype of student.
Figure 8:
Average total debt on graduation
Source: CRA analysis
Equally, the model produces the correspondingimpact on the principals that the Governmentissues and the cost in terms of the percentage ofthe loan that it will recover taking into accountthe effect of the subsidy and cancellation. This isshown in Figure 9 below.
Figure 9:
Total loan advanced (£m)and total subsidy
Source: CRA analysis
Scenario 2: £7,000 fee
Scenario 2, like scenario 1, is based on thecurrent loan system – however, it assumes ahigher fee level of £7,000.
25
2011
Ave
rage
tota
l deb
t on
grad
uatio
n (G
BP
)
2012 2013 2014 2015 2016
40,000
35,000
30,000
25,000
20,000
15,000
10,000
5,000
1,000
02011 2012 2013 2014 2015 2016
2,000
3,000
4,000
5,000
6,000
7,000
8,000
9,000
10,000
Tuit
ion
fee
inco
me
(GB
P m
illio
n)
New regime
Old regime
2,000
4,000
6,000
8,000
20,000
18,000
16,000
14,000
12,000
10,000
0
10.0%
20.0%
30.0%
40.0%
100.0%
90.0%
80.0%
70.0%
60.0%
50.0%
0.0%2011 2012 2013 2014 2015 2016
Principal or loan balance (£)
Total subsidy (%)
44915 UniUK Fees Report:44915 UniUK fees Report 06/03/2009 12:03 Page 25
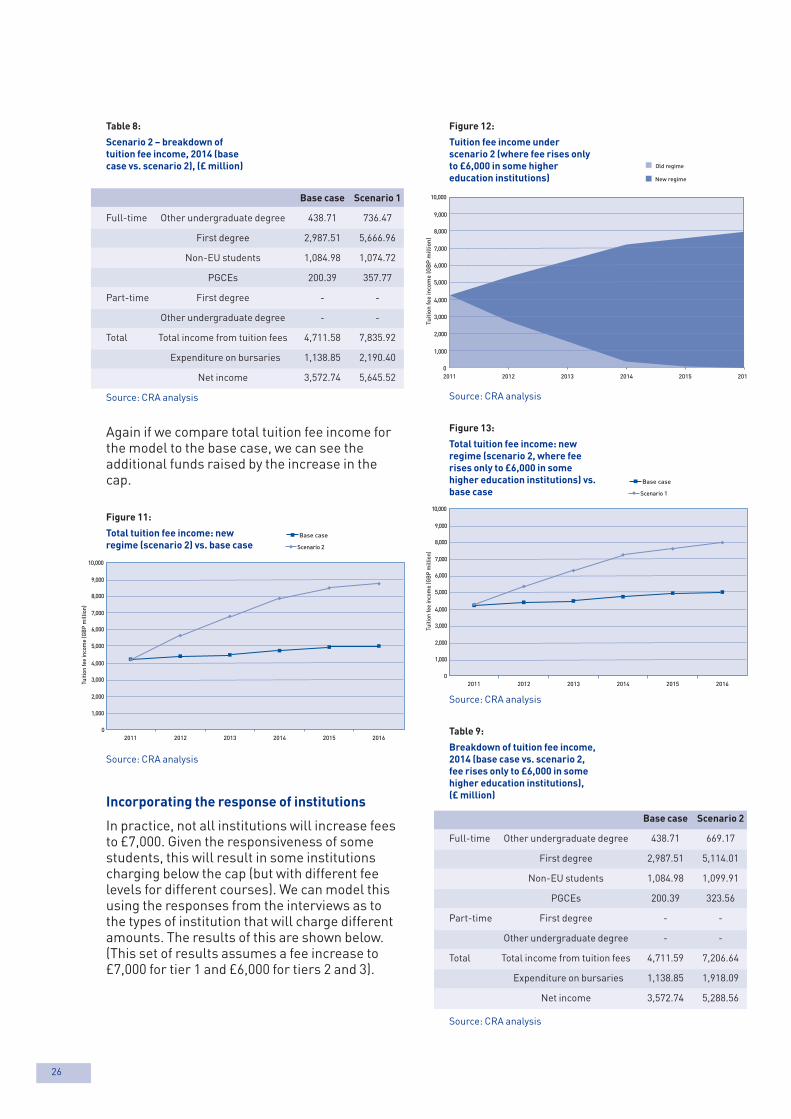
26
Figure 12:
Tuition fee income underscenario 2 (where fee rises onlyto £6,000 in some highereducation institutions)
Source: CRA analysis
Figure 13:
Total tuition fee income: newregime (scenario 2, where feerises only to £6,000 in somehigher education institutions) vs.base case
Source: CRA analysis
Table 9:
Breakdown of tuition fee income,2014 (base case vs. scenario 2,fee rises only to £6,000 in somehigher education institutions),(£ million)
Base case Scenario 2
Full-time Other undergraduate degree 438.71 669.17
First degree 2,987.51 5,114.01
Non-EU students 1,084.98 1,099.91
PGCEs 200.39 323.56
Part-time First degree - -
Other undergraduate degree - -
Total Total income from tuition fees 4,711.59 7,206.64
Expenditure on bursaries 1,138.85 1,918.09
Net income 3,572.74 5,288.56
Source: CRA analysis
Table 8:
Scenario 2 – breakdown oftuition fee income, 2014 (basecase vs. scenario 2), (£ million)
Base case Scenario 1
Full-time Other undergraduate degree 438.71 736.47
First degree 2,987.51 5,666.96
Non-EU students 1,084.98 1,074.72
PGCEs 200.39 357.77
Part-time First degree - -
Other undergraduate degree - -
Total Total income from tuition fees 4,711.58 7,835.92
Expenditure on bursaries 1,138.85 2,190.40
Net income 3,572.74 5,645.52
Source: CRA analysis
Again if we compare total tuition fee income forthe model to the base case, we can see theadditional funds raised by the increase in thecap.
Figure 11:
Total tuition fee income: newregime (scenario 2) vs. base case
Source: CRA analysis
Incorporating the response of institutions
In practice, not all institutions will increase feesto £7,000. Given the responsiveness of somestudents, this will result in some institutionscharging below the cap (but with different feelevels for different courses). We can model thisusing the responses from the interviews as tothe types of institution that will charge differentamounts. The results of this are shown below.(This set of results assumes a fee increase to£7,000 for tier 1 and £6,000 for tiers 2 and 3).
Base case
Scenario 2
1,000
02011
Tuiti
on fe
e in
com
e (G
BP
mill
ion)
2012 2013 2014 2015 2016
2,000
3,000
4,000
5,000
6,000
7,000
8,000
9,000
10,000
1,000
02011 2012 2013 2014 2015 201
2,000
3,000
4,000
5,000
6,000
7,000
8,000
9,000
10,000
Tuit
ion
fee
inco
me
(GB
P m
illio
n)
New regime
Old regime
Base case
Scenario 1
1,000
02011
Tuiti
on fe
e in
com
e (G
BP
mill
ion)
2012 2013 2014 2015 2016
2,000
3,000
4,000
5,000
6,000
7,000
8,000
9,000
10,000
44915 UniUK Fees Report:44915 UniUK fees Report 06/03/2009 12:03 Page 26

Universities UK Changing landscapes
The model uses the characteristics of theinstitution(s) as included in the HESA data set tocalibrate the model. For each of the groups it ispossible to set out:
p the tuition fee level and how this varies overtime;
p the bursary strategy;
p the sensitivity of students to changes in thetuition fee regime.
The model will simulate the impact on studentparticipation, the revenues for the institution orgroups, the average level of debt upongraduation and the cost of the scheme in termsof government financial support.
What the model cannot do
The model has been based on the results ofinterviews with institutions. It includesassumptions about the responsiveness ofstudents to different fee and maintenancearrangements. When running the model for aparticular institution the user needs to considerwhether:
p the parameters are appropriate for theinstitution;
p the parameters are sensible given the policyscenarios under consideration. For example,the responsiveness of students is based onrelatively small variations in fees and wouldalter if very large changes were assumed.
The model is a tool for considering the impact ofdifferent policies and as such it should be usefulalthough it is only one factor in the process ofarriving at new policies.
4.3 How individual institutions could use the model
Since the intention has been to develop a modelfor institutions to use for their own planning andfinancial purposes, we asked the vice-chancellors we interviewed what they would likethe model to be capable of and what kind ofinputs they would like to be able to vary.
Responses clearly reflected the existingmodelling work undertaken by their respectiveuniversities on the student markets in whichthey operate, including competitor behaviour.Some have already invested in sophisticatedmodels that allow them to explore trends and theimplications of future policies. Others have so fardeveloped only limited modelling capability. Allinstitutions agreed, however, that the banding ofinstitutions based on the data published by OFFAon the proportion of additional fee income spenton financial support for students and otherwidening access activities would not beappropriate. Several vice-chancellors felt thatthe data were potentially misleading andgrouping institutions was more generally a verysensitive issue.
Vice-chancellors wanted a range of modeloutputs and inputs and these have beenreflected as far as possible in designing themodel. Their key message was the need for ahigh degree of flexibility in inputs to reflect thestudent profile of individual institutions. Theyalso wanted to be able to look at the impact ofsimilar scenarios on institutions judged to betheir main competitors.
The model has therefore been designed tosimulate the impact of different tuition fee policyscenarios that might be considered in thevariable fees review for England in 2009.However from the outset the second objectivewas for the model to be useful for individualinstitutions in deepening their understanding ofthe market place.
What can the model do?
The model allows any institution to categoriseother institutions into useful comparator groups(or tiers). A group could include only itself orother institutions with similar characteristics.These characteristics can be defined by the userbut could include things such as the number offull-time students, the number of internationalstudents or the proportion of low-incomestudents. Alternatively the user can simplydefine the particular institutions it would like tobe in a group.
27
44915 UniUK Fees Report:44915 UniUK fees Report 06/03/2009 12:03 Page 27

28
Appendix ACost centres
Cost centre Cost centre Cost band
1 Clinical me dicine 1
2 Clinical dentistry 1
3 Veterinary science 1
4 Anatomy and physiology 1
5 Nursing and paramedical studies 1
6 Health and community studies 1
7 Psychology and behavioural sciences 1
8 Pharmacy and pharmacology 1
10 Biosciences 1
11 Chemistry 1
12 Physics 1
13 Agriculture and forestry 2
14 Earth, marine and environmental sciences 2
16 General engineering 2
17 Chemical engineering 2
18 Mineral, metallurgy and materials engineering 2
19 Civil engineering 2
20 Electrical, electronic and computer engineering 2
21 Mechanical, aero and production engineering 2
23 Architecture, built environment and planning 2
24 Mathematics 3
25 Information technology and systems sciences and computer software engineering 3
26 Catering and hospitality management 3
27 Business and management studies 3
28 Geography 3
29 Social studies 3
30 Media studies 3
31 Humanities and language based studies 3
33 Design and creative arts 3
34 Education 3
35 Modern languages 3
37 Archaeology 3
38 Sports science and leisure studies 3
41 Continuing education 3
99 Dummy cost centre - without reporting institution 3
Source: CRA grouping based on HESA data variables
44915 UniUK Fees Report:44915 UniUK fees Report 06/03/2009 12:03 Page 28

Universities UK Changing landscapes
Student bursaries
5. How would your institution respond to anincrease in the annual maximum tuition fee from£3,000 to £5,000 following the 2009 fees review ifthe following applied to full-time home and EUundergraduate students:
A. the same student loan arrangements andstudent support package as now?
B. the student loan repayment terms changed fromzero real interest as now to a real rate of intereston part/all of the loan?
C. public funds available for students were cappedat £3,000 (for fee loans) and institutions wereexpected to make additional bursary support orfee waivers available to students who wereunable to meet the additional costs themselves?
6. Are bursaries serving their intended purpose?How might bursaries develop in the future?Would a partial fee waiver system be moreeffective in sustaining demand from studentsfrom low income families?
Model design issues (outputs/inputs)
7. Have you investigated for your institution thelikely impact on student demand of debt ongraduation?
If yes, what level of tuition fee (and totalpotential debt on graduation) might significantlyreduce student applications? Would this affectthe types of courses you offer?
8. Should we band institutions according to theproportion of additional fee income they spendon bursaries and other widening accessactivities?
A recent report by the Office for Fair Access(01/08) has provided this information on aninstitution by institution basis for 2006/07.
9. Will the demographic decline in the number of18-20 year olds from 2010 have an impact oninstitutions’ decisions on setting tuition fees?Should the potential impact of demographicdecline be a major element in the prospective2009 review?
10. What model outputs would your institution findhelpful for its strategic planning and otherpurposes?
11. The two main elements in the model covergraduate earning profiles and loan/feeparameters. The model will provide theopportunity for institutions to vary parameters toreflect their own circumstances. What parameterswould you wish to be able to flex in this way?
Modelling alternative variable fee scenarios:questions for heads of institution
The aim of this study is to develop a user-friendlymodel, available to all Universities UK members,to enable them to model their institution’sfinancial position under different possible tuitionfee regimes. We wish to discuss the followingquestions with you under Chatham House rules.Opinions shared with us will be reported only atthe sectoral level, and no individual or institutionwill be named in or identifiable from our report.These questions are to help us considertechnical aspects integral to building a feemodel appropriate for use by institutions in thelonger term. They will also help to inform theassumptions we need to make about the likelybehaviour of institutions in response to specificscenarios that might result from the 2009 feesreview.
Fee options
1. What level of tuition fee is necessary for thelong-term sustainability of your full-timeundergraduate teaching programmes?
(Assume that HEFCE funding is not reduced prorata to any increase in the tuition fee.)
2. How far would the tuition fee cap need to rise foryour institution to consider charging fees belowthe permitted maximum? At what level mightother universities consider charging fees belowthe maximum?
3. If the fee cap were removed but with limitedpublic support (through fee loans), would youruniversity introduce tuition fees above themaximum supported by public fee loans? Wouldmany other universities introduce higher fees?To what level might fees rise?
(Assume that higher education institutions wouldbe required to provide generous bursaries or feewaivers for students from low income families.)
4. Some universities already charge lower tuitionfees for sub-degree and Foundation Yearprogrammes. Is there any scenario in which youruniversity might contemplate charging differentfees for different subjects? What about otherinstitutions?
If yes, would such differentiation be related torelative levels of demand or to underlying costdifferences?
Appendix BInterview questions
29
44915 UniUK Fees Report:44915 UniUK fees Report 06/03/2009 12:03 Page 29

30
Figure 14:
Scenario 1: Deferred payment:zero real interest rate (currentincome contingent loan), £5,000fee level
2011 2012 2013 2014 2015 2016
Total students (FTE) entry cohort 432,309 432,309 432,309 432,309 432,309 432,309
Institutions
Income from tuition fees (£) 4,187,723,758 4,957,026,958 5,738,407,334 6,440,615,950 6,826,577,279 7,117,848,937
Other undergraduate degree 397,413,734 489,287,427 605,328,484 606,420,299 657,997,263 642,391,856
First degree 2,656,198,918 3,319,473,399 3,921,551,932 4,543,853,366 4,793,072,272 5,012,983,213
Non-EU students 964,194,704 911,097,634 941,345,916 990,310,011 1,031,369,433 1,108,770,780
PGCEs 169,916,401 237,168,498 270,181,001 300,032,273 344,138,311 353,703,086
Expenditure on bursaries 1,017,424,372 1,283,392,048 1,519,893,470 1,750,373,202 1,850,990,620 1,906,122,942
Students
Average total debt at graduation (£) 17,248 19,119 22,483 22,447 25,206 26,412
Government
Value of new principal advanced (£) 7,540,348,671 8,362,818,407 9,306,011,208 10,091,949,260 11,300,404,461 10,863,625,501
Total subsidy (%) 26.9% 27.5% 27.5% 28.0% 27.9% 27.8%
Source: CRA International
Figure 15:
Scenario 2: Deferred payment:zero real interest rate (currentincome contingent loan), £7,000fee level
2011 2012 2013 2014 2015 2016
Total students (FTE) entry cohort 432,309 402,431 402,431 402,431 402,431 402,431
Institutions
Income from tuition fees (£) 4,259,517,780 5,654,328,231 6,855,837,264 7,938,557,063 8,438,106,032 8,743,261,673
Other undergraduate degree 412,390,757 545,461,927 719,619,089 766,467,358 779,142,634 852,998,166
First degree 2,667,435,555 3,813,490,466 4,747,432,155 5,723,242,942 6,180,071,502 6,273,659,510
Non-EU students 1,010,770,718 1,025,344,859 1,065,408,352 1,073,360,546 1,060,217,130 1,182,375,553
PGCEs 168,920,750 270,030,979 323,377,668 375,486,217 418,674,766 434,228,444
Expenditure on bursaries 1,021,907,751 1,498,105,232 1,874,450,434 2,240,740,743 2,399,996,762 2,487,773,227
Students
Average total debt at graduation (£) 17,092 19,712 21,855 23,453 29,056 32,462
Government
Value of new principal advanced (£) 7,480,348,710 8,454,666,058 9,872,300,854 11,069,354,506 12,316,582,075 12,072,191,206
Total subsidy (%) 26.8% 27.7% 29.1% 29.9% 30.6% 30.3%
Source: CRA International
Appendix CScenario results
44915 UniUK Fees Report:44915 UniUK fees Report 06/03/2009 12:03 Page 30

Universities UK Changing landscapes
Figure 16 :Scenario 3: Upfront payment:means-tested public support,£5,000 fee level
2011 2012 2013 2014 2015 2016
Total students (FTE) entry cohort 432,309 432,309 432,309 432,309 432,309 432,309
Institutions
Income from tuition fees (£) 4,187,723,758 4,957,026,958 5,738,407,334 6,440,615,950 6,826,577,279 7,117,848,937
Other undergraduate degree 397,413,734 489,287,427 605,328,484 606,420,299 657,997,263 642,391,856
First degree 2,656,198,918 3,319,473,399 3,921,551,932 4,543,853,366 4,793,072,272 5,012,983,213
Non-EU students 964,194,704 911,097,634 941,345,916 990,310,011 1,031,369,433 1,108,770,780
PGCEs 169,916,401 237,168,498 270,181,001 300,032,273 344,138,311 353,703,086
Expenditure on bursaries 1,017,424,372 1,283,392,048 1,519,893,470 1,750,373,202 1,850,990,620 1,906,122,942
Students
Average total debt at graduation (£) 16,600 18,396 21,423 21,065 21,706 21,829
Government
Value of new principal advanced (£) 7,285,597,197 8,091,199,421 8,461,030,276 8,741,228,904 9,451,696,849 8,705,958,641
Total subsidy (%) 26.4% 26.7% 26.3% 26.4% 26.1% 25.9%
Source: CRA International
Figure 17:
Scenario 4: Upfront payment:means-tested public support,£7,000 fee level
2011 2012 2013 2014 2015 2016
Total students (FTE) entry cohort 432,309 432,309 432,309 432,309 432,309 432,309
Institutions
Income from tuition fees (£) 4,271,892,940 5,869,465,576 7,281,387,609 8,581,417,634 9,132,391,460 9,478,081,690
Other undergraduate degree 429,416,423 570,858,114 749,905,275 820,118,561 831,374,986 907,087,884
First degree 2,661,137,648 4,001,910,801 5,121,472,561 6,273,234,814 6,784,081,415 6,916,020,442
Non-EU students 1,013,819,605 1,011,021,684 1,068,399,735 1,080,087,166 1,053,946,679 1,178,193,717
PGCEs 167,519,264 285,674,977 341,610,039 407,977,093 462,988,380 476,779,648
Expenditure on bursaries 1,023,956,934 1,567,903,005 2,011,180,105 2,426,778,824 2,633,525,918 2,728,327,861
Students
Average total debt at graduation (£) 16,585 19,141 20,064 21,165 22,637 23,342
Government
Value of new principal advanced (£) 7,224,132,342 8,066,253,860 8,618,566,352 9,189,053,607 9,715,355,768 8,777,329,697
Total subsidy (%) 26.1% 26.1% 26.3% 26.3% 26.3% 26.3%
Source: CRA International
31
44915 UniUK Fees Report:44915 UniUK fees Report 06/03/2009 12:03 Page 31

32
Figure 18:
Scenario 5: Deferred payment:real interest rate (no means-testing), £5,000 fee level
2011 2012 2013 2014 2015 2016
Total students (FTE) entry cohort 432,309 432,309 432,309 432,309 432,309 432,309
Institutions
Income from tuition fees (£) 4,177,951,517 5,086,452,387 5,789,246,240 6,550,354,854 6,894,583,905 7,129,942,032
Other undergraduate degree 362,165,107 501,873,605 586,111,035 633,315,412 642,196,426 634,534,797
First degree 2,654,817,339 3,361,893,015 3,928,008,408 4,510,576,878 4,834,109,947 5,017,151,722
Non-EU students 988,396,076 989,717,322 1,012,264,697 1,116,246,460 1,089,469,317 1,123,790,214
PGCEs 172,572,995 232,968,445 262,862,100 290,216,104 328,808,215 354,465,299
Expenditure on bursaries 1,033,954,073 1,304,286,287 1,521,863,838 1,754,660,899 1,859,390,293 1,918,669,445
Students
Average total debt at graduation (£) 16,591 20,315 21,964 22,605 26,829 28,570
Government
Value of new principal advanced (£) 7,520,326,892 8,500,714,227 9,524,042,088 10,223,743,999 11,496,157,039 10,790,448,635
Total subsidy (%) 22.8% 19.9% 16.5% 14.2% 12.7% 13.0%
Source: CRA International
Figure 19:Scenario 6: Deferred payment:real interest rate (no means-testing), £7,000 fee level
2011 2012 2013 2014 2015 2016
Total students (FTE) entry cohort 432,309 402,431 402,431 402,431 402,431 402,431
Institutions
Income from tuition fees (£) 4,173,841,406 5,601,009,455 6,745,133,344 7,887,933,384 8,399,633,172 8,724,835,046
Other undergraduate degree 410,833,164 553,238,309 709,079,497 801,271,128 751,333,639 813,826,346
First degree 2,612,709,551 3,786,414,459 4,711,155,079 5,700,219,595 6,119,995,427 6,284,010,486
Non-EU students 985,735,535 1,010,111,106 1,026,688,410 1,031,186,526 1,115,175,404 1,183,795,697
PGCEs 164,563,155 251,245,582 298,210,358 355,256,136 413,128,701 443,202,517
Expenditure on bursaries 1,012,081,404 1,445,172,988 1,783,769,398 2,181,749,674 2,325,532,179 2,381,802,203
Students
Average total debt at graduation (£) 17,794 18,485 21,933 23,198 29,908 32,557
Government
Value of new principal advanced (£) 7,284,203,919 8,233,185,247 9,808,923,653 10,813,108,182 11,871,181,923 11,842,354,846
Total subsidy (%) 22.3% 20.2% 18.9% 17.3% 17.1% 17.1%
Source: CRA International
44915 UniUK Fees Report:44915 UniUK fees Report 06/03/2009 12:03 Page 32

Universities UK Changing landscapes
Figure 20:Scenario 7: Capped interest-freeloans: private loans with realinterest rate, £5,000 fee level
2011 2012 2013 2014 2015 2016
Total students (FTE) entry cohort 432,309 432,309 432,309 432,309 432,309 432,309
Institutions
Income from tuition fees (£) 4,255,198,308 5,023,071,250 5,732,436,273 6,559,758,831 6,849,469,688 7,130,007,237
Other undergraduate degree 401,798,715 522,534,841 581,577,098 633,052,221 609,218,370 662,944,359
First degree 2,681,330,261 3,313,257,310 3,922,389,929 4,566,895,418 4,860,293,436 5,001,047,985
Non-EU students 991,469,110 948,299,423 970,898,648 1,069,185,519 1,059,637,786 1,128,896,993
PGCEs 180,600,222 238,979,676 257,570,599 290,625,673 320,320,096 337,117,899
Expenditure on bursaries 1,030,637,294 1,303,321,753 1,536,305,952 1,790,008,432 1,855,615,416 1,887,760,827
Students
Average total debt at graduation (£) 17,016 19,834 22,000 23,004 26,196 27,437
Government
Value of new principal advanced (£) 7,590,349,773 8,516,043,792 9,570,060,703 10,409,392,968 11,152,031,958 10,445,945,978
Total subsidy (%) 23.3% 20.5% 17.2% 14.2% 12.6% 12.7%
Source: CRA International
Figure 21:Scenario 8: Capped interest-freeloans: private loans with realinterest rate, £7,000 fee level
2011 2012 2013 2014 2015 2016
Total students (FTE) entry cohort 432,309 332,606 332,606 332,606 332,606 332,606
Institutions
Income from tuition fees (£) 4,200,594,168 5,068,786,349 5,726,449,686 6,460,620,595 6,733,579,197 6,951,137,354
Other undergraduate degree 398,905,577 509,017,908 623,882,349 687,202,611 647,735,075 679,685,212
First degree 2,675,806,644 3,327,438,225 3,870,840,672 4,472,085,997 4,663,344,488 4,780,720,167
Non-EU students 954,292,850 1,007,615,995 979,440,346 1,021,005,067 1,094,425,513 1,153,417,066
PGCEs 171,589,096 224,714,221 252,286,318 280,326,921 328,074,121 337,314,909
Expenditure on bursaries 1,020,311,970 1,281,549,596 1,485,403,027 1,713,018,859 1,777,067,907 1,846,718,617
Students
Average total debt at graduation (£) 16,478 20,061 23,090 23,974 29,451 32,045
Government
Value of new principal advanced (£) 7,660,219,845 8,629,961,351 9,370,508,491 9,757,066,184 10,264,403,920 9,814,120,772
Total subsidy (%) 23.3% 20.9% 19.0% 16.9% 16.7% 16.5%
Source: CRA International
33
44915 UniUK Fees Report:44915 UniUK fees Report 06/03/2009 12:03 Page 33
34
29 MacLeod, D (2008), op.cit.
30 Foskett, N (2006), op.cit.
31 Chester and Bekhradnia (2008), op.cit.
32 Boorman, S and Brown, N, op.cit.
33 Adnett, N and Slack, K (2007), ‘Are there economic incentives fornon-traditional students to enter HE? The labour market as abarrier to widening participation’, Higher Education Quarterly 61(2007), 23-36.
34 The Guardian (2008) 2 January.
35 Chester and Bekhradnia (2008), op.cit.
36 Davies (2008), op.cit.
37 Office for Fair Access (2008), Access agreement monitoringoutcomes for 2006-07.
38 Dearden, L et al (2005), Higher education funding policy: who wins andwho loses? A comprehensive guide to the current debate (The Institutefor Fiscal Studies).
39 The Guardian (2008) 19 February.
40 Brown, N and Ramsden, B (2008), The future size and shape of thehigher education sector in the UK: demographic projections(Universities UK).
41 King, R (2008), Private universities and public funding: models andbusiness plans (Universities UK).
42 Redden, E (2008), ‘Growth in international applicants slows‘, InsideHigher Ed, 14 April.
43 The Higher Education Statistics Agency (HESA) is the official agencyfor the collection, analysis and dissemination of quantitativeinformation about higher education in the UK – it integratesstatistical data collection across all publicly funded UK highereducation institutions.
44 The number of students in the dataset is not exactly a headcount ofstudents in each category. Rather, as described on HESA’s website,it ‘represents the institution's best academic judgement of the full-time equivalence of the student’. For example, a part-time student,or a student studying the equivalent of a three year course over fiveyears, would appear as a fraction of a number.
45 For information on grouping of this variable, see Appendix A.
46 Davies (2008), op.cit.
1 The model has been set up to be as flexible as possible. Thisincludes running scenarios where the application of a real rate ofinterest is based on means-testing or institutions charge differentialfees by course. However, the results from these scenarios are notset out in this report.
2 Although the current model focuses on full-time students, theunderlying data provided by HESA includes part-time students andthe model has been designed so that it could relatively easily beextended to include part-time students.
3 Section 26(2) b of the Higher Education Act 2004 requires that theannual increase is no greater than is required to maintain the value(of the fee) in real terms. Under Section 26(3) of the Act, theSecretary of State is to have regard to such index of prices as may bespecified in or determined in accordance with Regulations made byhim/her under this sub-section. The actual increases have been 2.3per cent for 2007/08 and 2.4 per cent for 2008/09.
4 For students aged over 25, it is based on their own householdincome. Parental income is considered for students aged under 25on entry.
5 About 75 per cent of the maximum student loan for maintenance isnon-income-assessed and can be borrowed by all students.Whether or not they are entitled to borrow the remaining 25 per cent,the income-assessed element, depends on household income.
6 There is no formal commitment to raising the amount of therepayment threshold. It last increased from £10,000 to £15,000 in2006.
7 The variability in the amount an institution spends on bursariesdepends on the proportion of additional income each university setsaside for bursaries (depending on need and ability) and also thetake-up of bursaries. OFFA’s report on experience of the first year ofoperation of this system notes that most institutions overestimatedoutreach expenditure. See OFFA (2008), Access agreementmonitoring: outcomes for 2006-07. As indicated in sections below,many institutions offer bursaries on a means-tested basis ofconsiderably more than the minimum requirement.
8 The model has been designed so that longer time horizons can beeasily included.
9 See, for example, the National Committee of Inquiry into HigherEducation (1997), known as the Dearing Report. See also the CubieReport into tuition fees in Scotland (Cubie et al (1999) Student finance:fairness for the future) and the Taylor report (Universities UK (2001)New directions for higher education funding: funding options reviewgroup final report.
10 See note 1.
11 Chester, J and Bekhradnia, B (2008), Funding higher fees: someimplications of a rise in the fee cap (Higher Education Policy Institute).
12 Foskett, N et al (2006), Changing fee regimes and their impact onstudent attitudes to higher education (Higher Education Academy)
13 Ibid.
14 Boorman, S and Brown, N (2007), unpublished paper.
15 BBC News (2005), New student fees ‘may boost debt’.
16 Foskett (2006), op.cit
17 London Economics (2007), Reality check: student finance regimes.
18 Ibid.
19 Chester and Bekhradnia (2008), op.cit.
20 Foskett, N (2006), op.cit.
21 Davies, P, Slack, K, Hughes, A, Mangan, J, and Vigurs, K (2008),Knowing where to study? Fees, bursaries and fair access (Institute forEducational Policy Research and Institute for Access Studies,Staffordshire University).
22 Bekhradnia B, (2008) ‘Raising fees is essential – but there will belosers’, The Independent 3 April.
23 Davies (2008), op.cit.
24 MacLeod, D (2008), ‘Get Wise’, The Guardian 19 February.
25 London Economics (2007), op.cit.
26 Attwood, R (2008), Student loans 'subsidise' top earners as low paidstruggle (Times Higher Education 27 March).
27 Davies (2008), op.cit.
28 Ibid.
Notes
44915 UniUK Fees Report:44915 UniUK fees Report 06/03/2009 12:03 Page 34

Universities UK Changing landscapes 35
44915 UniUK Fees Report:44915 UniUK fees Report 06/03/2009 12:03 Page 35

36
44915 UniUK Fees Report:44915 UniUK fees Report 06/03/2009 12:03 Page 36

100%
This product has been manufactured on paper fromwell managed forests and other controlled sources.It is manufactured using the FSC Chain of Custodyand by a company employing the ISO14001environmental standard.
44915 UniUK Fees Report:44915 UniUK fees Report 06/03/2009 12:03 Page 37

About Universities UK
This publication has beenproduced by Universities UK,which is the representative bodyfor the executive heads of UKuniversities and is recognised asthe umbrella group for theuniversity sector. It works toadvance the interests ofuniversities and to spread goodpractice throughout the highereducation sector.
Universities UKWoburn House20 Tavistock SquareLondonWC1H 9HQ
telephone+44 (0)20 7419 4111
fax+44 (0)20 7388 8649
webwww.UniversitiesUK.ac.uk
© Universities UKISBN 978 1 84036 196 4March 2009
44915 UniUK Fees Report:44915 UniUK fees Report 06/03/2009 12:03 Page 38