Embed Size (px)
Citation preview

Changing Mortality and Morbidity Rates and the Health Status and Life Expectancy of theOlder PopulationAuthor(s): Eileen M. Crimmins, Mark D. Hayward and Yasuhiko SaitoSource: Demography, Vol. 31, No. 1 (Feb., 1994), pp. 159-175Published by: Springer on behalf of the Population Association of AmericaStable URL: http://www.jstor.org/stable/2061913 .
Accessed: 23/07/2013 06:56
Your use of the JSTOR archive indicates your acceptance of the Terms & Conditions of Use, available at .http://www.jstor.org/page/info/about/policies/terms.jsp
.JSTOR is a not-for-profit service that helps scholars, researchers, and students discover, use, and build upon a wide range ofcontent in a trusted digital archive. We use information technology and tools to increase productivity and facilitate new formsof scholarship. For more information about JSTOR, please contact [email protected].
.
Springer and Population Association of America are collaborating with JSTOR to digitize, preserve and extendaccess to Demography.
http://www.jstor.org
This content downloaded from 193.54.110.35 on Tue, 23 Jul 2013 06:56:30 AMAll use subject to JSTOR Terms and Conditions

Demography, Vol. 31, No. 1, February 1994
Changing Mortality and Morbidity Rates and the Health Status and Life Expectancy of the Older Population*
Eileen M. Crimmins Andrus Gerontology Center University of Southern California Los Angeles, CA 90089-0191
Mark D. Hayward Department of Sociology and Population Research Institute The Pennsylvania State University University Park, PA 16802-6202
Yasuhiko Saito Andrus Gerontology Center University of Southern California Los Angeles, CA 90089-0191
This paper demonstrates the consequences of changes in mortality and health transition rates for changes in both health status life expectancy and the prevalence of health problems in the older population. A five-state multistate life table for the mid-1980s provides the baseline for estimating the effect of differing mortality and morbidity schedules. Results show that improving mortality alone implies increases in both the years and the proportion of dependent life; improving morbidity alone reduces both the years and the proportion of dependent life. Improving mortality alone leads to a higher prevalence of dependent individuals in the life table population; improving morbidity alone leads to a lower percentage of individuals with problems in functioning.
The aim of this paper is to demonstrate the consequences of changes in mortality and morbidity rates for changes in both health status life expectancy and the prevalence of health problems in the older population. Declines in mortality at older ages over the past 25 years have been quite remarkable. Less is known about recent morbidity changes in the older population, although most studies indicate modest increases in the reported prevalence of at least mild disability during the 1970s and into the early 1980s (Colvez and Blanchet 1981; Crimmins 1990; Crimmins and Ingegneri 1992; Crimmins, Saito, and Ingegneri 1989; Riley 1990; Verbrugge 1984, 1989). Some preliminary evidence suggests that this pattern may
* An earlier version of this paper was presented at the annual meetings of the Population Association of America, held in Denver, May 1992. Support for this project was provided by NIA Grant ROl AGO5107.
Copyright ( 1994 Population Association of America
159
This content downloaded from 193.54.110.35 on Tue, 23 Jul 2013 06:56:30 AMAll use subject to JSTOR Terms and Conditions

160 Demography, Vol. 31, No. 1, February 1994
have reversed itself since the mid-1980s, with a decline in reported functioning problems among the old (Crimmins and Ingegneri 1992; Manton, Corder, and Stallard 1993; Ycas 1987).
Early reports of increasing disability were met with skepticism. At first glance, it seemed implausible that the health of the older population could deteriorate while life expectancy increased. Recent reports of possible improvements in functioning among the old have met with almost the same skepticism. In both cases the skepticism arises from two sources: the potential weaknesses of available data to reliably and validly determine trends in health, and the fact that we possess no clear expectation of the magnitude of health change associated with given mortality changes. No analysis has demonstrated the sensitivity of population prevalence measures of ill health either to changes in mortality rates or to changes in health status transitions. Nor has any analysis successfully demonstrated the effect of changes in mortality and health transition rates on the length of expected life in various states of health.
In this study, we construct a multistate life table model of health status for the older population, using data pertaining to the second half of the 1980s. We employ simulation techniques to examine the likely effects of known past changes in mortality and possible future changes in mortality and morbidity transition schedules on estimated life expectancy in various states of health and on the prevalence of disability in a life table population. In this way we gain a clearer understanding of the dynamics altering both population health and health experiences pertaining to the individual life cycle.
BACKGROUND Demographers have noted the conceptual differences between measures of population
composition and individual life cycles. Their work leads one to expect little change in population composition with change in mortality. Preston (1982) generalizes that mortality change is likely to have substantial effects on individual life cycle experiences but relatively small effects on population composition. Employing the multistate model, Schoen (1988) observes that a constant change in mortality for each state results in an unaltered age-state composition of the multistate stable population. If mortality change is concentrated in some states but not in others, however, the composition of the population will be affected (Rogers 1992).
Demographers using the epidemiological model of disease prevalence argue that the relationship between mortality change and the prevalence of health problems in the population depends on where the change has occurred in the process of acquiring health problems (Crimmins 1990; Crimmins and Ingegneri 1992; Manton 1982; Verbrugge 1989). If mortality declines because health problems are prevented or because their onset is delayed, population health will improve with the decline in mortality. If the treatment of existing diseases merely prevents their progression or eliminates death at a later stage, some deterioration in population health is expected.
Because data are unavailable, little has been done to document the trends in age at onset and the progression of specific diseases. Evidence relating to physical functioning for 1969-1981, however, indicates little or no change either in age at onset or in disability transition rates for the population over age 65 (Crimmins 1987, 1990; Crimmins and Ingegneri 1992). These findings would lead us to expect a deterioration in population health during the 1970s, a period of declining mortality and of constant age at onset of disability. Similar data are not available to address the trend in more recent years.
A related stream of research investigates change in the length and proportion of active (or healthy) life that occurs with increases in life expectancy (Bebbington 1991; Manton and
This content downloaded from 193.54.110.35 on Tue, 23 Jul 2013 06:56:30 AMAll use subject to JSTOR Terms and Conditions

Changing Health Status and Life Expectancy of Older Population 161
Stallard 1990, 1991; Robine and Ritchie 1991; Wilkins and Adams 1983). Most of this research has paid little attention to the fact that life expectancy is a measure relating to the average experience of individuals over their projected life cycle, whereas the prevalence of health problems is a population or group measure (Crimmins, Saito, and Hayward 1993). One exception is the work of Rogers and his associates (Rogers 1992; A. Rogers, R. Rogers, and Belanger 1990; R. Rogers, A. Rogers, and Belanger 1989), who have emphasized the difference between life table prevalence measures and the incidence-based life expectancy measure. Unfortunately their interpretation of the relationship between these measures is somewhat misleading. For example, when they increased the life table prevalence of dependency by simulating the effects of constant mortality and health status transition rates in a multistate model, the results were interpreted as bias in the prevalence measure rather than as a movement toward the equilibrium population implied by the transition rates (A. Rogers et al. 1990). Although Rogers and colleagues have advanced the field by introducing the multistate model to the study of active life expectancy, the potential of this model for relating population health to expected life cycle experiences remains unrealized.
In this paper we build a baseline multistate life table with four health states, using data on the population of the United States from the 1980s. Employing a series of simulations, we then examine changes in the prevalence rates and the health status life expectancy measures produced by changes in the incidence rates that govern the flows between the life table states.
DATA The Longitudinal Study of Aging (LSOA) is the primary data set used for this analysis.
The LSOA began in 1984 with interviews of a representative sample of the noninstitutionalized population age 70 and over in the United States. Subjects were reinterviewed in 1986, 1988, and 1990. Each year the age of the youngest sample members increases so that by 1990, the sample consists of persons age 76 and older. We pool all four interview waves in this analysis to increase the reliability of the transition estimates.
Because not all members of the original sample were included at the 1986 interview, the description of the sample is more complex than that of a normal panel study with four waves. All of the original 7,527 sample members age 70 and over were eligible for reinterview at the third and fourth waves (1988 and 1990). In 1986, however, only a subset of the original group, 5,151 respondents, was selected for reinterview.
Because the LSOA initially did not include members of the institutionalized population, we supplement these data with estimates of the age-specific proportions of the population institutionalized, taken from the 1989 National Long Term Care Survey. We use these estimates to distribute the radix population (100,000) across the life table health states, mirroring the health status of the entire U.S. population at age 70, and to weight the institutionalized population observed in the LSOA so that it is represented appropriately in the calculation of transition rates.
STATES OF HEALTH OR FUNCTIONING Health and the lack thereof, or morbidity, are clearly multidimensional concepts that
can be measured in many ways. As in most demographic studies of population health and active life in the older population, we operationalize health status using indicators of functioning ability. Although this decision is based partly on availability of data, these
This content downloaded from 193.54.110.35 on Tue, 23 Jul 2013 06:56:30 AMAll use subject to JSTOR Terms and Conditions
162 Demography, Vol. 31, No. 1, February 1994
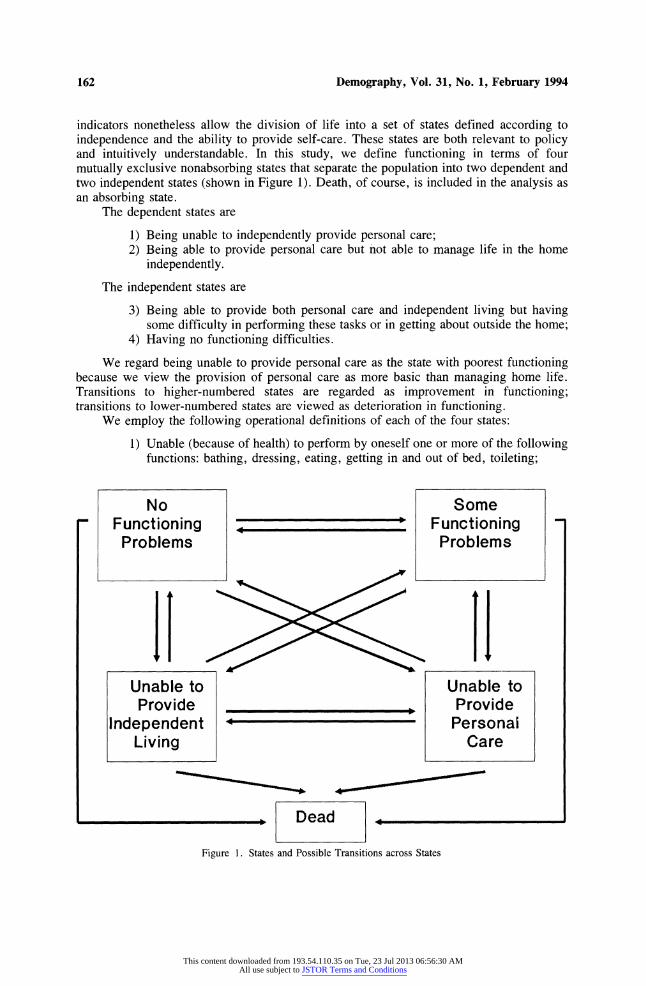
indicators nonetheless allow the division of life into a set of states defined according to independence and the ability to provide self-care. These states are both relevant to policy and intuitively understandable. In this study, we define functioning in terms of four mutually exclusive nonabsorbing states that separate the population into two dependent and two independent states (shown in Figure 1). Death, of course, is included in the analysis as an absorbing state.
The dependent states are
1) Being unable to independently provide personal care; 2) Being able to provide personal care but not able to manage life in the home
independently.
The independent states are
3) Being able to provide both personal care and independent living but having some difficulty in performing these tasks or in getting about outside the home;
4) Having no functioning difficulties.
We regard being unable to provide personal care as the state with poorest functioning because we view the provision of personal care as more basic than managing home life. Transitions to higher-numbered states are regarded as improvement in functioning; transitions to lower-numbered states are viewed as deterioration in functioning.
We employ the following operational definitions of each of the four states:
1) Unable (because of health) to perform by oneself one or more of the following functions: bathing, dressing, eating, getting in and out of bed, toileting;
No Some Functioning Functioning Problems Problems
11 H+1 Unable to Unable to Provide , Provide
Independent Personai Living Care
,_ |Dead __,
Figure 1. States and Possible Transitions across States
This content downloaded from 193.54.110.35 on Tue, 23 Jul 2013 06:56:30 AMAll use subject to JSTOR Terms and Conditions

Changing Health Status and Life Expectancy of Older Population 163
2) Able to perform all of the above functions but unable to perform one or more of the following tasks: preparing own meal, shopping for personal items, managing money, using the telephone, doing light housework;
3) Able to perform all of the above functions, although perhaps with difficulty, and/or having difficulty in one of the following functions: walking one-quarter mile, walking up 10 steps without rest, standing or being on feet for two hours, sitting for two hours, stooping/crouching/kneeling, lifting or carrying 10 pounds;
4) Having no difficulty in performing any of the 16 tasks named in the above definitions.
Although our work follows prior studies by defining health status in terms of functioning, our definitions differ in significant ways. Unlike many studies, ours does not define health states solely according to personal care activities (Branch et al. 1991; A. Rogers et al. 1990; R. Rogers et al. 1989). We include activities that cover a much wider range of functions. Even so, we do not use information on all the tasks listed in the LSOA. Each set of tasks in our study is selected as an indication of ability to provide self-care or to function at a given level. We select them because of the likelihood of impairment and change in impairment related to that function as well as for their face validity (Crimmins and Saito 1993). Because we are interested in functioning and health, our definitions rest on whether one is unable to perform tasks, not on whether one receives assistance with tasks.
Although a hierarchical interpretation of these health states is not essential to the application of the model, we believe that the evidence supports such an interpretation. Life expectancy for the four groups at age 70 (calculated by using a traditional life table method) ranges from 5.5 years for those needing personal care to 18.0 years for those who have no functioning problems. For the two middle groups, the values are 7.8 years for those who need help in managing independent living and 15.3 years for those with some functioning problems. The groups also differ widely in the number of functioning deficits. On average, the group needing personal care (not including the institutionalized portion of this group, for which data on specific functioning abilities were not available) cannot perform five of the 10 functions used in defining the first two states; for the group unable to manage independent home life, the number is slightly less than 2; by definition, the value for the next two groups is 0. For the first three groups, the numbers of other tasks (out of six) performed with some difficulty are 4.8, 3.9 and 2.4. Again by definition, the value for the fourth group is 0.
In our analysis we include the institutionalized population with those unable to provide personal care because the difference between living in the community and entering an institution for those unable to perform personal care is often a function of economic circumstances and availability of support (Garber and MaCurdy 1990). Our purpose is to determine the health status of the population under a variety of assumptions about changes in mortality and morbidity rates unconfounded by the effects of change in income and social support. In addition, given the two-year interval length, we estimate that about 80% of transitions into the institutionalized state will not be observed for this population.
The functioning state of each person is noted at each wave. Table 1 shows the initial and the end functioning states for each member of the panel for each observation interval begun alive (or missing). The pooled sample yields 15,584 observations, distributed as indicated. ' We pool the data over three intervals to increase the number of observations and to produce more reliable transition schedules.
This content downloaded from 193.54.110.35 on Tue, 23 Jul 2013 06:56:30 AMAll use subject to JSTOR Terms and Conditions

164 Demography, Vol. 31, No. 1, February 1994
Table 1. Distribution of Observations by Functioning State at Beginning and End of Two-Year Interval
State at End of Two-Year Interval Unable to Unable to
State at Provide Provide Some No Beginning Personal Independent Functioning Functioning of Interval Care Living Problems Problems Dead Missing Total Unable to
Provide Personal Care 651 106 90 15 563 58 1,483
Unable to Provide Independent Living 375 483 245 33 328 43 1,507
Some Functioning Problems 514 672 3,894 837 705 283 6,905
No Functioning Problems 154 123 1,517 2,581 293 191 4,859
Missing 41 18 85 46 63 577 830 Total 1,735 1,402 5,831 3,512 1,952 1,152 15,584
ANALYTICAL METHODS Transition Rates
Status differences between the beginning and the end of intervals are used to determine transitions in health status. Thus the data impose the assumption that only one transition occurs within each two-year interval; such an assumption very likely results in underestimating transitions. Within each observation interval, events (i.e., a death or a health status transition, and censoring) are assumed to occur in the middle of the interval, and exposure is adjusted to produce central rates. Thus the transition rates are assumed to be constant within intervals, although rates may vary across intervals.
The transition rates in this analysis are defined as
wij(x) = lim Pij(x,n) / n, (1)
where Pij(x,n) represents the probability that a transition from state i (e.g., no functioning problems) to state j (e.g., some functioning problems) occurs in the interval x to x + n, given that the person is in state i at exact age x (for this study, n = 2). We estimate these rates on the basis of a model which assumes that the process depends only on age. The general form of the model is
Iij(x) = exp (I3ijo + 13ijl x) (2a)
or, equivalently,
ln p-jj(x) = 1ijo + I3ijl * x. (2b)
This content downloaded from 193.54.110.35 on Tue, 23 Jul 2013 06:56:30 AMAll use subject to JSTOR Terms and Conditions

Changing Health Status and Life Expectancy of Older Population 165
In estimating these models we treat age as a continuous variable ranging from 70 to 96 years.2 Models of this form are analogous to piecewise exponential models used in discrete-time hazards analyses (Allison 1982; Blossfeld, Hamerle, and Mayer 1989).
We estimated 16 hazard models, each corresponding to a path shown in Figure 1 (16 = 4 origin states x 5 destination states - 4). Then we used the parameter estimates from each model to obtain schedules of predicted age-specific transition rates, m(x,n).3
Life Tables
To construct the life tables, we used the matrix of transition rates, M(x,n), to calculate a transition probability matrix, P(x,n). The formula below is the numerical approximation for P(x,n) suggested by Rogers and Ledent (1976) and by Willekens et al. (1982):
P(x,n) = (I + n/2 M(x,n))-l (I-n/2 M(x,n)). (3)
This equation allows us to specify the familiar life table relationship from which survivorship values for all ages from 70 up can be calculated (Hayward and Grady 1990; Rogers 1975; Schoen and Woodrow 1980):
I(x + n) = I(x) * P(x,n). (4)
The survivorship matrix I(x+n), whose elements are lij(x+n), denotes the number of persons in state i at exact age x who are in state j at exact age x + n. The survivorship matrix 1(x) is similar to I(x + n) but its elements, lij(x), represent the number of persons in both state i and state j at exact age x. Because a person can not occupy two states at the same time, the off-diagonal elements are 0; the diagonal elements represent the number of survivors in state i at exact age X.4 Finally, the transition probability matrix, P(x,n), consists of elements, Pij(x,n), which represent the probability that a person in state i at exact age x will be in state j at exact age x + n.
Once the survivorship values are calculated, we can estimate the expected magnitude of flows between health states for ages 70 and above. For example, we can calculate the expected number of moves into and out of the "no functioning problems" state above a certain age or between ages. These numbers are useful descriptors of individuals' experiences in health status over the life cycle. Calculation of transfers between health states for each age, D(x,n), is based on the following:
D(x,n) = L(x,n) * M(x,n), (5)
where L(x,n) denotes a matrix of person-years lived in health states between exact age x and x + n and assuming linearity in the gross flow functions,
L(x,n) = n/2 (I(x) + I(x + n)). (6)
The last key measure of the synthetic cohort's life cycle health experiences is the expectation of life in each health status. The life expectancy in state i at exact age x, ei(x), is calculated as follows:
ei(x) = Ti(x) / 1(x), (7)
where Ti(x) is the number of person-years lived in state i beyond age x by the cohort who survived to exact age x, and 1(x) is the number of survivors at exact age x.
In our analysis we use population-based rather than status-based multistate life tables. Population-based multistate life tables indicate the life expectancy and the health status of the entire life table population as it is distributed across health states at all ages of the life table. Other researchers have presented status-based life tables using similar data (A. Rogers
This content downloaded from 193.54.110.35 on Tue, 23 Jul 2013 06:56:30 AMAll use subject to JSTOR Terms and Conditions

166 Demography, Vol. 31, No. 1, February 1994
et al. 1990; R. Rogers et al. 1989). Status-based life tables indicate the health status and life expectancy of a group that enters the life table in one particular health state rather than that of the entire population. To estimate population-based tables we distribute the radix population according to the observed prevalence in each of the health states for the U.S. population 70 years of age.
The population-based life table contains two core summary measures of the cohort's life cycle experiences, namely the volume of movement during a time period and status life expectancy. For example, we could compare the relative frequency, across ages, of declines and improvements in health status. This information is important for understanding how changes in health and functioning are associated with aging. Similarly, health status life expectancies give some notion of the portions of the life cycle spent in varying degrees of poor health.
Population-based tables also allow us to compute the implied age-specific prevalence of health states in the life table population. The prevalence rates of health status are a consequence of flows both into and out of the various health states over some specified period-two years in our case-and of the stock of persons in each status.
Conceptually the health prevalence rates are distinct from the two types of life table measures noted above. Prevalence rates have no time dimension and take on meaning only with reference to a population group. In general terms these rates represent the population structure with regard to some attribute. Measures such as status life expectancy and the expected volume of transitions represent individual aging experiences. As we stated above, these concepts are related because individual life cycle experiences give rise to population structure.
We illustrate the connections between prevalence rates and transition rates by adopting a simple life table model consisting of two "alive" states-no functional limitations (o) and the presence of a functional limitation (i)-and an absorbing state of death (8). The prevalence rate of functional limitations among persons age x to x + n, PREVi(x,n), can be expressed in terms of life table notation, as follows (Schoen and Woodrow 1980):
PREVA,n) Li(x,n) (8) PREV(x,n) = L (x,n) + L0(x,n)
In this expression, Li(x,n) refers to the person-years lived in health state i during the age interval x to x + n, and is calculated according to Equation (6). This term is analogous to the midyear population of persons who are in health status i.
The net flow equations that give rise to the person-year values, and hence to the health status prevalence rates, are
lo(x + n) = 1(x) + di0(x,n) - d0j(x,n) - d.z,(x,n) (9)
and
li(x + n) = li(x) + d0i(x,n) - di0(x,n) - di(x,n). (10)
The first flow equation says that the number of persons without functional limitations at age x + n is equal to the number of persons without limitations at age x (i.e., a stock), plus the number of moves from some limitation to no limitation, minus the number of moves from no limitation to some limitation, minus those persons who had no limitations at age x who died during the interval. The interpretation of the second expression parallels that of the first. Because these two expressions define the numerator and the denominator of the prevalence rate, the complexity of behavior underlying the seemingly simple prevalence measure of health status is readily apparent. One of the aims of this paper is to clarify the
This content downloaded from 193.54.110.35 on Tue, 23 Jul 2013 06:56:30 AMAll use subject to JSTOR Terms and Conditions

Changing Health Status and Life Expectancy of Older Population 167
demographic dynamics that underlie the prevalence measures of health status in the older population.
RESULTS
Following the above procedures, we estimated life expectancy in the four states of health for the population age 70 and over in the United States during the latter part of the 1980s (Table 2). Total life expectancy at 70, estimated by the multistate method, is 12.16 years. This value is considerably lower than the value of 13.7 years that we would obtain by using the same data to construct a traditional single-decrement life table. U.S. vital statistics report a life expectancy of 13.9 years at age 70 in 1989, very similar to that of the sample (U.S. Bureau of the Census 1992). The difference between the single-decrement and the multistate method arises both from the Markovian assumptions of the multistate model and from the method used to apply the model (e.g., parameterization of 16 transition schedules and the use of the transition approach).
At age 70, one will spend slightly less than half of the expected years of life with some functioning difficulties but able to live independently. One can expect to be in one of the dependent states for 2.88 years (or 24% of remaining life). Living to an older age does not imply much increase in the number of disabled years, a finding similar to that of Branch et al. (1991); at age 90, the estimate is 3.24 (2.70 + 0.54) years of dependency. Certainly some of this increase is due to the increase in the number of people institutionalized at older ages because of changes in their social support networks or economic circumstances. As a result of the relative constancy in the expected number of years dependent, individuals spend a higher proportion of their remaining lives in this state as they age. At 80 this proportion is .43; at 90 it is .71.
The prevalence of the life table population in each of the four states is also shown in Table 2 and Figure 2. Almost half of the 70- and 71-year-olds have no functioning difficulties; almost another half have some difficulties but still are able to live independently. Only 3% live in the community but cannot provide independent living; 5%, about half of whom live in the community, are unable to provide personal care. The
Table 2. Expectations of Life and Implied Age-Specific Prevalence of Population in Specified States Derived from Population-Based Multistate Life Table, 1984-1990 (LSOA Population 70 +)
Unable to Unable to No Some Provide Provide
Functioning Functioning Independent Personal Age Total Problems Problems Living Care
Expectation of Life by States 70 12.16 3.91 5.36 0.70 2.18 80 7.31 1.33 2.83 0.68 2.46 90 4.38 0.23 0.91 0.54 2.70
Implied Age-Specific Prevalence of Population by States 70-71 1.00 0.46 0.46 0.03 0.05 80-81 1.00 0.27 0.46 0.07 0.20 90-91 1.00 0.08 0.28 0.12 0.51
This content downloaded from 193.54.110.35 on Tue, 23 Jul 2013 06:56:30 AMAll use subject to JSTOR Terms and Conditions

168 Demography, Vol. 31, No. 1, February 1994
100
9 No
70
70 72 74 76 78 80 82 84 86 88 90 92 94 96 Age
Figure 2. Implied Prevalence of Health Status in the Life Table Population
proportion of the life table survivors in the two dependent groups increases regularly with age, while the proportion with no functioning problems decreises sharply.
This picture of population prevalence may give a sense of a steady progression from good to poor functioning. Although this is true for the population as a whole, however, it is not necessarily the case for individuals. The summary figures in Table 3 show that the 100,000 individuals in the life table population make 267,571 transitions to death or between health statuses; 100,000 of these are to death. About one-third (29.6%) of the 167,571 health tranlsitions are to better health; the rest represent deterioration in functioning. In the two states where change can occur in either direction-where functioning can either deteriorate or improve-those who survive are almost as likely to move to better health as to worse health. About half of the deaths occur from a state of dependence, the greater proportion (40%) from a state of needing personal care.
Implications of Changing Life Table Parameters Table 2 illustrates the implications of observed mortality and health status transition
rates during the latter part of the 1980s. Now we systematically change the mortality and morbidity transition schedules in the life table. This exercise produces the stable or stationary population composition and the cohort life experiences implied by the new transition rates. We examine the consequences of changes in transition forces by first altering mortality rates. This step is followed by changing the rates of deteriorating functioning status and the rates of improving health status. In our initial examination of each
This content downloaded from 193.54.110.35 on Tue, 23 Jul 2013 06:56:30 AMAll use subject to JSTOR Terms and Conditions

Changing Health Status and Life Expectancy of Older Population 169
Table 3. Number of Transitions between States Made by the Life Table Population Age 70 +
Initial State Unable to Unable to
No Some Provide Provide End Functioning Functioning Independent Personal State Problems Problems Living Care Total No
Functioning Problems - 32,783 1,317 1,346 35,446
Some Functioning Problems 52,884 - 5,671 5,087 63,642
Unable to Provide Independent Living 4,039 15,188 - 3,409 22,636
Unable to Provide Personal Care 10,617 25,763 9,467 - 45,847
Dead 15,726 34,759 9,371 40,144 100,000 Summary Total
Transitions 83,266 108,493 25,826 49,986 267,571 To death 15,726 34,759 9,371 40,144 100,000 To better
health 0 32,783 6,988 9,842 49,613 To worse
health 67,540 40,951 9,467 0 117,958
effect we keep all other transition schedules constant at the level of the baseline life table. Then we examine the effect of letting all three sets of rates vary together. Finally, we examine the effect of changing the radix allocation of the population. Substantively this effect represents changes in the health status of the population at younger ages; as a result, a population with a different health status enters older age (Rogers 1992; Schoen 1988). We evaluate the implications of each change for life expectancy at age 70, and then for the health status of the life table population at age 80-81.
In Table 4, Panel A shows the baseline figures for age 70 from Table 2. Panel B displays the life expectancies that would occur with a change in mortality rates similar to that which occurred between 1968 and 1989 in the total U.S. population age 70 and over. To produce this change we increased mortality at all ages and from all states by 36.8%, keeping all other transition rates constant.5 This change lowered life expectancy at age 70 by about two years (from 12.16 to 10.32). Although life expectancy in all states is lower, the most significant change occurs in the health status "unable to perform personal care": the status life expectancy value is 35% lower under the high-mortality regime. Increasing mortality also results in a reduction in the proportion of expected life dependent. When the baseline life table is used, 24% of expected life is life in which help in functioning will be
This content downloaded from 193.54.110.35 on Tue, 23 Jul 2013 06:56:30 AMAll use subject to JSTOR Terms and Conditions

170 Demography, Vol. 31, No. 1, February 1994
Table 4. Life Expectancy at Age 70 for Both Sexes, by Health Status
(4) + (5)
() (2) (3) (4) (5) (1) Unable to Unable to Proportion
No Some Provide Provide Life Functioning Functioning Independent Personal Expectancy
Total Problems Problems Living Care Dependent
A. Baseline 12.16 3.91 5.36 0.70 2.18 0.24 B. Change Mortality
Increase 36.8% 10.32 3.64 4.72 0.53 1.42 0.19 Decrease 36.8% 15.38 4.25 6.22 1.01 3.91 0.32 Increase 50%
(only dependent) 11.16 3.87 5.22 0.58 1.48 0.18 Decrease 50%
(only dependent) 14.61 3.98 5.59 0.96 4.09 0.35 C. Change Getting Worse
Increase 36.8% 11.32 3.06 5.02 0.70 2.54 0.29 Decrease 36.8% 13.32 5.33 5.62 0.67 1.70 0.18
D. Change Getting Better Increase 36.8% 12.50 4.47 5.27 0.69 2.08 0.22 Decrease 36.8% 11.77 3.31 5.43 0.73 2.30 0.26
E. Combined Change 36.8% change
toward healthier life 17.22 6.72 6.47 1.02 3.01 0.23
50% change toward healthier life 20.27 8.44 6.99 1.26 3.58 0.24
36.8% change toward worsening health 9.28 2.45 4.49 0.57 1.77 0.25
F. Change Initial Distribution Increase 36.8%
states with functioning problems 11.83 3.21 5.67 0.73 2.22 0.25
Decrease 36.8% states with functioning problems 12.49 4.61 5.04 0.68 2.15 0.23
required. When mortality is 36.8% higher, the percent of total life expectancy in which help would be required declines to 19%.
Reducing mortality rates by the same percentage and holding all other transitions constant has the opposite effect. Not surprisingly, life expectancy in every state is higher, but the expected percentage of life dependent also increases. If mortality rates across all ages decreased another 36.8% from the baseline, 32% of life after age 70 would be dependent. The greatest increase (1.73 years) occurs in years of life unable to provide personal care.
Although an equitable decline in mortality across states of health is one plausible scenario, some researchers have suggested that past declines in mortality were concentrated among the frailest members of the population (Gruenberg 1977; Kramer 1980). To simulate this effect for the past, we concentrate the mortality increase among the two dependent states by assuming a 50% increase in the mortality schedules for these two groups, with the other two groups maintaining baseline mortality; to simulate the effect for the future, we decrease the baseline mortality in the same way. Concentrating the mortality change among
This content downloaded from 193.54.110.35 on Tue, 23 Jul 2013 06:56:30 AMAll use subject to JSTOR Terms and Conditions

Changing Health Status and Life Expectancy of Older Population 171
the most frail, however, does not greatly change the result we obtain when the mortality decline is spread across the entire population.
Next we change the likelihood of deterioration in function but hold mortality constant (Panel C). When the rates of transition to worse functioning are reduced, just over one year of life (13.32 vs. 12.16) is added and the proportion of expected life dependent is reduced by six percentage points (from 0.24 to 0.18). When the likelihood of improvement in functioning is changed by the same percentages (Panel D), the changes are in the same direction as those for the "getting worse" scenarios. The magnitude, however, is much smaller.
It is somewhat implausible that any one of these scenarios would occur in isolation. In a more realistic situation, they all might happen together; that is, mortality would decrease, getting worse would decrease, and getting better would increase (Panel E). This is what we regard as change toward a healthier life in the future. If the trends were reversed, the result would be change toward worsening health, which could have been the state of the older population in the United States about 20 years ago. If everything deteriorated by 36.8%, life expectancy at age 70 would be much lower (9.28 years) but the proportion of inactive or dependent life would be only 1% higher. If everything were to improve by 36.8%, estimated life expectancy would increase by 5.1 years but the percentage of life expectancy in which one could provide self-care would increase by only 1% from the current percentage. Even if every transition schedule were improved by 50%, the proportion of life in which one needed help would not change, although life expectancy would increase by eight years and years of dependent life expectancy by two years.
In sum, higher mortality, lower morbidity, and more rehabilitation (all other rates being equal) are linked to a greater proportion of healthy life. If all these factors change in unison, we find little change in the proportion of healthy life but significant change in the absolute amount.
To examine the effect of changes in cohort composition on life expectancy, we increase and then decrease by 36.8% the proportion of the population in each of the health statuses with functioning deficits (Panel F). Changing the initial distribution of the population at age 70 has less effect than changing the transition schedules in old age. If more people enter old age without functioning problems, but if the transition rates in old age remain constant, life expectancy will increase only slightly and the proportion of life dependent will decrease only slightly.
Now we examine the implications of the same changes for the prevalence of the population in the various health states for age 80-81 (Table 5). We focus on age 80 to show the effects of changing the process at earlier ages.
Although the direction of change in the prevalence rates is what we would expect, given the preceding information on length of life, we find that only a relatively small change in the prevalence of health states accompanies mortality change (Panel B). If mortality rates were 36.8% higher than current rates, the prevalence of dependency would be 4% lower. If rates decreased 36.8% from current rates, the prevalence of dependency would increase by 3%. Concentrating the mortality decline in the dependent section of the population results in a 6% increase in the proportion of the population which would need assistance in functioning.
Similar percentage changes in the likelihood of worsening functional states have a greater impact on the implied prevalence of health states than do the mortality changes. If transitions to worse health were 36.8% higher than at the present, the implied prevalence of the dependent population would be 9% greater (Panel C).
When we change the probability of retuming to better functioning (Panel D), the effect on the prevalence of the functionally dependent population is similar in size to the mortality effect but it is opposite in sign. Improving mortality increases the proportion functionally
This content downloaded from 193.54.110.35 on Tue, 23 Jul 2013 06:56:30 AMAll use subject to JSTOR Terms and Conditions

172 Demography, Vol. 31, No. 1, February 1994
Table 5. Implied Prevalence of Population in Specified Health States for Age 80-81
(1) (2) (3) (4) (5) (4) + (5) Unable to Unable to
No Some Provide Provide Functioning Functioning Independent Personal Proportion
Total Problems Problems Living Care Dependent
A. Baseline 1.00 0.27 0.46 0.07 0.20 0.27 B. Change Mortality
Increase 36.8% 1.00 0.28 0.48 0.06 0.17 0.23 Decrease 36.8% 1.00 0.25 0.45 0.07 0.23 0.30 Increase 50%
(only dependent) 1.00 0.29 0.49 0.06 0.16 0.22 Decrease 50%
(only dependent) 1.00 0.24 0.43 0.07 0.26 0.33 C. Change Getting Worse
Increase 36.8% 1.00 0.19 0.45 0.08 0.28 0.36 Decrease 36.8% 1.00 0.40 0.44 0.05 0.12 0.17
D. Change Getting Better Increase 36.8% 1.00 0.32 0.44 0.06 0.18 0.24 Decrease 36.8% 1.00 0.21 0.48 0.08 0.23 0.31
E. Combined Change 36.8% change
toward healthier life 1.00 0.43 0.40 0.05 0.12 0.17
50% change toward healthier life 1.00 0.51 0.36 0.04 0.09 0.13
36.8% change toward worsening health 1.00 0.15 0.48 0.09 0.29 0.38
F. Change Initial Distribution Increase 36.8%
states with functioning problems 1.00 0.26 0.47 0.07 0.21 0.28
Decrease 36.8% states with functioning problems 1.00 0.28 0.46 0.07 0.19 0.26
dependent; improving the chances of getting better reduces the proportion functionally dependent.
Because the mortality effects and the rehabilitation effects are in opposite directions, the overall effect of change toward a 36.8% healthier life is similar in all three areas to the effect of reducing the transitions to worse health (Panel E). A 50% change toward improved health would reduce remarkably the prevalence of dependency, again primarily because of a change in the likelihood of becoming dependent. By age 80, however, neither set of changes in the radix allocation of the population has much effect on the distribution of the population across functioning states (Panel F), an indication that the effect is dampened as age increases.
SUMMARY AND CONCLUSIONS Our analysis has shown that change in mortality creates the greatest changes in levels
of life expectancy at the oldest ages. Changes in the rates of either mortality or morbidity transitions affect the length of dependent life. Improving mortality alone implies an increase
This content downloaded from 193.54.110.35 on Tue, 23 Jul 2013 06:56:30 AMAll use subject to JSTOR Terms and Conditions

Changing Health Status and Life Expectancy of Older Population 173
in both the years and the proportion of dependent life; improving morbidity alone reduces both the years and the proportion of dependent life. If mortality and morbidity change together, the relative length of dependent life remains virtually unchanged.
The prevalence of disability also is affected by changes in both mortality and morbidity. Again, improving mortality alone leads to a higher proportion of nonfunctioning individuals in the life table population; improving morbidity leads to a lower percentage of nonfunctioning individuals. Improving morbidity represents a scenario in which the age at onset of functioning problems is increased. Thus the most effective way to reduce the percentage of the population with functioning disabilities is to increase the age at which people make the transition to poorer functioning. The decrease in transition rates to poor functioning, or the increase in age at onset of poor functioning while keeping mortality constant, could be called the "compression of morbidity" scenario (Fries 1980).
Our scenario of changes in all rates together toward improving health shows that although the proportion dependent in the life table population decreases, the proportion of expected life dependent is not changed in this scenario. This point demonstrates the usefulness of examining measures of population health as well as individual life.
Our simulations demonstrate that a population certainly can experience longer expected life but worsening health. In fact, it is probably reasonable to assume that this is the situation in the early stages of declining death rates from chronic diseases. When medical science and technology first address a chronic disease, the initial effect probably is felt on the death rates of fairly sick people. As progress is made against chronic diseases, either fatal or nonfatal, the progression of these diseases may be arrested at earlier stages. Eventually the understanding of the disease process may advance to the point where the age at onset of problems is increased and people are restored to better health. Such a situation would lead to a decline in the proportion of the population dependent.
Our results, of course, are based on the empirically observed mortality-morbidity transitions experienced during the latter part of the 1980s. Consequently they are relevant for populations in which the disease regime is dominated by chronic diseases for which there is no known cure and in which the cause structure of mortality is similar to that in the United States during the 1980s.
NOTES We found it necessary to impute health status for missing cases in order to produce levels of life
expectancy that reflect the sample's experience. Because deaths to sample members are recorded from information collected in the National Death Index, missing cases are likely to be persons who remain alive. Ignoring the missing cases while using the information from the death index results in underestimation of life expectancy. To compensate for this problem and to maintain the pattern of observed transitions, we imputed health status for respondents who were not known to be dead and who had reported health status either in the two waves before the wave in which they became lost to follow-up or immediately before and after the wave with the missing response. Health status is imputed for 1,176 interval observations that arise from 816 respondents. In each of 92 data sets determined by the pattern of missing data, we calculate the probability of being in a certain health status according to the probability actually observed in similar patterned responses and imputed that status to the missing persons. When we compare the distribution of 20 types of transitions in the two data sets (with and without imputation), the percentage of any one type of transition as a proportion of all transitions differ by less than 1.0.
2 To estimate appropriately the two-year age-specific hazard rate, we added 1.5 to an assigned age (the lower bound of each two-year age-group) for each two-year age-group (e.g., 71.5 for persons age 70-71). We did so because respondents are 0.5 year older than their stated age at the beginning of
This content downloaded from 193.54.110.35 on Tue, 23 Jul 2013 06:56:30 AMAll use subject to JSTOR Terms and Conditions

174 Demography, Vol. 31, No. 1, February 1994
the interval, on average, and 1.0 year older at the middle of the interval. Results of the hazard rate estimations on which the life tables are based are available from the authors.
3 The hazard rate estimation is based on a file of approximately two-year exposure intervals. To correct for the fact that the average interval length between waves differed slightly, however, we adjust the intervals for the average length. The first interval averaged two years and two months; the second interval averaged two years and one-half month; the third averaged one year and 11 months.
4 The elements of I(x) represent the stock of survivors in each health state at exact age x. The elements of l(x + n) represent the flow of persons among health states and to death between exact ages x and x + n. Once l(x + n) is computed, its elements are rearranged to represent the stock at exact age x+n. In other words, if y=x+n, 1(y) is not the same as l(x+n) (Schoen 1988, p. 68).
5 We use average age-specific mortality change among persons age 70 and over between 1968 and 1989 to set a plausible level of change in all parameters because no data are available for transition rates other than mortality. The 36.8 figure used in the analysis is an unweighted average of the percentage change in single-year age-specific mortality rates (except for the open-ended oldest group) from age 70 through 85+, calculated from unpublished NCHS data. When we use the actual age-specific rates of change for each age group rather than the average for all age groups, the results are virtually identical with regard to life expectancy and prevalence of health status in the population.
REFERENCES
Allison, P. D. 1982. "Discrete-Time Methods for the Analysis of Event Histories." Pp. 61-98 in Sociological Methodology, edited by S. Leinhart. San Francisco: Jossey-Bass.
Bebbington, A. C. 1991. "The Expectation of Life without Disability in England and Wales: 1976-88." Population Trends 66:26-29.
Blossfeld, H.-P., A. Hamerle, and K. U. Mayer. 1989. Event History Analysis. Hillsdale, NJ: Erlbaum.
Branch, L. G., J. M. Guralnik, D. J. Foley, F. J. Kohout, T. T. Wetle, A. Ostfeld, and S. Katz. 1991. "Active Life Expectancy for 10,000 Caucasian Men and Women in Three Communities." Journal of Gerontology 46:M145-50.
Colvez, A. and M. Blanchet. 1981. "Disability Trends in the United States Population 1966-76: Analysis of Reported Causes." American Journal of Public Health 71:464-71.
Crimmins, E. M. 1987. "Evidence on the Compression of Morbidity." Gerontologica Perspecta 1:45-49.
. 1990. "Are Americans Healthier as Well as Longer-Lived?" Journal of Insurance Medicine 22:89-92.
Crimmins, E. M. and D. G. Ingegneri. 1992. "Health Trends in the American Population." Pp. 259-78 in Demography and Retirement: The 21st Century, edited by A. M. Rappaport and S. J. Schieber. Westport, CT: Greenwood.
Crimmins, E. M. and Y. Saito. 1993. "Getting Better and Getting Worse: Transitions in Functional Status among Older Americans." Journal of Aging and Health 5:3-36.
Crimmins, E. M., Y. Saito, and M. D. Hayward. 1993. "Sullivan and Multistate Methods of Estimating Active Life Expectancy: Two Methods, Two Answers." Pp. 155-60 in Calculation of Health Expectancies: Harmonization, Consensus Achieved and Future Perspectives, edited by J. M. Robine, C. D. Mathers, M. R. Bone, and I. Romieu. Paris: Libbey Eurotext.
Crimmins, E. M., Y. Saito, and D. Ingegneri. 1989. "Changes in Life Expectancy and Disability-Free Life Expectancy in the United States." Population and Development Review 15:235-67.
Fries, J. F. 1980. "Aging, Natural Death and the Compression of Morbidity." New England Journal of Medicine 303:130-35.
Garber, A. M. and T. MaCurdy. 1990. "Predicting Nursing Home Utilization among the High-Risk Elderly." Pp. 173-204 in Issues in the Economics of Aging, edited by D. Wise. Chicago: University of Chicago Press.
Gruenberg, E. M. 1977. "The Failure of Success." Milbank Memorial Fund Quarterly 55:3-34.
This content downloaded from 193.54.110.35 on Tue, 23 Jul 2013 06:56:30 AMAll use subject to JSTOR Terms and Conditions

Changing Health Status and Life Expectancy of Older Population 175
Hayward, M. D. and W. R. Grady. 1990. "Work and Retirement among a Cohort of Older Men in the United States, 1963-1983." Demography 27:337-56.
Kramer, M. 1980. "The Rising Pandemic of Mental Disorders and Associated Chronic Diseases and Disabilities." Acta Psychiatrica Scandinavica 285:382-97.
Manton, K. G. 1982. "Changing Concepts of Morbidity and Mortality in the Elderly Population." Milbank Memorial Fund Quarterly 60:183-244.
Manton, K., L. S. Corder, and E. Stallard. 1993. "Estimates of Change in Chronic Disability and Institutional Incidence and Prevalence Rates in the U.S. Elderly Population From the 1982, 1984 and 1989 National Long Term Care Survey." Journal of Gerontology 48:S153-66.
Manton, K., and E. Stallard. 1990. "Changes in Health Functioning and Mortality." Pp. 140-62 in The Legacy of Longevity, edited by S. Stahl. Newbury Park, CA: Sage.
. 1991. "Cross-Sectional Estimates of Active Life Expectancy for the U.S. Elderly and Oldest-Old Populations." Journal of Gerontology: Social Sciences 46:S170-82.
Preston, S. 1982. "Individual Life Cycles and Population Characteristics." American Sociological Review 47:253-64.
Riley, J. C. 1990. "The Risk of Being Sick: Morbidity Trends in Four Countries." Population and Development Review 16:403-32.
Robine, J.-M. and K. Ritchie. 1991. "Healthy Life Expectancy: Evaluation of a New Global Indicator for Change in Population Health." British Medical Journal 302:457-60.
Rogers, A. 1975. Introduction to Multi-Regional Mathematical Demography. New York: Wiley. . 1992. "Heterogeneity and Selection in Multistate Population Analysis." Demography
29:31-38. Rogers, A. and J. Ledent. 1976. "Increment-Decrement Life Tables: A Comment." Demography
13:287-90. Rogers, A., R. Rogers, and A. Belanger. 1990. "Longer Life but Worse Health? Measurement and
Dynamics." The Gerontologist 30:640-49. Rogers, R., A. Rogers, and A. Belanger. 1989. "Active Life among the Elderly in the United States:
Multistate Life Table Estimates and Population Projections." Milbank Memorial Fund Quarterly 67:370-411.
Schoen, R. 1988. Modeling Multigroup Populations. New York: Plenum. Schoen, R. and K. Woodrow. 1980. "Labor Force Status Life Tables for the United States, 1972."
Demography 17:297-322. U.S. Bureau of the Census. 1992. Statistical Abstract of the United States: 1992. Washington, DC:
U.S. Bureau of the Census. Vebrugge, L. M. 1984. "Longer Life but Worsening Health? Trends in Health and Mortality of
Middle-Aged and Older Persons." Milbank Memorial Fund Quarterly 62:474-519. . 1989. "Recent, Present and Future Health of American Adults." Pp. 333-51 in Annual
Review of Public Health, Vol. 10, edited by L. Breslow, J. E. Fielding, and L. B. Love. Palo Alto: Annual Reviews Inc.
Willekens, F. J., I. Shah, J. M. Shah, and P. Ramachandran. 1982. "Multi-State Analysis of Marital Status Life Tables: Theory and Application." Population Studies 36:129-44.
Wilkins, R. and 0. B. Adams. 1983. "Health Expectancy in Canada, Late 1970's: Demographic, Regional, and Social Dimensions." American Journal of Public Health 73:1073-80.
Ycas, M. A. 1987. "Are the Eighties Different? Continuity and Change in the Health of Older Persons." Pp. 57-61 in Proceedings of the 1987 Public Health Conference on Records and Statistics. Hyattsville, MD: National Center for Health Statistics.
This content downloaded from 193.54.110.35 on Tue, 23 Jul 2013 06:56:30 AMAll use subject to JSTOR Terms and Conditions