Embed Size (px)
Citation preview
“Changing Natural Gas Pipeline Throughputs in Canada” Presented at 2015 EIA Energy Conference
June 15, 2015 Margaret Skwara, National Energy Board
Abha Bhargava, National Energy Board
• National Energy Board Act • LNG Export and Import Licence
Applications (summary and links to LNG export licence applications)
• Market Snapshots (energy information updates; weekly updates)
• Energy Futures Report (long term projections of supply and demand; Nov 2015 new release)
• Regulatory Document Index (submissions, correspondence, decisions)
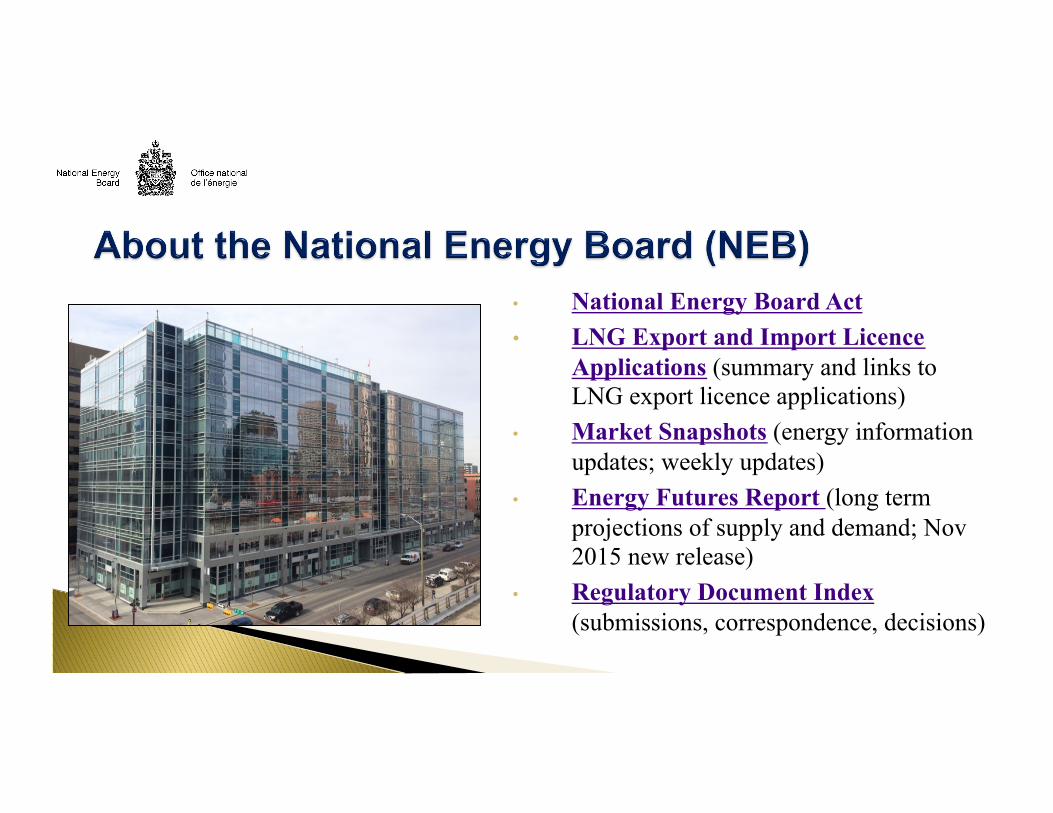
• 73,000 km of interprovincial and international pipelines.
• Pipelines shipped $159 billion worth of crude, petroleum products, NGLs and natural gas.
• Transportation cost of approximately $7 billion.
Source: NEB 2014 Annual Report to Parliament
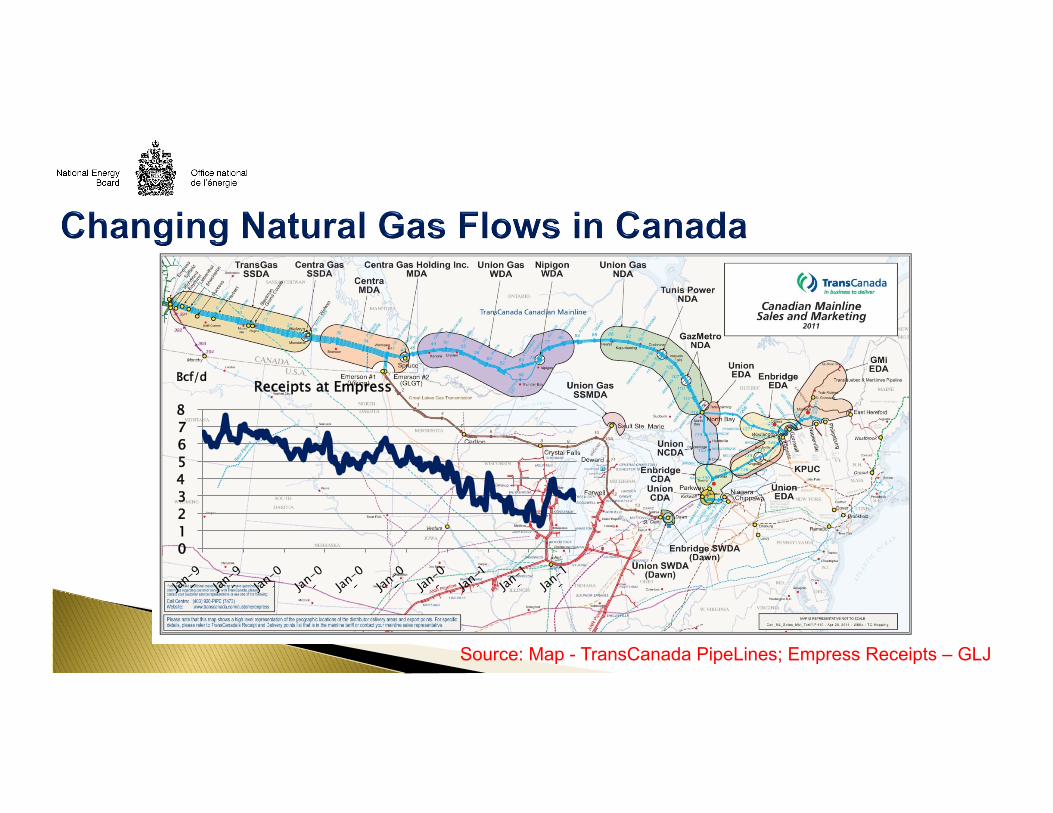
Source: Map - TransCanada PipeLines; Empress Receipts – GLJ
0 1 2 3 4 5 6 7 8
Bcf/d Receipts at Empress
0
1
2
3
4
5
0
10
20
30
40
50
60
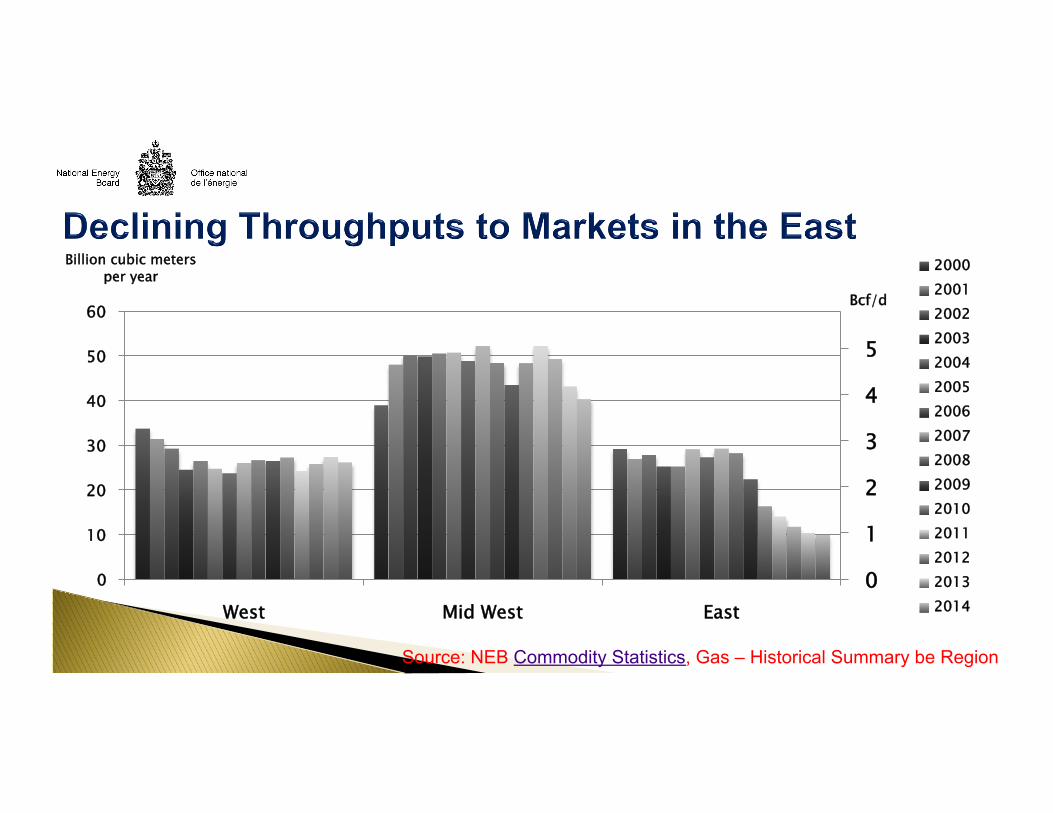
West Mid West East
Bcf/d
Billion cubic meters per year
2000 2001 2002 2003 2004 2005 2006 2007 2008 2009 2010 2011 2012 2013 2014
Source: NEB Commodity Statistics, Gas – Historical Summary be Region
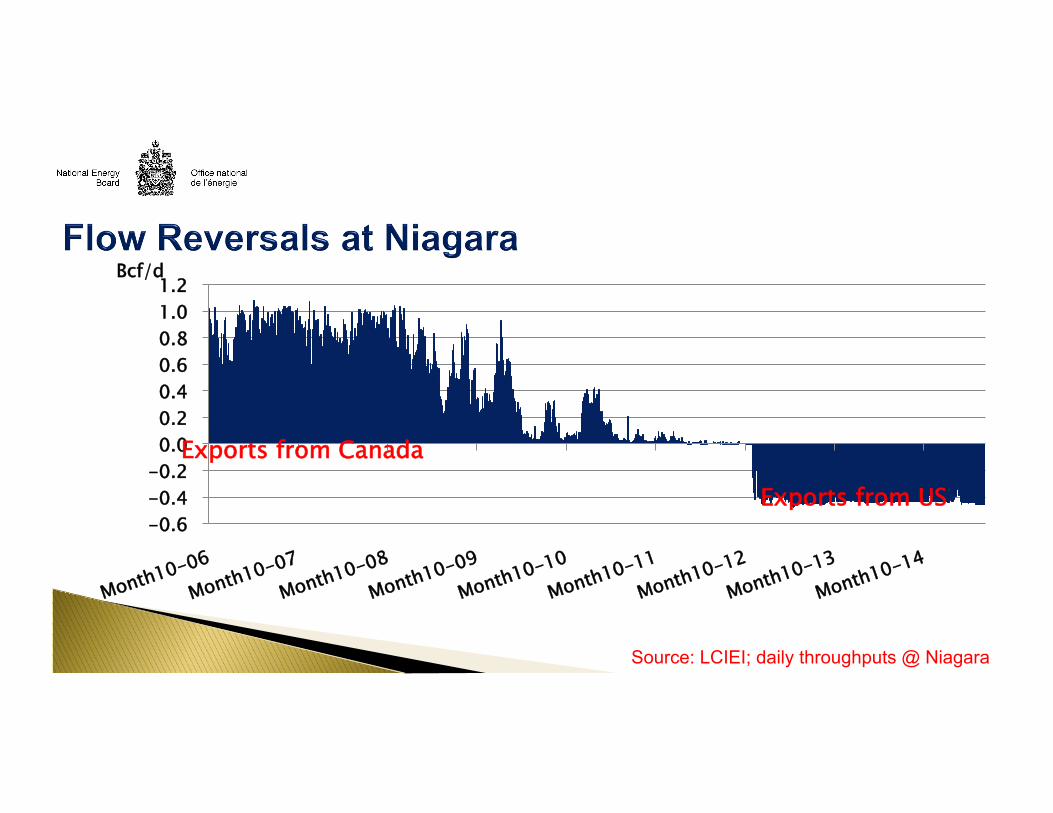
Source: LCIEI; daily throughputs @ Niagara
-0.6 -0.4 -0.2 0.0 0.2 0.4 0.6 0.8 1.0 1.2
Month10-06
Month10-07
Month10-08
Month10-09
Month10-10
Month10-11
Month10-12
Month10-13
Month10-14
Bcf/d
Exports from Canada
Exports from US
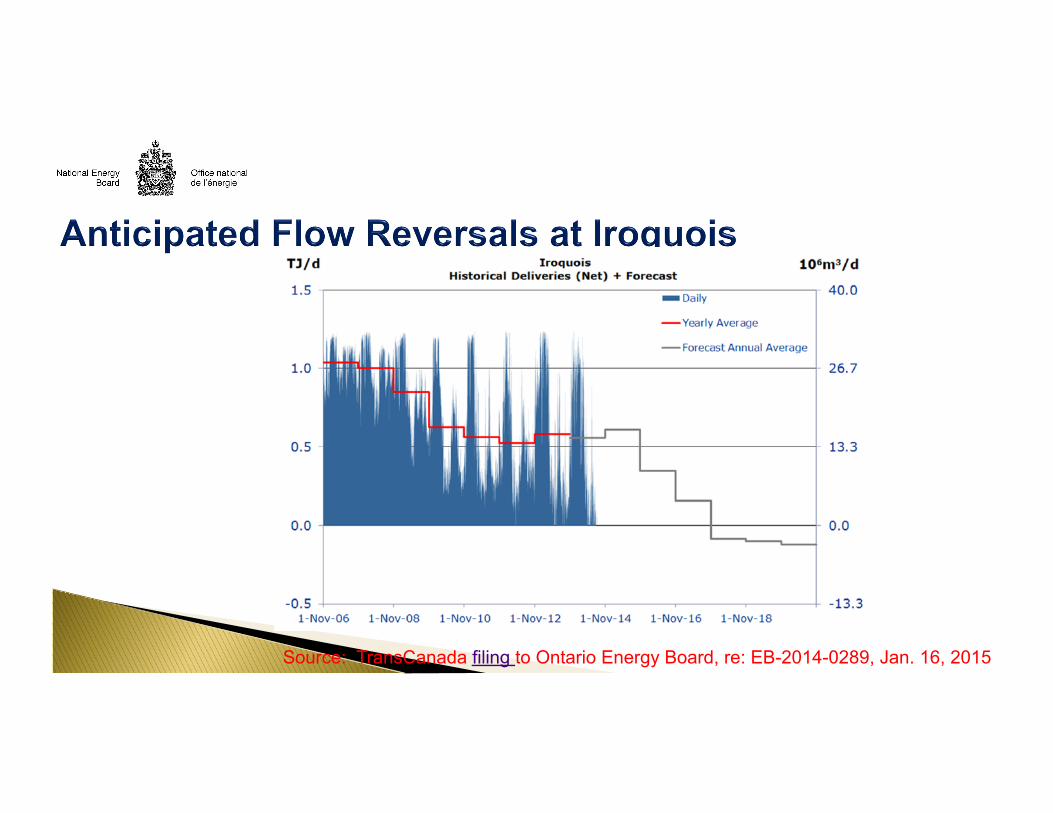
Source: TransCanada filing to Ontario Energy Board, re: EB-2014-0289, Jan. 16, 2015
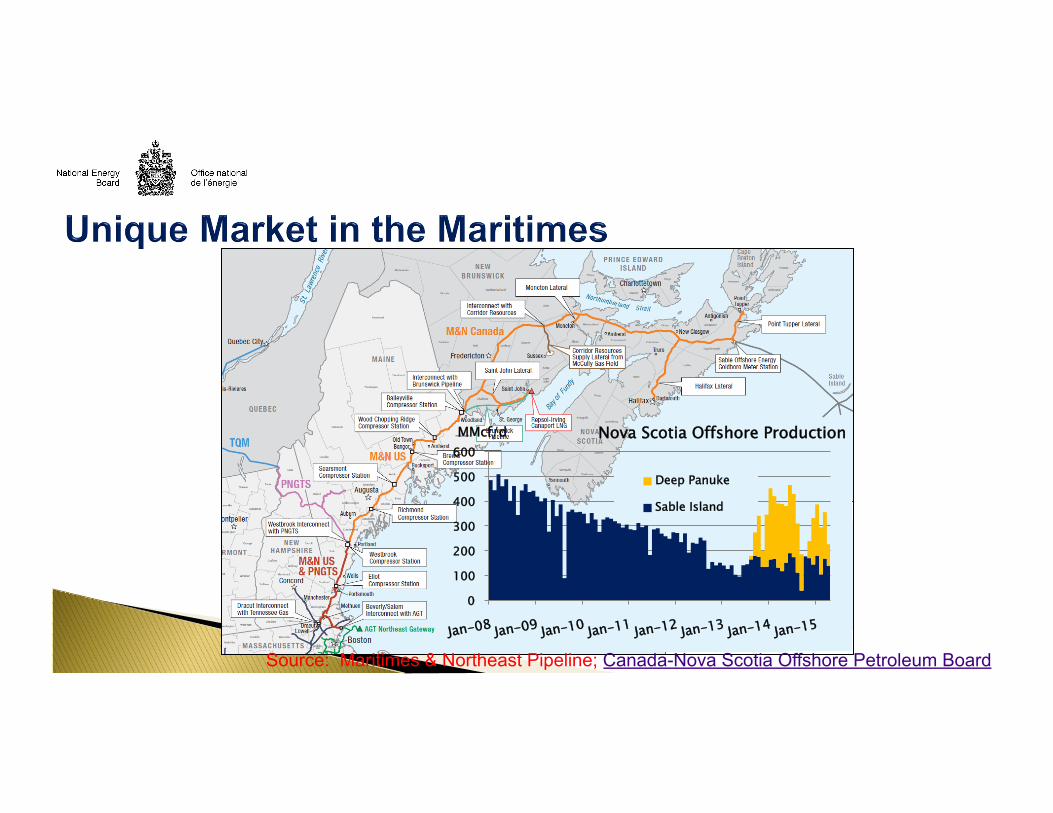
Source: Maritimes & Northeast Pipeline; Canada-Nova Scotia Offshore Petroleum Board
0
100
200
300
400
500
600
Jan-08 Jan-09 Jan-10 Jan-11 Jan-12 Jan-13 Jan-14 Jan-15
MMcf/d Nova Scotia Offshore Production
Deep Panuke
Sable Island
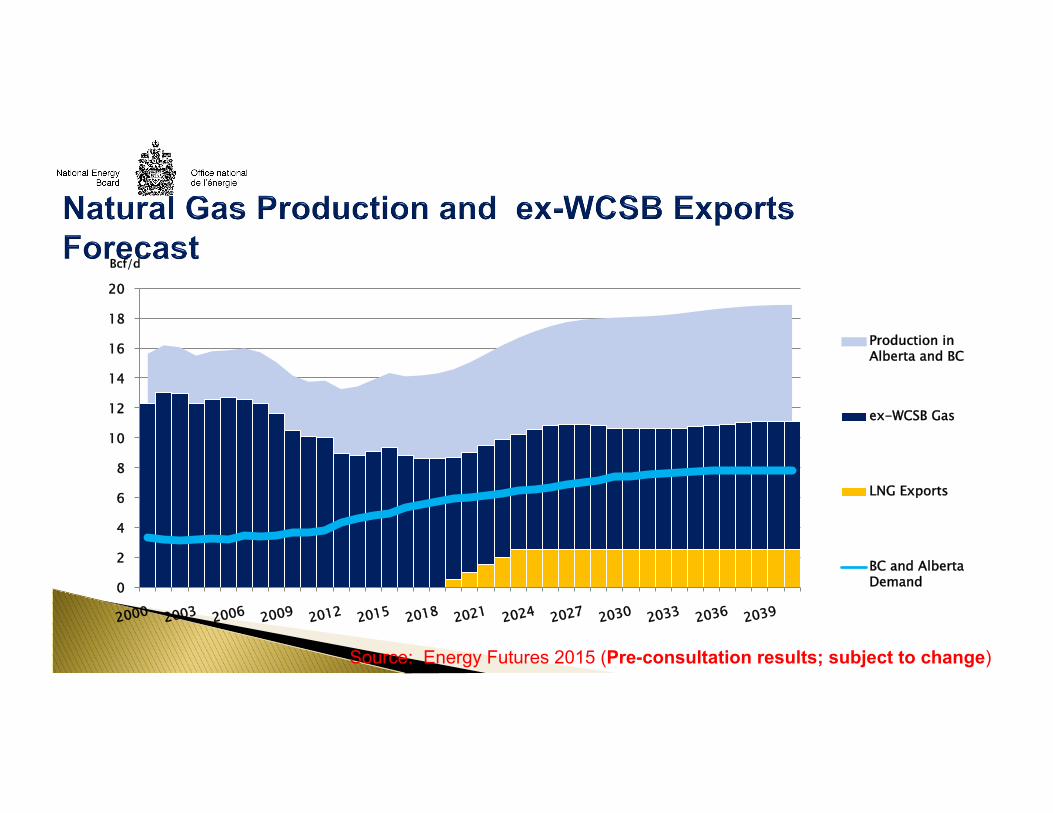
Source: Energy Futures 2015 (Pre-consultation results; subject to change)
0
2
4
6
8
10
12
14
16
18
20
2000 2003 2006 2009 2012 2015 2018 2021 2024 2027 2030 2033 2036 2039
Bcf/d
Production in Alberta and BC
ex-WCSB Gas
LNG Exports
BC and Alberta Demand
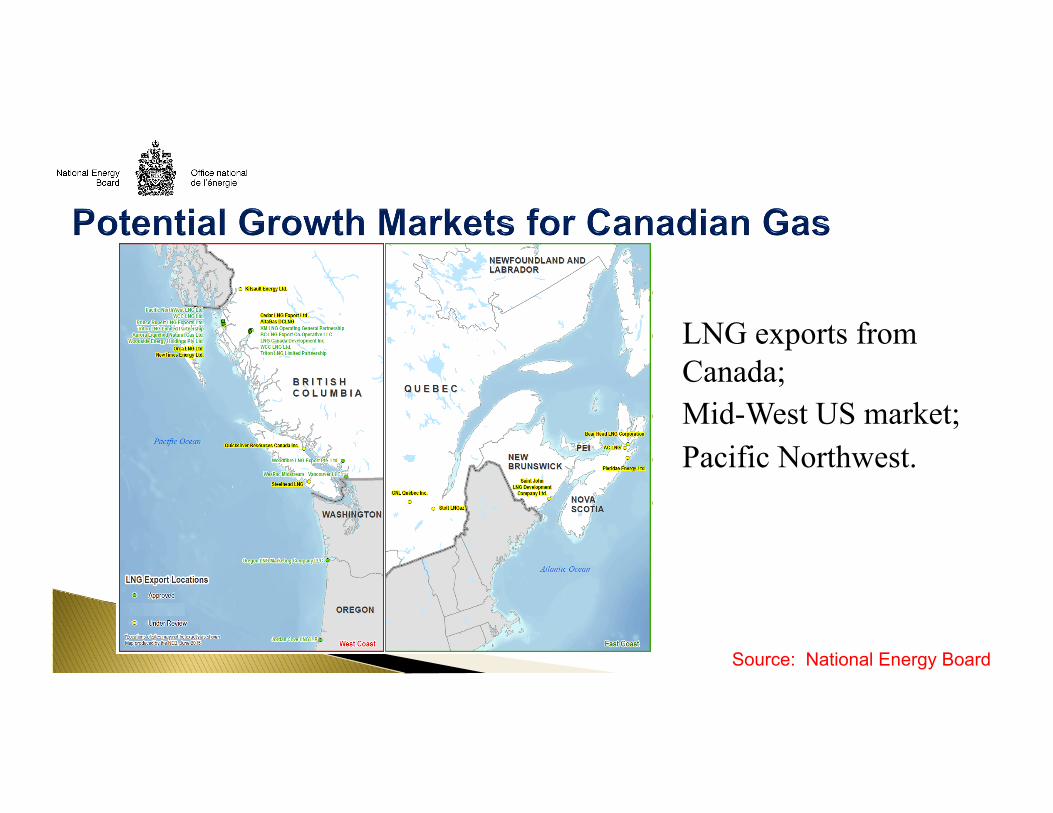
• • LNG exports from
Canada; • Mid-West US market; • Pacific Northwest. •
Source: National Energy Board
• Changing gas flows continue to characterize the Canadian natural gas market. • Less Canadian gas into the US Northeast market. • Traditional export points are evolving into import points (ex. Niagara, Chippawa,
Iroquois). • Maritimes to turn from net-exporters to net-importers of natural gas before the end of
the decade; pipeline de-bottlenecking plans in early phases of regulatory review (FERC).
• Canadian production expected to increase to ~19 Bcf/d by 2040. Forecast assumes 2.5 Bcf/d of LNG exports from Canada by 2023. 8 Bcf/d of natural gas available for ex-WCSB export.* *Preliminary results from Energy Futures 2015; to be released in November 2015.
• More Canadian gas will be exported to US Mid-West and US West markets.


![[Pipeline] Inspecting Pipeline Installation](https://img.pdfslide.net/doc/110x75/55cf8d045503462b1391543e/pipeline-inspecting-pipeline-installation.jpg)