Embed Size (px)
Citation preview
at SciVerse ScienceDirect
Ocean & Coastal Management 68 (2012) 58e68
Contents lists available
Ocean & Coastal Management
journal homepage: www.elsevier .com/locate/ocecoaman
Changing North Sea storm surge climate: An increasing hazard?
Ralf Weissea,*, Hans von Storcha, Hanz Dieter Niemeyerb, Heiko Knaackb
aHelmholtz-Zentrum Geesthacht, Centre for Materials and Coastal Research, Institute of Coastal Reserach, Max-Planck-Str. 1, 21502 Geesthacht, GermanybCoastal Research Station of the Lower Saxony Water Management, Coastal Defence and Nature Conservation Agency, Norderney/East Frisia, Germany
a r t i c l e i n f o
Article history:Available online 22 September 2011
* Corresponding author. Tel.: þ49 4152 87 2819; faE-mail address: [email protected] (R. Weisse).
0964-5691/$ e see front matter � 2011 Elsevier Ltd.doi:10.1016/j.ocecoaman.2011.09.005
a b s t r a c t
Extreme sea levels provide a substantial hazard for low lying coastal areas in the Southern North Sea.They are caused by a combination of different factors such as high astronomical tides, a large-scale rise ofthe sea surface caused by high wind speeds and low atmospheric pressure (usually referred to as stormsurges), or extreme wind-generated waves (sea states) caused by high wind speeds in atmospheric lowpressure systems; that is extra-tropical storms. Long-term changes in any of these factors maysubstantially alter the hazard associated with extreme sea levels. Moreover, any long-term change inmean sea level such as observed over the past 100 years or as associated with future anthropogenicclimate change will have an impact as it shifts the entire distribution of sea levels towards higher values;that is, it changes the baseline upon which storm induced sea levels have to be added. Moreover, inshallow waters non-linear interaction effects may occur. Here we review the present knowledge aboutlong-term changes in any of these factors. We show that storm activity in the area underwent consid-erable variations on time scales of decades and longer, but that no clear long-term trend could beidentified. Similar findings are obtained for long-term changes in the storm surge and wave climate.Mean sea level has increased in the Southern North Sea over the past centuries. Correspondingly anincrease in extreme sea levels is found. For the future most projections point towards a moderateincrease in storm activity in the area with corresponding changes in storm surge and wave climate. Thesechanges will add to the expected future increase in mean sea level, leading to an increased hazard fromextreme sea levels. The latter may have consequences for safety, especially in the low lying coastal areasin the Southern North Sea. Consequences for coastal protection and alternative strategies are discussed.
� 2011 Elsevier Ltd. All rights reserved.
1. Introduction
Extreme sea levels represent a substantial hazard for the lowlying coastal areas along the Southern North Sea coasts. They arecaused by a combination of various factors that extend over a widerange of spatial and time scales:
1. High astronomical tides may contribute to extreme sea levels.Tidal sea level variations are caused by the gravitational forcesexerted by the moon and the sun. These forces cause compli-cated spatially and time varying patterns in ocean sea level; butthe patterns are generally regular and predictable. In shallowwater the propagation of the tidal wave is significantly modi-fied by bathymetry. The latter may become important whenchanges in bathymetry such as caused by constructionworks orsimilar may locally modify the tidal signal and thus the riskassociated with extreme sea levels.
x: þ49 4152 87 4 2819.
All rights reserved.
2. Storm surges, also referred to as meteorological residuals, arethe response of the sea level to large-scale meteorologicalconditions. They are caused by storm wind fields pushing thewater towards or away from the coast and, to a smaller extent,by the action of the atmospheric pressure on the sea surface;that is, when atmospheric pressure at the sea surfaces rises, theheight of the sea surface is depressed and vice versa. This effectis known as the inverse barometric effect. Themagnitude of thestorm surge depends on a number of factors comprising thesize, movement, and intensity of the storm system, the near-shore local bathymetry (water depth) or the shape of thecoastline.
3. Extreme sea states refer towind-generated gravity waves at thesurface of the ocean. In the southern North Sea these waves aremostly generated locally in response to the local wind field.These waves may be superimposed with swell; that is, wavesgenerated by the wind some distance away. Swell propagatesfreely across the oceans along great circle paths and mayfurther add to the local wind sea; that is, waves that are stillgrowing and sustained by the local wind field. The height of
1 A reanalysis refers to the procedure of projecting the state of the atmospherefrom a finite set of imperfect, irregularly distributed observations onto a regulargrid using a frozen state-of-the-art numerical model and data assimilation system(Glickman, 2000). For a discussion see e.g. Weisse and von Storch (2009).
R. Weisse et al. / Ocean & Coastal Management 68 (2012) 58e68 59
extreme sea states depends on a number of factors such aswind speed, duration or fetch. In very shallow water waveheights become depth limited. Extreme sea states may add tothe coastal hazard caused by extreme sea levels by producingeffects known as wave run-up; that is, the maximum verticalextent of wave up-rush on a beach or structure and over-topping; that is, the flow of water over a dike or structurecaused by wave run-up.
4. Mean sea level refers to the average level of the sea surfacerelative to some local benchmark over a period long enoughsuch that effects caused by tides, storm surges, and gravitywaves are averaged out. Changes in mean sea level arise fromseveral factors changing either the shape of the ocean basins(e.g. vertical or tectonic land movements) or the volume ofwater within the oceans which may be caused by changes inocean density or mass. Changes in mean sea level may changethe hazard caused by extreme sea levels as these changes tendto shift the frequency distribution towards higher values.Under otherwise similar astronomical and meteorologicalconditions extreme sea levels may vary due to different base-lines or mean sea level values.
There is considerable interaction among the different factorscontributing to extreme sea levels in particular in shallow waters.For example, Horsburgh and Wilson (2007) analysed tide-gaugedata from five tide gauges equally spaced along the UK North Seacoast line and found that the peak meteorological residuals tend toavoid the times of nearest astronomical high water. Insteada tendency for surge maxima to occur most frequently on the risingtide is recognised (e.g., Doodson, 1929; Rossiter, 1961; Prandle andWolf, 1978). Horsburgh and Wilson (2007) provide a simplemathematical explanation in which a phase shift of the tidal signalin combination with a modulation in surge production and prop-agation due to water depth (known as tide-surge interaction)provides a good description of the observed conditions.
The interaction of mean sea level changes and the astronomicaltide was studied, for example, by Kauker (1999) and Plüß (2006).Both authors were interested in changes of the tidal signal inresponse to a rise in mean sea level. Kauker (1999) found that for anincrease in mean sea level of 1 m, co-tidal lines of the M2 (principallunar semidiurnal) tide show small shifts in the location ofamphidromic points resulting in an increase of tidal range of about1e4 cm for most of the southeastern North Sea. Using a spatiallyhigher resolved model and a larger range of mean sea level changesPlüß (2006) produced similar results but found that the effects maybe significantly enhanced near coasts and within estuaries. Themodelled changes are, however, considerably smaller than thosederived from observations, indicating either deficiencies in themodels or that other processes unknown so far considerablycontribute to the observed changes.
In the following we review present knowledge on changinghazards from extreme sea levels in the Southern North Sea. InSection 2 we describe past and potential future changes in NorthSea storm activity which represents the main driver for changes instorm surge hazard and wave climate. The latter are considered inSections 3 and 4. Mean sea level changes are reviewed in Section 5.The consequences of these changes on safety of coastal populationtogether with alternative strategies to provide safety and protec-tion are considered in Section 6. Finally, in Section 7 we concludewith a summary on challenges for future research.
2. North Sea storm activity
The North Sea is located in the mid-latitudes and under theinfluence of the prevailing atmospheric west wind belt; that is, the
dominant west-to-east motion of the air in mid-latitudes. Mid-latitude or extra-tropical cyclones are the dominant weatherphenomenon in this region. These are migratory atmosphericdisturbances, often associated with large pressure gradients andstrong wind speeds, developing at the interface between cold andwarm air in mid-latitudes and generally propagating eastwardcontrolled by the orientation of the flow within planetary-scalewaves. They tend to occur within and to propagate along region-ally confined areas, the so-called storm tracks. The North Sea isunder the influence of the North Atlantic storm track, one of thetwo major storm tracks in the Northern Hemisphere (e.g., Weisseand von Storch, 2009, Fig. 2.6).
There have been a number of extra-tropical cyclones (storms)causing severe damage and flooding along the North Sea coast line.Two of the more recent examples are the storms affecting thecoasts on 31 January and 1 February 1953 and on 16e17 February1962. While the storm in 1953 was associated with exceptionallyhigh wind speeds over the shallow continental shelf (Wolf andFlather, 2005) the 1962 storm mostly showed only moderatewind speeds (Koopmann, 1962). However, wind speeds wereincreasing over the Atlantic and moderate to strong northerlywinds covered a relatively large area from Iceland to NorthernGermany (Müller-Navarra et al., 2006). In both cases, the stormscaused extreme storm surges and were associated with a wide-spread failure of coastal protection (Gerritsen, 2005; Baxter, 2005;Sönnichsen and Moseberg, 2001) mostly due to poor conditions incoastal defence constructions.
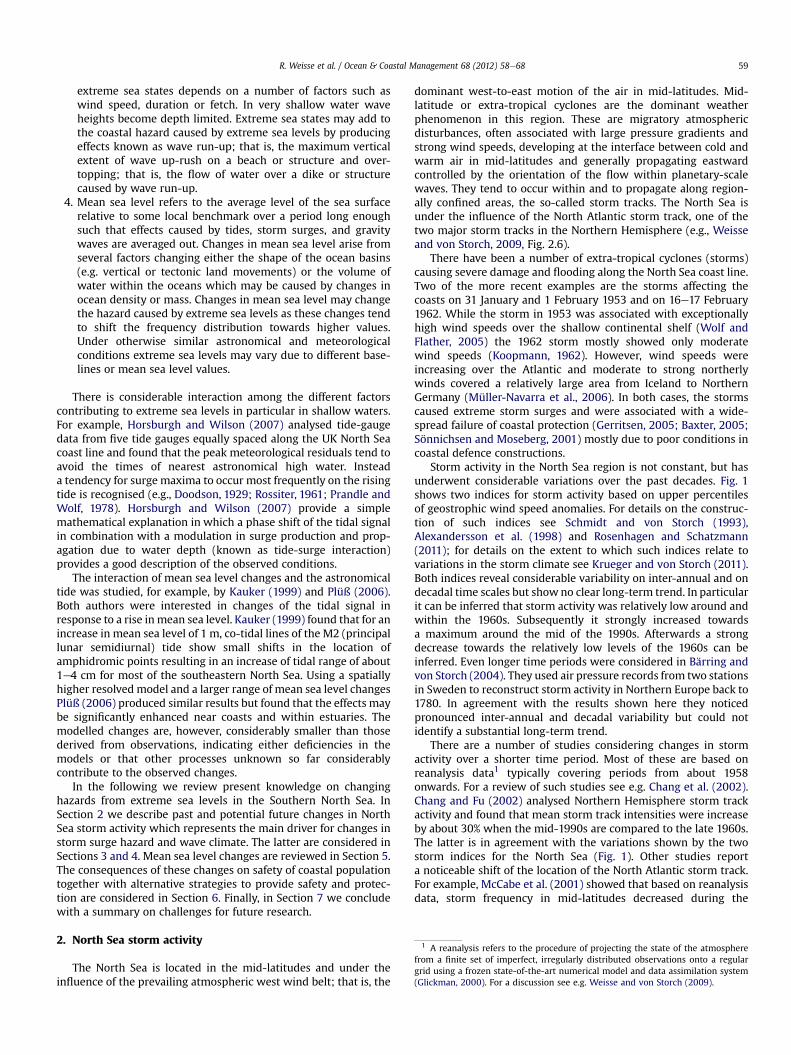
Storm activity in the North Sea region is not constant, but hasunderwent considerable variations over the past decades. Fig. 1shows two indices for storm activity based on upper percentilesof geostrophic wind speed anomalies. For details on the construc-tion of such indices see Schmidt and von Storch (1993),Alexandersson et al. (1998) and Rosenhagen and Schatzmann(2011); for details on the extent to which such indices relate tovariations in the storm climate see Krueger and von Storch (2011).Both indices reveal considerable variability on inter-annual and ondecadal time scales but show no clear long-term trend. In particularit can be inferred that storm activity was relatively low around andwithin the 1960s. Subsequently it strongly increased towardsa maximum around the mid of the 1990s. Afterwards a strongdecrease towards the relatively low levels of the 1960s can beinferred. Even longer time periods were considered in Bärring andvon Storch (2004). They used air pressure records from two stationsin Sweden to reconstruct storm activity in Northern Europe back to1780. In agreement with the results shown here they noticedpronounced inter-annual and decadal variability but could notidentify a substantial long-term trend.
There are a number of studies considering changes in stormactivity over a shorter time period. Most of these are based onreanalysis data1 typically covering periods from about 1958onwards. For a review of such studies see e.g. Chang et al. (2002).Chang and Fu (2002) analysed Northern Hemisphere storm trackactivity and found that mean storm track intensities were increaseby about 30% when the mid-1990s are compared to the late 1960s.The latter is in agreement with the variations shown by the twostorm indices for the North Sea (Fig. 1). Other studies reporta noticeable shift of the location of the North Atlantic storm track.For example, McCabe et al. (2001) showed that based on reanalysisdata, storm frequency in mid-latitudes decreased during the
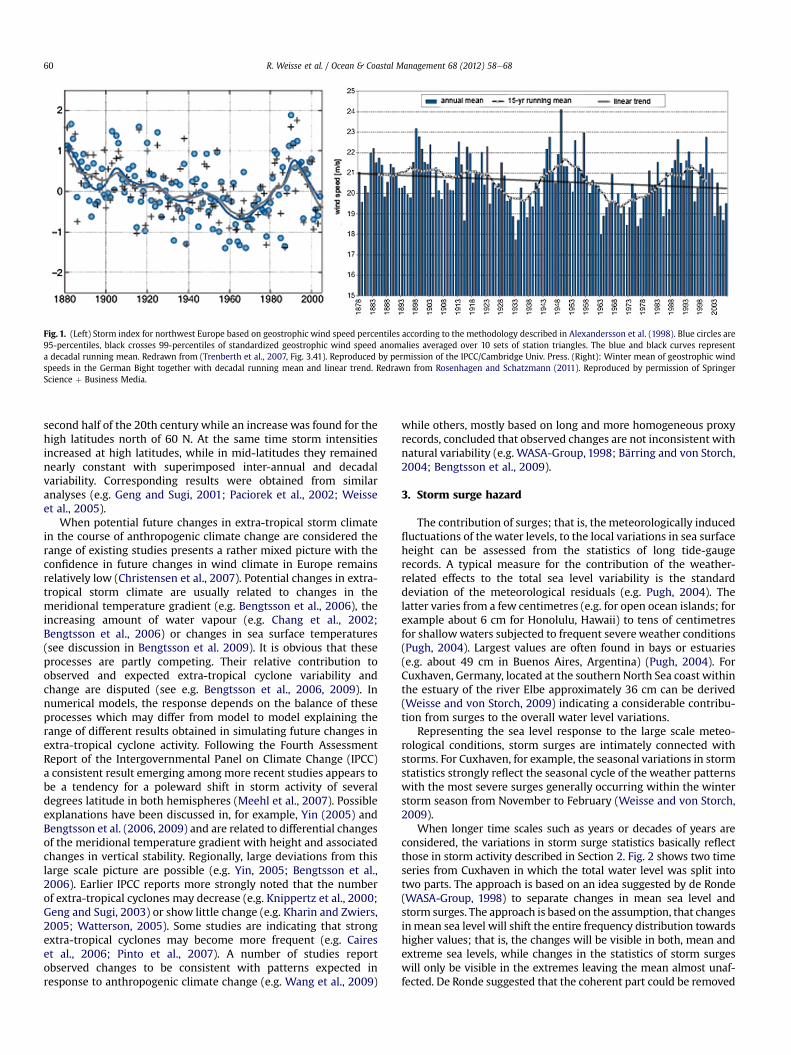
Fig. 1. (Left) Storm index for northwest Europe based on geostrophic wind speed percentiles according to the methodology described in Alexandersson et al. (1998). Blue circles are95-percentiles, black crosses 99-percentiles of standardized geostrophic wind speed anomalies averaged over 10 sets of station triangles. The blue and black curves representa decadal running mean. Redrawn from (Trenberth et al., 2007, Fig. 3.41). Reproduced by permission of the IPCC/Cambridge Univ. Press. (Right): Winter mean of geostrophic windspeeds in the German Bight together with decadal running mean and linear trend. Redrawn from Rosenhagen and Schatzmann (2011). Reproduced by permission of SpringerScience þ Business Media.
R. Weisse et al. / Ocean & Coastal Management 68 (2012) 58e6860
second half of the 20th century while an increase was found for thehigh latitudes north of 60 N. At the same time storm intensitiesincreased at high latitudes, while in mid-latitudes they remainednearly constant with superimposed inter-annual and decadalvariability. Corresponding results were obtained from similaranalyses (e.g. Geng and Sugi, 2001; Paciorek et al., 2002; Weisseet al., 2005).
When potential future changes in extra-tropical storm climatein the course of anthropogenic climate change are considered therange of existing studies presents a rather mixed picture with theconfidence in future changes in wind climate in Europe remainsrelatively low (Christensen et al., 2007). Potential changes in extra-tropical storm climate are usually related to changes in themeridional temperature gradient (e.g. Bengtsson et al., 2006), theincreasing amount of water vapour (e.g. Chang et al., 2002;Bengtsson et al., 2006) or changes in sea surface temperatures(see discussion in Bengtsson et al. 2009). It is obvious that theseprocesses are partly competing. Their relative contribution toobserved and expected extra-tropical cyclone variability andchange are disputed (see e.g. Bengtsson et al., 2006, 2009). Innumerical models, the response depends on the balance of theseprocesses which may differ from model to model explaining therange of different results obtained in simulating future changes inextra-tropical cyclone activity. Following the Fourth AssessmentReport of the Intergovernmental Panel on Climate Change (IPCC)a consistent result emerging among more recent studies appears tobe a tendency for a poleward shift in storm activity of severaldegrees latitude in both hemispheres (Meehl et al., 2007). Possibleexplanations have been discussed in, for example, Yin (2005) andBengtsson et al. (2006, 2009) and are related to differential changesof the meridional temperature gradient with height and associatedchanges in vertical stability. Regionally, large deviations from thislarge scale picture are possible (e.g. Yin, 2005; Bengtsson et al.,2006). Earlier IPCC reports more strongly noted that the numberof extra-tropical cyclones may decrease (e.g. Knippertz et al., 2000;Geng and Sugi, 2003) or show little change (e.g. Kharin and Zwiers,2005; Watterson, 2005). Some studies are indicating that strongextra-tropical cyclones may become more frequent (e.g. Caireset al., 2006; Pinto et al., 2007). A number of studies reportobserved changes to be consistent with patterns expected inresponse to anthropogenic climate change (e.g. Wang et al., 2009)
while others, mostly based on long and more homogeneous proxyrecords, concluded that observed changes are not inconsistent withnatural variability (e.g. WASA-Group, 1998; Bärring and von Storch,2004; Bengtsson et al., 2009).
3. Storm surge hazard
The contribution of surges; that is, the meteorologically inducedfluctuations of the water levels, to the local variations in sea surfaceheight can be assessed from the statistics of long tide-gaugerecords. A typical measure for the contribution of the weather-related effects to the total sea level variability is the standarddeviation of the meteorological residuals (e.g. Pugh, 2004). Thelatter varies from a few centimetres (e.g. for open ocean islands; forexample about 6 cm for Honolulu, Hawaii) to tens of centimetresfor shallowwaters subjected to frequent severe weather conditions(Pugh, 2004). Largest values are often found in bays or estuaries(e.g. about 49 cm in Buenos Aires, Argentina) (Pugh, 2004). ForCuxhaven, Germany, located at the southern North Sea coast withinthe estuary of the river Elbe approximately 36 cm can be derived(Weisse and von Storch, 2009) indicating a considerable contribu-tion from surges to the overall water level variations.
Representing the sea level response to the large scale meteo-rological conditions, storm surges are intimately connected withstorms. For Cuxhaven, for example, the seasonal variations in stormstatistics strongly reflect the seasonal cycle of the weather patternswith the most severe surges generally occurring within the winterstorm season from November to February (Weisse and von Storch,2009).
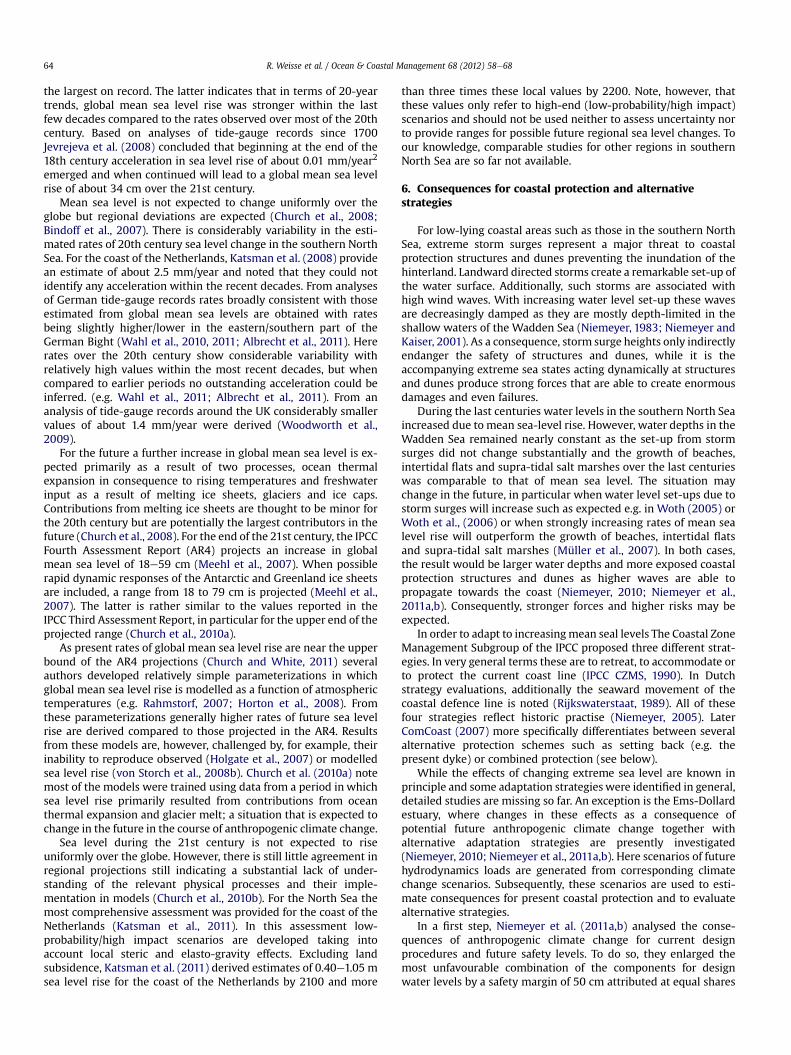
When longer time scales such as years or decades of years areconsidered, the variations in storm surge statistics basically reflectthose in storm activity described in Section 2. Fig. 2 shows two timeseries from Cuxhaven in which the total water level was split intotwo parts. The approach is based on an idea suggested by de Ronde(WASA-Group, 1998) to separate changes in mean sea level andstorm surges. The approach is based on the assumption, that changesinmean sea level will shift the entire frequency distribution towardshigher values; that is, the changes will be visible in both, mean andextreme sea levels, while changes in the statistics of storm surgeswill only be visible in the extremes leaving the mean almost unaf-fected. De Ronde suggested that the coherent part could be removed
Fig. 2. Annual mean high water levels (black) relative to German North Sea gauge level(NN þ 5.00 m) and linear trend (blue) in m at Cuxhaven, Germany and the corre-sponding difference in m between 99 percentile and annual mean high water levels(top, black) together with an 11-year running mean (top, blue). Redrawn from Weisseand von Storch (2009) with permission from Springer Sience þ Business Media.
R. Weisse et al. / Ocean & Coastal Management 68 (2012) 58e68 61
from the time series, e.g. by subtracting annual means from annualupper percentiles (e.g. 99 percentiles) and that the residual obtainedrepresents a proxy for storm-related water level fluctuations orstorm surges. Moreover, mean sea level variations could be analysedby studying the coherent part. The approach was tested and appliedto water levels in Cuxhaven by von Storch and Reichardt (1997) andFig. 2 shows an update of their analysis for the period 1843e2006derived fromWeisse and von Storch (2009).While the annualmeansshow a pronounced increase over the more than 150 years consid-ered the storm-related water level fluctuations appear remarkablyconstant with pronounced inter-annual and decadal variabilitysuperimposed. Closer inspection reveals that the decadal fluctua-tions are closely linked with that of storm activity in the southernNorth Sea (Fig. 1). In particular, the minima around the 1960s and atthe end of the record as well as the maximum around the mid 1990scan be clearly recognised.
Fig. 2 implies that extreme sea levels indeed increased over themore than 150 years analysed but also suggests that this isprimarily due to an increase in mean sea level while storm-relatedcontributions remained relatively constant. Similar analyses wereprovided by Woodworth and Blackman (2004) and Menéndez andWoodworth (2010) who considered a tide-gauge data set withquasi-global coverage. They concluded that subtracting extremeandmean sea levels leads to a reduction in the magnitude of trendsat most tide-gauges, suggesting that variations in mean andextreme sea levels have been largely coherent and that much of thechange in extremes is caused by corresponding changes in meanvalues.
A different approach to separate the meteorologically driven sealevel fluctuations from those caused by other factors is by usingdynamical tide-surgemodels driven by observed atmospheric windand pressure fields from the last decades of years. As changes due toother factors (such as mean sea level rise or modifications of
bathymetry) are excluded by design, such simulations allow for anestimate of long-term changes and variability in the storm surgeclimate. For the North Sea such simulations were performed, forexample, by Langenberg et al. (1999), Wakelin et al. (2003), orWeisse and Pluess (2006). While the analysis methods and theperiods considered differ, the general observation was that thesimulated changes and variations in storm surge climate closelyrelate to that derived from tide-gauges. In particular, an increase instorm surge heights along the southern and eastern coasts of theNorth Sea from the 1960s to the 1990s is reported about half ofwhich is attributed to variable extreme weather conditions whilethe other half appears to be associated with changes in large scale(mean) atmospheric conditions such as represented by the NorthAtlantic Oscillation (von Storch et al., 2008a).
Future changes in storm surge climate depend on correspondingchanges in atmospheric wind and pressure fields that are highlyuncertain (Christensen et al., 2007, see also Section 2). This uncer-tainty is reflected in corresponding analyses on possible futurechanges in North Sea storm surge climate with the majority ofexisting studies showing either no (e.g. Sterl et al., 2009) or onlylittle change (e.g. Langenberg et al., 1999; Kauker and Langenberg,2000; Woth, 2005; Woth et al., 2006; Debernhard et al., 2008)mostly in the southeastern part of the North Sea of up to a fewdecimetres (e.g. Woth, 2005). Not in all studies were all changesreported found to be detectable; that is, some were within therange of natural variability. A somewhat larger change is describedin Lowe and Gregory (2005) who found a 50e70 cm increase in 50-year storm surge return values towards the end of the century inresponse to anthropogenic climate change. These numbers deviateconsiderably from those provided by Lowe et al. (2001), Flather andWilliams (2000), or Sterl et al. (2009) who, using similar analysistechniques, reported smaller or no changes.
Uncertainty in future storm surge projections largely arises fromcorresponding uncertainties in wind climate change. The latter hascontributions from different sources: the use of different emissionscenarios (reflecting uncertainty about future socio-economicdevelopment) used to force the global climate models with; therange of different results produced by different models using thesame emission scenario (reflecting our imperfect knowledge aboutrelevant processes in the climate system); and the range of resultsobtained from one and the same model using one and the sameemission scenario (providing an assessment of internal (natural)climate variability). A particularly useful data set to assess potentialfuture changes in storm surge climate in relation to its naturalvariability was described by Sterl et al. (2009). In this case a globalclimate model was used to simulate the period 1950e2100seventeen times, using observed greenhouse gas concentration forthe past and conditions obtained from the A1B emission scenariofor the future. Weidemann et al., in press used wind and pressurefields from these simulations to drive a statistical downscalingmodel for storm surge heights along the German North Sea coast.Fig. 3 shows an example from their analysis for Husum, located atthe Schleswig-Holstein coast. It can be inferred that changes instorm surge height and frequency vary considerably towards theend of the century, although all realisations were obtained by usingwind fields from the same climate model and emission scenario.The range provided by the different realisations shows that naturalvariability is large and should be taken into account when climatechange signals from a limited set of realisations are analysed andinterpreted.
An important question is the extent to which there is aninteraction between potential changes in storm surge climate andmean sea level. The effects were studied by several authors bycomparing simulations in which a tide-surge model was runetwice under the same meteorological forcing but with different
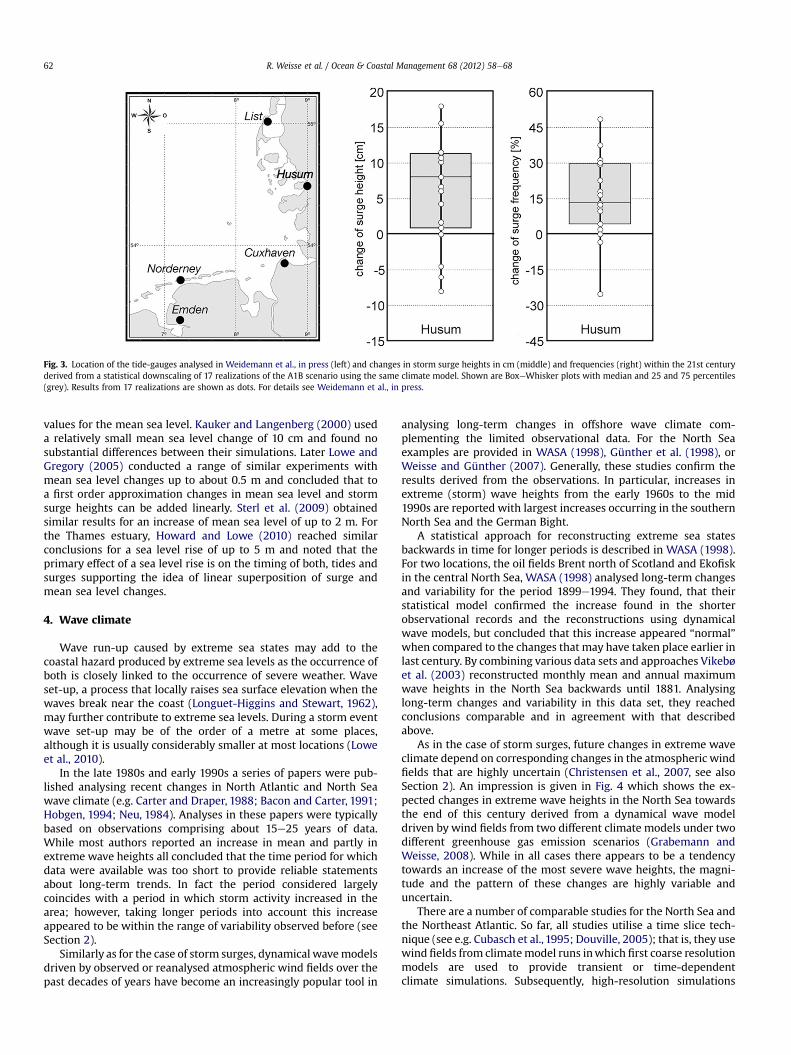
Fig. 3. Location of the tide-gauges analysed in Weidemann et al., in press (left) and changes in storm surge heights in cm (middle) and frequencies (right) within the 21st centuryderived from a statistical downscaling of 17 realizations of the A1B scenario using the same climate model. Shown are BoxeWhisker plots with median and 25 and 75 percentiles(grey). Results from 17 realizations are shown as dots. For details see Weidemann et al., in press.
R. Weisse et al. / Ocean & Coastal Management 68 (2012) 58e6862
values for the mean sea level. Kauker and Langenberg (2000) useda relatively small mean sea level change of 10 cm and found nosubstantial differences between their simulations. Later Lowe andGregory (2005) conducted a range of similar experiments withmean sea level changes up to about 0.5 m and concluded that toa first order approximation changes in mean sea level and stormsurge heights can be added linearly. Sterl et al. (2009) obtainedsimilar results for an increase of mean sea level of up to 2 m. Forthe Thames estuary, Howard and Lowe (2010) reached similarconclusions for a sea level rise of up to 5 m and noted that theprimary effect of a sea level rise is on the timing of both, tides andsurges supporting the idea of linear superposition of surge andmean sea level changes.
4. Wave climate
Wave run-up caused by extreme sea states may add to thecoastal hazard produced by extreme sea levels as the occurrence ofboth is closely linked to the occurrence of severe weather. Waveset-up, a process that locally raises sea surface elevation when thewaves break near the coast (Longuet-Higgins and Stewart, 1962),may further contribute to extreme sea levels. During a storm eventwave set-up may be of the order of a metre at some places,although it is usually considerably smaller at most locations (Loweet al., 2010).
In the late 1980s and early 1990s a series of papers were pub-lished analysing recent changes in North Atlantic and North Seawave climate (e.g. Carter and Draper, 1988; Bacon and Carter, 1991;Hobgen, 1994; Neu, 1984). Analyses in these papers were typicallybased on observations comprising about 15e25 years of data.While most authors reported an increase in mean and partly inextreme wave heights all concluded that the time period for whichdata were available was too short to provide reliable statementsabout long-term trends. In fact the period considered largelycoincides with a period in which storm activity increased in thearea; however, taking longer periods into account this increaseappeared to be within the range of variability observed before (seeSection 2).
Similarly as for the case of storm surges, dynamical wavemodelsdriven by observed or reanalysed atmospheric wind fields over thepast decades of years have become an increasingly popular tool in
analysing long-term changes in offshore wave climate com-plementing the limited observational data. For the North Seaexamples are provided in WASA (1998), Günther et al. (1998), orWeisse and Günther (2007). Generally, these studies confirm theresults derived from the observations. In particular, increases inextreme (storm) wave heights from the early 1960s to the mid1990s are reported with largest increases occurring in the southernNorth Sea and the German Bight.
A statistical approach for reconstructing extreme sea statesbackwards in time for longer periods is described in WASA (1998).For two locations, the oil fields Brent north of Scotland and Ekofiskin the central North Sea, WASA (1998) analysed long-term changesand variability for the period 1899e1994. They found, that theirstatistical model confirmed the increase found in the shorterobservational records and the reconstructions using dynamicalwave models, but concluded that this increase appeared “normal”when compared to the changes that may have taken place earlier inlast century. By combining various data sets and approaches Vikebøet al. (2003) reconstructed monthly mean and annual maximumwave heights in the North Sea backwards until 1881. Analysinglong-term changes and variability in this data set, they reachedconclusions comparable and in agreement with that describedabove.
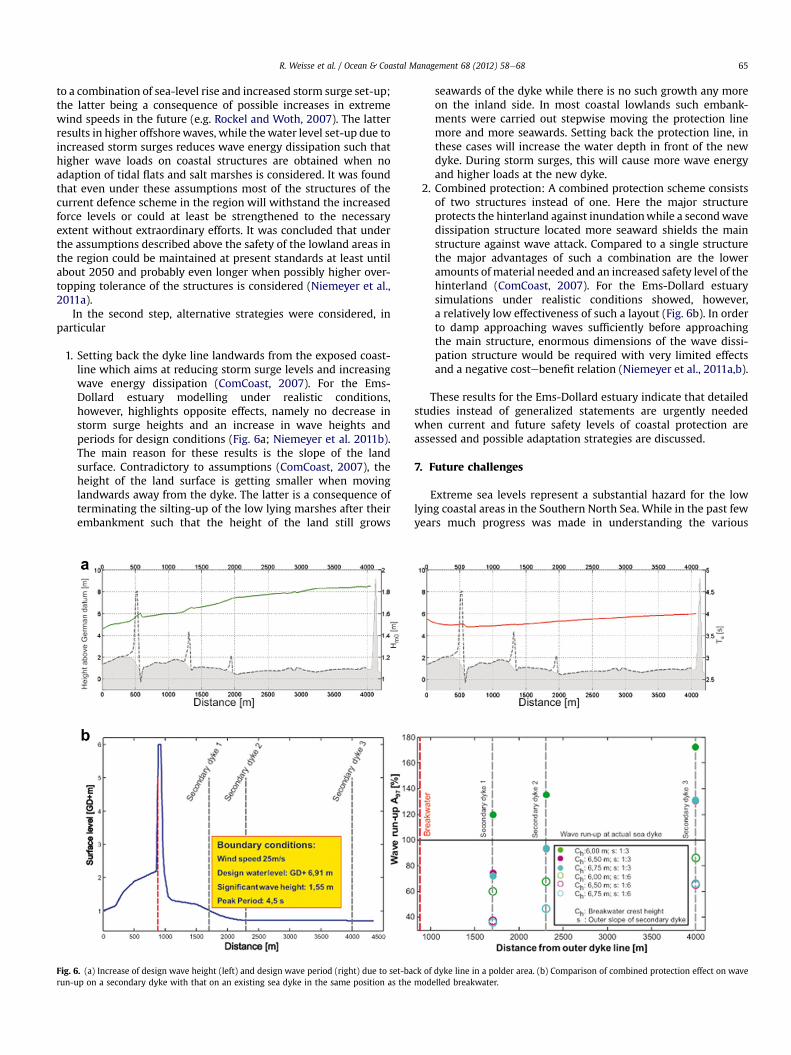
As in the case of storm surges, future changes in extreme waveclimate depend on corresponding changes in the atmospheric windfields that are highly uncertain (Christensen et al., 2007, see alsoSection 2). An impression is given in Fig. 4 which shows the ex-pected changes in extreme wave heights in the North Sea towardsthe end of this century derived from a dynamical wave modeldriven by wind fields from two different climate models under twodifferent greenhouse gas emission scenarios (Grabemann andWeisse, 2008). While in all cases there appears to be a tendencytowards an increase of the most severe wave heights, the magni-tude and the pattern of these changes are highly variable anduncertain.
There are a number of comparable studies for the North Sea andthe Northeast Atlantic. So far, all studies utilise a time slice tech-nique (see e.g. Cubasch et al., 1995; Douville, 2005); that is, they usewind fields from climatemodel runs inwhich first coarse resolutionmodels are used to provide transient or time-dependentclimate simulations. Subsequently, high-resolution simulations
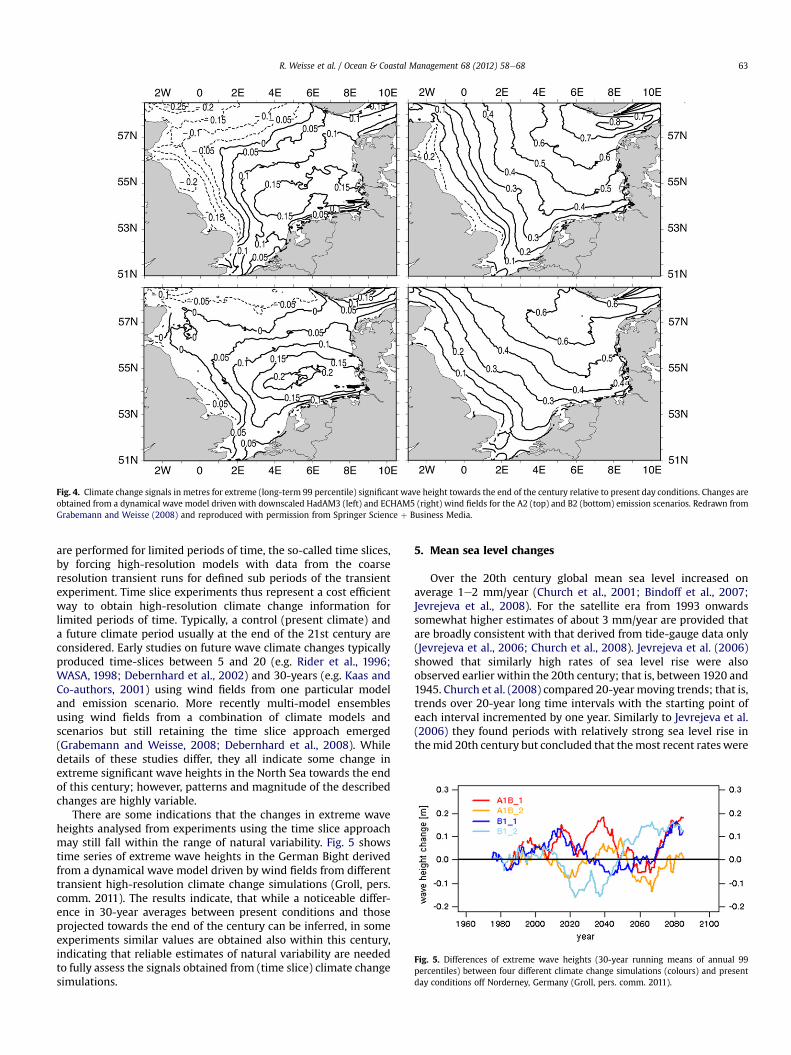
Fig. 5. Differences of extreme wave heights (30-year running means of annual 99percentiles) between four different climate change simulations (colours) and presentday conditions off Norderney, Germany (Groll, pers. comm. 2011).
Fig. 4. Climate change signals in metres for extreme (long-term 99 percentile) significant wave height towards the end of the century relative to present day conditions. Changes areobtained from a dynamical wave model driven with downscaled HadAM3 (left) and ECHAM5 (right) wind fields for the A2 (top) and B2 (bottom) emission scenarios. Redrawn fromGrabemann and Weisse (2008) and reproduced with permission from Springer Science þ Business Media.
R. Weisse et al. / Ocean & Coastal Management 68 (2012) 58e68 63
are performed for limited periods of time, the so-called time slices,by forcing high-resolution models with data from the coarseresolution transient runs for defined sub periods of the transientexperiment. Time slice experiments thus represent a cost efficientway to obtain high-resolution climate change information forlimited periods of time. Typically, a control (present climate) anda future climate period usually at the end of the 21st century areconsidered. Early studies on future wave climate changes typicallyproduced time-slices between 5 and 20 (e.g. Rider et al., 1996;WASA, 1998; Debernhard et al., 2002) and 30-years (e.g. Kaas andCo-authors, 2001) using wind fields from one particular modeland emission scenario. More recently multi-model ensemblesusing wind fields from a combination of climate models andscenarios but still retaining the time slice approach emerged(Grabemann and Weisse, 2008; Debernhard et al., 2008). Whiledetails of these studies differ, they all indicate some change inextreme significant wave heights in the North Sea towards the endof this century; however, patterns and magnitude of the describedchanges are highly variable.
There are some indications that the changes in extreme waveheights analysed from experiments using the time slice approachmay still fall within the range of natural variability. Fig. 5 showstime series of extreme wave heights in the German Bight derivedfrom a dynamical wave model driven by wind fields from differenttransient high-resolution climate change simulations (Groll, pers.comm. 2011). The results indicate, that while a noticeable differ-ence in 30-year averages between present conditions and thoseprojected towards the end of the century can be inferred, in someexperiments similar values are obtained also within this century,indicating that reliable estimates of natural variability are neededto fully assess the signals obtained from (time slice) climate changesimulations.
5. Mean sea level changes
Over the 20th century global mean sea level increased onaverage 1e2 mm/year (Church et al., 2001; Bindoff et al., 2007;Jevrejeva et al., 2008). For the satellite era from 1993 onwardssomewhat higher estimates of about 3 mm/year are provided thatare broadly consistent with that derived from tide-gauge data only(Jevrejeva et al., 2006; Church et al., 2008). Jevrejeva et al. (2006)showed that similarly high rates of sea level rise were alsoobserved earlier within the 20th century; that is, between 1920 and1945. Church et al. (2008) compared 20-yearmoving trends; that is,trends over 20-year long time intervals with the starting point ofeach interval incremented by one year. Similarly to Jevrejeva et al.(2006) they found periods with relatively strong sea level rise inthemid 20th century but concluded that themost recent rateswere
R. Weisse et al. / Ocean & Coastal Management 68 (2012) 58e6864
the largest on record. The latter indicates that in terms of 20-yeartrends, global mean sea level rise was stronger within the lastfew decades compared to the rates observed over most of the 20thcentury. Based on analyses of tide-gauge records since 1700Jevrejeva et al. (2008) concluded that beginning at the end of the18th century acceleration in sea level rise of about 0.01 mm/year2
emerged and when continued will lead to a global mean sea levelrise of about 34 cm over the 21st century.
Mean sea level is not expected to change uniformly over theglobe but regional deviations are expected (Church et al., 2008;Bindoff et al., 2007). There is considerably variability in the esti-mated rates of 20th century sea level change in the southern NorthSea. For the coast of the Netherlands, Katsman et al. (2008) providean estimate of about 2.5 mm/year and noted that they could notidentify any acceleration within the recent decades. From analysesof German tide-gauge records rates broadly consistent with thoseestimated from global mean sea levels are obtained with ratesbeing slightly higher/lower in the eastern/southern part of theGerman Bight (Wahl et al., 2010, 2011; Albrecht et al., 2011). Hererates over the 20th century show considerable variability withrelatively high values within the most recent decades, but whencompared to earlier periods no outstanding acceleration could beinferred. (e.g. Wahl et al., 2011; Albrecht et al., 2011). From ananalysis of tide-gauge records around the UK considerably smallervalues of about 1.4 mm/year were derived (Woodworth et al.,2009).
For the future a further increase in global mean sea level is ex-pected primarily as a result of two processes, ocean thermalexpansion in consequence to rising temperatures and freshwaterinput as a result of melting ice sheets, glaciers and ice caps.Contributions from melting ice sheets are thought to be minor forthe 20th century but are potentially the largest contributors in thefuture (Church et al., 2008). For the end of the 21st century, the IPCCFourth Assessment Report (AR4) projects an increase in globalmean sea level of 18e59 cm (Meehl et al., 2007). When possiblerapid dynamic responses of the Antarctic and Greenland ice sheetsare included, a range from 18 to 79 cm is projected (Meehl et al.,2007). The latter is rather similar to the values reported in theIPCC Third Assessment Report, in particular for the upper end of theprojected range (Church et al., 2010a).
As present rates of global mean sea level rise are near the upperbound of the AR4 projections (Church and White, 2011) severalauthors developed relatively simple parameterizations in whichglobal mean sea level rise is modelled as a function of atmospherictemperatures (e.g. Rahmstorf, 2007; Horton et al., 2008). Fromthese parameterizations generally higher rates of future sea levelrise are derived compared to those projected in the AR4. Resultsfrom these models are, however, challenged by, for example, theirinability to reproduce observed (Holgate et al., 2007) or modelledsea level rise (von Storch et al., 2008b). Church et al. (2010a) notemost of the models were trained using data from a period in whichsea level rise primarily resulted from contributions from oceanthermal expansion and glacier melt; a situation that is expected tochange in the future in the course of anthropogenic climate change.
Sea level during the 21st century is not expected to riseuniformly over the globe. However, there is still little agreement inregional projections still indicating a substantial lack of under-standing of the relevant physical processes and their imple-mentation in models (Church et al., 2010b). For the North Sea themost comprehensive assessment was provided for the coast of theNetherlands (Katsman et al., 2011). In this assessment low-probability/high impact scenarios are developed taking intoaccount local steric and elasto-gravity effects. Excluding landsubsidence, Katsman et al. (2011) derived estimates of 0.40e1.05 msea level rise for the coast of the Netherlands by 2100 and more
than three times these local values by 2200. Note, however, thatthese values only refer to high-end (low-probability/high impact)scenarios and should not be used neither to assess uncertainty norto provide ranges for possible future regional sea level changes. Toour knowledge, comparable studies for other regions in southernNorth Sea are so far not available.
6. Consequences for coastal protection and alternativestrategies
For low-lying coastal areas such as those in the southern NorthSea, extreme storm surges represent a major threat to coastalprotection structures and dunes preventing the inundation of thehinterland. Landward directed storms create a remarkable set-up ofthe water surface. Additionally, such storms are associated withhigh wind waves. With increasing water level set-up these wavesare decreasingly damped as they are mostly depth-limited in theshallow waters of the Wadden Sea (Niemeyer, 1983; Niemeyer andKaiser, 2001). As a consequence, storm surge heights only indirectlyendanger the safety of structures and dunes, while it is theaccompanying extreme sea states acting dynamically at structuresand dunes produce strong forces that are able to create enormousdamages and even failures.
During the last centuries water levels in the southern North Seaincreased due to mean sea-level rise. However, water depths in theWadden Sea remained nearly constant as the set-up from stormsurges did not change substantially and the growth of beaches,intertidal flats and supra-tidal salt marshes over the last centurieswas comparable to that of mean sea level. The situation maychange in the future, in particular when water level set-ups due tostorm surges will increase such as expected e.g. in Woth (2005) orWoth et al., (2006) or when strongly increasing rates of mean sealevel rise will outperform the growth of beaches, intertidal flatsand supra-tidal salt marshes (Müller et al., 2007). In both cases,the result would be larger water depths and more exposed coastalprotection structures and dunes as higher waves are able topropagate towards the coast (Niemeyer, 2010; Niemeyer et al.,2011a,b). Consequently, stronger forces and higher risks may beexpected.
In order to adapt to increasingmean seal levels The Coastal ZoneManagement Subgroup of the IPCC proposed three different strat-egies. In very general terms these are to retreat, to accommodate orto protect the current coast line (IPCC CZMS, 1990). In Dutchstrategy evaluations, additionally the seaward movement of thecoastal defence line is noted (Rijkswaterstaat, 1989). All of thesefour strategies reflect historic practise (Niemeyer, 2005). LaterComCoast (2007) more specifically differentiates between severalalternative protection schemes such as setting back (e.g. thepresent dyke) or combined protection (see below).
While the effects of changing extreme sea level are known inprinciple and some adaptation strategies were identified in general,detailed studies are missing so far. An exception is the Ems-Dollardestuary, where changes in these effects as a consequence ofpotential future anthropogenic climate change together withalternative adaptation strategies are presently investigated(Niemeyer, 2010; Niemeyer et al., 2011a,b). Here scenarios of futurehydrodynamics loads are generated from corresponding climatechange scenarios. Subsequently, these scenarios are used to esti-mate consequences for present coastal protection and to evaluatealternative strategies.
In a first step, Niemeyer et al. (2011a,b) analysed the conse-quences of anthropogenic climate change for current designprocedures and future safety levels. To do so, they enlarged themost unfavourable combination of the components for designwater levels by a safety margin of 50 cm attributed at equal shares
R. Weisse et al. / Ocean & Coastal Management 68 (2012) 58e68 65
to a combination of sea-level rise and increased storm surge set-up;the latter being a consequence of possible increases in extremewind speeds in the future (e.g. Rockel and Woth, 2007). The latterresults in higher offshorewaves, while thewater level set-up due toincreased storm surges reduces wave energy dissipation such thathigher wave loads on coastal structures are obtained when noadaption of tidal flats and salt marshes is considered. It was foundthat even under these assumptions most of the structures of thecurrent defence scheme in the region will withstand the increasedforce levels or could at least be strengthened to the necessaryextent without extraordinary efforts. It was concluded that underthe assumptions described above the safety of the lowland areas inthe region could be maintained at present standards at least untilabout 2050 and probably even longer when possibly higher over-topping tolerance of the structures is considered (Niemeyer et al.,2011a).
In the second step, alternative strategies were considered, inparticular
1. Setting back the dyke line landwards from the exposed coast-line which aims at reducing storm surge levels and increasingwave energy dissipation (ComCoast, 2007). For the Ems-Dollard estuary modelling under realistic conditions,however, highlights opposite effects, namely no decrease instorm surge heights and an increase in wave heights andperiods for design conditions (Fig. 6a; Niemeyer et al. 2011b).The main reason for these results is the slope of the landsurface. Contradictory to assumptions (ComCoast, 2007), theheight of the land surface is getting smaller when movinglandwards away from the dyke. The latter is a consequence ofterminating the silting-up of the low lying marshes after theirembankment such that the height of the land still grows
Fig. 6. (a) Increase of design wave height (left) and design wave period (right) due to set-barun-up on a secondary dyke with that on an existing sea dyke in the same position as the
seawards of the dyke while there is no such growth any moreon the inland side. In most coastal lowlands such embank-ments were carried out stepwise moving the protection linemore and more seawards. Setting back the protection line, inthese cases will increase the water depth in front of the newdyke. During storm surges, this will cause more wave energyand higher loads at the new dyke.
2. Combined protection: A combined protection scheme consistsof two structures instead of one. Here the major structureprotects the hinterland against inundationwhile a secondwavedissipation structure located more seaward shields the mainstructure against wave attack. Compared to a single structurethe major advantages of such a combination are the loweramounts of material needed and an increased safety level of thehinterland (ComCoast, 2007). For the Ems-Dollard estuarysimulations under realistic conditions showed, however,a relatively low effectiveness of such a layout (Fig. 6b). In orderto damp approaching waves sufficiently before approachingthe main structure, enormous dimensions of the wave dissi-pation structure would be required with very limited effectsand a negative costebenefit relation (Niemeyer et al., 2011a,b).
These results for the Ems-Dollard estuary indicate that detailedstudies instead of generalized statements are urgently neededwhen current and future safety levels of coastal protection areassessed and possible adaptation strategies are discussed.
7. Future challenges
Extreme sea levels represent a substantial hazard for the lowlying coastal areas in the Southern North Sea. While in the past fewyears much progress was made in understanding the various
ck of dyke line in a polder area. (b) Comparison of combined protection effect on wavemodelled breakwater.
R. Weisse et al. / Ocean & Coastal Management 68 (2012) 58e6866
factors contributing to extreme sea levels, their long-term varia-tions and potential future changes, there is still a substantial lack ofknowledge. Future challenges comprise
1. Improved understanding and assessment of past and potentialfuture regional changes in extreme sea levels. As it is thecombined effects of high astronomical tides, long-term changesin mean sea level and changes in the storm surge and waveclimate all components contributing to changes in extreme sealevels and possible interactions need to be considered andaccounted for. So far, mostly changes in mean sea level areemphasized, mostly because low-lying coastal areas appear tobe vulnerable to even small changes in mean sea level andbecause global mean sea level rise is considered to be one of themore certain consequences of anthropogenic climate change(Houghton et al. (2001). In particular, further research isneeded to provide comprehensive projections of regional meansea level change; to assess potential regional and local changesin tidal regimes and their interaction with changes in under-water topography, mean sea level, storm surges and extremewaves; and to assess potential changes in local wave climate, inparticular in combination with consequences for coastalprocesses such wave set-up and run-up. Moreover, whenpotential future developments are considered research isneeded to develop sampling strategies that, to account forcomputational constraints, with a limited number of ensem-bles and ensemble members provide more comprehensivecoverage of the sampling space so that improved and morescientifically based estimates of uncertainty ranges can beprovided. Coordinated activities such as suggested by Hemeret al. (2010) are needed to overcome the fragmented pictureand to provide designed ensemble approaches allowinga better assessment of the sources of uncertainty and theirranges. Combining dynamical modelling with statisticalapproaches may represent a way to further increase ensemblesizes allowing improved assessments of signal-to-noise ratiosand natural variability. The use of time-slice experimentsshould be reduced as interpretation of results may bemisleading in the face of long-term natural variability. Even-tually, regional detection and attribution studies are needed toassess to which extent observed changes are consistent withprojected ones, to make statements about time horizons atwhich projected changes should emerge from the backgroundvariability, and to monitor whether this indeed occurs. Thelatter provides a benchmark measuring our skill in under-standing the system and the observed changes.
2. Improved knowledge of the consequences of these changes. Sofar existing studies are mostly concerned with changes inextreme sea levels and the factors contributing to thesechanges. Research is needed to provide assessments of theconsequences for the coastal near-shore (shallow water) areas.This comprises transferring the knowledge about changingextreme sea levels, accompanying waves and their effects intoknowledge about consequences for coastal protection, offshoreoperations, or about near-shore processes such as erosion andsedimentation rates or wave set-up and run-up. Moreover,climatically induced effects need to be considered in relation tothat caused by other drivers such as changes in bathymetry orcoastline, e.g. in response to natural processes or water works.The relevance of such processes as well as of climaticallyinduced changes may vary from case to case.
3. Development of robust and flexible adaptation strategies.There is considerable uncertainty in the projections of futurechanges in extreme sea levels and the contributions from thevarious factors. Adaptation strategies need to cope with these
uncertainties. Instead of developing and testing a strategy fora particular (mostly high-end) scenario, chances and risks fora strategy need to be assessed for a wide range of scenarios andpossible developments. Adaptation strategies that cost-efficiently work under a broad range of possible scenarios(robust strategies) or which can be easily adopted to changingconditions in the course of time (flexible strategies) are mostpreferable. A comprehensive social dialogue communicatingchances and risks is needed in developing such strategies. Thelatter comprises more detailed and local evaluation of theconsequences of widely acknowledged generic approaches torespond to sea level rise such as planned retreat, accommo-dation, or protection (IPCC CZMS, 1990). For the Ems-Dollardestuary such a study has been performed (Niemeyer et al.,2011a,b), in this case indicating that present coastal protec-tion strategies will work even under changing climate condi-tions and that no general change in strategy is required for thecoming decades.
Acknowledgements
We thank Beate Gardeike for helping in preparing the graphics.Figs. 3 and 5 were kindly provided by Hendrik Weidemann andNikolaus Groll from the Helmholtz-Zentrum Geesthacht. Theevaluation of coastal protection strategies for the Ems-Dollardestuary was carried out within the KLIFF-Programme (http://www.kliff-niedersachsen.de) sponsored by the Lower SaxonMinistry of Science and Culture.
References
Albrecht, F., Wahl, T., Jensen, J., Weisse, R., 2011. Determining sea level change in theGerman Bight. Ocean Dyn. doi:10.1007/s10236-011-0462-z.
Alexandersson, H., Schmith, T., Iden, K., Tuomenvirta, H., 1998. Long-term variationsof the storm climate over NW Europe. Glob. Atmos. Oc. Syst. 6, 97e120.
Bacon, S., Carter, D., 1991. Wave climate changes in the North Atlantic and the NorthSea. Int. J. Climatol. 11, 545e558.
Bärring, L., von Storch, H., 2004. Scandinavian storminess since about 1800. Gephys.Res. Lett. 31, L20202. doi:10.1029/2004GL020441.
Baxter, P., 2005. The East Coast Great Flood, 31 Januarye1 February 1953: Asummary of the human disaster. Phil. Trans. R. Soc. A 363, 1293e1312.
Bengtsson, L., Hodges, K., Keenlyside, N., 2009. Will extra-tropical storms intensifyin a warmer climate? J. Clim. 22, 2276e2301. doi:10.1175/2008JCLI2678.1.
Bengtsson, L., Hodges, K., Roeckner, E., 2006. Storm tracks and climate change.J. Clim. 19, 3518e3543.
Bindoff, N., Willebrand, J., Artale, V., Cazenave, A., Gregory, J., Gulev, S., Hanawa, K.,Le Quéré, C., Levitus, S., Nojiri, Y., Shum, C., Talley, L., Unnikrishnan, A., 2007.Climate Change 2007: The Physical Science Basis. Contribution of WorkingGroup I to the Fourth Assessment Report of the Intergovernmental Panel onClimate Change. Cambridge University Press, Cambridge, United Kingdom andNew York, NY, USA. Ch. Observations: Oceanic Climate Change and Sea Level.
Caires, S., Swail, V., Wang, X., 2006. Projection and analysis of extreme waveclimate. J. Clim. 19, 5581e5605. doi:10.1175/JCLI3918.1.
Carter, D., Draper, L., 1988. has the north-east Atlantic become rougher? Nature 332,494.
Chang, E., Fu, Y., 2002. Interdecadal variations in Northern Hemisphere winterstorm track intensity. J. Clim. 15, 642e658.
Chang, E., Lee, S., Swanson, K., 2002. Strom track dynamics. J. Clim. 15, 2163e2182.Christensen, J., Hewitson, B., Busuioc, A., Chen, A., Gao, X., Held, I., Jones, R., Kolli, R.,
Kwon, W.-T., Laprise, R., Rueda, V.M., Mearns, L., Menéndez, C., Räisänen, J.,Rinke, A., Sarr, A., Whetton, P., 2007. Regional climate projections. In:Solomon, S., Qin, D., Manning, M., Chen, Z., Marquis, M., Averyt, K., Tignor, M.,Miller, H. (Eds.), Climate Change 2007: The Physical Science Basis. Contributionof Working Group I to the Fourth Assessment Report of the IntergovernmentalPanel on Climate Change. Cambridge University Press, Cambridge, UnitedKingdom and New York, NY, USA.
Church, J., Aarup, T., Woodworth, P., Wilson, W., Nicholls, R., Rayner, R., Lambeck, K.,Mitchum, G., Steffen, K., Cazenave, A., Blewitt, G., Mitrovica, J., Lowe, J., 2010a.Sea-level rise and variability: synthesis and outlook for the future. In: Church, J.,Woodworth, P., Aarup, T., Wilson, S. (Eds.), Understanding Sea-level Rise andVariabiliry. John Wiley & Sons, ISBN 978-1444334517.
Church, J., Gregory, J., Huybrechts, P., Kuhn, M., Lambeck, K., Nhuan, M., Qin, D.,Woodworth, P., 2001. Changes in sea level. In: Houghton, J., Ding, Y., Griggs, D.,Noguer, M., van der Linden, P., Dai, X., Maskell, K., Johnson, C. (Eds.), Climate
R. Weisse et al. / Ocean & Coastal Management 68 (2012) 58e68 67
Change 2001: Working Group I: The scientific basis. Cambridge UniversityPress, Cambridge, United Kingdom and New York, NY, USA.
Church, J., Roemmich, D., Domingues, C., Willis, J., White, N., Gilson, J., Stammer, D.,Köhl, A., Chambers, D., Landerer, F., Marotzke, J., Gregory, J., Suzuki, T.,Cazenave, A., Taron, P.L., 2010b. Ocean temperature and salinity contributions toglobal and regional sea-level change. In: Church, J., Woodworth, P., Aarup, T.,Wilson, S. (Eds.), Understanding Sea-level Rise and Variabiliry. John Wiley &Sons, ISBN 978-1444334517.
Church, J., White, N., 2011. Sea-level rise from the late 19th to the early 21st century.Surv. Geophys.. doi:10.1007/s10712e011e9119e1.
Church, J., White, N., Aarup, T., Wilson, W., Woodworth, P., Domingues, C., Hunter, J.,Lambeck, K., 2008. Understanding global sea levels: past, present and future.Sustain. Sci. 3, 9e22. doi:10.1007/s11625e008e0042e4.
ComCoast, 2007. The Future of Flood Risk Management. http://www.comcoast.org.Cubasch, U., Waszkewitz, J., Hegerl, G., Perlwitz, J., 1995. Regional climate changes as
simulated in time-slice experiments. Clim. Change 31, 273e304.Debernhard, J., Roed, L., 2008. Future wind, wave and storm surge climate in the
Northern Seas: a revist. Tellus A 60, 427e438. doi:10.1111/j.1600e0870.2008.00312.x.
Debernhard, J., Sætra, Ø, Roed, L., 2002. Future wind, wave and storm surge climatein the Northern Seas. Clim. Res. 23, 39e49.
Doodson, A., 1929. Report on thames floods. Geophys. Memoirs 47, 1e26.Douville, H., 2005. Limitations of time-slice experiments for predicting climate
change over South Asia. Clim. Dyn. 24, 373e391.Flather, R., Williams, J., 2000. Climate change effects on storm surges: methodol-
ogies and results. ECLAT-2 Workshop Report, No 3. In: Beersma, J., Agnew, M.,Viner, D., Hulme, M. (Eds.), Climate Scenarios for Water-related and CoastalImpact, pp. 66e78.
Geng, Q., Sugi, M., 2001. Variability of the North Atlantic cyclone activity in winteranalyzed from NCEP-NCAR reanalysis data. J. Clim. 14, 3863e3873.
Geng, Q., Sugi, M., 2003. Possible change of extratropical cyclone activity due toenhanced greenhouse gases and sulfate aerosols-study with a high-resolutionAGCM. J. Clim. 16, 2262e2274.
Gerritsen, H., 2005. What happened in 1953? The big flood in the Netherlands inretrospect. Phil. Trans. R. Soc. A 363, 1271e1291.
Glickman, T. (Ed.), 2000. Glossary of Meteorology, second ed. American Meteoro-logical Society, Boston, Massachusetts, U.S.A.
Grabemann, I., Weisse, R., 2008. Climate change impact on extreme wave condi-tions in the North Sea: an ensemble study. Ocean Dyn. 58, 199e212.doi:10.1007/s10236e008e0141ex.
Günther, H., Rosenthal, W., Stawarz, M., Carretero, J., Gomez, M., Lozano, I.,Serrano, O., Reistad, M., 1998. The wave climate of the Northeast Atlantic overthe period 1955-1994: the WASA wave hindcast. Glob. Atmos. Oc. Syst. 6,121e164.
Hemer, M., Wang, X., Church, J., Swail, V., 2010. Modeling proposal: coordinatingglobal ocean wave climate projections. Bull. Am. Met. Soc. 91, 451e454.doi:10.1175/2009BAMS2951.1.
Hobgen, N., 1994. Increases in wave heights over the North Atlantic: a review of theevidence and some implications for the naval architect. Trans. Roy. Inst. NavalArch. W5, 93e101.
Holgate, S., Jevrejeva, S., Woodworth, P., Brewer, S., 2007. Comment on “A semi-empirical approach to projecting future sea level rise”. Science 317, 1866,.doi:10.1126/science.1140942.
Horsburgh, K., Wilson, C., 2007. Tide-surge interaction and its role in the distri-bution of surge residuals in the North Sea. J. Geophys. Res. 112, C08003.doi:10.1029/2006JC004033.
Horton, R., Hereijer, C., Rosenzweig, C., Lu, J., Gornitz, V., Ruane, A., 2008. Sea levelrise projections for current generation CGCMs based on the semi-empiricalmethod. Geophys. Res. Lett. 35, L02725.
Houghton, J., Ding, Y., Griggs, D., Noguer, M., van der Linden, P.J., Dai, X., Maskell, K.,Johnson, C., 2001. Climate Change 2001: The Scientific Basis. Contribution ofWorking Group I to the Third Assessment Report of the IntergovernmentalPanel on Climate Change. Cambridge University Press, United Kingdom andNew York.
Howard, T., Lowe, J., 2010. Interpreting century-scale changes in southern North Seastorm surge climate derived from coupled model simulations. J. Clim. 23,6234e6247. doi:10.1175/2010JCLI3520.1.
Ipcc Czms, 1990. Strategies for adaptation to sea level rise. Tech. rep., Report of theCoastal Zone Management Subgroup, Response Strategies Working Group ofthe Intergovernmental Panel on Climate Change. Ministry of Transport, PublicWorks and Water Management, The Hague.
Jevrejeva, S., Grinsted, A., Moore, C., Holgate, S., 2006. Nonlinear trends and multi-year cycle in sea level records. J. Geophys. Res. 111 2005JC003229.
Jevrejeva, S., Moore, J., Grinsted, A., Woodworth, P., 2008. Recent global sea levelacceleration started over 200 years ago? Geohys. Res. Lett. 35, L08715.doi:10.1029/2008GL033611.
Kaas, E., Co-authors, 2001. STOWASUS 2100-Regional Storm, Wave and SurgeScenarios for the 2100 century. Final Report ENV4-CT97-04989. Available from.Danish Meteorological Institute.
Katsman, C., Hazeleger, W., Drijfhout, S., van Oldenborgh, G., Burgers, G., 2008.Climate scenarios of sea level rise for the northeast atlantic ocean: a studyincluding the effects of ocean dynamics and gravity changes induced by icemelt. Clim. Change 91, 351e374. doi:10.1007/s10584e008e9442e9.
Katsman, C., Sterl, A., Beersma, J.J., van den Brink, H.W., Church, J.A., Hazeleger, W.,Kopp, R., Kroon, D., Kwadijk, J., Lammersen, R., Lowe, J., Oppenheimer, M.,
Plag, H.-P., Ridley, J., von Storch, H., Vaughan, D., Vellinga, P., Vermeersen, L., vande Wal, R., Weisse, R., 2011. Exploring high-end scenarios for local sea level riseto develop flood protection strategies for a low-lying delta. Clim. Change.doi:10.1007/s10584e011e0037e5.
Kauker, F., 1999. Regionalization of climate model results for the North Sea. Ph.D.thesis, Univ. of Hamburg, Hamburg, Germany, [Available as GKKS Rep. 99/E/6from GKSS-Forschungszentrum, Geesthacht, Germany].
Kauker, K., Langenberg, H., 2000. Two models for the climate change relateddevelopment of sea levels in the North Sea e a comparison. Clim. Res. 15,61e67.
Kharin, V., Zwiers, F., 2005. Estimating extremes in transient climate changesimulations. J. Clim. 18, 1156e1172.
Knippertz, P., Ulbrich, U., Speth, P., 2000. Changing cyclones and surface windspeeds over the North Atlantic and Europe in a transient GHG experiment. Clim.Res. 15, 109e122.
Koopmann, G., 1962. Die Sturmflut vom 16./17. Februar 1962 aus ozeanographischerSicht. Die Küste 10, 55e68.
Krueger, O., von Storch, H., 2011. Evaluation of an air pressure based proxy for stormactivity. J. Clim.. doi:10.1175/2011JCLI3913.1.
Langenberg, H., Pfizenmayer, A., von Storch, H., Sündermann, J., 1999. Storm-relatedsea level variations along the North Sea coast: natural variability and anthro-pogenic change. Cont. Shelf. Res. 19, 821e842.
Longuet-Higgins, M., Stewart, R., 1962. Radiation stress and mass transport ingravity waves, with application to ‘surf beats’. J. Fluid Mech. 13, 481e503.doi:10.1017/S0022112062000877.
Lowe, J., Gregory, J., 2005. The effects of climate change on storm surges around theUnited Kingdom. Phil. Trans. R. Soc. A 363, 1313e1328. doi:10.1098/rsta.2005.1570.
Lowe, J., Gregory, J., Flather, R., 2001. Changes in the occurrence of storm surgesaround the United Kingdom under a future climate scenario using a dynamicstorm surge model driven by the Hadley Centre climate models. Clim. Dyn. 18,179e188.
Lowe, J., Woodworth, P., Knutson, T., McDonald, R., McInnes, K., Woth, K., vonStorch, H., Wolf, J., Swail, V., Bernier, N., Gulev, S., Horsburgh, K.,Unnikrishnan, A., Hunter, J.R., Weisse, R., 2010. Past and future changes inextreme sea levels and waves. In: Church, J., Woodworth, P.L., Aarup, T.,Wilson, S. (Eds.), Understanding Sea-level Rise and Variability. John Wiley &Sons, ISBN 978-1444334517, pp. 326e376.
McCabe, G., Clark, M., Serreze, M., 2001. Trends in Northern Hemisphere surfacecyclone frequency and intensity. J. Clim. 14 (12), 2763e2768.
Meehl, G., Stocker, T., Collins, W., friedlingstein, P., Gaye, A., Gregory, J., Kitoh, A.,Knutti, R., Murphy, J., Noda, A., Raper, S., Watterson, I., Weaver, A., Zhao, Z., 2007.Global climate projections. In: Solomon, S., Qin, D., Manning, M., Chen, Z.,Marquis, M., Averyt, K., Tignor, M., Miller, H. (Eds.), Climate Change 2007: ThePhysical Science Basis. Contribution of Working Group I to the Fourth Assess-ment Report of the Intergovernmental Panel on Climate Change. CambridgeUniversity Press, Cambridge, United Kingdom and New York, NY, USA.
Menéndez, M., Woodworth, P., 2010. Changes in extreme high water levels based ona quasi-global tide-gauge data set. J. Geophys. Res. 115 (C10011), 15.doi:10.1029/2009JC005997.
Müller, J., Zitman, T., Stive, M., Niemeyer, H., 2007. Long-term morphologicalevolution of the tidal inlet Norderneyer Seegat. In: Smith, J.M. (Ed.), Proc. 30thInt. Conf. Coast. Eng. San Diego, September 1e8, 2006. New World Scientific,New Jersey 4035(11).
Müller-Navarra, S., Bork, I., Jensen, J., Koziar, C., Mudersbach, C., Müller, A.,Rudolph, E., 2006. Modellstudien zur Sturmflut und zum Hamburg Orkan 1962.Hansa 43, 72e88.
Neu, H., 1984. Interannual variations and longer-term changes in the sea state of theNorth Atlantic. J. Geophys. Res. 89, 6397e6402.
Niemeyer, H., 1983. über den Seegang an einer inselgeschützten wattküste. In: onthe wave climate at an island-sheltered coast. BMFT-Forschungsbericht MF.0203.
Niemeyer, H., 2005. Coastal protection of lowlands: are alternative strategiespurposeful for changing climate?. In: Proc. 14th Biennial Coastal Zone Confer-ence New Orleans/La.July 17e21, 2005.
Niemeyer, H., 2010. Coastal protection of lowlands: are alternative strategiesa match to effects of climate change?. In: Proc. 17th IAHR-APD-ConferenceAuckland/New Zealand.
Niemeyer, H., Kaiser, R., 2001. Design wave evaluation for coastal protectionstructures in the Wadden Sea. In: Edge, B., Hemsley, J. (Eds.), Ocean WaveMeasurement and Analysis, vol. 2. Am. Soc. Civ. Engs., Reston/Va., USA.
Niemeyer, H., Kaiser, R., Berkenbrink, C., 2011a. Increased overtopping security ofdykes: a potential for compensating future impacts of climate change. In:Smith, J.M. (Ed.), Proc. 32nd Int. Conf. Coast. Eng. Shanghai/China, June 30eJuly5, 2010. New World Scientific, New Jersey.
Niemeyer, H., Kaiser, R., Knaack, H., Dissanayake, P., Miani, M., Elsebach, J.,Berkenbrink, C., Herrling, G., Ritzmann, A., 2011b. Evalution of coastal protec-tion strategies for lowlands in respect of climate change. In: Proc. 34th IAHR-Congress Brisbane/Australia.
Paciorek, C., Risbey, J., Ventura, V., Rosen, R., 2002. Multiple indices of NorthernHemisphere cyclone activity, Winters 1949e99. J. Clim. 15, 1573e1590.
Pinto, J., Ulbrich, U., Leckebusch, G., Spangehl, T., reyers, M., Zacharias, S., 2007.Changes in storm track and cyclone activity in three SRES ensemble experi-ments with the ECHAM5/MPI-OM1 GCM. Clim. Dyn. 29, 195e210. doi:10.1007/s00382e007e0230e4.
R. Weisse et al. / Ocean & Coastal Management 68 (2012) 58e6868
Plüß, A., 2006. Nichtlineare Wechselwirkung der Tide auf Änderungen des Meer-esspiegels im Übergangsbereich Küste/Ästuar am Beispiel der Elbe. In:Gönnert, G., Grassl, H., Kellat, D., Kunz, H., Probst, B., von Storch, H.,Sündermann, J. (Eds.). Klimaänderung und Küstenschutz.
Prandle, D., Wolf, J., 1978. The interaction of surge and tide in the North Sea and theriver Thames. Geophys. J. R. Astr. Soc. 55, 203e216.
Pugh, D., 2004. Changing Sea Levels: Effects of Tides, Weather and Climate. Cam-bridge University Press, Cambridge, United Kingdom and New York, NY, USA,ISBN 9780521532181.
Rahmstorf, S., 2007. A semi-empirical approach to projecting future sea-level rise.Science 315, 368e370. doi:10.1126/science.1135456.
Rider, K., Komen, G., Beersma, J., 1996. Simulations of the Response of the OceanWaves in the North Atlantic and North Sea to Co2 Doubling in the AtmosphereKnmi scientific rep. wr 96-05., KNMI, [Available from KNMI, P.O. Box 201, 3730AE De Bilt, the Netherlands.
Rijkswaterstaat, 1989. Kustverdediging na 1990. Ministerie voor Verkeer enWaterstaat, Den Haag.
Rockel, B., Woth, K., 2007. Extremes of near-surface wind speed over Europe andtheir future changes as estimated from an ensemble of RCM simulations. Clim.Change 82. doi:10.1007/s10584e006e9227ey.
Rosenhagen, G., Schatzmann, M., 2011. Das Klima der Metropolregion auf Grundlagemeteorologischer Messungen und Beobachtungen. In: von Storch, H.,Claussen, M. (Eds.), Klimabericht für die Metropolregion Hamburg. SpringerBerlin, Heidelberg, New York, ISBN 978-3-642-16034-9, pp. 19e60.
Rossiter, J., 1961. Interaction between tide and surge in the thames. Geophys. J. R.Astr. Soc. 6, 29e53.
Schmidt, H., von Storch, H., 1993. German Bight storms analysed. Nature 365, 791.Sönnichsen, U., Moseberg, J., 2001. Wenn die Deiche brechen: Sturmfluten und
Küstenschutz an der schleswig-holsteinischen Westküste und Hamburg.Husum Druck- und Verlagsgesellschaft mbH & Co. KG, Husum, ISBN 3-88042-690-2.
Sterl, A., van den Brink, H., de Vries, H., Haarsma, R., van Meijgaard, E., 2009. Anensemble study of extreme storm surge related water levels in the North Sea ina changing climate. Ocean Sci. 5, 369e378.
Trenberth, K., Jones, P., Ambenje, P., Bojariu, R., Easterling, D., Tank, A.K., er, D.P.,Rahimzadeh, F., Renwick, J., Rusticucci, M., Soden, B., Zhai, P., 2007. ClimateChange 2007: The Physical Science Basis. Contribution of Working Group I tothe Fourth Assessment Report of the Intergovernmental Panel on ClimateChange. Cambridge University Press, Cambridge, United Kingdom and NewYork, NY, USA. Ch. Observations: Surface and Atmospheric Climate Change.
Vikebø, F., Furevik, T., Furnes, G., Kvamstø, N., Reistad, M., 2003. Wave heightvariations in the North Sea and on the Norwegian Continental Shelf, 1881e1999.Cont. Shelf. Res. 23, 251e263.
von Storch, H., Gönnert, G., Meine, M., Woth, K., 2008a. Storm surgese an option forHamburg, Germany, to mitigate expected future aggravation of risk. Environ.Sci. and Policy. doi:10.1016/j.envsci.2008.08.003.
von Storch, H., Reichardt, H., 1997. A scenario of storm surge statistics for theGerman Bight at the expected time of doubled atmospheric carbon dioxideconcentration. J. Clim. 10, 2653e2662.
von Storch, H., Zorita, E., González-Rouco, J., 2008b. Relationship between globalmean sea-level and global mean temperature in a climate simulation of the pastmillennium. Ocean Dyn. 58, 227e236. doi:10.1007/s10236e008e0142e9.
Wahl, T., Jensen, J., Frank, T., 2010. On analysing sea level rise in the German Bightsince 1844. Nat. Hazards 10, 171e179. doi:10.5194/nhesse10e171e2010.
Wahl, T., Jensen, J., Frank, T., Haigh, I., 2011. Improved estimates of mean sea levelchanges in the German Bight over the last 166 years. Ocean Dyn.. doi:10.1007/s10236e011e0383ex.
Wakelin, S., Woodworth, P., Flather, R., Williams, J., 2003. Sea-level dependence onthe NAO over the NW European Continental Shelf. Geophys. Res. Lett. 30, 1403,.doi:10.1029/2003GL017041.
Wang, X., Swail, V., Zwiers, F., Zhang, X., Feng, Y., 2009. Detection of externalinfluence on trends of atmospheric storminess and northern ocean waveheights. Clim. Dyn. 32, 189e203. doi:10.1007/s00382e008e0442e2.
WASA-Group, 1998. Changing waves and storms in the Northeast Atlantic? Bull.Am. Meteorol. Soc. 79, 741e760.
Watterson, I., 2005. Simulated changes due to global warming in the variability ofprecipitation, and their interpretation using a gamma-distributed stochasticmodel. Adv. Water Resour. 28, 1368e1381.
Weidemann, H., Weisse, R., Grabemann, I. Statistisch regionalisierte sturm-flutszenarien für die deutsche nordseeküste. Die Küste, in press.
Weisse, R., Günther, H., 2007. Wave climate and long-term changes for the southernnorth sea obtained from a high-resolution hindcast 1958-2002. Ocean Dyn. 57,161e172. doi:10.1007/s10236e006e0094ex.
Weisse, R., Pluess, A., 2006. Storm-related sea level variations along the North Seacoast as simulated by a high-resolution model 1958e2002. Ocean Dyn. 56,16e25. doi:10.1007/s10236e005e0037ey.
Weisse, R., von Storch, H., 2009. Marine Climate and Climate Change: Storms, WindWaves and Storm Surges. Springer-Verlag, Berlin Heidelberg New York, ISBN978-3-540-25316-7.
Weisse, R., von Storch, H., Feser, F., 2005. Northeast Atlantic and North Seastorminess as simulated by a regional climate model during 1958e2001 andcomparison with observations. J. Clim. 18, 465e479. doi:10.1175/JCLIe3281.1.
Wolf, J., Flather, R., 2005. Modelling waves and surges during the 1953 storm. Phil.Trans. R. Soc. A 363, 1359e1375. doi:10.1098/rsta.2005.1572.
Woodworth, P., Blackman, D., 2004. Evidence for systematic changes in extremehigh waters since the mid-1970s. J. Clim. 17 (6), 1190e1197.
Woodworth, P., Teferle, F., Bingley, R., Shennan, I., Williamas, S., 2009. Trends in UKmean sea level revisited. Geophys. J. Int. 176, 19e30. doi:10.1111/j.1365e246X.2008.03942.x.
Woth, K., 2005. North Sea storm surge statistics based on projections in a warmerclimate: how important are the driving GCM and the chosen emission scenario?Gephys. Res. Lett. 32, L22708. doi:10.1029/2005GL023762.
Woth, K., Weisse, R., von Storch, H., 2006. Climate change and North Sea stormsurge extremes: an ensemble study of storm surge extremes expected ina changed climate projected by four different regional climate models. OceanDyn. 56, 3e15. doi:10.1007/s10236e005e0024e3. online 2005.
Yin, J., 2005. A consistent poleward shift of the storm tracks in simulations of 21stcentury climate. Gephys. Res. Lett. 32, L18701. doi:10.1029/2005GL023684.