Embed Size (px)
Citation preview
Australasian Transport Research Forum 2011 Proceedings28 - 30 September 2011, Adelaide, Australia
Publication website: http://www.patrec.org/atrf.aspx
1
Changing Perceptions of the Bus with Branded ServicesJohn Devney
Level 4, 211 Victoria Square, Adelaide, South Australia 5000
Abstract
Branded bus services have been implemented in many cities to make the bus network morelegible, to improve the image of bus transit and to increase the awareness of bus services forgreater patronage. Branded bus services have been classified into three broad categories forlocal or CBD shuttles, radial routes to the CBD from suburban areas and orbital or crosstownconnector routes.
The key attributes of these types of branded bus services, such as the vehicle livery, routedesign, service frequency, infrastructure, signage, information and promotion, are examinedwith examples from cities in Australia, New Zealand and North America. The recentexperience with branded bus services in various major cities was investigated and described,including examples from Perth, Brisbane, Sydney, Canberra, Melbourne, Vancouver andYork Region in Canada, and Washington, DC and Los Angeles, California in the USA.
A basic assessment method with criteria under the headings of branding image and livery,route legibility, service frequency, infrastructure and information was used to rate the qualityof these branded bus routes. Based on this evaluation, the factors that make a successfulbranded bus route are identified and discussed.
Guidelines for implementing high quality branded bus services are proposed. Branded busroutes must be planned carefully with the objective of creating a more simplified and legiblenetwork. A critical element for success is to keep the branding concept simple to make iteasy for the public to recognise and understand.
1. IntroductionBranded bus services have been implemented in many cities to make the bus network morelegible, to improve the image of bus transit and to increase the awareness of bus services forgreater patronage. The general rationale for branded bus routes is to:
Increase patronage on the bus network and to reduce traffic congestion in the CBD andalong busy traffic corridors;
Improve legibility for existing and new users to make bus services more attractive andeasier to understand; and
Change the perception and profile of bus transit without the high infrastructure costs ofbusways and transitways.
Branded bus services are also important to increase the profile of bus services whencommuter rail and light rail transit are well identified by tracks, stations and rolling stock.Buses only have bus stops along streets and off-street bus interchanges that are not asobvious for the public to see. Bus routes can be changed more easily and are consideredless permanent than rail systems. Branding can be used to give buses a stronger identity.
Bus service branding can be done with the vehicle livery, route design, service frequency,infrastructure, signage, information and promotion. The recent experience with branded busservices in various major cities is described, including examples from Perth, Brisbane,Sydney, Canberra, Melbourne, Auckland and Christchurch in New Zealand, Vancouver andYork Region in Canada, and Washington, DC and Los Angeles, California in the USA.

ATRF 2011 Proceedings
2
2. Attributes of Branded Bus ServicesBranded bus services can be designed by using a special colour, logo and/or name touniquely and simply identify the vehicle livery, bus stops and shelters, and the informationand signage. The different attributes of branded bus services are described in the followingsection with examples from a range of bus systems.
2.1. The Branding Image
The branding image for bus transit systems is typically applied with a colour theme with aunique easily understood logo and name. The colour branding typically uses bright solidcolours. In NSW the State Government has adopted a green colour for the free CBD shuttleservices and red for the crosstown Metrobus network. Examples of the unique logos andcolour schemes for branded services in a selection of cities in Australia and Canada areshown in Figure 1. These images and colours are used on the buses, stops and information.
Figure 1: Branded Logos and Colour Schemes
The CAT logo is used on the free shuttle busservices in Perth, Fremantle and Joondalup
Sugar glider logo for the CityGlider in Brisbane
A bright red colour scheme for the SydneyMetrobus prepaid crosstown network
A bright green colour scheme is used for thefree shuttle bus services in NSW
SmartBus logo with the orange branding forbuses in Melbourne
VIVA is the brand name for Bus Rapid Transit(BRT) in York Region, Ontario, Canada
Simple primary colour schemes have been used in cities to rebrand the image of the bus. Forexample, in July 2004 the entire bus system in Seoul, Korea was redesigned with a simplifiedcolour scheme and vehicle livery using blue, green, red or yellow to identify the trunk, feeder,circulator and intercity bus services respectively. This approach was used to successfullychange the image of the bus in this major Asian city.
2.2. Branded Livery
Vehicle liveries with special branding schemes have been applied to different degrees. Thebest vehicle branding exists where it is applied to the entire vehicle with a unique logo.Symbols of a black cat and a sugar glider are used on the buses in Perth and Brisbanerespectively, as shown in Figure 2. In Rockingham, Western Australia, a dolphin on a bluebus livery is used for the Route 555 Rockingham City Transit System.

Changing Perceptions of the Bus with Branded Services
3
Figure 2: Examples of Branded Bus Livery with Unique Logos
Perth CAT bus with the black cat logo andtri-colour route branding
Brisbane CityGlider bus with the sugar gliderlogo and blue colour scheme
Vehicle branding can be simply applied with a consistent colour scheme, as shown Figure 3for the Metrobus routes in metropolitan Sydney and the free shuttle bus in Sydney CBD. Thegreen colour scheme for the bus livery has been adopted for all of the free CBD shuttleservices throughout NSW and this provides consistency for the free shuttle bus image.
Figure 3: Examples of Branded Bus Livery with a Consistent Colour Scheme
Metobus livery in Sydney on Route 10 Sydney Free CBD Shuttle Route 555
The bus liveries for two branded BRT services in Los Angeles, USA and in York Region,Ontario in Canada are shown in Figure 4. The vehicles allow for multi-door loading.
Figure 4: Vehicles for Branded BRT Services
Sliver and orange “streamlined” bus for the OrangeLine in Los Angeles, California
VIVA three-door bus in York Region, Ontario, Canada

ATRF 2011 Proceedings
4
Some branded bus services have a less distinctive and a minimal vehicle livery with busesthat may be used for other services. This confuses the strength and importance of the brandand image. Examples of bus liveries that do not present a strong and obvious image to thepublic are in Adelaide and Subiaco, Western Australia as shown in Figure 5.
Figure 5: Examples of Bus Services with Less Distinctive Vehicle Branding
Adelaide CityFree buses have a colourful liveryfor the brand, but they are also used for otherservices in addition to the CityFree 99C loop
A red front section and small logo is used todesignate the Subiaco Shuttle in WesternAustralia.
2.3. Branded Stops, Shelters and Stations
Bus stops and shelters can be branded to uniquely designate a branded bus service. It canbe provided with unique signage, specially-designed shelters and real time informationdisplays. Examples of branded stop signage and real time information are shown in Figure 6.
Figure 6: Examples of Branded Bus Stop Signage and Information
Red bus stop for the Brisbane CBD Loop bus SmartBus branded signage with a real timeinformation display in Melbourne
Examples of branded bus shelters in Perth and Brisbane are shown in Figure 7. Theseshelters have a distinctive look and use the logo and colour scheme of the branded busservices to provide consistency in the image of these bus routes.

Changing Perceptions of the Bus with Branded Services
5
Figure 7: Examples of Branded Bus Shelters
CAT bus shelter in Hay Street at King Street,Perth
CityGlider bus shelter at the West End ferryterminal, Brisbane
Bus rapid transit (BRT) typically uses branding at the stations to promote a stronger identityfor the bus similar to train stations on railway lines. In Australia, branding with a uniquecolour and logo has been applied at the busway stations in Brisbane and the T-way stationsin Sydney. Examples of branded BRT stations in the USA and Canada that have been builtto be consistent with the vehicle and route branding are shown in Figure 8.
Figure 8: Examples of Branded BRT Stations
Orange Line BRT station in Los Angeles, USA VIVA-branded station in York Region, north ofToronto, Canada
3. Classes of Branded Bus ServicesBranded bus services have been classified into three broad categories for local CentralBusiness District (CBD) shuttles, radial routes to the CBD from suburban areas and orbital orcrosstown connector routes. Branded bus services can be broadly classified as:
CBD Shuttles or Downtown Circulators which are free or low fare, high frequency busservices along short routes within a CBD or to a railway station;
Radial Routes which operate high frequency services directly along major corridors fromthe outer suburban areas to the CBD, typically with longer stop spacing for fasterservices; and
Crosstown Connectors which are bus routes that operate in an orbital or crosstownroute that do not service the CBD and provide network connectivity linking across a radialor grid bus network.

ATRF 2011 Proceedings
6
3.1. CBD Shuttles
Since the mid-1990s, CBD shuttles, or Downtown Circulators as they are known in the USA,have been introduced in most capital cities in Australia, in New Zealand and in severalAmerican cities. All of these bus services operate a circuit route in the central areaconnecting the main railway station or stations to the high density office area and major CBDretail precinct. CBD shuttle routes are typically free or have low fares to attract patronage onshort trips between the city train and bus stations and the major employment areas in theCBD. (Boyle, 2011) These bus routes are dissimilar to community buses which are operatedby local Councils as a local community service for the elderly and people who have mobilityproblems to travel to the local shops, libraries, medical offices and recreational centres. CBDshuttles are popular with commuters from the train stations, tourists and visitors who do notknow the CBD well and CBD shoppers and business people who park in one location anduse the shuttle bus to travel around the CBD. The vehicles used on CBD shuttles aretypically low-floor accessible buses for people in wheelchairs or for parents or carers withprams.
In the DC Circulator Transit Development Plan for Washington, DC, it is recommended that astrong brand is very important for a CBD shuttle route. It must have distinctive, comfortablebuses, high-frequency services operating all day with at least 10-minute headways, easy tounderstand routes and a simple, affordable fare structure. In the USA, many “downtowncirculators” have a nominal fare, such as $1.00. In Australia, all of the CBD shuttles are freeand subsidised through parking levies, CBD business fees or government subsidies.
One of the first branded bus services in Australia was the Perth Central Area Transit (CAT)system that was introduced in 1996. It replaced the free City Clipper bus route network withfive inner city routes in central Perth. The vehicle livery for the Perth CAT services hasalways been silver grey with a black cat logo, but initially a fleet of Scania buses was used.These vehicles were eventually replaced with Mercedes buses with a common silver greylivery with a tri-colour marking on the front bumper and side of the bus to designate the Red,Yellow and Blue CAT routes as shown in Figure 2.
In 2011, the Perth CAT bus network is comprised of three CBD routes as shown in Figure 9.The Blue CAT route operates as a one-way double loop between Northbridge and the SwanRiver that is not as legible for passengers as the Red or Yellow CAT routes that operatemore simply between East Perth and West Perth.
Figure 9: Perth CAT Network
Source: www.transperth.wa.gov.au

Changing Perceptions of the Bus with Branded Services
7
The routes for CBD shuttles can be designed as a small one-way loop, larger two-way simpleloops, a two-way linear line and a double loop or “figure 8” configuration. Double loops arenot preferred for branded bus services where route legibility is very important. A double loopis more suitable for community bus services to maximise the number of stops at attractionsproviding a high level of accessibility throughout the CBD, and therefore it is not intended forfast or frequent shuttle services.
The NSW Government operates free shuttle buses with high frequency services for shorttrips in CBD locations. The bus stops maintain the branding with the green shuttle logo.These free shuttle services have been introduced in Bankstown, Blacktown, Cabramatta,Campbelltown, Gosford, Kogarah, Liverpool, Newcastle, Parramatta, Penrith, Sydney CBDand Wollongong. All shuttle services operate in either small one-way loops or larger two-wayloops. The Parramatta Free CBD shuttle is shown in Figure 10 as an example of a simpleone-way loop route.
An example of a linear shuttle route is the Subiaco Shuttle Route 97, as shown in Figure 10.This shuttle service connects Subiaco train station with the QEII Medical Centre and theUniversity of Western Australia, and it is jointly funded by these organisations andTransperth. The shuttle route operates every 15 minutes from 7 am to 6:30 pm on weekdaysand every half hour on Saturdays between 9 am and 6 pm and hourly on Sundays.
Figure 10: Types of Shuttle Services
Source: www.131500.com.au Source: www.transperth.wa.gov.au
In Parramatta, NSW, the Free Shuttle serviceoperates in simple one-way loop route
In Perth, the Subiaco Shuttle operates north-south between the train station and the UWAcampus with a terminus loop
Various branded CBD shuttle services with the branding attributes used in the assessment,such as the vehicle livery and signage, route design and the highest frequency during thepeak demand period, are provided in Table 1. Most of the CBD shuttle routes operate withfree services, except for ones highlighted with the red shaded rows.

ATRF 2011 Proceedings
8
Table 1: Branded CBD Shuttles
CityShuttle Name
(Route Number)Vehicle Liveryand Signage Route Design
Peak ServiceFrequency
PerthPerth CAT (Central AreaTransit) (Blue 1, Red 2,Yellow 3)
Grey buses andshelters with catlogo (Blue, Red,
Yellow stops)
Two linear routes,One one-way“figure 8” loop
Every 5 minuteson Red, every 15minutes on Blueand Yellow
Fremantle Fremantle CAT
Orange; changingto Red and Blueloop routes from
June 2011
One-way “figure8” loop changingto two one-wayloop routes in
June 2011
Every 15 minuteson Red, every 10minutes on Blueas of June 2011
Joondalup,WA
Joondalup CAT (10, 11,13)
Teal with CATlogo Three loop routes Every 15 minutes
Rockingham,WA
Rockingham City TransitSystem (555) (fares)
Blue with dolphinlogo
Linear route withsome turns Every 15 minutes
Subiaco, WA Subiaco Shuttle (97)(standard fares)
Red SubiacoShuttle logo on aTransperth bus
Linear route withsome turns Every 15 minutes
Midland, WA Midland Gate Shuttle(300)
Transperth livery;pink logo ontimetable
One-way loop Every 20 minutes
Brisbane City Loop Red Clockwise /anticlockwise pair Every 15 minutes
Brisbane Spring Hill Loop Yellow One-way “figure 8”loop Every 10 minutes
Melbourne City Tourist Shuttle Red and lightbrown
One-way loopwith deviations Every 30 minutes
Sydney CBD Shuttle (555) Green and white Clockwise /anticlockwise pair Every 10 minutes
Wollongong Gong Shuttle (55) Green and white Two-way loop Every 10 minutes
Parramatta Parramatta Shuttle (900) Green and white One-way loop Every 10 minutes
Bankstown Bankstown Shuttle (950) Green and white One-way loop Every 20 minutes
Blacktown Blacktown Shuttle (720) Green and white One-way loop Every 15 minutes
Liverpool Liverpool Shuttle (999) Green and white One-way loop Every 20 minutes
Newcastle Newcastle Shuttle (555) Green and white One-way loop Every 20 minutes
Adelaide CityFree (99C) CityFree gold withwindow card
Clockwise /anticlockwise pair Every 15 minutes
AdelaideCity Connector (Redand Green routesfunded by the Council)
Tindo green solarbus and whitemini-buses
Two one-way“figure 8” loops Hourly
Auckland,New Zealand City Circuit Red bus with City
Circuit brandingOne-way loopwith deviation Every 10 minutes
Christchurch,New Zealand
The Shuttle (ended withearthquake in Feb 2011)
Yellow hybridelectric buses Linear route Every 10 minutes
Washington,DC
DC Circulator (fivecoloured routes)(US$1 fare)
Red, silver andyellow on specialbuses and stops
Short linearroutes Every 10 minutes

Changing Perceptions of the Bus with Branded Services
9
3.2. Radial Routes
Branded radial bus services from the suburban areas to the CBD have been implemented inmany cities to increase the awareness of the bus routes with high frequency, direct servicesthat typically operate with wide stop spacing and bus priority measures, such as bus queuejump signals, “B” lights, bus lanes and sections of dedicated busway.
In 2010 ACTION in Canberra implemented the Rapid Bus concept of branded high frequencybus routes. (ACTION, 2010) Examples of branded radial routes with the level of brandingand peak period frequency used in the assessment are summarised in Table 2.
Table 2: Branded Radial Routes
CityRoute Name
(Number of Routes) Level of BrandingPeak Service
Frequency
Canberra
Rapid Network (4 colour-codedcorridors; Blue Rapid with 7300 series routes; Red Rapid200, Green Routes 4 and 5,Gold Routes 2 and 3)
Colour-coded routes;standard vehicle fleet
Blue Rapid every 5-8minutes; Red Rapidat least every 15minutes; Green andGold lines at leastevery 20 minutes
SydneyMetrobus Network (7 prepaidroutes: M10, M20, M30, M40,M50, M52, M61)
Red low-floor buses andred bus stops Every 10 minutes
Melbourne Skybus (Melbourne Airport) Red low-floor articulatedbuses and red signage Every 10 minutes
Perth Perth Airport Connector Orange mini-buses Less than hourly
Adelaide Jetbus (J1 and J2) Jetbus logo on timetables Every 15 minutes
BrisbaneCityGlider (prepaid only route)(West End to Teneriffe)
Sugar glider logo and lightblue colour on buses, stops
and sheltersEvery 5 minutes
Brisbane
BUZ Route Network (11prepaid CBD-based routes:111, 130, 140, 150, 199, 200,333, 345, 385, 412, 444)
BUZ symbol on bus stopsAt least every 10minutes
AdelaideGo Zone corridors (38corridors with regular routes toAdelaide CBD)
Red on Go Zone bus stops,timetables and maps
At least every 15minutes
Perth High Frequency 900 series (2routes: 920, 940) No special branding Every 15 minutes
Minneapolis,USA
Hi-Frequency Route Network(6 radial routes: 5, 6, 10, 16,19, 64)
Hi-Frequency logo on stopsand timetables
At least every 15minutes
3.3. Crosstown Connectors
Branded bus services have been implemented as crosstown connectors in the form of highquality bus rapid transit (BRT) corridors, or with non-CBD cross-suburban or orbital routes tolink major suburban attractors, such as university and TAFE campuses, regional shoppingcentres, major sporting venues, medical centres and hospitals.
Branded BRT services have been implemented in North America. In the York Region locatedimmediately north of Toronto, Canada, the VIVA brand was launched in 2005 with highfrequency direct bus services. The VIVA network comprises of two “line-haul” routes with the
ATRF 2011 Proceedings
10
Blue VIVA in the north-south corridor along Yonge Street and the Purple VIVA in the east-west direction along Highway 7. (Transport Canada, 2008, Gast and Turner, 2009)Additional peak period only VIVA routes are used to supplement the service frequency withconnections to the train stations.
In Los Angeles, the Orange Line which is a BRT corridor is branded like the other Metro raillines in order to highlight it as a premium service and visually distinguish it from other busservices. The buses known as Metro Liners are painted in the silver and grey of Metro trains.While the stations on the Orange Line have artwork to uniquely identify each one, the basicdesign and construction of the stations is identical to consistently reinforce a strongrecognisable branding identity.
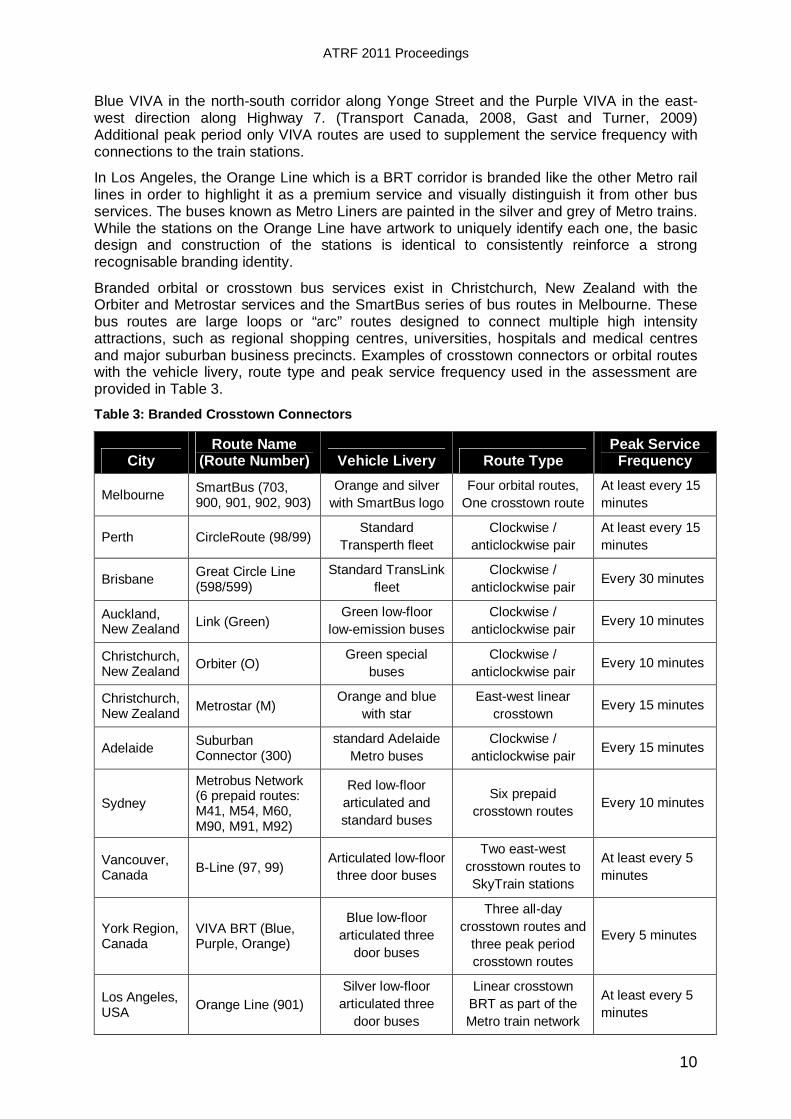
Branded orbital or crosstown bus services exist in Christchurch, New Zealand with theOrbiter and Metrostar services and the SmartBus series of bus routes in Melbourne. Thesebus routes are large loops or “arc” routes designed to connect multiple high intensityattractions, such as regional shopping centres, universities, hospitals and medical centresand major suburban business precincts. Examples of crosstown connectors or orbital routeswith the vehicle livery, route type and peak service frequency used in the assessment areprovided in Table 3.
Table 3: Branded Crosstown Connectors
CityRoute Name
(Route Number) Vehicle Livery Route TypePeak Service
Frequency
Melbourne SmartBus (703,900, 901, 902, 903)
Orange and silverwith SmartBus logo
Four orbital routes,One crosstown route
At least every 15minutes
Perth CircleRoute (98/99)Standard
Transperth fleetClockwise /
anticlockwise pairAt least every 15minutes
Brisbane Great Circle Line(598/599)
Standard TransLinkfleet
Clockwise /anticlockwise pair Every 30 minutes
Auckland,New Zealand Link (Green)
Green low-floorlow-emission buses
Clockwise /anticlockwise pair Every 10 minutes
Christchurch,New Zealand Orbiter (O)
Green specialbuses
Clockwise /anticlockwise pair
Every 10 minutes
Christchurch,New Zealand Metrostar (M)
Orange and bluewith star
East-west linearcrosstown
Every 15 minutes
Adelaide SuburbanConnector (300)
standard AdelaideMetro buses
Clockwise /anticlockwise pair Every 15 minutes
Sydney
Metrobus Network(6 prepaid routes:M41, M54, M60,M90, M91, M92)
Red low-floorarticulated andstandard buses
Six prepaidcrosstown routes Every 10 minutes
Vancouver,Canada B-Line (97, 99)
Articulated low-floorthree door buses
Two east-westcrosstown routes toSkyTrain stations
At least every 5minutes
York Region,Canada
VIVA BRT (Blue,Purple, Orange)
Blue low-floorarticulated three
door buses
Three all-daycrosstown routes and
three peak periodcrosstown routes
Every 5 minutes
Los Angeles,USA Orange Line (901)
Silver low-floorarticulated three
door buses
Linear crosstownBRT as part of theMetro train network
At least every 5minutes

Changing Perceptions of the Bus with Branded Services
11
4. Assessment of Branded Bus ServicesA basic assessment method with criteria to score the various attributes was used to rate thequality and success of these branded bus routes. The branded bus services described inTable 1 for CBD shuttles, Table 2 for CBD radial routes and Table 3 for crosstownconnectors were assessed based on various branding characteristics, service attributes,infrastructure and information provided. This information was used in a comparativeassessment of CBD shuttles to determine which branding elements are the most useful inproviding a highly legible bus service that will attract patronage. Based on this evaluation, thefactors that make a successful branded bus route are identified and discussed.
4.1. Assessment Criteria
Five key criteria were identified to assess the quality and effectiveness of branded busservices and they are provided in Table 4. These criteria have sub-criteria that were groupedunder main criteria for the branding image, service design, infrastructure and information.These criteria were considered the most applicable for assessing the quality of branding busservices. The scoring was based on information from websites for each public transportoperator or authority and personal knowledge of these services.
Table 4: Criteria for Assessing Branded Bus Services
Criterion Sub-criteria Description of Criterion
BrandingImage
Colour Scheme Use of a distinctive colour to easy identify the bus service thatdoes not conflict with other colours used in the system.
Logo and Name A unique logo and name was designed to promote the brand.
Vehicle Livery A special vehicle fleet is used to identify the bus services
RouteLegibility
Simplicity andDirectness ofRoute
Simplicity of the bus route to closely connect many attractions,such as railway stations, university campuses, major shoppingcentres and retail precincts, significant public and culturalinstitutions and hospitals
ServiceQuality Peak Frequency The frequency of the bus services does not require a published
timetable.
Infrastructure
ServiceReliabilityMeasures
Bus priority measures, such as bus lanes and bus queue jumpsignals, are used along the route to improve service reliability.The highest level of bus priority is provided with dedicatedbusway infrastructure.
Shelter Design The design of the shelters is unique and distinctive while beingpractical and safe to provide passengers sufficient cover.
Stop Signage The stop signage is distinctive and linked to the colour andlogo of the branded bus service.
Informationand Promotion
Stop andTimetableInformation
The information at the stop is useful for waiting passengers inthe form of real time information or easy to read maps withsymbols.
Promotion andMarketing
The branded bus service is promoted through easy to readmaterials that explain the simplicity of branded bus services.
The assessment of the branded bus services was based on scores from 5 to 1 for VeryGood, Good, Average, Poor and Very Poor as described in Table 5. The scores weredetermined using the subjective opinion of the author based on knowledge of the variousbranded bus services. Initially an equal importance weighting was used for each criterion.The sensitivity of the scores was tested with less importance assigned to the criteria underthe categories of branding image, service design, infrastructure and information. Thesesensitivity tests did not significantly change the results for the best branded bus services.

ATRF 2011 Proceedings
12
Table 5: Scoring for the Assessment of Branded Bus Services
Rating(Score )
VehicleLivery
RouteLegibility
Highest PeakFrequency Infrastructure Promotion
VeryGood
(5)
special fleetwith brandingand logo
Two-waystraight linear
Every 5 minutesor morefrequent
High qualityBRT stationsand bus priority
special websitewith on-linetracking or realtime information
Good(4)
total distinctivebrandingcolour
Two-wayindirect linear
Every 6 to 10minutes
Brandedshelters; realtime information
special brochure,map and website
Average (3)
partialbrandingcolour
Two-way ormultiple loops
Every 11 to 15minutes
Branded stopsignage
basic brochurewith map withbranding
Poor(2)
minimal routebrandingcolour or logo
One-way loops Every 16 to 30minutes
Only brandedroute number orname on stop
map andtimetablescombined withregular services
Very Poor(1)
no specialroute branding
Double loopswith deviations
Greater thanevery 30minutes
No specialbrandinginformation
timetable that isnot different fromregular routes
4.2. Comparison of Branded Bus Services
The branded bus services were grouped into 21 cities with CBD shuttles, ten cities with radialroutes and 11 cities with crosstown connectors. A comparison of branded CBD shuttleservices is shown in Figure 11. The CBD shuttle services with the highest scores are thePerth CAT and the DC Circulator in Washington, DC. Both of these high frequency servicesare very legible with uniquely-branded vehicles and signage and excellent on-line promotion.
Figure 11: Comparison of Branded CBD Shuttles

Changing Perceptions of the Bus with Branded Services
13
A comparison of branded radial routes is shown in Figure 12. The CBD radial routes with thehighest scores are the CityGlider in Brisbane, Skybus in Melbourne and the Metrobusnetwork in Sydney each with very legible brand for the buses, routes and information.
Figure 12: Comparison of Branded Radial Routes
A comparison of branded crosstown and orbital routes is shown in Figure 13. The cities withthe highest scores are the SmartBus in Melbourne and the BRT systems in North America.
Figure 13: Comparison of Branded Crosstown and Orbital Routes
ATRF 2011 Proceedings
14
4.3. Evidence of the Success of Branded Bus Services
Further investigation into the success of branded bus services was conducted by obtainingmore detailed information from patronage reports, market research surveys and commentsfrom the agencies responsible for their planning, implementation and operation. Oneexample from the top ranked branded bus services in each category of CBD shuttles, radialroutes and crosstown connectors was selected, namely the Perth CAT system, the CityGliderin Brisbane and the Smartbus services in Melbourne. Only Australian examples wereselected because access to the information was more readily available.
4.3.1. Central Area Transit in Perth, Western Australia
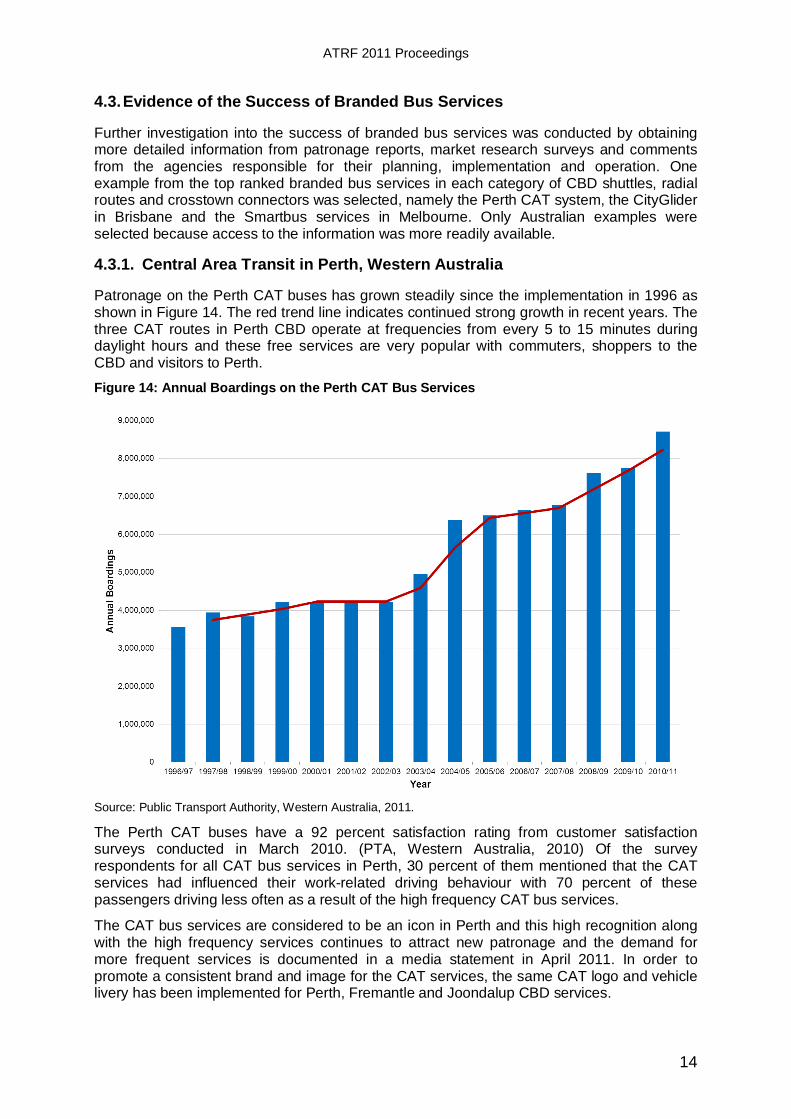
Patronage on the Perth CAT buses has grown steadily since the implementation in 1996 asshown in Figure 14. The red trend line indicates continued strong growth in recent years. Thethree CAT routes in Perth CBD operate at frequencies from every 5 to 15 minutes duringdaylight hours and these free services are very popular with commuters, shoppers to theCBD and visitors to Perth.
Figure 14: Annual Boardings on the Perth CAT Bus Services
Source: Public Transport Authority, Western Australia, 2011.
The Perth CAT buses have a 92 percent satisfaction rating from customer satisfactionsurveys conducted in March 2010. (PTA, Western Australia, 2010) Of the surveyrespondents for all CAT bus services in Perth, 30 percent of them mentioned that the CATservices had influenced their work-related driving behaviour with 70 percent of thesepassengers driving less often as a result of the high frequency CAT bus services.
The CAT bus services are considered to be an icon in Perth and this high recognition alongwith the high frequency services continues to attract new patronage and the demand formore frequent services is documented in a media statement in April 2011. In order topromote a consistent brand and image for the CAT services, the same CAT logo and vehiclelivery has been implemented for Perth, Fremantle and Joondalup CBD services.

Changing Perceptions of the Bus with Branded Services
15
4.3.2. CityGlider in Brisbane, Queensland
The CityGlider in Brisbane has been very successful with sustained growth in patronagesince the implementation on 11 April 2010. It has operates with pre-paid ticketing and dual-door boarding for faster boarding and alighting, a frequency of every five minutes during thepeak period and every 10 to 15 minutes during the off-peak periods and has a 24-hourservice on Friday and Saturday and 18-hour service from Sunday to Thursday.
The CityGlider carries about 40,000 passengers per week and during the first 14 months ofoperation 2 million passengers have boarded the services. Research into the impact of theunique branding on patronage has not been conducted. The high patronage results becauseit operates to inner city areas that previously had poor bus service, the high frequencyservices along a direct route, the higher speed operations with fewer stops spaced furtherapart and the high legibility of the bus stops well positioned along the route.
4.3.3. Smartbus in Melbourne, Victoria
The Smartbus routes in Melbourne have proven to be very popular and the patronage hasgrown since the first implementation in 2002 with crosstown Routes 703 and 888/889.(Department of Transport, Victoria, 2010) The key features of the SmartBus concept is thedirect route along arterial roads between train stations and significant activity centres, suchas major shopping centres and the high service frequency operating at least every 15minutes between 6.30 am and 9.00 pm on weekdays and every 30 minutes at other times,and the longer hours of service into the late evening.
Market research for the Route 903 in July 2009 provides evidence that the SmartBus liverywas highly successful in generating awareness of new route with about half (51 percent) ofthose interviewed reporting that they became aware via totems and the branded buses alongthe route. (Department of Transport, Victoria, 2009) The livery and advertising campaignworked together with a total of 72 percent of the respondents becoming aware of the newSmartBus route via one of these two methods.
From the market research conducted on the Route 902 in April 2011, passengers were usingthe SmartBus or were using it more often because the SmartBus route was more direct ormore convenient than alternative routes. (Department of Transport, Victoria, 2011a) TheSmartBus service brand was specifically reported as a reason for usage by 4 percent ofrespondents. Passengers surveyed also mentioned they used the SmartBus routes becauseof the high service frequency, the direct route along main roads and the longer operatinghours.
On 4 October 2010, SmartBus Routes 905, 906, 907 and 908 were launched. (Department ofTransport, Victoria, 2011b) These four Doncaster Area Rapid Transit (DART) projectSmartBus routes cover a wide area of Manningham with higher frequency bus services. Theyalso complemented the three existing crosstown SmartBus Routes 901, 902 and 903 thatalso operate in Manningham. The market research conducted on the DART SmartBus routesin June 2011 suggested that the vehicle livery as a form of promotion had almost twice theimpact as other forms of advertising and should be seen as the primary focus for promotingfuture new SmartBus services.
The SmartBus livery was highly successful in generating awareness of new routes with 40percent of those interviewed reporting that they became aware of the services by seeingbuses along the routes or bus stops or totems being installed. Comparatively, advertising onoutdoor signs and in the local newspaper had almost half the impact as the livery ingenerating awareness of the new routes (25 percent). The livery and advertising campaignworked together to give an additive effect with a total of 62 percent becoming aware of thenew SmartBus DART routes.

ATRF 2011 Proceedings
16
5. Guidelines for Branded Bus ServicesOf the five criteria used in the assessment, the branding of the vehicle livery is most oftenused to designate a branded bus service and secondly the branding of information. The useof special infrastructure to brand a bus service is least used most likely because it is the mostexpensive element to implement with the cost of special bus shelters and BRT infrastructure.
Based on the research and assessment of branded bus services in the previous sections, thefollowing guidelines for implementing high quality branded bus services are provided.
The branding image must be distinctive from other public transport services and easilyrecognisable and understood by the general public. The use of unique special logos andbright colour schemes for the bus livery, signage and information is encouraged.
The colour scheme must be kept simple, clean and consistent. If multiple brandingcolours are used, they must be designed to work as part of the network and not conflictwith the vehicle livery, signage and information used elsewhere in the system.
The routes should be simple with no deviations. Direct linear two-way routes arepreferable to loop routes. Any one-way shuttle routes should be kept small for a shortcircuit time and to maintain a high service frequency.
A high level of service will make the bus service more obvious and attractive to use.Successful branded bus routes typically operate at least every 10 minutes and do notrequire detailed timetables in brochures and at stops.
Branded bus services are most successful when they can use BRT infrastructure and buspriority measures to provide services with improved reliability and reduced travel times inorder to reinforce the message from the branded vehicle livery, signage and information.
Special innovative websites and easy-to-read information brochures should be designedto promote the branded bus services apart from the other regular suburban bus services.
6. ConclusionsThe main objective of branded bus services is to change the perception of the bus byimplementing services with a new look in order to attract more patronage. A unique brandingimage can be applied to the vehicle livery, route and service design, stops, shelters andother bus priority infrastructure, and for quality information to promote the services.
Branded bus services are applicable for local internal CBD shuttles, radial suburban routes tothe CBD and crosstown or orbital routes that do not service the CBD. A selection of brandedbus services from each of these categories was assessed based on criteria for vehicle livery,route legibility, peak period service frequency, infrastructure and information.
From the assessment of the selection of branded bus services in this research, the brandedBRT routes in York Region, Canada and in Los Angeles, USA have the highest scores. InAustralia, SmartBus in Melbourne has the best branded crosstown routes. For the CBDshuttles, the Perth CAT and DC Circulator in Washington, DC have the highest scores. TheCityGlider in Brisbane has the best branding concept for radial routes. The lowest scores arefor the Midland Gate shuttle in Perth and for the orbital routes in Perth, Adelaide andBrisbane where no special vehicle branding and a low level of promotion has been used.
Evidence that the branding of the vehicle livery and bus stops with a unique colour schemeand logo encourages higher patronage is inconclusive because the popularity of branded busservices may result from the higher service frequencies along direct legible routes orbecause most of the CBD shuttles are free services. However, from discussions with theplanners of the branded bus services, the bus routes that have a distinctive brand have amuch higher awareness by the general public and are more legible for new users tounderstand than the rest of the bus network.

Changing Perceptions of the Bus with Branded Services
17
High quality branded bus routes have a distinctive colour scheme for the vehicle livery,signage and information, a very legible route with services operating at least every 10minutes and bus priority measures wherever possible to improve the quality of the services.
In summary, branded bus routes must be planned carefully with the objective of creating amore simplified and legible network that is easily recognised by the general public. Keepingthe branding concept simple, consistent and unique is a critical element for success.
ReferencesACTION (2010) Parliamentary Zone Bus Services brochure, ACTION, Canberra, ACT
American Public Transit Association (2010) BRT Branding, Imaging and Marketing, APTAStandards Development Program, Washington, DC
Booz and Company (2010) Case Studies, Accessing Our Airports, Integrating City TransportPlanning with Growing Air Services Demand, Tourism and Transport Forum, Sydney, NSW
Boyle, D (2011) Practices in the Development and Deployment of Downtown Circulators,Transit Cooperative Research Practice Synthesis of Practice 87, Transportation ResearchBoard, Washington, DC
Canadian Urban Transit Association (2009) Transit Vision 2040, CUTA, Toronto, Canada
Currie, G and Wallis, I (2007) Effective Ways to Grow Urban Bus Markets - A Synthesis ofEvidence, Thredbo Conference 10, Hamilton Island, Australia
District Department of Transportation (2011) DC Circulator Transit Development Plan, DraftFinal Report, DC Department of Transportation, Washington, DC
Department of Transport, Victoria (2010) Fact Sheet: Where is SmartBus? Melbourne, Victoria
Department of Transport, Victoria (2009) SmartBus Route 903 Communications Research - AReport of Research Findings, Market Solutions Pty Ltd, Moonee Ponds, Victoria
Department of Transport, Victoria (2011a) SmartBus Market Research for Route 902 - A Reportof Research Findings, Market Solutions Pty Ltd, Moonee Ponds, Victoria
Department of Transport, Victoria (2011b) SmartBus DART Communications Research - AReport of Research Findings, Market Solutions Pty Ltd, Moonee Ponds, Victoria
Gast, J and Turner, M-F (2009) VIVA: Case Study and Evaluation of Branded Bus RapidTransit Infrastructure, Transportation Research Board Annual Meeting, Washington, DC
Hess, D and Bitterman A (2008) Bus Rapid Transit Identity: An Overview of Current“Branding” Practice, Journal of Public Transportation, Volume 11, No. 2, 2008
Public Transport Authority, Western Australia (2010) Passenger Satisfaction Monitor 2010,All Modes Presentation, CAT Bus Research pages 84 - 105, Painted Dog Research,Leederville, Western Australia
QED, Indec and Radbone, I (2002) Review of Adelaide Connector Free Bus Service, FinalReport, Adelaide City Council
Transport Canada (2008) Marketing and Branding for Bus Rapid Transit, Case Studies inSustainable Transportation, Ottawa, Canada
Vincent, W and Callaghan, L (2007) A Preliminary Evaluation of the Metro Orange Line BusRapid Transit Project, Breakthrough Technologies Institute, Washington, DC

ATRF 2011 Proceedings
18
Websites
https://www.action.act.gov.au Rapid Network, Canberra, ACT
http://www.adelaidemetro.com.au/routes/go-zones Go Zones, Adelaide, South Australia
http://www.brisbane.qld.gov.au/traffic-transport/public-transport/buses/cityglider/index.htm
http://www.brisbanetimes.com.au/queensland/more-highfrequency-buses-needed-quirk-20110708-1h6cl.html CityGlider, Brisbane, Queensland
http://www.dccirculator.com DC Circulator, Washington, DC, USA
http://www.linkbus.co.nz/index.php Link Bus, Auckland, New Zealand
http://www.wa.alp.org.au/news/2011/04/07/labor-doggedly-pursues-overcrowding-on-cat-buses Media statement in Perth, Western Australia regarding the strong patronage on thePerth CAT buses in April 2011
http://www.metlinkmelbourne.com.au/timetables/smartbus/ SmartBus in Melbourne, Victoria
http://www.metroinfo.co.nz Shuttle, Orbiter and Metrostar in Christchurch, New Zealand
http://www.metro.net Orange Line BRT, Los Angeles Metro, Los Angeles, California, USA
http://www.tc.gc.ca/eng/programs/environment-utsp-casestudy-cs67e-market-809.htmMarketing and Branding for Bus Rapid Transit in Waterloo, Metro Vancouver, York Regionand Halifax, Transport Canada
http://thatsmelbourne.com.au Melbourne Tourist Shuttle
http://www.translink.ca/ B-Line, TransLink, Vancouver, British Columbia, Canada
http://translink.com.au/ CityGlider and BUZ routes, TransLink, Brisbane, Queensland
http://www.transperth.wa.gov.au/ CAT and CircleRoute, Transperth, Perth, Western Australia
http://www.transport.vic.gov.au SmartBus in Melbourne, Victoria
http://www.yrt.ca VIVA York Region Transit, Canada
http://www.131500.com.au/ CBD Shuttles and Sydney Metrobus network, NSW Government
Note: All websites were accessed to view information about the success and marketing ofbranded bus services, bus route maps and timetables in May 2011.
AcknowledgementsThe author wishes to thank the following people for providing statistics and the informationabout the success of the branded bus services in their city.
Simon Cox, Network and System Planner, Service Development, Transperth, PublicTransport Authority, Western Australia for the Perth CAT system
Brendan O'Keeffe, Principal Engineer, Transport Policy, Brisbane Infrastructure, BrisbaneCity Council for the Brisbane CityGlider bus services
Chris Bright, Manager SmartBus, Systems and Information Services Division,Department of Transport, Victoria for the SmartBus in Melbourne


![WELCOME [dsm-india.org]dsm-india.org/wp-content/uploads/2016/06/DSM-activities...Bus Branding Advertisements on BMTC buses Bus Branding (Advertisements) as a media on BMTC Buses in](https://img.pdfslide.net/doc/110x75/5f09247d7e708231d4256ddb/welcome-dsm-indiaorgdsm-indiaorgwp-contentuploads201606dsm-activities.jpg)