Embed Size (px)
Citation preview
NBER WORKING PAPER SERIES
CHANGING SOCIAL CONTRACTS:BELIEFS AND DISSIPATIVE INCLUSION IN BRAZIL
Lee J. AlstonMarcus Melo
Bernardo MuellerCarlos Pereira
Working Paper 18588http://www.nber.org/papers/w18588
NATIONAL BUREAU OF ECONOMIC RESEARCH1050 Massachusetts Avenue
Cambridge, MA 02138December 2012
This paper originated as a paper presented at a Festschrift in honor of Thrainn Eggertsson in April2012. The work of Eggertsson (2005) on the role of beliefs influencing social models and social equilibriuminspired our thoughts on social contracts with respect to inequality and redistribution. For commentswe thank participants at the conference, Andy Baker and an anonymous referee. The views expressedherein are those of the authors and do not necessarily reflect the views of the National Bureau of EconomicResearch.
NBER working papers are circulated for discussion and comment purposes. They have not been peer-reviewed or been subject to the review by the NBER Board of Directors that accompanies officialNBER publications.
© 2012 by Lee J. Alston, Marcus Melo, Bernardo Mueller, and Carlos Pereira. All rights reserved.Short sections of text, not to exceed two paragraphs, may be quoted without explicit permission providedthat full credit, including © notice, is given to the source.
Changing Social Contracts: Beliefs and Dissipative Inclusion in BrazilLee J. Alston, Marcus Melo, Bernardo Mueller, and Carlos PereiraNBER Working Paper No. 18588December 2012JEL No. O10,O43,P51
ABSTRACT
Social contracts about inequality and redistribution are country-specific. We rely on a model of inequalityand redistribution where multiple steady states can emerge in given country. We link the model tothe recent literature on beliefs and argue that beliefs are a major determinant of which equilibriumresults. We show that changes in beliefs may shift the equilibrium in a country over time. We presentevidence that beliefs are typically very stable over time, yet argue that Brazil has recently undergonea dramatic shift in beliefs which we show is associated with a change in the country's social contractin the past thirty years. The transition from one social contract to another has taken place through aprocess which we call 'dissipative inclusion', where redistribution and social inclusion are effectivelyachieved but accompanied by distortions, inefficiencies and rent dissipation.
Lee J. AlstonInstitutions ProgramInstitute of Behavioral ScienceDepartment of EconomicsUniversity of Colorado at BoulderBoulder, CO 80309-0483and [email protected]
Marcus MeloUniversity of [email protected]
Bernardo MuellerDepartment of EconomicsUniversity of [email protected]
Carlos PereiraGetulio Vargas [email protected]
Changing Social Contracts: Beliefs and Dissipative Inclusion in Brazil
Lee Alston
University of Colorado NBER, Research Associate
Marcus Melo
University of Pernambuco
Bernardo Mueller University of Brasilia
Carlos Pereira
FGV – Rio de Janeiro
November 2012
1 Introduction Every country has its own peculiar social contract, that is, a different mix of
redistributive policies through taxes, transfers and regulation with associated levels of
inequality, social mobility and development. Although the concept of a social contract
implies a ‘choice’ by each country for that way of organizing itself, it is in effect the
result of a process of social choice that aggregates individual preferences in the context
of specific political institutions which are in turn endogenous to the social contract. The
wide variety of social contracts throughout the world, even in countries which are
comparable in many other respects such as general location, history and stage of
development, has lead researchers to question what leads to different levels and styles of
redistribution, and also what impact this has on economic growth and well-being. The
most studied contrast has been that between Europe´s high-budget welfare state and the
US’s more laissez-faire approach. While European countries, and especially those in
Scandinavia, have opted for greater levels of taxes, transfers and social insurance, as
well as more stringent regulation of labor and other markets, the US has chosen less
redistribution and more flexible regulation, leaving more social insurance to be done by
2
families and firms. These choices have been associated with more inequality in the US,
yet greater social mobility and economic dynamism.1
In the next section we review the literature on the determinants of redistribution.
This literature has evolved significantly in the past decades. The initial view that the
level of redistribution in a society could be explained as positive function of inequality
has been reversed and the emphasis on economic determinants has been replaced by a
wider range of political, demographic, institutional and behavioral determinants. More
recently greater emphasis has been put on the idea that the choice of social contract may
be crucially determined by beliefs. Beliefs are a fluid concept and in much of this
literature they are thought of as views on issues such as whether people’s fates are
determined by effort or luck, or whether the poor are poor because they are lazy or
because society is unfair. These concepts of beliefs are then operationalized by using
data from large surveys such as the World Values Survey or the General Social Survey
for the US, usually in cross-country or cross-state comparisons so as to reach
conclusions about what determines the different preferences for redistribution.
Our interest is not to explain how different beliefs lead to different social
contracts across countries, but rather to analyze the shift from the existing social
contract – that is, the equilibrium level of inequality and redistribution -to a new social
contract as the result of a change in beliefs. In Section 3 we use the model from
Bénabou (2000) to show the channels through which a change in beliefs can lead to a
new social contract. Although the data shown in Section 4 suggests that most social
contracts are relatively stable and long lasting, or only change incrementally over time,
we argue in Section 5 that Brazil has undergone a punctuated change in beliefs and
social contract since the country re-democratized in 1985.
This distinct break in beliefs provides an opportunity to analyze the details of
how a social contract changes in practice. When one considers different social contracts
in a model or in cross-country comparisons one usually compares one stable
equilibrium with another, without much consideration of the transition process. But in
practice a change in social contract can be traumatic and messy. It involves
redistributing income, wealth and opportunity. It uproots established ways of doing
things and rewrites the rules. Old rights are diluted or extinguished and new ones
1 Note however that Alesina, Glaeser and Sacerdote (2001: 212) argue that “(h)arder data on income mobility do not suggest such strong differences in mobility for the middle classes between the United States and Europe.” See also Alesina and Glaser (2004: 191-195).
3
created. Losers resist and fight back while winners often take time to adapt. The new
policies that are suppose to implement the new status quo rarely work smoothly in such
an environment and can lead to waste and inefficiency or other unintended
consequences. The upshot is that the new social contract might differ significantly from
what was originally expected. If this mismatch is sufficiently large it might feedback
and lead to another change in beliefs. Alternatively a new unexpected equilibrium might
prevail.
In Section 6 we analyze the transition in Brazil from one social contract to
another as beliefs changed. We argue that this process has brought the messiness and
dissipation described above as well as significant inclusion and openness that have
reduced poverty and inequality to unprecedented levels. We call this process
‘dissipative inclusion’ and argue that the net effect of these competing forces results in
higher economic growth and well-being.
2. Literature Review on Inequality and Redistribution Early models of the determinants of redistribution focused on the proposition
that in democracies the income of the median voter is normally lower than the mean
income so the electoral process overwhelmingly caters to the poor through the
imposition of redistributive policies. There is great variability in the median to mean
income ratio across countries, from almost equality in Denmark to less than two-thirds
in Colombia and Brazil. When the median income is significantly below the mean
income a proposal, for example, that pooled all resources and gave everyone the mean
income would be economically feasible and attractive to the median (and decisive) voter
(Bénabou, 2000: 99). The seminal article in this literature is Meltzer and Richards
(1981) which postulated that greater demands for redistribution would lead to lower
growth because the taxation required for redistribution discouraged savings and
investment, and mitigated incentives for work effort and human capital accumulation.
The same negative relationship between inequality and growth was later confirmed
using new growth models (Alesina and Rodrik, 1994) and overlapping generation
models (Persson and Tabellini,1994). Importantly, these two papers provided empirical
evidence through cross-country regressions that growth and inequality are negatively
related.
The growth regressions, however, only captured the reduced form relationship
between growth and inequality. The actual channel through which inequality affects
4
growth in the models was not tested. This channel, in these models, is the demand for
redistribution which is presumed to be greater the bigger the difference between mean
and median incomes. A more rigorous test of this prediction was provided by Perotti
(1995), who estimated the full structural relationship including the effect of inequality
on redistribution and the effect of redistribution on growth. Although the negative
reduced form effect of inequality on growth was confirmed under some specifications,
the full system told a different story. The data indicated no effect of inequality on
redistribution and a positive, rather than a negative, effect of redistribution on growth.
Thus, although Meltzer and Richards (1981), Alesina and Rodrik (1994) and Persson
and Tabellini (1994) did get the negative relationship right between inequality and
growth, they were wrong on both of the intermediary steps.
These early models’ expectation that greater inequality would lead to greater
pressure from the poor for redistribution was based on a median voter logic. But even in
most democracies it is more reasonably the case that rather than one-person-one-vote,
decisions are more influenced by one-dollar-one-vote (Karabarbounis, 2011).2 This
means that the decisive voter has an income above the median and maybe even above
the mean and would be less interested in redistribution. Bénabou (2000: 107) shows
evidence that richer and more educated individuals have a greater propensity to vote, to
try to influence others, to contribute money, attend meetings and work on campaigns.
Similarly the expectation that higher redistribution hinders investment and
accumulation is contradicted by the data. Lindert (2011) argues that although “the
intuition that taxing and giving hurts economic progress is centuries old, (pg. 3)” the
data actually show that the “bigger tax bite to finance social spending does not correlate
negatively with either the level or the growth of GDP per capita (pg. 2).” In part this is
because most high-budget welfare states actually tax capital and property more lightly
than low transfer private market economies like the US and Japan, choosing to finance
the social bill by taxes on the least elastic factors of production such as labor income as
well as consumption (Lindert, 2011). Besides Perotti (1995) mentioned above, several
other papers have also found a positive effect of redistribution on growth: Bénabou
(2002), Easterly and Rebelo (1993), Sala-i-Martin (1996), Saint Paul and Verdier
(1996), Aghion and Bolton (1997), Galor et al. (2009) and Engerman and Sokoloff
2 Karabarbounis (2011) shows that when the poor class is richer relative to the mean income, there is a greater propensity for redistribution. But when the middle class or the rich are richer relative to mean income there is less redistribution.
5
(2000). Of course, whether redistribution is growth enhancing or not ultimately depends
on the details of the policies and their implementation.
In the next section we use a model developed by Bénabou (2000) that yields a
U-shaped curve where redistribution is negatively related to inequality at low levels of
inequality but positively related at higher levels. The crucial point of the model it that it
shows that there can be multiple steady-states for a given country, or for countries with
similar ‘fundamentals’, e.g. democracies with a similar level of income. A given
country therefore has the possibility of ending up in low inequality – high redistribution
equilibrium, or a high inequality – low redistribution equilibrium. The model thus
accommodated the prototypical contrast between Europe and the US without having to
resort to assumptions of different preferences of the population.3 This naturally raises
the question of which equilibrium prevails. We argue that a country’s equilibrium is
initially determined by conditions related to endowments and historical circumstances
and then remains on that equilibrium unless a shock knocks it to another. These can be,
for example, shocks to the distribution of wealth in the form of immigration,
educational discrimination, new technologies or shifts in demand, or shocks to the
political system such as expansions of the franchise. These shocks, even if temporary,
can move a country permanently from one equilibrium to another, thus history matters.
It is interesting that Bénabou (2000: 97) establishes at the outset the goal of
explaining the choice of social contract “without appealing to exogenous differences in
tastes, technologies, or political systems.” In a later paper (Bénabou, 2005: 1595) he
reiterates the intention to answer the question focusing only on political and economic
factors and not relying on social norms or beliefs, which he dismisses as ‘easier
explanations’ (Bénabou, 2000: 107). Yet subsequent authors have not been shy about
appealing to beliefs as a main determinant of the choice of social contract and a vibrant
literature has emerged, once again largely focused on the US/Europe puzzle, often using
data from surveys like the World Value Survey to quantify beliefs.
In “Why Doesn't the United States Have a European-Style Welfare State?”
Alesina, Glaser and Sacerdote (2001)4 analyze economic, political and what they call
behavioral answers to this question. Although at times they seem to be reluctant towards
3 For a discussion of the European social contract and its changes over time see the discussion in Eggertsson (2005). 4 Later expanded into a book entitled: Fighting Poverty in the US and Europe: A World of Difference (Alesina and Glaser, 2004).
6
relying on beliefs as an explanation, in the end beliefs turn out to be a central part of
their answer: Our bottom line is that Americans redistribute less than Europeans for three reasons: because the majority of Americans believe that redistribution favors racial minorities, because Americans believe that they live in an open and fair society and that if someone is poor it is his or her own fault, and because the political system is geared toward preventing redistribution. In fact, the political system is likely to be endogenous to these basic American beliefs. (pg. 247)
Since that paper a rich literature has pursued the relationship between beliefs and
inequality/redistribution (Alesina, Cozzi and Mantovanz, 2009; Fong, 2001; Jusko,
2011; Bénabou and Tirole, 2006; Alesina and Ferrara, 2004; Alesina and Giuliano,
2009.)
If one accepts that beliefs matter, this raises the question of what determines
beliefs. Several papers have tried to endogenize beliefs. Alesina and Giuliano (2009)
provide a broad survey and discussion of the literature on beliefs and redistribution.
Guiliano and Spilimbergo (2009: 1) propose the ‘impressionable years hypothesis’ that
“individuals growing up during recessions tend to believe that success in life depends
more on luck than on effort.” Bénabou and Tirole (2006) introduce some psychology
into political economy by developing a theory of differences in ideology and
redistributive policies that considers for example that people may simply derive comfort
from thinking they live in a just world. Alesina and Fuchs Schundeln (2007) show how
indoctrination may influence people’s views. Piketty (1995) argues that preferences for
redistribution arise from personal history.
In this paper we focus on what we argue is a relatively rare event in the modern
world; a large punctuated change in beliefs and the ensuing shift in social contract. In
Section 4 we show that in Brazil, as the military regime fell in 1985, beliefs in
economic growth at all costs in a stratified society were replaced by beliefs in social
inclusion and open access. Because we are dealing with a single country we can make a
more detailed case for which beliefs prevailed than studies using a cross-section and
relying on one or two survey questions. We show that the new belief initially brought
chaos as social inclusion was sought without concern for fiscal sustainability. When
social inclusion was interpreted as everyone having a right to everything, hyperinflation
was the natural consequence. The profound turmoil and distress of a decade of
hyperinflation eventually gave rise to a belief that we call ‘fear of inflation,’ where
society sees the avoidance on a return to the inflationary past as a policy imperative that
supplants any other objective. The previous and still held belief in open and equal
7
access along with the new ‘fear of inflation’ resulted in a belief in fiscally sound social
inclusion. The new belief has been the basis for the drastic shift in the social contract in
the past two and a half decades.5 The shift in the dominant belief allows us to
investigate the transition from one equilibrium to another over time. First, however, we
present a framework that provides the tools for understanding the determinants of
multiple steady-state social contracts and the shift from the status quo to a new steady-
state.
3. What Determines which Social Contract Emerges? Because we are interested in the effects of beliefs on the nature of the social
contract that emerges this section presents a theoretical analysis of the relationship
between inequality and the support for redistribution, based on Bénabou (2000).6 The
model assumes that incomes follow a lognormal distribution with a variance equal to
∆2. The distribution is right-skewed so that the median income is below the mean. The
level of ∆ is a measure of the level of inequality. Suppose that there is a choice of policy
where either everyone consumes their own endowments, or all resources are pooled and
everybody consumes the mean income. Suppose also, for now, that redistribution entails
no dead-weight loss or other form of waste. The support for the redistributive policy is
equal to the fraction of the population that lies below the mean income, as the mean
income, which they would receive, is higher than their current income. Because the
median voter, who is the decisive voter, is below the median, that policy will have
enough support to be approved. Even if the decisive voter is above the median but
below the mean income, the policy will still be approved. Transforming the log-normal
distribution to a standard normal distribution allows us to quantify the fraction of the
population that would be in favor of a given policy. The proportion in favor of the
redistributive policy is then the fraction p of voters below the mean level of income:
p = Φ(∆/2) (1)
where Φ(.) is the cumulative distribution function of a standard normal.7 Note
that this implies that support for redistribution increases as inequality worsens. Even if
the threshold level of support for approval of the redistributive policy is above the 5 We elaborate in Section 5. 6 We rely on the ‘simplified presentation of the main ideas’ in Section 1 of Bénabou (2000: 98-101). The complete model is considerably more complex and elaborate than that presented here. 7 Given that incomes are distributed Ν(µ,∆2), the mean of the log-normal distribution is µ+∆2/2. Thus a transformation to the standard normal results in Φ((∆2/2)/∆)= Φ((∆/2).
8
median due to wealth effects over political influence, the important result is that 𝜕𝑝𝜕∆
> 0,
that is, the greater the inequality, the greater the support for redistribution. This
relationship is shown in the straight line in Figure 1 where B=0.
The result found in the early literature (Meltzer and Richards, 1981; Alesina and
Rodrik, 1994; Persson and Tabellini, 1994) was actually even more pronounced than
that in (1), due to the assumption of deadweight losses from redistribution. Let B be the
level of deadweight losses involved in the redistributive policies.8 The level of support
for the policy of redistributing the now smaller level of total wealth is:9
p =𝛷 �−𝐵+𝛥
2
2𝛥
� = 𝛷(−𝐵𝛥
+ 𝛥2) (2)
At high levels of deadweight loss (large B) but moderate to low levels of
inequality, p will be low as the proposed redistribution is so wasteful it makes most
people worse off. But as inequality increases −𝐵∆
tends to zero and ∆2 becomes larger. The
result is that 𝜕𝑝𝜕∆
is even more positive than before (see the bottom curve in Figure 1
where B<0). As we have seen, however, this result is not reflected in the data as more
unequal countries are not found to redistribute more.
[Figure 1 here]
If, however, as argued in the previous section, we consider that redistributive
policies can be efficiency enhancing by, for example, allowing the poor to invest in their
human capital in the presence of credit constraints, then B will be positive and the
support for redistribution is:
p =𝛷 �𝐵+𝛥
2
2𝛥� = 𝛷(𝐵
𝛥+ 𝛥
2) (3)
This case can be interpreted by realizing that there are two effects that determine
the support for redistribution. The first effect arises because redistribution increases the
size of the pie. This effect is measured by 𝐵∆ , and its impact is high if society is
sufficiently equal. But this impact becomes smaller as inequality increases, because
there will be more rich people that lose out and oppose the redistribution, even after
considering the gain in efficiency. The second effect is related to the term ∆2, which as
8 That is, income is reduced from y to ye-B, where B>0. 9 The numerator is the normalized mean income minus the deadweight losses. The intuition is that the redistributive proposal now yields a smaller income to each individual so some of those who supported this proposal when there was no deadweight loss will now be made worse off and will oppose it.
9
before captures the fact that as inequality increases there will be more and more support
from the poor to redistribute from rich. The first effect captures a negative relation
between inequality and redistribution and the second capture, as above, a positive
relation. Together they describe a U-shaped trajectory of the support for redistribution
as inequality increases. This is shown in the upper curve in Figure 1 where B>0. The
data cited in the previous section indicating that inequality and redistribution are
negatively related, suggest that the more empirically relevant part is the negatively
inclined part of the curve.10
Whether redistribution effectively occurs depends on the social choice
mechanism in each country that translates support for redistribution into actual tax,
transfers and regulation. For the sake of simplicity assume that a proposal will be
approved if a proportion of voters above a certain threshold support the redistribution.
This proportion is typically greater than 50% due to wealth effects that bias the weight
of the support from the rich. Figure 1 shows that if inequality is below ∆1 or above ∆2
the redistributive policy will be approved, but at intermediate levels it will not pass.
Whatever happens, the level of redistribution that is chosen will feedback into the level
of inequality. It is therefore important to understand how the dynamics of this
relationship determines which steady-state will emerge.
We replicate in Figure 2 the curve with B>0 which represents the political
mechanisms through which inequality affects the support for redistribution. In addition
Figure 2 shows the accumulation mechanism which maps the effect on inequality from
the redistributive policies implemented. When redistribution is high, inequality is
reduced. When society is at a level of inequality where the political mechanism results
in a level of redistribution lower than that which the accumulation mechanism requires
for that level of inequality, then inequality increases. Conversely, for any level of
inequality, when the political mechanism is above the accumulation mechanism,
inequality decreases. The arrows in Figure 2 show how these dynamics can lead to
steady states S1 or S2 where the chosen level of redistribution is compatible with the
level of inequality and thereafter nothing changes unless external shocks alter the
position of the curves. 10 Bénabou (2003: 14) is skeptical about the possibility of econometrically testing the prediction of an inverted ‘U’ relationship between inequality and redistribution: “…different sources of inequality have different effects on redistributive institutions —which, in particular, sheds doubt on the possibility of empirically estimating a catch-all relationship between inequality and redistribution, or inequality and growth.” Nevertheless at least one study, Mello and Tiongson (2003) has found econometric evidence to support the hypotheses in Bénabou (2000).
10
[Figure 2]
In Bénabou (2000) the major interest is to analyze how a country with political
and economic ‘fundamentals’ represented by a given set of political and accumulation
mechanisms can end up in very different social contracts, such as one that generates
growth-enhancing redistributions (e.g. East Asia) versus another that might involve
sacrificing employment and growth for social insurance (e.g. Western Europe). Our
interest here is on what factors can shift a country from on steady-state to another.
Several types of shocks may affect the shape and location of the curves. Any change
that affects the social choice process of preference aggregation or the nature of the
wealth bias in the policy making process would naturally change the political
mechanism curve. Similarly, any change that affected the effectiveness of redistributive
policies in reducing inequality, such as a less distorting tax or improved targeting in
social programs, would affect the accumulation curve. More importantly, if beliefs
about inequality and redistribution suddenly changed, then both curves would be
simultaneously affected, as those other determinants are likely endogenous to beliefs.
Figure 2 illustrates the impact of a change in beliefs. PM1 and AM1 are the initial
political and accumulations mechanism curves drawn such that there is a single steady
state at S1 in which there is relatively high inequality and low redistribution. Suppose
something happens in this country that causes a punctuated change in beliefs over a
relatively short time period. In this example the beliefs have changed towards being
more inclusive and redistributive. This would shift the political mechanism upwards, as
the same level of inequality would induce more support for redistribution. It would also
make support for redistribution less elastic (a flatter curve) as an increase in inequality
would entice more subdued opposition from the rich who vote against redistribution.
Similarly, the new beliefs would shift the accumulation mechanism to the left, as the
same level of redistribution would have a bigger impact on reducing inequality. Also,
this curve would become more elastic (the axes are inverted for the accumulation curve)
as changes in redistribution now have a greater impact on inequality. The total effect of
these changes is a shift of the steady-state from S1 to S2, where there is less inequality
and more redistribution.
The shift shows that a relatively sudden change in beliefs can lead to a
discontinuous change in social contract.11 Clearly, beliefs and the other possibly
11 Slow incremental changes in beliefs can also lead to a discontinuous change if the beliefs reach a tipping point.
11
endogenous determinants of the ‘choice’ of social contract change incrementally over
time, yet our interest in this paper is in a more punctuated change.12 This allows us to
investigate how the practical transition from one equilibrium to another transpires once
the underlying factors prompt policy makers to ‘decide’ on a new social contract.
Whereas slow incremental changes involve a gradual process of adaptation, a more
discontinuous change is more disruptive producing dissipation in its wake.
[Figure 2 here]
4. How common are Punctuated Changes of Social Contracts? In this section we show data that indicates that social contracts are relatively
stable over time. We then claim that in contrast to this general trend, the experience of
Brazil since the mid-1980s has been a relatively rare instance of more abrupt and less
continuous change driven by a punctuated shift in beliefs.
Most of the social contract literature focuses on cross-country variation of
inequality and redistribution and their determinants. Because these variables tend to be
relatively stable over time it is natural that interest has centered on explaining why some
countries have such different social contracts than others. The canonical comparison is
that between high-welfare Europe and low-redistribution US (Alesina, Glaser and
Sacerdote, 2001; Alesina and Glaser, 2004; Bénabou and Tirole, 2006; Bénabou, 2000;
Alesina, and Angeletos, 2005; Handler, 2003). Alesina, Glaser and Sacerdote (2001)
illustrate the durability of social contracts by identifying the determinants of the
differences between the US and Europe with origins in past centuries. For example, they
argue that the US Constitution contains strong protection of property rights due to the
fear by the Founding Fathers that in a democracy the majority might engage in
pernicious over-redistribution, with the consequence that there have since been strong
impediments to taxation and redistribution. They emphasize that
…from the very beginning of the expansion of the public sector in the late nineteenth century, the United States and Europe show very distinct patterns. ... The observation that the difference is of long standing is important, because it allows us to exclude explanations of the difference that are specific to a certain period or event. (Our emphasis. Alesina, Glaser and Sacerdote, 2001: 193-194)
When the literature has dealt with the comparison of a larger sample, the tests
are almost always based on a cross-section of countries with the emphasis on variation
across countries rather than over time. Most of the papers cited in the previous sections
12 By a ‘punctuated change’ we refer to historical time which may meant the change in beliefs took place over 5-10 years.
12
are based on cross-sections: Alesina and Rodrik (1994), Persson and Tabellini (1994),
Perotti (1995), Mello and Tiongson (2003), Jusko (2011), Sala-i-Martin (1996). Even
when a panel is used, as in Karabarbounis (2010) and Forbes (2000) the emphasis is on
cross-country variation. This is largely due to data limitations, but also to the fact that
many of the relevant variables, such as inequality, do not vary much over time, which is
the point we are trying to make.
The emphasis on cross-country comparisons is also present in the literature that
focuses on beliefs as a determinant social contracts (Alesina and Giuliano, 2009;
Alesina and Angeletos, 2005; Alesina and La Ferrara; Alesina, Cozzi and Mantovan,
2009). This literature often uses survey data such as the World Value Survey and the
General Social Survey from the US. Although this data is often available in different
waves over time the interest is on comparisons across countries because this is where
there is more variation. Other papers focus on the variation among individuals within a
same country, but even when different waves are used, as in Fong (2001) and Giuliano
and Spilimbergo (2009), the main interest is in the ‘between’ rather than the ‘within’
variation.
There are some papers that focus specifically on how the social contract in a
given country changes when some of its determinants change. But even in these cases
the nature of the change is usually gradual rather than discontinuous. For example,
Bénabou (2003), analyzes how technical change, by increasing the return to human
capital affects redistribution. Because skills are unevenly distributed in the population,
skill-based technical change can induce more inequality and lower support for
redistribution by shifting the political and accumulation mechanisms in Figure 2,
leading to an unraveling of the welfare state. Even though technical change can often be
disruptive, its emergence and diffusion tend to be dispersed relatively slowly, though
admittedly the pace of technical change and the magnitude of its impact have been
accelerating over time (Kurzweil, 2001). Jusko (2011) shows that in many
circumstances immigration also affects the support for redistribution and consequently
the social contract. Here again, the pace of change is relatively spread out over time.
Further evidence of the stability of social contracts is provided by the
investigation by Alesina and Fuchs-Schundeln (2006) of the different preferences for
redistribution by East and West Germans after reunification. They find that East
Germans that lived under communism maintained strong preferences in favor of
redistribution and state intervention after reunification, even after controlling for other
13
determinants. They estimate that it will take one to two generations for preferences to
converge with those in the West. This corroborates the notion that the determinants of
social contracts change slowly over time.
In order to ascertain the extent to which the main variables involved in social
contracts vary over time we plotted each variable against itself in different periods
covering the largest span for which data is available. Figure 3 shows the evolution of
inequality for OECD countries from the mid-1980s to the latest figure available (circa
2009) and Figure 4 does the same for public social spending in 1980 and 2007. Both
figures show a 45 degree line where variables would be the same in both years, and a
line showing the OLS fit. The closer the lines the lower the change over time. Figure 3
confirms the notion that inequality, especially as measured by the Gini coefficient,
varied very little over the past 30 years, with most countries becoming only slightly less
equal. Public social spending (Figure 4) on the other hand did show greater change, as
the regression line is everywhere above the 45 degree line. All countries in the sample
increased public social spending except the Netherlands and (marginally) Ireland, with
an indication that there is a process of convergence in social spending as those that
spent less in 1980 increased spending more than those that already spent more in the
initial period. Thus although there is some variation over time, the change seems to be
affecting all countries in the sample together, rather than being a country-specific
phenomenon.
[Figures 3 and 4 here]
In Figures 5 and 6 we show the changes over time in beliefs about redistribution
and inequality change over time. We use data from the second and fourth waves of the
World Values Survey. The two variables that proxy beliefs are the ones frequently used
in the literature (Alesina and Giuliano, 2009; Alesina and Angeletos, 2005; Alesina and
La Ferrara; Alesina, Cozzi and Mantovan, 2009). The first asks respondents whether
success in life depends more on hard work or on luck. The other asks whether people
should provide for themselves or whether governments should be responsible for their
well-being. Respondents position themselves on a scale of 1 to 10 and the data show
country averages. The idea is that if one believes that fate is determined by luck and that
it is the government’s responsibility to take care of people, then beliefs are compatible
with higher levels of redistribution and a desire for lower inequality. Clearly this data is
only a rough proxy as the questions might have different connotations and subtexts in
different countries. Nevertheless, for our purpose of ascertaining change over time these
14
limitations are less severe. In both figures the regression line has rotated clockwise yet
has remained relatively close to the 45 degree line, though in both cases there are some
outliers. The data indicate that, as a rule, beliefs are stable and enduring and do not vary
dramatically over time. The exceptions are countries that have undergone traumatic
events, such as revolutions, or dramatic regime changes. It is important to note that
Figures 5 and 6 do not capture the change of beliefs we claim took place in Brazil as the
data compare 1991 to 2005 and that shift took place in the mid-1980s.
[Figure 5 and 6 here]
5. Changing Beliefs and Social Contract in Brazil After twenty-two years of military dictatorship Brazil re-democratized in 1985.
Ever since then the country has been undergoing a dramatic process of change. In this
section we argue that this process has in effect amounted to a shift in the social contract
from a high-inequality/low redistribution equilibrium to a significantly lower-
inequality/high redistribution equilibrium. We show how the nature of policies has
changed and we provide evidence that those policies had an impact on inequality and
redistribution, changing the social contract. In addition we argue that these changes
were motivated by a punctuated change in beliefs regarding the nature of the social
contract.
The first ten years of the military dictatorship (1964-1974) encompassed a
period of extremely high economic growth that is known as the Brazilian miracle,
achieved through central planning and massive state intervention. In Alston et al. (2012)
we identify a dominant belief in this period that we call ‘developmentalism’. This is a
belief that economic issues must take precedence over social and political concerns such
as poverty and political participation. This belief is encapsulated in the maxim of first
increasing the pie to divide it later. During this period the budding dissatisfaction with
the authoritarian nature of the regime was mitigated by the stellar economic
performance. But as that performance deteriorated after 1974, the discontentment with
the oppression, repression, censorship, torture and the general lack of freedom grew
exponentially and the regime underwent a slow and painful ten year decline in which
the belief in ‘developmentalism’ gave way over a relatively short period of time to the
belief in social inclusion.
Up to the present time, there is a belief that social inclusion must be a central
goal of society, explicitly pursued by governmental policies and an integral part of the
15
country’s social, political and economic life. The first early manifestation of this belief
was the massive street protests for direct elections in 1984, a collective catharsis that
served as a watershed between the old and the new social order. This was followed by
an unprecedented extension in the franchise that included the illiterate (25% of the
population) and opened the way for the first presidential election (in 1990) in which
more than half of the population voted. It is noteworthy that this extension of the
franchise was not a strategic decision by a threatened elite, as has often been the case in
history (Acemoglu and Robinson, 2000, 2006). Instead it was a choice made by a new
regime that had just come to power under the belief of social inclusion and was an
expression of the rejection of the exclusionary ways of the past regime. Although there
were those who defended a literacy requirement, under the new spirit of inclusion it was
quickly settled that all would have the right to vote. At the same time the new
Constitution of 1988 codified the belief in social inclusion by establishing a wide array
of extremely progressive rights and protections. Even though many constitutions in
other countries have similar progressive styles, Alston et al. (2012) argue that this
nature of the new Brazilian Constitution has been crucially consequential in biasing
policies irreversibly towards inclusion, openness and representation. This bias, however,
did not preclude the wealthy from continuing to command a more than proportional
influence on policy, nor interest groups from insulating their transfers in the
Constitution. Government expenditures nearly doubled in the wake of the 1988
Constitution under the demands of both inclusive and particularistic policies. Alesina,
Glaser and Sacerdote (2001: 225) find a strong correlation (52%) between social
spending and the year of the most recent constitution for a sample of OECD countries.
The Brazilian Constitution of 1988 surely fit this pattern.
The natural consequence of this new policy environment was hyperinflation.
Brazil had intermittently endured high levels of inflation throughout the 20th century,
but what took place after 1985 was a whole new experience (see Figure 7). Ten years of
annual inflation rates of over 1,000% had a profound effect on the economy and society.
Though it did not undermine the belief in social inclusion it did instill a second belief
that would come to lexicographically dominate; the fear of inflation. The ten years of
suffering and despair, struggling against the irresistible force of ever rising prices,
etched in the souls of a generation of Brazilians the understanding that inflation wreaks
havoc to the daily lives of the nation, firms and individuals. This is an understanding
that only those that have experienced a hyperinflation can truly grasp. To this effect
16
Mervyn King (2004) cites the diary of a Frankfurt resident in 1923:13 “[I]t was more
than disorder that smashed over people, it was something like daily explosions ... the
smallest, the most private, the most personal events always had one and the same cause;
the raging plunge of money."
When Brazil finally tackled inflation in 1994 the country embarked on a new
chapter of its history that has lasted to the current day. Free from the overbearing
distraction of dealing with inflation and its consequences the government turned
towards pursuing the myriad essential reforms that the country badly needed.
Importantly, this process was undertaken under the dual beliefs of social inclusion and
fear of inflation which amounted to a paradigm of fiscally sound social inclusion which
has since been the dominant force shaping policymaking and government action.
Alston, Melo, Mueller and Pereira (2008, 2009a, 2009b, 2012) argue that this process
has given rise to political institutions that increasingly endowed the President with
overwhelming powers, yet subject to strong and effective checks and balances as well as
electoral and market incentives to pursue those dual overriding objectives. Under this
regime monetary stability has been an imperative irrespective of which party or person
has been in power. Similarly, redistributive and inclusive policies have and continue to
be expanded. This includes not only the well-known Bolsa Familia conditional cash
transfer program that is frequently held as a successful model for other countries, but
myriad other programs and regulations in every conceivable area.14
We provide examples of the reach of public policy in the next section, where we
also address how these policies affect economic performance and efficiency. Here,
however, we show that the belief in fiscally sound social inclusion had an impact on the
social contract. From 1995 to 2009 there was a sharp increase in federal social spending.
This was an increase of 146% in real terms and 104% in per capita terms (IPEA, 2011:
25). As a percentage of GDP the increase is more modest but still considerable,
justifying Brazil to be classified by Lindert et al. (2006: 3) as a ‘high spender’ in the
context of Latin American countries and social spending. Partly as a consequence of the
need to finance these expenditures in a fiscally sound manner Brazil has had an
extremely high and growing tax burden, especially for a developing country (see Figure
14). Out of 179 countries Brazil ranks as the 33rd highest tax burdened in 2012 (34.3%
13 King (2004) cites this quote from Ferguson (2001: 154). 14 See Lindert et al. (2006) for a comprehensive survey and evaluation of the multiple types of social programs in Brazil and other Latin American counties.
17
of GDP), above countries like Canada (31.3%), Japan (28.1%) and the US (26.9%)
(Heritage Foundation, 2012). Compared to other BRIC economies Brazil’s tax burden is
approximately double that of India’s (16.8%) and China’s (17.5%), yet on par with
Russia (34.4%). However, while Brazil allocates more than 60% of its total government
spending to social programs, matching OECD levels, Russia spends only 50% (World
Bank, 2011: 16).
Besides direct government expenditure on social programs Brazil also has heavy
pro-social regulation that is indirectly redistributive, such as labor legislation that is
strongly biased towards the employee. Perhaps one of the most important redistributive
regulations in recent years has been the minimum wage policy. Whereas in 1995 Ramos
and Reis (1995) found very little impact of minimum wage policy on reductions of
inequality, more recent studies indicate that at least 35% of the fall in inequality by
2005 could be attributed to the minimum wage policy (Saboia, 2007). Figure 8 shows
the real level of the minimum wage in Brazil from 1984 to 2012. Since 2006 the official
rule for annually adjusting the minimum wage has been to add the variation of inflation
in the preceding year plus the growth of GDP two years back. Following this rule the
increase in 2012 reached an unprecedented 13%, due to the high level of growth in 2010
and the moderately high inflation of 2011. Although this rule has direct and fiscally
perverse impacts on government social security spending, it also serves as a floor and a
benchmark used by the private sector. The policy incorporated millions of new
consumers into the markets for goods and services, including a plethora of durable
goods such as automobiles. Increased social spending is fundamentally changing society
in novel ways. The Economist (2011: 48-50) points out that Brazil is undergoing a
similar transition as Britain in the 1880s, when rising incomes led to a shortage of
domestic servants. It cites a study by IPEA that found that while in São Paulo from
2008 to 2012 the size of the workforce rose 11% and wages 8%, the number of
domestics fell by 4% and their wages rose 21%.
[Figure 8 here]
Have all these social policies, spending and regulations had an impact on
inequality? Figure 9, which shows the evolution of inequality and poverty in Brazil
from 1981 to 2009, indicates the answer to this question is ‘yes’. Although we do not
present a rigorous analysis that there is direct causation from the social policies to the
distinct fall in inequality and poverty since the mid-1990s, there is broad consensus in
the literature that the redistributive polices have been effective (Barros et al. 2006;
18
IPEA, 2009; Neri, 2012). Both poverty and inequality have oscillated in the past in
response to shocks and the macroeconomic cycles, yet it is clear in the data that both
have been systematically falling since the early 1990s.
[Figure 9 here]
As a consequence of these changes the size of the middle class (class C) has
grown from 31% of the population in 1993 to 55% in 2011.15 Over the same period the
richer classes (A and B) have also increased, doubling from 6% to 12% of the
population. The growth of the three upper classes was achieved at the expense of the
two lower classes (D and E) which nearly halved from 63% to 33% from 1993 to 2011.
If it is true that a large middle class is important for economic growth (see Easterly,
2001; and the discussion in Banerjee and Duflo, 2008), then these recent changes in
Brazil have the potential to be very consequential.
The data provided in this section shows that Brazil has clearly increased its level
of redistribution and reduced the level of inequality since the return to democracy in
1985, which is the point where we identified a sharp change in beliefs towards what
would become by the mid-1990s a belief in fiscally sound social inclusion. In short,
Brazil has changed its social contract. In the spirit of Bénabou (2000) and as illustrated
in Figure 2 we see the changes in Brazil as a move from a low-redistribution/high-
inequality equilibrium towards a higher-redistribution/lower-inequality equilibrium. We
say ‘towards’ because it is likely that a new equilibrium has not yet been reached and
that the process of transition is still actively underway. Figure 10 plots federal social
spending against inequality for 1980, 1985, 1990 and 1996-2009 (due to comparable
data availability). The data show a move from the southeast to the northwest, consistent
with a change in the social contract. The changes appear modest given the scale of the
graph, but keep in mind that Gini coefficients tend to be very stable. Also the near
doubling of federal social spending from 1985 to 2009 certainly sub-estimates the level
of redistribution as a large part of the inclusive policies in Brazil are not through direct
government redistribution, but rather through regulation that increases access and
participation. And importantly, as noted above, the direction of change in the past
decade is indicative that the shift towards a more northwesterly equilibrium has not yet
15 The definition of each class relates to people in a family with per capita monthly income equal to (in Reais of July 2011) : Class E – 0 to 1085; Class D – 1085 to 1734; Class C - 1734 to 7475; Class B – 7475 to 9745; Class A – 9745 and above.
19
been concluded and that greater reductions in inequality and increases in redistribution
are likely to materialize in the coming years.16
[Figure 10 here]
Our claim in this section has been that Brazil has been through a transformation
in which a belief of fiscally sound social inclusion has become dominant. Nevertheless
beliefs are difficult to quantify and the best that can be done to support our
interpretation is to provide a rich narrative of the changes the country has been through
and show how the data are compatible with that interpretation. We believe that the data
shown in this section portray remarkable changes and provide strong circumstantial
evidence that beliefs have in fact changed. The treatment of this issue in Alston, Melo,
Mueller and Pereira (2012) provides a more in depth and detailed analysis of these
issues.
6 – Changing Social Contracts through Dissipative Inclusion
If we accept that Brazil has changed its social contract, the question
automatically arises: what happened to social welfare and economic performance?
Social contracts are not Pareto rankable, as by definition there are distributional
consequences. One cannot, for example, state unambiguously whether a US-style social
contract is better than a European-styled one. Therefore, in principle we cannot judge if
the new equilibrium in Brazil is superior to that in the early 1980s. We can, however,
argue that the new social contract is a direct consequence of the dominant belief in
fiscally sound social inclusion.
If we look narrowly at economic growth instead of social welfare, the picture
remains inconclusive. Figure 11 shows the level of GDP growth in Brazil from 1950 to
2007 with the world average GDP plotted in the continuous line. The dotted lines show
the GDP growth of the countries at the 20th and 80th percentile. The data show that until
the mid-1970s Brazil’s economic growth was predominantly above the world average
and often higher than the top 20th percentile. Thereafter economic growth has been
overwhelmingly below the world average, including most years after 2000. This pattern
of high growth under inequality/low redistribution and low growth under less
inequality/higher redistribution would seem to suggest that Brazil is moving from a
16 That the country would have taken this route is by no means obvious. As recently as ten years ago Medeiros (2001) analyzed the trajectory of the Brazilian Welfare State from the 1930s to the 1990s and concluded that “… there is no evidence that the Brazilian Welfare State has undergone a change of trajectory in the 1990s towards more equalitarian models.”
20
stereotypical US social contract to a European social contract. However, in Bénabou
(2000: 113 and 2004: 9) the growth implications of different social contracts are more
nuanced than this dichotomy implies, relying instead on the relative magnitudes of the
tax distortions associated with redistribution and the presence of credit constraints that
hinder investments in human capital and entrepreneurship.17 More specifically, when
tax distortions are high and credit constraints are low, redistribution is expensive and
does relatively little to improve the allocation of investment expenditures. In this
situation a more redistributive social contract leads to lower income growth. On the
other hand, when tax-distortions are relatively small and credit constraints are high,
there are net gains to redistribution and a more redistributive social contract induces
higher economic growth. Bénabou (2005) describes this result as follows:
Are the potential growth-enhancing effects of redistributive policies in the presence of credit constraints significant, or trivial compared to the standard deadweight losses? While the answer must ultimately come from empirical studies of specific policy programs or experiments, recent quantitative models suggest very important long-run effects, ranging from several percentage points of steady-state GDP to several percentage points of long-run growth, depending on the presence of accumulated factors, such as physical capital or knowledge spillovers, that complement individual human capital. (Bénabou, 2005: 1601)
[Figure 11 here]
What have been the growth implications for Brazil from these two forces? How
does the extent of the dead weight losses involved in the increased redistribution of the
past decades compare to the potential for improved investment allocation as
redistribution compensates for ill-functioning asset markets? It is not straightforward
how each of these constraints can be measured and compared. Given that growth has
been below par for the past two decades during which redistribution has been
effectively reducing inequality, one might presume that the tax distortion effect had a
greater impact than the credit constraint effect. But such a conclusion may be
premature. Although the growth in incomes as measured by GDP per capita has
certainly been low relative to the world average, or even the Latin American average, it
is nevertheless also the case that parallel to the reduction in inequality the Brazilian
economy has been undergoing dramatic changes in other economic variables besides
GDP, such as the drop in poverty, attainment of investment grade status in 2008, record
levels of foreign reserves and foreign direct investment, and a dramatic modernization
17 See Banjeree (2009) for a discussion on the channels through which credit constraints impede those without wealth but with the talent and drive to invest from doing so.
21
and growth of agriculture (see Alston and Mueller, 2011.) It may be that the increased
redistribution in Brazil has been compensating for credit constraints and that many of
those who have the talent and opportunity but did not have the wealth, have been
investing more and better, but that the impacts on economic growth are simply slow to
materialize and have not yet been captured by measures of GDP. This is quite plausible
as many of the gains to be had from redistribution work through investment in human
capital, entrepreneurship and innovations (or new ways of doing things), all of which
typically payoff only in the long run.
What can we say about the relative impacts of tax distortions and credit
constraints in Brazil? There are good reasons to expect both to be quite large. A highly
unequal country with myriad untapped productive opportunities like Brazil is likely to
have huge gains from getting round constraints to better investment allocation. As for
tax distortions, Brazil has a highly developed tax system but one that is nevertheless full
of inefficiencies and distortions (Lledo, 2005). Furthermore the relevant distortions are
not only those in the formal tax system but in all kinds of redistributive policies, such as
labor regulation, judicial bias and social security rules that provide work disincentives
and impede contracting. Despite the efforts to redistribute wealth many regressive
policies remain in place.
If both tax distortions and credit constraints are high in Brazil, which prevails?
We propose to answer this question by looking at how Brazil transitioned from one
social contract to the other. This process of transition is more nuanced than would be
suggested by theoretical models such as the one presented in section 3. When beliefs
and other determinants of the social contract change, the country does not automatically
jump from one equilibrium to the next. The process through which beliefs change is not
immediate and only consolidates slowly as outcomes match expectations over time.
There is a long and messy transition during which it is far from obvious what
transformations are taking place. New institutions emerge, creating new constraints and
new incentives with many distributional consequences. Those harmed by the changes
resist, distorting the intended outcomes of the new policies and capturing part of the
gains intended for others. Those who benefit often do not immediately recognize the
gains and are often reluctant to back up the changes. Old habits die hard and a clear
understanding of how things work under the new institutions takes time to emerge.
Tax distortions and credit constraints crucially affect the ultimate outcomes on
growth and inequality. But, we interpret tax distortions more broadly than mere dead-
22
weight loses to include all the rent dissipation that arises as people react to the new
institutions and policies, e.g., lobbying, rent-seeking, striking, political squabbling,
gridlock, and corruption. In the extreme this dissipation can wash out all of the gains
that the redistribution creates. In turn, we also interpret the gains from redistribution
more broadly than simply the removal of credit constraints for investment in human
capital and entrepreneurship. The redistribution enables access by formerly excluded
sections of society to both economic and political organizations and markets. Much
current research on economic development stresses ‘access’ as playing a central role to
a sustained process of economic and political performance. North, Wallis and Weingast
(2009) have open access, rule of law for all, and impersonal administration of the law as
the defining characteristics of a developed society. Similarly, Acemoglu and Robinson
(2006 and 2012) argue that the lack of inclusive political and economic institutions is
the main reason why nations fail.
The shift from low to high redistribution social contracts prompts both
dissipation and inclusion. The relative impact of each and the net impact on economic
growth and performance depends on the context of each country. In Brazil the transition
to a new social contact embodies both considerable dissipation and inclusion. We
classify this transition as a process of ‘dissipative inclusion.’
The starting point of dissipative inclusion is the belief in fiscally sound social
inclusion. Social inclusion without the fiscal discipline is self-defeating, as it was from
1985 to 1994 in Brazil when it led to hyperinflations. The inclusion gets written into the
laws and policies and gradually becomes a part of the way of doing things. In many
cases these goals may initially seem like folly or wishful thinking and are often ignored
or badly enforced, generating perverse incentives and other distortions. But over time
formal laws and informal norms embody the inclusion, prompting organizations and
individuals to accept the changes.
Some examples of dissipative inclusion, pointing out first the dissipation and
then the inclusion help describe the process. A prominent example is land reform, which
was a central policy of the first civilian government in 1985 and has featured high in the
programs of all governments since. The goal has been to redistribute land from
unproductive latifundia to the masses of landless peasants. The unintended consequence
of these policies has been over 18 thousand rural conflicts and more than 1,200 deaths
from 1985 to 2010 (Comissão Pastoral da Terra, 2010). The land reform programs have
clearly entailed significant dissipation. But at the same time there has also been
23
significant inclusion. By 2010 more than 900 thousand families received land through
the land reform programs, in what amounts to a transfer of approximately 87 million
hectares, an area greater than Portugal and France combined. Even though a large
proportion of these have not managed to become independent producers and many have
eventually sold their land, large scale redistribution has nevertheless taken place
(Alston, Libecap and Mueller, 2010).
A second example has been the rise of participatory institutions, allowing the
common citizen and representing organizations to take part directly in the process of
policymaking. The Constitution of 1988 explicitly included the ‘participatory ideal’ to
foster empowerment and make the democratic process more open and transparent. The
size and scope of the participatory experiment in Brazil has made it a reference point in
any analysis of civic engagement (Avritzer, 2009). The participation includes councils,
budget procedures, and municipal master plans. Initially most initiatives were local but
soon federal policymaking adopted many similar characteristics. Participatory
institutions can be found in a wide array of policy areas: education, health, environment,
housing, water basins, urban policy, sports, culture, and racial equality. What has been
the impact of this experience in Brazil? It is very hard to tell. An edited volume
dedicated to the analysis of how to evaluate the impacts of participatory institutions in
Brazil finds both elements of dissipative inclusion (Pires, 2011). On one hand there is
evidence that the participatory arrangements fail to provide participation or to affect
outcomes, leading to higher costs, delays, capture, gridlock and bad policy. On other
hand there is increasingly more evidence of cases where participation has provided
access, transparency and accountability, sometimes directly and other times simply by
improving the debate. Pires (2011) recognizes the difficulty in reaching a conclusion
regarding the net impact of participatory institutions in Brazil and calls for further
research to try to answer whether the inclusion achieved is greater than the
accompanying dissipation.
Other examples of dissipative inclusion in Brazil are: expansion of the social
security net; (Castro and Ribeiro, 2009); judicial activism towards social goals (Brinks
and Gauri, 2012); pro-worker labor laws (Barros and Corseuil, 2004; Almeida and
Carneiro, 2009); and quotas in public universities, inter alia.
The nature of dissipative inclusion can be better understood by seeing how these
policies contrast with policies that have different characteristics. In Figure 12 we show a
typology of policies where the horizontal axis measures the level of inclusiveness and
24
the vertical axis measures the level of economic efficiency. This inclusion-efficiency
space is divided into different areas for which we provide descriptive labels. In principle
a given country can have different policies in any and all of the areas in this space. But
given that all policies in a given country are affected by the same basic political and
economic determinants, we would expect them to have similar characteristics. Policies
in the bottom left corner are classified as ‘Inefficient Extractive’ as they both exclude
much of the population and are economically inefficient (eg. North Korea). In contrast,
policies in the top right corner are termed ‘Efficient Inclusion,’ as they simultaneously
promote growth and inclusion (eg. Most OECD countries). In the intermediate areas in
the policy space we distinguish four other types of policies. ‘Growth-Promoting
Authoritarian’ policies are those that promote successful economic growth through
authoritarian means (eg. China). ‘Populist Inclusion’ are policies that have a veneer of
inclusion but originate from opportunism and demagoguery of a short-termist
government, so that much of the promised inclusion never materializes or gets reversed
over time (eg. Argentina). ‘Efficient with Limited Access’ are economically efficient
policies that are more inclusive than an authoritarian government would pursue but not
yet fully inclusive (eg. late 19th century US). Finally, ‘Dissipative Inclusion’ are policies
that achieve significant inclusion, participation and empowerment of previously
excluded social groups, promoting changes that in time may be conducive to better
economic performance. But this is accompanied by inefficiencies and dissipation of
rents as the new policies encounter resistance from those that lose out in the process of
redistribution. We argue that these characteristics pervade much of the policymaking in
Brazil today.
Whereas policies in the efficient inclusion category unambiguously promote
economic growth, policies characterized by dissipative inclusion can be dominated by
either the dissipation or the inclusion. The net effect of dissipative inclusion in Brazil is
hard to determine because it is hard to quantify both the dissipation and the inclusion,
but also because the process is still ongoing and the outcomes on either side do not
necessarily materialize at the same time. In many cases the dissipation is quicker to
emerge and tends to be much more conspicuous than the inclusion. It may also be, as
suggested by Lindert (2003), that over time social spending tends to become less
distortive, whereas learning and adaptation tends to make inclusion more effective. For
these reasons it is common for the process of dissipative inclusion to be confused with
purely dysfunctional policy-making that has no compensating benefits. In the end only
25
time will tell whether the net effect on growth and welfare will be positive or negative.
Yet, without a doubt the belief of fiscally sound social inclusion produced an incredible
amount of institutional strengthening in Brazil in the past decades. As a result we cannot
discount the powerful transformative impact that inclusion is silently achieving amidst
the sound and fury of the accompanying distortions and inefficiencies.
[Figure 12]
7 – Concluding Remarks
Brazil has moved from a high-inequality low-redistribution social contract
before 1985 to one characterized by lower-inequality, higher-redistribution today. The
repressive years under military dictatorship and the oppressive years under
hyperinflation motivated the shift in beliefs. The resulting belief of fiscally sound social
inclusion has been the driving force reducing poverty and inequality. We label the
transformative process ‘dissipative inclusion’ as it entails effective inclusion but at the
expense of significant dissipation of rents.
It is tempting to suggest that governments could tweak the process to enhance
inclusion and avoid distortions. Naturally, there is room for interventions to improve the
terms of the trade-offs. However, the fundamental nature of dissipative inclusion has no
short-term fix because it is determined by the distribution of power in society. In the
spirit of North, Wallis and Weingast (2009) and Acemoglu and Robinson (2012) the
distribution of power means that there are limits to what can be achieved through
redistribution in the short run without upsetting the social order. In this sense the
dissipative nature of social inclusion may be efficient from a ‘remediableness’ criterion
(Williamson, 1996). In the long-run, however, the process of dissipative inclusion
should endogenously change the distribution of wealth and power, allowing for less
inefficiencies and consequently more growth.
Finally, is the concept of dissipative inclusion specific to Brazil or are there any
general insights gained to better understand the process of development? The key
element in dissipative inclusion is the existence of some force pushing for inclusion that
is capable to match and overcome the formidable forces that naturally resist
redistribution. In Brazil the force is the overarching belief in social inclusion. If this
belief were not strongly rooted and infused in the country’s lifeblood, from the
Constitution to the culture, the judiciary, the press, the educational system, and the
political parties, the policies aimed at achieving openness, empowerment and inclusion
would be in vain. Any country trying to achieve these same goals motivated by some
26
less powerful force would fail in the face of strong resistance. In this sense the Brazilian
experience may not be replicable because beliefs cannot be manufactured, but it is
useful for understanding the circumstances in which social contracts change.
References
Acemoglu, Daron and James A. Robinson. 2000. "Why Did the West Extend the Franchise? Growth, Inequality and Democracy in Historical Perspective." Quarterly Journal of Economics CXV: 1167-1199.
Acemoglu, Daron and James A. Robinson. 2006. Economic Origins of Dictatorship and Democracy. Cambridge, UK: Cambridge University Press.
Acemoglu, Daron and James A. Robinson. 2012. Why Nations Fail? The Origins of Power, Prosperty and Poverty. Cambridge, UK: Cambridge University Press.
Aghion, Phillipe and Bolton, Patrick. 1997. “A Theory of Trickle-Down Growth and Development,” Review of Economic Studies 64(2): 151—172.
Alesina, Alberto F. and Paola Giuliano. 2009. “Preferences for Redistribution,” NBER Working Paper 14825, http://www.nber.org/papers/w14825.
Alesina, Alberto and George-Marios Angeletos. 2005. “Fairness and Redistribution,” The American Economic Review, Vol. 95, No. 4 (Sep.), pp. 960-980.
Alesina, Alberto F., Guido Cozzi and Noemi Mantovan. 2009. “The Evolution of Ideology, Fairness and Redistribution,” NBER Working Paper No. 15587, December.
Alesina, Alberto and Edward L. Glaeser. 2004. Fighting Poverty in the US and Europe: A World of Difference. Oxford: Oxford University Press, 262 pages.
Alesina, Alberto and Eliana La Ferrara. 2005. “Preferences for Redistribution in the Land of Opportunities,” Journal of Public Economics 89: 897– 931.
Alesina, Alberto and Dani Rodrik. 1994. “Distributive Politics and Economic Growth,” The Quarterly Journal of Economics, Vol. 109, No. 2 (May, 1994), pp. 465-490.
Alesina, Alberto and Nicola Fuchs-Schündeln. (2007) “Good-Bye Lenin (or Not?): The Effect of Communism on People's Preferences,” American Economic Review, Aug, Vol. 97, No. 4: 1507-1528.
Alesina, Alberto , Edward Glaeser and Bruce Sacerdote. 2001. “Why Doesn't the United States Have a European-Style Welfare State?” Brookings Papers on Economic Activity, Vol. 2001, No. 2. (2001), pp. 187-254.
Almeida, Rita and Pedro Carneiro. 2009. “Enforcement of Labor Regulation and Firm Size,” Journal of Comparative Economics, Vol. 37, Issue 1: 28-46.
Alston, L.J., B. Mueller. 2011. “Brazilian Development: This Time for Real?” CESifo Forum, v. 1, p. 37-46, 2011. www.cesifo-group.de/DocDL/forum1-11-focus6.pdf
27
Alston, Lee J., Marcus Melo, Bernardo Mueller and Carlos E. Pereira. 2012. The Road to Prosperity: Beliefs, Leadership and Windows of Opportunity; Brazil 1960-2010, Book manuscript.
Alston, L.J., M.A. Melo, B. Mueller and C. Pereira. 2008. “On the Road to Good Governance: Recovering from Economic and Political Shocks in Brazil,” Eds. E. Stein, M. Tommasi, C. Scartascini and P. Spiller, Policymaking in Latin America: How Politics Shapes Policies, Harvard University Press.
Alston, L.J., M.A. Melo, B. Mueller and C. Pereira. 2009a. Presidential Power, Fiscal Responsibility Laws, and the Allocation of Spending: The Case of Brazil. In: Mark Hallerberg; Carlos Scartascini; Ernesto Stein. (Org.). Who Decides the Budget? Cambridge: Harvard University Press, V. 1, p. 56-78.
Alston, L.J., M.A. Melo, B. Mueller and C. Pereira. 2009b. “The Political Economy of Productivity in Brazil.” Washington: Inter-American Development Bank, 2009 (Working Paper).
Alston, Lee J., Gary D. Libecap, and Bernardo Mueller. 2010. “How Interest Groups can Influence Political Outcomes Indirectly through Information Manipulation: The Landless Peasants Movement in Brazil”. NBER Working Paper Series No. 15771.
Avritzer, Leonardo. 2009. Participatory Institutions in Democratic Brazil, Baltimore, John Hopkins University Press.
Banerjee, Abhijit V. 2009. “Investment Efficiency and the Distribution of Wealth,” World Bank, Commission on Growth and Development, Working paper No.53. http://economics.mit.edu/files/6966.
Banerjee, Abhijit V. and Esther Duflo. 2008. “What Is Middle Class about the Middle Classes around the World?” The Journal of Economic Perspectives, Vol. 22, No. 2 (Spring), pp. 3-28.
Barros, Ricardo Paes and Carlos Henrique Corseuil. 2004. “The Impact of Regulations on Brazilian Labor Market Performance,” in (editors) James J. Heckman and Carmen Pagés, Law and Employment: Lessons from Latin, University of Chicago Press.
Barros, Ricardo P., Mirela de Carvalho, Samuel Franco and Rosane Mendonça. 2007. “A Importância da Queda Recente da Desigualdade na Redução da Pobreza,” Texto para Discussão IPEA, No. 1256.
Bénabou, Roland. 2000. “Unequal Societies: Income Distribution and the Social Contract,” The American Economic Review, Vol. 90, No. 1, March: 96-129.
Bénabou, Roland. 2002. “Tax and Education Policy in a Heterogeneous-Agent Economy: What Levels of Redistribution Maximize Growth and Efficiency?” Econometrica 70(2): 481—517.
Benabou, Roland, 2005. "Inequality, Technology and the Social Contract," in: Philippe Aghion & Steven Durlauf (ed.), Handbook of Economic Growth, Elsevier, edition 1, volume 1, chapter 25, pages 1595-1638.
28
Bénabou, Roland and Jean Tirole. 2006. "Belief in a Just World and Redistributive Politics," Quarterly Journal of Economics, 121(2), May: 699-746.
Brinks, Daniel M. and Varun Gauri. 2012. “The Law’s Majestic Equality?: The Distributive Impact of Litigating Social and Economic Rights,” The World Bank, Policy Research Working Paper No. 5999.
Castro, Jorge Abrahão and José Aparecido Carlos Ribeiro. 2009. “As Políticas Sociais e a Constituição de 1988: Conquistas e Desafios,” in IPEA Política Social: Acompanhamento e Análise, Brasília, Vol. 17.
Comissão Pastoral da Terra. 2010. Conflitos no Campo no Brasil. Brasília: CPT. http://www.cptnacional.org.br/index.php?option=com_content&view=article&id=734.
Easterly, William. 2001. “The Middle Class Consensus and Economic Development,” Journal of Economic Growth, Vol. 6 No. 4: 317-335.
Easterly, William and Sergio Rebelo. 1993. “Fiscal Policy and Growth,” Journal of Monetary Economics, 32, 417-458.
The Economist. 2011. “The Servant Problem,” December 17th: 47-50.
Eggertsson, Thrainn. 2005. Imperfect Institutions: Possibilities and Limits of Reform. New York: Cambridge University Press.
Engerman, Stanley L. and Kenneth L. Sokoloff. 2000. “History Lessons: Institutions, Factor Endowments, and Paths of Development in the New World,” Journal of Economic Perspectives, 14(3): 217—232.
Ferguson, Niall. 2001. The Cash Nexus: Money and Power in the Modern World, 1700-2000. London: Penguin/Allen Lane Press.
Forbes, Kirstin J. 2000. “The Relationship between Inequality and Growth,” American Economic Review, Vol 90. No. 4: 869-887.
Fong, Christina. 2001. “Social Preferences, Self-interest, and the Demand for Redistribution,” Journal of Public Economics, 82: 225-246.
Galor, Oded, Omer Moav, and Dietrich Vollrath. 2009. “Inequality in Landownership, the Emergence of Human-Capital Promoting Institutions, and the Great Divergence,” Review of Economic Studies, 76(1): 143—179.
Giuliano, Paola and Antonio Spilimbergo. 2009. “Growing Up in a Recession: Beliefs and the Macroeconomy,” NBER Working Paper 15321, http://www.nber.org/papers/w15321.
Jusko, Karen Long. 2011. “The Politics of Redistribution in Diverse Societies,” Working Paper, Department of Political Science, Stanford University.
Handler, Joel F. 2003. “Social Citizenship and Workfare in the US and Western Europe: From Status to Contract,” Journal of European Social Policy, August,Vol. 13 No. 3 229-243.
Heritage Foundation. 2012. “Index of Economic Freedom,” http://www.heritage.org/.
IPEA. 2011. “Comunicado IPEA No. 108 – Gasto Federal: uma Análise da Execução Orçamentária de 2010,” Instituto de Pesquisa Econômica Aplicada.
IPEA. 2009. “Vinte Anos da Constituição Federal,” Política Social: Acompanhamento e Análise, Brasília, Vol. 17.
29
Karabarbounis, Loukas. 2011. “One Dollar, One Vote,” Economic Journal, Vol. 121, Issue 553: 621-651.
Kurzweil, Raymond, 2001. “The Law of Accelerating Returns, Lifeboat Foundation, http://lifeboat.com/ex/law.of.accelerating.returns retrieved 2012-03-22.
Lindert, Peter H. 2003. “Why the Welfare State Looks Like a Free Lunch,” NBER Working Paper 9869, http://www.nber.org/papers/w9869.
Lindert, Kathy, Emmanuel Skoufias and Joseph Shapiro. 2006. “Redistributing Income to the Poor and the Rich: Public Transfers in Latin America and the Caribbean,” World Bank, Social Safety Nets Primer Series.
Lledo, Victor Duarte. 2005. “Tax Systems under Fiscal Adjustment: A Dynamic CGE Analysis of the Brazilian Tax Reform,” IMF Working Paper, WP/05/142.
Medeiros, Marcelo. 2001. “A Trajetória do Welfare State no Brasil: Papel Redistributivo das Políticas Sociais dos Anos 1930 aos Anos 1990,” Brasília: IPEA, Texto para Discussão, No.852.
Mello, Luiz de, and Erwin R. Tiongson. 2003. “Income Inequality and Redistributive Government Spending,” IMF Working Paper, WP/03/14.
Meltzer, Allan H. and Scott F. Richard. 1981. “A Rational Theory of the Size of Government,” The Journal of Political Economy, Volume 89, Issue 5 (Oct., 1981), 914-927.
Mervyn King. 2004. “Institutions of Monetary Policy,” The American Economic Review, Vol. 94, No. 2, Papers and Proceedings of the One Hundred Sixteenth Annual Meeting of the American Economic Association San Diego, CA, January 3-5, 2004 (May), pp. 1-13.
Neri, Marcelo C. 2012. De Volta ao País do Futuro: Projeções, Crise Europeia e a Nova Classe Média, Fundação Getúlio Vargas, Centro de Políticas Sociais.
North, Douglass C., John J. Wallis and Barry R. Weingast. 2009. Violence and Social Orders: A Conceptual Framework for Interpreting Recorded Human History, Cambridge University Press.
Perotti, Roberto. 1995. “Growth Income Distribution, and Democracy: What the Data Say,” Columbia University Discussion Paper Series No. 757.
Persson, Torsten and Guido Tabellini. 1994. “Is Inequality Harmful for Growth?” The American Economic Review, Vol. 84, No. 3 (Jun., 1994), pp. 600-621.
Piketty, T. 1995. “Social Mobility and Redistributive Politics,” Quarterly Journal of Economics, Vol. 110, No. 3: 551-584.
Pires, Roberto R.C. (editor) 2011. Efetividade das Instituições Participativas no Brasil: Estratégias de Avaliação, Brasília: IPEA, Diálogos para o Desenvolvimento, Vol. 7.
Ramos, Lauro and José Guilherme A. Reis. 1995. “Salário Mínimo, Distribuição de Renda e Pobreza no Brasil,” Pesquisa e Planejamento Econômico, Rio de Janeiro, Vol. 25 No. 1, April: 99-114.
Saboia, João. 2007. “A Redistribuição de Renda não Pode Parar,” Valor Econômico, Feb. 13th 2007.
30
Saint Paul, Gilles and Thierry Verdier. 1996. “Inequality, Redistribution and Growth: A Challenge to the conventional Political Economy Approach,” European Economic Review, 40: 719-728.
Sala-i-Martin, Xavier. 1996. “Transfers, Social Safety Nets, and Economic Growth,” IMF Working Paper, No. 96/40: 1-31.
Williamsnon, Oliver. 1996. The Mechanisms of Governance, Oxford University Press.
World Bank. 2011. “Social Expenditure and Fiscal Federalism in Russia,” Washington, World Bank, Human Development Sector Unit, Europe and Central Asia Unit, Report No. 54392-RU.
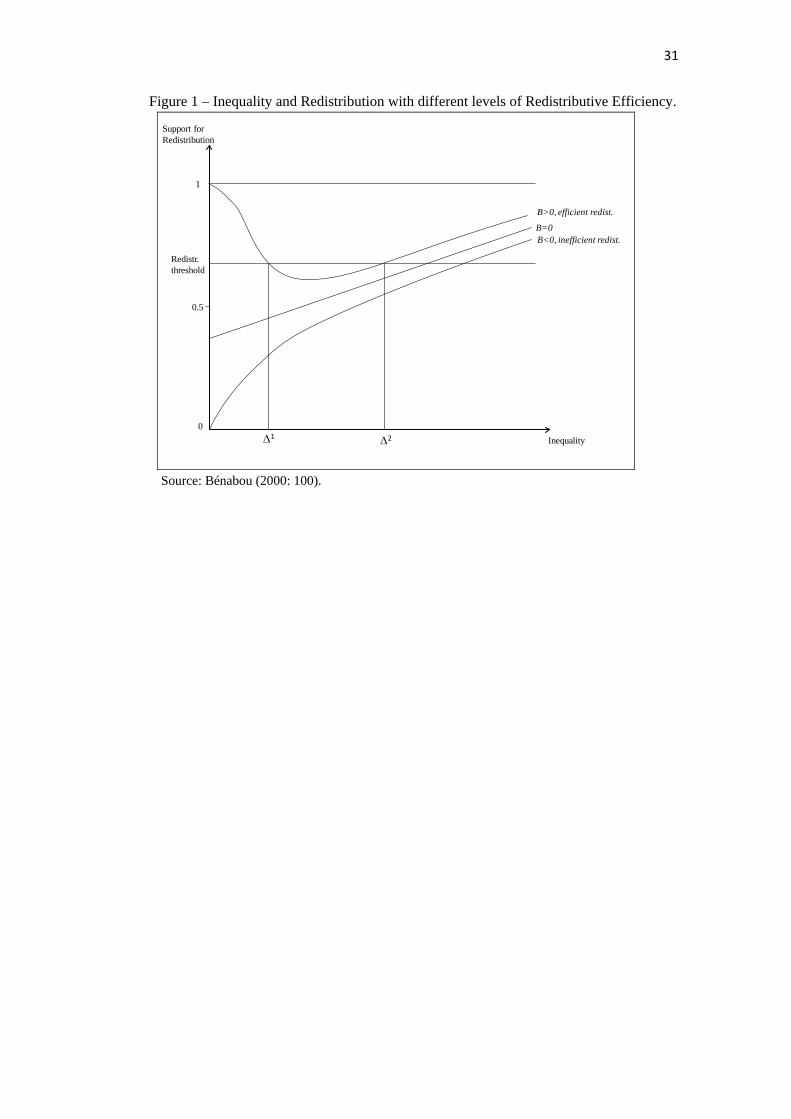
31
Figure 1 – Inequality and Redistribution with different levels of Redistributive Efficiency.
0.5
0
Support forRedistribution
Inequality
B>0, efficient redist.
B<0, inefficient redist.B=0
Redistr.threshold
1
∆1 ∆2
Source: Bénabou (2000: 100).
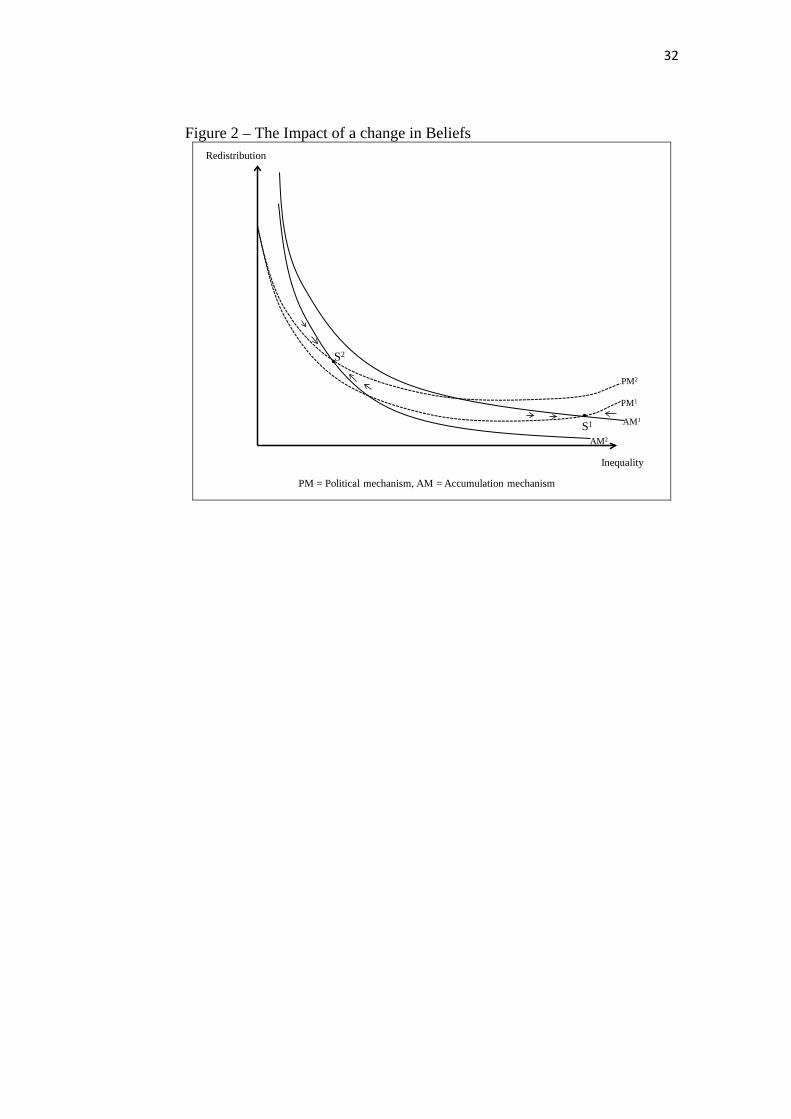
32
Figure 2 – The Impact of a change in Beliefs
Inequality
Redistribution
PM1
AM1S1
PM2
AM2
S2
PM = Political mechanism, AM = Accumulation mechanism
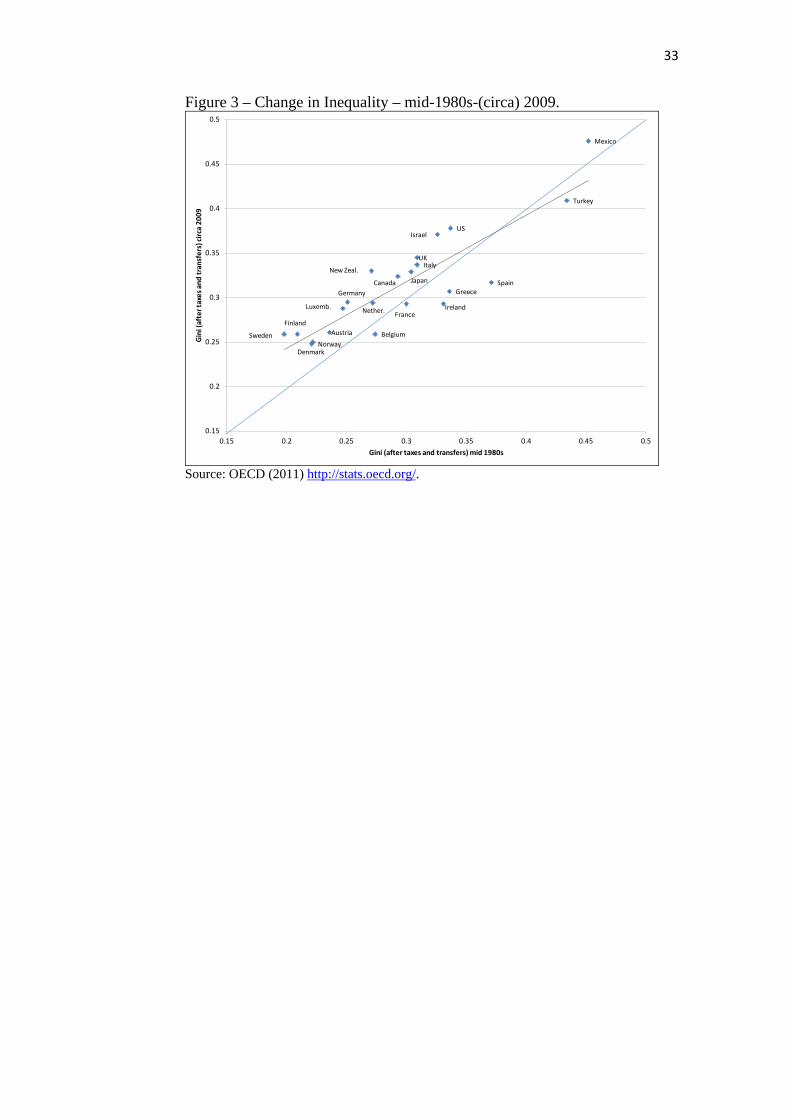
33
Figure 3 – Change in Inequality – mid-1980s-(circa) 2009.
Austria Belgium
Canada
Norway
FinlandFrance
Germany Greece
Ireland
Israel
Italy
Japan
Luxemb.
Mexico
Nether.
New Zeal.
Denmark
Spain
Sweden
Turkey
UK
US
0.15
0.2
0.25
0.3
0.35
0.4
0.45
0.5
0.15 0.2 0.25 0.3 0.35 0.4 0.45 0.5
Gin
i (af
ter t
axes
and
tran
sfer
s) ci
rca
2009
Gini (after taxes and transfers) mid 1980s
Source: OECD (2011) http://stats.oecd.org/.
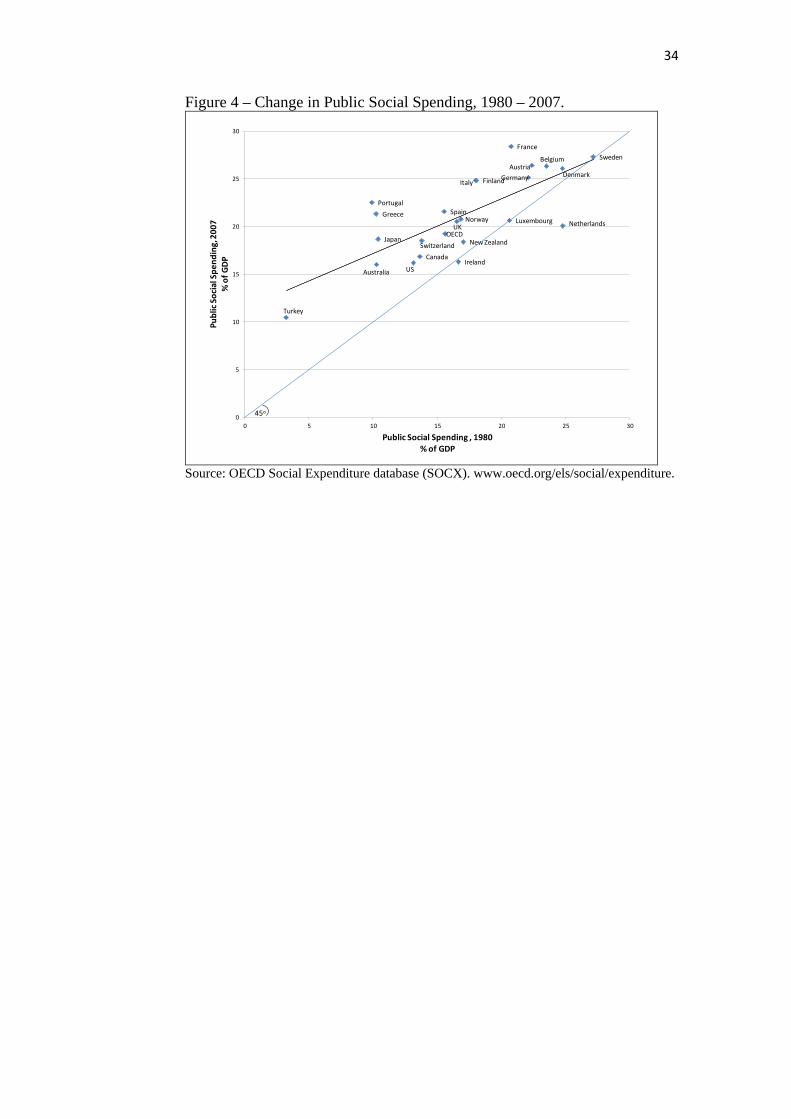
34
Figure 4 – Change in Public Social Spending, 1980 – 2007.
Australia
AustriaBelgium
Canada
DenmarkFinland
France
Germany
Greece
Ireland
Italy
Japan
Luxembourg Netherlands
New Zealand
Norway
PortugalSpain
Sweden
Switzerland
Turkey
UK
US
OECD
0
5
10
15
20
25
30
0 5 10 15 20 25 30
Publ
ic S
ocia
l Spe
ndin
g, 2
007
% o
f GDP
Public Social Spending , 1980% of GDP
45o
Source: OECD Social Expenditure database (SOCX). www.oecd.org/els/social/expenditure.
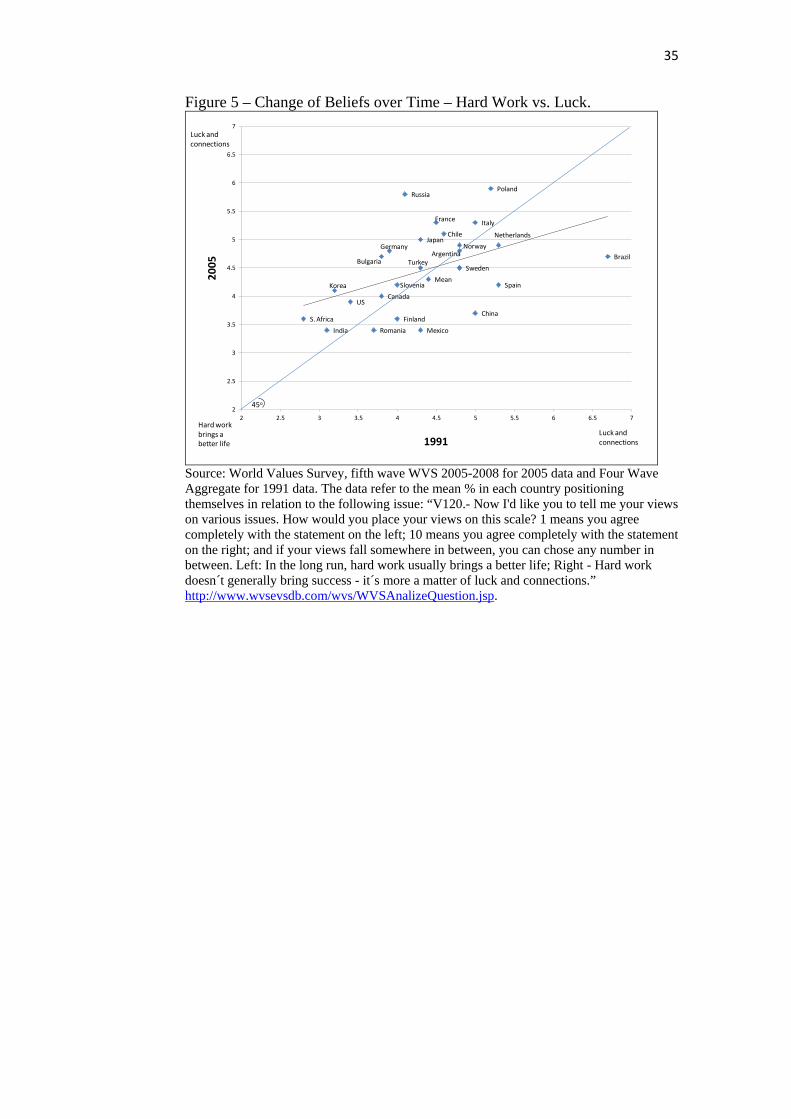
35
Figure 5 – Change of Beliefs over Time – Hard Work vs. Luck.
Mean
Argentina BrazilBulgaria
Canada
Chile
ChinaFinland
France
Germany
India
Italy
Japan
Korea
Mexico
NetherlandsNorway
Poland
Romania
Russia
Slovenia
S. Africa
Spain
SwedenTurkey
US
2
2.5
3
3.5
4
4.5
5
5.5
6
6.5
7
2 2.5 3 3.5 4 4.5 5 5.5 6 6.5 7
2005
1991Hard workbrings abetter life
Luck andconnections
Luck andconnections
45o
Source: World Values Survey, fifth wave WVS 2005-2008 for 2005 data and Four Wave Aggregate for 1991 data. The data refer to the mean % in each country positioning themselves in relation to the following issue: “V120.- Now I'd like you to tell me your views on various issues. How would you place your views on this scale? 1 means you agree completely with the statement on the left; 10 means you agree completely with the statement on the right; and if your views fall somewhere in between, you can chose any number in between. Left: In the long run, hard work usually brings a better life; Right - Hard work doesn´t generally bring success - it´s more a matter of luck and connections.” http://www.wvsevsdb.com/wvs/WVSAnalizeQuestion.jsp.
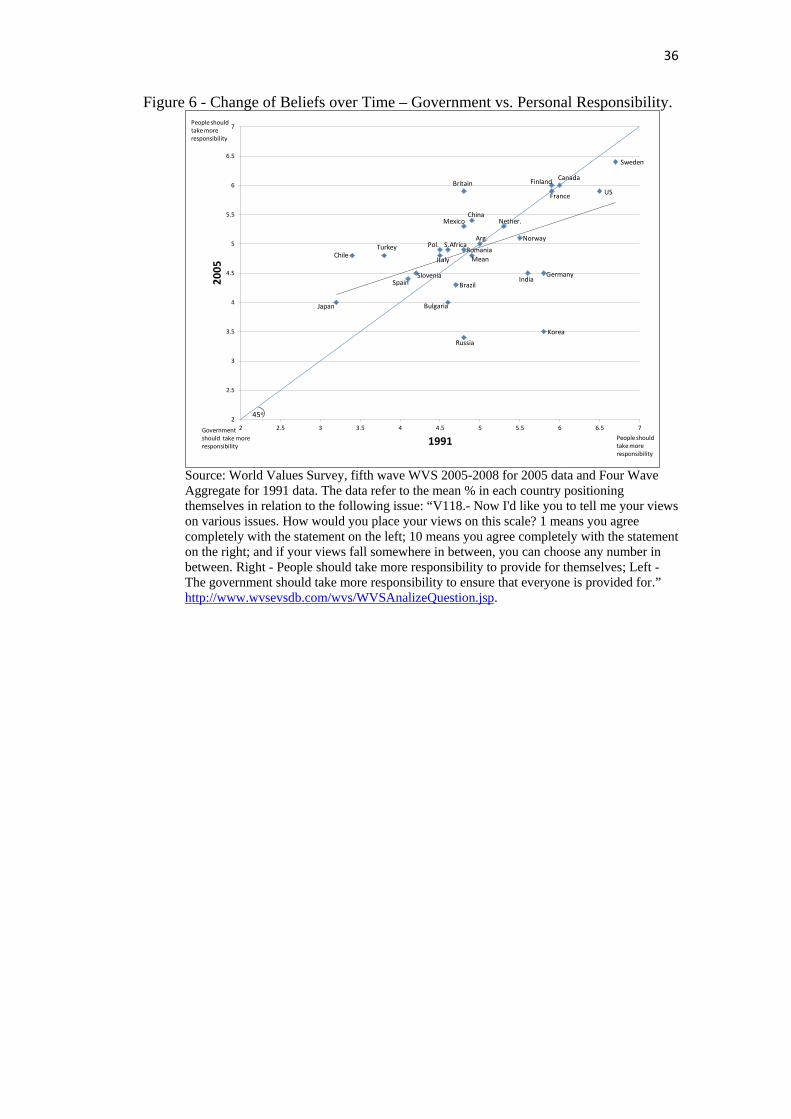
36
Figure 6 - Change of Beliefs over Time – Government vs. Personal Responsibility.
Mean
Arg.
Brazil
Bulgaria
Canada
Chile
China
Finland
France
GermanyIndia
Italy
Japan
Korea
Mexico Nether.
NorwayPol.
Romania
Russia
Slovenia
S.Africa
Spain
Sweden
Turkey
BritainUS
2
2.5
3
3.5
4
4.5
5
5.5
6
6.5
7
2 2.5 3 3.5 4 4.5 5 5.5 6 6.5 7
2005
1991 People shouldtake moreresponsibility
Governmentshould take more responsibility
People shouldtake moreresponsibility
45o
Source: World Values Survey, fifth wave WVS 2005-2008 for 2005 data and Four Wave Aggregate for 1991 data. The data refer to the mean % in each country positioning themselves in relation to the following issue: “V118.- Now I'd like you to tell me your views on various issues. How would you place your views on this scale? 1 means you agree completely with the statement on the left; 10 means you agree completely with the statement on the right; and if your views fall somewhere in between, you can choose any number in between. Right - People should take more responsibility to provide for themselves; Left - The government should take more responsibility to ensure that everyone is provided for.” http://www.wvsevsdb.com/wvs/WVSAnalizeQuestion.jsp.
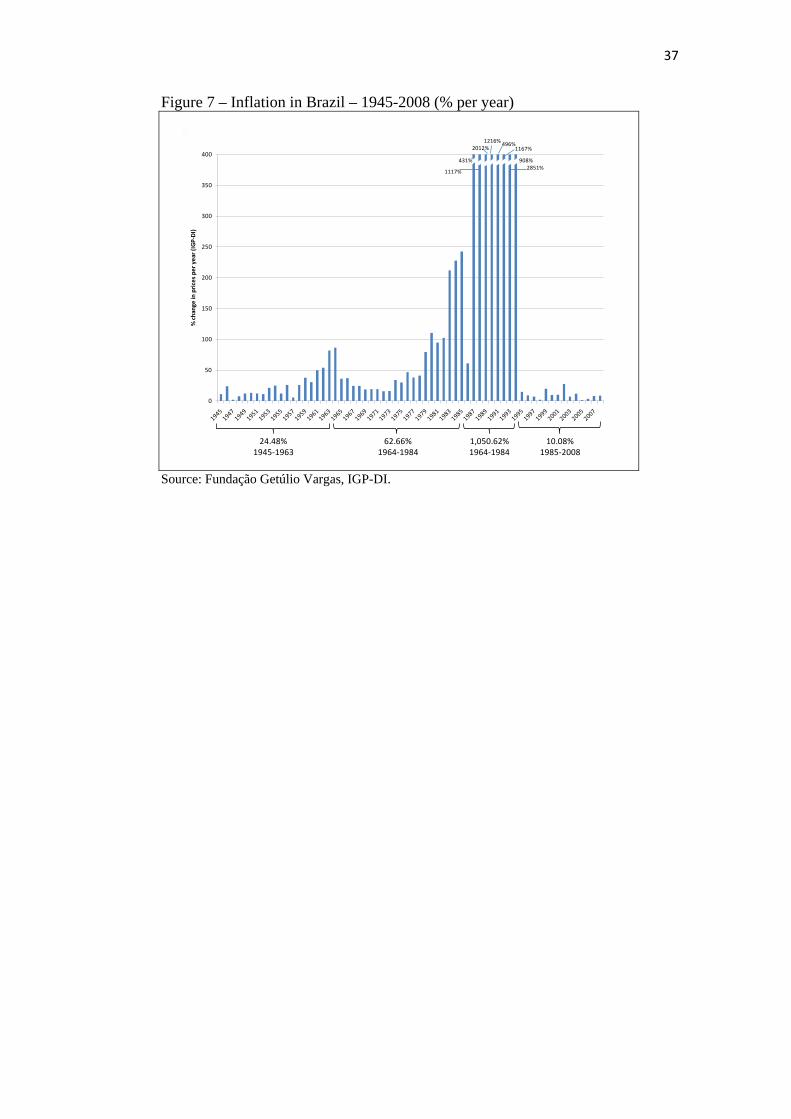
37
Figure 7 – Inflation in Brazil – 1945-2008 (% per year)
0
50
100
150
200
250
300
350
400
% ch
ange
in p
rices
per
yea
r (IG
P-DI
)
24.48%1945-1963
62.66%1964-1984
1,050.62%1964-1984
10.08%1985-2008
1117%
431% 908%
2012%1216% 496%
1167%
2851%
Source: Fundação Getúlio Vargas, IGP-DI.
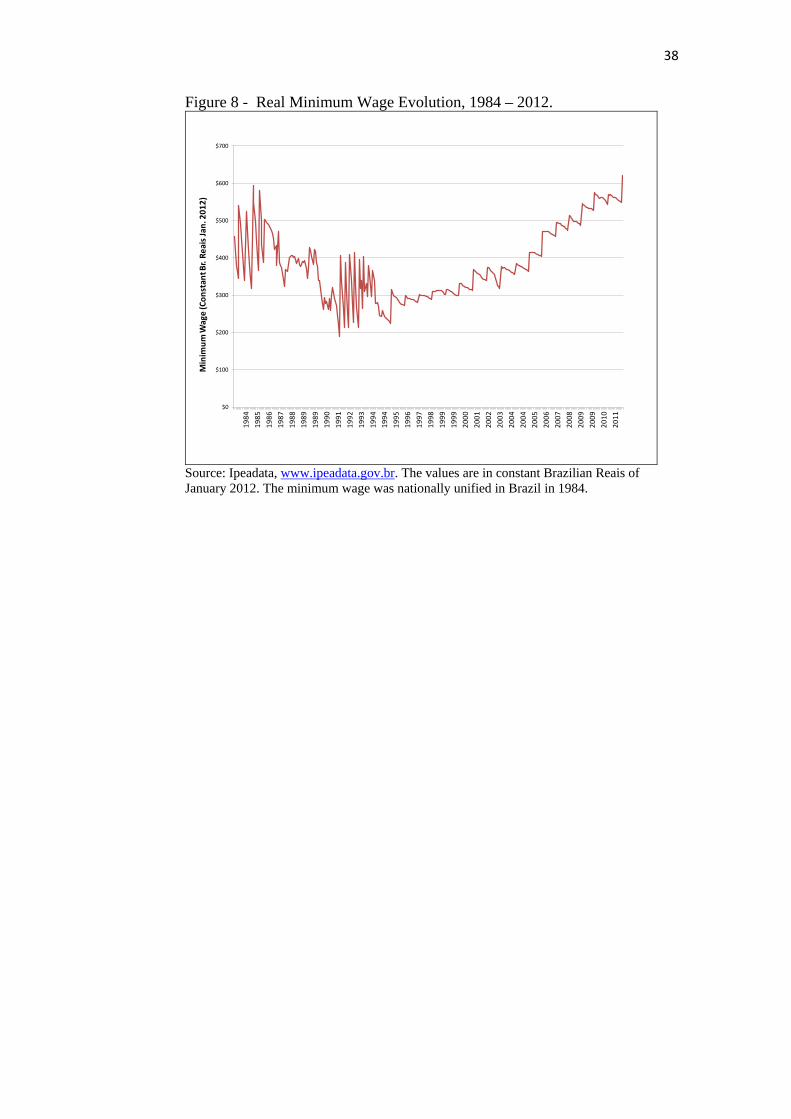
38
Figure 8 - Real Minimum Wage Evolution, 1984 – 2012.
$0
$100
$200
$300
$400
$500
$600
$700
1984
1985
1986
1987
1988
1989
1989
1990
1991
1992
1993
1994
1994
1995
1996
1997
1998
1999
1999
2000
2001
2002
2003
2004
2004
2005
2006
2007
2008
2009
2009
2010
2011
Min
imum
Wag
e (C
onst
ant B
r. Re
aisJ
an. 2
012)
Source: Ipeadata, www.ipeadata.gov.br. The values are in constant Brazilian Reais of January 2012. The minimum wage was nationally unified in Brazil in 1984.
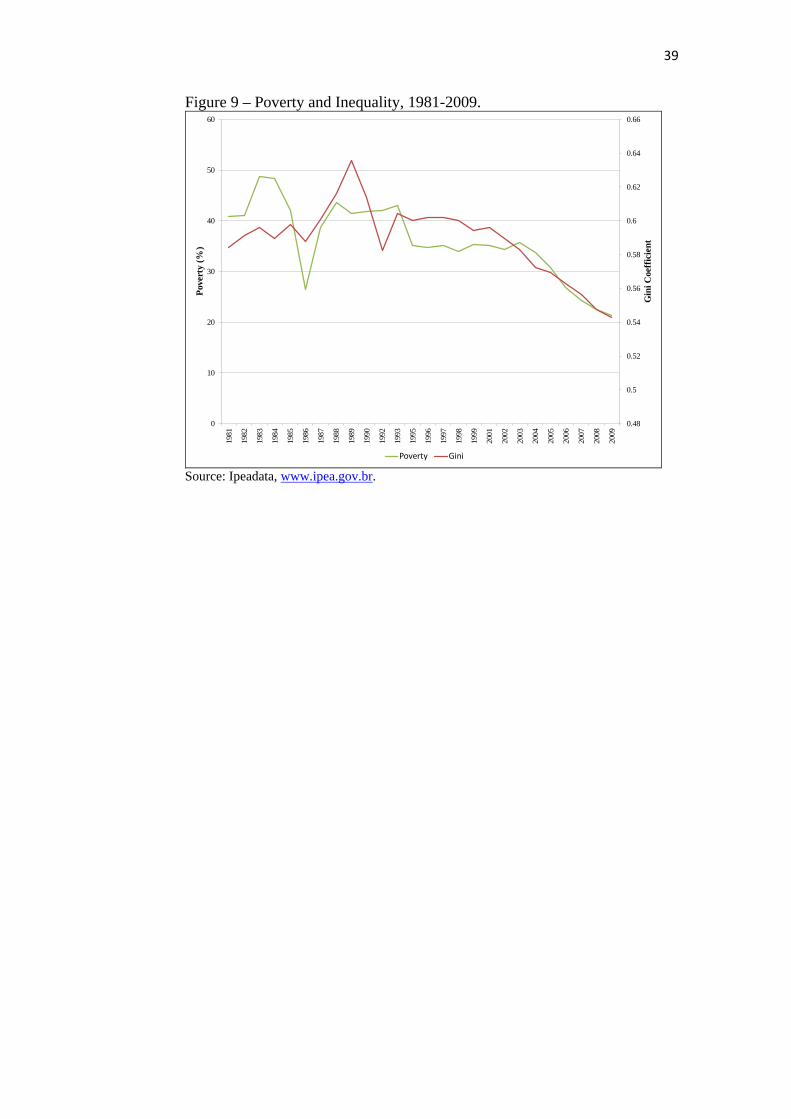
39
Figure 9 – Poverty and Inequality, 1981-2009.
0.48
0.5
0.52
0.54
0.56
0.58
0.6
0.62
0.64
0.66
0
10
20
30
40
50
60
1981
1982
1983
1984
1985
1986
1987
1988
1989
1990
1992
1993
1995
1996
1997
1998
1999
2001
2002
2003
2004
2005
2006
2007
2008
2009
Gin
i Coe
ffic
ient
Pove
rty
(%)
Poverty Gini
Source: Ipeadata, www.ipea.gov.br.
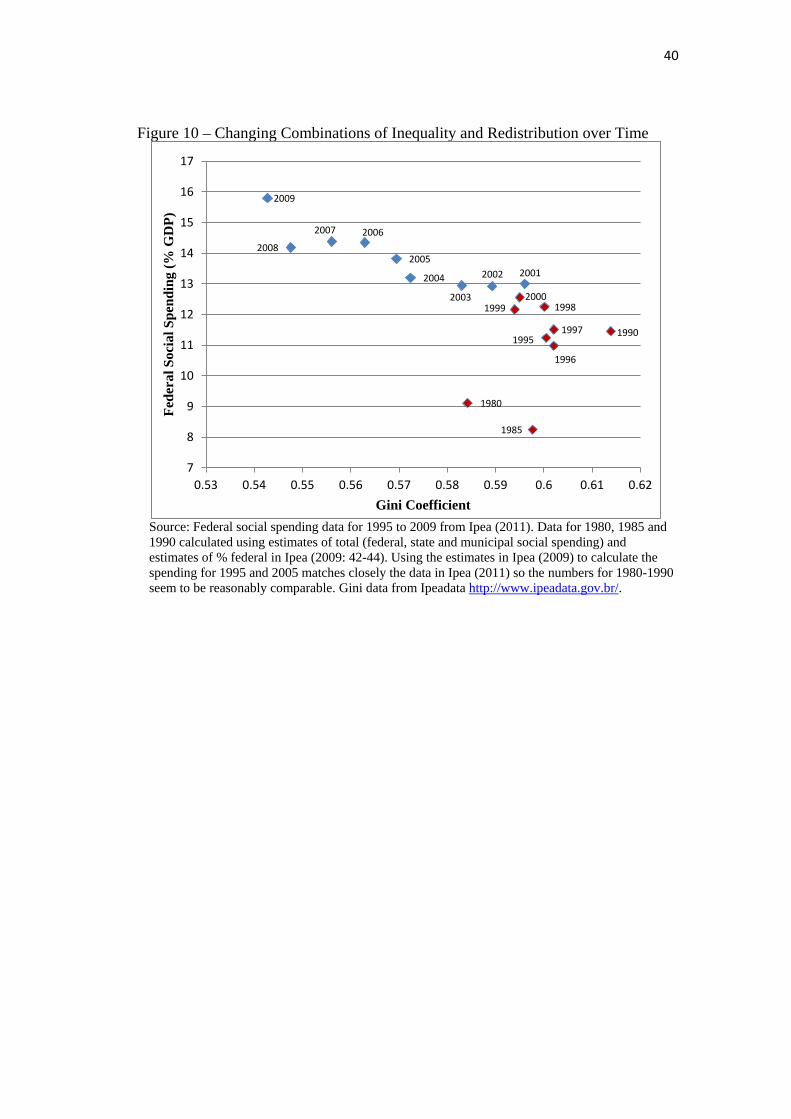
40
Figure 10 – Changing Combinations of Inequality and Redistribution over Time
Source: Federal social spending data for 1995 to 2009 from Ipea (2011). Data for 1980, 1985 and 1990 calculated using estimates of total (federal, state and municipal social spending) and estimates of % federal in Ipea (2009: 42-44). Using the estimates in Ipea (2009) to calculate the spending for 1995 and 2005 matches closely the data in Ipea (2011) so the numbers for 1980-1990 seem to be reasonably comparable. Gini data from Ipeadata http://www.ipeadata.gov.br/.
1990
1980
1985
1995
1996
1997
1998 1999 2000
2001 2002
2003
2004
2005
2006 2007
2008
2009
7
8
9
10
11
12
13
14
15
16
17
0.53 0.54 0.55 0.56 0.57 0.58 0.59 0.6 0.61 0.62
Fede
ral S
ocia
l Spe
ndin
g (%
GD
P)
Gini Coefficient
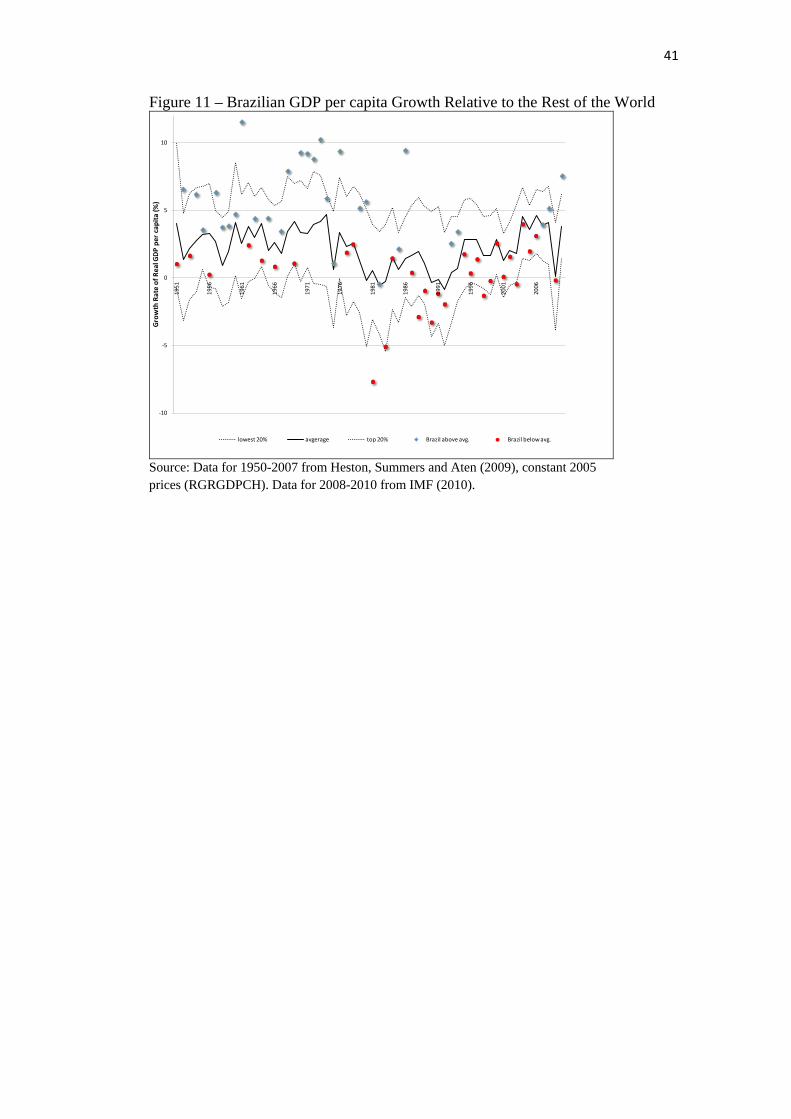
41
Figure 11 – Brazilian GDP per capita Growth Relative to the Rest of the World
-10
-5
0
5
10
1951
1956
1961
1966
1971
1976
1981
1986
1991
1996
2001
2006
Grow
th R
ate
of R
eal G
DP p
er c
apita
(%)
lowest 20% avgerage top 20% Brazil above avg. Brazil below avg.
Source: Data for 1950-2007 from Heston, Summers and Aten (2009), constant 2005 prices (RGRGDPCH). Data for 2008-2010 from IMF (2010).
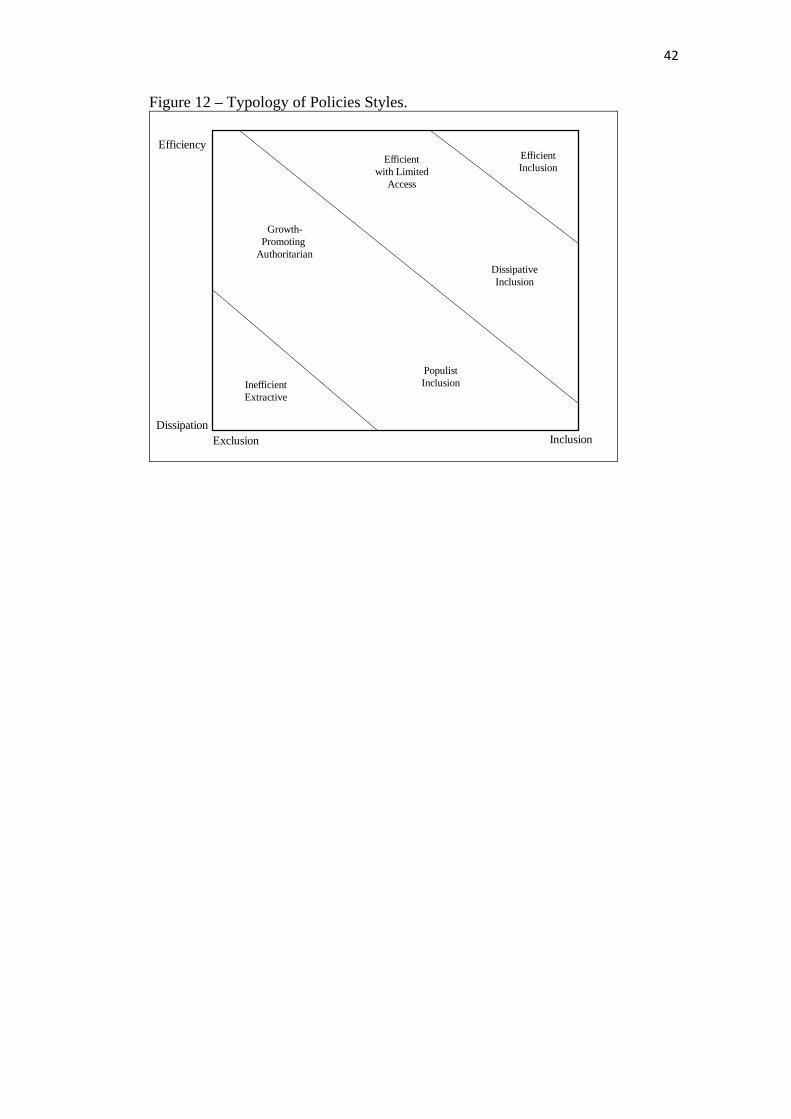
42
Figure 12 – Typology of Policies Styles.
Exclusion
PopulistInclusion
Efficiency
DissipationInclusion
InefficientExtractive
DissipativeInclusion
EfficientInclusion
Growth-Promoting
Authoritarian
Efficientwith Limited
Access


![Dissipative Homogenised Reinforced Concrete (DHRC)[]](https://img.pdfslide.net/doc/110x75/61e0a07b2cc22c22a2631590/dissipative-homogenised-reinforced-concrete-dhrc.jpg)