Embed Size (px)
Citation preview

Changing with the Times: Adapting Fundraisingto a New United States

Getting Acquainted

Common Cultures: The War Generation
• Old Blue Eyes• The Crash• The Dust Bowl• December 7th
• The Big One• VJ and VE Days

continued…
• “Loose Lips Sink Ships” and “Nothing to fear
but fear itself” • “Pennsylvania 65000” and “I’ll Never Smile Again” • “The Shadow Knows” • “Fibber McGee’s Closet”• Burma Shave

Common Cultures: Boomers
• “Call for Philip Morris”, “The Beev” and “The
Brady Bunch”• Cuban Crisis and Cold War• Iron Curtain and Berlin Wall• British Invasion and Lunar Landing• Kennedy and King

continued…
• “Kent State and Watergate• Selma and Vietnam• “Duck and Cover” • Stagflation and Gas Lines• 8 Tracks and Vinyl

What are your Generation’sCultural Touchstones?
• Hit songs or Top Recording Artists• Popular Movies, TV shows or Stars• Major Political Events• Defining Moments

Forever Young

Forever Young
America has always been a magnet for immigration. And those who move here rarely leave, creating two interesting dynamics: an aging “Majority” population and a growing population of “Minority” newcomers. Eventually, wealth often changes hands.

The “Grecian Formula” Effect
As historical Majority populations enjoy a
greater share of national wealth and income, birth
rates decline and the median age rises. In
contrast, newly arrived populations tend to
expand with higher birth rates. The net result is that the United States is
not growing as old as fast as other developed
and developing economies with more limited immigration.

Who’s Expecting?
Percentage of U.S. children ages 0–17 by race and Latino origin, 1980–2003 and projected 2004–2020

The Immigration Factor
Top 10 Leading Sources of U.S. Immigration
Country 2000 2010
Canada 678,000 920,000
China 1,391,000 1,900,000
Cuba 952,000 1,100,000
Dominican Republic 692,000 941,000
El Salvador 765,000 1,100,000
India 1,007,000 1,600,000
Korea 701,000 880,000
Mexico 7,841,000 9,600,000
Philippines 1,222,000 1,700,000
Ireland 863,000 1,200,000
Total Population from Top 10 16,112,000 21,741,000
Total Foreign Born 31,100,000 40,500,000
Total US Population 281,000,000 308,936,000
% of Foreign Born in Total US Population 11.07% 13.11%
(Source: 2000 U.S. Census; 2004 Yearbook of Immigration; Wikipedia)

Comparison and Prediction
Portrait of Kids in the USA Served by Boys and Girls Clubs
USA % Clubs %% Served by
Clubs
Total # of Children
53,200,000 100%
4,600,000 100% 8.65%
White (non-Latino)
30,856,000 58%
1,656,000 36% 5.37%
African American
7,980,000 15%
1,426,000 31% 17.87%
Latino
10,640,000 20%
966,000 21% 9.08%
Asian
2,128,000 4%
138,000 3% 6.48%
All Others
2,660,000 5%
414,000 9% 15.56%

continued…
If wealth and demographic trends continue, local Boys and Girls Clubs will find themselves serving diminishing percentages of Caucasian and African American children and providing programs to increasing percentages of Latino, Asian and multi-racial children in the years ahead. Should we therefore be adjusting our fundraising markets and practices?

Winnebago Land Rush
At the same time, aging boomers—especially white males—are still a dominant force in contemporary philanthropy. They are living longer, and acting younger, than any prior US population. And they are inheriting and preparing to transfer $41 trillion over the next few decades! Should we adjust our strategy for this wealthy market?

Which Way Do We Go?
I shall be telling this with a sighSomewhere ages and ages hence: Two roads diverged in a wood, and I— I took the one less traveled by, And that has made all the difference.- “The Road Not Taken”, Robert Frost

The Next US Landscape

Living Generations
• Silent Generation (1925 – 1942)• Baby Boomers (1945 – 1960)• Generation X (1961 – 1981)
(Source: www.garamchai.com)

continued…
•Generation Y (1982 – today)• 70.4 million people ages 5 – 22• 26% of the U.S. population• 3 times the size of Generation X• 1/3 is non-white• 90% of children under 12 have friends of a different ethnicity than their own
(Source: www.garamchai.com)

Age and Diversity
The minority population will account for nearly 90 percent of the total US population growth between 1995 and 2050.
Minority population will surpass the non-Latino White population after 2050.

continued…
Minority population aged 5 and under will exceed non-Minority by 2030. By 2050, there will be 18 million more Minority persons under age 35 than non-Minority persons of the same age.
By 2015, there will be more elderly than youth among non-Latino Whites and more youth than elderly among all minority groups.

Challenges to Fundraising

Percentage Who Give
Source: “Charitable Giving: How Much, by Whom, to What, and How?”, Havens, O’Herlihy and Schervish, Social Welfare Research Institute

The Problem for Philanthropy of Changing Demographics
“If formal philanthropy is something that whites are involved in more than members of other ethnicities, what are the implications for nonprofits in a country where…whites will increasingly constitute a minority of the population in many cities and states across the country? The impact on nonprofits can be reduced if they manage to suitably engage donors of diverse cultures.”
-Havens, O’Herlihy and Schervish in “Charitable Giving: How Much, by Whom, to What, and How?”

The Solution: “The Power of the Ask”
• The Independent Sector considers the “power of the ask” as one of the strongest motivators of charitable giving.• 67% of Latino households and 68% of African American households said they had not volunteered or given because they were not asked.
(Sources: Independent Sector; Social Welfare Research Institute;
Giving and Volunteering in California)

continued…
• Personal networks are keenly important since much of Minority giving is through informal channels. In fact, when both are combined, differences in charitable giving between whites and other ethnicities disappear.
(Sources: Independent Sector; Social Welfare Research Institute; Giving and Volunteering in California)

Market Breakdown

“Money follows involvement”
Alexander, G. D. and Carlson, K: Essential Principles for Fundraising Success (Jossey-Bass, September 2005)

Exploring the Markets
• Wealth and Income
• Age
Focus on Seniors and Boomers• Gender
Focus on Women• Ethnicity
Focus on Latinos, African Americans and Asians

Wealth at the Top
• There were about 7.3 million individuals in the
United States with gross assets of $675,000 or
more in 2001.
• These individuals represented about 3.5%
of the total U.S. adult population.

continued… • Top wealth holders had a combined net worth
of over 13.8 trillion, 32.7% of total US net worth.
• There are only 70,000 Ultra High Net Worth
individuals with assets over 30 million on the
planet, approximately ¼ of whom live in the U.S.
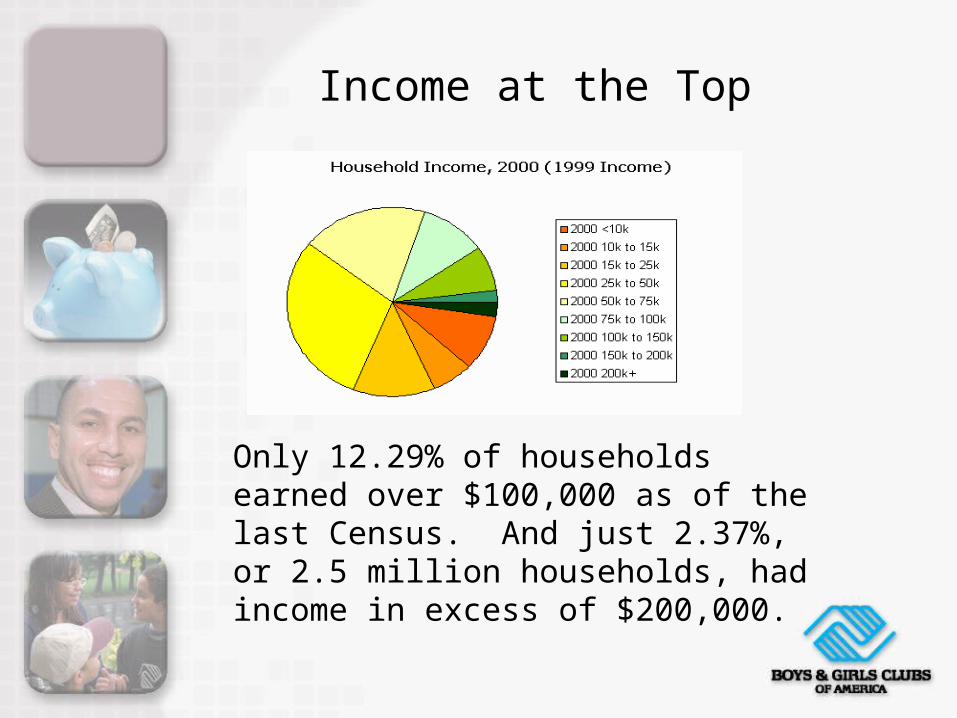
Income at the Top
Only 12.29% of households earned over $100,000 as of the last Census. And just 2.37%, or 2.5 million households, had income in excess of $200,000.

Giving by the Wealthy
The richest 5 percent of households (those with an adjusted gross income of $140,000 or more) contribute 40 percent or $61 billion of the $152 billion a year given by individuals.

continued…
And the top 1% contributed 22% of charitable dollars.
The 2 percent of estates valued at $3 million or more made 75 percent or $12 billion of the $16 billion in charitable bequests.

Areas of Charitable Interest for the Wealthy
Growing Older
• Approximately 35 million US citizens are age
65 or older. Three in five people in this age
group are women.
• Over the next forty years, the number of people
age 65 and older is expected to double and
the number of people age 85 and older is
expected to triple.

continued…
• Along with general trends for the US population,
minority populations are living longer, getting
older, and becoming more racially diverse.
• The percentage of older persons, who now
comprise over 16 %of the older population, is
expected to grow to 22% by 2020.

Boomers in the Batter Box
• 26.8% of the US population—80 million people—was born during the baby boom.
• 51% of boomers are women.
• 16.9% of boomers are people of color.
• Boomers age 45 to 54 have the highest average household income ($68,028 before taxes) of any age group.
(Source: www.civicventures.org)

Voluntarism by the Aging
• Volunteers over 65 devote double the amount
of time to community activities of any other age
group.
• “Participation of seniors in volunteering could
be expanded substantially if more were asked
to volunteer or were offered an incentive to serve.”
(Source: Civic Ventures)

Voluntarism by the Aging
• Just 17 percent of adults age 55 and over who
were not directly asked to volunteer did so
on their own.
• 83% of those who were asked to volunteer did
so—more than four times the number who had
to approach organizations uninvited.
(Source: Civic Ventures)

Women in the Economy
Forty percent of privately held U.S. firms areowned or controlled by women.
In addition, women’s businesses:• Grew at twice the pace of all other firms between 1997 and 2004• Create jobs at twice the rate of all other firms• Grow faster than all other firms• Are more likely than others to stay in business.
(Source: How She Does It, Margaret Heffernan)

continued…
And women of color do even better! Their businesses are four times as likely to stay in
business as any other!
(Source: How She Does It, Margaret Heffernan)

Why Women Give
• Altruism, accompanied by a sense of self empowerment
• Being part of a larger community.
• Finding like-minded people—meeting others who share interests and values.
• Participating in the process and watching a project unfold.
(Source: Forum of Regional Association of Grantmakers)

How Women Give
• To fewer charities• Different charities than their husbands• Based upon their values not loyalty to “his causes”• Through giving clubs/circles

Latino Wealth & Income
• The number of Latino households with incomes of over $100,000 rose 137% between 1990 & 2000
• The net worth of U.S. Latinos increased 30% since 1998, exceeding $534 billion in 2000
• 1 out of every 10 small businesses will be Latino by this year
(Sources: U.S. Census Bureau; Hispanic Trends; Small Business Administration; HispanTelligence®)

Latino Wealth & Income
• There are approximately 2 million Latino-owned businesses generating nearly $300 billion in annual gross receipts. That is expected to rise to 3.2 million firms with over $465 billion by the end of the decade.
• The number of Latino-owned companies grew 82% since 1997
(Sources: U.S. Census Bureau; Hispanic Trends; Small Business Administration; HispanTelligence®)

Documented giving dating back to the 1700s, responsible for the creation of the African Methodist Episcopal Church (1800), the Tuskegee Institute (1860), the Urban League (1910) and many other venerable organizations.
The following chart highlights community giving priorities:
African American Philanthropy
Source: Communities of Color: Engaging in Philanthropic Activities”, W.K. Kellogg Foundation, 2002

African American Generosity
• According to an analysis of IRS records by the Chronicle of Philanthropy, African Americans with $50,000+ income give a higher percentage of discretionary income than most Americans.
• Most African Americans give to multiple causes and most giving is local (79%).
Source: Communities of Color: Engaging in Philanthropic Activities”, W.K. Kellogg Foundation, 2002

Key Features of African American Philanthropy
• Studies show that African American philanthropy occurs most often in the context of religious organizations.
• The urge to give back is a significant motivation among African American donors.
Source: “Engaging Communities of Color”, WS & Associates, LLC and “Communities of Color: Engaging in Philanthropic Activities”, W.K. Kellogg Foundation, 2002

continued…
• African American donors seem to prefer to give in interpersonal contexts.
• African American donors seem to forgo endowment building in favor of donating time and money to assist with more immediate community needs.
Source: “Engaging Communities of Color”, WS & Associates, LLC and “Communities of Color: Engaging in Philanthropic Activities”, W.K. Kellogg Foundation, 2002

Key Features of Asian
American Philanthropy
According to Jessica Chao, “Within Asian America, the most vibrant, broad-based traditions of giving and volunteering are the informal and indigenous forms practiced in various immigrant communities. American-style philanthropy, with its custom of giving discrete gifts of money to nonprofits in return for tax deductions and recognition beyond the Asian-American community, is a relatively new concept for Asian Americans.”
Source: Asian American Philanthropy: Expanding Circles of Participation, Jessica Chao, 2003

continued… She also notes that:
• Asian-American philanthropic practices vary widely reflecting the diversity of the population itself;
• Donor characteristics depend on both generation and country of origin; and,
• Successful fundraising efforts require a personal touch, including “asks” made by a prestigious member of the community or family.
Source: Asian American Philanthropy: Expanding Circles of Participation, Jessica Chao, 2003

Building an Action Plan

Engaging the New Community
“Engaging communities of color in the philanthropy and volunteerism field is more challenging than engaging women or youth, for several reasons. First communities of color tend to give informally. Formal and structured programs or initiatives engaging communities of color are not directly suited to their philanthropic and volunteering practices…
Source: “Engaging Communities of Color”, WS & Associates, LLC and “Communities of Color: Engaging in Philanthropic Activities”, W.K. Kellogg Foundation, 2002

continued…
Second, communities of color have rich giving and sharing cultures that are somewhat difference from the mainstream. In order for a philanthropy and volunteerism initiative to work effectively in communities of color, the initiative must be integrated with those communities’ cultures…”
Source: “Engaging Communities of Color”, WS & Associates, LLC and “Communities of Color: Engaging in Philanthropic Activities”, W.K. Kellogg Foundation, 2002