Embed Size (px)
Citation preview

To get to school each
morning, imagine you are
driven along Smith Street
and pass through an
intersection controlled by
traffic lights. The traffic light
for this direction has a cycle
of green and amber for a
total of 40 seconds, then red
for 20 seconds. What is the
chance that the traffic light
will be red as you approach
the intersection? What is the
chance that the traffic light
will be red every morning
for a school week?
In this chapter, we look
at both experimental and
theoretical probabilities
and how we can use these to
estimate or forecast how
often something may occur
in the long run.
13Probability

618 M a t h s Q u e s t 8 f o r V i c t o r i a
READY?areyou
Are you ready?Try the questions below. If you have difficulty with any of them, extra help can be
obtained by completing the matching SkillSHEET. Either click on the SkillSHEET icon
next to the question on the Maths Quest 8 CD-ROM or ask your teacher for a copy.
Understanding chance words
1 For each of the following events, specify whether the chance of the event occurring is certain,
fifty–fifty or impossible.
a Two dice are rolled and a total of 14 is obtained.
b A coin is tossed and it lands on Tails.
c The month of July will follow June.
d The maximum temperature on a summer’s day in Melbourne will be less than 0°C.
e A fair die is rolled and a number less than 4 is obtained.
Understanding a deck of playing cards
2 For a standard deck of 52 playing cards, state the number of:
a red cards b jacks
c black queens d kings of diamonds
e eights f number of cards with face value greater than 7.
Simplifying fractions
3 Simplify each of the following fractions.
a b c d
Converting a fraction into a decimal
4 Convert the following fractions into decimals.
a b c d
Converting a fraction into a percentage
5 Convert the following fractions into percentages.
a b c d
Multiplying a fraction by a whole number
6 Calculate each of the following.
a × 20 b × 99 c × 35 d × 96
Listing the sample space
7 List the sample space (possible outcomes) for each of the following.
a Rolling a die b Tossing a coin
c Spinning a circular spinner numbered from 1 to 5
Multiplying proper fractions
8 Calculate each of the following.
a × b × c × d ×
13.1
13.113.113.2
13.4
4
8---
12
15------
36
100---------
5
20------
13.5
1
5---
3
4---
3
10------
17
20------
13.6
1
4---
3
5---
7
10------
7
20------
13.7
4
5---
8
11------
3
10------
1
6---
13.8
13.10
4
7---
3
8---
1
3---
8
9---
5
8---
7
15------
6
13------
4
9---

C h a p t e r 1 3 P r o b a b i l i t y 619
Probability scaleWe mentally calculate probability all the time as we make decisions as trivial as
whether to buy sweets or not and important decisions about health, safety, friendships
and careers.
Probability is defined as the chance of an event occurring. The concept of probability
was first developed when a gambler inquired about the chance of a particular outcome
occurring in a dice game. Today, it is used extensively in areas such as business, sports,
determining insurance premiums and marketing, predicting future trends or the likeli-
hood of inheriting a genetic disease.
Each day we estimate the probability of something occurring. We make forecasts or
educated guesses to try to predict outcomes. Mathematicians assign a value from 0 to 1
(inclusive) to the probability of an event occurring as shown by the following
probability scale.
A probability of 0 implies that the chance of an event occurring is impossible; that is,
there is no chance it will happen. A probability of 1 implies that the chance of an event
occurring is certain; that is, there is every chance it will happen. Probabilities may be
written as fractions, decimals or percentages.
Impossible
Highlyunlikely
Veryunlikely
Unlikely
Verylikely
Certain
Highlylikely
Less thaneven chance
Evenchance
Better thaneven chance
Likely
0 0.1 0.2 0.3 0.4 0.5
50%
0.6 0.7 0.8 0.9 1
0% 100%

620 M a t h s Q u e s t 8 f o r V i c t o r i a
It is important to note that the responses for particular situations, such as part c in
worked example 1, are not always straightforward and may differ for each individual. A
careful analysis of each event is required before making any predictions about their
future occurrences.
Describe the probability of each of the following events occurring, using a term from this list.
impossible highly unlikely very unlikely
less than even chance even chance
better than even chance very likely
highly likely certain
a February follows January.
b You draw the queen of diamonds from a
standard deck of playing cards.
c You will compete in gymnastics at the
Olympics.
d You roll a standard die and obtain
an even number.
e Every VCE student will
obtain an ENTER score
of 99.95%.
THINK WRITE
a Read the statement and associate the
likelihood of the event occurring with
one of the given words from the list.
Note: Provide reasoning.
a This is a true statement. February always
follows January.
Answer the question. It is certain this event will occur.
b Repeat steps 1 and 2 of part a. b In a standard deck of 52 playing cards there
is only one queen of diamonds. Thus, you
have an extremely slim chance of drawing
this particular card.
It is highly unlikely this event will occur.
c Repeat steps 1 and 2 of part a. c The chance of a person competing in the
Olympics is very small. However, it could
happen.
It is very unlikely this event will occur.
d Repeat steps 1 and 2 of part a. d There are six possible outcomes when
rolling a die, each of which are equally
likely. Three of the outcomes are even while
three are odd.
There is an even chance this event will occur.
e Repeat steps 1 and 2 of part a. e Due to each student having different
capabilities and the number of students
involved, this situation could never occur.
It is impossible that this event will occur.
1
2
1WORKEDExample

C h a p t e r 1 3 P r o b a b i l i t y 621
Assign a fraction to represent the
estimated probability of each of
the following events occurring:
a a high tide will be followed by
a low tide
b everyone in the class will agree
on every matter this year
c a tossed coin lands Heads
d a standard die is rolled and the
number 5 appears uppermost
e one of your 15 tickets in a
20-ticket raffle will win.
THINK WRITE
a Determine the likelihood of an event
occurring, with reasoning.
a The tide pattern occurs daily; this event
seems certain.
Answer the question. The probability of this event occurring is
equal to 1.
b Repeat steps 1 and 2 of part a. b Total agreement among many people on
every subject over a long time is virtually
impossible.
The probability of this event occurring is
equal to 0.
c Repeat steps 1 and 2 of part a. c When tossing a coin there are two equally
likely outcomes, a head or a tail.
The probability of this event occurring is
equal to .
d Repeat steps 1 and 2 of part a. d When rolling a die there are six equally
likely outcomes: 1, 2, 3, 4, 5, 6.
The probability of this event occurring is
equal to .
e Repeat steps 1 and 2 of part a. e There are 15 chances out of 20 of winning.
The probability of this event occurring is
equal to , which when simplified is equal
to .
1
2
1
2---
1
6---
15
20------
3
4---
2WORKEDExample
1. Probability is defined as the chance of an event occurring.
2. Probabilities range from 0 (impossible, no chance) to 1 (certain, every chance)
inclusive.
3. Probabilities may be written as fractions, decimals or percentages.
remember

622 M a t h s Q u e s t 8 f o r V i c t o r i a
Probability scale
1 Describe the probability of each of the following events occurring using a term from
the list below.
impossible highly unlikely very unlikely
less than even chance even chance better than even chance
very likely highly likely certain
a The sun will set today.
b Every student in this class will score 100%
in the next mathematics exam.
c It will rain tomorrow.
d Your shoelace will break next time you tie
your shoes.
e Commercial TV stations will reduce time
devoted to ads.
f A comet will collide with Earth this year.
g The year 2020 will be a leap year.
h You roll a standard die and an 8 appears
uppermost.
i A tossed coin lands on its edge.
j World records will be broken at the next Olympics.
k You roll a standard die and an odd number appears uppermost.
l You draw the queen of hearts from a standard deck of playing cards.
m You draw a heart or diamond card from a standard deck of playing cards.
n One of your 11 tickets in a 20-ticket raffle will win.
o A red marble will be drawn from a bag containing 1 white marble and 9 red marbles.
p A red marble will be drawn from a bag containing 1 red and 9 white marbles.
2 Write two examples of events which are:
a impossible b certain c highly likely
d highly unlikely e equally likely (even chance).
3 Assign a fraction or decimal to represent the estimated probability of each of the
following events occurring.
a Heads appears uppermost when a coin is tossed.
b You draw a red marble from a bag containing 1 white and 9 red marbles.
c A standard die shows a 7 when rolled.
d You draw a yellow disk from a bag containing 8 yellow disks.
e The next baby in a family will be a boy.
f A standard die will show a 1 or a 2 when rolled.
g You draw the queen of hearts from a standard deck of playing cards.
h One of your 11 tickets in a 20-ticket raffle will win.
i A standard die will show a number less than or equal to 5 when rolled.
j You draw an ace from a standard deck of playing cards.
k A class captain will be elected from five candidates.
l You draw a king or queen card from a standard deck of playing cards.
m You spin a seven-sided spinner and obtain an odd number.
n Heads or Tails will show uppermost when a coin is tossed.
13A
SkillSH
EET 13.1
Understanding chance words
WORKED
Example
1
SkillSH
EET 13.2
Understanding a deck of playing cards
WORKED
Example
2

C h a p t e r 1 3 P r o b a b i l i t y 623
4
The word that best describes the probability for a standard die to show a prime number is:
5
The probability of Darwin experiencing a white Christmas this year is closest to:
Experimental probabilityBy observing what actually happens, we can calculate the chances of certain things
occurring. Experiments are performed to give data, which can then be used to forecast
the outcome of future similar events. Studying the frequency of an event (that is, the
number of times an event occurs) gives the clue.
The following are definitions of terms which will be used throughout the chapter.
An experiment that is performed in the same way each time is called a trial.
An outcome is a particular result of a trial.
A favourable outcome is one that we are looking for.
An event is the set of favourable outcomes in each trial.
The relative frequency of an event occurring is the chance of it happening
expressed as a fraction or decimal.
The rule for the relative frequency is: .
A impossible B very unlikely C even chance
D very likely E certain
A 1 B 0.75 C 0.5 D 0.25 E 0
multiple choice
multiple choice
Relative frequencyfrequency of an event
total number of trials-------------------------------------------------------=
The table at right shows the results of a fair coin
which was tossed 20 times. What are the relative
frequencies of:
a Heads? b Tails?
Continued over page
THINK WRITE
a Write the frequency of the number
of Heads and the total number of
trials; that is, tosses.
a Frequency of Heads = 8
Total number of tosses = 20
Write the rule for the relative
frequency.
Relative frequency =
Substitute the known values into
the rule.
Relative frequency of Heads =
Evaluate and simplify if possible. = (or 0.4)
Answer the question. The relative frequency of obtaining Heads is .
1
2frequency of a Head
total number of tosses----------------------------------------------------
38
20------
42
5---
52
5---
3WORKEDExampleEvent Frequency
HeadsTails
812
Total 20

624 M a t h s Q u e s t 8 f o r V i c t o r i a
THINK WRITE
b Write the frequency of the number
of Tails and the total number of
trials; that is, tosses.
b Frequency of Tails = 12
Total number of tosses = 20
Write the rule for the relative
frequency.
Relative frequency =
Substitute the known values into
the rule.
Relative frequency of Tails =
Evaluate and simplify if possible. = (or 0.6)
Answer the question. The relative frequency of obtaining Tails is .
1
2frequency of Tails
total number of tosses----------------------------------------------------
312
20------
43
5---
53
5---
Forty people picked at random were asked where
they were born. The results were coded as follows:
Place of birth
1. Melbourne 2. Elsewhere in Victoria
3. Interstate 4. Overseas.
Responses
1, 3, 2, 1, 1, 4, 3, 1, 2, 1, 2, 1, 3, 4, 1, 2, 3, 1, 3, 4,
4, 3, 2, 1, 2, 3, 1, 4, 1, 2, 3, 4, 1, 2, 3, 1, 1, 4, 2, 3
a Organise the data into a frequency table.
b Find the relative frequency of each category as a fraction and a decimal.
c What is the total of the relative frequencies?
d Where is a person selected at random most likely to have been born?
e How many people out of 100 would you expect to be born overseas?
THINK WRITE
a Draw a table with 3 columns. The
column headings are in order, Score,
Tally, and Frequency.
a
Enter the codes 1, 2, 3 and 4 into the
score column.
Place a stroke into the tally column
each time a code is recorded.
Note: | | | | represents a score of five.
Count the number of strokes
corresponding to each code and
record in the frequency column.
Add the total of the frequency
column.
1Score
Total
Tally Frequency
Code 1
Code 2
Code 3
Code 4
14
9
10
7
40
2
3
4
5
4WORKEDExample

C h a p t e r 1 3 P r o b a b i l i t y 625
Continued over page
THINK WRITE
b Write the rule for the relative
frequency.
b Relative frequency =
Substitute the known values into the
rule for each category.
Evaluate and simplify where
possible.
Category 1: People born in Melbourne
Relative frequency =
= or 0.35
Category 2: People born elsewhere in
Victoria
Relative frequency = or 0.255
Category 3: People born interstate
Relative frequency =
= or 0.25
Category 4: People born overseas
Relative frequency = or 0.175
c Add each of the relative frequency
values.
c Total = + + +
= 0.35 + 0.225 + 0.25 + 0.175
= 1
Answer the question. The relative frequencies sum to a total of 1.
d Using the results from part b, obtain
the code which corresponds to the
largest frequency.
Note: A person selected at random is
most likely to have been born in the
place with the largest frequency.
d Melbourne (Code 1) corresponds to the
largest frequency.
Answer the question. A person selected at random is most likely to
have been born in Melbourne.
e Write the relative frequency of
people born overseas and the number
of people in the sample.
e Relative frequency (overseas) =
Number of people in the sample = 100
Write the rule for the expected
number of people.
Note: Of the 100 people, or 0.175
would be expected to be born
overseas.
Expected number = relative frequency
× number of people
1frequency of category
total number of people------------------------------------------------------
2
3
14
40------
7
20------
9
40------
10
40------
1
4---
7
40------
17
20------
9
40------
1
4---
7
40------
2
1
2
17
40------
2
7
40------

626 M a t h s Q u e s t 8 f o r V i c t o r i a
Experimental probability
1 The table at right shows the results of
tossing a fair coin 150 times. What are the
relative frequencies of:
a Heads? b Tails?
2 A fair coin was tossed 300 times. A Head
came up 156 times.
a Find the relative frequency of the Head outcome as a fraction.
b Calculate the relative frequency of Tails as a decimal.
3 A die is thrown 50 times, with 6 as the favourable outcome. The 6 came up 7 times.
Find the relative frequency of:
a a 6 occurring
b a number that is not a 6 (that is, any number other than a 6) occurring.
4 A spinner with 3 equal sectors, as shown at right, was
spun 80 times, with results as shown in the table:
a What fraction of the spins resulted in a 3?
b What fraction of the spins resulted in a 2?
c Express the relative frequency of the spins which resulted in a 1 as a decimal.
Score 1 2 3
Frequency 29 26 25
Substitute the known values into the rule. Expected number = × 100
=
Evaluate. = 17.5
Round the value to the nearest whole number.
Note: We are dealing with people. Therefore,
the answer must be represented by a whole
number.
≈ 18
Answer the question. We would expect 18 of the 100 people
to be born overseas.
37
40------
700
40---------
4
5
6
1. Relative frequency =
2. The total sum of the relative frequencies in an experiment is equal to 1.
3. Expected frequency = relative frequency × the number in the sample
frequency of an event
total number of trials----------------------------------------------------
remember
13B
SkillSH
EET 13.4
Simplifying fractions
SkillSH
EET 13.3
Forming fractions
SkillSH
EET 13.5
Converting a fraction into a decimal
WORKED
Example
3
Event Frequency
HeadsTails
8466
Total 150
1
2
3

C h a p t e r 1 3 P r o b a b i l i t y 627
5 A die was rolled 200 times and the results recorded in the table below.
a Name the outcomes that make up each of the following events:
i an even number ii a number less than 3
iii a number ≥ 3 iv a prime number
v a number > 6 vi the number 5 or more
vii a non-prime number viii the number 4 or less
ix a multiple of three x a number which is divisible by 5.
b Express the relative frequency of each of the face numbers as a percentage.
c What percentage of outcomes turned out to be even?
d What was the relative frequency of non-prime numbers, as a percentage?
e What was the relative frequency of numbers divisible by 5, as a percentage?
f What was the relative frequency of numbers greater than or equal to (≥) 3, as a
percentage?
g What was the relative frequency of odd numbers, as a percentage?
h What was the relative frequency of numbers which are multiples of 3, as a
percentage?
i What was the relative frequency of numbers that are 5 or greater, as a percentage?
j What was the relative frequency of numbers that are 2 or less, as a percentage?
6 The following table shows the progressive results of a coin-tossing experiment.
a What do you notice about the relative frequencies for each trial?
b If we were to repeat the same experiment in the same way, would the results
necessarily be identical to those in the table? Explain your answer.
7 100 people picked at random were asked which Olympic event they would most like
to see. The results were coded as follows:
1. Swimming 2. Athletics 3. Gymnastics 4. Rowing.
The recorded scores were:
1, 1, 4, 3, 2, 2, 2, 4, 4, 3, 1, 1, 4, 2, 1, 1, 1, 4, 2, 2, 1, 3, 3, 3, 4, 1, 1, 3, 2, 2, 1, 2, 1, 1,
1, 1, 2, 3, 3, 3, 3, 2, 2, 4, 1, 1, 1, 3, 2, 2, 4, 1, 1, 1, 3, 3, 3, 3, 2, 1, 2, 2, 2, 2, 3, 4, 4, 1,
1, 1, 2, 3, 3, 2, 1, 4, 3, 2, 3, 1, 1, 2, 4, 1, 1, 3, 2, 2, 3, 3, 4, 4, 2, 1, 1, 3, 1, 2, 4, 1.
a Organise the data into a frequency table.
b Find the relative frequency of each category as a fraction and a decimal.
c What is the total of the relative frequencies?
d Which Olympic event selected at random is most likely to be seen?
e How many people out of 850 would you expect to see the gymnastics?
Score 1 2 3 4 5 6
Frequency 30 34 35 32 35 34
Number of coin tosses
Outcome Relative frequency
Heads Tails Heads (%) Tails (%)
10 6 4 60 40
100 54 46 54 46
1000 496 504 49.6 50.4
SkillSHEET
13.6
Convertinga fraction
into apercentage
WORKED
Example
4
SkillSHEET
13.7
Multiplying afraction
by a wholenumber

628 M a t h s Q u e s t 8 f o r V i c t o r i a
8 The following are results of 20 trials conducted for an experiment involving the
5-sector spinner at right.
1, 4, 2, 5, 3, 4, 5, 3, 2, 5, 1, 3, 2, 4, 2, 1, 4, 3, 3, 2
a Organise the data into a frequency table.
b Find the relative frequency of each outcome.
c How many times would you have expected each
outcome to have appeared? How did you come to this
conclusion?
d Which was the most common outcome?
e What is the total of all the relative frequencies?
9 The square spinner at right was trialled 40 times and the results
of how it landed were recorded as shown below.
2, 4, 3, 1, 3, 2, 1, 4, 4, 3, 3, 1, 4, 2, 1, 2, 3, 1, 4, 2,
4, 2, 1, 2, 1, 3, 1, 4, 3, 1, 3, 1, 4, 2, 3, 1, 3, 2, 4, 4
a What would you expect the relative frequency of
each outcome to be?
b Organise the data into a frequency table and calculate the actual experimental
relative frequency of each number.
c Find the relative frequency of the event, odd number, from the table obtained in
part b.
d What outcomes make up the event, prime number?
Hint: Remember a prime number has exactly
2 factors: itself and 1.
e Calculate the relative frequency of
the event, prime number, from the table
obtained in part b.
10 When 60 light bulbs were tested, 3 were
found to be faulty.
a What was the relative frequency of
faulty bulbs?
b What fraction of the bulbs were not
faulty?
c In a carton of 600 such bulbs, how
many would you expect to be faulty?
11 A card is randomly (with no predictable pattern) drawn 60 times from a hand of 5 cards,
it is recorded, then returned and the five cards are reshuffled. The results are shown in
the frequency distribution table at right.
For each of the following, give:
i the favourable outcomes that make up the event
ii the relative frequency of these events.
a A heart b A diamond
c A red card d A 3
e A spade or a heart f A 3 or a queen
g The king of spades h A 3 or a diamond
1
2
3
4
5
1
4
32
3
Q
3
3
3
13
15
12
9
11
Card Frequency

C h a p t e r 1 3 P r o b a b i l i t y 629
12
Olga observed that, in 100 games of roulette,
red came up 45 times. Out of 20 games on
the same wheel, how many would she expect
to come up red?
13
A fair coin was tossed 40 times and it came
up Tails 18 times. The relative frequency of
Heads was:
1 Choose a word or words from the list to complete the sentence:
even chance, highly unlikely, very unlikely, certain, impossible, no chance.
The chance of winning first prize in Lotto is
2 Give 2 examples of events that are certain.
3 True or false? It is highly unlikely that you will find $500 today.
4 A coin is tossed. What is the probability of getting Heads?
5 A 6-sided die is rolled. What is the probability of getting a 5?
6 A fair coin is tossed 50 times. Tails comes up 30 times. Calculate the relative
frequency of Heads outcome as a decimal.
7 A die is rolled 60 times and the number 4 comes up 15 times. Find the relative
frequency of the outcome ‘not a 4’.
The following results of 20 trials of a die being rolled relate to questions 8 and 9.
2, 5, 1, 4, 2, 3, 1, 1, 5, 1, 3, 4, 2, 3, 3, 2, 6, 3, 3, 2.
8 Organise the data into a frequency table.
9 Find the relative frequency of a 3 being rolled.
10 The probability of an event is . What might the event be?
A 4.5 B C
D 9 E None of these
A B C
D E unable to be calculated
multiple choice
4
9---
9
4---
GAME time
Probability— 001
WorkS
HEET 13.1
multiple choice
9
11------
11
20------
9
20------
20
11------
1
2
3---

630 M a t h s Q u e s t 8 f o r V i c t o r i a
Sample spaces and theoretical probability
In the long run (that is, for a very large number of trials), the relative frequency of an
event will match its theoretical (or empirical) probability.
The theoretical probability of a particular event occurring is denoted by the symbol
Pr(event) and defined as the number of favourable outcomes divided by the number of
possible outcomes.
A sample space, S, is a list of all the possible outcomes (obtained from an
experiment) and enclosed in a pair of curled brackets, { }. Theoretical probability
uses sample spaces to work out chances.
The theoretical probability of an event is given by the rule:
Pr(event) =
It is important to note that the given rule gives an indication of what the probability is
likely to be, not what it will be.
The game Rock, paper, scissors is played all over the world, not just for fun but
also for settling disagreements.
The game uses the three different hand signs shown left.
Simultaneously, two players ‘pound’ the fist of one hand into the air three times.
On the third time each player displays one of the hand signs. Possible results are
shown below.
1 Play 20 rounds of Rock, paper, scissors with a partner. After each round, record
each player’s choice and the result in a table like the one shown below.
(Use R for rock, P for paper and S for scissors.)
2 Based on the results of your 20 rounds, what is the experimental probability of
a you winning? b your partner winning? c a tie?
3 Do you think playing Rock, Paper, Scissors is a fair way to settle a
disagreement? Explain.
COMMUNICATION Rock, paper, scissors
Rock
Paper
Scissors
Rock breaks scissors
Rock wins
Scissors cut paper
Scissors win
Paper covers rock
Paper wins
Round number Player 1 Player 2 Result
1 P R Player 1 wins
2 S R Player 2 wins
3 S S Tie
number of favourable outcomes
number of possible outcomes---------------------------------------------------------------------------------

C h a p t e r 1 3 P r o b a b i l i t y 631
A standard 6-sided die is rolled.
a List the sample space for this experiment.
b Determine the probability of obtaining the following appearing uppermost:
i 4 ii an odd number iii 5 or less.
THINK WRITE
a Write all the possible outcomes for the
given experiment.
a S = {1, 2, 3, 4, 5, 6}
b iii Write the number of possible
outcomes.
b iii Number of possible outcomes = 6
Write the number of favourable
outcomes.
Note: The favourable outcome is 4.
Number of favourable outcomes = 1
Write the rule for probability. Pr(event) =
Substitute the known values into
the rule and evaluate.
Pr(4) =
Answer the question. The probability of 4 appearing
uppermost is .
b iii Write the number of possible
outcomes.
b iii Number of possible outcomes = 6
Write the number of favourable
outcomes. The favourable outcomes
are 1, 3, 5.
Number of favourable outcomes = 3
Write the rule for probability. Pr(event) =
Substitute the known values into
the rule.
Pr(odd number) =
Evaluate and simplify. =
Answer the question. The probability of an odd number
appearing uppermost is .
b iii Repeat steps 1 to 5 of part b i.
Note: 5 or less means the favourable
outcomes are 1, 2, 3, 4, 5. Therefore, the
number of favourable outcomes is 5.
b iii Number of possible outcomes = 6
Number of favourable outcomes = 5
Pr(5 or less) =
The probability of obtaining 5 or less is .
1
2
3number of favourable outcomes
number of possible outcomes----------------------------------------------------------------------------
41
6---
5
1
6---
1
2
3number of favourable outcomes
number of possible outcomes----------------------------------------------------------------------------
43
6---
51
2---
6
1
2---
5
6---
5
6---
5WORKEDExample

632 M a t h s Q u e s t 8 f o r V i c t o r i a
A card is drawn at random from a standard well-shuffled pack.
Find the probability of drawing:
a a club b a king or an ace c not a spade.
Express each answer as a fraction and as a percentage.
THINK WRITE
a Write the number of outcomes in the
sample space. There are 52 cards in
a pack.
a Number of possible outcomes = 52
Write the number of favourable
outcomes. There are 13 cards in each suit.
Number of favourable outcomes = 13
Write the rule for probability. Pr(event) =
Substitute the known values into the
rule and simplify.
Pr(a club) =
=
Convert the fraction to a percentage;
that is, multiply by 100%.
Percentage = × 100%
= %
= 25%
Answer the question. The probability of drawing a club is or 25%.
b Write the number of outcomes in the
sample space.
b Number of possible outcomes = 52
Write the number of favourable
outcomes. There are 4 kings and 4 aces.
Number of favourable outcomes = 8
Write the rule for probability. Pr(event) =
Substitute the known values into the
rule and simplify.
Pr(a king or an ace) =
=
Convert the fraction to a percentage,
rounded to one decimal place.
Percentage = × 100%
= %
≈ 15.4%
Answer the question. The probability of drawing a king or an ace
is or approximately 15.4%.
c Repeat steps 1 to 6 of part a.
Note: Not a spade means clubs,
hearts or diamonds. Therefore, the
number of favourable outcomes is 39.
c Number of possible outcomes = 52
Number of favourable outcomes = 39
Pr(not a spade) = =
Percentage = × 100% = = 75%
The probability of drawing a card which is
not a spade is or 75%.
1
2
3number of favourable outcomes
number of possible outcomes----------------------------------------------------------------------------
413
52------
1
4---
51
4---
100
4---------
61
4---
1
2
3number of favourable outcomes
number of possible outcomes----------------------------------------------------------------------------
48
52------
2
13------
52
13------
200
13---------
62
13------
1
39
52------
3
4---
3
4---
300
4---------
3
4---
6WORKEDExample
C h a p t e r 1 3 P r o b a b i l i t y 633
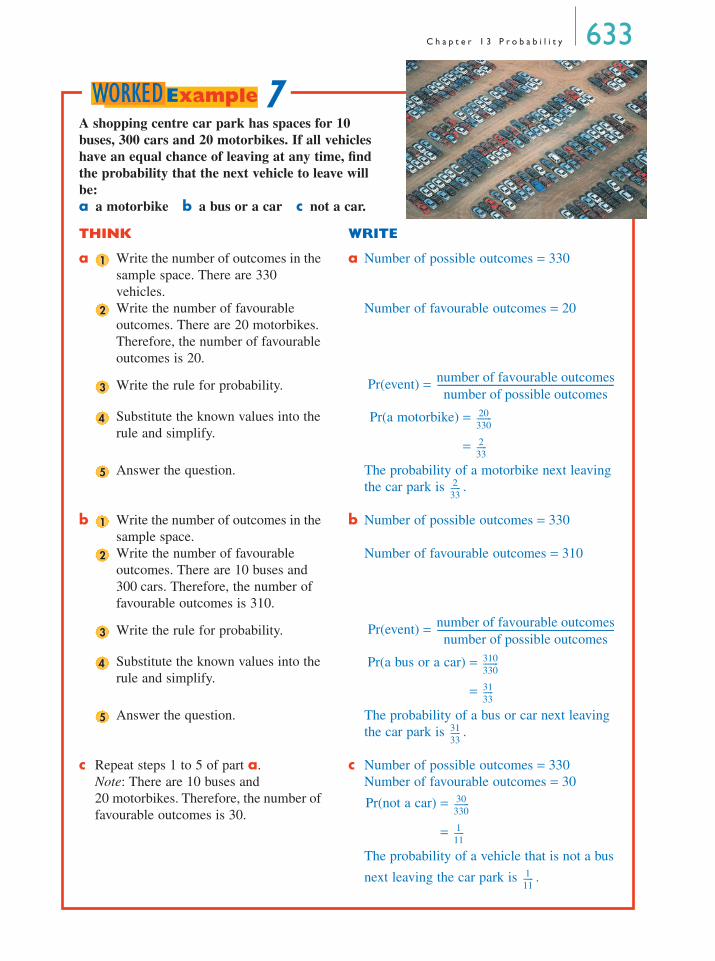
A shopping centre car park has spaces for 10
buses, 300 cars and 20 motorbikes. If all vehicles
have an equal chance of leaving at any time, find
the probability that the next vehicle to leave will
be:
a a motorbike b a bus or a car c not a car.
THINK WRITE
a Write the number of outcomes in the
sample space. There are 330
vehicles.
a Number of possible outcomes = 330
Write the number of favourable
outcomes. There are 20 motorbikes.
Therefore, the number of favourable
outcomes is 20.
Number of favourable outcomes = 20
Write the rule for probability. Pr(event) =
Substitute the known values into the
rule and simplify.
Pr(a motorbike) =
=
Answer the question. The probability of a motorbike next leaving
the car park is .
b Write the number of outcomes in the
sample space.
b Number of possible outcomes = 330
Write the number of favourable
outcomes. There are 10 buses and
300 cars. Therefore, the number of
favourable outcomes is 310.
Number of favourable outcomes = 310
Write the rule for probability. Pr(event) =
Substitute the known values into the
rule and simplify.
Pr(a bus or a car) =
=
Answer the question. The probability of a bus or car next leaving
the car park is .
c Repeat steps 1 to 5 of part a.
Note: There are 10 buses and
20 motorbikes. Therefore, the number of
favourable outcomes is 30.
c Number of possible outcomes = 330
Number of favourable outcomes = 30
Pr(not a car) =
=
The probability of a vehicle that is not a bus
next leaving the car park is .
1
2
3number of favourable outcomes
number of possible outcomes----------------------------------------------------------------------------
420
330---------
2
33------
52
33------
1
2
3number of favourable outcomes
number of possible outcomes----------------------------------------------------------------------------
4310
330---------
31
33------
531
33------
30
330---------
1
11------
1
11------
7WORKEDExample

634 M a t h s Q u e s t 8 f o r V i c t o r i a
1 What is the sample space for rolling a standard 6-sided die?
2 What is the sample space for rolling 2 standard 6-sided dice?
Hint: The answer is not 12.
3 Complete the following sample space for rolling two dice.
Note: Each colour in the table corresponds to the colour of the die.
4 Using the sample space, complete the following table.
5 Do you notice a pattern involving the probabilities in the table? Explain your
answer.
The pattern observed in question 5 relates to symmetry. Investigate the symmetry
property on tossing three coins.
6 List the sample space for tossing three coins.
7 Using the sample space obtained in question 6, complete the following table.
8 From the table above, which event is the probability of tossing three Tails the
same as?
9 By symmetry, which event has the same probability as tossing Heads twice and
Tails once?
Try these experiments.
10 By symmetry, list possible events that would have the same probabilities for
the sample space of rolling three standard 6-sided dice. (You don’t have to list
the whole sample space.)
11 By symmetry, list possible events that would the same probabilities when
tossing 4, 5 or 6 coins.
COMMUNICATION Symmetry of chance
Die 2
1 2 3 4 5 6
Die
1
1 (1, 1) (1, 2) (1, 3) (1, 4) (1, 5) (1, 6)
2
3
4
5
6
Sum 2 3 4 5 6 7 8 9 10 11 12
Probability
Number of Heads 0 1 2 3
Probability

C h a p t e r 1 3 P r o b a b i l i t y 635
COMMUNICATION In the long run —tossing a coin
Toss a coin 60 times and record whether it shows Heads (H)
or Tails (T) uppermost in a table like this.
Once your results have been recorded, obtain the frequency results from each
member of the class and add them together to obtain a total value for the class
frequency. This is called pooling your results. Determine the percentage relative
class frequency by using the rule given in the table below.
Now that both tables have been completed, answer the following questions.
1 Does a larger sample group alter the percentage results?
2 Are the class results closer to those predicted by theory?
3 Compare your own result with the class result. Which do you think would be more
reliable? Explain your answer.
4 Complete the following sentence:
In the long run the relative frequency of an event will .
Outcome Tally Frequency
% Relative frequency
( × 100%)Heads (H)
Tails (T)
frequency
60-------------------------
OutcomeClass
frequency
% Relative class frequency
( × 100%)Heads (H)
Tails (T)
class frequency
number of students 60¥
--------------------------------------------------------------

636 M a t h s Q u e s t 8 f o r V i c t o r i a
Sample spaces and theoretical probability
1 A standard 6-sided die is rolled.
a List the sample space for this experiment.
b Determine the probability of obtaining the following appearing uppermost:
i a 6 ii an even number
iii at most, 4 iv a 1 or a 2
v a prime number vi a number greater than 4
vii a 7 viii a number which is a factor of 60.
2 List the sample spaces for these experiments:
a tossing a coin
b selecting a vowel from the word ‘ASTRO-
NAUT’
c selecting a day of the week to go to the
movies
d drawing a marble from a bag containing 3
reds, 2 whites and 1 black
e rolling a standard 6-sided die
f drawing a picture card from a standard pack of
playing cards
g spinning an 8-sector circular spinner numbered
from 1 to 8
h selecting even numbers from the first 20 counting numbers
i selecting a piece of fruit from a bowl containing 2 apples, 4 pears, 4 oranges and
4 bananas
j selecting a magazine from a rack containing 3 Dolly, 2 Girlfriend, 1 Smash Hits
and 2 Mathsmag magazines.
k selecting the correct answer from the options A, B, C, D, E on a multiple-choice
test
l winning a medal at the Olympic games.
3 A card is drawn at random from a standard well-shuffled pack. Find the probability of
drawing:
a the king of spades b a 10
c a jack or a queen d a club
e a red card f an 8 or a diamond
g an ace.
Express each answer as a fraction and as a percentage.
1. A sample space, S, is a list of all the possible outcomes (obtained from an
experiment) and enclosed in a pair of curled brackets { }.
2. The theoretical probability of an event occurring is given by the rule:
Pr(event)number of favourable outcomes
number of possible outcomes----------------------------------------------------------------------------=
remember
13C
SkillSH
EET 13.8
Listing the sample space
WORKED
Example
5
WORKED
Example
6

C h a p t e r 1 3 P r o b a b i l i t y 637
4 A shopping centre car park has spaces for 8 buses, 160 cars and 12 motorbikes. If all
vehicles have an equal chance of leaving at any time, find the probability that the next
vehicle to leave will be:
a a bus b a car
c a motorbike or a bus d not a car.
5 A bag contains 3 red, 2 black, 1 pink, 2 yellow, 3 green and 3 blue marbles. If a
marble is drawn at random, calculate the chance that it is:
a red b black
c yellow d red or black
e not blue f red or black or green
g white h not pink.
6 A beetle drops onto one square of a
chessboard. What are its chances of
landing on a square which is:
a black?
b white?
c neither black nor white?
d either black or white?
7 What chance is there that the next
person you meet has his/her birthday:
a next Monday?
b sometime next week?
c in September?
d one day next year?
8 For each of the following spinners:
a b c d
i state whether each of the outcomes are equally likely. Explain your answer.
ii find the probability of the pointer stopping on 1.
9 Hanna flipped a coin 5 times and each time a Tail showed. What are the chances of
Tails showing on the sixth toss?
10 a Design a circular spinner coloured red, white, black, yellow and green so that each
colour is equally likely to result from any trial.
b What will be the angle between each sector in the spinner?
11 a Design a circular spinner with the numerals 1, 2 and 3 so that 3 is twice as likely
to occur as 2 or 1 in any trial.
b What will be the size of the angles in each sector at the centre of the spinner?
WORKED
Example
7
2 1
23
4 1
2
1 1
12
3
4
SkillSHEET
13.9
Calculatingthe angle
in a sectorgraph

638 M a t h s Q u e s t 8 f o r V i c t o r i a
12 a Design a circular spinner labelled A, B, C and D so that Pr(A) = , Pr(B) = ,
Pr(C) = , Pr(D) = .
b What will be the size of the angles between each sector in the spinner?
13 a What is the total of all the probabilities in question 12?
b What is the angle sum of the sectors in question 12?
14 a List all the outcomes for tossing a coin once, together with their individual
probabilities.
b Find the total.
15 a List all the outcomes for tossing a coin twice, together with their individual
probabilities.
b Find the total.
16 a List the probabilities for the elements of the sample space for rolling a 6-faced die.
b Find the total of the probabilities.
c Do the totals for questions 14b, 15b and 16b agree with that in 13a?
d What conclusion can you draw?
17
If a circular spinner has 3 sectors, A, B and C, such that Pr(A) = and Pr(B) = ,
then Pr(C) must be:
A B C
D E none of these
18
For an octagonal spinner with equal sectors, numbered from 1 to 8, the chance of
getting a number between (but not including) 5 and 8 is:
A B C
D E none of these
1
4---
1
3---
1
6---
1
4---
multiple choice
1
2---
1
3---
1
4---
2
5---
1
6---
5
6---
multiple choice
1
4---
1
2---
3
8---
5
8---
MA
TH
S Q
UEST
CHALL
EN
GE
CHALL
EN
GE
MA
TH
S Q
UEST
The targets shown are an equilateral triangle, a square and a circle with
coloured regions that are also formed from equilateral triangles, squares
and circles. If a randomly thrown dart hits each target, find the prob-
ability that the dart hits each target’s coloured region.
1 2 3

1�—�14
3�—�7
1�—�4
1�—�2
1�—�5
1�—�4
1�—�8
1�—�14
3�—�10
1�—�2
2�—�5
5�—�14
2�—�5
1�—�10
3�—�7
7�—�20
1�—�15
1�—�8
1�—�7
1�—�3
1�—�4
1�—�2
2�—�5
3�—�8
Calculate the probabilityof randomly selecting each of the
lettered items in each group tofind the puzzle code.
When I’m down in the dumps,I buy myself a new dress!
F
D
E
D E E E
E A D
A D D A
EPr (A) =___
Pr (H) =___ Pr (I) =___ Pr (M) =___
Pr (T) =___ Pr (U) =___ Pr (W) =___ Pr (Y) =___
Pr (D) =___
Pr (E) =___
Pr (F) =___
Pr (N) =___
Pr (O) =___
Pr (R) =___
Pr (S) =___
H M
I
H H
M M
H
O R
R
N
S
R
O R O
NO
R
O
O W W
TW
Y
U W T
W
UY
UU
U
T
WU
T
U
T
C h a p t e r 1 3 P r o b a b i l i t y 639

640 M a t h s Q u e s t 8 f o r V i c t o r i a
SimulationsOften a simple experiment,
such as rolling a die, tossing
a coin or drawing a card,
may be conducted to model
or imitate some real-life situ-
ation. This is called a simu-
lation. The outcomes of the
simulation can then be inves-
tigated easily on an experi-
mental basis.
Simulations occur in areas
such as business, engi-
neering, medical and scien-
tific research, problem-
solving activities and so on. They are carried out because the real-life situation being
imitated may be dangerous, impractical, too expensive or time consuming.
Simple experimental devices or technology can be used to simulate real-life
situations so that outcomes may be investigated on an experimental basis.
The following example illustrates how technology, in the form of a graphics calcu-
lator, can be used to simulate a real-life situation.
A married couple wants to continue having children until they have offspring of both
sexes. On average, how many children should they expect to have in order to reach this
goal?
a Design an experiment to simulate the situation and specify the device used to represent
the outcomes.
b Describe the experimental precautions necessary to ensure fair and accurate trials
when simulating real life.
THINK WRITE
a Determine the sample space.
Note: There are two possible
outcomes; that is, a girl or a boy,
both of which are equally likely.
a Sample space = {boy, girl}
The two events are equally likely.
Use technology to simulate the
outcomes.
Note: As there are only two
outcomes; the numbers 0 and 1 will
be generated using a graphics
calculator.
The numbers 0 and 1, randomly generated
by a graphics calculator, will simulate the
outcomes of childbirth. 0 will represent the
birth of a boy, and 1 will represent the birth
of a girl.
Obtaining 0 = boy (B).
Obtaining 1 = girl (G).
1
2
8WORKEDExample

C h a p t e r 1 3 P r o b a b i l i t y 641
Continued over page
THINK WRITE
Specify how the experiment will be
conducted.
Note: Select and then PRB
and 5:randInt(. Then type 0,1). The
function randInt(0,1) gives random
numbers 0 or 1.
Repeatedly press the key until both
sexes are represented; that is, until a 0 and a
1 are obtained. This will correspond to 1
experiment. Repeat this process 49 times.
Note: The screendump below shows that 2
attempts were required to obtain the desired
result.
However the same result will not be obtained
each time the experiment is performed.
Record the result in a table
comprising three columns titled
experiment number, results, number
of trials.
Note: This is only one possible
solution.
3
MATH
ENTER
4Exp. No. Results
No. of trials
Exp. No. Results
No. of trials
1 BG 2 26 GGGB 42 GGB 3 27 GGGGB 53 BG 2 28 GGGB 44 GGGGB 5 29 BG 25 BBBBBBG 7 30 BBBG 46 GGGB 4 31 BG 27 BBG 3 32 GB 28 BBG 3 33 GGGB 49 BBBBG 5 34 BG 2
10 GB 2 35 GGGGGGB 711 BG 2 36 BBBBBBG 712 GGGB 4 37 GB 213 BBG 3 38 BG 214 BBG 3 39 GGB 315 GB 2 40 GGGGB 516 BG 2 41 BBG 317 GGB 3 42 BBBBBG 618 GB 2 43 GGB 319 GGB 3 44 GGB 320 BBBG 4 45 BBBG 421 BG 2 46 BBG 322 GB 2 47 GGGGGGB 723 GGGGB 5 48 BG 224 BG 2 49 BBG 325 GGGGB 5 50 GGGGGB 6
Total 175

642 M a t h s Q u e s t 8 f o r V i c t o r i a
Note: Each time the experiment is conducted, different results will be achieved.
1 Experimental simulation
Repeat the experiment conducted in worked example 8 using an alternative
device, say a coin, and then pool your results with all of the members of your
class. Compare your own result against the worked example and class results.
Once you have done this, answer the following questions.
a How do your values compare with the worked example and class results?
b Which do you think would be more reliable? Explain your answer.
2 Spreadsheet simulation
The above activity may also be performed using spreadsheets. Construct your
own spreadsheet or use either of the two Excel spreadsheet files provided on the
Maths Quest 8 CD-ROM. The first one is a prepared spreadsheet that simulates
the tossing of a coin. Follow the list of Heads and Tails until both are
represented. Pressing provides a new list. The second file guides you in
constructing a spreadsheet for this purpose. Comment on how the results
obtained using the spreadsheet compare with the practical, worked example and
class results.
THINK WRITE
b Comment on the precautions
necessary to ensure fair and accurate
trials.
b In order to ensure fairness and accuracy,
a long run of trials, say 50, is necessary.
Also, each trial must be performed the
same way.
Answer the original question.
i Write the total number of trials
and total number of experiments.
ii Write the rule for the average
number of children.
iii Substitute the known values into
the rule.
iv Evaluate.
v Round the value to the nearest
whole number.
Note: As we are dealing with
people we must work with whole
numbers.
vi Summarise your findings.
Note: Comment on points of
interest, that is, the maximum
and minimum number of
children.
Total number of trials = 2 + 3 + . . . + 3 + 6
= 175
Total number of experiments = 50
Average =
Average number of children =
= 3.5
≈ 4
The average number of children required to
reach the goal of having both sexes
represented was 4. The minimum and
maximum number of children required to
achieve the goal were 2 and 7, respectively.
1
2
total number of trials
total number of experiments-------------------------------------------------------------------
175
50---------
EXCE
L Spreadsheet
Simu-lating coin tosses
EXCE
L Spreadsheet
Simu-lating coin tosses(DIY)
COMMUNICATION Simulation
F9

C h a p t e r 1 3 P r o b a b i l i t y 643
The investigation ‘Simulation’ reinforces the idea that each time the experiment is con-
ducted, different results will be achieved.
Other means, such as a die or spinner, could have been used for the simulation in
worked example 8 and the first part of the investigation. In each case the device would
need to give two possibilities, one for a girl and one for a boy.
Simulations
1 Simulate the situation in which a couple wants to keep having children until they
have a boy and a girl.
a Use a graphics calculator and record your results in a table.
b On average, how many children would they expect to have to reach their goal?
c What would be the smallest and largest family size?
2 ii Design an experiment to simulate each of the following situations and specify the
device used to represent the outcomes.
ii Describe experimental precautions necessary to ensure fair and accurate trials for
the following:
a a true/false test in which answers are randomly distributed
b a casino game with outcomes grouped in colours of either red or black
c breakfast cereal boxes containing 4 different types of plastic toys
d six people in a group and one is
to be chosen as leader
e three choices of main meals are
on a menu; all are equally liked
f five possible holiday destinations
are offered; all are equally avail-
able
g five types of takeaway fast foods
are available. One, pizza, is twice
as popular as each of the others
(the other 4 are equally popular).
Simple experimental devices can be used to simulate real-life situations so that
outcomes may be investigated on an experimental basis. When setting up a
simulation, follow these steps:
1. determine the sample space
2. choose a device to simulate the outcomes
3. perform the experiment
4. record the outcomes in a table
5. calculate the probability of each outcome
6. summarise the findings.
remember
13DWORKED
Example
8
GC
program–
Casio
Coinflip
GC program
– TI
Coinflip
EXCEL Spreadsheet
Simulatingcoin tosses
EXCEL Spreadsheet
Simulatingcoin
tosses(DIY)

644 M a t h s Q u e s t 8 f o r V i c t o r i a
For questions 3 to 10:
i design an experiment to simulate the situations and specify the device used to
represent the outcomes
ii describe experimental precautions necessary to ensure fair and accurate trials.
3 A mouse in a maze can make left or right turns at each junction. Assuming each turn
is equally likely, how many junctions on average must the mouse go through before
each type of turn will have been made?
4 A restaurant menu features 4 desserts that it assumes are equally popular. How many
dessert orders must be filled (on average) before the owner can be sure all types will
have been ordered?
5 Two board-riders surfing at a beach need to decide which of them should go to the
shop to buy drinks. How many drink-buying trips on average will be made for each to
have had a turn at going?
6 A sailing school encourages students who
reach a particular level of proficiency to
race each other around a course, using
the same type of boat. Assuming all of
the 3 students are equally skilled,
how many races will need to be run
on average before all 3 students
experience a win?
7 Each container of Whacko tennis
balls includes a star player swap
card. There are 6 different cards
randomly distributed in the
containers. How many containers
of Whacko tennis balls would you
expect to have to buy to get the
complete set of 6 cards?
8 Simone is a model who gets twice as
much work as the other 4 models at a
small agency. The other 4 get equal
amounts of work. How many bookings
should the owner of the agency expect to fulfil
on average to ensure all of her models have
worked?
9 Candidates A, B and C have equal chances of being elected, while candidate D has
twice their chance and candidate E has three times their chance. How many elections
must take place (on average) before all candidates have had a turn at being the elected
representative?
C h a p t e r 1 3 P r o b a b i l i t y 645
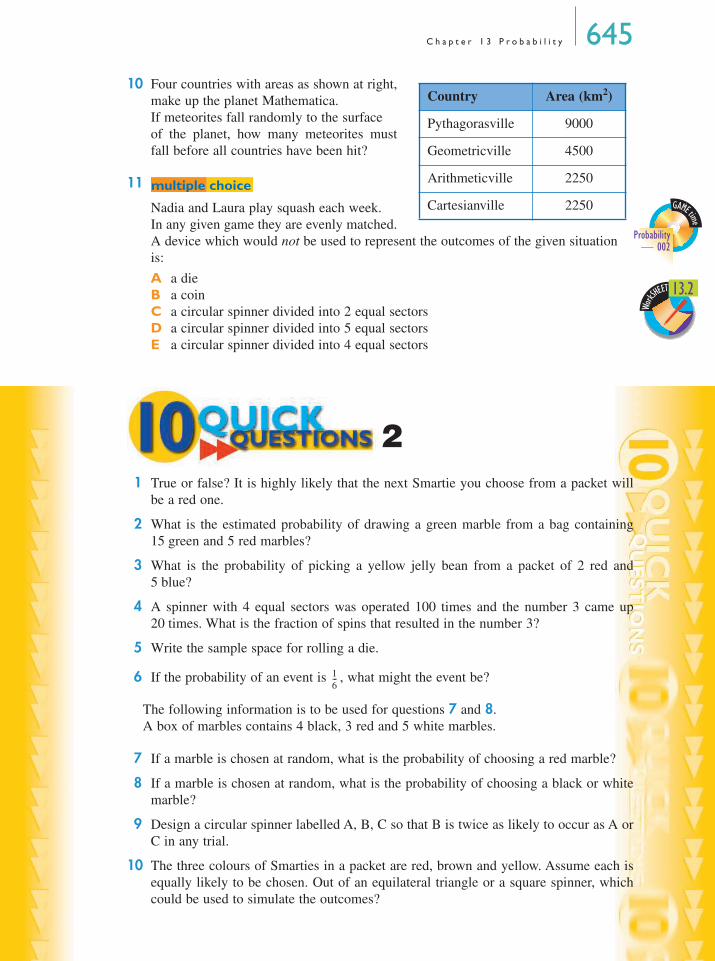
10 Four countries with areas as shown at right,
make up the planet Mathematica.
If meteorites fall randomly to the surface
of the planet, how many meteorites must
fall before all countries have been hit?
11
Nadia and Laura play squash each week.
In any given game they are evenly matched.
A device which would not be used to represent the outcomes of the given situation
is:
1 True or false? It is highly likely that the next Smartie you choose from a packet will
be a red one.
2 What is the estimated probability of drawing a green marble from a bag containing
15 green and 5 red marbles?
3 What is the probability of picking a yellow jelly bean from a packet of 2 red and
5 blue?
4 A spinner with 4 equal sectors was operated 100 times and the number 3 came up
20 times. What is the fraction of spins that resulted in the number 3?
5 Write the sample space for rolling a die.
6 If the probability of an event is , what might the event be?
The following information is to be used for questions 7 and 8.
A box of marbles contains 4 black, 3 red and 5 white marbles.
7 If a marble is chosen at random, what is the probability of choosing a red marble?
8 If a marble is chosen at random, what is the probability of choosing a black or white
marble?
9 Design a circular spinner labelled A, B, C so that B is twice as likely to occur as A or
C in any trial.
10 The three colours of Smarties in a packet are red, brown and yellow. Assume each is
equally likely to be chosen. Out of an equilateral triangle or a square spinner, which
could be used to simulate the outcomes?
A a die
B a coin
C a circular spinner divided into 2 equal sectors
D a circular spinner divided into 5 equal sectors
E a circular spinner divided into 4 equal sectors
Country Area (km2)
Pythagorasville 9000
Geometricville 4500
Arithmeticville 2250
Cartesianville 2250 GAME time
Probability— 002
WorkS
HEET 13.2
multiple choice
2
1
6---

646 M a t h s Q u e s t 8 f o r V i c t o r i a
Tree diagrams and two-way tablesSo far we have looked at experiments that deal with one event occurring. When more
than one event occurs within the same experiment, a diagrammatic representation of
the sample space is useful in calculating the required probabilities. An example of a
diagrammatic representation is a tree diagram. Alternatively, the sample space may be
represented by a two-way table.
A tree diagram is a branching diagram which lists all the possible outcomes.
Sample spaces may also be represented using a two-way table.
a Show the sample space for tossing a coin twice (or 2 coins together) by using:
i a tree diagram ii a two-way table.
b What is the probability of obtaining: i Heads twice? ii Heads and Tails?
THINK WRITE
a i Use branches to show the
individual outcomes for the first
toss. Place a 1 above the first toss
outcomes.
a i
Link each outcome from the first
toss with the outcomes of the
second toss. Place a 2 above the
second toss outcomes.
List each of the possible outcome
pairs in the order they occur; that
is, the first toss result followed by
the second toss result.
ii Draw a table consisting of three
rows and columns. Leave the first
cell blank.
ii
Label the second and third cells
of the first row as H and T
respectively. Place a 1 above the
first row.
Label the second and third cells
of the first column as H and T
respectively. Place a 2 beside the
first column.
Combine the outcome pairs in the
order in which they occur in each
of the remaining cells; that is, the
first toss result followed by the
second toss result.
1 1 2 Outcomes
HH
HT
TH
TT
H
T
H
T
H
T
2
3
1
1
H T
2H H H T H
T H T T T
2
3
4
9WORKEDExample

C h a p t e r 1 3 P r o b a b i l i t y 647
The prepared spreadsheet ‘Coin tossing’, found on the Maths Quest 8 CD-ROM, allows
you to see the sample space when tossing any given number of coins.
THINK WRITE
b i Using either the tree diagram or
the two-way table, write the
number of favourable outcomes
and the total number of possible
outcomes.
Note: The outcome of two Heads
occurs once.
b i Number of favourable outcomes = 1
Total number of possible outcomes = 4
Write the rule for probability. Pr(event) =
Substitute the known values into
the rule and evaluate.
Pr(2 Heads) =
Answer the question. The probability of obtaining 2 Heads
when a coin is tossed twice is .
ii Using either the tree diagram or
the two-way table, write the
number of favourable outcomes
and the total number of possible
outcomes.
Note: The outcome of 1 Heads
and 1 Tails occurs twice.
ii Number of favourable outcomes = 2
Total number of possible outcomes = 4
Write the rule for probability. Pr(event) =
Substitute the known values into
the rule and simplify.
Pr(1 Heads and 1 Tails) =
=
Answer the question. The probability of obtaining 1 Heads and
1 Tails when a coin is tossed twice is .
1
2number of favourable outcomes
number of possible outcomes----------------------------------------------------------------------------
31
4---
4
1
4---
1
2number of favourable outcomes
number of possible outcomes----------------------------------------------------------------------------
32
4---
1
2---
4
1
2---
EXCEL Spreadsheet
Cointossing

648 M a t h s Q u e s t 8 f o r V i c t o r i a
a A coin is tossed and then a die is rolled. Use i a tree diagram ii a two-way table to
show all the possible outcomes.
b What is the probability of obtaining i Heads and an even number? ii an odd number?
THINK WRITE
a i Use branches to show the
individual outcomes for the first
event; that is, the toss of the coin.
Place a 1 above the first event
outcome.
a i
Link each outcome from the first
event with each of the outcomes
from the second event; that is, the
roll of the die. Place a 2 above the
second event outcomes.
List each of the possible outcome
pairs in the order they occur; that
is, the first event result followed
by the second event result.
ii Draw a table consisting of seven
rows and three columns. Leave
the first cell blank.
ii
Label the second and third cells
of the first row as H and T
respectively. Place a 1 above the
first row.
Label cells two to seven of the
first column as 1, 2, 3, 4, 5, 6
respectively. Place a 2 beside the
first column.
Combine the outcome pairs in the
order they occur in each of the
remaining cells; that is, the first
event result followed by the
second event result.
b i Using either the tree diagram or
the two-way table, write the
number of favourable outcomes
and the total number of possible
outcomes.
Note: The outcome of Heads and
an even number occurs 3 times.
b i Number of favourable outcomes = 3
Total number of possible outcomes = 12
Write the rule for probability. Pr(event) =
1 1 2 Outcomes
H1
H2
H3
H4
H5
H6
T1
T2
T3
T4
T5
T6
1
2
3
4
5
6
1
2
3
4
5
6
H
T
2
3
1
1
H T
2
1 H 1 T 1
2 H 2 T 2
3 H 3 T 3
4 H 4 T 4
5 H 5 T 5
6 H 6 T 6
2
3
4
1
2number of favourable outcomes
number of possible outcomes----------------------------------------------------------------------------
10WORKEDExample

C h a p t e r 1 3 P r o b a b i l i t y 649
People around the world have played games with dice for thousands of years. Dice
were first mentioned in print in the Mahabharata, a sacred epic poem written in
India more than 2000 years ago. The six-sided dice used today are almost identical
to those used in China about 600 BC and in Egypt about 2000 BC.
Barbudey is a popular game in Greece and Mexico. Two players take turns
rolling 2 dice until one of the following winning or losing rolls is obtained.
Winning rolls:
Losing rolls:
1 Calculate the probability of getting a winning roll.
2 Calculate the probability of getting a losing roll.
3 Calculate the probability of getting neither a winning nor a losing roll.
4 Play the game a number of times with a partner. Set up an experiment to
investigate the experimental probabilities of getting a winning roll and getting a
losing roll. Compare your results.
THINK WRITE
Substitute the known values
into the rule and simplify.
Pr(Heads and an even number) =
=
Answer the question. The probability of obtaining Heads and an
even number when a coin is tossed and a die is
rolled is .
ii Using either the tree diagram
or the two-way table, write the
number of favourable outcomes
and the total number of possible
outcomes.
Note: The outcome of an odd
number occurs 6 times.
ii Number of favourable outcomes = 6
Total number of possible outcomes = 12
Write the rule for probability. Pr(event) =
Substitute the known values
into the rule and simplify.
Pr(an odd number) =
=
Answer the question. The probability of obtaining an odd number
when a coin is tossed and a die is rolled is .
33
12------
1
4---
4
1
4---
1
2number of favourable outcomes
number of possible outcomes----------------------------------------------------------------------------
36
12------
1
2---
4
1
2---
COMMUNICATION Dice game
650 M a t h s Q u e s t 8 f o r V i c t o r i a
When dealing with tree diagrams in worked examples 9 and 10, we obtained the
probability of an event by counting each individual favourable outcome and dividing it
by the total number of possible outcomes as we did with a two-way table. We will now
look at an alternative method that involves multiplying the probabilities associated with
each of the relevant branches leading to the required result.
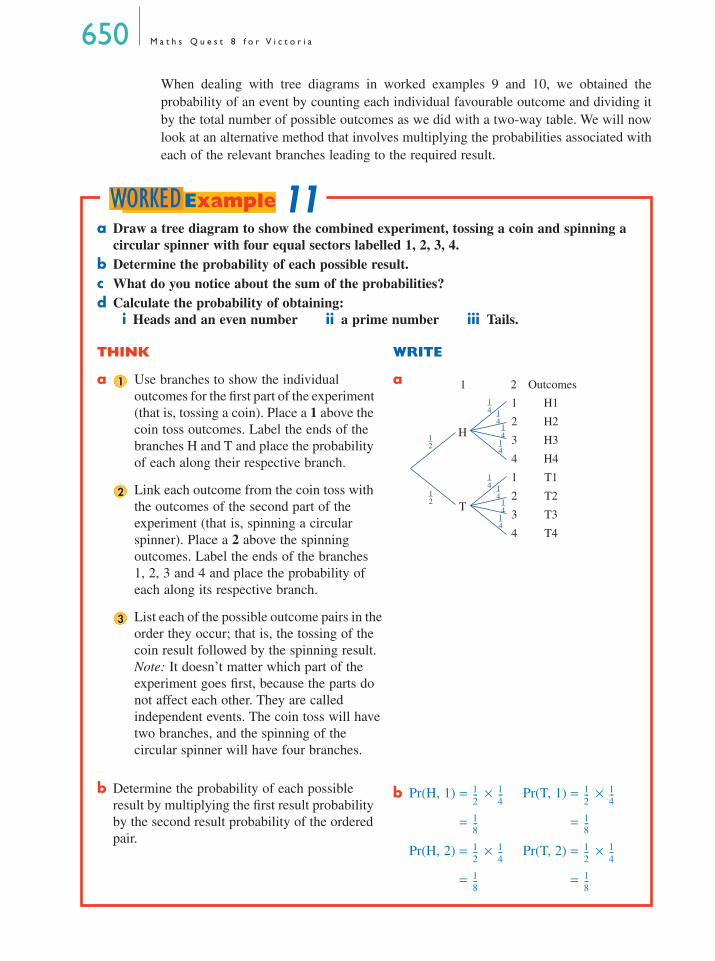
a Draw a tree diagram to show the combined experiment, tossing a coin and spinning a
circular spinner with four equal sectors labelled 1, 2, 3, 4.
b Determine the probability of each possible result.
c What do you notice about the sum of the probabilities?
d Calculate the probability of obtaining:
i Heads and an even number ii a prime number iii Tails.
THINK WRITE
a Use branches to show the individual
outcomes for the first part of the experiment
(that is, tossing a coin). Place a 1 above the
coin toss outcomes. Label the ends of the
branches H and T and place the probability
of each along their respective branch.
a
Link each outcome from the coin toss with
the outcomes of the second part of the
experiment (that is, spinning a circular
spinner). Place a 2 above the spinning
outcomes. Label the ends of the branches
1, 2, 3 and 4 and place the probability of
each along its respective branch.
List each of the possible outcome pairs in the
order they occur; that is, the tossing of the
coin result followed by the spinning result.
Note: It doesn’t matter which part of the
experiment goes first, because the parts do
not affect each other. They are called
independent events. The coin toss will have
two branches, and the spinning of the
circular spinner will have four branches.
b Determine the probability of each possible
result by multiplying the first result probability
by the second result probability of the ordered
pair.
b Pr(H, 1) = × Pr(T, 1) = ×
= =
Pr(H, 2) = × Pr(T, 2) = ×
= =
1
1–2
1–2
1–4
1–4
1–4
1–4
1–4
1–4
1–4
1–4
1 2 Outcomes
H1
H2
H3
H4
T1
T2
T3
T4
1
2
3
4
1
2
3
4
H
T
2
3
1
2---
1
4---
1
2---
1
4---
1
8---
1
8---
1
2---
1
4---
1
2---
1
4---
1
8---
1
8---
11WORKEDExample

C h a p t e r 1 3 P r o b a b i l i t y 651
THINK WRITE
Pr(H, 3) = × Pr(T, 3) = ×
= =
Pr(H, 4) = × Pr(T, 4) = ×
= =
c Add the probabilities together and answer
the question.
c Total = + + + + + + +
= 1
The probabilities of each combined result
in the tree diagram add up to 1.
d i Add the probability of each of the
outcome pairs that comprise Heads
and an even number.
d i Pr(H, even) = Pr(H, 2) + Pr(H, 4))
Pr(H, even) = +
Evaluate and simplify.=
=
ii Add the probability of each of the
outcome pairs that comprise a prime
number; that is, 2 or 3.
Note: Heads or Tails are not specified;
therefore, pairs consisting of either
coin outcome are acceptable.
ii Pr(prime) = Pr(H, 2) + Pr(H, 3)
+ Pr(T, 2) + Pr(T, 3)
= + + +
=
Evaluate and simplify. =
d iii Add the probability of each of the
outcome pairs which comprise Tails.
Note: Numbers are not specified;
therefore, pairs consisting of any
spinner outcome are acceptable.
iii Pr(tails) = Pr(T, 1) + Pr(T, 2)
+ Pr(T, 3) + Pr(T, 4)
= + + +
=
Evaluate and simplify. =
1
2---
1
4---
1
2---
1
4---
1
8---
1
8---
1
2---
1
4---
1
2---
1
4---
1
8---
1
8---
1
8---
1
8---
1
8---
1
8---
1
8---
1
8---
1
8---
1
8---
1
1
8---
1
8---
2 2
8---
1
4---
1
1
8---
1
8---
1
8---
1
8---
4
8---
21
2---
1
1
8---
1
8---
1
8---
1
8---
4
8---
21
2---
When more than one event occurs within the same experiment, a representation of
the sample space is useful in calculating the required probabilities. Sample spaces
may be represented by:
1. a tree diagram, which is a branching diagram that lists all the possible
outcomes, or
2. a two-way table.
remember

652 M a t h s Q u e s t 8 f o r V i c t o r i a
Tree diagrams and two-way tables
1 a Show the sample space for tossing a coin twice (or 2 coins together), by using
ii a tree diagram ii a two-way table.
b What is the probability of obtaining:
i 2 Tails?
ii Heads and then Tails?
iii Tails and then Heads?
iv one of each?
v both the same?
2 a Use a tree diagram to show the sample space for two children that are born into a
family.
b What are the chances that they are:
i 2 girls? ii 2 boys?
iii both the same sex? iv a boy, then a girl?
v a girl, then a boy? vi one of each sex?
3 a Use a tree diagram to show the sample space for an electrical
circuit that contains two switches, each of which can be on or off.
b What chance is there that the switches are:
i both on? ii both off?
iii both in the same position? iv one off, one on?
4 a Use a tree diagram to show the sample space for a true/false test that has
2 questions.
b What is the probability that the answers are:
i true, then false? ii false, then true?
iii both false? iv both true?
v one true, one false?
5 a Use a tree diagram and two-way table to show the sample space for the following.
A light may be on or off and a door open or closed.
b What are the chances of the following situations?
i door open, light on
ii door closed, light off
iii door closed, light on
iv door open, light off
6 a A coin is tossed and then a die is rolled. Use i a tree diagram ii a two-way table to
show all the possible outcomes.
b What is the probability of obtaining:
i Tails and the number 5? ii an even number?
iii Heads and a prime number? iv the number 3?
7 a Use a two-way table to show the sample space
for the following. A coin is tossed and the spinner
at right is twirled.
b What are the chances of obtaining:
i Heads and a 1?
13E
WORKED
Example
9
EXCEL Spreadsheet
Cointossing
WORKED
Example
10
1
2
3

C h a p t e r 1 3 P r o b a b i l i t y 653
ii Tails and a 2?
iii Tails and a 3?
iv Heads and a 2?
v Tails and an odd number?
vi Heads and an even number?
vii Tails and a prime number?
8 a Use a two-way table to show the sample space
for the following. Zipper sports cars come in 3
colours (red, white and yellow) with manual
or automatic transmissions available.
b What are the chances of a car selected at
random being:
i red?
ii automatic?
iii yellow and automatic?
iv white and manual?
v red and automatic?
9 a Use a two-way table to show the sample space for the following. A die is rolled and
a coin is tossed.
b What is the probability of obtaining the following?
i H, 6 ii T, 1 iii H, even iv T, odd v H, ≥ 4 vi T, < 3 vii H, not 6
10 A bag contains two red balls and one black. A ball is drawn, its colour noted, and then
it is replaced. A second draw is then made. Use a tree diagram to list all possible out-
comes. (Hint: Place each red ball on a separate branch.) Find the probability of
drawing:
i black, black ii red, red
iii red, then black iv black, then red
v different colours vi the same colour each time
vii no reds viii no blacks
ix at least one red x neither red nor black
xi at least one black.
11
Two sets of traffic lights each show red, amber or green for equal amounts of time.
The chance of encountering 2 red lights in succession are:
12
In the situation described in question 11, the probability of experiencing amber and
green in any order is:
A B C D E
A B C D E none of these
multiple choice
1
3---
1
6---
2
3---
2
9---
1
9---
multiple choice
2
3---
1
9---
1
2---
1
3---

654 M a t h s Q u e s t 8 f o r V i c t o r i a
13 a Draw a tree diagram to show the combined experiment, tossing a coin and spinning
a circular spinner with six equal sectors labelled 1, 2, 3, 4, 5, 6.
b Determine the probability of each possible result.
c What do you notice about the sum of the probabilities?
d Calculate the probability of obtaining:
i a head and an even number ii a prime number iii a tail.
14 a Draw a tree diagram to show the combined experi-
ment, rolling a die and spinning the circular spinner
shown at right.
b Determine the probability of each possible result.
c What do you notice about the sum of the
probabilities?
d Calculate the probability of obtaining:
i the number 2
ii the colour yellow
iii the colour red
iv an even number and the colour blue.
To get to school each morning, you are driven along Smith Street and pass through
an intersection controlled by traffic lights. The traffic light for Smith Street drivers
has a cycle of green and amber for a total of 40 seconds and then red for 20
seconds.
1 What is the probability that the traffic light will be red as you approach the
intersection?
2 Over 3 school weeks, how many days would you expect the traffic light to be
red as you approach the intersection?
3 Design an experiment in which you simulate the operation of the traffic light to
record whether the light is red as you approach the intersection. Explain what
device you will use to represent the outcomes.
4 Complete this experiment 10 times and calculate the experimental probability
that the traffic light will be red as you approach the intersection.
5 Repeat the experiment a further 40 times so that you have 50 results. Again
calculate the probability that the traffic light will be red as you approach the
intersection.
6 Use the probabilities calculated in parts 4 and 5 to estimate the number of days
that the traffic light would be red over 3 school weeks.
7 Compare your results.
8 Design an experiment to calculate the probability that the traffic light will be red
every morning for a school week.
9 What is the chance that the traffic light will be red every morning for a school
week?
SkillSH
EET 13.10
Multiplying proper fractions
WORKED
Example
11
WorkS
HEET 13.3
COMMUNICATION Green is for go, red is for stop!

C h a p t e r 1 3 P r o b a b i l i t y 655
Copy the sentences below. Fill in the gaps by choosing the correct word or
expression from the word list that follows.
1 Selection of an item in no particular order or pattern is called
.
2 A number that represents the (or probability) of something
happening can range from 0 (an outcome) to 1 (a
outcome) inclusive.
3 probability is found by observing what actually happens.
4 Each performance of an experiment is called a .
5 An is a particular result of a trial.
6 An is the set of favourable outcomes in each trial.
7 The of an event happening is found by dividing the frequency
by the total number of trials.
8 outcomes are those we are looking for.
9 The list of all possible outcomes is called the .
10 probability = .
11 may be expressed as a decimal, or percentage.
12 In the , the relative frequency of an event will match its
theoretical probability.
13 To use an experimental device to mimic the choices in a real-life situation
is to perform a . Graphics calculators, spreadsheets, coins,
dice, spinners and so on are used.
14 To keep track of all the outcomes in a sample space for a 2-stage experi-
ment, we can use a or a .
summary
number of favourable outcomes
number of possible outcomes-----------------------------------------------------------------------------------------
W O R D L I S T
probability
random
relative
frequency
sample space
two-way table
chance
fraction
trial
theoretical
long run
certain
experimental
event
tree diagram
impossible
favourable
outcome
simulation

656 M a t h s Q u e s t 8 f o r V i c t o r i a
1
A person getting hit by lightning today is an event that is:
A impossible B certain C highly likely
D very unlikely E even chance
2 Describe the probability of each of the following
events using a term from the list below.
impossible
highly unlikely
very unlikely
less than even chance
even chance
better than even chance
very likely
highly likely
certain
a The sun will rise tomorrow.
b You will see in the next century.
c Your one ticket in a 100-ticket raffle will win.
d You obtain a number less than or equal to 7
using a 10-sided die.
e A Tail shows up when a coin is tossed.
3 Assign a fraction or decimal to represent the
estimated probability of each of the following
events occurring.
a Two Heads showing up when a coin is
tossed twice.
b A traffic light showing amber or red if all colours show for an equal amount of time.
c A black marble being drawn from a bag containing 10 black, 8 white, 6 red, 4 yellow and
2 blue marbles.
4 If a die is rolled 200 times and a 6 comes up 30 times, then its relative frequency is:
A B C D 30% E
5 If a teacher found over the years that Year 8 students pass mathematics with a relative
frequency of , how many of her current class of 27 would she expect to pass?
A 2 B 3 C 18 D 15 E 24
6 An experiment involving rolling a die was conducted, with the results as shown in the
following frequency table.
Score 1 2 3 4 5 6
Frequency 9 8 12 13 10 8
multiple choice13A
CHAPTERreview
13A
13A
13B20
3------
3
20------
17
20------
1
5---
13B 2
3---
13B

C h a p t e r 1 3 P r o b a b i l i t y 657
a How many trials were performed?
b How many outcomes were in the sample space?
c How many times would you have expected a 6 to come up?
d Find the relative frequency of:
i 5 ii 1 iii even numbers.
7 People from a random sample were asked how they would vote in an election. The results
were coded as:
1 Liberal–National 2 Labor 3 One Nation 4 Democrats 5 other.
The recorded intentions were:
1, 2, 2, 1, 1, 2, 5, 3, 2, 1, 3, 1, 4, 2, 3, 1, 2, 1, 4, 2, 2, 4, 1, 2, 2,
3, 1, 2, 1, 1, 1, 2, 2, 1, 4, 1, 2, 1, 2, 3, 2, 2, 2, 1, 1, 1, 2, 3, 2, 5
a Organise the data into a frequency table.
b Find the relative frequency of each category, to the nearest whole per cent.
c A person selected at random from the general population would be highly likely to vote
for one of which 2 parties?
d Out of 1000 people, how many could be expected to vote for One Nation?
e What should be the total of all the relative frequency percentages?
8
The chance of getting a 5 with the spinner at right is:
A B C D E none of these
9 Study the spinner shown at right.
a What is sample space?
b Are all outcomes equally likely?
Explain your answer.
c In theory, what are the chances
of spinning:
i a 2? ii a 6?
10 One thousand tickets were sold for a raffle. If you purchased five, what are your chances of
winning the raffle?
11 A cube has 2 red faces, 2 white faces, 1 green and 1 yellow. If rolled, what is the probability
of the top face showing:
a red? b yellow? c not red? d green or white?
12 On each of the 5 days, Monday to Friday, garbage is collected. What are the chances that
garbage is collected at an address chosen at random on:
a Wednesday? b Thursday or Friday?
c Sunday? d a day other than Monday?
13 A multiple-choice question has as alternatives A, B, C, D and E. Only one is correct.
a What is the probability of guessing:
i the right answer? ii the wrong answer?
b What is the total of the probabilities?
14 a Design a circular spinner with the numbers 1 to 4 so that:
Pr(1) = , Pr(2) = , Pr(3) = , Pr(4) = .
b What will the size of the angle in each sector be?
13B
13Cmultiple choice
1
2
3
4
5
1
3---
1
5---
1
6---
2
5---
13C
1 2
3
45
6
13C
13C
13C
13C
13C1
2---
1
4---
1
8---
1
8---

658 M a t h s Q u e s t 8 f o r V i c t o r i a
15 Give the probability of each of the
numbers in this circular spinner.
16 Traffic lights (red, amber, green) are set so that each colour shows for the same amount
of time. Perform an experiment to simulate the situation so that you can determine
(on average) how many sets of lights you must encounter in order to get 2 green lights
in succession. Give a full description and tabulate your results.
17 Pool your results with another student to determine how many sets of lights are needed to
get 2 green lights in succession. Compare the results obtained with those in question 16.
18 a Draw a tree diagram to show the sample space for a two-question test in which the
answers can only be yes (Y) or no (N).
b Calculate the probability of the correct answers being:
i YY ii NN iii no, then yes
iv yes, then no v a yes and a no vi both the same
vii neither yes nor no.
19 Draw a two-way table to show the sample space for the situation in question 18.
20 a Use a tree diagram and two-way table to show all the possible outcomes for the sex
(B, G) and hair colour (blond, black, brown, red) of a baby.
b What are the chances (assuming all outcomes are equally likely) of a child being:
vi a blond girl? ii a red-haired boy? iii a redhead?
iv not blond? v a boy with black or brown hair?
21 Caryle is deciding what to order for
lunch from her favourite restaurant.
The table at right provides her possible
entree, main meal and dessert options.
a Draw a tree diagram to show the
possible combinations Caryle can
order if she chooses to have an
entree, main meal and dessert.
b How many different options can Caryle choose from?
c What is the probability that Caryle will order:
iii lamb as her main meal?
iii ice-cream for dessert?
iii soup as her entree and fruit salad for dessert?
iv either pasta or soup for an entree, chicken or seafood as her main and crème caramel
iv for dessert?
d Without drawing a tree diagram, how many different options would there be if Caryle
could choose from:
iii three entrees, three mains and three desserts?
iii four entrees, three mains and three desserts?
iii two entrees, four mains and three desserts?
e Explain how the total number of options were obtained in part d.
1
2
3 4
5
6
13C
13D
13D
13E
13E13E
13E Entree Main Dessert
Pasta Roast chicken Crème caramel
Soup Lamb cutlets Ice-cream
Seafood platter Fruit salad
testtest
CHAPTER
yourselfyourself
13