Embed Size (px)
Citation preview

EPI 809 / Spring 2008
Chapter 9
Nonparametric Statistics

EPI 809 / Spring 2008
Learning Objectives
1. Distinguish Parametric & Nonparametric Test Procedures
2. Explain commonly used Nonparametric Test Procedures
3. Perform Hypothesis Tests Using Nonparametric Procedures

EPI 809 / Spring 2008
Hypothesis Testing Procedures
Many More Tests Exist!

EPI 809 / Spring 2008
Parametric Test Procedures
1. Involve Population Parameters (Mean)
2. Have Stringent Assumptions (Normality)
3. Examples: Z Test, t Test, χ2 Test, F test

EPI 809 / Spring 2008
Nonparametric Test Procedures
1. Do Not Involve Population ParametersExample: Probability Distributions, Independence
2. Data Measured on Any Scale (Ratio or Interval, Ordinal or Nominal)
3. Example: Wilcoxon Rank Sum Test

EPI 809 / Spring 2008
Advantages of Nonparametric Tests
1. Used With All Scales2. Easier to Compute3. Make Fewer Assumptions4. Need Not Involve
Population Parameters5. Results May Be as Exact
as Parametric Procedures
© 1984-1994 T/Maker Co.

EPI 809 / Spring 2008
Disadvantages of Nonparametric Tests
1.May Waste Information Parametric model more efficient if data Permit
2.Difficult to Compute by
hand for Large Samples
3.Tables Not Widely Available
© 1984-1994 T/Maker Co.

EPI 809 / Spring 2008
Popular Nonparametric Tests
1. Sign Test
2. Wilcoxon Rank Sum Test
3. Wilcoxon Signed Rank Test

EPI 809 / Spring 2008
Sign Test

EPI 809 / Spring 2008
Sign Test 1. Tests One Population Median, η
2. Corresponds to t-Test for 1 Mean
3. Assumes Population Is Continuous
4. Small Sample Test Statistic: # Sample Values Above (or Below) Median
5. Can Use Normal Approximation If n ≥ 10

EPI 809 / Spring 2008
Sign Test Concepts
Make null hypothesis about true median
Let S = number of values greater than median
Each sampled item is independent
If null hypothesis is true, S should have binomial distribution with success probability .5

EPI 809 / Spring 2008
Sign Test Example
You’re an analyst for Chef-Boy-R-Dee. You’ve asked 7 people to rate a new ravioli on a 5-point scale (1 = terrible,…, 5 = excellent) The ratings are: 2 5 3 4 1 4 5.
At the .05 level, is there evidence that the median rating is at least 3?

EPI 809 / Spring 2008
Sign Test Solution
H0: Ha: α = Test Statistic:
P-Value:
Decision:
Conclusion:

EPI 809 / Spring 2008
Sign Test Solution
H0: η = 3Ha: η < 3α = Test Statistic:
P-Value:
Decision:
Conclusion:

EPI 809 / Spring 2008
Sign Test Solution
H0: η = 3Ha: η < 3α = .05Test Statistic:
P-Value:
Decision:
Conclusion:

EPI 809 / Spring 2008
Sign Test Solution
H0: η = 3Ha: η < 3α = .05Test Statistic:
P-Value:
Decision:
Conclusion:
S = 2 (Ratings 1 & 2 Are Less Than η = 3:2, 5, 3, 4, 1, 4, 5)Is observing 2 or more a small prob event?

EPI 809 / Spring 2008
Sign Test Solution
H0: η = 3Ha: η < 3α = .05Test Statistic:
P-Value:
Decision:
Conclusion:
P(S ≥ 2) = 1 - P(S ≤ 1) = .9297
(Binomial Table, n = 7, p = 0.50)
S = 2 (Ratings 1 & 2 Are Less Than η = 3:2, 5, 3, 4, 1, 4, 5)Is observing 2 or more a small prob event?

EPI 809 / Spring 2008
Sign Test Solution
H0: η = 3Ha: η < 3α = .05Test Statistic:
P-Value:
Decision:
Conclusion:Do Not Reject at α = .05
P(x ≥ 2) = 1 - P(x ≤ 1) = . 9297
(Binomial Table, n = 7, p = 0.50)
S = 2 (Ratings 1 & 2 Are Less Than η = 3:2, 5, 3, 4, 1, 4, 5)Is observing 2 or more a small prob event?
EPI 809 / Spring 2008
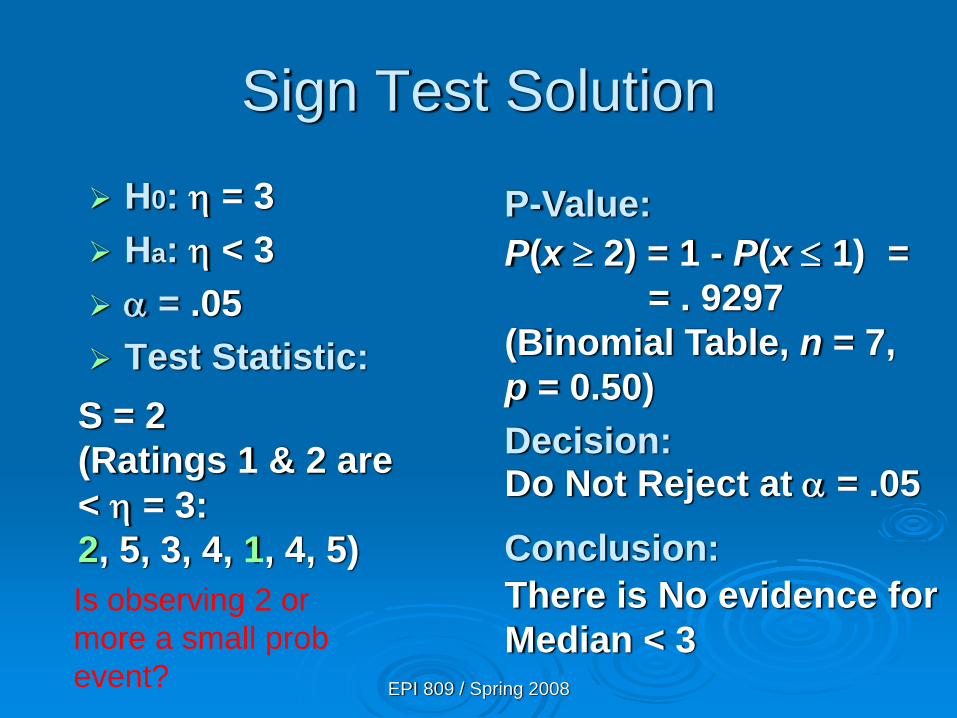
Sign Test Solution
H0: η = 3Ha: η < 3α = .05Test Statistic:
P-Value:
Decision:
Conclusion:Do Not Reject at α = .05
There is No evidence for Median < 3
P(x ≥ 2) = 1 - P(x ≤ 1) == . 9297
(Binomial Table, n = 7, p = 0.50)
S = 2 (Ratings 1 & 2 are < η = 3:2, 5, 3, 4, 1, 4, 5)Is observing 2 or more a small prob event?

EPI 809 / Spring 2008
Wilcoxon Rank Sum Test
EPI 809 / Spring 2008
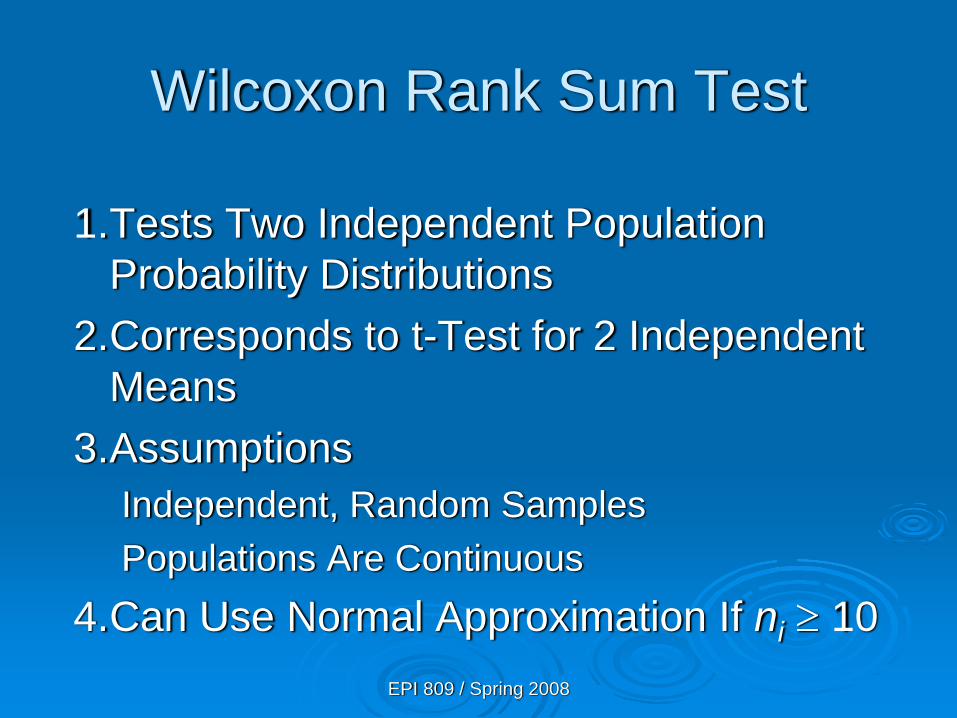
Wilcoxon Rank Sum Test
1.Tests Two Independent Population Probability Distributions
2.Corresponds to t-Test for 2 Independent Means
3.AssumptionsIndependent, Random SamplesPopulations Are Continuous
4.Can Use Normal Approximation If ni ≥ 10

EPI 809 / Spring 2008
Wilcoxon Rank Sum Test Procedure
1. Assign Ranks, Ri, to the n1 + n2 Sample Observations
If Unequal Sample Sizes, Let n1 Refer to Smaller-Sized SampleSmallest Value = 1
2. Sum the Ranks, Ti, for Each SampleTest Statistic Is TA (Smallest Sample)
Null hypothesis: both samples come from the same underlying distribution
Distribution of T is not quite as simple as binomial, but it can be computed

EPI 809 / Spring 2008
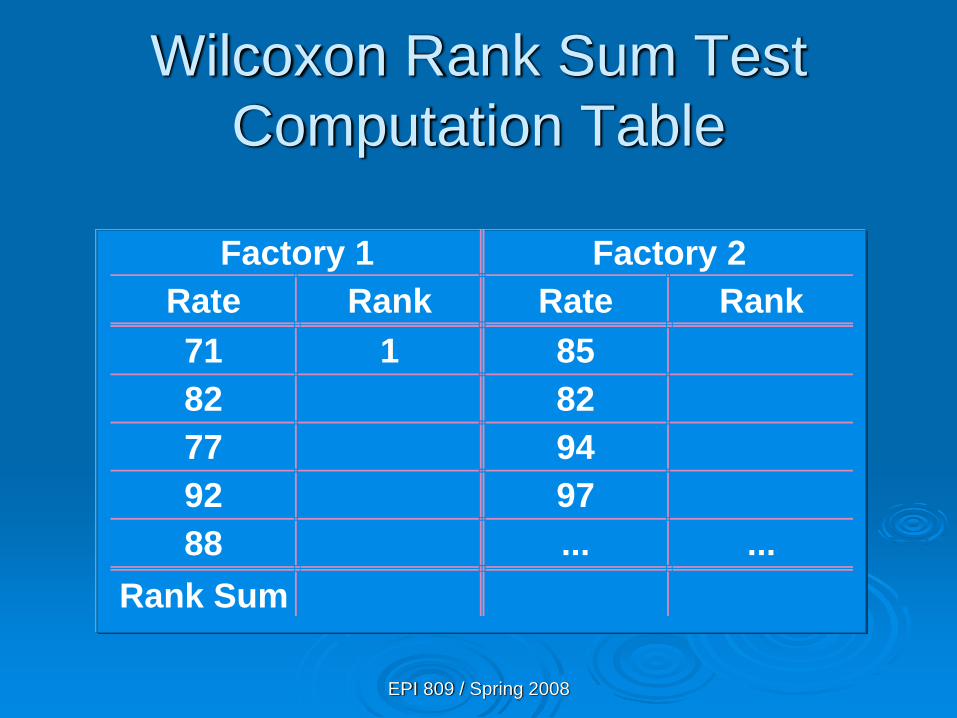
Wilcoxon Rank Sum Test Example
You’re a production planner. You want to see if the operating rates for 2 factories is the same. For factory 1, the rates (% of capacity) are 71, 82, 77, 92, 88. For factory 2, the rates are 85, 82, 94 & 97. Do the factory rates have the same probability distributions at the .10 level?

EPI 809 / Spring 2008
Wilcoxon Rank Sum Test Solution
H0:Ha:α =n1 = n2 = Critical Value(s):
Test Statistic:
Decision:
Conclusion:
Σ Ranks

EPI 809 / Spring 2008
Wilcoxon Rank Sum Test Solution
H0: Identical Distrib.Ha: Shifted Left or Rightα =n1 = n2 = Critical Value(s):
Test Statistic:
Decision:
Conclusion:
Σ Ranks

EPI 809 / Spring 2008
Wilcoxon Rank Sum Test Solution
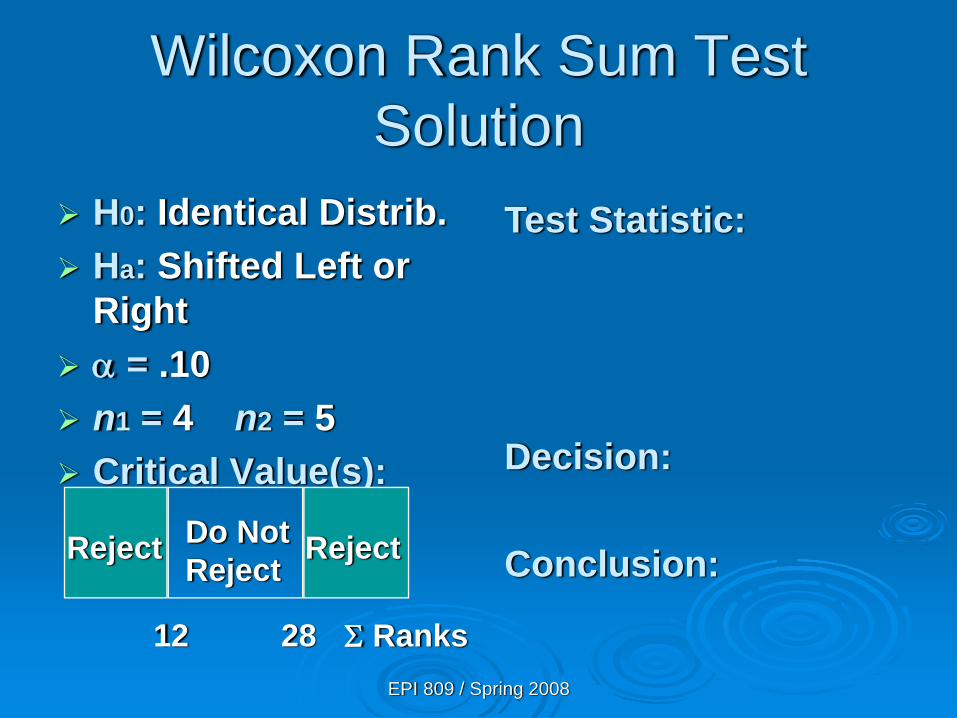
H0: Identical Distrib.Ha: Shifted Left or Rightα = .10n1 = 4 n2 = 5 Critical Value(s):
Test Statistic:
Decision:
Conclusion:
Σ Ranks

EPI 809 / Spring 2008
Wilcoxon Rank Sum Table 12 (Rosner) (Portion)α = .05 two-tailed
EPI 809 / Spring 2008
Wilcoxon Rank Sum Test Solution
H0: Identical Distrib.Ha: Shifted Left or Rightα = .10n1 = 4 n2 = 5 Critical Value(s):
Test Statistic:
Decision:
Conclusion:Reject RejectDo Not Reject
12 28 Σ Ranks

EPI 809 / Spring 2008
Wilcoxon Rank Sum Test Computation Table
Factory 1 Factory 2Rate Rank Rate Rank
Rank Sum

EPI 809 / Spring 2008
Wilcoxon Rank Sum Test Computation Table
Factory 1 Factory 2Rate Rank Rate Rank71 8582 8277 9492 9788 ... ...
Rank Sum
EPI 809 / Spring 2008
Wilcoxon Rank Sum Test Computation Table
Factory 1 Factory 2Rate Rank Rate Rank71 1 8582 8277 9492 9788 ... ...
Rank Sum

EPI 809 / Spring 2008
Wilcoxon Rank Sum Test Computation Table
Factory 1 Factory 2Rate Rank Rate Rank71 1 8582 8277 2 9492 9788 ... ...
Rank Sum

EPI 809 / Spring 2008
Wilcoxon Rank Sum Test Computation Table
Factory 1 Factory 2Rate Rank Rate Rank71 1 8582 3 82 477 2 9492 9788 ... ...
Rank Sum
EPI 809 / Spring 2008
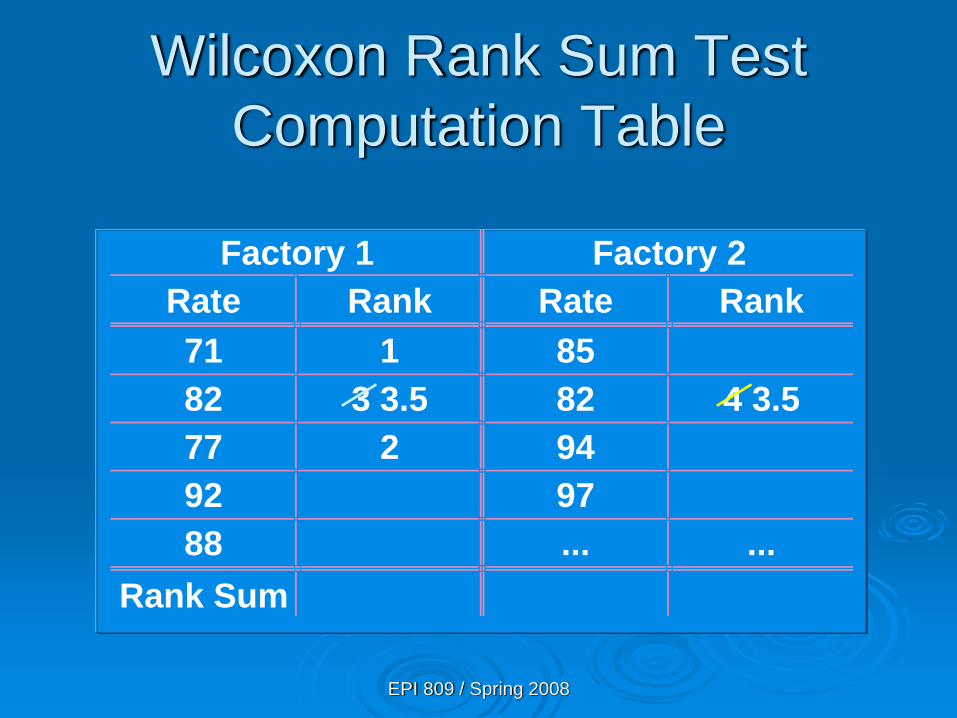
Wilcoxon Rank Sum Test Computation Table
Factory 1 Factory 2Rate Rank Rate Rank71 1 8582 3 3.5 82 4 3.577 2 9492 9788 ... ...
Rank Sum

EPI 809 / Spring 2008
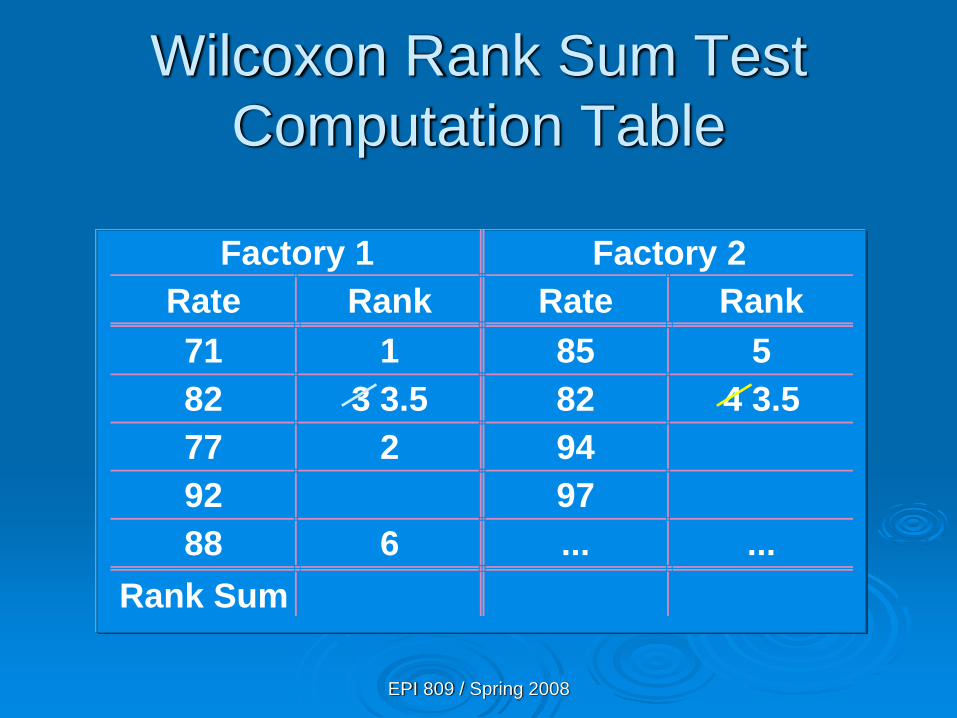
Wilcoxon Rank Sum Test Computation Table
Factory 1 Factory 2Rate Rank Rate Rank71 1 85 582 3 3.5 82 4 3.577 2 9492 9788 ... ...
Rank Sum
EPI 809 / Spring 2008
Wilcoxon Rank Sum Test Computation Table
Factory 1 Factory 2Rate Rank Rate Rank71 1 85 582 3 3.5 82 4 3.577 2 9492 9788 6 ... ...
Rank Sum

EPI 809 / Spring 2008
Wilcoxon Rank Sum Test Computation Table
Factory 1 Factory 2Rate Rank Rate Rank71 1 85 582 3 3.5 82 4 3.577 2 9492 7 9788 6 ... ...
Rank Sum

EPI 809 / Spring 2008
Wilcoxon Rank Sum Test Computation Table
Factory 1 Factory 2Rate Rank Rate Rank71 1 85 582 3 3.5 82 4 3.577 2 94 892 7 9788 6 ... ...
Rank Sum

EPI 809 / Spring 2008
Wilcoxon Rank Sum Test Computation Table
Factory 1 Factory 2Rate Rank Rate Rank71 1 85 582 3 3.5 82 4 3.577 2 94 892 7 97 988 6 ... ...
Rank Sum

EPI 809 / Spring 2008
Wilcoxon Rank Sum Test Computation Table
Factory 1 Factory 2Rate Rank Rate Rank71 1 85 582 3 3.5 82 4 3.577 2 94 892 7 97 988 6 ... ...
Rank Sum 19.5 25.5

EPI 809 / Spring 2008
Wilcoxon Rank Sum Test Solution
H0: Identical Distrib.Ha: Shifted Left or Rightα = .10n1 = 4 n2 = 5 Critical Value(s):
Test Statistic:
Decision:
Conclusion:Reject RejectDo Not Reject
12 28 Σ Ranks
T2 = 5 + 3.5 + 8+ 9 = 25.5 (Smallest Sample)
EPI 809 / Spring 2008
Wilcoxon Rank Sum Test Solution
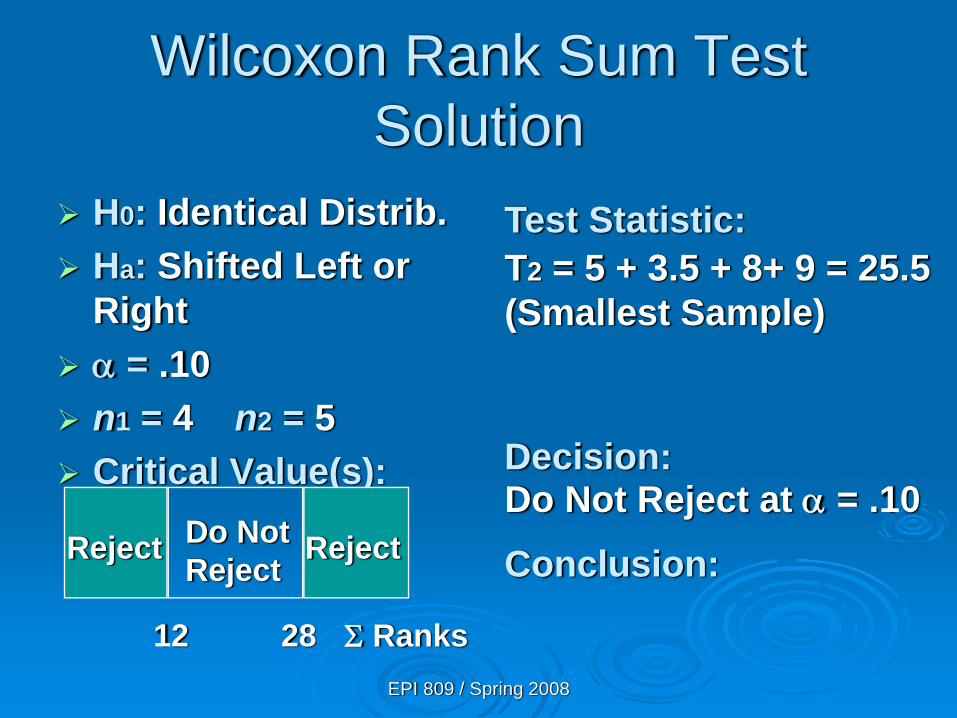
H0: Identical Distrib.Ha: Shifted Left or Rightα = .10n1 = 4 n2 = 5 Critical Value(s):
Test Statistic:
Decision:
Conclusion:Do Not Reject at α = .10
Reject RejectDo Not Reject
12 28 Σ Ranks
T2 = 5 + 3.5 + 8+ 9 = 25.5 (Smallest Sample)

EPI 809 / Spring 2008
Wilcoxon Rank Sum Test Solution
H0: Identical Distrib.Ha: Shifted Left or Rightα = .10n1 = 4 n2 = 5 Critical Value(s):
Test Statistic:
Decision:
Conclusion:Do Not Reject at α = .10
There is No evidence for unequal distrib
Reject RejectDo Not Reject
12 28 Σ Ranks
T2 = 5 + 3.5 + 8+ 9 = 25.5 (Smallest Sample)